Embed Size (px)
Citation preview

Tampere University of Technology
A comparison of rheology and FTIR in the study of polypropylene and polystyrenephotodegradation
CitationMylläri, V., Ruoko, T-P., & Syrjälä, S. (2015). A comparison of rheology and FTIR in the study of polypropyleneand polystyrene photodegradation. Journal of Applied Polymer Science, 132(28), [42246].https://doi.org/10.1002/app.42246Year2015
VersionPeer reviewed version (post-print)
Link to publicationTUTCRIS Portal (http://www.tut.fi/tutcris)
Published inJournal of Applied Polymer Science
DOI10.1002/app.42246
CopyrightThis is the peer reviewed version of the following article: Mylläri, V., Ruoko, T.-P. and Syrjälä, S. (2015), Acomparison of rheology and FTIR in the study of polypropylene and polystyrene photodegradation. J. Appl.Polym. Sci., 132, 42246, which has been published in final form at https://dx.doi.org/10.1002/app.42246. Thisarticle may be used for non-commercial purposes in accordance with Wiley Terms and Conditions for Self-Archiving
Take down policyIf you believe that this document breaches copyright, please contact [email protected], and we will remove accessto the work immediately and investigate your claim.
Download date:04.01.2020

A comparison of rheology and FTIR in the study of polypropylene and
polystyrene photodegradation
Ville Mylläria, Tero-Petri Ruokob, Seppo Syrjäläc
aDepartment of Material Science, Tampere University of Technology, Tampere 33101, Finland
bDepartment of Chemistry and Bioengineering, Tampere University of Technology, Tampere
33101, Finland
cDepartment of Mechanical Engineering and Industrial Systems, Tampere University of
Technology, Tampere 33101, Finland
Correspondence to: Ville Mylläri (E-mail: [email protected])
Abstract
Rheology and FTIR spectroscopy are compared as methods to study the degree of
photodegradation in polypropylene (PP) and polystyrene (PS) sheets. The materials are hot
pressed, artificially photo-aged with fluorescent lights for 4-2048 h and then measured with
a rotational rheometer and FTIR. Both materials show a tendency for chain scission which can
be seen as a reduction in viscosity. Changes in PP can be observed with both methods after
256 h of irradiation. Changes in PS become significant in rheology after 64 h but in FTIR only
after 1024 h of irradiation. Due to the different chemical nature of the materials, the
degradation of PS is rather linear with exposure, whereas the degradation of PP is more
exponential. By using the zero shear viscosities obtained through extrapolations of the Cole-
Cole and Carreau-Yasuda models, relative molecular weights are estimated with the aid of
the power-law relationship between these two. These results are compared with the carbonyl
indices determined from the FTIR spectra. Rheology is found to be a viable alternative for FTIR
in certain situations.
Keywords: Rheology, FTIR, photodegradation, UV, polystyrene, polypropylene
Introduction
Fourier transform infrared spectroscopy (FTIR) is probably the most common technique for
analysing polymer ageing caused by UV irradiation. It is fast, accurate, and widely used.1-3 The
IR spectrum reveals the presence of functional groups, such as carbonyl groups, which are
formed from the polymer radicals generated during the degradation process. Polymer
rheology, on the other hand, is typically used to estimate processability and the properties of
materials. The use of rheology in the study of polymer photodegradation is based on the fact
that rheology is sensitive to changes in molecular weight, and it is a less frequently used
method than FTIR.
Polymer radicals can induce crosslinking and chain scission reactions,4 which are the two main
competitive reactions that affect molecular weight during photodegradation. Chain scission
reduces the average molecular weight of a polymer, whereas crosslinking raises it by
increasing the bonding between polymer chains. Chain scission generally dominates over
crosslinking and, therefore, a decrease in the molecular weight is a common consequence of
photodegradation. The primary means to obtain information concerning the molecular
weight of a polymer is gel permeation chromatography (GPC). However, GPC has many
drawbacks such as long operation times, expensive equipment, and the need to dissolve the
polymer in a solvent, which in some cases needs to be performed at high temperatures that
can induce thermal ageing.
In ageing studies, rheology is typically used to analyse thermal degradation caused by heat or
multiple extrusions.5-8 However, rheological testing has been increasingly utilized in the study
of photodegradation.9-15 Many of these studies have been made by one research group, and
they are rarely focused on the comparison of these two methods. Studies where a limited
comparison between FTIR and rheology is possible have been made on materials such as
polybutene-1,9 elastomers,10 biodegradable polymers,11 PE/feather composites,12 gamma-
irradiated high melt strength polypropylene,13 and polyetheretherketone.14 The polybutene-
1 study9 indicates that rheology could be a more accurate method than FTIR in detecting the
early signs of photodegradation. The results of the rheological studies show a very different
behaviour between the materials, some of them being highly crosslinkable, and others
showing a tendency for chain scission. These kinds of photodegradation studies of
conventional PP and PS samples were not found in the literature, but thermal degradation
studies indicate a large reduction in molecular weight for both materials. This reduction can
be seen as decreased viscosity, and the research hypothesis of this study is that this behaviour
is observed under UV irradiation as well. Thermal and photodegradation are similar as long
as the degradation occurs by the generally acknowledged hydroperoxide mechanism, as is
the case for PP.18, 19 There is evidence that a majority of PS degrades through a different chain
scission mechanism, resulting in depolymerisation and release of gaseous styrene monomers,
dimers, and trimers20 as well as complete oxidation products CO2 and H2O.21 This mechanism
should lead to noticeable changes in molecular weight, and should thus be observable with
rheology.
The goal of this study is to evaluate the suitability of rheological measurements for detecting
changes in the polymer structure caused by photodegradation. The linear viscoelastic
properties of photodegraded PP and PS samples are determined by means of small amplitude

oscillatory shear measurements. The results of the measurements are compared with the
corresponding results provided by FTIR spectroscopy.
Experimental
Materials
Two materials, Lyondellbasell polypropylene Moplen grade HP501L (Rotterdam, Netherlands)
and BASF Polystyrol 143 E polystyrene (Ludwigshafen, Germany) were used. HP501L is a
homopolymer grade with a melt flow rate of 6.0 g/10min. Polystyrol 143 E is a medium
strength, easy flowing general purpose grade with a melt volume-flow rate of 10 cm3/10 min
(200 °C, 5 kg). Neither of the materials have inherent UV-stability. According to a DSC test
(Netzsch DSC 204 F1, N2 atmosphere, 10 °C/min) the Tg of PP was 8 °C, Tm 172 °C, and the Tg
of PS was 84 °C. Molecular weights (Mw) and polydispersity indexes (PI) were 307900 g/mol
and 2.28 for PS,8 and 325000 g/mol and 5.9 for PP.22
Materials were hot pressed between aluminium plates using a temperature of 210 °C and
force of 200 kN for 3 minutes. Force was increased slowly to minimize the formation of air
bubbles. The sample thickness was 0.43 ± 0.03 mm and the sample size approximately 20*15
cm.
Photodegradation procedure
PP and PS samples were exposed to UV radiation using a self-built UV chamber. The chamber
is equipped with four UVA-340 fluorescent tubes (Q-Panel Lab Products, Cleveland, USA) as
the radiation source. The spectrum in the chamber is close to sunlight in the critical short
wavelength UV region, and the solar cut-off is 295 nm. To compensate the decrease in light
intensity with time, a simple tube rotation and replacement system was adopted. This
involves replacing the oldest of the four tubes every 400 h and rotating the remaining three
lamps. This results in 1600 h of use time for each lamp.
The UV irradiation chamber was characterized using a Bentham DM150 double-
monochromator spectroradiometer equipped with measurement head UV-J1002 from CMS
Schreder. The chamber was symmetrically divided into nine measuring points and their
average was used. The focal plane of the measurement head was approximately 16 cm from
the bottom of the chamber. The dose rate at the UVB range (290-315 nm) was 0.7 W/m2, at
the UVA range (315-400 nm) 12.1 W/m2, and at the visible range (400-600 nm) 3.1 W/m2. The
samples were irradiated for 4-2048 h; 2-1024 h from both sides, one hour of irradiation
corresponding to a 57 kJ/m2 dose.
Rheological measurements
Oscillatory shear measurements within the linear viscoelastic range were carried out for the
samples using an Anton Paar Physica MCR 301 rheometer. All the experiments were
performed under a nitrogen atmosphere using a 25 mm plate-plate geometry and a gap size
of approximately 0.4 mm. The measurement temperature was 200 °C for PP and 220 °C for
PS. The measuring points in the angular frequency range of 0.1 – 562 rad/s were recorded
with decreasing frequency.
FTIR measurements
FTIR measurements were made with Bruker optics tensor 27 using ATR (attenuated total
reflectance) mode. Spectra were measured between 400-4000 cm-1, using 64 scans and a
resolution of 4 cm-1.

Results and discussion
Rheological measurements
The rheological testing was performed on all samples but there are no visible changes in
samples irradiated for 4-32 h. In PP the changes become visible between 256 h and 512 h
(Figure 1) and in PS between 64 h and 128 h of irradiation (Figure 2). The observed
degradation behaviour is different between the materials. In PP the degradation initiates later
than in PS but at a more rapid rate so that the viscosity of the 2048 h irradiated samples is
approximately only 0.01 % of the 1024 h sample viscosity. To measure the 2048 h PP sample,
special arrangements had to be made: a larger plate and a smaller gap were used. In PS the
changes are visible earlier but the degradation rate is slower so that even the 2048 h
irradiated samples were easily measurable. The degradation in the 2048 h irradiated samples
was observable without any equipment, since the colour of PS had turned yellow and PP
cracked with minimal force.
Figure 1. Complex viscosity of the PP samples measured at 200 °C.
1.0E+02
1.0E+03
1.0E+04
1.0E+05
0.1 1 10 100 1000
Co
mp
lex v
isco
sit
y [
Pa*s
]
Angular Frequency [rad/s]
0h
64h
128h
256h
512h
1024h
Time

Figure 2. Complex viscosity of the PS samples measured at 220 °C.
Previous studied have shown that in the photodegradation of PP approximately one crosslink
occurs per ten chain scissions, depending on the ageing time and the sample thickness.16 In
PS the probability of chain scission is initially higher than the probability of crosslinking, but it
decreases during the ageing.17 This indicates that a higher reduction in viscosity should be
seen for PP. PP degrades through the general hydroperoxide mechanism, which is similar to
thermal degradation, except for the fact that the degradation is initiated by photoexcited
extrinsic carbonyl groups.18, 19 This mechanism is well known and has been extensively studied
since the late 1960’s. On the other hand, as little as 10 % of photoexcited PS hydroperoxide
radicals go through the general hydroperoxide mechanism.21 Nevertheless, the
photodegradation in PS is initiated by chain scission reactions resulting in large changes in the
molecular weight although the probability of chain scission decreases with ageing.17, 20 The
differences in degradation mechanisms causes the different rheological properties for PP and
PS.
It is possible to estimate the changes in the molecular weight (Mw) by using the power-law
relationship between the zero shear viscosity (η0) and Mw: 23
𝜂0 ∝ 𝑀𝑤3.4 (1)
1.0E+01
1.0E+02
1.0E+03
1.0E+04
0.1 1 10 100 1000
Co
mp
lex V
isco
sit
y [
Pa*s
]
Angular frequency [1/s]
0h 64h 128h
256h 512h 1024h
2048h
Time
Equation 1 presumes that Mw is above a critical limit where molecular entanglements begin
to resist the flow. Zero shear viscosity can be estimated by using the imaginary component
(η’’) and the real component (η’) of the complex viscosity, the equation known as the Cole-
Cole equation (2):
𝜂∗(𝜔) =𝜂0
1+(𝑖𝜔𝜆0)1−ℎ (2)
where η* is the complex viscosity, ω angular frequency, η0 zero shear viscosity, λ0 average
relaxation time and h parameter of the relaxation-time distribution. This often used
experimental rheological model predicts that the η’’ versus η’ curve is an arc of a circle in the
complex plane and that the extrapolated crossing point of the arc and the real axis is zero
shear viscosity η0. The use of this model has been extensively reviewed in several
photodegradation publications.10, 15, 24
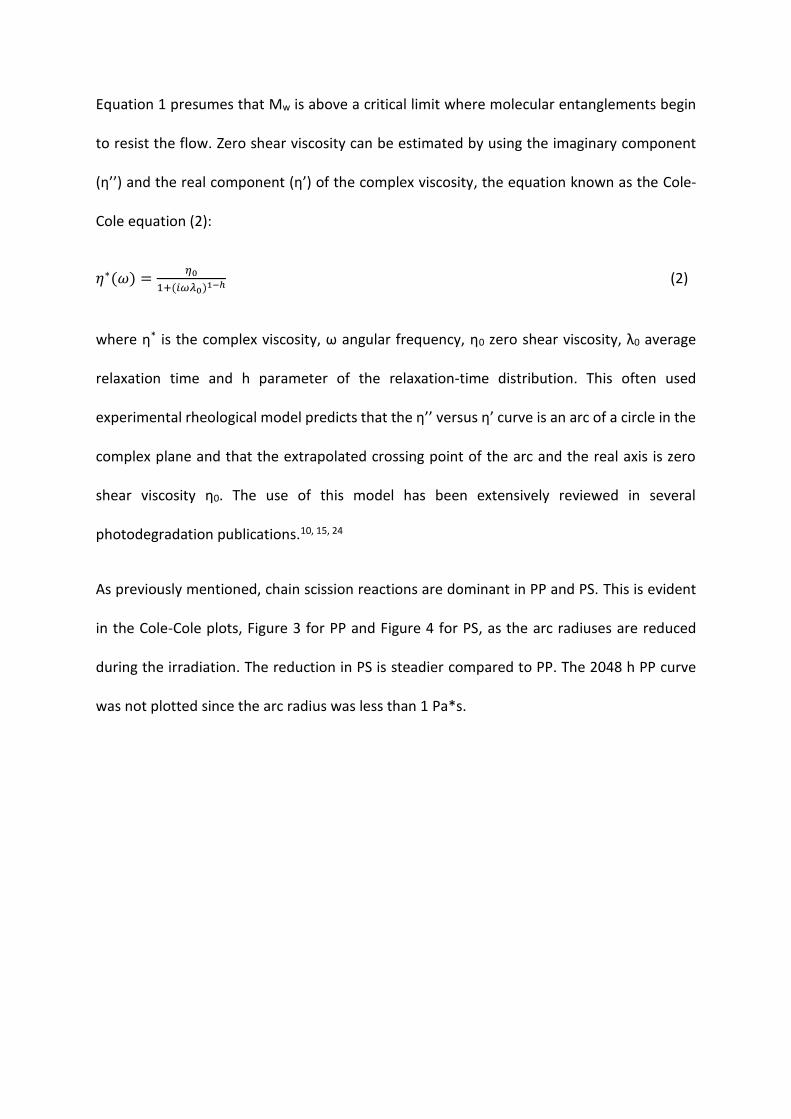
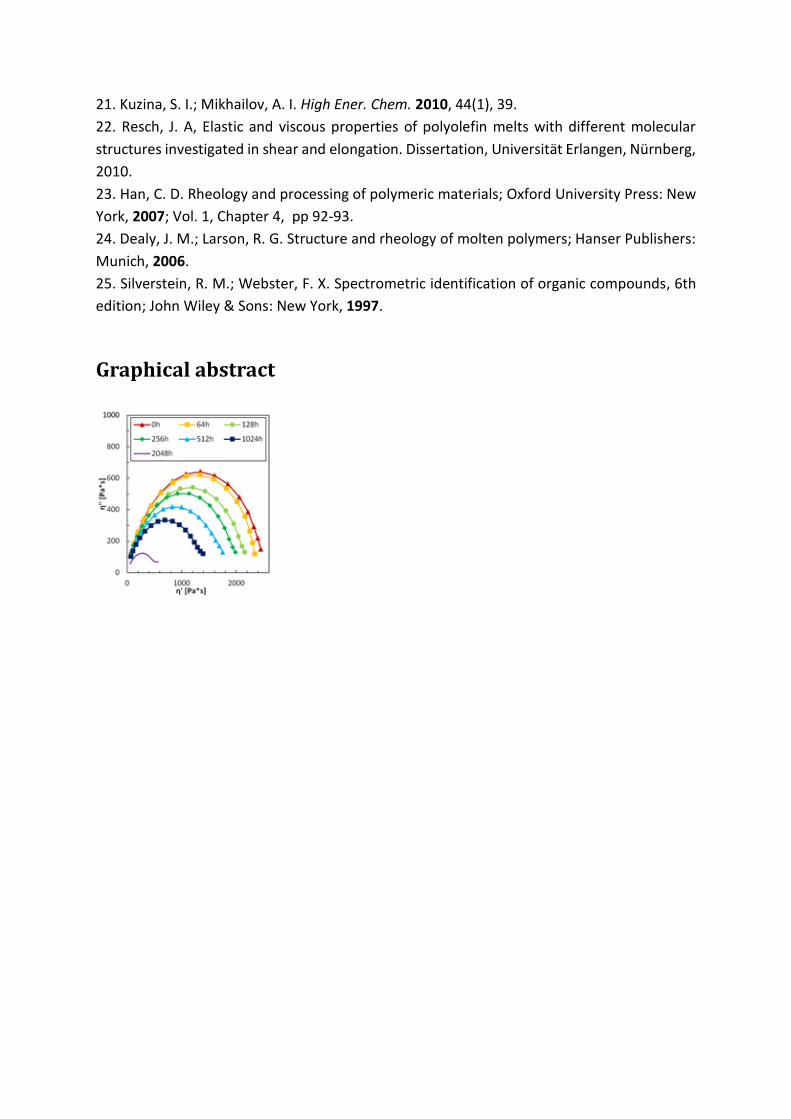
As previously mentioned, chain scission reactions are dominant in PP and PS. This is evident
in the Cole-Cole plots, Figure 3 for PP and Figure 4 for PS, as the arc radiuses are reduced
during the irradiation. The reduction in PS is steadier compared to PP. The 2048 h PP curve
was not plotted since the arc radius was less than 1 Pa*s.
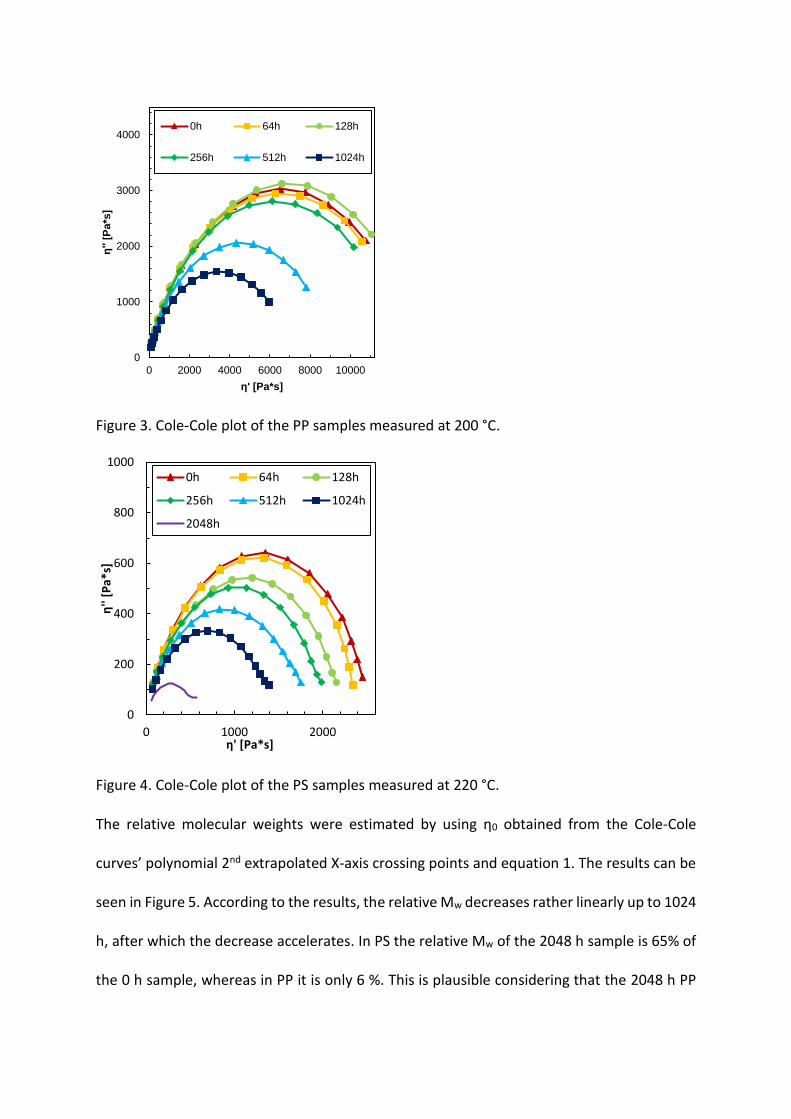
Figure 3. Cole-Cole plot of the PP samples measured at 200 °C.
Figure 4. Cole-Cole plot of the PS samples measured at 220 °C.
The relative molecular weights were estimated by using η0 obtained from the Cole-Cole
curves’ polynomial 2nd extrapolated X-axis crossing points and equation 1. The results can be
seen in Figure 5. According to the results, the relative Mw decreases rather linearly up to 1024
h, after which the decrease accelerates. In PS the relative Mw of the 2048 h sample is 65% of
the 0 h sample, whereas in PP it is only 6 %. This is plausible considering that the 2048 h PP
0
1000
2000
3000
4000
0 2000 4000 6000 8000 10000
η'' [
Pa*s
]
η' [Pa*s]
0h 64h 128h
256h 512h 1024h
0
200
400
600
800
1000
0 1000 2000
η''
[Pa*
s]
η' [Pa*s]
0h 64h 128h
256h 512h 1024h
2048h

sample is very fragile, but the accuracy of this value may be poor. A different measuring setup
was used due to the very low viscosity, and equation 1 is valid only above a certain critical
limit, as mentioned before.
Figure 5. Relative molecular weights of the PP and PS samples calculated from the
extrapolated Cole-Cole plots.
Another way to estimate the zero shear viscosity is derived from the complex viscosity curves.
Since the angular frequencies used in this study were not low enough to provide the zero
shear viscosities directly, extrapolations had to be used. This was done in equation 3 by fitting
and extrapolating the Carreau-Yasuda model:24
𝜂 = 𝜂0[1 + (𝜆𝜔)𝑎](𝑛−1)/𝑎 (3)
where η0 is the zero-shear rate viscosity, ω the angular frequency, and λ, n and a are the other
fitting parameters. The results, calculated using equation 1 and presented in Figure 6, are
consistent with the Cole-Cole inspections. Among these two methods, the Carreau-Yasuda
extrapolations were significantly more complicated and time-consuming so, based on these
results, the use of Cole-Cole plots is recommended.
0.5
0.6
0.7
0.8
0.9
1
1.1
64 128 256 512 1024 2048
Rela
tive M
w
Time [h]
PP
PS
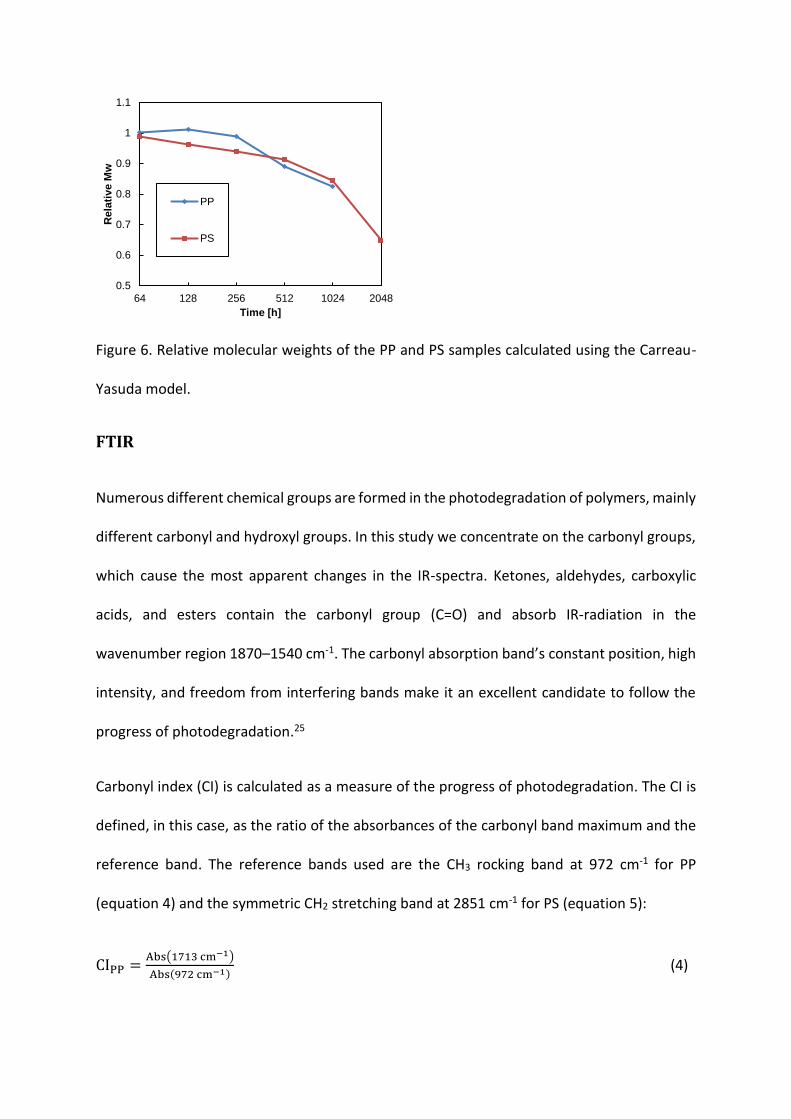
Figure 6. Relative molecular weights of the PP and PS samples calculated using the Carreau-
Yasuda model.
FTIR
Numerous different chemical groups are formed in the photodegradation of polymers, mainly
different carbonyl and hydroxyl groups. In this study we concentrate on the carbonyl groups,
which cause the most apparent changes in the IR-spectra. Ketones, aldehydes, carboxylic
acids, and esters contain the carbonyl group (C=O) and absorb IR-radiation in the
wavenumber region 1870–1540 cm-1. The carbonyl absorption band’s constant position, high
intensity, and freedom from interfering bands make it an excellent candidate to follow the
progress of photodegradation.25
Carbonyl index (CI) is calculated as a measure of the progress of photodegradation. The CI is
defined, in this case, as the ratio of the absorbances of the carbonyl band maximum and the
reference band. The reference bands used are the CH3 rocking band at 972 cm-1 for PP
(equation 4) and the symmetric CH2 stretching band at 2851 cm-1 for PS (equation 5):
CIPP =Abs(1713 cm−1)
Abs(972 cm−1) (4)
0.5
0.6
0.7
0.8
0.9
1
1.1
64 128 256 512 1024 2048
Rela
tive M
w
Time [h]
PP
PS

CIPS =Abs(1726 cm−1)
Abs(2851 cm−1) (5)
Linear baseline corrections are applied to all measured absorbances, since the baselines
shifted during photodegradation. The baseline correction regions are listed in Table 1.
Table 1. Linear baseline correction for the PP and PS samples.
Polymer Absorption band
[cm-1] Baseline correction
[cm-1]
PP 972 1070–926
1713 1825–1531
PS 2851 2876–2820
1726 1840–1630
FTIR tests show a totally different behaviour between these two materials than rheology. In
the case of PP the changes become visible roughly at the same time as in rheology, between
256 h and 512 h (Figure 7). In the case of PS (Figure 8), the changes are small compared to PP,
and do not become clearly visible before 1024 h. The CI of PP starts rising rapidly after 256 h
so that the 2048 h sample has almost 40 times higher CI than the 0 h sample (Figure 9). The
rise in the CI of PS is smaller and more linear compared to PP. The first signs of degradation
are visible around 256 h of irradiation, where the CI has risen 10% from the 0 h sample. At
512 h the rise is 22%, at 1024 h 48%, and at 2048 h 240%. Among these two materials, the
FTIR results are more consistent in PS. The variation in the surface of PP is estimated to be a
material related property which makes the early detection of photodegradation difficult with
FTIR.
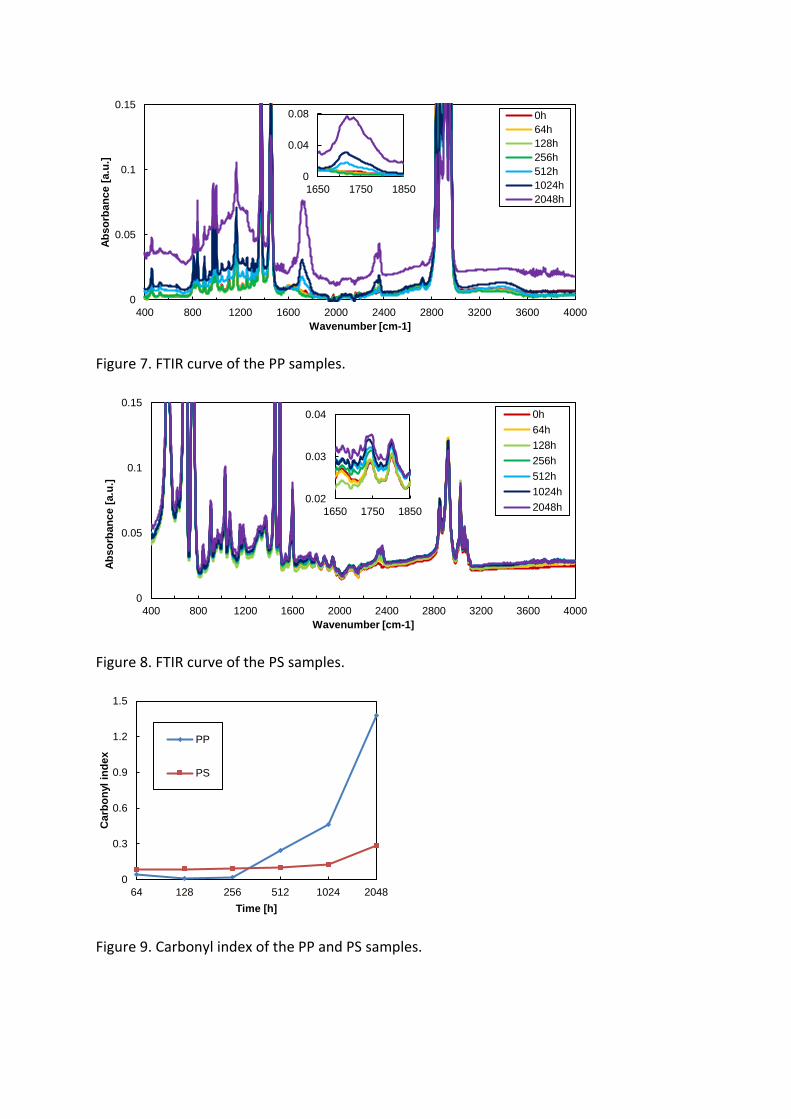
Figure 7. FTIR curve of the PP samples.
Figure 8. FTIR curve of the PS samples.
Figure 9. Carbonyl index of the PP and PS samples.
0
0.05
0.1
0.15
400 800 1200 1600 2000 2400 2800 3200 3600 4000
Ab
so
rban
ce [
a.u
.]
Wavenumber [cm-1]
0h
64h
128h
256h
512h
1024h
2048h
0
0.04
0.08
1650 1750 1850
0
0.05
0.1
0.15
400 800 1200 1600 2000 2400 2800 3200 3600 4000
Ab
so
rban
ce [
a.u
.]
Wavenumber [cm-1]
0h
64h
128h
256h
512h
1024h
2048h0.02
0.03
0.04
1650 1750 1850
0
0.3
0.6
0.9
1.2
1.5
64 128 256 512 1024 2048
Carb
on
yl
ind
ex
Time [h]
PP
PS

Conclusions
In the case of PP, rheology and FTIR were determined to be equally efficient methods in
detecting the early signs of photodegradation, observable after 256 h of UV irradiation. The
photodegradation mechanism of PS differs from PP so that the changes in PS can be seen
much earlier in rheology than in FTIR. The first signs of degradation were clearly visible in
rheology after 64 h of irradiation but the FTIR measurements did not show any changes before
256 h and no significant changes before 1024 h of ageing. This result is important because
FTIR is the most commonly used method to estimate the first signs of photodegradation. The
use of rheology could improve the detection of photodegradation in many cases, including
situations where the surface is nonhomogeneous, dirty, or flaky. In addition, rheology could
be better utilized in samples like textiles or fibers where FTIR has limitations.
Chain scission reactions were dominant over crosslinking which could be seen as reduced
viscosity for both materials. The curves of the Cole-Cole-plots were almost perfectly circular
arcs as suggested by theory, which provided a good basis for the relative molecular weight
estimations. These results were consistent with Carreau-Yasuda estimated molecular weights
It is important to notice that rheology reflects the changes in the whole sample whereas ATR-
FTIR shows only the chemical changes very near the material surface. This is a clear advantage
of rheology but it is also limited by the sample size requirements. Even though it is possible
to prepare samples from complex objects to be measured with rheology, this would be too
time-consuming to compete with FTIR. A typical rheological measurement takes only a few
minutes but sample preparation can multiply the time needed. Nevertheless, the results show
that rheological measurements have the potential to replace FTIR in certain situations in the
study of UV degradation, essentially in the early detection of degradation.
Acknowledgements
The authors are grateful to the Academy of Finland for funding the UVIADEM project (Grant
no 253655) and Ph.D Anu Heikkilä for the characterization of the UV irradiation chamber.
References
1. Edge, M. Infrared spectroscopy in analysis of polymer degradation. Encyclopedia of
analytical chemistry; Meyers, R. A., Ed.; Wiley, 2006.
2. Gardette, J.-L. Infrared Spectroscopy in the Study of the Weathering and Degradation of
Polymers. Handbook of Vibrational Spectroscopy; Chalmers, J. M.; Griffiths, P. R., Eds.; Wiley
2006.
3. Rajakumar, K.; Sarasvathy, V.; Thamarai Chelvan, A.; Chitra, R., Vijayakumar, C. T. J. Polym.
Environ. 2009, 17, 191.
4. Ranby, B.; Rabek J. F. In Photodegradation, photo-oxidation and photostabilization of
polymers; Pearce, E., Ed.; Wiley, New York, 1975.
5. De Goede, S. Novel analytical approaches for studying degradation in polypropylene and
propylene-1-pentene copolymers. Doctoral thesis. University of Stellenbosch; South Africa,
2006.
6. da Costa, H. M.; Ramos, V. D.; Rocha M. C. G. Polym. Testing 2005, 24, 86.
7. Kumar, A.; Commereuc, S.; Verney, V. Polym. Degrad. Stab. 2004, 85, 751.
8. Remili, C.; Kaci, M.; Benhamida, A.; Bruzaud, S.; Grohens, Y. Polym. Degrad. Stab. 2011, 96,
1489.
9. Benicek, L.; Chvatalova, L.; Obadal, M.; Cermak, R.; Verney, V.; Commereuc, S. Polym.
Degrad. Stab. 2011, 96, 1740.
10. Commereuc, S.; Bonhomme, S.; Verney, V.; Lacoste, J. Polymer 2000, 41, 917.
11. Moura, I.; Botelho, G.; Machado, A.V. J. Polym. Environ. 2014, 22, 148.
12. Spiridon, I.; Paduraru, O.M.; Rudowski, M.; Kozlowski, M: Darie, R. N. Indust. Eng. Chem.
Res. 2012, 51, 7279.
13. Oliani, W. L.; Parra, D. F.; Lugao, A. B. Rad. Phys. Chem. 2010, 79, 383.
14. Mylläri, V.; Ruoko, T.-P.; Järvelä, P. Polym. Degrad. Stab. 2014, 109, 278.
15. Commereuc, S.; Askanian, H.; Verney, V.; Celli, A.; Marchese, P.; Berti, C. Polym. Degrad.
Stab. 2013, 98, 1321.
16. Girois, S.; Audouin, L.; Verdu, J.; Delprat, P.; Marot, G. Polym. Degrad. Stab. 1996, 51, 125.
17. Bottino, F. A.; Cinquegrani, A. R.; Di Pasquale, G.; Leonardi, L.; Pollicino, A. Polym. Test.
2004, 23, 405.
18. Carlsson, D. J.; Wiles, D. M. Macromolecules 1969, 2(6), 587.
19. Carlsson, D. J.; Wiles, D. M. Macromolecules 1969, 2(6), 597.
20. Jang, B. N.; Wilkie, C. A. Polymer 2005, 46, 2933.
21. Kuzina, S. I.; Mikhailov, A. I. High Ener. Chem. 2010, 44(1), 39.
22. Resch, J. A, Elastic and viscous properties of polyolefin melts with different molecular
structures investigated in shear and elongation. Dissertation, Universität Erlangen, Nürnberg,
2010.
23. Han, C. D. Rheology and processing of polymeric materials; Oxford University Press: New
York, 2007; Vol. 1, Chapter 4, pp 92-93.
24. Dealy, J. M.; Larson, R. G. Structure and rheology of molten polymers; Hanser Publishers:
Munich, 2006.
25. Silverstein, R. M.; Webster, F. X. Spectrometric identification of organic compounds, 6th
edition; John Wiley & Sons: New York, 1997.
Graphical abstract