Embed Size (px)
Citation preview
www.ajhg.org Marchini et al.: Comparison of Phasing Algorithms 437
A Comparison of Phasing Algorithms for Trios and Unrelated IndividualsJonathan Marchini,1 David Cutler,2 Nick Patterson,3 Matthew Stephens,4 Eleazar Eskin,5Eran Halperin,6 Shin Lin,2 Zhaohui S. Qin,7 Heather M. Munro,7 Goncalo R. Abecasis,7and Peter Donnelly,1 for the International HapMap Consortium1Department of Statistics, University of Oxford, Oxford, United Kingdom; 2McKusick-Nathans Institute of Genetic Medicine, Johns HopkinsUniversity School of Medicine, Baltimore; 3Broad Institute of Massachusetts Institute of Technology and Harvard, Cambridge, MA;4Department of Statistics, University of Washington, Seattle; 5Computer Science Department, Hebrew University, Jerusalem; 6The InternationalComputer Science Institute, Berkeley; and 7Center for Statistical Genetics, Department of Biostatistics, University of Michigan, Ann Arbor
Knowledge of haplotype phase is valuable for many analysis methods in the study of disease, population, andevolutionary genetics. Considerable research effort has been devoted to the development of statistical and compu-tational methods that infer haplotype phase from genotype data. Although a substantial number of such methodshave been developed, they have focused principally on inference from unrelated individuals, and comparisonsbetween methods have been rather limited. Here, we describe the extension of five leading algorithms for phaseinference for handling father-mother-child trios. We performed a comprehensive assessment of the methods appliedto both trios and to unrelated individuals, with a focus on genomic-scale problems, using both simulated data anddata from the HapMap project. The most accurate algorithm was PHASE (v2.1). For this method, the percentagesof genotypes whose phase was incorrectly inferred were 0.12%, 0.05%, and 0.16% for trios from simulated data,HapMap Centre d’Etude du Polymorphisme Humain (CEPH) trios, and HapMap Yoruban trios, respectively, and5.2% and 5.9% for unrelated individuals in simulated data and the HapMap CEPH data, respectively. The othermethods considered in this work had comparable but slightly worse error rates. The error rates for trios are similarto the levels of genotyping error and missing data expected. We thus conclude that all the methods considered willprovide highly accurate estimates of haplotypes when applied to trio data sets. Running times differ substantiallybetween methods. Although it is one of the slowest methods, PHASE (v2.1) was used to infer haplotypes for the1 million–SNP HapMap data set. Finally, we evaluated methods of estimating the value of r2 between a pair ofSNPs and concluded that all methods estimated r2 well when the estimated value was �0.8.
Received September 2, 2005; accepted for publication December 29, 2005; electronically published January 26, 2006.Address for correspondence and reprints: Dr. Jonathan Marchini, Department of Statistics, University of Oxford, 1 South Parks Road, Oxford,
OX1 3TG, United Kingdom. E-mail: [email protected]. J. Hum. Genet. 2006;78:437–450. � 2006 by The American Society of Human Genetics. All rights reserved. 0002-9297/2006/7803-0012$15.00
The size and scale of genetic-variation data sets for bothdisease and population studies have increased enormous-ly. A large number of SNPs have been identified (currentdatabases show 9 million of the posited 10–13 millioncommon SNPs in the human genome [International Hap-Map Consortium 2005]); genotyping technology has ad-vanced at a dramatic pace, so that 500,000 SNP assayscan be undertaken in a single experiment; and patternsof correlations among SNPs (linkage disequilibrium [LD])have been catalogued in multiple populations, yieldingefficient marker panels for genomewide investigations(see the International HapMap Project Web site). Thesegenetic advances coincide with recognition of the needfor large case-control samples to robustly identify geneticvariants for complex traits. As a result, genomewide as-sociation studies are now being undertaken, and mucheffort is being made to develop efficient statistical tech-niques for analyzing the resulting data, to uncover thelocation of disease genes. In addition, the advances allowmuch more detailed analysis of candidate genes identi-fied by more traditional linkage-analysis methods.
Many methods of mapping disease genes assume that
haplotypes from case and control individuals are avail-able in the region of interest. Such approaches have beensuccessful in localizing many monogenic disorders (Laz-zeroni 2001), and there is increasing evidence, of botha practical and theoretical nature, that the use of haplo-types can be more powerful than individual markers inthe search for more-complex traits (Puffenberger et al.1994; Akey et al. 2001; Hugot et al. 2001; Rioux et al.2001). Similarly, haplotypes are required for many pop-ulation-genetics analyses, including some methods forinferring selection (Sabeti et al. 2002), and for studyingrecombination (Fearnhead and Donnelly 2001; Myersand Griffiths 2003) and historical migration (Beerli andFelsenstein 2001; De Iorio and Griffiths 2004).
It is possible to determine haplotypes by use of experi-mental techniques, but such approaches are considerablymore expensive and time-consuming than modern high-throughput genotyping. The statistical determination ofhaplotype phase from genotype data is thus potentiallyvery valuable if the estimation can be done accurately.This problem has received an increasing amount of atten-tion over recent years, and several computational and
438 The American Journal of Human Genetics Volume 78 March 2006 www.ajhg.org
statistical approaches have been developed in the litera-ture (see Salem et al. [2005] for a recent literature re-view). Existing methods include parsimony approaches(Clark 1990; Gusfield 2000, 2001), maximum-likelihoodmethods (Excoffier and Slakin 1995; Hawley and Kidd1995; Long et al. 1995; Fallin and Schork 2000; Qin etal. 2002), Bayesian approaches based on conjugate pri-ors (Lin et al. 2002, 2004b; Niu et al. 2002) and onpriors from population genetics (Stephens et al. 2001;Stephens and Donnelly 2003; Stephens and Scheet 2005),and (im)perfect phylogeny approaches (Eskin et al. 2003;Gusfield 2003). Up to now, no comprehensive comparisonof many of these approaches has been conducted.
The forthcoming era of genomewide studies presentstwo new challenges to the endeavor of haplotype-phaseinference. First, the size of data sets that experimenterswill want to phase is about to increase dramatically, interms of both numbers of loci and numbers of individ-uals. For example, we might expect data sets consistingof 500,000 SNPs genotyped in 2,000 individuals in somegenomewide studies. Second, to date, most approacheshave focused on inferring haplotypes from samples ofunrelated individuals, but estimation of haplotypes fromsamples of related individuals is likely to become im-portant. When inferring haplotypes within families, sub-stantially more information is available than for samplesof unrelated individuals. For example, consider the sit-uation in which a father-mother-child trio has been geno-typed at a given SNP locus. With no missing data, phasecan be determined precisely, unless all three individualsare heterozygous at the locus in question. Of loci witha minor-allele frequency of 20%, for example, just 5.1%will be phase unknown in trios, but this rises to 32%in unrelated individuals. With missing data, other com-binations of genotypes can also fail to uniquely deter-mine phase.
In this study, we describe the extension of several ex-isting algorithms for dealing with trio data. We then de-scribe a comprehensive evaluation of the performanceof these algorithms for both trios and unrelated individ-uals. The evaluation uses both simulated and real datasets of a larger size (in terms of numbers of SNPs) thanhas been previously been considered. We draw the en-couraging conclusion that all methods provide a verygood level of accuracy on trio data sets. Overall, thePHASE (v2.1) algorithm provided the most accurate es-timation on all the data sets considered. For this method,the percentages of genotypes whose phase was incor-rectly inferred were 0.12%, 0.05%, and 0.16% for triosfrom simulated data, HapMap CEPH trios, and HapMapYoruban trios, respectively, and 5.2% and 5.9% for un-related individuals in simulated data and the HapMapCEPH data, respectively. The other methods consideredin this study had comparable but slightly worse errorrates. The error rates for trios are comparable to ex-
pected levels of genotyping error and missing data andhighlight the level of accuracy that the best phasing algo-rithms can provide on a useful scale. We also observedsubstantial variation in the speed of the algorithms weconsidered. Although it is one of the slowest methods,PHASE (v2.1) was used to infer haplotypes for the 1million–SNP HapMap data set (International HapMapConsortium 2005). In addition, the data sets used in thiscomparison will be made available, to form a benchmarkset to aid the future development and assessment ofphasing algorithms. Finally, we evaluated methods ofestimating the value of between a pair of SNPs. The2rmost accurate method for estimating was to first use2rPHASE to infer the haplotypes across the region andthen to estimate between the pair of SNPs as if the2rhaplotypes were known. All methods estimated well2rwhen the estimated value was �0.8.
Material and Methods
In this section, we describe the algorithms implemented in thisstudy. Since most of these algorithms have been described else-where, we give only a brief overview of each method, togetherwith some details concerning how each method was extendedto cope with father-mother-child trios. Following a descriptionof our notation and the assumptions made by each method,there is one subsection for each new method. Individuals whocontributed to the development of the trio version of eachmethod are shown in parentheses as part of the subsectiontitle. In each subsection, expressed opinions are those of thecontributing authors of that subsection and not of the com-bined set of authors as a group. We conclude with a conciseoverview that relates the different methods according to theassumptions they make about the most-plausible haplotypereconstructions.
Notation and Assumptions
We consider m linked SNPs on a chromosomal region of ntrio families, where each trio consists of a mother, a father,and one offspring. We use the following notation throughout.Let denote all the observed genotypes, inG p (G ,…,G )1 n
which denotes the ith trio. GFi, GMi, andG p (GM ,GF ,GC )i i i i
GCii denote the observed genotype data for the father, mother,and child, respectively, and each are vectors of length m—thatis, , with , 1, or 2 representingGF p (GF ,…,GF ) GF p 0i i1 im ik
homozygous wild-type, heterozygous, or homozygous mutantgenotypes, respectively, at SNP marker k. Similarly, let H p
denote the unobserved haplotype configura-(H ,H ,…,H )1 2 n
tions compatible with G, in which , whereH p (HM ,HF)i i i
and denote the haplo-HM p (HM ,HM ) HF p (HF ,HF )i i1 i2 i i1 i2
type pairs of the mother and father, respectively. We use thenotation to indicate that the two haplo-HF � HF p GFi1 i2 i
types are compatible with the genotype GFi. Also, we letbe a vector of unknown population haplotypeV p (v ,…,v )1 s
frequencies of the s possible haplotypes that are consistent withthe sample.
All of the following algorithms make the assumption that
www.ajhg.org Marchini et al.: Comparison of Phasing Algorithms 439
all the parents are sampled independently from the populationand that no recombination occurs in the transmission of hap-lotypes from the parents to children.
PHASE (M.S. and J.M.)
The PHASE algorithm (Stephens et al. 2001; Stephens andDonnelly 2003; Stephens and Scheet 2005) is a Bayesian ap-proach to haplotype inference that uses ideas from populationgenetics—in particular, coalescent-based models—to improveaccuracy of haplotype estimates for unrelated individuals sam-pled from a population. The algorithm attempts to capture thefact that, over short genomic regions, sampled chromosomestend to cluster together into groups of similar haplotypes. Withthe explicit incorporation of recombination in the most recentversion of the algorithm (Stephens and Scheet 2005), this clus-tering of haplotypes may change as one moves along a chromo-some. The method uses a flexible model for the decay of LDwith distance that can handle both “blocklike” and “nonblock-like” patterns of LD.
We extended the algorithm described by Stephens and Scheet(2005) to allow for data from trios (two parents and one off-spring). We treat the parents as a random sample from thepopulation and aim to estimate their haplotypes, taking intoaccount both the genotypes of the parents and the genotypeof the child. More specifically, we aim to sample from thedistribution (compared with samplingPr (HF,HMFGF,GM,GC)from , as shown in the work by StephensPr (HF,HMFGF,GM)and Scheet [2005]). To do this, we use a Markov chain–MonteCarlo (MCMC) algorithm very similar to that of Stephens andScheet (2005), but, instead of updating one individual at atime, we update pairs of parents simultaneously. Note that theobserved genotypes may include missing data at some loci, inwhich case the inferred haplotype pairs will include estimatesof the unobserved alleles. When updating the parents in trioi, this involves computing, for each possible pair of haplotypecombinations in the two par-′ ′(HF p {hf,hf };HM p {hm,hm })i i
ents, the probability
′Pr HF p {hf,hf },HM( i i
′p {hm,hm }FGF ,GM ,GC ,HF ,HM ,r ∝ a bg ,)i i i �i �i i i i
where
′a p (2 � d )p(hfFHF ,HM ,r,m)p(hf FHF ,HM ,r,m) ,′i hfhf �i �i �i �i
′b p (2 � d )p(hmFHF ,HM ,r,m)p(hm FHF ,HM ,r,m) ,′i hmhm �i �i �i �i
and
′ ′g p Pr [GCFHF p (hf,hf ),HM p (hm,hm )] ,i i i i
and where is 1 if and is 0 otherwise; and′d h p h HF′hh �i
are the sets and with and removed,HM HF HM HF HM�i i i
respectively; p is a modification of the conditional distributionof Fearnhead and Donnelly (2001); r is an estimate of thepopulation-scaled recombination rate, which is allowed to varyalong the region being considered; and m is a parameter that
controls the mutation rate (see Stephens and Scheet [2005] formore details). The probability ′Pr [GCFHF p (hf,hf ),HM pi i i
is calculated assuming no recombination from par-′(hm,hm )]ents to offspring and is therefore trivial to compute. We alsoassume no genotyping error. As a result, this probability istypically equal to 0 for a large number of parental diplotypeconfigurations consistent with the parental genotypes, so thechildren’s genotype data substantially reduces the number ofdiplotype configurations that must be considered. As in thework of Stephens and Scheet (2005), we use Partition Ligation(Niu et al. 2002) to further reduce the number of diplotypeconfigurations considered when estimating haplotypes overmany markers. This approach is not the most efficient, but itinvolved few changes to the existing algorithm.
wphase (N.P.)
The model underlying wphase was developed on the basisof ideas proposed by Fearnhead and Donnelly (2001) thatintroduced a simple approximate model for haplotypes sam-pled from a population. The algorithm differs from the PHASEalgorithm above in three ways:
1. PHASE uses MCMC to sample configurations, whereaswphase performs a discrete hill climb. wphase computesa pseudolikelihood function or score for a putative hap-lotype reconstruction, H, of the form
n
S(H) p a bg ,� i i iip1
where , , and are defined as in the description ofa b gi i i
PHASE above. The method attempts to maximize thescore by iteratively applying a set of “moves” that makesmall changes to the reconstruction.
2. PHASE and wphase differ in the precise form of the con-ditional distributions, p, used to calculate the factors a i
and . As explained above, PHASE uses a modificationbi
of the conditional distribution of Fearnhead and Donnelly(2001), whereas wphase uses the conditional distributionsintroduced by Li and Stephens (2003).
3. PHASE internally re-estimates a variable recombinationrate across the region, whereas wphase uses an externallyinput constant recombination rate across the region. Spe-cifically, wphase uses and .r p 0.05 v p 0.02
In our opinion, the second and third differences are more im-portant than the first. Although use of an MCMC offers sometheoretical advantages, particularly the possibility of inferencewith use of multiple imputation of haplotypes, this is rarelyused in practice (see David Clayton’s SNPHAP algorithm fora notable exception [Clayton Web site]). If only one haplotypereconstruction is to be used (e.g., in HapMap), then maxi-mizing a pseudolikelihood function is likely to produce a goodsolution. Testing in simulation has shown that wphase nearlyalways returns a score that is as good as or better than thevalue of the true haplotypes. This suggests that the quality ofthe reconstruction can be improved only by refining the score,not by altering the details of the hill climb. The difference inthe form of the conditional distributions described above maylead to improved reconstructions (Stephens and Scheet 2005).
440 The American Journal of Human Genetics Volume 78 March 2006 www.ajhg.org
In the special case of the resolution of singleton SNPs that oc-cur in the same individual, the conditional distributions usedwith PHASE will result in a more plausible solution than thoseused with wphase. The effect this difference has for nonsingle-ton SNPs remains unclear.
In addition, internally estimating a variable recombinationrate is important, and its absence is a major weakness of thecurrent version of wphase. True recombination rates varygreatly across the genome (McVean et al. 2004; Myers et al.2005) and between various simulated regions in our test set.
Initial comparisons with PHASE version 1 (Stephens et al.2001) at the time of development showed wphase to have verysimilar performance but not enough improvement to make itimportant to publish quickly. Since then, wphase has hardlyimproved, the main change being support for trio data, butPHASE underwent a major revision, with significant perfor-mance enhancements (Stephens and Donnelly 2003; Stephensand Scheet 2005).
HAP2 (S.L., A.C., and D.C.)
Haplotype and missing data inference was performed withHAP2, the details of which have been published elsewhere (Linet al. 2004b). In short, HAP2 takes a Bayesian approach tohaplotype reconstruction, set forth by Stephens et al. (2001),of dynamically updating an individual’s haplotypes to re-semble other haplotypes in the sample at each iteration in anMCMC scheme. The differences between this algorithm andthe PHASE algorithm described above are as follows.
1. The conditional distributions, p, used at each iterationto sample the reconstruction of each individual are a spe-cial case of those used in PHASE, in which recombinationis not explicitly modeled and a parent-independent mu-tation model is assumed. Specifically, the probability ofobserving a new haplotype is given by a Hoppe urn model(Hoppe 1987) or, equivalently, a Dirichlet, rather thancoalescent-based, prior distribution for the haplotypes.Stephens et al. (2001) point out that the mode of theposterior distribution of this model will be close to themaximum-likelihood estimate sought by the expectation-maximization (EM) algorithm.
2. Whole haplotypes are not taken into account duringthe calculation of the conditional distributions. In recon-struction of an individual’s haplotypes only, data at sitesthat are ambiguous for that individual are used. Thisdifference results in a large increase in the speed of thealgorithm.
3. A variant-partition ligation method (Niu et al. 2002) isused for the piecemeal reconstruction of haplotypes. Weset the boundaries of the atomistic units to coincide withthose of high-LD blocks. These regions were defined tobe contiguous sequences in which all pairwise (Le-′FD Fwontin 1988) among segregating sites are 10.8. The two-locus haplotype frequencies needed for the calculation ofthese values were estimated by the Weir-Cockerham two-point EM algorithm (Weir 1996). In our program, LDblocks longer than six sites were split to make atomisticunits computationally manageable. Also, orphaned seg-regating sites that were not linked with any high-LDblocks were absorbed into the adjacent block containing
a site with the maximum to the orphan.2r
With nuclear-family data, our program reconstructs the hap-lotypes of parents with children’s genotypes used to constrainthe former’s haplotype space. On a more technical note, when-ever an individual’s haplotypes cannot be reconstructed to beequivalent to other haplotypes found in the population sample,a parent-independent mutation model is assumed that givesequal weight to all plausible reconstructions; this situation israrely encountered in practice, because of the atomistic unitsused in the algorithm.
The goal of our program was to create a tool that achieveshighly accurate haplotype reconstruction but that could beused, with reasonable execution times, on enormous data sets.The ultimate intent was to use the haplotypes reconstructedin this manner as alleles in disease-association studies (Lin etal. 2004a).
HAP (E.H. and E.E.)
HAP was extended (Halperin and Eskin 2004) to allow itto cope with genotypes typed from father-mother-child trios.The HAP algorithm assumes that the ancestral history of thehaplotypes can be described by a perfect phylogeny tree. Aperfect phylogeny tree is a genealogical tree with no recom-binations and no recurrent mutations. HAP considers all phaseassignments that result in a set of haplotypes that are almostconsistent with a perfect phylogeny. Each assignment, H, is thengiven a score, , that is the maximum likelihood of theS(H)solution, under the assumption that the haplotypes were ran-domly picked from the population. More specifically,
n
S(H) p max v v v v ,� HM HM HF HFi1 i2 i1 i2iV
where and . HAP thenHF � HF p GF HM � HM p GMi1 i2 i i1 i2 i
chooses the phase assignment with the highest score. To phasea long region, HAP applies the perfect phylogeny model in asliding window to short overlapping regions. These overlap-ping predictions are combined using a dynamic programming-based tiling algorithm that chooses the optimal phase assign-ment for the long region that is most consistent with the over-lapping predictions of phase in the short regions (see Halperinand Eskin [2004] for more details).
Within a short region, the extension of HAP to trios musttake into account the fact that the haplotypes of the childrenare copies of the haplotypes of the parents. We assume thereare no recombinations or mutations between the parents andthe children in the trios. This allows us, first, to unambiguouslyresolve the phase of the trios in many of the positions. For theremaining positions, we use HAP to enumerate all possiblephase assignments. This results in a set of haplotypes that arealmost consistent with a perfect phylogeny. In that enumera-tion, we exclude the solutions that contradict Mendelian in-heritance within a trio. For each such solution, we give thelikelihood score, which is the probability to observe the par-ents’ haplotypes in our sample. We pick the solution with max-imum likelihood as a candidate solution. To further improvethe solution, we use a local search algorithm. The local searchalgorithm starts from the solution given by HAP, and it re-
www.ajhg.org Marchini et al.: Comparison of Phasing Algorithms 441
peatedly changes the phase of one of the trios to a differentpossible phase and checks whether the likelihood function hasincreased. If it has increased, we use the new solution as thecandidate solution and repeat this procedure. If no local changecan be applied to increase the likelihood, we stop and use thesolution as a putative solution for this region. HAP has beensuccessfully applied to several large genomic data sets, includ-ing a whole-genome survey of genetic variation (Hinds et al.2005).
tripleM and PL-EM (Z.S.Q., T. Niu, and J. Liu)
The tripleM algorithm is a direct extension of the EM al-gorithm (Dempster et al. 1977) used in maximum-likelihoodhaplotype reconstruction for unrelated individuals (MacLeanand Morton 1985; Excoffier and Slakin 1995; Hawley and Kidd1995; Long et al. 1995; Chiano and Clayton 1998; Qin et al.2002); “PL-EM” is the name given to the version of the al-gorithm for unrelated data.
Assuming that there is no recombination event in this chro-mosomal region during meiosis, we write down the probabilityof observing the genotype data in a single trio family:
P(GFV) ∝ � �iHF �HF pGF HM �HM pGMi1 i2 i i1 i2 i
#v v v v I ,HF HF HM HM HF �HM pGCi1 i2 i1 i2 i i i
where is the indicator function for the event thatIHF �HM pGCi i i
and , such that .au � HF v � HM u � v p GCi i i
Assuming, further, a complete independence of the n triofamilies, we have the joint probability of the data from all thefamilies as the product of that of individual ones. In the E stepof the ( )th iteration of the EM algorithm, we compute thet � 1Q function as , where
s(t)Q(VFV ) p � E (n FG) log v(t)V g ggp1
n (t) (t) (t) (t)v v v v Ia b c d {g�{a ,b ,c ,d }and{a ,b }�{c ,d }pGC }i i i i i i i i i i i i iE (n FG) p .(t) �V g (t) (t) (t) (t)� � v v v v I′ ′ ′ ′ ′ ′ ′ ′ip1 a b c d {{a ,b }�{c ,d }pGC }i i i i i i i i i′ ′ ′ ′a �b pGF c �d pGMi i i i i i
In the M-step, the frequency vector is updated by maximizingthe Q function, which gives rise to
E (n FG)(t)V g(t�1)v p .g 4n
For k linked SNPs, the total number of all possible distincthaplotypes is . The regular EM algorithm is unable to handlek2such a large number of SNPs, and computational techniquesare required to allow this method to be applied to large regions.Partition-ligation (Niu et al. 2002) can be applied to solve thisproblem. At the beginning, the SNPs are divided into disjointpieces, typically no more than eight SNPs in each piece. Theabove EM-based algorithm is then applied to all the trio fam-ilies, to infer haplotype frequencies in each subset of markers.Since phasing on these subsets of markers is performed inde-pendent of one another, these steps can be performed in par-allel, to speed up the process. Subsequently, adjacent piecesare ligated using the same EM algorithm. To keep the com-
putation cost in check, only nonrare haplotypes are retainedin each EM step. Essentially, tripleM is a direct extension ofthe PL-EM algorithm for haplotype reconstruction, seen in thework of Qin et al. (2002), and this approach has been usedto construct haplotype phase for general pedigrees in the workof Zhang et al. (2005).
Summary of Methods
The descriptions of the above algorithms indicate that thereare strong similarities among the models and assumptions theyuse (see table 1 for a summary of the properties of the fivemethods). We have also found it useful to consider differencesamong the methods from a formal point of view, in terms ofthe probability model on which they are based. We find ituseful to think of each of the models from a Bayesian pointof view, even though this may not be how all of the methodswere developed and subsequently described. Within this frame-work, we wish to make inferences about the unknown haplo-type reconstruction, H, and the population allele frequenciesof the haplotypes, V, conditional on a set of observed genotypedata G—that is, we wish to infer the posterior distribution
. By use of the Bayes rule, this can be written asp(V,HFG)
Pr (V,HFG) ∝ Pr (GFH)Pr (HFV)Pr (V) ,
and each method can be described in terms of the three factorson the right side of this expression. All five of the methodsconsidered here use essentially the same expression for the firsttwo factors. The first factor, , models how consistentPr (GFH)the haplotype configuration H is with the observed genotypedata G. So, for trio data,
n
′ ′Pr (GFH) p Pr [GCFHF p (hf,hf ),HM p (hm,hm )] ,� i i iip1
where is computed un-′ ′Pr [GCFHF p (hf,hf ),HM p (hm,hm )]i i i
der the assumption of no recombination between parents andchild.
The second factor models the probability distribution of thehaplotype reconstruction, H, given the population allele fre-quencies, V. All of the methods make the assumption of ran-dom mating in the population, to derive the following prob-ability model:
n
Pr (HFV) p v v v v .� HM HM HF HFi1 i2 i1 i2i
Earlier, we saw that the key idea behind the PHASE algo-rithm is that, over short genomic regions, sampled chromo-somes tend to cluster together into groups of similar haplo-types. This “clustering property” is encapsulated through thespecification of a prior distribution on the population haplo-type frequencies, V. PHASE and wphase use a prior that ap-proximates the coalescent with recombination that puts moreweight on distributions in which clusters of similar haplotypestend to have nonzero frequency. Unfortunately, it is not pos-sible to write down the form of this prior distribution directly,since PHASE and wphase directly specify the conditional dis-
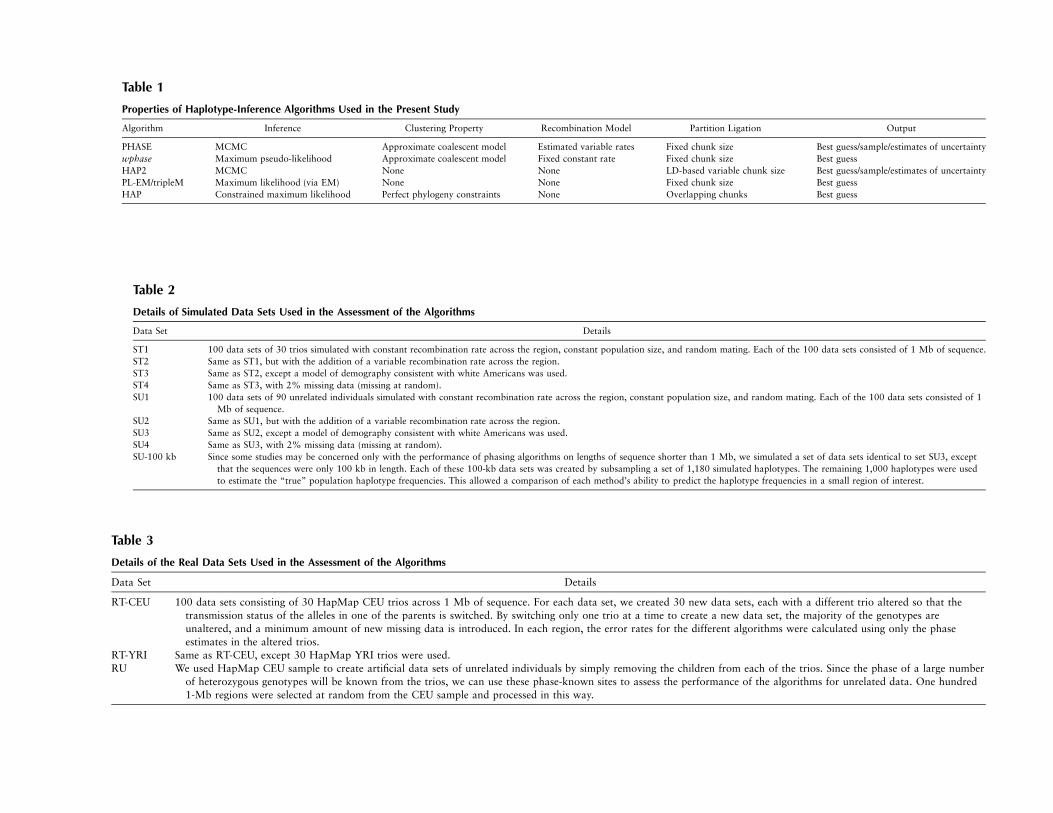
Table 1
Properties of Haplotype-Inference Algorithms Used in the Present Study
Algorithm Inference Clustering Property Recombination Model Partition Ligation Output
PHASE MCMC Approximate coalescent model Estimated variable rates Fixed chunk size Best guess/sample/estimates of uncertaintywphase Maximum pseudo-likelihood Approximate coalescent model Fixed constant rate Fixed chunk size Best guessHAP2 MCMC None None LD-based variable chunk size Best guess/sample/estimates of uncertaintyPL-EM/tripleM Maximum likelihood (via EM) None None Fixed chunk size Best guessHAP Constrained maximum likelihood Perfect phylogeny constraints None Overlapping chunks Best guess
Table 2
Details of Simulated Data Sets Used in the Assessment of the Algorithms
Data Set Details
ST1 100 data sets of 30 trios simulated with constant recombination rate across the region, constant population size, and random mating. Each of the 100 data sets consisted of 1 Mb of sequence.ST2 Same as ST1, but with the addition of a variable recombination rate across the region.ST3 Same as ST2, except a model of demography consistent with white Americans was used.ST4 Same as ST3, with 2% missing data (missing at random).SU1 100 data sets of 90 unrelated individuals simulated with constant recombination rate across the region, constant population size, and random mating. Each of the 100 data sets consisted of 1
Mb of sequence.SU2 Same as SU1, but with the addition of a variable recombination rate across the region.SU3 Same as SU2, except a model of demography consistent with white Americans was used.SU4 Same as SU3, with 2% missing data (missing at random).SU-100 kb Since some studies may be concerned only with the performance of phasing algorithms on lengths of sequence shorter than 1 Mb, we simulated a set of data sets identical to set SU3, except
that the sequences were only 100 kb in length. Each of these 100-kb data sets was created by subsampling a set of 1,180 simulated haplotypes. The remaining 1,000 haplotypes were usedto estimate the “true” population haplotype frequencies. This allowed a comparison of each method’s ability to predict the haplotype frequencies in a small region of interest.
Table 3
Details of the Real Data Sets Used in the Assessment of the Algorithms
Data Set Details
RT-CEU 100 data sets consisting of 30 HapMap CEU trios across 1 Mb of sequence. For each data set, we created 30 new data sets, each with a different trio altered so that thetransmission status of the alleles in one of the parents is switched. By switching only one trio at a time to create a new data set, the majority of the genotypes areunaltered, and a minimum amount of new missing data is introduced. In each region, the error rates for the different algorithms were calculated using only the phaseestimates in the altered trios.
RT-YRI Same as RT-CEU, except 30 HapMap YRI trios were used.RU We used HapMap CEU sample to create artificial data sets of unrelated individuals by simply removing the children from each of the trios. Since the phase of a large number
of heterozygous genotypes will be known from the trios, we can use these phase-known sites to assess the performance of the algorithms for unrelated data. One hundred1-Mb regions were selected at random from the CEU sample and processed in this way.
www.ajhg.org Marchini et al.: Comparison of Phasing Algorithms 443
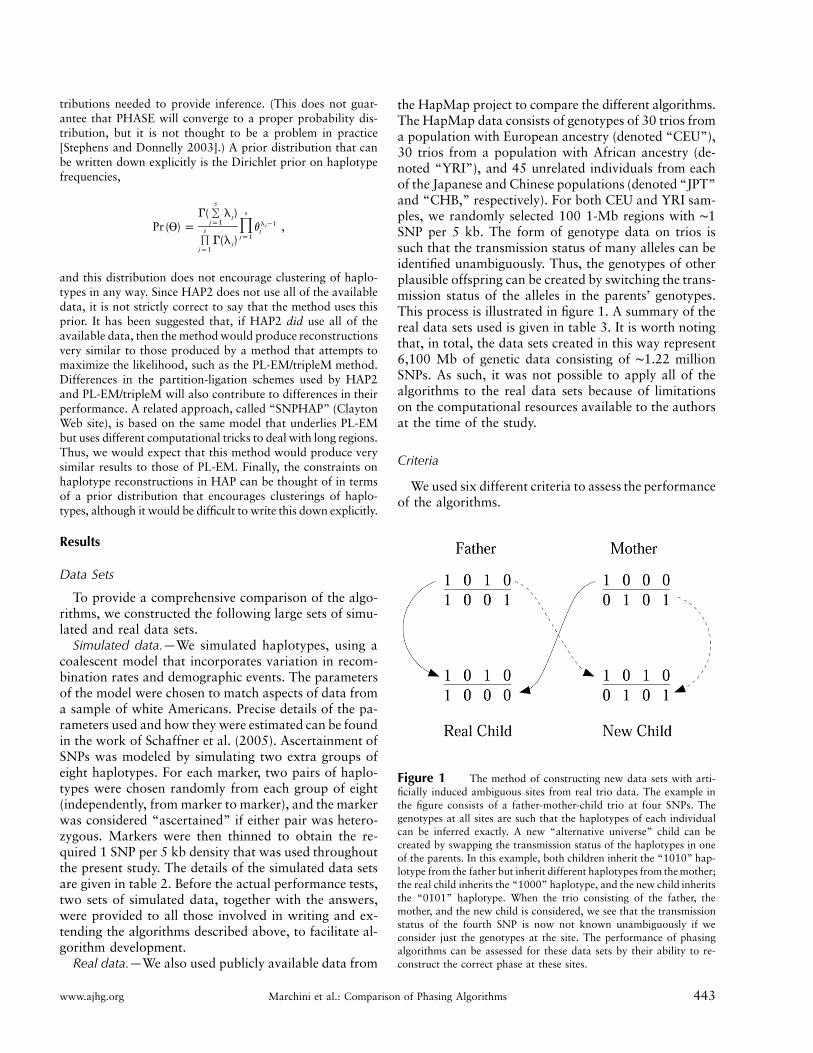
Figure 1 The method of constructing new data sets with arti-ficially induced ambiguous sites from real trio data. The example inthe figure consists of a father-mother-child trio at four SNPs. Thegenotypes at all sites are such that the haplotypes of each individualcan be inferred exactly. A new “alternative universe” child can becreated by swapping the transmission status of the haplotypes in oneof the parents. In this example, both children inherit the “1010” hap-lotype from the father but inherit different haplotypes from the mother;the real child inherits the “1000” haplotype, and the new child inheritsthe “0101” haplotype. When the trio consisting of the father, themother, and the new child is considered, we see that the transmissionstatus of the fourth SNP is now not known unambiguously if weconsider just the genotypes at the site. The performance of phasingalgorithms can be assessed for these data sets by their ability to re-construct the correct phase at these sites.
tributions needed to provide inference. (This does not guar-antee that PHASE will converge to a proper probability dis-tribution, but it is not thought to be a problem in practice[Stephens and Donnelly 2003].) A prior distribution that canbe written down explicitly is the Dirichlet prior on haplotypefrequencies,
s
sG( � l )jjp1 l �1jPr (V) p v ,�s j
jp1� G(l )jjp1
and this distribution does not encourage clustering of haplo-types in any way. Since HAP2 does not use all of the availabledata, it is not strictly correct to say that the method uses thisprior. It has been suggested that, if HAP2 did use all of theavailable data, then the method would produce reconstructionsvery similar to those produced by a method that attempts tomaximize the likelihood, such as the PL-EM/tripleM method.Differences in the partition-ligation schemes used by HAP2and PL-EM/tripleM will also contribute to differences in theirperformance. A related approach, called “SNPHAP” (ClaytonWeb site), is based on the same model that underlies PL-EMbut uses different computational tricks to deal with long regions.Thus, we would expect that this method would produce verysimilar results to those of PL-EM. Finally, the constraints onhaplotype reconstructions in HAP can be thought of in termsof a prior distribution that encourages clusterings of haplo-types, although it would be difficult to write this down explicitly.
Results
Data Sets
To provide a comprehensive comparison of the algo-rithms, we constructed the following large sets of simu-lated and real data sets.
Simulated data.—We simulated haplotypes, using acoalescent model that incorporates variation in recom-bination rates and demographic events. The parametersof the model were chosen to match aspects of data froma sample of white Americans. Precise details of the pa-rameters used and how they were estimated can be foundin the work of Schaffner et al. (2005). Ascertainment ofSNPs was modeled by simulating two extra groups ofeight haplotypes. For each marker, two pairs of haplo-types were chosen randomly from each group of eight(independently, from marker to marker), and the markerwas considered “ascertained” if either pair was hetero-zygous. Markers were then thinned to obtain the re-quired 1 SNP per 5 kb density that was used throughoutthe present study. The details of the simulated data setsare given in table 2. Before the actual performance tests,two sets of simulated data, together with the answers,were provided to all those involved in writing and ex-tending the algorithms described above, to facilitate al-gorithm development.
Real data.—We also used publicly available data from
the HapMap project to compare the different algorithms.The HapMap data consists of genotypes of 30 trios froma population with European ancestry (denoted “CEU”),30 trios from a population with African ancestry (de-noted “YRI”), and 45 unrelated individuals from eachof the Japanese and Chinese populations (denoted “JPT”and “CHB,” respectively). For both CEU and YRI sam-ples, we randomly selected 100 1-Mb regions with ∼1SNP per 5 kb. The form of genotype data on trios issuch that the transmission status of many alleles can beidentified unambiguously. Thus, the genotypes of otherplausible offspring can be created by switching the trans-mission status of the alleles in the parents’ genotypes.This process is illustrated in figure 1. A summary of thereal data sets used is given in table 3. It is worth notingthat, in total, the data sets created in this way represent6,100 Mb of genetic data consisting of ∼1.22 millionSNPs. As such, it was not possible to apply all of thealgorithms to the real data sets because of limitationson the computational resources available to the authorsat the time of the study.
Criteria
We used six different criteria to assess the performanceof the algorithms.
444 The American Journal of Human Genetics Volume 78 March 2006 www.ajhg.org
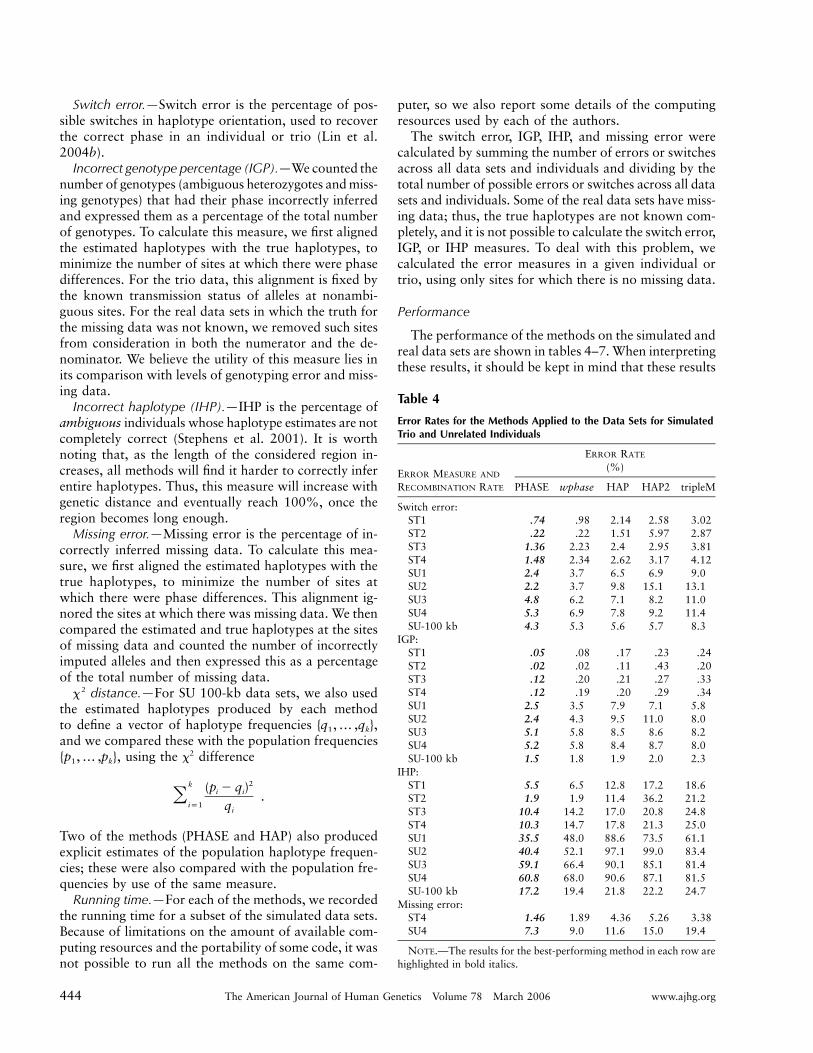
Table 4
Error Rates for the Methods Applied to the Data Sets for SimulatedTrio and Unrelated Individuals
ERROR MEASURE AND
RECOMBINATION RATE
ERROR RATE
(%)
PHASE wphase HAP HAP2 tripleM
Switch error:ST1 .74 .98 2.14 2.58 3.02ST2 .22 .22 1.51 5.97 2.87ST3 1.36 2.23 2.4 2.95 3.81ST4 1.48 2.34 2.62 3.17 4.12SU1 2.4 3.7 6.5 6.9 9.0SU2 2.2 3.7 9.8 15.1 13.1SU3 4.8 6.2 7.1 8.2 11.0SU4 5.3 6.9 7.8 9.2 11.4SU-100 kb 4.3 5.3 5.6 5.7 8.3
IGP:ST1 .05 .08 .17 .23 .24ST2 .02 .02 .11 .43 .20ST3 .12 .20 .21 .27 .33ST4 .12 .19 .20 .29 .34SU1 2.5 3.5 7.9 7.1 5.8SU2 2.4 4.3 9.5 11.0 8.0SU3 5.1 5.8 8.5 8.6 8.2SU4 5.2 5.8 8.4 8.7 8.0SU-100 kb 1.5 1.8 1.9 2.0 2.3
IHP:ST1 5.5 6.5 12.8 17.2 18.6ST2 1.9 1.9 11.4 36.2 21.2ST3 10.4 14.2 17.0 20.8 24.8ST4 10.3 14.7 17.8 21.3 25.0SU1 35.5 48.0 88.6 73.5 61.1SU2 40.4 52.1 97.1 99.0 83.4SU3 59.1 66.4 90.1 85.1 81.4SU4 60.8 68.0 90.6 87.1 81.5SU-100 kb 17.2 19.4 21.8 22.2 24.7
Missing error:ST4 1.46 1.89 4.36 5.26 3.38SU4 7.3 9.0 11.6 15.0 19.4
NOTE.—The results for the best-performing method in each row arehighlighted in bold italics.
Switch error.—Switch error is the percentage of pos-sible switches in haplotype orientation, used to recoverthe correct phase in an individual or trio (Lin et al.2004b).
Incorrect genotype percentage (IGP).—We counted thenumber of genotypes (ambiguous heterozygotes and miss-ing genotypes) that had their phase incorrectly inferredand expressed them as a percentage of the total numberof genotypes. To calculate this measure, we first alignedthe estimated haplotypes with the true haplotypes, tominimize the number of sites at which there were phasedifferences. For the trio data, this alignment is fixed bythe known transmission status of alleles at nonambi-guous sites. For the real data sets in which the truth forthe missing data was not known, we removed such sitesfrom consideration in both the numerator and the de-nominator. We believe the utility of this measure lies inits comparison with levels of genotyping error and miss-ing data.
Incorrect haplotype (IHP).—IHP is the percentage ofambiguous individuals whose haplotype estimates are notcompletely correct (Stephens et al. 2001). It is worthnoting that, as the length of the considered region in-creases, all methods will find it harder to correctly inferentire haplotypes. Thus, this measure will increase withgenetic distance and eventually reach 100%, once theregion becomes long enough.
Missing error.—Missing error is the percentage of in-correctly inferred missing data. To calculate this mea-sure, we first aligned the estimated haplotypes with thetrue haplotypes, to minimize the number of sites atwhich there were phase differences. This alignment ig-nored the sites at which there was missing data. We thencompared the estimated and true haplotypes at the sitesof missing data and counted the number of incorrectlyimputed alleles and then expressed this as a percentageof the total number of missing data.
distance.—For SU 100-kb data sets, we also used2x
the estimated haplotypes produced by each methodto define a vector of haplotype frequencies ,{q , … ,q }1 k
and we compared these with the population frequencies, using the x2 difference{p , … ,p }1 k
2k (p � q )i i .�ip1 qi
Two of the methods (PHASE and HAP) also producedexplicit estimates of the population haplotype frequen-cies; these were also compared with the population fre-quencies by use of the same measure.
Running time.—For each of the methods, we recordedthe running time for a subset of the simulated data sets.Because of limitations on the amount of available com-puting resources and the portability of some code, it wasnot possible to run all the methods on the same com-
puter, so we also report some details of the computingresources used by each of the authors.
The switch error, IGP, IHP, and missing error werecalculated by summing the number of errors or switchesacross all data sets and individuals and dividing by thetotal number of possible errors or switches across all datasets and individuals. Some of the real data sets have miss-ing data; thus, the true haplotypes are not known com-pletely, and it is not possible to calculate the switch error,IGP, or IHP measures. To deal with this problem, wecalculated the error measures in a given individual ortrio, using only sites for which there is no missing data.
Performance
The performance of the methods on the simulated andreal data sets are shown in tables 4–7. When interpretingthese results, it should be kept in mind that these results
www.ajhg.org Marchini et al.: Comparison of Phasing Algorithms 445
are specific to the density of SNPs and sample size ofthe data sets used. Several clear patterns are evident inthese tables.
Overall, the performance of all the data sets is verygood. For the best method, we observed percentagesof genotypes that had their phase incorrectly inferred:0.12% for trios and 5.2% for unrelated individuals onsimulated data sets, 0.05% and 5.9% on HapMap CEPHtrios and unrelated individuals, respectively, and 0.16%on HapMap Yoruban trios (table 4). These results clearlyshow the difference in error rates between the use of trioand unrelated samples (compare ST and SU data sets intable 4). The error rates for the trio data sets are com-parable to expected levels of genotyping error and miss-ing data and highlight the level of accuracy that the best-phasing algorithms can provide on a useful scale.
For the trio data sets, the PHASE algorithm consis-tently provided the best performance (compare methodsfor ST data sets of table 4). Of the other methods, thewphase algorithm is the next best and is followed byHAP, HAP2, and tripleM, in that order. The only excep-tion is that tripleM sometimes has a better performancethan HAP2 (i.e., for ST2 data set, regardless of errormeasure).
For the data sets of unrelated individuals, the PHASEalgorithm consistently provided the best performance,followed by wphase (compare methods for SU data setsof table 4). Of the other methods, PL-EM seems to per-form better than both HAP and HAP2 in terms of IGPand IHP but less well in terms of switch error. This sug-gests that the haplotypes that PL-EM infers incorrectlyrequire a relatively large number of switches to be madecorrect.
As expected, the performance is better for trio datasets than for unrelated individuals. Another useful sum-mary of the performance of the algorithms that high-lights the differences between the use of trio and unre-lated data is the rate of switch errors per unit of physicaldistance. For the real-data-set comparisons shown in ta-ble 6, the results of the PHASE algorithm correspond toan average of one (trio) switch error every 8 Mb andevery 3.6 Mb for the RT-CEU and RT-YRI data sets,respectively. For the RU data sets, we observed an av-erage of one switch error every 333 kb of sequence. Asmentioned above, these figures are relevant only to theSNP density and sample size of the data sets analyzed.
The performance of PHASE is improved in the sce-narios in which recombination occurs in hotspots (ST2and SU2 in table 4), compared with the scenarios thathave constant recombination rates (ST1 and SU1 in table4). This pattern does not hold, in general, for the othermethods.
The error rates for simulated data depend on the de-mographic models assumed, because there is a differencein performance of the data sets simulated using a model
of demography that is based on real data (ST3 and SU3in table 4) and those simulated using a model that as-sumes constant population size and random mating (ST2and SU2 in table 4).
The error rates for the data simulated with “CEU-like” demography are higher than real CEU data sets(compare ST4 and SU4 data sets in table 4 with RT-CEU and RU-CEU in table 6). It is difficult to specifythe exact reason for this, but potential explanations in-clude differences in the amount and pattern of missingdata, differences in the levels of recombination, and dif-ferences in the real and simulated demographic events.
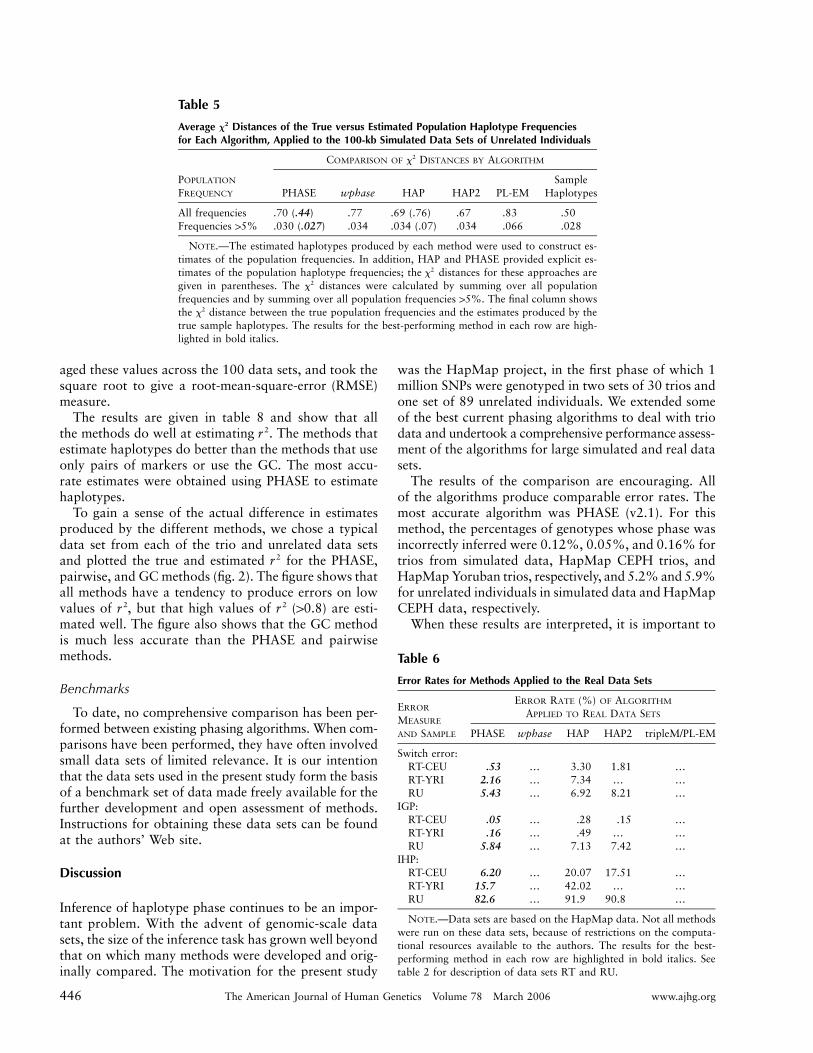
There is a large variation in the running times of thedifferent methods (see table 7). For the simulated triodata sets, the fastest algorithm was tripleM, at 1.5 s.The algorithms HAP2, HAP, wphase, and PHASE took12, 15, 4,480, and 8,840 times as long, respectively. Forsimulated unrelated data sets, HAP was the fastest algo-rithm, at 35.1 s. The algorithms HAP2, PL-EM, PHASE,and wphase took 3.6, 7.5, 1,114, and 12,205 times aslong, respectively. Even so, PHASE was successfully ap-plied to infer haplotypes from phase I of the HapMapproject (1 million SNPs genotyped in two sets of 30 triosand a set of 89 unrelated individuals [InternationalHapMap Consortium 2005]). (See J.M.’s Web site foronline material with details of the haplotype estimationfor phase I of the HapMap project.)
Estimation of r2
In a given study, it is often of interest to consider thepattern of (pairwise) LD across a region for which ge-notype data has been collected. Estimates of LD are use-ful for visualization of the LD structure in a region orfor purposes of defining a set of tagging SNPs for usein association studies (Johnson et al. 2001; Carlson etal. 2004). A commonly used measure is the squared cor-relation coefficient within haplotypes; it cannot be2(r )calculated directly from genotype data. We evaluated thefollowing methods of estimating between a pair of2rSNPs within a given region.
1. First, estimate haplotypes with the algorithms con-sidered in the present study (PHASE, wphase, HAP,HAP2, and tripleM/PL-EM) and then estimate 2rbetween each pair of SNPs, as if these were the truehaplotypes.
2. Use genotypes for pairs of markers to estimate 2rwith the EM algorithm (pairwise) (Weir 1996).
3. Use the genotype correlation (GC).
We applied these methods to the simulated trio andunrelated data sets with (ST4 and SU4) and without(ST3 and SU3) missing data. For each of the 100 regionswithin each of these data sets, we first calculated themean squared error of the true and estimated , aver-2r
446 The American Journal of Human Genetics Volume 78 March 2006 www.ajhg.org
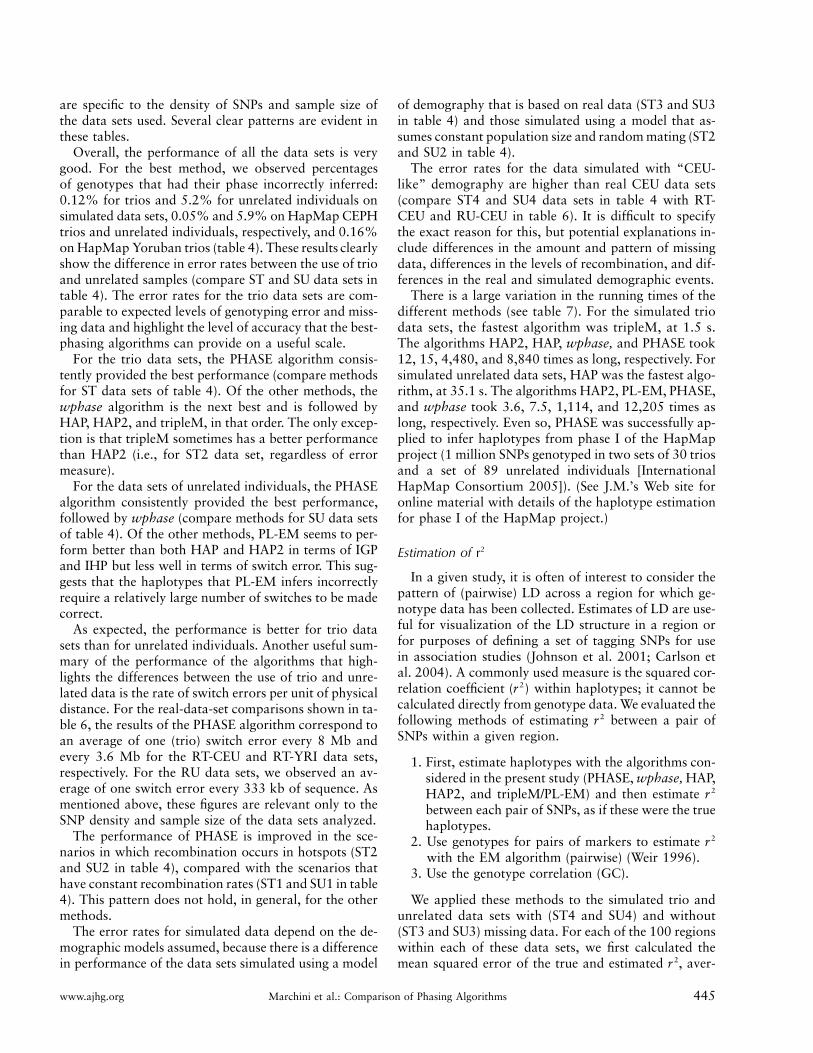
Table 5
Average Distances of the True versus Estimated Population Haplotype Frequencies2x
for Each Algorithm, Applied to the 100-kb Simulated Data Sets of Unrelated Individuals
POPULATION
FREQUENCY
COMPARISON OF DISTANCES BY ALGORITHM2x
PHASE wphase HAP HAP2 PL-EMSample
Haplotypes
All frequencies .70 (.44) .77 .69 (.76) .67 .83 .50Frequencies 15% .030 (.027) .034 .034 (.07) .034 .066 .028
NOTE.—The estimated haplotypes produced by each method were used to construct es-timates of the population frequencies. In addition, HAP and PHASE provided explicit es-timates of the population haplotype frequencies; the distances for these approaches are2x
given in parentheses. The distances were calculated by summing over all population2x
frequencies and by summing over all population frequencies 15%. The final column showsthe distance between the true population frequencies and the estimates produced by the2x
true sample haplotypes. The results for the best-performing method in each row are high-lighted in bold italics.
Table 6
Error Rates for Methods Applied to the Real Data Sets
ERROR
MEASURE
AND SAMPLE
ERROR RATE (%) OF ALGORITHM
APPLIED TO REAL DATA SETS
PHASE wphase HAP HAP2 tripleM/PL-EM
Switch error:RT-CEU .53 … 3.30 1.81 …RT-YRI 2.16 … 7.34 … …RU 5.43 … 6.92 8.21 …
IGP:RT-CEU .05 … .28 .15 …RT-YRI .16 … .49 … …RU 5.84 … 7.13 7.42 …
IHP:RT-CEU 6.20 … 20.07 17.51 …RT-YRI 15.7 … 42.02 … …RU 82.6 … 91.9 90.8 …
NOTE.—Data sets are based on the HapMap data. Not all methodswere run on these data sets, because of restrictions on the computa-tional resources available to the authors. The results for the best-performing method in each row are highlighted in bold italics. Seetable 2 for description of data sets RT and RU.
aged these values across the 100 data sets, and took thesquare root to give a root-mean-square-error (RMSE)measure.
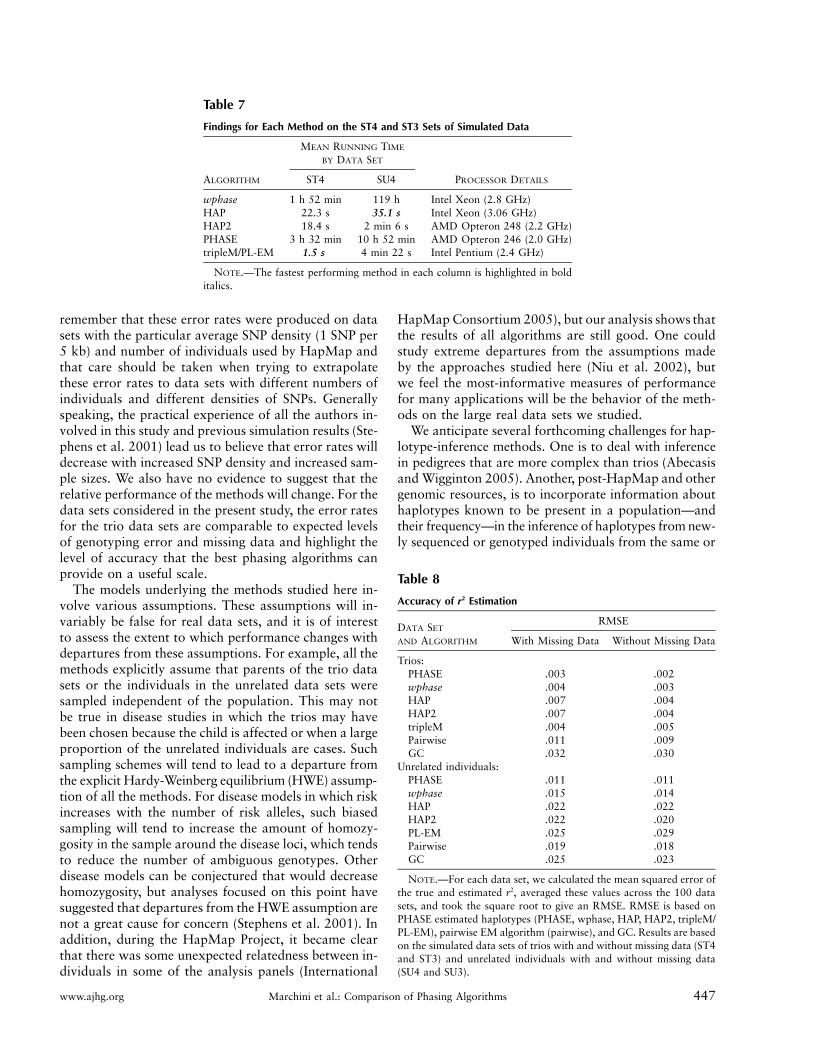
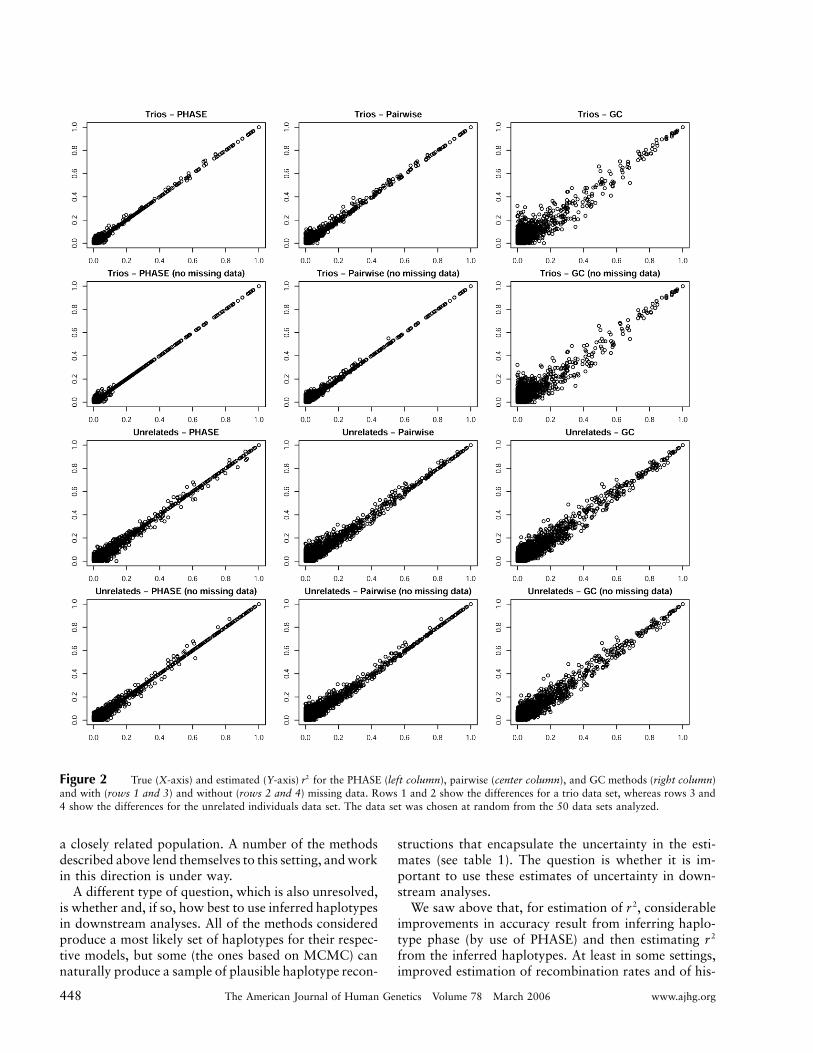
The results are given in table 8 and show that allthe methods do well at estimating . The methods that2restimate haplotypes do better than the methods that useonly pairs of markers or use the GC. The most accu-rate estimates were obtained using PHASE to estimatehaplotypes.
To gain a sense of the actual difference in estimatesproduced by the different methods, we chose a typicaldata set from each of the trio and unrelated data setsand plotted the true and estimated for the PHASE,2rpairwise, and GC methods (fig. 2). The figure shows thatall methods have a tendency to produce errors on lowvalues of , but that high values of (10.8) are esti-2 2r rmated well. The figure also shows that the GC methodis much less accurate than the PHASE and pairwisemethods.
Benchmarks
To date, no comprehensive comparison has been per-formed between existing phasing algorithms. When com-parisons have been performed, they have often involvedsmall data sets of limited relevance. It is our intentionthat the data sets used in the present study form the basisof a benchmark set of data made freely available for thefurther development and open assessment of methods.Instructions for obtaining these data sets can be foundat the authors’ Web site.
Discussion
Inference of haplotype phase continues to be an impor-tant problem. With the advent of genomic-scale datasets, the size of the inference task has grown well beyondthat on which many methods were developed and orig-inally compared. The motivation for the present study
was the HapMap project, in the first phase of which 1million SNPs were genotyped in two sets of 30 trios andone set of 89 unrelated individuals. We extended someof the best current phasing algorithms to deal with triodata and undertook a comprehensive performance assess-ment of the algorithms for large simulated and real datasets.
The results of the comparison are encouraging. Allof the algorithms produce comparable error rates. Themost accurate algorithm was PHASE (v2.1). For thismethod, the percentages of genotypes whose phase wasincorrectly inferred were 0.12%, 0.05%, and 0.16% fortrios from simulated data, HapMap CEPH trios, andHapMap Yoruban trios, respectively, and 5.2% and 5.9%for unrelated individuals in simulated data and HapMapCEPH data, respectively.
When these results are interpreted, it is important to
www.ajhg.org Marchini et al.: Comparison of Phasing Algorithms 447
Table 7
Findings for Each Method on the ST4 and ST3 Sets of Simulated Data
ALGORITHM
MEAN RUNNING TIME
BY DATA SET
PROCESSOR DETAILSST4 SU4
wphase 1 h 52 min 119 h Intel Xeon (2.8 GHz)HAP 22.3 s 35.1 s Intel Xeon (3.06 GHz)HAP2 18.4 s 2 min 6 s AMD Opteron 248 (2.2 GHz)PHASE 3 h 32 min 10 h 52 min AMD Opteron 246 (2.0 GHz)tripleM/PL-EM 1.5 s 4 min 22 s Intel Pentium (2.4 GHz)
NOTE.—The fastest performing method in each column is highlighted in bolditalics.
Table 8
Accuracy of Estimation2r
DATA SET
AND ALGORITHM
RMSE
With Missing Data Without Missing Data
Trios:PHASE .003 .002wphase .004 .003HAP .007 .004HAP2 .007 .004tripleM .004 .005Pairwise .011 .009GC .032 .030
Unrelated individuals:PHASE .011 .011wphase .015 .014HAP .022 .022HAP2 .022 .020PL-EM .025 .029Pairwise .019 .018GC .025 .023
NOTE.—For each data set, we calculated the mean squared error ofthe true and estimated , averaged these values across the 100 data2rsets, and took the square root to give an RMSE. RMSE is based onPHASE estimated haplotypes (PHASE, wphase, HAP, HAP2, tripleM/PL-EM), pairwise EM algorithm (pairwise), and GC. Results are basedon the simulated data sets of trios with and without missing data (ST4and ST3) and unrelated individuals with and without missing data(SU4 and SU3).
remember that these error rates were produced on datasets with the particular average SNP density (1 SNP per5 kb) and number of individuals used by HapMap andthat care should be taken when trying to extrapolatethese error rates to data sets with different numbers ofindividuals and different densities of SNPs. Generallyspeaking, the practical experience of all the authors in-volved in this study and previous simulation results (Ste-phens et al. 2001) lead us to believe that error rates willdecrease with increased SNP density and increased sam-ple sizes. We also have no evidence to suggest that therelative performance of the methods will change. For thedata sets considered in the present study, the error ratesfor the trio data sets are comparable to expected levelsof genotyping error and missing data and highlight thelevel of accuracy that the best phasing algorithms canprovide on a useful scale.
The models underlying the methods studied here in-volve various assumptions. These assumptions will in-variably be false for real data sets, and it is of interestto assess the extent to which performance changes withdepartures from these assumptions. For example, all themethods explicitly assume that parents of the trio datasets or the individuals in the unrelated data sets weresampled independent of the population. This may notbe true in disease studies in which the trios may havebeen chosen because the child is affected or when a largeproportion of the unrelated individuals are cases. Suchsampling schemes will tend to lead to a departure fromthe explicit Hardy-Weinberg equilibrium (HWE) assump-tion of all the methods. For disease models in which riskincreases with the number of risk alleles, such biasedsampling will tend to increase the amount of homozy-gosity in the sample around the disease loci, which tendsto reduce the number of ambiguous genotypes. Otherdisease models can be conjectured that would decreasehomozygosity, but analyses focused on this point havesuggested that departures from the HWE assumption arenot a great cause for concern (Stephens et al. 2001). Inaddition, during the HapMap Project, it became clearthat there was some unexpected relatedness between in-dividuals in some of the analysis panels (International
HapMap Consortium 2005), but our analysis shows thatthe results of all algorithms are still good. One couldstudy extreme departures from the assumptions madeby the approaches studied here (Niu et al. 2002), butwe feel the most-informative measures of performancefor many applications will be the behavior of the meth-ods on the large real data sets we studied.
We anticipate several forthcoming challenges for hap-lotype-inference methods. One is to deal with inferencein pedigrees that are more complex than trios (Abecasisand Wigginton 2005). Another, post-HapMap and othergenomic resources, is to incorporate information abouthaplotypes known to be present in a population—andtheir frequency—in the inference of haplotypes from new-ly sequenced or genotyped individuals from the same or
448 The American Journal of Human Genetics Volume 78 March 2006 www.ajhg.org
Figure 2 True (X-axis) and estimated (Y-axis) for the PHASE (left column), pairwise (center column), and GC methods (right column)2rand with (rows 1 and 3) and without (rows 2 and 4) missing data. Rows 1 and 2 show the differences for a trio data set, whereas rows 3 and4 show the differences for the unrelated individuals data set. The data set was chosen at random from the 50 data sets analyzed.
a closely related population. A number of the methodsdescribed above lend themselves to this setting, and workin this direction is under way.
A different type of question, which is also unresolved,is whether and, if so, how best to use inferred haplotypesin downstream analyses. All of the methods consideredproduce a most likely set of haplotypes for their respec-tive models, but some (the ones based on MCMC) cannaturally produce a sample of plausible haplotype recon-
structions that encapsulate the uncertainty in the esti-mates (see table 1). The question is whether it is im-portant to use these estimates of uncertainty in down-stream analyses.
We saw above that, for estimation of , considerable2rimprovements in accuracy result from inferring haplo-type phase (by use of PHASE) and then estimating 2rfrom the inferred haplotypes. At least in some settings,improved estimation of recombination rates and of his-
www.ajhg.org Marchini et al.: Comparison of Phasing Algorithms 449
torical recombination events can also result from firstestimating haplotypes and then treating these as known(International HapMap Consortium 2005). We did notlook at estimating by integrating out over the uncer-2rtainty in the haplotypes, and this might perform evenbetter than the two-stage procedure we did use.
In contrast, several studies have suggested that simply“plugging in” haplotype estimates to analysis methodscan be suboptimal—namely, the studies of Morris et al.(2004) in the context of fine mapping and Kraft et al.(2005) for estimation of haplotype relative risks. Bothstudies used maximum likelihood for phase estimation.We saw above that this is one of the worst-performingmethods considered here, effectively because this methoddoes not give more weight to solutions in which hap-lotypes cluster together. In addition, both studies con-sidered situations—20 SNPs in 1 Mb for 100 cases/con-trols in the work of Morris et al. (2004) and 4 SNPs for200 cases/controls in that of Kraft et al. (2005)—inwhich there remained considerable uncertainty over es-timated haplotypes. The density of SNPs in future studieswill vary—depending on available resources, the geno-typing platform used to assay the data, and the way inwhich the assayed SNPs have been chosen—and willlikely lie somewhere between the density of the HapMapsamples and the sparse simulated data sets consideredby Morris et al. (2004) and Kraft et al. (2005). Knowl-edge of the haplotypes from the HapMap project shouldallow us to make much more accurate estimates of hap-lotypes, whatever the density of the markers in the futureprojects. Thus, uncertainty in haplotypes will be muchless than it would have been if the HapMap data werenot available. We suggest that the jury remains out onthis question, pending studies that use the best phase-estimation methods on realistic-sized data sets and stud-ies that take the HapMap data into account, for whichaccurate phase estimation is more likely.
In the specific context of disease-association studies,there remains an open question about how best to com-bine information across markers. Doing so could butneed not necessarily use haplotype information. Chap-man et al. (2003) have shown that, in a particular frame-work, the cost, in terms of additional parameters, ofincluding haplotypes in the analysis, rather than simplyusing multilocus genotypes, outweighs the benefits fordetecting a disease variant. In contrast, Lin et al. (2004a)show that haplotype information has an important rolein detecting rare variants. Different issues arise in lo-calization, and Zollner and Pritchard (2005) have shownthat haplotypes can be valuable in this context.
Acknowledgments
We are grateful to Steve Schaffner for help and advice in usinga sophisticated coalescent-based simulator, which allowed usto generate haplotype data with complex demographics. J.M.
was supported by the Wellcome Trust. P.D. was supported bythe Wellcome Trust, the National Institutes of Health (NIH),The SNP Consortium, the Wolfson Foundation, the NuffieldTrust, and the Engineering and Physical Sciences ResearchCouncil. M.S. is supported by NIH grant 1RO1HG/LM02585-01. N.P. is a recipient of a K-01 NIH career-transition award.G.R.A. is supported by NIH National Human Genome Re-search Institute grant HG02651. E.E. is supported by the Cal-ifornia Institute for Telecommunications and Information Tech-nology, Calit2. Computational resources for HAP were pro-vided by Calit2 and National Biomedical Computational Re-source grant P41 RR08605 (National Center for ResearchResources, NIH).
Web ResourcesThe URLs for data presented herein are as follows:
Authors’ Web site, http://www.stats.ox.ac.uk/˜marchini/phaseoff.htmlClayton Web site, http://www-gene.cimr.cam.ac.uk/clayton/software/
(for the SNPHAP algorithm)HAP, http://research.calit2.net/hap/International HapMap Project, http://www.hapmap.org/J.M.’s Web site, http://www.stats.ox.ac.uk/˜marchini/HapMap
.Phasing.pdf (for details of how haplotypes were inferred for thePHASE v.1 HapMap)
PHASE, http://www.stat.washington.edu/stephens/software.htmlPL-EM, http://www.people.fas.harvard.edu/˜junliu/plem/click.htmltripleM, http://www.sph.umich.edu/csg/qin/tripleM/
ReferencesAbecasis GR, Wigginton JE (2005) Handling marker-marker linkage
disequilibrium: pedigree analysis with clustered markers. Am J HumGenet 77:754–767
Akey J, Jin L, Xiong M (2001) Haplotypes vs single marker linkagedisequilibrium tests: what do we gain? Eur J Hum Genet 9:291–300
Beerli P, Felsenstein J (2001) Maximum likelihood estimation of amigration matrix and effective population sizes in n subpopulationsby using a coalescent approach. Proc Natl Acad Sci USA 98:4563–4568
Carlson C, Eberle MA, Rieder MJ, Yi Q, Kruglyak L, Nickerson DA(2004) Selecting a maximally informative set of single-nucleotidepolymorphisms for association analyses using linkage disequilibrium.Am J Hum Genet 74:106–120
Chapman JM, Cooper JD, Todd JA, Clayton DG (2003) Detectingdisease associations due to linkage disequilibrium using haplotypetags: a class of tests and the determinants of statistical power. HumHered 56:18–31
Chiano M, Clayton D (1998) Fine genetic mapping using haplotypeanalysis and the missing data problem. Ann Hum Genet 62:55–60
Clark AG (1990) Inference of haplotypes from PCR-amplified samplesof diploid populations. Mol Biol Evol 7:111–122
De Iorio M, Griffiths R (2004) Importance sampling on coalescenthistories. II. Subdivided population models. Adv Appl Probab 36:434–454
Dempster A, Laird N, Rubin D (1977) Maximum likelihood fromincomplete data via EM algorithm. J R Stat Soc B 39:1–38
Eskin E, Halperin E, Karp R (2003) Efficient reconstruction of haplo-type structure via perfect phylogeny. J Bioinform Comput Biol 1:1–20
Excoffier L, Slakin M (1995) Maximum likelihood estimation of mo-lecular haplotype frequencies in a diploid population. Mol Biol Evol12:921–927
Fallin D, Schork NJ (2000) Accuracy of haplotype frequency estima-
450 The American Journal of Human Genetics Volume 78 March 2006 www.ajhg.org
tion for biallelic loci, via the expectation-maximization algorithmfor unphased diploid genotype data. Am J Hum Genet 67:947–959
Fearnhead P, Donnelly P (2001) Estimating recombination rates frompopulation genetic data. Genetics 159:1299–1318
Gusfield D (2000) A practical algorithm for optimal inference of hap-lotypes from diploid populations. Proc Int Conf Intell Syst Mol Biol8:183–189
——— (2001) Inference of haplotypes from samples of diploid pop-ulations: complexity and algorithms. J Comput Biol 8:305–323
——— (2003) Haplotyping as perfect phylogeny: conceptual frame-work and efficient solutions. Paper presented at the Proceedings ofthe 6th Annual International Conference on Computational Biology,Washington, DC
Halperin E, Eskin E (2004) Haplotype reconstruction from genotypedata using imperfect phylogeny. Bioinformatics 20:1842–1849
Hawley M, Kidd K (1995) HAPLO: a program using the EM algorithmto estimate the frequencies of multi-site haplotypes. J Hered 86:409–411
Hinds DA, Stuve LL, Nilsen GB, Halperin E, Eskin E, Ballinger DG,Frazer KA, Cox DR (2005) Whole-genome patterns of common DNAvariation in three human populations. Science 307:1072–1079
Hoppe F (1987) The sampling theory of neutral alleles and an urnmodel in population genetics. J Math Biol 25:123–159
Hugot JP, Chamaillard M, Zouali H, Lesage S, Cezard JP, Belaiche J,Almer S, Tysk C, O’Morain CA, Gassull M, Binder V, Finkel Y,Cortot A, Modigliani R, Laurent-Puig P, Gower-Rousseau C, MacryJ, Colombel JF, Sahbatou M, Thomas G. (2001) Association of NOD2leucine-rich repeat variants with susceptibility to Crohn’s diseaseNature 411:599–603
International HapMap Consortium (2005) A haplotype map of thehuman genome. Nature 437:1299–1320
Johnson GC, Esposito L, Barratt BJ, Smith AN, Heward J, Di GenovaG, Ueda H, Cordell HJ, Eaves IA, Dudbridge F, Twells RC, PayneF, Hughes W, Nutland S, Stevens H, Carr P, Tuomilehto-Wolf E,Tuomilehto J, Gough SC, Clayton DG, Todd JA (2001) Haplotypetagging for the identification of common disease genes. Nat Genet29:233–237
Kraft P, Cox D, Paynter R, Hunter D, De Vivo I (2005) Accountingfor haplotype uncertainty in matched association studies: a com-parison of simple and flexible techniques. Genet Epidemiol 28:261–272
Lazzeroni L (2001) A chronology of fine-scale gene mapping by linkagedisequilibrium. Stat Methods Med Res 10:57–76
Lewontin R (1988) On measures of gametic disequilibrium. Genetics120:849–852
Li N, Stephens M (2003) Modeling linkage disequilibrium and iden-tifying recombination hotspots using single-nucleotide polymorphismdata. Genetics 165:2213–2233
Lin S, Chakravarti A, Cutler D (2004a) Exhaustive allelic transmissiondisequilibrium tests as a new approach to genome-wide associationstudies. Nat Genet 36:1181–1188
——— (2004b) Haplotype and missing data inference in nuclear fam-ilies. Genome Res 14:1624–1632
Lin S, Cutler DJ, Zwick ME, Chakravarti A (2002) Haplotype infer-ence in random population samples. Am J Hum Genet 71:1129–1137
Long J, Williams R, Urbanek M (1995) An E-M algorithm and testingstrategy for multiple-locus haplotypes. Am J Hum Genet 56:799–810
MacLean C, Morton N (1985) Estimation of myriad haplotype fre-quencies. Genet Epidemiol 2:263–272
McVean G, Myers S, Hunt S, Deloukas P, Bentley D, Donnelly P (2004)The fine-scale structure of recombination rate variation in the humangenome. Science 304:581–584
Morris AP, Whittaker JC, Balding DJ (2004) Little loss of informationdue to unknown phase for fine-scale linkage-disequilibriummappingwith single-nucleotide–polymorphism genotype data. Am J Hum Ge-net 74:945–953
Myers S, Bottolo L, Freeman C, McVean G, Donnelly P (2005) A fine-scale map of recombination rates and hotspots across the humangenome. Science 310:321–324
Myers S, Griffiths R (2003) Bounds on the minimum number of re-combination events in a sample history. Genetics 163:375–394
Niu T, Qin ZS, Xu X, Liu JS (2002) Bayesian haplotype inference formultiple linked single-nucleotide polymorphisms. Am J Hum Genet70:157–169
Puffenberger E, Kauffman E, Bolk S, Matise T, Washington S, AngristM, Weissenbach J, Garver KL, Mascari M, Ladda R, SlaugenhauptSA, Chakravarti A (1994) Identity-by-descent and association map-ping of a recessive gene for Hirschsprung disease on human chromo-some 13q22. Hum Mol Genet 3:1217–1225
Qin ZS, Niu T, Liu JS (2002) Partition-ligation–expectation-maxi-mization algorithm for haplotype inference with single-nucleotidepolymorphisms. Am J Hum Genet 71:1242 1247
Rioux J, Daly M, Silverberg M, Lindblad K, Steinhart H, Cohen Z,Delmonte T, et al (2001) Genetic variation in the 5q31 cytokinegene cluster confers susceptibility to Crohn disease. Nat Genet 29:223–228
Sabeti PC, Reich DE, Higgins JM, Levine HZ, Richter DJ, SchaffnerSF, Gabriel SB, Platko JV, Patterson NJ, McDonald GJ, AckermanHC, Campbell SJ, Altshuler D, Cooper R, Kwiatkowski D, WardR, Lander ES (2002) Detecting recent positive selection in the humangenome from haplotype structure. Nature 419:832–837
Salem M, Wessel J, Schork J (2005) A comprehensive literature reviewof haplotyping software and methods for use with unrelated indi-viduals. Hum Genomics 2:39–66
Schaffner SF, Foo C, Gabriel S, Reich D, Daly MJ, Altshuler D (2005)Calibrating a coalescent simulation of human genome sequence var-iation. Genome Res 15:1576–1583
Stephens M, Donnelly P (2003) A comparison of Bayesian methodsfor haplotype reconstruction from population genotype data. Am JHum Genet 73:1162–1169
Stephens M, Scheet P (2005) Accounting for decay of linkage dis-equilibrium in haplotype inference and missing-data imputation. AmJ Hum Genet 76:449–462
Stephens M, Smith NJ, Donnelly P (2001) A new statistical methodfor haplotype reconstruction from population data. Am J Hum Ge-net 68:978–989
Weir BS (1996) Genetic data analysis II: methods for discrete popula-tion genetic data. Sinauer Associates, Sunderland, MA
Zhang K, Sun F, Zhao H (2005) HAPLORE: a program for haplotypereconstruction in general pedigrees without recombination. Bioin-formatics 21:90–103
Zollner S, Pritchard JK (2005) Coalescent-based association mappingand fine mapping of complex trait loci. Genetics 169:1071–1092