Embed Size (px)
Citation preview

JOURNALOFNEARINFRAREDSPECTROSCOPY
1
ISSN: 0967-0335 © IM Publications LLP 2009
doi: 10.1255/jnirs.xxx All rights reserved
A comparison of near infrared method development approaches using a drug product on different spectrophotometers and chemometric software algorithms
Assad Kazeminy,a Saeed Hashemi,a Roger L. Williams,b Gary E. Ritchie,c Ronald Rubinovitzd and Sumit Sene,*
aIrvine Pharmaceutical Services, Inc., 10 Vanderbilt, Irvine, CA 92618, USA
bUnited States Pharmacopeial Convention, 12601 Twinbrook Parkway, Rockville, Maryland 20852, USA
cFormer United States Pharmacopeial Convention, 12601 Twinbrook Parkway, Rockville, Maryland 20852, USA
dBüchi Corporation, 19 Lukens Drive, New Castle, DE 19720, USA
eUnited States Food and Drug Administration, 19701 Fairchild, Irvine, CA 92612, USA. E-mail: [email protected]
It is well known that spectral variability in near infrared (NIR) spectroscopy can be attributed to the analyst, sample, sample positioning,
instrument confi guration and software (in both algorithm formats and structures used as well as in the execution of data pre-treatment
and analysis). It is often acknowledged that the single largest factor impacting NIR results is sample presentation. However, what is
obvious but not often acknowledged is that there are instrumental and software differences as well. These differences, evident in the
quality of the spectra, may impact the chemometrics that are subsequently performed and, possibly, the results obtained from the
multivariate statistical models. In order to investigate just what are these sources of variability, and just how much these variations
may impact the results of the multivariate models for predicting the identifi cation of pharmaceutical dosage forms, a study has been
conducted. To the authors’ knowledge, no other systematic study of this kind has been published. In this study, we are interested in
learning what variability, if any, the choices for instrument and software have on the development of a NIR method for the identifi cation
of pharmaceutical dosage forms. Furthermore, we would like to learn what and how do the choices made early on in the experimental
design impact the fi nal quality of the spectra and the resulting multivariate models obtained from these spectra. A study protocol was
designed, using a common data set consisting of four formulations of Ibuprofen, involving three investigating parties, namely, US FDA,
USP and Irvine Pharmaceutical Services and using three NIR instruments, namely (listed in alphabetical order), a Bruker spectrometer,
a Büchi spectrometer and a Foss spectrometer. Based on the results and despite differences in instrument confi guration [dispersive or
Fourier Transform (FT)], number of spectral data points, principal components analysis (PCA) or factorisation algorithms, and valida-
tion modelling approach, exact and accurate spectroscopic results can be achieved using NIR spectroscopy for discriminate analysis.
More importantly, this study shows that the same NIR method spectral range and pre-treatment parameters can be used, and that
nearly the same multivariate models can be obtained, despite instrumental and software differences, to accurately predict the identity
of pharmaceutical dosage forms.
Keywords: near infrared (NIR) spectroscopy, instrument variability, chemometric software algorithms, multivariate discriminant analysis, PCA
A. Kazeminy et al., J. Near Infrared Spectrosc. 17, xxx–xxx (2009)
Received: 9 June 2009 ■ Revised: 30 September 2009 ■ Accepted: 11 October 2009 ■ Publication: 2009

2 An NIR Comparison of Method Development Approaches Using A Drug Product
It has been successfully demonstrated that near infrared
(NIR) spectroscopy can be used for the analysis of pharma-
ceutical products using a single instrument and software
confi guration.1–6 The focus of this study was to determine
if the variability observed across different NIR instruments
and chemometric software packages can be an impediment
for the deployment of this technique if different instrument
and software types are to be used for the development of NIR
models.
The United States Food and Drug Administration (US
FDA), the United States Pharmacopeia (USP) and Irvine
Pharmaceutical Services, have undertaken a feasibility
study using NIR spectroscopy to identify, by the chemometric
method of multivariate discriminate analysis using principal
component analysis (PCA) and factorisation, four formula-
tions of Ibuprofen (200 mg): two branded (Advil and Motrin)
and two store-branded (CVS and Rite Aid) Ibuprofen (200 mg)
immediate-release tablets, using three different instrument/
software combinations. The instruments used included
(listed in alphabetical order), a Bruker Vector 22N FT-NIR
spectrometer, Bruker Optik GmbH, Ettlingen, Germany, a
Büchi NIRFlex Solids, Flawil, Switzerland and a Foss XDS
Rapid Content Analyser, Laurel, USA. The software used from
each instrument, respectively, were OPUS 5.5, NIRCal 5.2 and
Vision 3.4. The Unscrambler 9.7, a stand-alone multivariate
analysis and experimental design software package, was
used as referee software to assist in developing a common
model. The Bruker Vector 22N FTNIR spectrometer and the
Foss XDS Rapid Content Analyser used for this study are
both located at the USP, and the Büchi NIRFlex Solids spec-
trometer was located at the Irvine Pharmaceutical Services.
A study protocol was designed, using a common data set
consisting of these four formulations of Ibuprofen, involving
the three investigating parties, using the above-mentioned
different NIR instrument/software combinations. To our
knowledge, this is the first study of its kind investigating
the variability of NIR instrument/software combinations and
their impact on chemometric models for discriminate drug
analysis.
There were four specifi c objectives of the study:
(1) Demonstrate that by the use of the computerised algo-
rithms of PCA and factorisation, three identical, or nearly
identical, spectral libraries can be obtained on three different
instruments. These spectral libraries will be comprised of
the same samples drawn from the same manufactured lots,
scanned the same way and modelled using the same software
settings.
(2) Compare four formulations of Ibuprofen: (200 mg)
two branded and two store-branded Ibuprofen (200 mg).
Immediate-release tablets will result in four distinct clusters
in multi-dimensional space.
(3) Demonstrate that the calibration models are able to analyse
unknown tablets (validation set) and determine if they are
ibuprofen (200 mg) immediate-release tablets from one of the
four known sources of origin that constitute the libraries or
are not from any of these known sources.
(4) The results from each analysis of unknown samples should
give the same predicted results, indifferent of the model used,
and despite instrument, spectra, algorithm, or number of cali-
bration samples, demonstrating that a protocol can be used in
each laboratory, independent of location, device, analyst and
software used to perform the identifi cation.
ExperimentalInstrumentation and software
The instruments that were used included a Bruker Vector 22N
FT-NIR spectrometer with a spectral range of 4000–12000 cm–1
and spectral resolution set at 8 cm–1 (Bruker Optik GmbH,
Ettlingen, Germany), Büchi NIRFlex Solids with a spectral
range 1000–2500 nm (10,000–4000 cm–1) and spectral resolu-
tion set at 8 cm–1 (Büchi, Flawil, Switzerland) and Foss XDS
Rapid Content Analyser with a spectral range of 400–2500 nm
(25,000–4000 cm–1) and a spectral resolution set by the speci-
fi ed bandpass of 9 nm (Foss NIRSystems, Inc., Laurel, MD, USA).
The software used for each instrument were, respectively, OPUS
5.5, NIRCal 5.2, and Vision 3.4. The Unscrambler 9.7, a stand-
alone multivariate analysis and experimental design software
package (CAMO Technologies Inc., Trondheim Norway), was
used as referee software to assist in developing a common
model.
Validation of instrument operation
Tests for wavelength accuracy, photometric precision, accu-
racy and noise were performed on all of the instruments prior
to tablet measurements as recommended by the USP general
information chapter <1119> Near-Infrared Spectroscopy
(http://www.usp.org/USPNF/revisions/usp31nf26secondSup-
plement01.html.7 (Graeme has asked me to reference this
as Reference 7 and renumber the remaining references. Is
this okay?) Vendor recommended performance tests for each
instrument were run as well. The tests are routine quality
control tests of the instrument performance and as such were
performed at the prescribed intervals to verify correct instru-
ment performance.
Sample sets
Table 1 lists the sources for the samples used for the study. Ten
lots of four formulations of Ibuprofen (200 mg) were obtained:
two branded (Advil, Motrin) and two store-branded (CVS, Rite
Aid) Ibuprofen (200 mg) immediate release tablets. The formu-
lations for each are shown in Table 2. Three sets of samples
were prepared for each instrument. These sets comprise the
calibration set, test set and validation set. For this study, manu-
facturer lots 1–8 were used for the calibration set and test set
and manufacturer lots 9 and 10 were set aside and used for the
validation sets. While one of the purposes of the protocol was
Introduction

A. Kazeminy et al., J. Near Infrared Spectrosc. 17, xxx–xxx (2009) 3
to control the preparation of the calibration, test, and validation
sample sets, it was found later that the calibration set prepared
for the Foss instrument was missing one tablet (see Table 6
footnote) and the validation set for the Foss instrument and
the Bruker instrument were different from the validation set
prepared for the Büchi instrument, containing only 28 tablets
from the Motrin validation set instead of 40 tablets originally
intended, all due to packaging errors. This error had no effect
on the outcome of the study (model prediction accuracy of vali-
dation samples) as will be shown later in this paper. The sample
sets were prepared as shown in Table 3.
Sample collection and analyses
The study protocol was modelled on that described by Scafi
and Pasquini.8 The multivariate chemometric approach to
calibrate, validate and maintain the spectral libraries was
based on work proposed by Workman and Brown.9,10 Log
1/R (sometimes referred to as Absorbance) spectra from the
Bruker and Foss instrument, and refl ectance spectra from
the Büchi instrument, were collected from each tablet for
the calibration and test sets by averaging 32 scans in diffuse
reflectance mode against a 99% reflectance background
reference. The spectra were collected across the following
ranges from each instrument: Bruker samples were
scanned from 11,999 cm–1 to 3999 cm–1 (833 nm to 2500 nm),
Büchi samples were scanned from 10,000 cm–1 to 4000 cm–1
(1000 nm to 2500 nm) and using the Foss instrument, each
tablet was scanned from 400 nm to 2500 nm, Photographs of
the tablets are shown in Figure 1. The Unscrambler 9.7 was
used to investigate the Foss calibration set spectral proper-
ties that could be used to distinguish each formulation. Tables
4 and 5 show the series of spectral pre-treatments that were
tested for use in order to achieve a PCA that could be used
to determine the identity of the samples from the validation
sets. The test sets were used to optimise the prediction of
the fi nal models before being used to predict the validation
sets. The Bruker software, OPUS 5.5, uses the factorisa-
tion method to model and so the calibration set from this
instrument, while subjected to PCA in The Unscrambler 9.7,
required a different approach when constructed in the OPUS
5.5 software. Table 6 lists the model values for the calibration
modelling approach.
Development of NIR
calibrations
Based on observations from the Unscrambler 9.7 exploration,
a Savitzky–Golay, fi rst derivative, 21 point smoothing, 3rd order
polynomial, from 1000 nm to 2500 nm and a PCA model, using
Mahalanobis distance in the wavelength range from 1400–
1500 nm, was postulated as the optimal model to apply to the
Bruker, Büchi and Foss calibration data sets. Figures 2(a), 2(b)
Lot Brand—Advil Brand—Motrin Generic—CVS Generic—Rite Aid
1 B946681 PCA189 6EE0102 P45032
2 × 200 = 400 tablets 3 × 100 = 300 tablets 2 × 250 = 500 tablets 1 × 500 = 500 tablets
2 B87154 LLA103 6HE0515 P44389
2 × 200 = 400 tablets 3 × 100 = 300 tablets 4 × 100 = 400 tablets 1 × 500 = 500 tablets
3 B94669 PCA112 7BE0119 P424477
3 × 100 = 300 tablets 3 × 100 = 300 tablets 1 × 750 = 750 tablets 1 × 250 = 250 tablets
4 B27624 PCA226 7AE0039 P44686
4 × 75 = 300 tablets 10 × 24 = 240 tablets 1 × 750 = 750 tablets 1 × 250 = 250 tablets
5 B91364 PBA123 7CE0268 P14360
2 × 150 = 300 3 × 100 = 300 tablets 1 × 750 = 750 tablets 3 × 100 = 300 tablets
6 B73322 PBA194 7AE0699 P42476
2 × 150 = 300 tablets 3 × 100 = 300 tablets 1 × 500 = 500 tablets 3 × 100 = 300 tablets
7 B33863 PAA016 6LE0478 P42498
3 × 100 = 300 tablets 5 × 50 = 250 tablets 1 × 500 = 500 tablets 2 × 120 = 240 tablets
8 B91414 PBA186 7AE0270 P44151
2 × 200 = 400 tablets 5 × 50 = 250 tablets 3 × 100 = 300 tablets 5 × 50 = 250 tablets
9 B98483 PEA106 6GE0118 P44688
9 × 24 = 216 tablets 2 × 100 = 200 tablets 1 × 500 = 500 tablets 5 × 50 = 250 tablets
10 B91386 LLA329 7BE0606 P42058
2 × 200 = 400 tablets 2 × 100 = 200 tablets 1 × 500 = 500 tablets 2 × 100 = 200 tablets
Table 1. Sources of Ibuprofen (200 mg) samples used for this study.

4 An NIR Comparison of Method Development Approaches Using A Drug Product
and 2(c) show that four clusters can easily be separated from
each other in all three data sets. The following discussions
track the model development in the OPUS 5.5, NIRCal 5.2 and
Vision 3.4 software packages.
Pre-treatment I: baseline correction
Based upon the exploration of data pre-treatments shown in
Tables 4 and 5, a baseline correction using the function:
f(x) = x – min(X),
where x is a variable and X denotes all selected variables for
this sample, was fi rst applied in the Unscrambler 9.7. A base-
line correction was shown to be the simplest pre-treatment
applied to the calibration data sets to effect separation of all
four formulations, although barely. Furthermore, it was deter-
mined that while it is possible to apply a baseline transform
function to the Foss calibration set using the Vision 3.4 soft-
ware, the same mathematical transformation was not found
to be available in the Bruker or the Büchi software.
Using the Bruker OPUS 5.5 software, the closest approxima-
tion to the baseline offset function used in the Unscrambler 9.7
would be a normalisation function. This would then be followed
by the Savitzky–Golay, first derivative, 21 point smoothing,
3rd order polynomial, from 1000 nm to 2500 nm, followed by
factorisation (which is a Bruker PCA algorithm using Euclidian
distance within the Opus IDENT set-up module where the cali-
bration set resides. It was further noted that the default fi rst
derivative transformation for the OPUS 5.5 software is a cubic
polynomial equation.
The Büchi NIRCal 5.2 software required the use of several
spectra manipulations; to reverse the x-axis, orient the spectra
in the same direction as they are for the Foss and Bruker data,
prior to performing the PCA to the data [Figures 3(a), 3(b) and
3(c)]. The Savitzky–Golay fi rst derivative transformation for
the NIRCal 5.2 software is also a cubic polynomial equation.
In addition to other derivative functions, the NIRCal software
allows the use of customisable linear fi lters, which allowed
matching to the same derivative treatment used in the other
Advil Motrin CVS-Ibuprofen Rite Aid-Ibuprofen
Acelytated monoglycerides
Beeswax
Propylene glycol
Cellulose
Lactose
Sodium starch glycolate
Ethoxyethanol
Lecithin
Pharmaceutical glaze
Povidone
Semithicone
Sodium benzoate
Sodium lauryl sulphate
Sucrose
Fd&C yellow #6
Magnesium stearate
Polydextrose
Polyethylene glycol
FD&C yellow #6
Magnesium stearate
Polydextrose
Polyethylene glycol
Croscarmellose sodium
Microcrystalline cellulose
Pharmaceutical shellac
Pregelatinised starch
Carnauba wax
Shellac
Ppregelatinised starch
Carnauba wax
Hypromellose
Carnauba wax
Hypromellose
Croscarmellose sodium
Microcrystalline cellulose
Hypromellose
Iron oxides
Silicon dioxide
Corn starch
Ibuprofen
Stearic acid
Titanium dioxide
Iron oxides
Colloidal silicon dioxide
Corn starch
Ibuprofen
Stearic acid
Titanium dioxide
Fumed silica gel
Corn starch
Ibuprofen
Stearic acid
Titanium dioxide
Iron oxides
Colloidal silicon dioxide
Corn starch
Ibuprofen
Stearic acid
Titanium dioxide
Table 2. Formulations of Ibuprofen (200 mg) samples.

A. Kazeminy et al., J. Near Infrared Spectrosc. 17, xxx–xxx (2009) 5
software packages. The resulting fi lters for the Büchi calibra-
tion set are listed in Table 6.
Pre-treatment II: Savitzky–Golay fi rst derivative, 21 point smoothing, cubic polynomial
The smoothing and differentiation of paired data by the proce-
dure of simplifi ed least squares, now called the Savitzky–
Golay Filter,11 was developed for the removal of the random
noise from paired data sets, such as that obtained for NIR,
Log 1/R versus wavelength. For the data sets from this study,
it can be shown that the calibration by PCA or factorisation is
most affected by sampling variation manifested as baseline
offsets. The offsets result in signifi cant overlap of spectra
with closely resembling spectral features, which cannot be
completely resolved in spectral space. Tables 4 and 5 show
a systematic approach of pre-treating the calibration sample
spectra. The pre- treatments were applied and investigated
for their ability to remove sampling variation from the spectra.
The plus sign indicates that the samples from these formula-
tions can be separated into distinct clusters from the other
samples of a different formulation using the associated pre-
treatment, whereas the minus sign indicates that samples
from these formulations cannot be separated into distinct
clusters from the other samples of a different formulation
using the associated pre-treatment. The contribution of the
variability from the samples can be seen in Figures 3(a), 3(b)
and 3(c). The baseline offset is evident in the exploded plot of
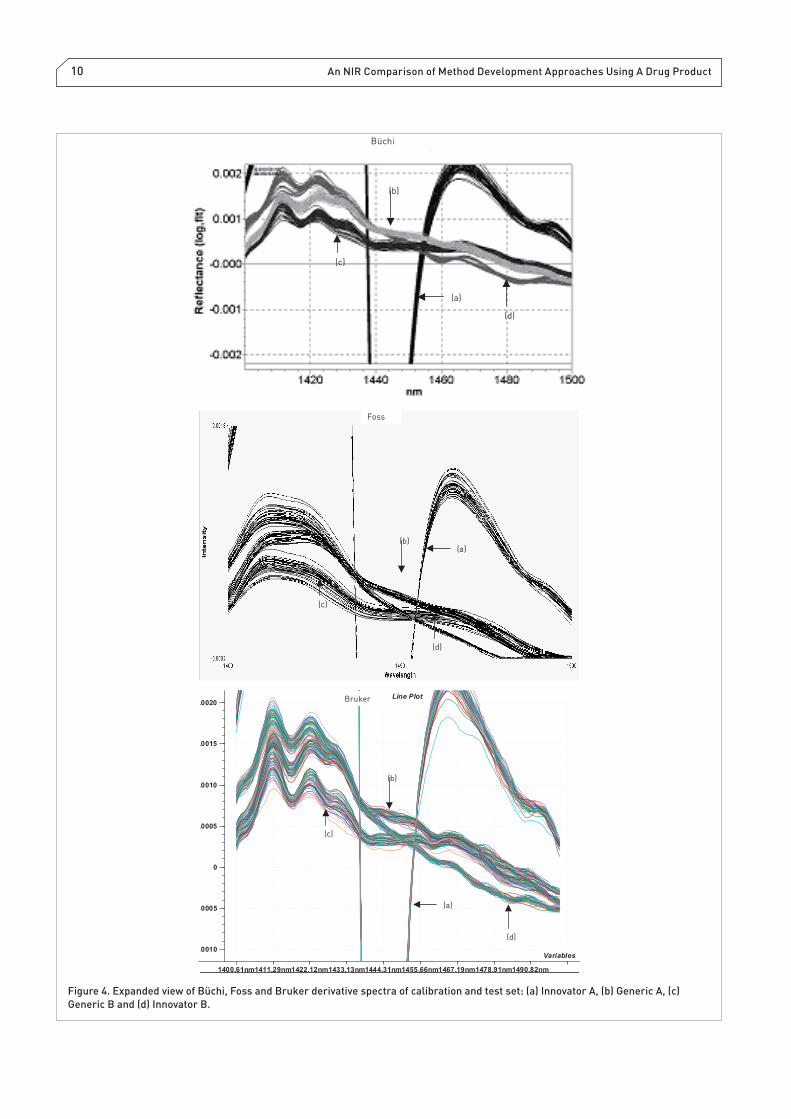
the spectra in Figure 4 and the effect of smoothing and deriv-
ative pre-treatment is also evident as well (Note: The number
of data points applied for smoothing the spectra during deri-
vatisation were investigated and 21 data points was found
to be optimal for discerning spectral features of the four
formulations in spectral space). Particularly noticeable at
the wavelength 1440 nm, one can observe a sharp band in the
untreated spectra, which is attributed to Innovator A samples
(Advil) [Note: This is due to the sucrose in the formulation
as indicated in Table 2. The origin of this unique band is
discussed by Davies and Miller.12 The impact of band reso-
lution from dispersive and FT is most noticeable in Figure
4, which is the expanded view of the first derivative and
smoothed spectra. The result of applying the Savitzky–Golay
fi rst derivative, 21 point smoothing fi lter is that it changes
the directions of the of the Generic A and Generic B spectra
relative to both the Innovator A and Innovator B spectra in the
region between 1400 nm and 1500 nm.
Principal component calculations
The PCA models [either by Mahalanobis distance (MD) for the
Foss and Büchi instruments or Euclidian distance (ED) for the
Bruker instrument) resulted in correct and accurate predic-
tions of all three validation sets. Mahalanobis distance is the
statistical distance taking into account the variance of each
variable and the correlation coeffi cients. In the case of a single
Laboratory/instrument Experimental
samples
Innovator
manufacturer
Advil
Innovator
manufacturer
Motrin
Generic
manufacturer
CVS
Generic
manufacturer
Rite Aid
Total
United States
Pharmacopeia/
Foss
Calibration Set 6 tabs × 8 lots = 48 6 tabs × 8 lots = 48 6 tabs × 8 lots = 48 6 tabs × 8 lots = 48 192
Test Set 2 tabs × 8 lots = 16 2 tabs × 8 lots = 16 2 tabs × 8 lots = 16 2 tabs × 8 lots = 16 64
Validation set 20 tabs × 2 lots = 40 14 tabs × 2 lots = 28 20 tabs × 2 lots = 40 20 tabs × 2 lots = 40 148
United States
Pharmacopeia/
Bruker
Calibration Set 6 tabs × 8 lots = 48 6 tabs × 8 lots = 48 6 tabs × 8 lots = 48 6 tabs × 8 lots = 48 192
Test Set 2 tabs × 8 lots = 16 2 tabs × 8 lots = 16 2 tabs × 8 lots = 16 2 tabs × 8 lots = 16 64
Validation set 20 tabs × 2 lots = 40 14 tabs × 2 lots = 28 20 tabs × 2 lots = 40 20 tabs × 2 lots = 40 148
FDA/Irvine Pharmaceutical
Services, Inc./
Büchi
Calibration Set 6 tabs × 8 lots = 48 6 tabs × 8 lots = 48 6 tabs × 8 lots = 48 6 tabs × 8 lots = 48 192
Test Set 2 tabs × 8 lots = 16 2 tabs × 8 lots = 16 2 tabs × 8 lots = 16 2 tabs × 8 lots = 16 64
Validation set 20 tabs × 2 lots = 40 20 tabs × 2 lots = 40 20 tabs × 2 lots = 40 20 tabs × 2 lots = 40 160
Total 312 288 312 312 1224
Table 3. Study design.
Figure 1. Ibuprofen (200 mg) tablets. Upper left, Advil, upper
right, Motrin, lower left CVS, and lower right, Rite Aid.

6 An NIR Comparison of Method Development Approaches Using A Drug Product
variable, it is the square of the distance (between two objects,
or between an object and the centroid) divided by the variancea
Euclidian distance is simply the distance between two varia-
bles and is calculated as the arithmetic difference, i.e. variable
1–variable 2. For a bi-variate model, the squared distances
between two vectors in multi-dimensional space are the sum
of squared differences in their coordinates. As noted previ-
ously, the algorithms used by each software were different
by the calculations employed for score distances. The signifi -
cance of this difference is that, even though the distances were
calculated in the principal component space (PC space) for the
Foss and Büchi calibration sets, and in wavelength space for
the Bruker calibration set, on similarly pre-treated spectra,
using the same wavelength range, and on different number of
principal components, the models gave identical predictions
for the validation sets (see Table 7). The reason that the PCA
calculation is invariant in either wavelength space or PC space
is explained by De Maesschalck et al.6
The supervised training by PCA, a discriminant analysis
technique, relies on the measurement of distances between
objects in order to achieve classifi cation. As noted by De
Maesschalck et al., this can occur in wavelength space or
in PC space, and on normalised or unnormalised spectra.
Another factor that De Maesschalck et al. point out, that may
not be obvious to a casual user of NIR techniques, is that
“the MD and the ED can also be calculated using a smaller
number of latent variables (PCs) obtained after PCA analysis
instead of the original variables. In this case, the MD, however,
does not need to correct for the covariance between the vari-
ables, since PCs are by defi nition orthogonal (uncorrelated).
However, the way each of the residual PCs is weighted in the
computation of the distance must be taken into account.” The
paper goes on to clarify the relationship between the ED and
the MD, particularly how each is calculated in the original
variable space and the PC space. It should be noted here
that the Bruker software, OPUS 5.5, utilises an approach
referred to as factorisation, which is explained as a spectral
distance calculation. Table 7 gives the model values for each
Spectra treatment
1000–2500 nm
Cluster
Innovator A Innovator B Generic A Generic B
Untreated spectra + + – –
Baseline corrected + + + +
First derivative + – + +
Second derivative + + – –
Baseline corrected
First derivative
+ + – –
Baseline corrected
Second derivative
+ – + +
*Pre-treatments applied to the raw spectra that resulted in a separate and distinct cluster for any member of the four sample sets following principle com-
ponent analysis are denoted by a plus sign, and pre-treatments that did not result in separate and distinct clusters are denoted by a minus sign. Plus signs,
in bold, indicates that all four sample sets were successfully separated
Table 4. Data pretreatments from 1000–2500 nm.
Spectra treatment
(1400–1500 nm)
Cluster
Innovator A Innovator B Generic A Generic B
Untreated spectra + – – –
Baseline corrected + + – –
First derivative + + – –
Second derivative + or yes? – – –
Baseline corrected
First derivative+ + + +
Baseline corrected
Second derivative+ – – –
**See footnote from Table 4
Table 5. Data pre-treatments from 1400–1500 nm.
aFrom a glossary provided with the permission of Bryan Prazen of the
Synovec Group, Department of Chemistry, University of Washington.
Found at http://www.spectroscopynow.com/coi/cda/detail.cda?id=101
18&type=EducationFeature&chId=9&page=1
A. Kazeminy et al., J. Near Infrared Spectrosc. 17, xxx–xxx (2009) 7
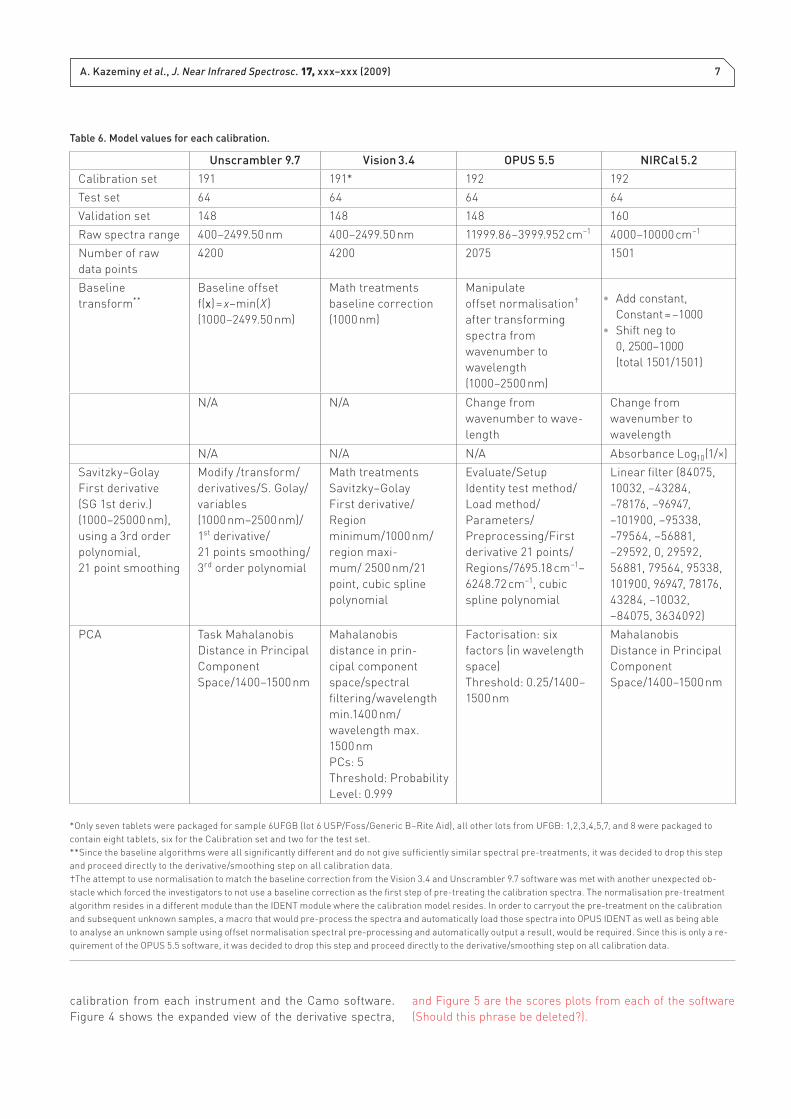
calibration from each instrument and the Camo software.
Figure 4 shows the expanded view of the derivative spectra,
and Figure 5 are the scores plots from each of the software
(Should this phrase be deleted?).
Unscrambler 9.7 Vision 3.4 OPUS 5.5 NIRCal 5.2
Calibration set 191 191* 192 192
Test set 64 64 64 64
Validation set 148 148 148 160
Raw spectra range 400–2499.50 nm 400–2499.50 nm 11999.86–3999.952 cm–1 4000–10000 cm–1
Number of raw
data points
4200 4200 2075 1501
Baseline
transform**
Baseline offset
f(x) = x–min(X)
(1000–2499.50 nm)
Math treatments
baseline correction
(1000 nm)
Manipulate
offset normalisation†
after transforming
spectra from
wavenumber to
wavelength
(1000–2500 nm)
Add constant, •
Constant = –1000
Shift neg to•
0, 2500–1000
(total 1501/1501)
N/A N/A Change from
wavenumber to wave-
length
Change from
wavenumber to
wavelength
N/A N/A N/A Absorbance Log10(1/×)
Savitzky–Golay
First derivative
(SG 1st deriv.)
(1000–25000 nm),
using a 3rd order
polynomial,
21 point smoothing
Modify /transform/
derivatives/S. Golay/
variables
(1000 nm–2500 nm)/
1st derivative/
21 points smoothing/
3rd order polynomial
Math treatments
Savitzky–Golay
First derivative/
Region
minimum/1000 nm/
region maxi-
mum/ 2500 nm/21
point, cubic spline
polynomial
Evaluate/Setup
Identity test method/
Load method/
Parameters/
Preprocessing/First
derivative 21 points/
Regions/7695.18 cm–1–
6248.72 cm–1, cubic
spline polynomial
Linear fi lter (84075,
10032, –43284,
–78176, –96947,
–101900, –95338,
–79564, –56881,
–29592, 0, 29592,
56881, 79564, 95338,
101900, 96947, 78176,
43284, –10032,
–84075, 3634092)
PCA Task Mahalanobis
Distance in Principal
Component
Space/1400–1500 nm
Mahalanobis
distance in prin-
cipal component
space/spectral
fi ltering/ wavelength
min.1400 nm/
wavelength max.
1500 nm
PCs: 5
Threshold: Probability
Level: 0.999
Factorisation: six
factors (in wavelength
space)
Threshold: 0.25/1400–
1500 nm
Mahalanobis
Distance in Principal
Component
Space/1400–1500 nm
*Only seven tablets were packaged for sample 6UFGB (lot 6 USP/Foss/Generic B–Rite Aid), all other lots from UFGB: 1,2,3,4,5,7, and 8 were packaged to
contain eight tablets, six for the Calibration set and two for the test set.
**Since the baseline algorithms were all signifi cantly different and do not give suffi ciently similar spectral pre-treatments, it was decided to drop this step
and proceed directly to the derivative/smoothing step on all calibration data.
†The attempt to use normalisation to match the baseline correction from the Vision 3.4 and Unscrambler 9.7 software was met with another unexpected ob-
stacle which forced the investigators to not use a baseline correction as the fi rst step of pre-treating the calibration spectra. The normalisation pre-treatment
algorithm resides in a different module than the IDENT module where the calibration model resides. In order to carryout the pre-treatment on the calibration
and subsequent unknown samples, a macro that would pre-process the spectra and automatically load those spectra into OPUS IDENT as well as being able
to analyse an unknown sample using offset normalisation spectral pre-processing and automatically output a result, would be required. Since this is only a re-
quirement of the OPUS 5.5 software, it was decided to drop this step and proceed directly to the derivative/smoothing step on all calibration data.
Table 6. Model values for each calibration.

8 An NIR Comparison of Method Development Approaches Using A Drug Product
2b
Innovator B
Innovator A
Generic B
Generic A
2a
Innovator A
Innovator B
Generic B
Generic A
22c
Innovator A
Innovator B
Generic B
Generic A
Figure 2. (a) Büchi PCA Score Plot (Unscrambler 9.7) using, (b) Foss PCA Score Plot (Unscrambler 9.7) and (c) Bruker PCA Score Plot
(Unscrambler 9.7).
(a)
(b)
(c)

A. Kazeminy et al., J. Near Infrared Spectrosc. 17, xxx–xxx (2009) 9
3
lo
g (
1/R
)
Innovator A
3b
(b)
Lo
g (
1/R
)
WWavelength
Lo
g (
1/R
)
(c)
Figure 3. (a) Büchi raw spectra plot (NIRCal 5.2), (b) Foss raw spectra plot (Vision 3.4) and (c) Bruker raw spectra plot (OPUS 5.5).
(a)
(b)
(c)
10 An NIR Comparison of Method Development Approaches Using A Drug Product
(a)
(c)
(d)
(b)
Büchi
18
(a)
(c)
(d)
(b)
(a)(b)
(c)
(d)
Foss
.0010
.0005
0
.0005
.0010
.0015
.0020
1400.61nm1411.29nm1422.12nm1433.13nm1444.31nm1455.66nm1467.19nm1478.91nm1490.82nm
Variables
Line Plot
(a)
(b)
(c)
(d)
Bruker
Figure 4. Expanded view of Büchi, Foss and Bruker derivative spectra of calibration and test set: (a) Innovator A, (b) Generic A, (c)
Generic B and (d) Innovator B.

A. Kazeminy et al., J. Near Infrared Spectrosc. 17, xxx–xxx (2009) 11
Validation results and
discussion
Table 7 lists a summary of the results of the validations sets
from the, Bruker, Büchi and Foss instruments, respectively.
The results demonstrate that all four objectives of the study
were met. Four distinct computerised algorithms of PCA
and factorisation were used to construct three separate
spectral libraries from a common calibration and test set,
each residing on different instruments in different laborato-
ries and one residing on stand-alone software, the referee
model. The use of the “referee” model helped establish the
baseline values for the model parameters such as spectral
range, spectra pre-treatment, calibration algorithms, etc.
that could be used across the various software platforms
despite the variations in instrument bandwidth, spectral data
points, algorithms for smoothing, derivative and other calcu-
lations. Specifi cally, while it was found that a PCA model
based on calculating Mahalanobis distance in PC space,
second derivative Gap 20, second order polynomial was suffi -
cient to model the calibration and test set on two of the three
instruments, it became evident early on in the experiment
that by using exactly the same model consisting of the same
algorithm calculation and same pre-treatment routine was
not possible. However, by the use of the referee software
which, when loaded with the calibration set from all three
instruments, one could easily determine how to optimise the
spectral range, and smoothing and derivative pre-treatment
parameters in order to achieve similar calibration and test
set parameters. The limiting calibration setting was found to
be the polynomial function, which effects how many points
are used to calculate the smoothing and derivative function.
As was shown in Figure 4, there is a very narrow spectral
range (100 nm or 1446.46 cm–1 on which separation can be
made on the four data sets in spectra space.
Having met the fi rst objective with some deviations, the
second, third and fourth objectives were easily met, as
the three models were successful at predicting the vali-
dation sets for each instrument, resulting in four distinct
clusters in multidimensional space, each cluster repre-
senting the innovator and generic brand Ibuprofen formula-
tions. Additionally, samples from Generic A lots 6GE0118
(CVS Brand) and P42058 (Rite Aid) were correctly identifi ed
as not belonging to Generic A lots comprising the cali-
bration sets for all three data sets. It was observed that
these samples have a distinct banding pattern in the region
from 1400 nm–1500 nm from all other sample spectra. The
most likely cause of this is assuredly due to the presence
of a component that absorbs in the NIR region not found in
those samples comprising the calibration set. As a result of
the new band in the critical region between 1400–1500 nm,
these samples also produce a fi fth separate and distinct
cluster in PC space.
It must be mentioned here that this experiment, being
performed in different laboratories within different organisa-
tional cultures, was totally driven by a protocol that was jointly
crafted and agreed upon prior to execution. The authors feel
that this is a key point since this experiment was designed to
meet specifi c objectives, despite the fact that the instruments,
software and personnel were at different locations. This, of
course, was not the major factor. The major factor was trying
to coordinate all of the steps within the protocol from within
different organisations. While NIR experiments are generally
described as non-destructive, fast and cost effective, when
done on a large scale they require planning, discussion and
coordination. This is rarely mentioned. It is hoped that this
example may serve as a model for future applications that
involve large sample sets and multi-organisations using
multiple instrument–software combinations. The current
global pharmaceutical counterfeiting problem is one area that
should benefi t from examples like the one demonstrated in
this paper.
ConclusionsThe specifi c objective of the study was to obtain log 1/R spectra
of four formulations of Ibuprofen (200 mg) from two branded
Instrument Lot Innovator A
tablets
Innovator B
tablets
Generic A Generic B
Foss 9 20 20 0 20
10 20 8 0 20
Bruker 9 20 20 0 20
10 20 8 0 20
Büchi 9 20 20 0 20
10 20 20 0 20
Twenty tablets were tested for each combination of instrument and lot, except for Lot 10 of Innovator B where only eight were tested on the Foss and Bruker
instruments
Table 7. Number of tablets identifi ed.

12 An NIR Comparison of Method Development Approaches Using A Drug Product
and two store-branded Ibuprofen (200 mg) immediate-release
tablets and use them to design, develop, validate and deploy a
calibration model that can subsequently be used to correctly
classify by discriminant analysis using PCA, log 1/R spectra
from unknown samples (validation set) on NIR instruments of
varying types and software confi gurations.
This experiment was designed to study the impact that NIR
instrument hardware and software configurations have on
NIR method development. Several variables were detected
and assessed. Spectrometer types, sample holders, spec-
tral acquisition settings, data pre-treatments and PCA algo-
rithms were studied. NIR method development was attempted
by three different analysts on three different instruments
located in two different laboratories. It was determined
that even though identical samples were used for model-
ling and prediction, and the same calibration approach was
tried on the accompanying software, spectra differences were
observed due to the number of data points, and that these
impact the ability to perform the same or similar data pre-
treatments in different software. Furthermore, the algorithms
employed in each software platform may limit the ability to
deploy a method developed on any single software platform
to be deployed across different software platforms. However,
despite the differences observed, it was possible to find a
common method using each software that enabled accurate
predictions of the validation samples when each model was
used independent of instrument and software confi guration.
Knowing the sources of variability that impact the log 1/R
NIR spectrum will minimise the overall prediction varia-
bility and increase the likelihood of correctly classifying by
discriminant analysis, the log 1/R spectra from unknown
samples subsequently measured and compared to the spec-
tral library and classifi ed by the calibration model, when
model parameters are used on different instrument and
software combinations.
It was found that using Savitzky–Golay, fi rst derivative, 21
point smoothing, third order polynomial, pre-treated spectra
and either PCA or factorisation model (either by MD in prin-
cipal component space for the Foss and Büchi or ED in wave-
length space for the Bruker Factorisation method) resulted in
different models but possessing the same accuracy capabili-
ties (100%) for predicting samples comprising similar valida-
tion sets. Each model consisted of 192 calibration samples
(except the Foss calibration set which had one missing tablet
for a total of 191 calibration samples) and 64 test set samples
developed for each NIR instrument, Each model correctly and
accurately (100%) predicted 160 validation samples using the
Büchi model, and 148 validation samples using the Bruker
and Foss models (Graeme Batten thinks that this sentence
should be deleted. Do you agree?). One validation sample set,
a store-branded Ibuprofen (200 mg) immediate-release tablet,
was correctly identifi ed as not belonging to the samples repre-
sented in the calibration set by all three models. Based on
these results, and despite differences in instrument confi gu-
ration [dispersive or Fourier Transform (FT)], number of spec-
tral data points, PCA or factorisation algorithms and validation
modelling approach, exact and accurate spectroscopic results
can be achieved using NIR spectroscopy for discriminate anal-
ysis. More importantly, this study shows that the same NIR
method spectral range and pre-treatment parameters can
be used and that nearly the same multivariate models can
be obtained, despite instrumental and software differences,
to accurately predict the identity of pharmaceutical dosage
forms.
AcknowledgementsThe authors are grateful for the contributions to this project
from each of the following scientists: Darrell Abernathy,
Rebecca Allen, Todd Cecil, Walter Hauck, Andrea Iwanik,
Steven Lane, Samir Wahab and Patricia White from USP,
Rudy Flach, Charles Petersen and Heather Coffi n from Irvine,
William Martin from the FDA, Michael Surgeary from Büchi,
Cynthia Kradjel from Integrated Technical Solutions and Verne
Hebard from Bruker.
References1. P. de Peinder, M.J. Vredenbregt, T. Visser and D. de
Kaste, “Detection of lipitor counterfeits: a comparison of
NIR and Raman spectroscopy in combination with che-
mometrics”, J. Pharmaceut. Biomed. Anal. 47, 688 (2008).
doi: 10.1016/j.jpba.2008.02.016
2. J. Luypaerta, D.L. Massart and Y. Vander Heyden,
“Near-infrared spectroscopy applications in pharma-
ceutical analysis”, Talanta 72, 865 (2007). doi: 10.1016/j.
talanta.2006.12.023
3. Y. Roggo, P. Chalusa, L. Maurera, C. Lema-Martineza, A.
Edmonda and N. Jenta, “A review of near infrared spec-
troscopy and chemometrics in pharmaceutical technolo-
gies”, J. Pharmaceut. Biomed. Anal. 44, 683 (2007). doi:
10.1016/j.jpba.2007.03.023
4. A.K. Deisingh, “Pharmaceutical counterfeiting”, Analyst
130, 271 (2005). doi: 10.1039/b407759h
5. C.A. Anderson, J.K. Drennen and E.W. Ciurczak,
“Pharmaceutical applications of near infrared spec-
troscopy”, in Handbook of Near-Infrared Analysis”, 3rd
Edn, (Practical Spectroscopy Series Volume 35) Ed by
D.A. Burns and E. W. Ciurczak. CRC Press, Boca Raton,
Florida, USA, p. 585 (2008).
6. R. De Maesschalck, D. Jouan-Rimbaud and D.L.
Massart, “Tutorial—The Mahalanobis distance”,
Chemometr. Intell. Lab Syst. 50, 1 (2000). doi: 10.1016/
S0169-7439(99)00047-7
7. USP general information chapter <1119> Near-Infrared
Spectroscopy (http://www.usp.org/USPNF/revisions/
usp31nf26secondSupplement01.html.
8. S.H.F. Scafi and C. Pasquini, “Identifi cation of counterfeit
drugs using near-infrared spectroscopy”, Analyst 126,
2218 (2001). doi: 10.1039/b106744n

A. Kazeminy et al., J. Near Infrared Spectrosc. 17, xxx–xxx (2009) 13
9. J. Workman Jr and J. Brown, “A new standard practice
for multivariate, quantitative infrared analysis-Part I”,
Spectroscopy 11(2), 48 (1996).
10. J. Workman Jr and J. Brown, “A new standard practice
for multivariate, quantitative infrared analysis-Part II”,
Spectroscopy 11(9), 24 (1996).
11. A. Savitzky and M.J.E. Golay, “Smoothing and
differentiation of data by simplifi ed least squares pro-
cedures,” Anal. Chem. 36, 1627 (1964). doi: 10.1021/
ac60214a047
12. A.M.C. Davies and C. Miller, “Tentative assignment of the
1440-nm absorption band in the near-infrared spectrum
of crystalline sucrose”, Appl. Spectrosc. 42, 703 (1988).