Embed Size (px)
Citation preview

Rahul Reddy [email protected] | September 2nd, 2015
1
A Comparison of Methods: Normalizing High-Throughput RNA Sequencing Data
ABSTRACT
As RNA-Seq and other high-throughput sequencing grow in use and remain critical for gene expression studies, technical variability in counts data impedes studies of differential expression studies, data across samples and experiments, or reproducing results. Studies like Dillies et al. (2013) compare several between-lane normalization methods involving scaling factors, while Hansen et al. (2012) and Risso et al. (2014) propose methods that correct for sample-specific bias or use sets of control genes to isolate and remove technical variability. This paper evaluates four normalization methods in terms of reducing intra-group, technical variability and facilitating differential expression analysis or other research where the biological, inter-group variability is of interest. To this end, the four methods were evaluated in differential expression analysis between data from Pickrell et al. (2010) and Montgomery et al. (2010) and between simulated data modeled on these two datasets. Though the between-lane scaling factor methods perform worse on real data sets, they are much stronger for simulated data. We cannot reject the recommendation of Dillies et al. to use TMM and DESeq normalization, but further study of power to detect effects of different size under each normalization method is merited.
INTRODUCTION
RNA-Seq and other high-throughput sequencing technologies are key to the study of gene expression
and especially important for differential expression analysis. However, technical variability in RNA-Seq
data is an impediment to studying differential expression, reproducing results of experiments, and
comparing raw count data between samples. For differential expression analysis in particular, our
interest is in the biological variability between groups, rather than intra-group, technical variability that
may arise during sequencing. Though comparative evaluations have been done using real data by
Hansen et al. (2012), and Dillies et al. (2013) have used both real and simulated data, it remains unclear
which RNA-Seq normalization method(s) scientists should use for data analysis. More recently, Risso et
al. (2014) proposed using factor analysis on sets of control genes, which also merits consideration. By
comparing such recommended methods with real and simulated data, this paper seeks to help scientists
choose the best normalization method for their own RNA-Seq analysis.
Objective
This study will evaluate 4 normalization methods recommended for differential expression analysis in
recent literature: Trimmed Mean of M-Values (TMM), Relative Log Expression (RLE, the default method
in the DESeq package), Conditional Quantile Regression (CQN), and Remove Unwanted Variation (RUV).
Using real and simulated data, these methods will be compared with respect to removing technical
variability and differential expression analysis.
.CC-BY-NC-ND 4.0 International licensepeer-reviewed) is the author/funder. It is made available under aThe copyright holder for this preprint (which was not. http://dx.doi.org/10.1101/026062doi: bioRxiv preprint first posted online Sep. 3, 2015;

Rahul Reddy [email protected] | September 2nd, 2015
2
METHODS
This section describes the normalization methods, real datasets, simulation, and criteria for comparison
used in this study. In the following pages, terminology and abbreviations are used which are specific to
Genomics, Statistics, the R statistical computing software, and the Bioconductor suite of R packages. For
example, by technical variability we speak of variation within a group or condition, as opposed to the
biological variation between groups or conditions that is of research interest. Differential expression
refers to genes being up-regulated or down-regulated between different conditions. The condition may
be that samples are from different individuals, populations, or species, different organ tissues or cell
types for the same individuals, different time periods for the same individual and tissue, or any
combination thereof. Typically, Bioconductor packages EdgeR or DESeq are the backbone of a
differential expression study, as outlined by Anders et al. (2013). This study uses the EdgeR package in a
reference workflow provided by Susan Holmes (Stanford University, 2015), and implementing each
method per its vignette.
Normalization Methods
Most RNA-Seq datasets are obtained using Illumina sequencers that eight independent sequencing
areas, or "lanes." Libraries of cDNAs, representative of RNA from a cell or tissue sample, are deposited
on these lanes. The normalization methods compared in this study address different sources of variation
in the resulting count data, with the first two addressing differences in library size (i.e. sequencing
depth). Library size, or number of mapped short reads obtained in sequencing a given library, can be
normalized between samples by scaling raw read counts in each lane according to a single, lane-specific
factor. Trimmed Mean of M-Values (TMM) and DESeq (Relative Log Expression, or RLE) are two different
methods based on calculating such scaling factors. Conditional Quantile Normalization (CQN) corrects
for within-sample, gene-specific effects (gene length, GC-content, etc.), while Remove Unwanted
Variation (RUV) removes technical variability through factor analysis on sets of control genes or samples.
Trimmed Mean of M-Values (TMM)
TMM normalization is the EdgeR package's default normalization method and assumes that most genes
are not differentially expressed. It calculates a normalization factor for each gene, though this correction
factor is applied to library size (i.e. sequencing depth) rather than not raw counts. Moreover, to
compute the TMM factor, one lane is considered a reference sample and the others test samples, with
TMM being the weighted mean of log ratios between test and reference, after excluding the most
expressed genes and the genes with the largest log ratios. According to Dillies et al. (2013), the DESeq
method and TMM outperformed Median Count, Upper Quantile, Mean of Total Count, and RPKM
(Reads per Kilobase per Million) normalization methods, as well as Quantile Normalization.
Relative Log Expression (DESeq)
For DESeq's default normalization method, the RLE (Relative Log Expression) normalization method was
used in EdgeR as it is equivalent. Starting with the hypothesis that most genes are not DE, scaling factors
.CC-BY-NC-ND 4.0 International licensepeer-reviewed) is the author/funder. It is made available under aThe copyright holder for this preprint (which was not. http://dx.doi.org/10.1101/026062doi: bioRxiv preprint first posted online Sep. 3, 2015;

Rahul Reddy [email protected] | September 2nd, 2015
3
are calculated for each lane as median of the ratio, for each gene, of its read count of its geometric
mean across all lanes. This way, non-differentially expressed genes will have similar read counts across
samples, with a ratio of 1, and the median of the ratio for a given lane serves as a correction factor to
apply to all read counts. Along with TMM, Dillies et al. (2013) recommended DESeq normalization.
Conditional Quantile Normalization (CQN)
Proposed by Hansen et al. (2012), CQN operates on the assumption that RNA-Seq data is greatly
affected by bias and systemic errors, with a sample effect that is not common for all genes. The authors
focused on sample-specific GC-content bias, which resulted in confounding of GC-content and log fold
change values. To remove such technical variability, they removed this GC-content effect and also used
quantile normalization. However, they improved upon prior efforts to remove sample-specific GC bias
by assuming that the distribution of true expression values does not depend on GC-content, and felt
that strong GC-content effects across different parts of the same gene support this assumption. The
authors also published a Bioconductor package, cqn, which we use to implement this normalization and
create offsets that can be used in EdgeR's GLM test (Likelihood Ratio Test) for differential expression.
Remove Unwanted Variation (RUV)
RUV is a normalization method that uses factor analysis of suitable sets of control genes (or samples) to
remove technical variability, thus obtaining more accurate estimates of differential expression. Risso et
al. (2014) used the External RNA Control Consortium's spike-in controls as control genes and developed
three algorithms. RUVg assumes a set of "negative" control genes that are not affected by biological
covariates of interest (e.g. housekeeping genes or spike-ins), but are affected by unwanted technical
variability like any other genes. RUVr makes no such assumption, and all control genes may be used to
normalize the data while RUVs is a middle option that requires negative control genes exactly as in
RUVg, but is less sensitive to these genes. Given housekeeping genes in our dataset that could serve as
negative control genes, we implemented RUVg using the authors' RUVSeq package.
Real Data
Dataset Descriptions
Through the tweeDESeqCountData package by Gonzalez (2010) based on the study by Esnaola et al.
(2013), we obtained the datasets of Pickrell et al. (2010) and Montgomery et al. (2010). These studies of
lymphoblastoid cell gene expression gathered RNA-Seq data from 69 individuals from Nigeria of Yoruba
ancestry (Pickrell, HapMap YRI) and 60 from Utah of European ancestry (Montgomery, HapMap CEU).
Pickrell included 29 men and 40 women, Montgomery 27 men and 33 women, and both datasets
included GC-content and length data. No genes were known to be differentially expressed between
populations, housekeeping genes were also included.
Comparison Procedures
.CC-BY-NC-ND 4.0 International licensepeer-reviewed) is the author/funder. It is made available under aThe copyright holder for this preprint (which was not. http://dx.doi.org/10.1101/026062doi: bioRxiv preprint first posted online Sep. 3, 2015;

Rahul Reddy [email protected] | September 2nd, 2015
4
The four methods were compared based on variation in normalized data results of differential
expression analysis. After filtering out genes with low read counts, only 6855 genes were ultimately
considered. Bar plots of the Biological Coefficient of Variance (BCV, square root of dispersion), violin
plots of intra-group variation, and RLE (Relative Log Expression) Plots were made to see how each
method reduced technical variability. Differential expression of genes between the two populations was
determined using EdgeR's GLM Likelihood Ratio Test, generating lists of genes obtained under each
normalization method. These lists were then compared through a Venn Diagram and tables.
Simulation
In addition to working with real data, we created a simulated dataset based on 6855 genes and 129
samples from the Pickrell and Montgomery data used in analysis. The SimSeq package allowed us to
model RNA-Seq data, with read counts having a negative binomial distribution, generating count data
for 6850 genes across 30 samples (15 per group) with 4000 of the genes differentially expressed. For this
simulated dataset, we repeated the same analyses as with real data, and were also able to evaluate
each method based on its false positive and false negative rates (or true positive and true negative
rates). Having specified a priori that 4000 genes be randomly set as differentially expressed, we could
measure each normalization method's performance in finding these genes to be differentially expressed.
RESULTS
Our interest in comparing normalization methods was to reduce technical, intra-group variability, and
make biological, inter-group variability of research interest more apparent. For this, we considered real
and simulated data. Looking at bar plots of the Biological Coefficient of Variation (BCV), TMM and DESeq
hardly reduce the total variability (sum of intra- and inter-group) versus Raw Counts, though CQN and
RUV seem to do so. We see this same pattern when considering only housekeeping genes, which have
constant expression levels in most settings, though we cannot make any statements about significance.
.CC-BY-NC-ND 4.0 International licensepeer-reviewed) is the author/funder. It is made available under aThe copyright holder for this preprint (which was not. http://dx.doi.org/10.1101/026062doi: bioRxiv preprint first posted online Sep. 3, 2015;
Rahul Reddy [email protected] | September 2nd, 2015
5
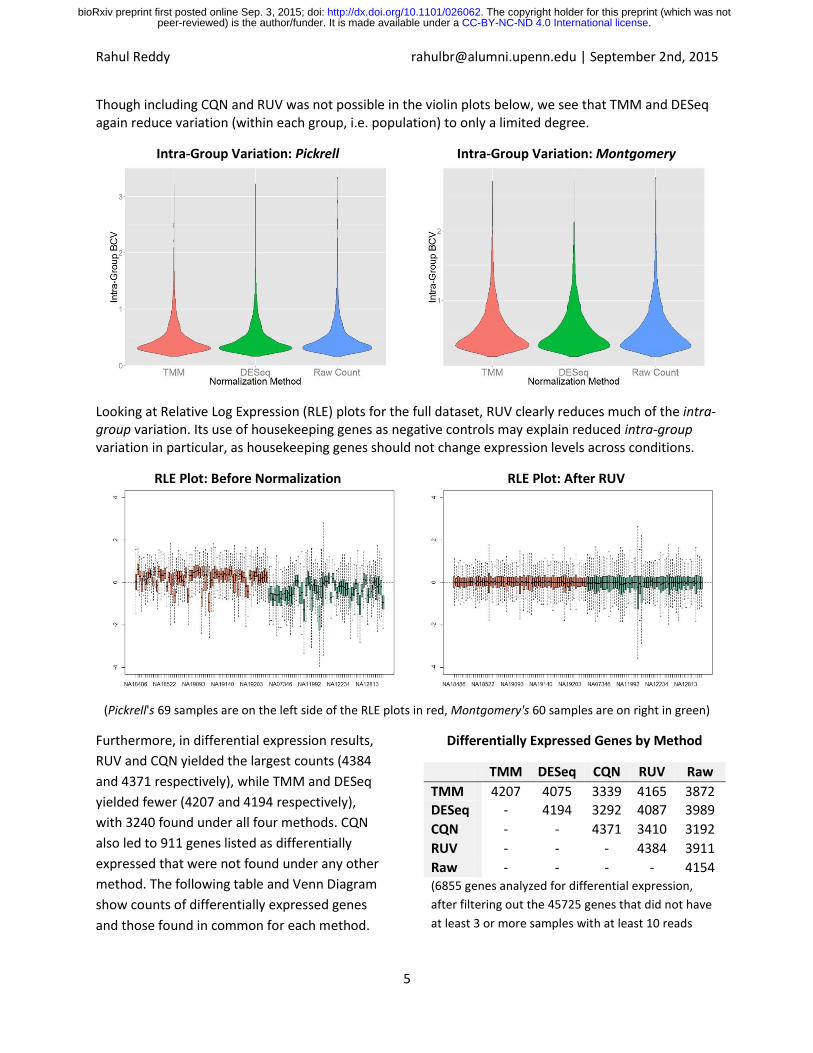
Though including CQN and RUV was not possible in the violin plots below, we see that TMM and DESeq again reduce variation (within each group, i.e. population) to only a limited degree.
Intra-Group Variation: Pickrell
Intra-Group Variation: Montgomery
Looking at Relative Log Expression (RLE) plots for the full dataset, RUV clearly reduces much of the intra-group variation. Its use of housekeeping genes as negative controls may explain reduced intra-group variation in particular, as housekeeping genes should not change expression levels across conditions.
RLE Plot: Before Normalization
RLE Plot: After RUV
(Pickrell's 69 samples are on the left side of the RLE plots in red, Montgomery's 60 samples are on right in green)
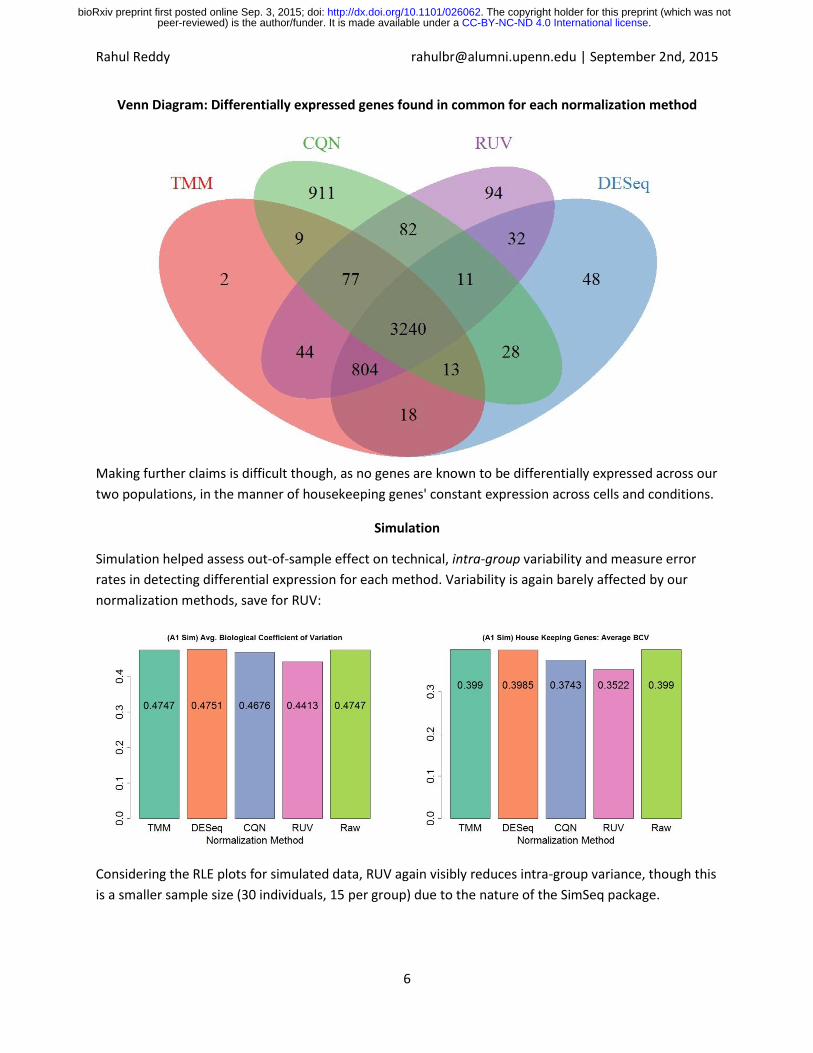
Furthermore, in differential expression results,
RUV and CQN yielded the largest counts (4384
and 4371 respectively), while TMM and DESeq
yielded fewer (4207 and 4194 respectively),
with 3240 found under all four methods. CQN
also led to 911 genes listed as differentially
expressed that were not found under any other
method. The following table and Venn Diagram
show counts of differentially expressed genes
and those found in common for each method.
Differentially Expressed Genes by Method
TMM DESeq CQN RUV Raw
TMM 4207 4075 3339 4165 3872
DESeq - 4194 3292 4087 3989
CQN - - 4371 3410 3192
RUV - - - 4384 3911
Raw - - - - 4154 (6855 genes analyzed for differential expression,
after filtering out the 45725 genes that did not have
at least 3 or more samples with at least 10 reads
.CC-BY-NC-ND 4.0 International licensepeer-reviewed) is the author/funder. It is made available under aThe copyright holder for this preprint (which was not. http://dx.doi.org/10.1101/026062doi: bioRxiv preprint first posted online Sep. 3, 2015;
Rahul Reddy [email protected] | September 2nd, 2015
6
Venn Diagram: Differentially expressed genes found in common for each normalization method
Making further claims is difficult though, as no genes are known to be differentially expressed across our
two populations, in the manner of housekeeping genes' constant expression across cells and conditions.
Simulation
Simulation helped assess out-of-sample effect on technical, intra-group variability and measure error
rates in detecting differential expression for each method. Variability is again barely affected by our
normalization methods, save for RUV:
Considering the RLE plots for simulated data, RUV again visibly reduces intra-group variance, though this
is a smaller sample size (30 individuals, 15 per group) due to the nature of the SimSeq package.
.CC-BY-NC-ND 4.0 International licensepeer-reviewed) is the author/funder. It is made available under aThe copyright holder for this preprint (which was not. http://dx.doi.org/10.1101/026062doi: bioRxiv preprint first posted online Sep. 3, 2015;

Rahul Reddy [email protected] | September 2nd, 2015
7
RLE Plot: Before Normalization
RLE Plot: After RUV
Differentially Expressed Genes by Method
TMM DESeq
CQN RUV Raw
TMM 1327 1318 870 726 1327 DESe
q
- 1337 874 723 1318
CQN - - 1098 647 870
RUV - - - 864 726
Raw - - - - 1327
Differential expression results were much smaller in counts, but also notable for CQN and RUV having the smallest counts, whereas they had the most for the real data. simulation also allowed us to compare the four methods by their false positive rate in differential expression analysis.
Of 6850 simulated genes, 4000 were set
at random to be differentially expressed.
After filtering, 6183 genes remained for
our analysis. The Venn Diagram on the
right gives a breakdown of differential
expression by method, while the accuracy
of each normalization method is given in
the following confusion matrices. The
error rate is given for each method, with
(in clockwise order from top left) True
Positive, False Negative, True Negative,
and False Positive counts.
DE genes found in common for each method
TM M
M
41%
Error
DE Analysis
DE Not DE
Rea
l DE 1219 2427
Not DE 108 2429
DES
eq 41%
Error
DE Analysis
DE Not DE
Rea
l DE 1224 2422
Not DE 113 2424
.CC-BY-NC-ND 4.0 International licensepeer-reviewed) is the author/funder. It is made available under aThe copyright holder for this preprint (which was not. http://dx.doi.org/10.1101/026062doi: bioRxiv preprint first posted online Sep. 3, 2015;

Rahul Reddy [email protected] | September 2nd, 2015
8
CQ
N 43.09%
Error
DE Analysis
DE Not DE R
eal DE 1040 2606
Not DE 58 2479
RU
V 46.06%
Error
DE Analysis
DE Not DE
Rea
l DE 831 2815
Not DE 33 2504
Raw
Co
un
t 41%
Error
DE Analysis
DE Not DE
Rea
l DE 1219 2427
Not DE 108 2429
From the simulated data, it's clear that even
though RUV seemed best in reducing intra-
group variance with real data, it has a high false
negative rate (2805 genes classified as Not DE,
when in fact they were DE) and did worst of all
the methods in differential expression analysis.
DISCUSSION
In considering four methods to reduce technical, intra-group variability and thus improve differential
expression analysis, there was not one method that dominated. In reducing intra-group, technical
variability TMM and DESeq had no significant effect as compared to the Raw Count data, whereas CQN
and RUV may have had an effect. However, CQN and RUV are only useful in particular circumstances.
CQN can correct for GC-content, read lengths, or similar sample-specific bias, which is why Dillies et al.
(2013) did not evaluate it against TMM and DESeq, the methods they found to perform best. RUV
requires a set of negative control genes or samples, such as housekeeping genes, which are not always
known. For the Pickrell and Montgomery datasets, CQN and RUV reduced variation more and resulted in
a higher count of differentially expressed genes as well.
However, simulation suggests that these advantages of CQN and RUV may have been specific to our
choice of datasets, and that much more can be done to assess how each normalization method affects
the power of tests for differential expression. The Pickrell and Montgomery datasets would be expected
to have non-trivial GC-content, as they were used by Hansen et al. (2012) to introduce CQN. They also
had housekeeping genes, ready to use as controls for RUV. For differential expression as well, simulation
results were the opposite of those with real data, as RUV and CQN had the lowest gene counts.
Moreover, their error rates (46.09% and 43.03%) were higher as well, with very high false negative
rates. Though our scope did not include the effect of each normalization method on power (i.e.
minimizing false negatives), RUV's high rate of false negatives and the ability with simulation to test
power by varying the number of differential expressed genes make this worth future study.
.CC-BY-NC-ND 4.0 International licensepeer-reviewed) is the author/funder. It is made available under aThe copyright holder for this preprint (which was not. http://dx.doi.org/10.1101/026062doi: bioRxiv preprint first posted online Sep. 3, 2015;

Rahul Reddy [email protected] | September 2nd, 2015
9
Conclusion
Though this study found CQN and RUV promising in their ability to reduce technical, intra-group
variability, it cannot reject the recommendation of Dillies et al. (2013) to use DESeq and TMM
normalization for differential expression analysis. Indeed, these two methods were the most accurate
for simulated data and had similar differential expression results to CQN and RUV using real data. What
remains of interest are the conditions under which CQN and RUV may be best applied, especially if
certain levels of GC-content bias meriting use of CQN or specific control genes best suited to RUV could
be identified. In the manner of a 2013 protocol established by Anders et al for RNA sequencing data
analysis, protocols for normalization are worth developing as more and more research and researchers
rely on RNA-Seq.
REFERENCES
Hansen, Kasper D., Rafael A. Irizarry, and W. U. Zhijin. "Removing technical variability in RNA-seq data
using conditional quantile normalization."Biostatistics 13.2 (2012): 204-216.
Dillies, Marie-Agnès, et al. "A comprehensive evaluation of normalization methods for Illumina high-
throughput RNA sequencing data analysis." Briefings in bioinformatics 14.6 (2013): 671-683.
Risso, Davide, et al. "Normalization of RNA-seq data using factor analysis of control genes or
samples." Nature biotechnology 32.9 (2014): 896-902.
Anders, Simon, and Wolfgang Huber. "Differential expression analysis for sequence count data." Genome
biol 11.10 (2010): R106.
Holmes, Susan. "RNA Sequence Analysis in R: EdgeR." RNA Sequence Analysis in R: EdgeR. Stanford
University, 15 June 2014. Web. 24 July 2015.
Pickrell, Joseph K., et al. "Understanding mechanisms underlying human gene expression variation with
RNA sequencing." Nature 464.7289 (2010): 768-772.
Montgomery, Stephen B., et al. "Transcriptome genetics using second generation sequencing in a
Caucasian population." Nature 464.7289 (2010): 773-777.
Frazee, Alyssa C., Ben Langmead, and Jeffrey T. Leek. "ReCount: a multi-experiment resource of
analysis-ready RNA-seq gene count datasets." BMC bioinformatics 12.1 (2011): 449.
Gonzalez, Juan R., Maintainer Juan R. Gonzalez, and RNAseqData biocViews
HighThroughputSequencingData. "Package ‘tweeDEseqCountData’." population464 (2010): 773-777.
Esnaola, Mikel, Robert Castelo, and Juan Ramón González. "tweeDEseq: analysis of RNA-seq data
using the Poisson-Tweedie family of distributions."dim (countsNigerian) 1.52580 (2013): 69.
Anders, Simon, et al. "Count-based differential expression analysis of RNA sequencing data using R and
Bioconductor." Nature protocols 8.9 (2013): 1765-1786.
.CC-BY-NC-ND 4.0 International licensepeer-reviewed) is the author/funder. It is made available under aThe copyright holder for this preprint (which was not. http://dx.doi.org/10.1101/026062doi: bioRxiv preprint first posted online Sep. 3, 2015;