Embed Size (px)
Citation preview

A Comparison of Major and Minor Elemental Fluxes collected in
Neutrally Buoyant and Surface-Tethered Sediment Traps
Rachel H. R. Stanleya*, Ken O. Buesselera, Steven J. Manganinia,
Deborah K. Steinbergb, and James R. Valdesa
a Woods Hole Oceanographic Institution, Woods Hole, MA 02543, - bVirginia Institute of Marine Science, College of William and Mary, Gloucester Pt, VA 23062, USA
Abstract
There is evidence that horizontal flow over the mouth of shallow sediment traps can lead
to collection biases due to hydrodynamic effects. To eliminate flow, Neutrally Buoyant
Sediment Traps (NBSTs) based upon a neutral float designed to track subsurface ocean currents
were developed. Here we compare material collected in NBSTs to material collected in standard
Particle Interceptor sediment Traps (PITs) deployed during June and September 2001 at the
Bermuda Atlantic Time-series Study (BATS) site. Current meters located on the PITs array
indicated that both experiments were conducted during conditions of relatively low horizontal
flow, which are optimal conditions for the unbiased collection of sinking particles by PITs. The
NBSTs and PITs both recorded a range of overall flux conditions, as supported by the fluxes of
mass, particulate organic carbon (POC), and other elements (S, Mg, Sr, Fe, Mn, Ni, Ti, P, V),
which do not significantly differ between the two types of traps. However, the fluxes of Si, Ca,
Al, and Ba collected by the PITs are significantly larger than the NBST fluxes of those same
elements. Additionally, the fluxes of particulate organic nitrogen (PON) collected by the PITs
are significantly smaller than the NBST PON fluxes. The most likely cause of these flux
differences is hydrodynamic bias inherent in the PIT design, which causes particle sorting based

2
upon settling velocity and other characteristics of the carrier phases. How these results compare
under conditions of higher flow or differing particle characteristics cannot be assessed from this
study.
Keywords: Sediment trap; Upper ocean flux; Export flux; Particle sorting; Bermuda;
Introduction
Sediment traps have been extensively used to measure carbon export and to examine
other biogeochemical processes (Eppley and Peterson, 1979; Knauer et al, 1990; Michaels et al.,
1994). Rates of remineralization with depth have been studied through sediment traps (Martin et
al., 1987) and the resulting relationship has been used in many biogeochemical models
(Gnanadesikan, 1999; Christian et al., 2002; Schlitzer, 2002 ). Sediment traps have also been
used to study vertical distribution and cycling of trace elements in the upper ocean (Livingston
and Anderson, 1983; Martin and Knauer, 1984; Buat-Menard et al., 1989; Buesseler et al., 1990).
Sediment traps offer the advantage of allowing direct collection and examination of
sinking particles. However, several known problems with upper ocean sediment traps can make
using sediment trap records troublesome (Gardner, 2000). The export fluxes calculated from
sediment traps can differ by up to a factor of three to ten from those calculated from 234Th
disequilibria (Buesseler, 1991; Buesseler et al., 1994; Murray et al., 1996; Hernes et al., 2001).
Trap-derived carbon fluxes have not been able to �close� the C budget at BATS to within a
factor of three (Michaels et al., 1994) and active flux of C by zooplankton vertical migration only
partially resolves the discrepancy (Steinberg et al., 2000). Additionally, factor of two to five
* Corresponding author: [email protected]; Tel: (508)289-2927; fax: (508)457-2193

3
differences in fluxes in upper ocean paired traps have been observed (Gust et al., 1992).
These discrepancies may be the result of several types of biases in upper ocean sediment
traps. Hydrodynamic biases resulting from flow across the top of the trap, tilt of the trap,
mooring lines, trap geometry, etc. could cause traps to overcollect certain types of particles and
undercollect others, leading to particle sorting (Gust et al., 1996). Other potential problems
include swimmers � live organisms that swim or are carried into the traps � and solubilization of
sinking material within the trap after collection but before analysis (Gardner, 2000).
Neutrally Buoyant Sediment Traps (NBSTs) were developed in order to minimize
hydrodynamic biases (Valdes and Price, 2000). When the NBSTs were first deployed in October
and June of 1997, the NBST collected fewer swimmers (factor of two to ten), smaller fluxes of
234Th fluxes (factor of three), and comparable mass, particulate organic carbon (POC), and
particulate organic nitrogen (PON) fluxes (factor of 1.2) (Buesseler et. al, 2000).
In June and September 2001, we deployed PITs and modified NBSTs, which had
improved ballasting capabilities, more sample tubes (n=6), and an improved closing mechanism.
We were particularly interested in whether particle sorting was occurring � were the PITs
collecting different particles than the NBSTs and thus though the total mass flux might be
comparable, the fluxes of specific elements different? Here we examined particle sorting by
comparing the total mass and the elemental fluxes (POC, PON, Si, Ca, Al, Ba, S, Mg, Sr, Fe,
Mn, Ni, Ti, P, and V) of material collected in both types of traps.
Methods
1. Sample Collection

4
Both a PIT array and one or two NBSTs were deployed from the R.V. Weatherbird II on
two separate occasions in the Sargasso Sea at the Bermuda Atlantic Time-series Study (BATS)
site (31°40�N, 64°10�W). The PIT array was of the standard cylindrical MultiPIT design (Knauer
et al., 1979) that is commonly used in many sediment trap studies including the US JGOFS time-
series studies at BATS and in Hawaii. The NBST and PIT had identical collection tubes (0.0039
m2 collection area). Each PIT had eight collection tubes mounted on the body, with baffles in
each tube. Each NBST had six collection tubes with baffles in each tube. Material from two
tubes from the NBST was analyzed for mass and major elements and material from two other
tubes from the NBST was analyzed for POC and PON.
In June 2001, one NBST was programmed to drift at 150 m. In September 2001, one
NBST drifted at 150 m and another drifted at 300 m. Details of NBST deployment procedures
are described elsewhere (Valdes and Price, 2000). On both cruises, within 1 km from the NBST
deployment site, PITs were deployed at 150 m, 200 m, and 300 m according to standard BATS
protocols (Knap et al., 1997). In June, the PIT and NBST were at a relative distance of 5.5 km at
recovery. In September, the PIT and the 150 m NBST were at a relative distance of 13.3 km and
the PIT and the 300 m NBST were at a relative distance of 15.3 km at recovery. The traps were
in the water for approximately three days before being recovered. In September, the NBSTs
came to the surface uncapped, which could cause loss of material. However, no visual indication
of brine loss was evident and the NBSTs actually collected more POC and PON than the PITs
suggesting that minimal loss occurred.
Horizontal flows were measured on the PIT array at a depth of 170 m using an Anderra
RCM style current meter. Data were stored at 2 minute intervals. Mean current speeds were 4 cm
s-1 with excursions up to 11 cm s-1 in June 2001 and 8 cm s-1 with excursions up to 15 cm s-1 in

5
September 2001. The horizontal flow across the NBST will be on the order of the rms vertical
shear over the 1.2 m length of the instrument. The flow should be weaker than 0.2 cm s-1, which
is less than 5% of the flow across the PIT (Valdes and Price, 2000).
In June, the mixed layer depth based on a 0.3 ºC change in temperature was 16 m, with a
mean temperature of 24ºC. In September, the mixed layer depth based on a 0.3 ºC change in
temperature was 40 m, with a mean temperature of 28 ºC. Profiles of nitrate, phosphate, silicate,
and primary productivity (measured through bottle experiments according to standard BATS
protocols) were similar in June and September (BATS data reports). Additional hydrodynamic
data from the June cruise (BATS cruise #153) and the September cruise (BATS cruise #156) are
available at http://www.bbsr.edu/cintoo/bats/bats.html.
2. Elemental Flux Analysis
Samples from the NBSTs and PITs were analyzed for a suite of elements (Si, Ca, Al, Ba,
S, Mg, Sr, Fe, Mn, Ni, Ti, P, and V). In all cases, one tube provided the material for one sample.
Swimmers were hand picked out of the sample under a microscope, according to standard BATS
protocols (Knap et al., 1997). The samples were then mailed to WHOI where the samples were
filtered by vacuum filtration onto pre-weighed acid-cleaned 25 mm 0.4 micron Nuclepore
membrane filters. The collected material was rinsed three times with Milli-Q water. After drying
in a 60°C oven for 24 hours or until a constant weight was reached, the filters were reweighed
and then digested for 15 minutes in 2.5 mL of ultrapure nitric acid, 2.5 mL of Milli-Q water, and
100 µL of ultrapure hydrofluoric acid in Teflon bombs in a 120°C microwave (Manganini et al.,
2002). The digested particle solutions were analyzed by standard curve with a commercially
available sector field ICP mass spectrometer (Element1, Thermo Finnigan MAT GmbH,

6
Bremen, Germany). Blank filters prepared alongside the filtering and analysis (but not exposed
to the sediment trap deployment or picking procedures) had element concentrations below 10%
of that of the concentrations of the September samples. Material from two tubes different from
those used for major element analysis was hand-picked for swimmers and then used for POC and
PON analysis, according to standard BATS protocols (Knap et al., 1997).
Nonparametric statistics were used to determine if differences observed in fluxes
measured in the NBSTs and the PITs were significant; the small number of samples precluded
the use of statistics based on normal or known distributions (such as the t-test). The
Kolmogorov-Smirnov test (Hollander and Wolfe, 1999), a two-tailed distribution-free test for
general differences in two populations, was used to determine if the difference between the
fluxes for any given element measured in the NBSTs vs. the fluxes of that element measured in
the PITs was significant. Due to the small sample size and discrete nature of the data, a
significance level of α =0.1 was chosen to detect possible important differences in the data. In
order to have the maximum number of samples (and thus the most reasonable statistics), we
compared the entire NBST data set for a given element in a given month (for example, NBST
September calcium fluxes at 150 m and 300 m) to the entire PIT data set for that element in that
month (PIT September calcium fluxes at 150 m, 200 m, and 300 m). We could not compare the
NBST data to the PIT data at each specific depth due to the small sample size.
Results
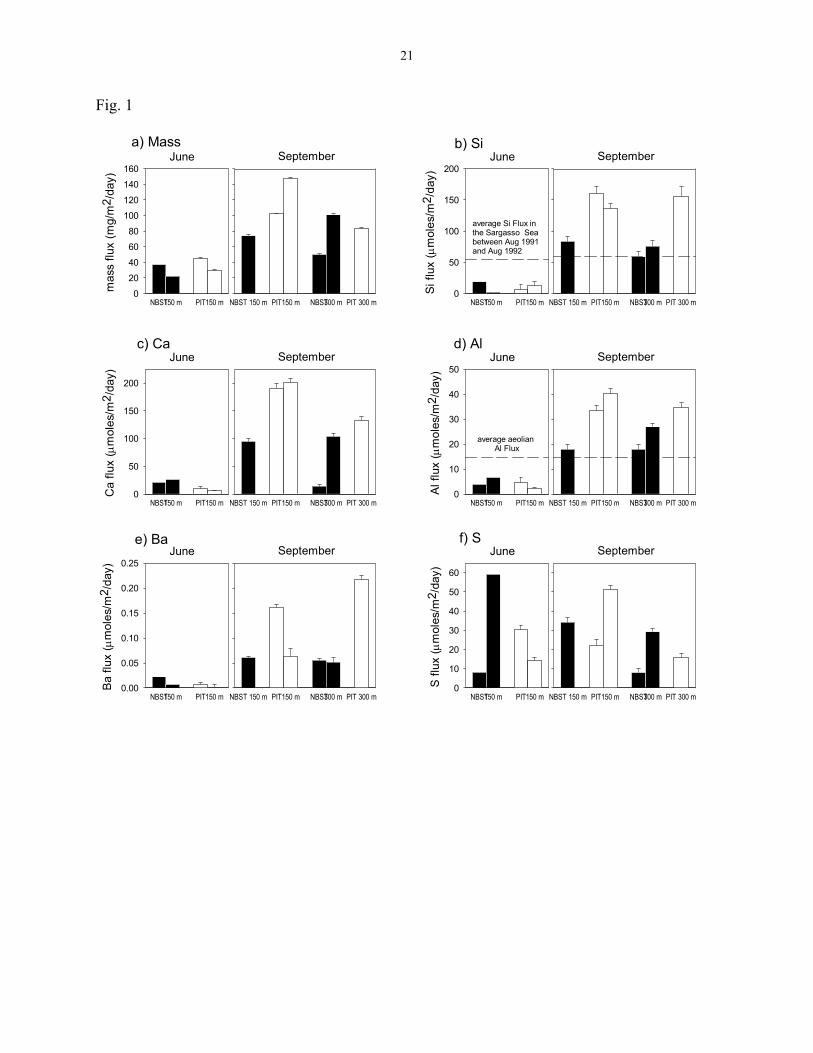
The mass flux was significantly larger (P=0.002; Kolmogorov-Smirnov test) in
September than in June but did not differ significantly when determined by NBSTs or by PITs

7
(Fig. 1a). Fluxes of Si, Ca, Al, and Ba were significantly larger (P=0.057) when determined by
the PITs than by the NBSTs in September and were significantly larger (P <0.02) in September
than in June (Fig. 1 and Table 1). The Si fluxes as determined by the NBSTs and the PITs were
on the same order as the Si fluxes measured by Brzezinski and Nelson (1995) in the Sargasso
Sea in August 1991 through August 1992 (average Si flux of 55 µmol/m2/day). The Al fluxes
we measured were on the same order as estimated annual Al aeolian fluxes in the Sargasso Sea
(Jickells, 1999). Fluxes of P, Ti, V, Fe, Mn, Sr, and Ni were all significantly smaller (P ≤0.03) in
June than in September and were comparable when determined by the NBSTs and by the PITs
(Table 1). Fluxes of S and Mg showed no significant differences in June or September or
between NBSTs or PITs (Fig. 1 and Table 1).
In June, one fish was found in each of the two NBST tubes designated for POC and PON
analysis. Since picking probably did not remove all the scales of the fish, we do not have
accurate data for POC or PON fluxes determined in June by the NBST1. In September, fluxes of
PON were significantly larger (P=0.03) when determined by the NBSTs than by the PITs (Table
1). The average PON flux in the September NBST 150 m and 300 m tubes was 0.25 mmoles m-2
day-1 whereas the average PON flux in the PIT 150 m and 300 m tubes was 0.15 mmoles m-2
day-1. The average of the September POC fluxes determined from the NBSTs (2.0 mmoles m-2
day-1) was not significantly different from the average of POC fluxes determined by the PITs
(1.8 mmoles m-2 day-1).
Microscopic inspection of the material collected in NBST and PITs revealed differences
in number and type of swimmers collected. For example, in September, the NBST at 300 m
collected a large number of amphipods and their eggs. Amphipods are known to associate with
1 There were no fish scales in the tubes designated for elemental analysis. Thus, fish scales did not contaminate the elemental and mass analyses.

8
marine snow particles (Steinberg et al.1994), so the collection of these animals suggests that the
NBST may be more efficient at collecting certain types of marine snow. Additionally, copper-
rich blue particles were found to be present only in material collected in the NBST (Stanley et
al., 2002).
Discussion
The assumption behind any sediment trap study is that the quantity and quality of
material collected over a given period is an accurate representation of the in-situ sinking particle
flux in the ocean. Differences in flux and composition of material collected by two traps of
differing designs suggest that this assumption may not always be valid (Gust et al., 1992;
Buesseler et al., 2000). In the upper ocean, the NBST should remove an expected hydrodynamic
bias related to the collection of slowly settling particles in a strong horizontal flow. In this study
both trap types indicated that we sampled a range of flux conditions with low flux in June and
moderate flux in September. Despite these gross similarities between the material collected in the
two trap types, our results indicate significant differences for specific components of the flux.
To interpret these differences, we first address the tube-to-tube variability common to this type
of sampling.
1. Consideration of variability between tubes
There was significant variability between the material collected in different collection
tubes from the same traps. For example, the mass fluxes often differed by almost a factor of two
between two tubes from the same trap (Fig. 1a). The tube-to-tube variability was at least equal to
the NBST vs. PIT variability for mass, POC, and PON. This variability needs to be taken into

9
consideration when differences between the material collected by the NBSTs and by the PITs are
interpreted. Statistical analysis based on the ordering or ranking of the data, such as the
Kolmogorov-Smirnov test, allows us to determine whether the differences between the material
collected in the NBSTs and the PITs are significant in spite of the tube-to-tube variability.
Variability between tubes is commonly seen in mass, POC, and PON fluxes collected
with PITs at BATS during the last decade (BATS data reports at
http://www.bbsr.edu/users/ctd/traplist.html). The variability is likely a reflection of the small
fluxes being collected; a random event that carries just a few more particles into one tube rather
than another can have a significant effect on the calculated flux. Hydrodynamic biases that
produce shading of certain tubes could be another cause of variability. However, since we see
the variability between tubes in both the NBSTs and the PITs, hydrodynamic biases are probably
not the cause. The variability indicates that in order to determine accurate fluxes, one needs
larger collection tubes, longer collection periods, and/or fluxes reported as the average of
material collected in many collection tubes. In many studies, multi-element and isotopic analyses
are not conducted from the same tube, thus complicating the interpretation of elemental or
isotopic comparisons.
2. Elemental Fluxes
The total mass flux, POC flux, and the fluxes of many elements (P, Ti, V, Fe, Sr, S, Mg,
Mn, Ni) did not differ significantly when determined by the NBSTs or by the PITs (Fig. 1, Table
1). The fact that the NBSTs and the PITs agree in some cases is good news for the trapping
community � perhaps hydrodynamic flow is not preventing sediment traps from being good

10
recorders of upper ocean export fluxes of many major carrier phases, at least in these conditions.
The currents, as measured on the PITs during these deployments, averaged 4 cm/s in June and 8
cm/s in September and were thus considerably less than the limit of 15 cm/s, below which PITs
are expected to give accurate estimates of particle flux (Gardner, 1980; Butman et al., 1986).
Elements that are primarily aeolian in origin (Al, Fe, Ti) and those that are primarily
biological in origin (P, Si, Ba) all show higher fluxes in September relative to June, suggesting
that the observed seasonal variability cannot be attributed solely to increased dust fluxes during
the September cruise or due to an increase in late summer productivity. This seasonal variability
in fluxes is not surprising, given that prior PITs data and deep trap data from BATS and other
locations show significant seasonal variability in total flux (Karl et al., 1996; Michaels and Knap,
1996, Conte et al., 2001).
One of the reasons we set out to test the effect of reducing horizontal flow to near zero
with the NBST was to see if hydrodynamic bias alone could account for the apparent C
imbalance at BATS (Michaels et al., 1994). These data indicate under these conditions, reducing
hydrodynamic biases does not increase collection efficiency by the factor of two or more needed
to close the C budget at BATS. How these results would compare at velocities above 15 cm s-1
or under conditions of differing source particle composition and sinking rates cannot be
determined from these data.
Even under these low flow conditions, fluxes of Si, Ca, Al and Ba as collected by the
PITs in September were significantly larger than those collected by the NBSTs. In contrast, the
flux of PON collected by the PITs was significantly smaller than the NBST PON flux. The ratios
of Si /Al, Ca /Al, and Ba /Al did not differ significantly between material collected in the NBSTs
and the PITs and between September and June (Fig. 2). This suggests that the differences seen in

11
Si, Al, Ca, and Ba fluxes between the NBSTs and the PITs may be due to carrier phases with
common hydrodynamic characteristics. The Ca/Al ratios measured in the sediment traps are
larger than the mean crustal ratio of 0.34 mole Ca/mole Al, suggesting the particles are not
simply aggregated aeolian particles. The Si, Ca, Al and Ba fluxes determined by the NBSTs may
differ from the fluxes determined by the PITs in September but not in June because of the
slightly higher currents in September or because of differences in the source particle
characteristics. Additionally, because fluxes are so low in June, it is analytically difficult to see
differences in fluxes between the two trap types.
These data bear on the issue of trap �calibration�. While first order corrections for over
or undercollection biases using radionuclide activity calibration can be made (Murray et al.,
1996; Hernes et al., 2001; Scholten et al., 2001; Yu et al., 2001), the data on particle sorting
suggests that different particle types may have different collection biases. For example, slowly
settling marine snow particles might be caught less efficiently than rapidly sinking fecal pellets
or planktonic tests under conditions of significant horizontal flow over the trap mouth. Which
fraction each radionuclide is tracking may be an issue. Particle sorting, therefore, complicates the
use of single calibration factors. Nevertheless, radionuclide calibration is still valuable � if traps
cannot be shown to quantitatively collect natural radionuclide fluxes without bias, than there is
good reason to question the accuracy of other elemental fluxes (Buesseler, 1991).
While we cannot prove from this data that the NBST is more accurate, the assumed
removal of a hydrodynamic bias in the NBST implies that the NBST data are more likely to be
representative of in situ fluxes. The differences in the fluxes of PON, Ca, Ba, Al and Si in
material collected in the NBST vs. in the PITs suggest particle sorting is occurring, most likely
due to hydrodynamic biases in the PITs. These data support the suggestion that sediment traps

12
of different designs lead to particle sorting and that for certain elements, this particle sorting can
lead to significant differences in estimates of upper ocean particle flux.
Acknowledgements
This work was supported by the NSF Chemical Oceanography program and by the
Department of Defense (graduate fellowship to RHRS). We would like to thank Rod Johnson,
Keven Neely, and Kevin Cloutter at BBSR, and John Andrews, Lary Ball, Steven Pike, James
Price, and Dave Schneider at WHOI for assistance. This is Woods Hole Oceanographic
Institution contribution #XXXX.

13
References
Brzezinski, M.A., Nelson, D.M., 1995. The annual silica cycle in the Sargasso Sea near
Bermuda. Deep-Sea Research I 42, 1215-1237.
Buat-Menard, P., Davies, J., Remoudaki, E., Miquel, J.C., Bergametti, G., Lambert, C.E., Ezat,
U., Quetel, C., La Rosa, J., Fowler, S.W., 1989. Non-steady-state biological removal of
atmospheric particles from Mediterranean surface waters. Nature 340, 131-134.
Buesseler, K.O., 1991.Do upper-ocean sediment traps provide an accurate record of particle
flux? Nature 353, 420-423.
Buesseler, K.O., Livingston, H.D., Honjo, S., Hay, B.J., Konuk, T., Kempe, S., 1990.
Scavenging and particle deposition in the southwestern Black Sea � evidence from Chernobyl
radiotracers. Deep-Sea Research 37, 413-430.
Buesseler, K.O., Michaels, A.F., Siegel, D.A., Knap, A.H., 1994. A three dimensional time-
dependent approach to calibrating sediment trap fluxes. Global Biogeochemical Cycles 12, 297-
310.
Buesseler, K.O., Steinberg, D.K., Michaels, A.F., Johnson, R.J., Andrews, J.E., Valdes, J.R.,
Price, J.F., 2000. A comparison of the quantity and quality of material caught in a neutrally
buoyant versus a surface-tethered sediment trap. Deep-Sea Research I 47, 277-294.
14
Butman, C.A., Grant, W.D., Stolzenbach, K.D., 1986. Predictions of sediment trap biases in
turbulent flows: a theoretical analysis based on observations from the literature. Journal of
Marine Research 44, 601-644.
Christian, J.R., Verschell, M.A., Murtugudde, R., Busalacchi, A.J., McClain, C.R., 2002.
Biogeochemical modeling of the tropical Pacific Ocean. I: Seasonal and interannual variability.
Deep-Sea Research II 49, 509-543.
Conte, M.H., Ralph, N., Ross, E.H., 2001. Seasonal and interannual variaibility in deep ocean
particle fluxes at the Oceanic Flux Program (OFP)/Bermuda Atlantic Time Series (BATS) site in
the Western Sargasso Sea near Bermuda. Deep Sea Research II 48, 1471-1505.
Eppley, R.W., Peterson, B.J., 1979. Particulate organic matter flux and planktonic new
production in the deep ocean. Nature 282,677-680.
Gardner, W.D., 1980. Sediment trap dynamics and calibration: a laboratory evaluation. Journal
of Marine Research 38, 17-39.
Gardner, W.D., 2000. Sediment trap technology and sampling in surface waters. In: Hanson,
R.B., Ducklow, H.W., Field, J.G. (Eds.), The Changing Ocean Carbon Cycle: midterm synthesis
of the Joint Global Ocean Flux Study. Cambridge University Press, pp. 240-281.
Gnanadesikan, A., 1999. A global model of silicon cycling: Sensitivity to eddy parameterization

15
and dissolution. Global Biogeochemical Cycles 13, 199-220.
Gust, G., Byrne, R.H., Bernstein, R.E., Betzer, P.R., Bowles, W., 1992. Particle fluxes and
moving fluids: experience from synchronous trap collections in the Sargasso Sea. Deep-Sea
Research I 41, 831-857.
Gust, G., Bowles, W., Giordano, S., Huettel, M., 1996. Particle accumulation in a cylindrical
sediment trap under laminar and turbulent steady flow: An experimental approach. Aquatic
Sciences 58, 297-326.
Hernes, P.J., Peterson, M.L., Murray, J.W., Wakeham, S.G., Lee, C., Hedges, J.I., 2001.
Particulate carbon and nitrogen fluxes and compositions in the central equatorial Pacific. Deep-
Sea Research I 48, 1999-2023.
Hollander, M., Wolfe, D.A., 1999. Nonparametric Statistical Methods. John Wiley & Sons, Inc.,
New York, pp.178-185.
Jickells, T.D., 1999. The inputs of dust derived elements to the Sargasso Sea; a synthesis. Marine
Chemistry 68, 5-14.
Karl, D.M., Christian, J.R., Dore, J.E., Hebel, D.V., Letelier, R.M., Tupas, L.M., Winn, C.D.,
1996. Seasonal and interannual variability in primary production and particle flux at
Station ALOHA. Deep-Sea Res. II 43, 539-568.
16
Knap, A.J., Michaels, A.F., Steinberg, D.K., et al., 1997. BATS Methods Manual, Version 4. US
JGOFS Planning Office, Woods Hole, MA.
Knauer, G.A., Martin, J.H., and Bruland, K.W., 1979. Fluxes of particulate carbon, nitrogen, and
phosphorus in the upper water column of the northeast Pacific. Deep-Sea Research 26, 97-108.
Knauer, G.A., Redalje, D.G., Harrison, W.G., Karl, D.M., 1990. New production at the
VERTEX time-series site. Deep-Sea Research 37, 1121-1134.
Livingston, H.D., Anderson, R.F., 1983. Large particle transport of plutonium and other fallout
radionuclides to the deep ocean. Nature 303, 228-231.
Manganini, S.J., Ball, L.A., Hayashi, K., Churchill, J.H., Stanley, R.H.R., Honjo. S., 2002. A
new rapid chemical method for analyzing Si, Ca, Al, and other elements in marine/freshwater
particles and sediments. Eos Transactions AGU 83 (4), Ocean Sciences Meeting Supplement,
Abstract OS21B-19.
Martin, J.H., Knauer, G.A., 1984. VERTEX: manganese transport through oxygen minima. Earth
and Planetary Science Letters 67, 35-47.
Martin, J.H., Knauer, G.A., Karl, D.M. Broenkow, W.W., 1987. VERTEX: carbon cycling in the
northeast Pacific. Deep-Sea Research 34, 267-285.
17
Michaels, A.F., Bates, N.R., Buesseler, K.O., Carlson, C.A., Knap, A.H., 1994. Carbon system
imbalances in the Sargasso Sea. Nature 372, 537-540.
Michaels, A.F. and Knap, A.H., 1996. Overview of the U.S. JGOFS Bermuda Atlantic Time-
series Study and the Hydrostation S program. Deep-Sea Research II 43, 157-198.
Murray, J.W., Young, J., Newton, J., Dunne, J., Chapin, R., Paul, B., 1996. Export flux of
particulate organic carbon from the central equatorial Pacific determined using a combined
drifting trap- 234Th approach. Deep-Sea Research II 43, 1093-1132.
Pace, M.L., Knauer, G.A., Karl D.M., Martin, J.H., 1987. Primary production, new production
and vertical flux in the eastern Pacific Ocean. Nature 325, 803-804.
Schlitzer, R., 2002. Carbon export fluxes in the Southern Ocean: results from inverse modeling
and comparison with satellite-based estimates. Deep-Sea Research II 49, 1623-1644.
Scholten, J.C., Fietzke, J., Vogler, S., van der Loeff, M.R., Mangini A., Koeve, W., Stoffers, P.,
Antia, A., Neuer, S., Waniek, J., 2001. Trapping efficiencies of sediment traps from the deep
eastern North Atlantic: The 230Th calibration. Deep-Sea Research II 48, 2383-2408.
Stanley, R.H.R., Buesseler, K.O., Steinberg, D.K., Andrews, J.E., Manganini S.J., Valdes, J.R.,
and Price, J.F. 2002. Understanding upper ocean particle flux: neutrally buoyant sediment traps

18
versus surface-tethered traps. Eos Transactions AGU 83 (4), Ocean Sciences Meeting
Supplement, Abstract OS211B-24.
Steinberg, D.K., M.W. Silver, S.L. Coale, C.H. Pilskaln, and J. Paduan. 1994. Midwater
zooplankton communities on pelagic detritus (giant larvacean houses) in Monterey Bay,
California. Limnology and Oceanography 39(7), 1606-1620.
Steinberg, D.K., Pilskaln, C.H., Silver, M.W., 1998. Contribution of zooplankton associated with
detritus to sediment trap �swimmer� carbon in Monterey Bay, CA. Marine Ecology Progress
Series 164, 157-166.
Steinberg, D.K., Carlson, C.A., Bates, N.R., Goldthwait, S.A., Madin, L.P. , Michaels, A.F.,
2000. Zooplankton vertical migration and the active transport of dissolved organic and inorganic
carbon in the Sargasso Sea. Deep-Sea Research I 47, 137-158.
Valdes, J.R, Price, J.F., 2000. A neutrally buoyant, upper ocean sediment trap. Journal of
Atmospheric and Oceanographic Technology 17, 62-68.
Yu, E.-F., Francios, R., Bacon, M.P., Honjo, S., Fleer, A.P., Manganini, S.J., van der Loeff,
M.M.R., Ittekot, V., 2001. Trapping efficiency of bottom-tethered sediment traps estimated from
the intercepted fluxes of 230Th and 231Pa. Deep-Sea Research I 48, 865-889.

19
Figure Captions
Fig. 1. Fluxes determined from material collected in the NBSTs (black) and the PITs (white) at
the depths indicated. Each bar represents the flux from one sampling tube. When two tubes from
the same trap and depth were analyzed, the first bar of the pair represents the flux in tube #1 and
the second bar represents the flux in tube #2. Error bars on the elemental fluxes reflect the
combined analytical error of the ICP-MS and the error due to subtraction of the filter blank. a)
Total mass flux. Error bars reflect the standard deviation of multiple weights of the same sample.
b) Si flux. The average Si flux between August 1991 and August 1992 is estimated from Fig. 6
of Brzezinski and Nelson (1995). c) Ca flux. d) Al flux. The average aeolian Al flux is from
Jickells (1999). e) Ba flux. f) S flux.
Fig. 2. Ratios of Si /Al, Ca /Al, and Ba /Al presented in the same way as the mass and elemental
fluxes. Dashed lines denote the crustal ratios on a µmole/µmole basis.

20
Tables
Table 1. Elemental fluxes as determined by NBSTs and PITs at the depths indicated in June and
September 2001. When more than one tube was analyzed from the same depth, all fluxes
determined are listed, with the first flux always corresponding to the first tube (and thus the first
bar on the bar graphs in Fig. 1). Horizontal lines divide the elements into four groups: (i) fluxes
in PITs in September significantly greater (P =0.057) than fluxes in NBSTs in September; (ii)
fluxes in NBSTs significantly greater (P =0.03) than fluxes in PITs (iii) fluxes comparable in
NBSTs and in PITs and fluxes significantly greater (P ≤0.03) in September than in June; (iv)
fluxes comparable in NBSTs and PITs and in September and in June.
June Flux (µmole m-2day-1)
September Flux (µmole m-2day-1)
Element NBST 150m PIT 150m NBST 150m PIT 150m NBST 300m PIT 300m
Si 19, 2 7, 13 83 161, 136 59, 76 155 Ca 21, 26 10, 6 95 190, 201 15, 104 132 Al 4, 7 5, 2 18 34, 40 18, 27 35 Ba 0.02, 0.01 0.01, 0.002 0.061 0.16, 0.063 0.056, 0.052 0.22
PON 0.21, 0.29 0.12, 0.26, 0.16, 0.17 0.23, 0.28 0.12, 0.09, 0.17 P 0.8, 1.1 1.4, 1.3 4.6 5.0, 4.4 3.2, 6.8 3.4 Ti 0.9, 0.3 0.2, 0.1 1.0 1.2, 1.0 2.2, 7.2 0.9 V 0.06, 0.01 0.01, 0.01 0.05 0.04, 0.04 0.03, 0.05 0.03 Fe 8, 3 3, 1 10 14, 18 12, 10 10 Mn 0.09, 0.05 0.06, 0.01 0.11 0.16, 0.16 0.13, 0.15 0.13 Sr 0.10, 0.21 0.08, 0.05 1.01 0.98, 0.54 0.09, 0.41 0.42 Ni 0.35, 0.07 0.07, 0.01 1.82 0.46, 0.47 0.59, 0.23 0.21
POC 2.1, 2.2 0.9, 2.2, 1.6, 1.2 1.7, 2.1 1.3, 1.0, 4.2 S 8, 59 30, 14 34 22, 51 8, 29 16
Mg 16, 97 59, 30 26 25, 79 11, 32 24
21
Fig. 1
June
NBST150 m PIT150 m
Ba
flux
( µm
oles
/m2 /
day)
0.00
0.05
0.10
0.15
0.20
0.25September
NBST 150 m PIT150 m NBST300 m PIT 300 m
e) Ba
June
NBST150 m PIT150 m
Al f
lux
(µm
oles
/m2 /
day)
0
10
20
30
40
50September
NBST 150 m PIT150 m NBST300 m PIT 300 m
d) Al
June
NBST150 m PIT150 m
Si f
lux
(µm
oles
/m2 /
day)
0
50
100
150
200September
NBST 150 m PIT150 m NBST300 m PIT 300 m
b) Si
June
NBST150 m PIT150 m
S fl
ux (µ
mol
es/m
2 /da
y)
0
10
20
30
40
50
60
September
NBST 150 m PIT150 m NBST300 m PIT 300 m
f) S
June
NBST150 m PIT150 m
Ca
flux
(µm
oles
/m2 /
day)
0
50
100
150
200
September
NBST 150 m PIT150 m NBST300 m PIT 300 m
c) Ca
June
NBST150 m PIT150 m
mas
s flu
x (m
g/m
2 /da
y)
0
20
40
60
80
100
120
140
160September
NBST 150 m PIT150 m NBST300 m PIT 300 m
a) Mass
average Si Flux in the Sargasso Sea between Aug 1991 and Aug 1992
average aeolian Al Flux

22
Fig. 2
June
NBST150 m PIT 150 mBa
flux
/ Al F
lux
( µm
ol B
a / µ
mol
Al)
0.000
0.002
0.004
0.006
0.008
0.010
June
NBST150 m PIT 150 mSi f
lux
/ Al F
lux
( µm
ol S
i / µ
mol
Al)
0
2
4
6
8
10September
NBST 150 m PIT 150 m NBST 300 m PIT 300 m
June
NBST150 m PIT 150 mCa
flux
/ Al F
lux
( µm
ol C
a / µ
mol
Al)
0
2
4
6
8
10September
NBST 150 m PIT 150 m NBST 300 m PIT 300 m
September
NBST 150 m PIT 150 m NBST 300 m PIT 300 m
a) Si / Al Flux Ratio
b) Ca / Al Flux Ratio
c) Ba / Al Flux Ratio
crustal ratio