Embed Size (px)
Citation preview

A Comparison of Low and High
Pressure Cold Spray Systems6/25/2019
Presented by Matt Siopis, PhD
UTRC Team Members: Mike Klecka, Matt Mordasky,
Tim Landry
Portions of this Research w ere sponsored by the Army Research Laboratories and w as accomplished under Cooperative
Agreement Number W911NF-15-2-0034-S9. The views and conclusions contained in this document are those of the authors
and should not be interpreted as representing the off icial policies, either expressed or implied, of the Army Research
Laboratory or the U.S. Government. The U.S. Government is authorized to reproduce and distribute reprints for government
purposes notw ithstanding any copyright notation herein.

Why Does the Cold Spray System Matter?
Application Requirements
Non-Structural: Dimensional restoration
Structural: Deposit needs to carry load
Cost
Capital Investment
Cost per Spray ($ / Volume)
Misc. Cold Spray System Requirements
Size, weight, etc.
Cost
StructuralNon-
Structural

Current UTC Business Needs
United Technologies Corporation
Pratt & Whitney
Aircraft Engines
Collins Aerospace
Aerostructures, Avionics, Interiors,
Mechanical Systems, Mission
Systems, and Power and controls
High Value Structural Repairs
Materials with High Strength and High Ductility

Cold Spray for Non-Structural & Structural Repair
StructuralNon-Structural
Spray Process Conditions
Typically for geometry restoration
Moderate strength
Low ductility (<1%)
Lower spray process conditions
Nitrogen
Feedstock/Powder
Pure metals or alloys
Blends with hard phase
Partial load carrying capability
High strength
Moderate to high ductility (>5%)
High spray process conditions
Helium, high pressure (>35 Bar)
Feedstock/Powder
Pure metals or alloys
Low
NitrogenHigh
Helium
Low
HeliumHigh
Nitrogen

Cold Spray Process Conditions
Powder Injection Site
Nozzle
TC TC
Main Gas
Path
Carrier Gas /
Powder
Main Gas
Path
Powder Accelerates
Substrate
• Pressurize and heat gas (Nitrogen or Helium)• Choke the flow and expand gas (Converging – Diverging Nozzle)• Inject powder upstream or downstream• Accelerate the powder using aerodynamic drag

Process Conditions
Process
Gas Selection 1 0 if N2, 1 if He Type 33
Pressure (bar) 40 Pressure (psi) 580
Gas Temperature (°C) 430
Standoff Distance (in) 1
Particle
Diameter
(um)
Impact Temp
(°c)
Impact Velocity
(m/s)
Critical
Velocity
Ratio
Nozzle Dimensions
Mach Number
at nozzle inlet 104.6 387 662 1.3
Throat Diameter (in) 0.078 0.028 Vp, m/s (at impact) 662 88 376 726 1.4
Exit Diameter (in) 0.196
Expanding
Length (in) Tp, C (at impact) 387 73.99 362 794 1.5
Entrance Diameter (in) 0.350 4.327 62.22 346 867 1.5
Converging Length (in) 0.393
Expanding
Angle (2Q)
Degrees Ve, m/s (at nozzle exit) 628 52.32 326 944 1.6
Area Ratio 6.31 1.562 Te, C (at nozzle exit) 391 44 304 1025 1.7
Overall Length 4.72 37 280 1109 1.8
31.11 254 1195 1.9
26.16 230 1283 1.9
Average CVR 22 210 1371 2.0
Powder Information 1.805 18.5 197 1459 2.1
Particle density (g/cc) 2.64 Critical Velocity (m/s) 519 15.55 196 1543 2.2
Particle Specific Heat, Cp J/kg-K 910 Critical Veocity Ratio 1.2742 Average Velocity 13.08 210 1623 2.4
Particle Size (microns) 104.6
Max Particle
Temperature (°C) 430 1143 11 239 1696 2.6
UTS (Mpa) 290 UTS (ksi) Erosion Velocity (m/s) 1038
Melting Point (°c) 630 42.1 Erosion Velocity Ratio 0.637Average
Temperature
271
Size %chan
Normalized
Fraction
104.6 0.1 0.001
87.99 0.61 0.006
Injection Powder Temperature (°c) 565 73.99 1.44 0.014
Initial Powder Temperature (°c) 430 62.22 3.49 0.035
52.32 8.03 0.080
44 15.7 0.157
AR / DL 1.459271303 37 22.94 0.229
31.11 22.77 0.228
26.16 14.83 0.148
22 6.71 0.067
18.5 2.42 0.024
Material being sprayed 15.55 0.83 0.008
5056 2.64 630 290 910 13.08 0.13 0.001
11 0 0.000
total of % 100
* #'s read off microtrac graph
Powder Distribution
for Averages*
Data Output
0.000
0.050
0.100
0.150
0.200
0.250
0.0
0.5
1.0
1.5
2.0
2.5
3.0
0 20 40 60 80 100
Cri
tica
l V
elo
city
Rat
io
Paticle Diameter (um)
Critical Velocity Ratio
Material
Type 24 K-TechLong
0.078 x 0.25 x 6
0.078 x 0.11 x
Type 33 Innovati 0.068 x 0.2 x 6
Not Used
Apply
Downstream
Injection
Remove
Downstream
Injection
-5
-4
-3
-2
-1
0
0
200
400
600
800
1000
1200
0.00 0.10 0.20 0.30 0.40
m/s
& d
eg
ree
K
nozzle axis, meters
particle velocity particle temp nozzle exit gas velocity gas temp Upper Nozzle
Process
Gas Selection 1 0 if N2, 1 if He Type 33
Pressure (bar) 40 Pressure (psi) 580
Gas Temperature (°C) 430
Standoff Distance (in) 1
Particle
Diameter
(um)
Impact Temp
(°c)
Impact Velocity
(m/s)
Critical
Velocity
Ratio
Nozzle Dimensions
Mach Number
at nozzle inlet 104.6 387 662 1.3
Throat Diameter (in) 0.078 0.028 Vp, m/s (at impact) 662 88 376 726 1.4
Exit Diameter (in) 0.196
Expanding
Length (in) Tp, C (at impact) 387 73.99 362 794 1.5
Entrance Diameter (in) 0.350 4.327 62.22 346 867 1.5
Converging Length (in) 0.393
Expanding
Angle (2Q)
Degrees Ve, m/s (at nozzle exit) 628 52.32 326 944 1.6
Area Ratio 6.31 1.562 Te, C (at nozzle exit) 391 44 304 1025 1.7
Overall Length 4.72 37 280 1109 1.8
31.11 254 1195 1.9
26.16 230 1283 1.9
Average CVR 22 210 1371 2.0
Powder Information 1.805 18.5 197 1459 2.1
Particle density (g/cc) 2.64 Critical Velocity (m/s) 519 15.55 196 1543 2.2
Particle Specific Heat, Cp J/kg-K 910 Critical Veocity Ratio 1.2742 Average Velocity 13.08 210 1623 2.4
Particle Size (microns) 104.6
Max Particle
Temperature (°C) 430 1143 11 239 1696 2.6
UTS (Mpa) 290 UTS (ksi) Erosion Velocity (m/s) 1038
Melting Point (°c) 630 42.1 Erosion Velocity Ratio 0.637Average
Temperature
271
Size %chan
Normalized
Fraction
104.6 0.1 0.001
87.99 0.61 0.006
Injection Powder Temperature (°c) 565 73.99 1.44 0.014
Initial Powder Temperature (°c) 430 62.22 3.49 0.035
52.32 8.03 0.080
44 15.7 0.157
AR / DL 1.459271303 37 22.94 0.229
31.11 22.77 0.228
26.16 14.83 0.148
22 6.71 0.067
18.5 2.42 0.024
Material being sprayed 15.55 0.83 0.008
5056 2.64 630 290 910 13.08 0.13 0.001
11 0 0.000
total of % 100
* #'s read off microtrac graph
Powder Distribution
for Averages*
Data Output
0.000
0.050
0.100
0.150
0.200
0.250
0.0
0.5
1.0
1.5
2.0
2.5
3.0
0 20 40 60 80 100
Cri
tica
l V
elo
city
Rat
io
Paticle Diameter (um)
Critical Velocity Ratio
Material
Type 24 K-TechLong
0.078 x 0.25 x 6
0.078 x 0.11 x
Type 33 Innovati 0.068 x 0.2 x 6
Not Used
Apply
Downstream Injection
Remove
Downstream Injection
-5
-4
-3
-2
-1
0
0
200
400
600
800
1000
1200
0.00 0.10 0.20 0.30 0.40
m/s
& d
eg
ree
Knozzle axis, meters
particle velocity particle temp nozzle exit gas velocity gas temp Upper Nozzle
Process
Gas Selection 1 0 if N2, 1 if He Type 33
Pressure (bar) 40 Pressure (psi) 580
Gas Temperature (°C) 430
Standoff Distance (in) 1
Particle
Diameter
(um)
Impact Temp
(°c)
Impact Velocity
(m/s)
Critical
Velocity
Ratio
Nozzle Dimensions
Mach Number
at nozzle inlet 104.6 387 662 1.3
Throat Diameter (in) 0.078 0.028 Vp, m/s (at impact) 662 88 376 726 1.4
Exit Diameter (in) 0.196
Expanding
Length (in) Tp, C (at impact) 387 73.99 362 794 1.5
Entrance Diameter (in) 0.350 4.327 62.22 346 867 1.5
Converging Length (in) 0.393
Expanding
Angle (2Q)
Degrees Ve, m/s (at nozzle exit) 628 52.32 326 944 1.6
Area Ratio 6.31 1.562 Te, C (at nozzle exit) 391 44 304 1025 1.7
Overall Length 4.72 37 280 1109 1.8
31.11 254 1195 1.9
26.16 230 1283 1.9
Average CVR 22 210 1371 2.0
Powder Information 1.805 18.5 197 1459 2.1
Particle density (g/cc) 2.64 Critical Velocity (m/s) 519 15.55 196 1543 2.2
Particle Specific Heat, Cp J/kg-K 910 Critical Veocity Ratio 1.2742 Average Velocity 13.08 210 1623 2.4
Particle Size (microns) 104.6
Max Particle
Temperature (°C) 430 1143 11 239 1696 2.6
UTS (Mpa) 290 UTS (ksi) Erosion Velocity (m/s) 1038
Melting Point (°c) 630 42.1 Erosion Velocity Ratio 0.637Average
Temperature
271
Size %chan
Normalized
Fraction
104.6 0.1 0.001
87.99 0.61 0.006
Injection Powder Temperature (°c) 565 73.99 1.44 0.014
Initial Powder Temperature (°c) 430 62.22 3.49 0.035
52.32 8.03 0.080
44 15.7 0.157
AR / DL 1.459271303 37 22.94 0.229
31.11 22.77 0.228
26.16 14.83 0.148
22 6.71 0.067
18.5 2.42 0.024
Material being sprayed 15.55 0.83 0.008
5056 2.64 630 290 910 13.08 0.13 0.001
11 0 0.000
total of % 100
* #'s read off microtrac graph
Powder Distribution
for Averages*
Data Output
0.000
0.050
0.100
0.150
0.200
0.250
0.0
0.5
1.0
1.5
2.0
2.5
3.0
0 20 40 60 80 100
Crit
ical
Vel
ocit
y Ra
tio
Paticle Diameter (um)
Critical Velocity Ratio
Material
Type 24 K-TechLong
0.078 x 0.25 x 6
0.078 x 0.11 x
Type 33 Innovati 0.068 x 0.2 x 6
Not Used
Apply
Downstream Injection
Remove
Downstream Injection
-5
-4
-3
-2
-1
0
0
200
400
600
800
1000
1200
0.00 0.10 0.20 0.30 0.40
m/s
& d
eg
ree
K
nozzle axis, meters
particle velocity particle temp nozzle exit gas velocity gas temp Upper Nozzle
Impact Velocity & Temperature
Particle Velocity CalculatorPowder Particle
Distribution
Impact velocity and temperature are controlled by process conditions, nozzle geometry, powder material properties and particle size distribution

• CVR is equivalent to the term, η which is used
in numerous German Cold Spray publications • CVR > 1.0 can be correlated to improved
ductility in Cold Spray aluminum alloys
Critical Velocity Ratio
T. Schmidt, F. Gartner, H. Assadi, and H. Kreye, Development of a
Generalized Parameter Window for Cold Spray Deposition, Acta
Mater., 51 (2003) 4379-4394.
CVR =𝑉𝑖𝑚𝑝𝑎𝑐𝑡
𝑉𝑐𝑟𝑖𝑡𝑖𝑐𝑎𝑙
σUTS Ultimate Tensile Strength
ρ Density
Ti Impact Temperature
TMP Melting Point
CP Specific Heat
F1, F2 Empirical Factors
CVR > 1.0
Critical Velocity Critical Velocity Ratio

Critical Velocity Ratio & Mechanical Properties
Compiled Aluminum Alloy Data
2xxx, 5xxx, 6xxx, 7xxx series
Powder Feedstock
Preprocessed (HT, Classified)
Critical Velocity Ratio (CVR)
= 1.0 results in bonding
> 1.0 improved ductility
Structural Repair
Higher CVRs, >1.21
Compiled Data from Cold Sprayed Aluminum Alloys

Case Study: Cold Spray for Structural Repair Compare three Cold Spray OEM systems
Centerline
Inovati
VRC Metal Systems
Assumptions
Spraying a 6061 aluminum alloy for structural repair
Material has been preprocessed and classified
Process gas is Helium
Nozzle geometry is defined by each OEM
Process temperature is limited by nozzle material, PBI at 450°C
Process pressure is limited by OEM system capability
Evaluate Critical Velocity Ratio capability and cost of each system
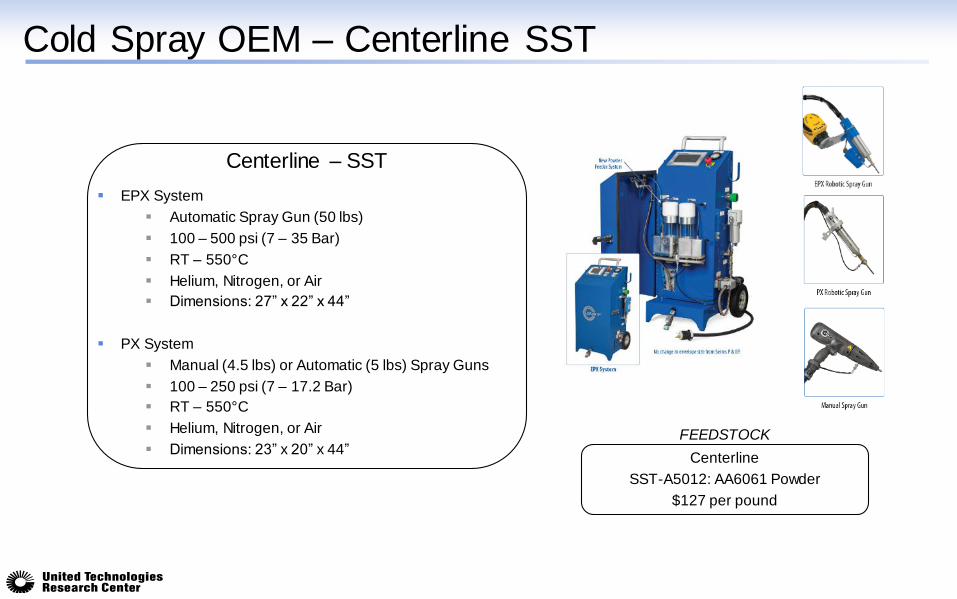
EPX System
Automatic Spray Gun (50 lbs)
100 – 500 psi (7 – 35 Bar)
RT – 550°C
Helium, Nitrogen, or Air
Dimensions: 27” x 22” x 44”
PX System
Manual (4.5 lbs) or Automatic (5 lbs) Spray Guns
100 – 250 psi (7 – 17.2 Bar)
RT – 550°C
Helium, Nitrogen, or Air
Dimensions: 23” x 20” x 44”
Cold Spray OEM – Centerline SST
Centerline – SST
Centerline
SST-A5012: AA6061 Powder
$127 per pound
FEEDSTOCK

KM Coating Development System – HDR
KM Raster Gun (5 lbs)
50 – 130 psig (3.4 – 9 Bar)
RT – 1000°C
Helium, Nitrogen, or He/N2 mixture
Spray Enclosure
Dimensions: 62” x 62” x 76”
Cold Spray OEM – Inovati
Inovati
FEEDSTOCK
Inovati
6061 Powder
$126 per pound

Gen III
Nozzle Applicator (4.4 lbs)
80 – 1000 psig (5.5 – 69 Bar)
RT – 800°C @ heater
Helium or Nitrogen
Dimensions: 72” x 34” x 72”
Raptor
Nozzle Applicator (4.4 lbs)
80 – 1000 psig (5.5 – 69 Bar)
RT – 800°C @ heater
Helium or Nitrogen
Dimensions: 68” x 32” x 65”
Dragon Fly
Nozzle Applicator (4.4 lbs)
80 – 1000 psig (5.5 – 69 Bar)
RT – 800°C @ heater
Helium or Nitrogen
Dimensions: 12” x 22” x 40” (2x)
28” x 16” x 13” (1x)
Cold Spray OEM – VRC Metal Systems
Solvus Global – Powders on Demand
SAAM-AL6061-G1H1
$125 per pound
VRC Metal Systems
FEEDSTOCK
Raptor Dragon Fly
Gen III

Cold Spray System vs. CVR, Helium
Cold Sprayed Aluminum Alloys
CVR of 1.13, ~3% elongation
CVR of 1.23, ~5% elongation
CVR of 1.36, ~10% elongation
5%
3%
10%

Cold Spray System vs. CVR, Helium vs. Nitrogen
Cold Sprayed Aluminum Alloys
CVR of 1.13, ~3% elongation
CVR of 1.23, ~5% elongation
CVR of 1.36, ~10% elongation
5%
3%
10%
Nitrogen
Helium

Cold Spray System CVR vs. Cost
Inovati
KM CDS
Centerline
EPX
VRC
Dragon Fly
VRC
Raptor
VRC
Gen III
Cold Sprayed Aluminum Alloys
CVR of 1.13, ~3% elongation
CVR of 1.23, ~5% elongation
CVR of 1.36, ~10% elongation
5%
3%
10%

Summary
There is a need for structural repair of high value aerospace parts
Spray process conditions and powder feedstock are key to structural
repair
High pressure cold spray systems are necessary to achieve the CVRs
(critical velocity ratios) required for structural repair
Cold spray system capability and capital cost should be considered
before purchasing a system

Thank You