Embed Size (px)
Citation preview

June 1998
NASA/TM-1998-208420AFDD/TR-98-A-003
A Comparison of InteractionalAerodynamics Methods for a Helicopterin Low Speed Flight
John D. BerryU.S. Army Aviation and Missile CommandAeroflightdynamics DirectorateJoint Research Program OfficeLangley Research Center, Hampton, Virginia
Victor Letnikov and Irena BavykinaMil Moscow Helicopter PlantMoscow, Russia
Mark S. ChaffinLockheed Martin Engineering & SciencesHampton, Virginia

The NASA STI Program Office ... in Profile
Since its founding, NASA has been dedicatedto the advancement of aeronautics and spacescience. The NASA Scientific and TechnicalInformation (STI) Program Office plays a keypart in helping NASA maintain thisimportant role.
The NASA STI Program Office is operated byLangley Research Center, the lead center forNASAÕs scientific and technical information.The NASA STI Program Office providesaccess to the NASA STI Database, thelargest collection of aeronautical and spacescience STI in the world. The Program Officeis also NASAÕs institutional mechanism fordisseminating the results of its research anddevelopment activities. These results arepublished by NASA in the NASA STI ReportSeries, which includes the following reporttypes: · TECHNICAL PUBLICATION. Reports of
completed research or a major significantphase of research that present the resultsof NASA programs and include extensivedata or theoretical analysis. Includescompilations of significant scientific andtechnical data and information deemedto be of continuing reference value. NASAcounter-part of peer reviewed formalprofessional papers, but having lessstringent limitations on manuscriptlength and extent of graphicpresentations.
· TECHNICAL MEMORANDUM.
Scientific and technical findings that arepreliminary or of specialized interest,e.g., quick release reports, workingpapers, and bibliographies that containminimal annotation. Does not containextensive analysis.
· CONTRACTOR REPORT. Scientific and
technical findings by NASA-sponsoredcontractors and grantees.
· CONFERENCE PUBLICATION.
Collected papers from scientific andtechnical conferences, symposia,seminars, or other meetings sponsored orco-sponsored by NASA.
· SPECIAL PUBLICATION. Scientific,
technical, or historical information fromNASA programs, projects, and missions,often concerned with subjects havingsubstantial public interest.
· TECHNICAL TRANSLATION. English-
language translations of foreign scientificand technical material pertinent toNASAÕs mission.
Specialized services that help round out theSTI Program OfficeÕs diverse offerings includecreating custom thesauri, building customizeddatabases, organizing and publishingresearch results ... even providing videos.
For more information about the NASA STIProgram Office, see the following:
· Access the NASA STI Program HomePage at http://www.sti.nasa.gov
· E-mail your question via the Internet to
[email protected] · Fax your question to the NASA Access
Help Desk at (301) 621-0134 · Phone the NASA Access Help Desk at
(301) 621-0390 · Write to:
NASA Access Help Desk NASA Center for AeroSpace Information 7121 Standard Drive Hanover, MD 21076-1320

National Aeronautics andSpace Administration
Langley Research CenterHampton, Virginia 23681-2199
June 1998
NASA/TM-1998-208420AFDD/TR-98-A-003
A Comparison of InteractionalAerodynamics Methods for a Helicopterin Low Speed Flight
John D. BerryU.S. Army Aviation and Missile CommandAeroflightdynamics DirectorateJoint Research Program OfficeLangley Research Center, Hampton, Virginia
Victor Letnikov and Irena BavykinaMil Moscow Helicopter PlantMoscow, Russia
Mark S. ChaffinLockheed Martin Engineering & SciencesHampton, Virginia

Available from the following:
NASA Center for AeroSpace Information (CASI) National Technical Information Service (NTIS)7121 Standard Drive 5285 Port Royal RoadHanover, MD 21076-1320 Springfield, VA 22161-2171(301) 621-0390 (703) 487-4650
1
AbstractRecent advances in computing subsonic flowhave been applied to helicopter configurationswith various degrees of success. This paper is acomparison of two specific methods applied to aparticularly challenging regime of helicopterflight, very low speeds, where the interaction ofthe rotor wake and the fuselage are mostsignificant. Comparisons are made betweendifferent methods of predicting the interactionalaerodynamics associated with a simple generichelicopter configuration. These comparisons aremade using fuselage pressure data from a Mach-scaled powered model helicopter with a rotordiameter of approximately 10 feet. The datashown are for an advance ratio of 0.05 with athrust coefficient of 0.0066. The results of thiscomparison show that in this type of complexflow both analytical techniques have regionswhere they are more accurate in matching theexperimental data.
IntroductionRotorcraft configurations have always presenteda challenge to the accurate prediction of vehicleaerodynamic performance. Complex liftingsurfaces operating in a characteristicallyunsteady environment present challengeenough, but coupling this flow with the shapescommon to helicopter fuselages amplifies thecomplexity. Often the prediction of isolated rotoraerodynamics is coupled using superpositionwith linear aerodynamic fuselage analyses ormeasured isolated fuselage data. Previousstudies (reference 1 and 2) of completehelicopter configurations have shownweaknesses in the linear superpositionassumptions commonly used in the designcycle. However, accurate models for thecomplex aerodynamic interactions between therotor and the fuselage have not been developedas general tools available to the helicopterdesigner.
Non-linear interaction effects arise in theaerodynamics of helicopter configurations inseveral cases. Among these cases clearly thewake of the rotor affects the fuselage onset flow.The wake geometry in most inflow models isassumed to be undisturbed by the fuselage.The wake does distort due to the presence ofthe fuselage. This distortion increases as thewake skew angle decreases (at lower speeds
where the wake washes over the body). Theinfluence of the fuselage on the inflow to therotor is also potentially significant. The additionalinflow distortion to the presence of the fuselageproduces a change in the aerodynamics of theblades. This effect changes the strength of theshed wake and contributes to additionaldistortion of the wake.
NotationCt Thrust Coefficient, thrust/(density x disk
area x tip speed x tip speed), where thrustis the force normal to the plane of the rotor
Cp Pressure Coefficient, (pressure - freestream pressure)/free stream dynamicpressure
R Radius of the rotor, 62 in (1.574 m )
X Downstream length, in.
Y Lateral distance, in.
Z Vertical length, in.
A1s Longitudinal Flapping angle, degrees
Experimental DataThe Langley 14- by 22-Foot SubsonicTunnel
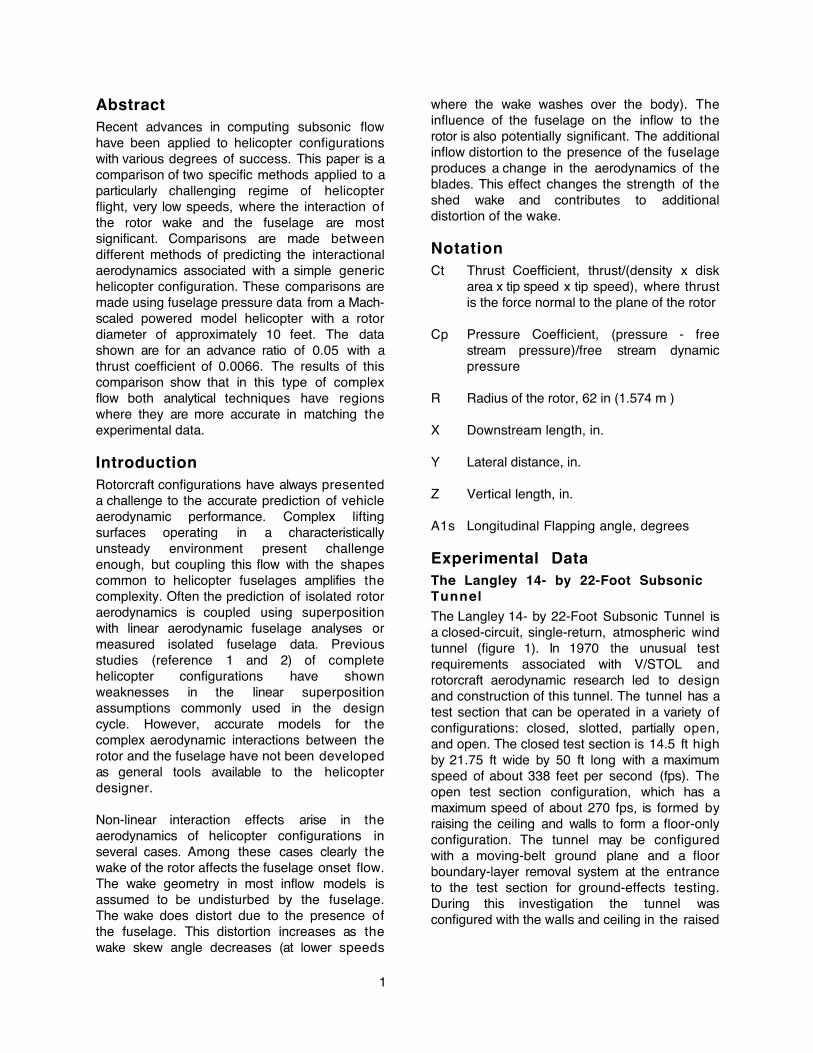
The Langley 14- by 22-Foot Subsonic Tunnel isa closed-circuit, single-return, atmospheric windtunnel (figure 1). In 1970 the unusual testrequirements associated with V/STOL androtorcraft aerodynamic research led to designand construction of this tunnel. The tunnel has atest section that can be operated in a variety ofconfigurations: closed, slotted, partially open,and open. The closed test section is 14.5 ft highby 21.75 ft wide by 50 ft long with a maximumspeed of about 338 feet per second (fps). Theopen test section configuration, which has amaximum speed of about 270 fps, is formed byraising the ceiling and walls to form a floor-onlyconfiguration. The tunnel may be configuredwith a moving-belt ground plane and a floorboundary-layer removal system at the entranceto the test section for ground-effects testing.During this investigation the tunnel wasconfigured with the walls and ceiling in the raised
2
position to improve the quality of the low speedflow.
Figure 1: Langley 14- by 22-Foot SubsonicTunnel
The tunnel is equipped with an on-line static datareduction system that can display computedaerodynamic coefficients with interactions andwall interference corrections in real time. Thetunnel has support, drive, and instrumentation tofacilitate powered rotorcraft testing and has beenused for rotorcraft investigations since itsinception. In addition, the tunnel has flow-visualization and acoustic testing capabilities.
Rotor Test System
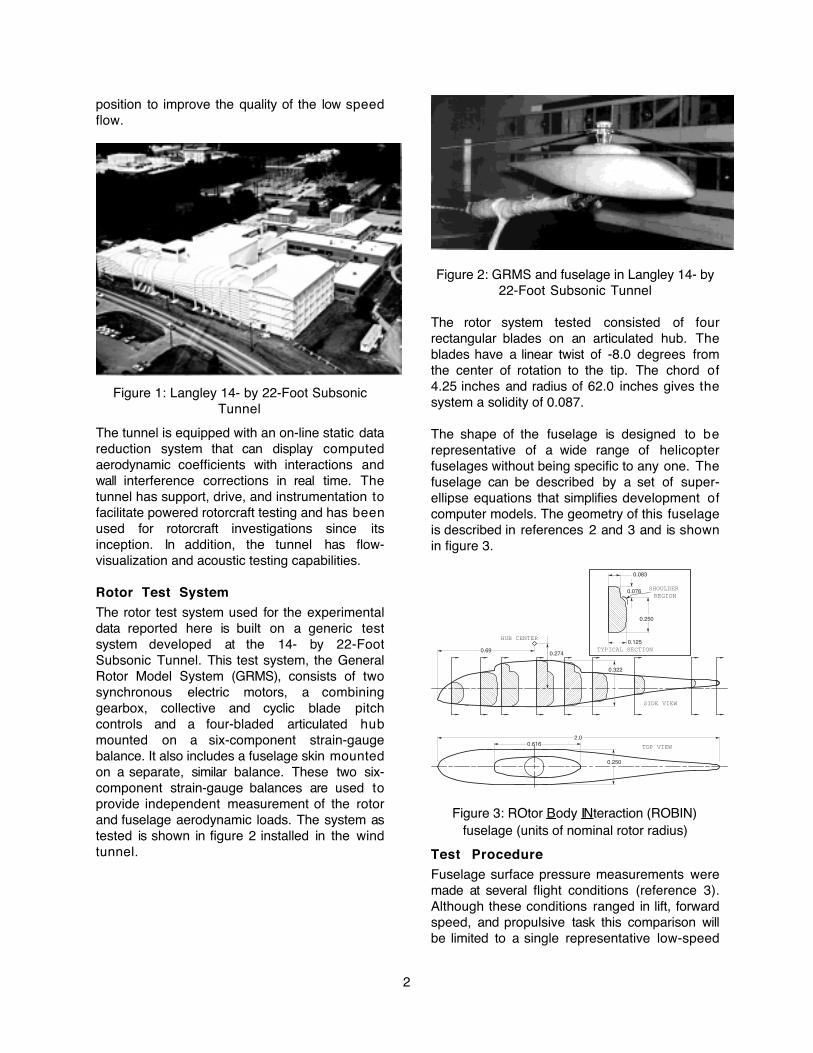
The rotor test system used for the experimentaldata reported here is built on a generic testsystem developed at the 14- by 22-FootSubsonic Tunnel. This test system, the GeneralRotor Model System (GRMS), consists of twosynchronous electric motors, a combininggearbox, collective and cyclic blade pitchcontrols and a four-bladed articulated hubmounted on a six-component strain-gaugebalance. It also includes a fuselage skin mountedon a separate, similar balance. These two six-component strain-gauge balances are used toprovide independent measurement of the rotorand fuselage aerodynamic loads. The system astested is shown in figure 2 installed in the windtunnel.
Figure 2: GRMS and fuselage in Langley 14- by22-Foot Subsonic Tunnel
The rotor system tested consisted of fourrectangular blades on an articulated hub. Theblades have a linear twist of -8.0 degrees fromthe center of rotation to the tip. The chord of4.25 inches and radius of 62.0 inches gives thesystem a solidity of 0.087.
The shape of the fuselage is designed to berepresentative of a wide range of helicopterfuselages without being specific to any one. Thefuselage can be described by a set of super-ellipse equations that simplifies development ofcomputer models. The geometry of this fuselageis described in references 2 and 3 and is shownin figure 3.
0.250
0.083
SIDE VIEW
TOP VIEW
TYPICAL SECTION
0.250
0.322
0.076
HUB CENTER
2.00.616
0.69 0.274
0.125
SHOULDERREGION
Figure 3: ROtor B ody IN teraction (ROBIN)fuselage (units of nominal rotor radius)
Test Procedure
Fuselage surface pressure measurements weremade at several flight conditions (reference 3).Although these conditions ranged in lift, forwardspeed, and propulsive task this comparison willbe limited to a single representative low-speed

3
condition. The advance ratio for thisrepresentative condition was 0.05. A non-dimensional thrust coefficient of 0.0066 was setwith a shaft angle of -2.0 degrees relative to thefree-stream. The rotor tip speed was 649 feetper second. The rotor cyclic controls weretrimmed to reduce once-per-revolution flappingof the rotor blades with respect to the rotor shaftto -0.8 degrees of longitudinal flapping and 0.07degrees of lateral flapping.
Pressure measurements were made using anarray of scanning pressure transducers.Pressure taps were arranged in strips of taps atconstant X stations. Only the average pressurevalues could be obtained with theinstrumentation available during thisinvestigation. The helicopter model is mountedon a sting support system that fits to the bottomof the fuselage and trails the model.
Computational MethodsTwo methods of computing the interaction of thehelicopter rotor and its wake with the fuselagewill be shown in this work. The first method isbased on techniques that model the flowsassociated with the helicopter. This method hasbeen developed by Mil using models developedfor the analysis of helicopter flows (reference 4).The second method shown is based on thesolution of the Navier-Stokes equations for theflow. The effect of the rotor in this method isapproximated using a Òpressure jumpÓ boundarycondition at the rotor disk. This method hasbeen developed by the AeroflightdynamicsDirectorate (AFDD) of the US Army (reference 5).
Mil Method
This work presents some results of the study offlow over a helicopter fuselage at the lowhorizontal velocity condition with the influence ofthe main rotor. In these calculations allowanceswere made for wake contraction and for variabilityof convection velocity of free vortices. Anassumption was made that the free vortices weremoving down with a velocity averaged overazimuth. However this average velocity varieswith blade radius and according to the verticaldistance from the rotation plane of the rotor.Other details of this method are described inreference 4.
The method shown here is computed insequence on personal-computer class ofworkstations. As such, this method could beincorporated in a comprehensive helicopteranalysis to be a computationally efficient methodfor simulation of the aerodynamic influence of arotor-fuselage configuration. Solutions from thismethod have been provided without an estimateof the actual computer time required. Six mainsub-programs are used in this method.
1. The main program that starts and links to therest of the programs.
2. A sub-program to provide the discretegeometry of the fuselage surface and its wake inthe case where the flow separates at the aft endof the fuselage.
3. A sub-program for the approximation of thewake shape when separating at the aft of thefuselage using the method described inreference 6.
4. A sub-program for calculating the flow over thefuselage.
5. A sub-program to determine the velocitiesinduced by the fuselage and its wake at anypoint in space.
6. A sub-program to calculate the streamlines onthe fuselage surface.
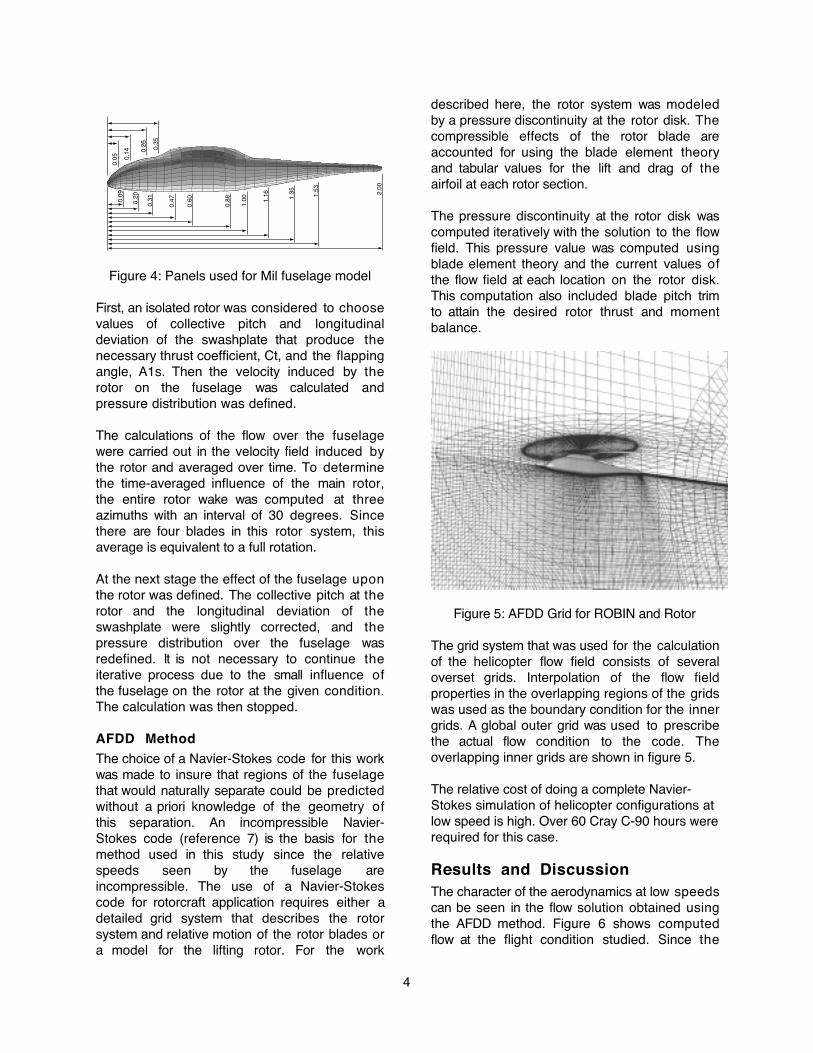
The fuselage geometry is broken down intopanels using an automated procedure. Theresulting panels for the Mil calculation are shownin figure 4 along with the experimental presuremeasurement stations. Interpolation is requiredbetween the computed surface pressures at thepanel centers to the locations of the measuredpressures.
4
0.05
0.09
0.14
0.20
0.26
0.31
0.35
0.47
0.60
0.88
1.00 1.16 1.35 1.53 2.00
Figure 4: Panels used for Mil fuselage model
First, an isolated rotor was considered to choosevalues of collective pitch and longitudinaldeviation of the swashplate that produce thenecessary thrust coefficient, Ct, and the flappingangle, A1s. Then the velocity induced by therotor on the fuselage was calculated andpressure distribution was defined.
The calculations of the flow over the fuselagewere carried out in the velocity field induced bythe rotor and averaged over time. To determinethe time-averaged influence of the main rotor,the entire rotor wake was computed at threeazimuths with an interval of 30 degrees. Sincethere are four blades in this rotor system, thisaverage is equivalent to a full rotation.
At the next stage the effect of the fuselage uponthe rotor was defined. The collective pitch at therotor and the longitudinal deviation of theswashplate were slightly corrected, and thepressure distribution over the fuselage wasredefined. It is not necessary to continue theiterative process due to the small influence ofthe fuselage on the rotor at the given condition.The calculation was then stopped.
AFDD Method
The choice of a Navier-Stokes code for this workwas made to insure that regions of the fuselagethat would naturally separate could be predictedwithout a priori knowledge of the geometry ofthis separation. An incompressible Navier-Stokes code (reference 7) is the basis for themethod used in this study since the relativespeeds seen by the fuselage areincompressible. The use of a Navier-Stokescode for rotorcraft application requires either adetailed grid system that describes the rotorsystem and relative motion of the rotor blades ora model for the lifting rotor. For the work
described here, the rotor system was modeledby a pressure discontinuity at the rotor disk. Thecompressible effects of the rotor blade areaccounted for using the blade element theoryand tabular values for the lift and drag of theairfoil at each rotor section.
The pressure discontinuity at the rotor disk wascomputed iteratively with the solution to the flowfield. This pressure value was computed usingblade element theory and the current values ofthe flow field at each location on the rotor disk.This computation also included blade pitch trimto attain the desired rotor thrust and momentbalance.
Figure 5: AFDD Grid for ROBIN and Rotor
The grid system that was used for the calculationof the helicopter flow field consists of severaloverset grids. Interpolation of the flow fieldproperties in the overlapping regions of the gridswas used as the boundary condition for the innergrids. A global outer grid was used to prescribethe actual flow condition to the code. Theoverlapping inner grids are shown in figure 5.
The relative cost of doing a complete Navier-Stokes simulation of helicopter configurations atlow speed is high. Over 60 Cray C-90 hours wererequired for this case.
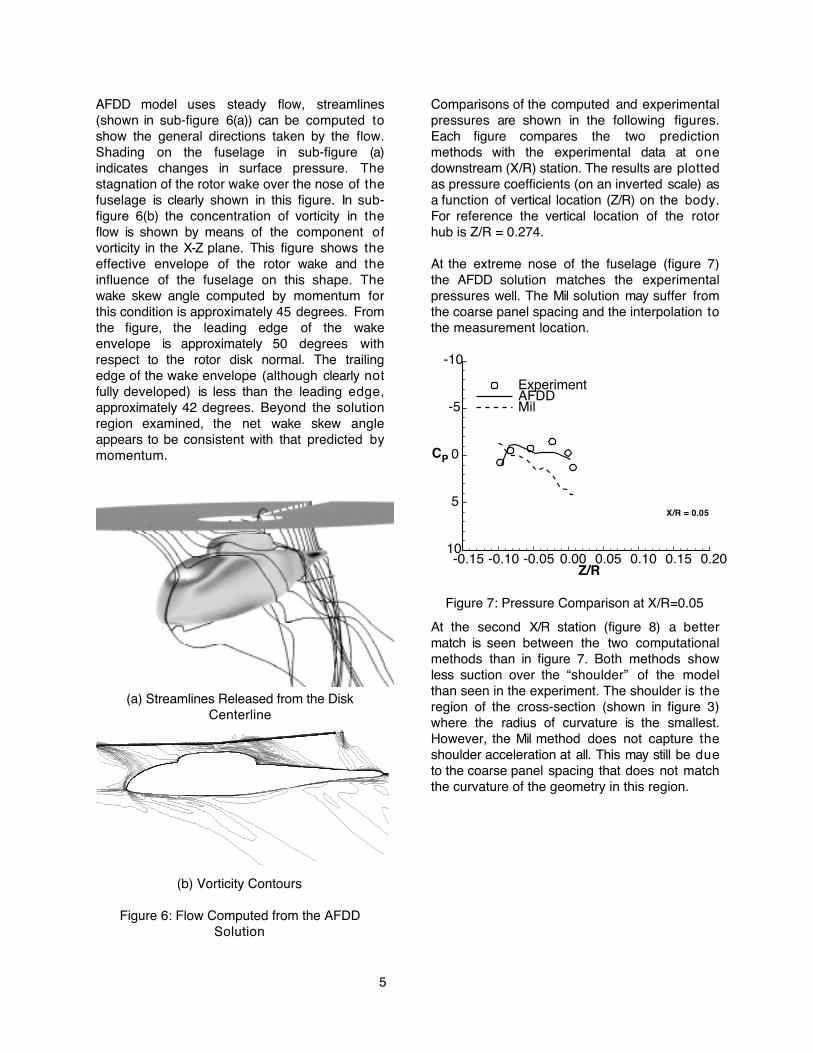
Results and DiscussionThe character of the aerodynamics at low speedscan be seen in the flow solution obtained usingthe AFDD method. Figure 6 shows computedflow at the flight condition studied. Since the
5
AFDD model uses steady flow, streamlines(shown in sub-figure 6(a)) can be computed toshow the general directions taken by the flow.Shading on the fuselage in sub-figure (a)indicates changes in surface pressure. Thestagnation of the rotor wake over the nose of thefuselage is clearly shown in this figure. In sub-figure 6(b) the concentration of vorticity in theflow is shown by means of the component ofvorticity in the X-Z plane. This figure shows theeffective envelope of the rotor wake and theinfluence of the fuselage on this shape. Thewake skew angle computed by momentum forthis condition is approximately 45 degrees. Fromthe figure, the leading edge of the wakeenvelope is approximately 50 degrees withrespect to the rotor disk normal. The trailingedge of the wake envelope (although clearly notfully developed) is less than the leading edge,approximately 42 degrees. Beyond the solutionregion examined, the net wake skew angleappears to be consistent with that predicted bymomentum.
(a) Streamlines Released from the DiskCenterline
(b) Vorticity Contours
Figure 6: Flow Computed from the AFDDSolution
Comparisons of the computed and experimentalpressures are shown in the following figures.Each figure compares the two predictionmethods with the experimental data at onedownstream (X/R) station. The results are plottedas pressure coefficients (on an inverted scale) asa function of vertical location (Z/R) on the body.For reference the vertical location of the rotorhub is Z/R = 0.274.
At the extreme nose of the fuselage (figure 7)the AFDD solution matches the experimentalpressures well. The Mil solution may suffer fromthe coarse panel spacing and the interpolation tothe measurement location.
-0.15 -0.10 -0.05 0.00 0.05 0.10 0.15 0.20
-10
-5
0
5
10
X/R = 0.05
CP
Z/R
ExperimentAFDDMil
Figure 7: Pressure Comparison at X/R=0.05
At the second X/R station (figure 8) a bettermatch is seen between the two computationalmethods than in figure 7. Both methods showless suction over the ÒshoulderÓ of the modelthan seen in the experiment. The shoulder is theregion of the cross-section (shown in figure 3)where the radius of curvature is the smallest.However, the Mil method does not capture theshoulder acceleration at all. This may still be dueto the coarse panel spacing that does not matchthe curvature of the geometry in this region.
6
-0.15 -0.10 -0.05 0.00 0.05 0.10 0.15 0.20
-10
-5
0
5
10
CP
Z/R
ExperimentAFDDMil
X/R = 0.09
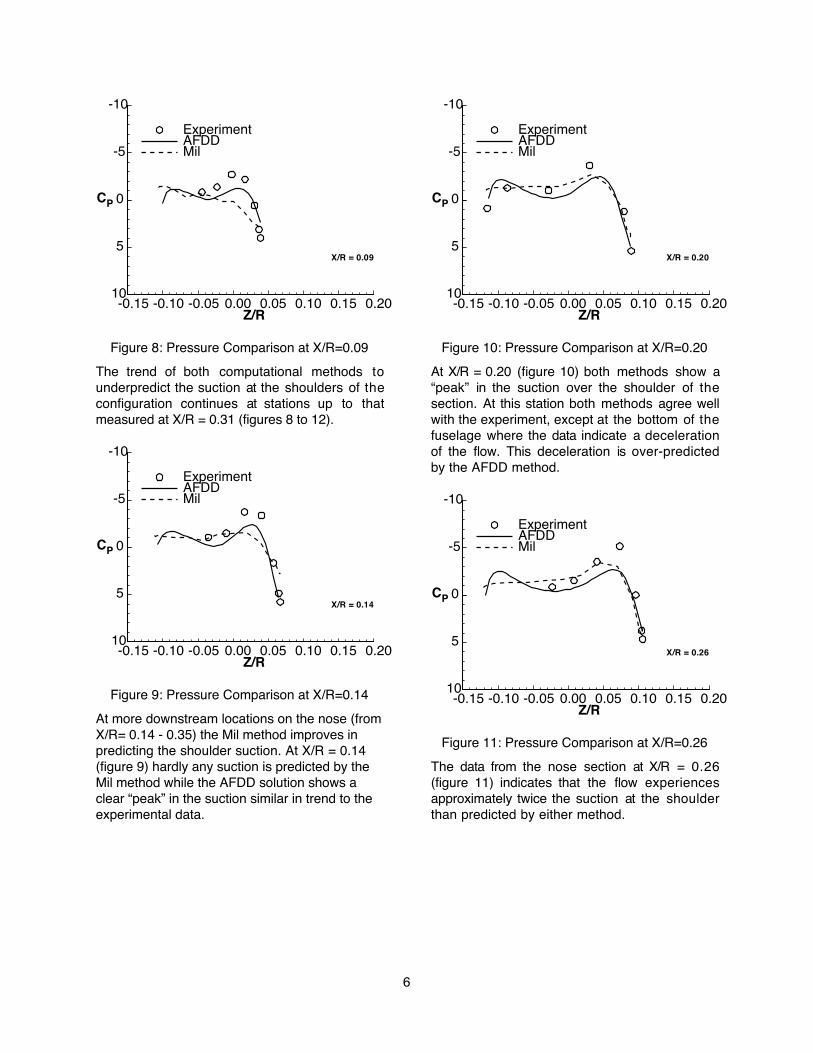
Figure 8: Pressure Comparison at X/R=0.09
The trend of both computational methods tounderpredict the suction at the shoulders of theconfiguration continues at stations up to thatmeasured at X/R = 0.31 (figures 8 to 12).
-0.15 -0.10 -0.05 0.00 0.05 0.10 0.15 0.20
-10
-5
0
5
10
CP
Z/R
ExperimentAFDDMil
X/R = 0.14
Figure 9: Pressure Comparison at X/R=0.14
At more downstream locations on the nose (fromX/R= 0.14 - 0.35) the Mil method improves inpredicting the shoulder suction. At X/R = 0.14(figure 9) hardly any suction is predicted by theMil method while the AFDD solution shows aclear ÒpeakÓ in the suction similar in trend to theexperimental data.
-0.15 -0.10 -0.05 0.00 0.05 0.10 0.15 0.20
-10
-5
0
5
10
CP
Z/R
ExperimentAFDDMil
X/R = 0.20
Figure 10: Pressure Comparison at X/R=0.20
At X/R = 0.20 (figure 10) both methods show aÒpeakÓ in the suction over the shoulder of thesection. At this station both methods agree wellwith the experiment, except at the bottom of thefuselage where the data indicate a decelerationof the flow. This deceleration is over-predictedby the AFDD method.
-0.15 -0.10 -0.05 0.00 0.05 0.10 0.15 0.20
-10
-5
0
5
10
CP
Z/R
ExperimentAFDDMil
X/R = 0.26
Figure 11: Pressure Comparison at X/R=0.26
The data from the nose section at X/R = 0.26(figure 11) indicates that the flow experiencesapproximately twice the suction at the shoulderthan predicted by either method.
7
-0.15 -0.10 -0.05 0.00 0.05 0.10 0.15 0.20
-10
-5
0
5
10
CP
Z/R
ExperimentAFDDMil
X/R = 0.31
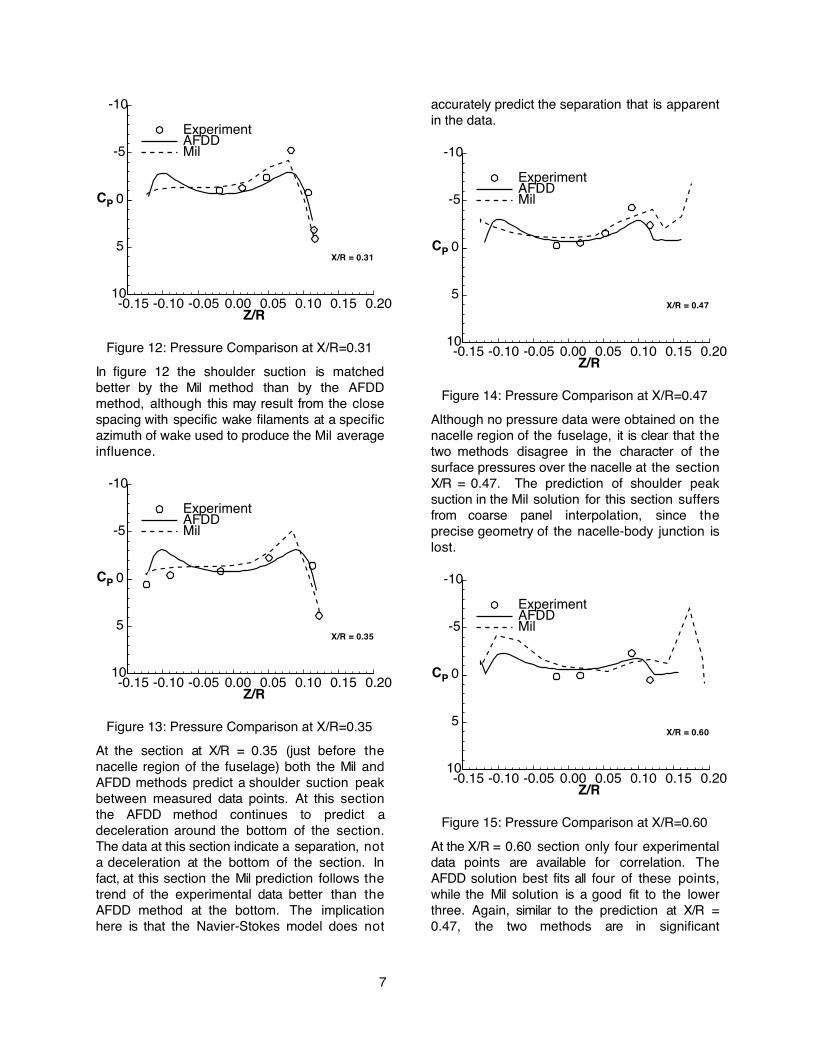
Figure 12: Pressure Comparison at X/R=0.31
In figure 12 the shoulder suction is matchedbetter by the Mil method than by the AFDDmethod, although this may result from the closespacing with specific wake filaments at a specificazimuth of wake used to produce the Mil averageinfluence.
-0.15 -0.10 -0.05 0.00 0.05 0.10 0.15 0.20
-10
-5
0
5
10
CP
Z/R
ExperimentAFDDMil
X/R = 0.35
Figure 13: Pressure Comparison at X/R=0.35
At the section at X/R = 0.35 (just before thenacelle region of the fuselage) both the Mil andAFDD methods predict a shoulder suction peakbetween measured data points. At this sectionthe AFDD method continues to predict adeceleration around the bottom of the section.The data at this section indicate a separation, nota deceleration at the bottom of the section. Infact, at this section the Mil prediction follows thetrend of the experimental data better than theAFDD method at the bottom. The implicationhere is that the Navier-Stokes model does not
accurately predict the separation that is apparentin the data.
-0.15 -0.10 -0.05 0.00 0.05 0.10 0.15 0.20
-10
-5
0
5
10
CP
Z/R
ExperimentAFDDMil
X/R = 0.47
Figure 14: Pressure Comparison at X/R=0.47
Although no pressure data were obtained on thenacelle region of the fuselage, it is clear that thetwo methods disagree in the character of thesurface pressures over the nacelle at the sectionX/R = 0.47. The prediction of shoulder peaksuction in the Mil solution for this section suffersfrom coarse panel interpolation, since theprecise geometry of the nacelle-body junction islost.
-0.15 -0.10 -0.05 0.00 0.05 0.10 0.15 0.20
-10
-5
0
5
10
CP
Z/R
ExperimentAFDDMil
X/R = 0.60
Figure 15: Pressure Comparison at X/R=0.60
At the X/R = 0.60 section only four experimentaldata points are available for correlation. TheAFDD solution best fits all four of these points,while the Mil solution is a good fit to the lowerthree. Again, similar to the prediction at X/R =0.47, the two methods are in significant
8
disagreement on the character of the flow on thenacelle of the fuselage.
-0.15 -0.10 -0.05 0.00 0.05 0.10 0.15 0.20
-10
-5
0
5
10
CP
Z/R
ExperimentAFDDMil
X/R = 0.88
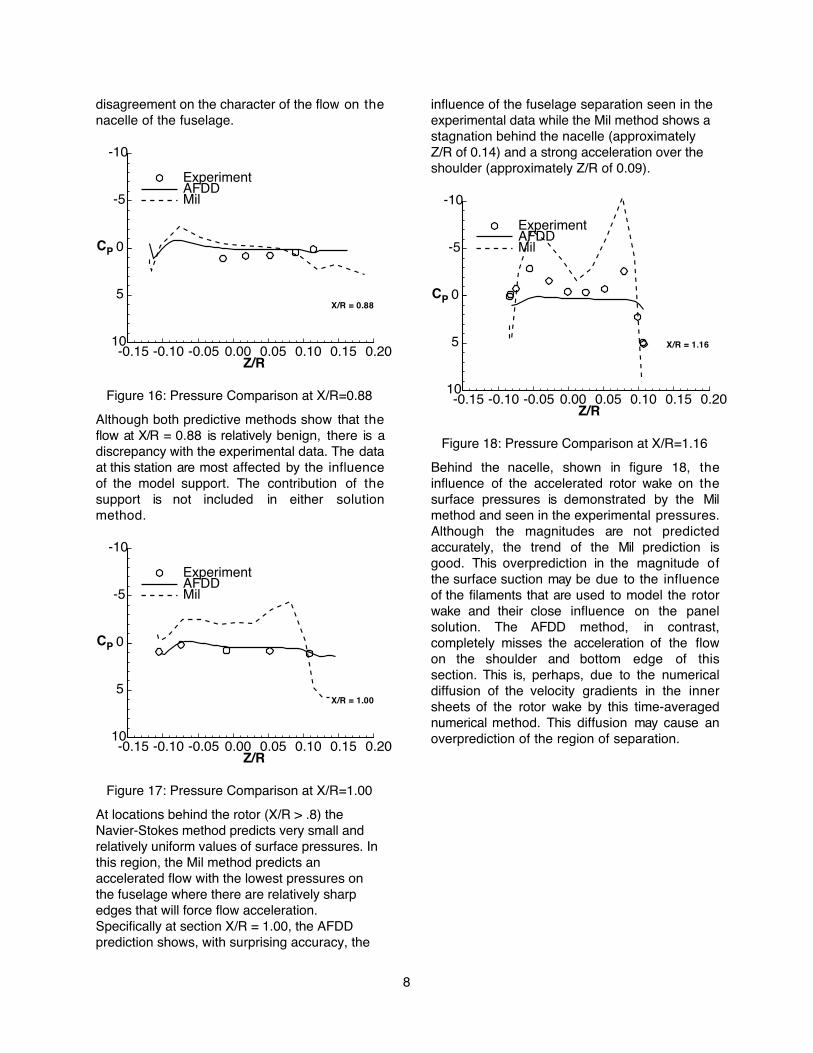
Figure 16: Pressure Comparison at X/R=0.88
Although both predictive methods show that theflow at X/R = 0.88 is relatively benign, there is adiscrepancy with the experimental data. The dataat this station are most affected by the influenceof the model support. The contribution of thesupport is not included in either solutionmethod.
-0.15 -0.10 -0.05 0.00 0.05 0.10 0.15 0.20
-10
-5
0
5
10
CP
Z/R
ExperimentAFDDMil
X/R = 1.00
Figure 17: Pressure Comparison at X/R=1.00
At locations behind the rotor (X/R > .8) theNavier-Stokes method predicts very small andrelatively uniform values of surface pressures. Inthis region, the Mil method predicts anaccelerated flow with the lowest pressures onthe fuselage where there are relatively sharpedges that will force flow acceleration.Specifically at section X/R = 1.00, the AFDDprediction shows, with surprising accuracy, the
influence of the fuselage separation seen in theexperimental data while the Mil method shows astagnation behind the nacelle (approximatelyZ/R of 0.14) and a strong acceleration over theshoulder (approximately Z/R of 0.09).
-0.15 -0.10 -0.05 0.00 0.05 0.10 0.15 0.20
-10
-5
0
5
10
CP
Z/R
ExperimentAFDDMil
X/R = 1.16
Figure 18: Pressure Comparison at X/R=1.16
Behind the nacelle, shown in figure 18, theinfluence of the accelerated rotor wake on thesurface pressures is demonstrated by the Milmethod and seen in the experimental pressures.Although the magnitudes are not predictedaccurately, the trend of the Mil prediction isgood. This overprediction in the magnitude ofthe surface suction may be due to the influenceof the filaments that are used to model the rotorwake and their close influence on the panelsolution. The AFDD method, in contrast,completely misses the acceleration of the flowon the shoulder and bottom edge of thissection. This is, perhaps, due to the numericaldiffusion of the velocity gradients in the innersheets of the rotor wake by this time-averagednumerical method. This diffusion may cause anoverprediction of the region of separation.
9
-0.15 -0.10 -0.05 0.00 0.05 0.10 0.15 0.20
-10
-5
0
5
10
CP
Z/R
ExperimentAFDDMil
X/R = 1.35
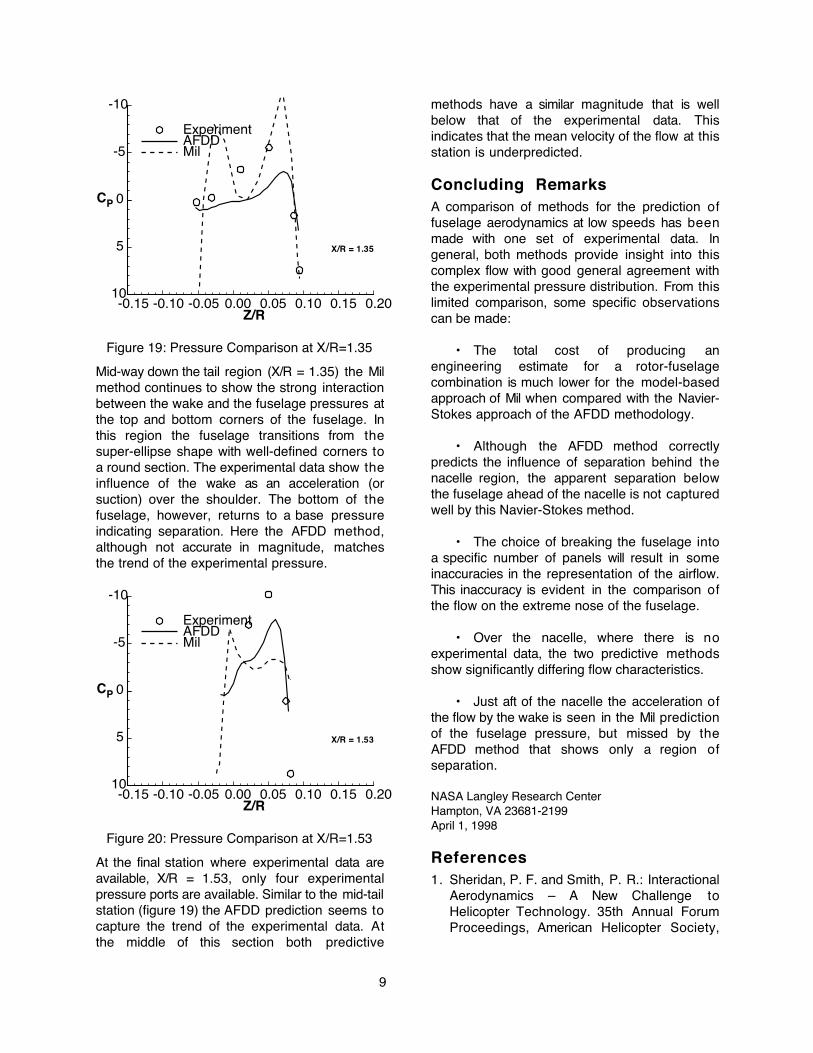
Figure 19: Pressure Comparison at X/R=1.35
Mid-way down the tail region (X/R = 1.35) the Milmethod continues to show the strong interactionbetween the wake and the fuselage pressures atthe top and bottom corners of the fuselage. Inthis region the fuselage transitions from thesuper-ellipse shape with well-defined corners toa round section. The experimental data show theinfluence of the wake as an acceleration (orsuction) over the shoulder. The bottom of thefuselage, however, returns to a base pressureindicating separation. Here the AFDD method,although not accurate in magnitude, matchesthe trend of the experimental pressure.
-0.15 -0.10 -0.05 0.00 0.05 0.10 0.15 0.20
-10
-5
0
5
10
CP
Z/R
ExperimentAFDDMil
X/R = 1.53
Figure 20: Pressure Comparison at X/R=1.53
At the final station where experimental data areavailable, X/R = 1.53, only four experimentalpressure ports are available. Similar to the mid-tailstation (figure 19) the AFDD prediction seems tocapture the trend of the experimental data. Atthe middle of this section both predictive
methods have a similar magnitude that is wellbelow that of the experimental data. Thisindicates that the mean velocity of the flow at thisstation is underpredicted.
Concluding RemarksA comparison of methods for the prediction offuselage aerodynamics at low speeds has beenmade with one set of experimental data. Ingeneral, both methods provide insight into thiscomplex flow with good general agreement withthe experimental pressure distribution. From thislimited comparison, some specific observationscan be made:
¥ The total cost of producing anengineering estimate for a rotor-fuselagecombination is much lower for the model-basedapproach of Mil when compared with the Navier-Stokes approach of the AFDD methodology.
¥ Although the AFDD method correctlypredicts the influence of separation behind thenacelle region, the apparent separation belowthe fuselage ahead of the nacelle is not capturedwell by this Navier-Stokes method.
¥ The choice of breaking the fuselage intoa specific number of panels will result in someinaccuracies in the representation of the airflow.This inaccuracy is evident in the comparison ofthe flow on the extreme nose of the fuselage.
¥ Over the nacelle, where there is noexperimental data, the two predictive methodsshow significantly differing flow characteristics.
¥ Just aft of the nacelle the acceleration ofthe flow by the wake is seen in the Mil predictionof the fuselage pressure, but missed by theAFDD method that shows only a region ofseparation.
NASA Langley Research CenterHampton, VA 23681-2199April 1, 1998
References1. Sheridan, P. F. and Smith, P. R.: Interactional
Aerodynamics Ð A New Challenge toHelicopter Technology. 35th Annual ForumProceedings, American Helicopter Society,
10
Washington, D. C., May 1979, pp. 79-59-1Ð79-59-15.
2. Berry, J. D. and Althoff, S. L.: Inflow VelocityPerturbations Due to Fuselage Effects in thePresence of a Fully Interactive Wake. 46thAnnual Forum Proceedings, AmericanHelicopter Society, Washington, D. C., May1990, pp. 1111Ð1120.
3. Freeman, C. E. and Mineck, R. E.: FuselageSurface Pressure Measurements of aHelicopter Wind-Tunnel Model with a 3.15-Meter Diameter Single Rotor. NASA TM80051, March 1979.
4. Letnikov, V. B. and Bavykina, I. D.: Calculationof the Aerodynamic Interaction BetweenRotor, Wing and Fuselage. Mil MoscowHelicopter Plant Report No. 880/5-USA,December 1995.
5. Chaffin, M. S. and Berry, J. D.: HelicopterFuselage Aerodynamics Under a Rotor byNavier-Stokes Simulation. Journal of theAmerican Helicopter Society, 42:3, July1997.
6. Poltz, G. and Quentin, J.: Separated FlowAround Helicopter Bodies. 7th EuropeanRotorcraft and Powered Lift Aircraft Forumproceedings, 1981.
7. Rogers, S. E., Kwak, D., Kiris, C.: Steady andUnsteady Solutions of the IncompressibleNavier-Stokes Equations. AIAA Journal,Volume 29, Number 4, April 1991, pp.603Ð610.
11
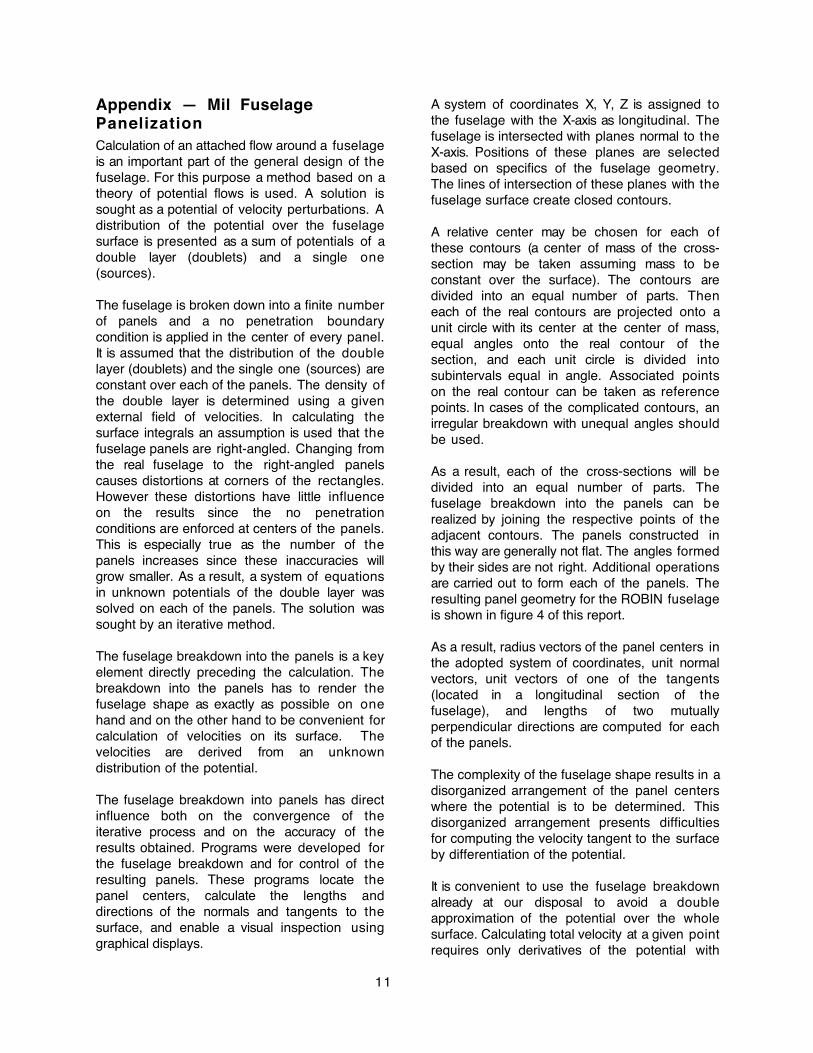
Appendix Ñ Mil FuselagePanelizationCalculation of an attached flow around a fuselageis an important part of the general design of thefuselage. For this purpose a method based on atheory of potential flows is used. A solution issought as a potential of velocity perturbations. Adistribution of the potential over the fuselagesurface is presented as a sum of potentials of adouble layer (doublets) and a single one(sources).
The fuselage is broken down into a finite numberof panels and a no penetration boundarycondition is applied in the center of every panel.It is assumed that the distribution of the doublelayer (doublets) and the single one (sources) areconstant over each of the panels. The density ofthe double layer is determined using a givenexternal field of velocities. In calculating thesurface integrals an assumption is used that thefuselage panels are right-angled. Changing fromthe real fuselage to the right-angled panelscauses distortions at corners of the rectangles.However these distortions have little influenceon the results since the no penetrationconditions are enforced at centers of the panels.This is especially true as the number of thepanels increases since these inaccuracies willgrow smaller. As a result, a system of equationsin unknown potentials of the double layer wassolved on each of the panels. The solution wassought by an iterative method.
The fuselage breakdown into the panels is a keyelement directly preceding the calculation. Thebreakdown into the panels has to render thefuselage shape as exactly as possible on onehand and on the other hand to be convenient forcalculation of velocities on its surface. Thevelocities are derived from an unknowndistribution of the potential.
The fuselage breakdown into panels has directinfluence both on the convergence of theiterative process and on the accuracy of theresults obtained. Programs were developed forthe fuselage breakdown and for control of theresulting panels. These programs locate thepanel centers, calculate the lengths anddirections of the normals and tangents to thesurface, and enable a visual inspection usinggraphical displays.
A system of coordinates X, Y, Z is assigned tothe fuselage with the X-axis as longitudinal. Thefuselage is intersected with planes normal to theX-axis. Positions of these planes are selectedbased on specifics of the fuselage geometry.The lines of intersection of these planes with thefuselage surface create closed contours.
A relative center may be chosen for each ofthese contours (a center of mass of the cross-section may be taken assuming mass to beconstant over the surface). The contours aredivided into an equal number of parts. Theneach of the real contours are projected onto aunit circle with its center at the center of mass,equal angles onto the real contour of thesection, and each unit circle is divided intosubintervals equal in angle. Associated pointson the real contour can be taken as referencepoints. In cases of the complicated contours, anirregular breakdown with unequal angles shouldbe used.
As a result, each of the cross-sections will bedivided into an equal number of parts. Thefuselage breakdown into the panels can berealized by joining the respective points of theadjacent contours. The panels constructed inthis way are generally not flat. The angles formedby their sides are not right. Additional operationsare carried out to form each of the panels. Theresulting panel geometry for the ROBIN fuselageis shown in figure 4 of this report.
As a result, radius vectors of the panel centers inthe adopted system of coordinates, unit normalvectors, unit vectors of one of the tangents(located in a longitudinal section of thefuselage), and lengths of two mutuallyperpendicular directions are computed for eachof the panels.
The complexity of the fuselage shape results in adisorganized arrangement of the panel centerswhere the potential is to be determined. Thisdisorganized arrangement presents difficultiesfor computing the velocity tangent to the surfaceby differentiation of the potential.
It is convenient to use the fuselage breakdownalready at our disposal to avoid a doubleapproximation of the potential over the wholesurface. Calculating total velocity at a given pointrequires only derivatives of the potential with

12
respect to length in two different directions. Wecan use the vector of the tangent located in thefuselage longitudinal plane as one of thedirections. A vector located in the planeperpendicular to the X-axis and tangent to thefuselage contour in the given section isconveniently used as the second direction. Todetermine the direction of this tangent, thecontour at the given point is approximated with acircle.

Form ApprovedOMB No. 0704-0188
Public reporting burden for this collection of information is estimated to average 1 hour per response, including the time for reviewing instructions, searching existing data sources, gathering and maintaining the data needed, and completing and reviewing the collection of information. Send comments regarding this burden estimate or any other aspect of this collection of information, including suggestions for reducing this burden, to Washington Headquarters Services, Directorate for Information Operations and Reports, 1215 Jefferson Davis Highway, Suite 1204, Arlington, VA 22202-4302, and to the Office of Management and Budget, Paperwork Reduction Project (0704-0188), Washington, DC 20503.
1. AGENCY USE ONLY (Leave blank) 2. REPORT DATE 3. REPORT TYPE AND DATES COVERED
4. TITLE AND SUBTITLE
6. AUTHOR(S)
5. FUNDING NUMBERS
7. PERFORMING ORGANIZATION NAME(S) AND ADDRESS(ES) 8. PERFORMING ORGANIZATION REPORT NUMBER
9. SPONSORING / MONITORING AGENCY NAME(S) AND ADDRESS(ES) 10. SPONSORING / MONITORING AGENCY REPORT NUMBER
11. SUPPLEMENTARY NOTES
12a. DISTRIBUTION / AVAILABILITY STATEMENT 12b. DISTRIBUTION CODE
13. ABSTRACT (Maximum 200 words)
14. SUBJECT TERMS 15. NUMBER OF PAGES
16. PRICE CODE
17. SECURITY CLASSIFICATION OF REPORT
18. SECURITY CLASSIFICATION OF THIS PAGE
19. SECURITY CLASSIFICATION OF ABSTRACT
20. LIMITATION OF ABSTRACT
NSN 7540-01-280-5500Prescribed by ANSI Std. Z39-18298-102
Standard Form 298 (Rev. 2-89)
REPORT DOCUMENTATION PAGE
June 1998 Technical Memorandum
A Comparison of Interactional Aerodynamics Methods for a Helicopter in Low Speed Flight
581-10-11-01
John D. Berry, Victor Letnikov, Irena Bavykina, and Mark Chaffin
U.S. Army Aviation and Missile Command (AMCOM)Aeroflightdynamics Directorate (AFDD)Joint Research Program OfficeLangley Research Center, Hampton, VA 23681-2199
L-17732
National Aeronautics and Space AdministrationWashington, DC 20546-0001U.S. Army Aviation and Missile CommandMoffett Field, CA 94035-1000
NASA/TM-1998-208420AFDD/TR-98-A-003
Berry: AMCOM, AFDD, Langley Research Center, Hampton, VA; Letnikov and Bavykina: Mil Moscow Helicopter Plant, 2 Sokolnichesky Val, 107113, Moscow, Russia; Chaffin: Lockheed Martin Engrg. & Sci., Hampton, VA
Unclassified - UnlimitedSubject Category 05Standard DistributionAvailability: NASA CASI (301) 621-0390
Recent advances in computing subsonic flow have been applied to helicopter configurations with various degrees of success. This paper is a comparison of two specific methods applied to a particularly challenging regime of helicopter flight, very low speeds, where the interaction of the rotor wake and the fuselage are most significant. Comparisons are made between different methods of predicting the interactional aerodynamics associated with a simple generic helicopter configuration. These comparisons are made using fuselage pressure data from a Mach-scaled powered model helicopter with a rotor diameter of approximately 3 meters. The data shown are for an advance ratio of 0.05 with a thrust coefficient of 0.0066. The results of this comparison show that in this type of complex flow both analytical techniques have regions where they are more accurate in matching the experimental data.
Helicopter, Interactional Aerodynamics, Rotor Wake, Fuselage Pressures 17
A03
Unclassified Unclassified Unclassified UL