Embed Size (px)
Citation preview

A Comparison of Four Test Equating Methods
Report Prepared for the Education Quality and Accountability Office (EQAO) by
Xiao Pang, Ph.D.Psychometrician, EQAO
Ebby Madera, Ph.D.Psychometrician, EQAO
Nizam Radwan, Ph.D.Psychometrician, EQAO
Su Zhang, Ph.D.Psychometrician, EQAO
APRIL 2010

Education Quality and Accountability Office, 2 Carlton Street, Suite 1200, Toronto ON M5B 2M9, 1-888-327-7377, www.eqao.com
© 2010 Queen’s Printer for Ontario
About the Education Quality and Accountability Office
The Education Quality and Accountability Office (EQAO) is an independent provincial agency funded by theGovernment of Ontario. EQAO’s mandate is to conduct province-wide tests at key points in every student’sprimary, junior and secondary education and report the results to educators, parents and the public.
EQAO acts as a catalyst for increasing the success of Ontario students by measuring their achievementin reading, writing and mathematics in relation to Ontario Curriculum expectations. The resulting dataprovide a gauge of quality and accountability in the Ontario education system.
The objective and reliable assessment results are evidence that adds to current knowledge about studentlearning and serves as an important tool for improvement at all levels: for individual students, schools,boards and the province.
About EQAO Research
EQAO undertakes research for two main purposes:
• to maintain best-of-class practices and to ensure that the agency remains at the forefront of large-scale assessment and
• to promote the use of EQAO data for improved student achievement through the investigation ofmeans to inform policy directions and decisions made by educators, parents and the government.
EQAO research projects delve into the factors that influence student achievement and education quality,and examine the statistical and psychometric processes that result in high-quality assessment data.

Acknowledgements
This research was conducted under the direction of Michael Kozlow and the
EQAO scholars in residence, Todd Rogers and Mark Reckase, who provided guidance on
the development of the proposal and the conduct of the study. They provided extensive
and valuable advice on the research procedures, input at different stages of the analysis
and review and editorial comments on the final report. Qi Chen provided academic and
technical assistance to speed up the process of the analysis. Yunmei Xu provided timely
assistance in completing the analysis. The authors are grateful to them for the significant
contributions they made to improve the academic quality of this research.
Abstract
This research evaluated the effectiveness of identifying students’ real gains
through the application of four commonly used equating methods: concurrent calibration
(CC) equating, fixed common item parameter (FCIP) equating, Stocking and Lord test
characteristic curve (TCC) equating, and mean/sigma (M/S) equating. The performance
of the four procedures was evaluated using simulated data for a test design with multiple
item formats. Five gain conditions (-0.3, -0.1, 0.0, 0.1 and 0.3 on the θ-scale) were built
into the simulation to mimic the Ontario Secondary School Literacy Test (OSSLT), the
Test provincial de compétences linguistiques (TPCL), the Assessments of Reading,
Writing and Mathematics, Primary and Junior Divisions and the applied version of the
English Grade 9 Assessment of Mathematics. Twenty replications were conducted. The
estimated percentages at multiple achievement levels and in the successful and
unsuccessful categories were compared with the respective true percentages obtained
from the known θ-distributions. The results across seven assessments showed that the
FCIP, TCC and M/S equating procedures based on separate calibrations performed
equally well and much better than the CC procedure.

1
Introduction
One of the goals of the Education Quality and Accountability Office (EQAO) is
to provide evidence concerning changes in student achievement from year to year in the
province of Ontario.1 Yearly assessments in both English and French are conducted at the
primary (Grade 3) and junior (Grade 6) levels (reading, writing and mathematics) and in
Grade 9 (academic and applied mathematics). The results for these assessments are
reported in terms of the percentage of students at each of five achievement levels (Not
Enough Evidence for Level 1 [NE1] or Below Level 1 and Levels 1, 2, 3 and 4). The
provincial standard for acceptable performance is Level 3. In addition to these
assessments, EQAO is responsible for two literacy tests: the Ontario Secondary School
Literacy Test (OSSLT) in English and the Test provincial de compétences linguistiques
(TPCL) in French, either of which is a required credential for graduation from high
school.2
When reporting evidence of change in performance between two years, it is
important that a distinction be made between differences in difficulty of the test forms
used to assess the students and real gains or losses in achievement between the two years.
The purpose of equating is to adjust for test difficulty differences so that only real
differences in performance are reported.
There are, however, different procedures for equating tests, some of which are
based on classical test score theory (CTST) and others on item response theory (IRT).
Some research has shown that equating based on CTST and IRT provides similar results
for horizontal equating. For example, Hills, Subhiyah and Hirsch (1988) found similar
results with linear equating, concurrent calibration (CC) using the Rasch model and the
three-parameter IRT model, and separate calibration using the three-parameter IRT
model with fixed common item parameter (FCIP) equating and mean/sigma (M/S)
equating (Marco, 1977). However, Kolen and Brennan (1995) pointed out that since
many large assessment programs use IRT models to develop and calibrate tests, the use
1 EQAO is an arm’s length agency of the Ontario Ministry of Education that administers large-scale
provincial assessments. 2 Students who are unsuccessful on the OSSLT may take it again the next year or enrol in the Ontario
Secondary School Literary Course.

2
of IRT-based equating methods is often the logical choice. Therefore, since EQAO uses
procedures based on IRT to calibrate and equate the items in each of its assessments, the
equating methods considered in the present study were restricted to IRT-based equating
methods.
The most commonly used IRT equating procedures are the CC procedure
(Wingersky & Lord, 1984), which is based on a concurrent calibration of a sample
consisting of the students assessed in each of two years to be equated; the FCIP
procedure; the test characteristic curve (TCC) procedure (Loyd & Hoover, 1980) and the
M/S procedure. The FCIP, TCC and M/S procedures are based on separate calibrations of
the two samples. Unfortunately these procedures do not always yield the same results.
Therefore, understanding the behavior of different equating methods is critical to
ensuring that the interpretation of estimates of change is valid.
EQAO currently uses separate IRT calibration and the FCIP equating procedure.
However, no research has examined the effectiveness of this approach in recovering
gains or differences between two years for the EQAO assessments, or whether or not one
of the other IRT equating methods might better recover such changes.
Purpose of the Study
The purpose of the present study is to assess the effectiveness of the four
different equating procedures identified above (CC, FCIP, TCC and M/S) in identifying
the real changes in student performance across years. Specifically, the four procedures
were compared in terms of how accurately the results they yielded represented known
changes in the percentages of students at each achievement level for the primary (Grade
3), junior (Grade 6) and Grade 9 assessments and in the two achievement categories for
the OSSLT and TPCL (successful and unsuccessful).
Review of Equating Methods
When the common-item nonequivalent group design and IRT-based equating
methods are used, one of two approaches can be taken: concurrent or separate calibration.
With the concurrent calibration and equating approach (Lord & Winkersky, 1984), the
students’ responses from the two tests to be equated are combined into one data file

3
through the alignment of the common items. The tests are then simultaneously calibrated.
As a result, the parameter estimates for the items in the tests are put on a common scale.
The students’ ability scores for two tests are estimated separately using the corresponding
scaled item parameters, and the means of the two tests are then compared to determine
the direction and magnitude of the change. Theoretically, CC is expected to yield more
stable results than the separate-calibration methods that employ transformations, and CC
is also expected to minimize the impact of sampling fluctuations in the estimation of the
pseudo-guessing parameter due to an increase in the number of low-ability examinees.
With separate calibration, the calibrations are performed separately for the two
tests and common items are used to put the two tests on a common scale. The test used to
set the common scale is referred to as “the reference test” and the second test is referred
to as “the equated test.” A linear transformation can then be used to place the item
parameters from the equated test on the scale of the reference test based on the items
common to the two tests. Equating procedures that use a linear transformation include the
mean/mean approach (M/M) (Loyd & Hoover, 1980), the M/S method (Marco, 1977) and
the TCC approach (Li, Lissitz & Yang, 1999; Stocking & Lord, 1983). While it is
theoretically correct to use the M/M or the M/S procedure, the parameters are used
separately to estimate the equating coefficients. In contrast, the TCC method is a
simultaneous estimation procedure that takes better account of the information provided
(Li et al., 1999).
FCIP is an alternative two-step calibration and equating method. In it, the
reference test is calibrated first. When the equated test is calibrated, the parameters of its
common items are fixed at the estimates obtained through the calibration of the reference
test. As a result, the equated test score distribution is placed on the reference test scale
(for a technically detailed description of FCIP, refer to Kim, 2006). The FCIP procedure
is expected to produce results superior to those produced by the M/M, M/S and TCC
procedures because of the avoidance of incorrect transformation functions.
While some research has been conducted to evaluate different IRT equating
approaches (Hanson & Belguin, 2002; Hills, Subhiyah & Hirsch, 1988; Kim & Cohen,
1998; Kolen & Brennan, 2004; Petersen, Cook & Stocking, 1983; Prowker & Camilli,

4
2006; Bishop, Shari, Lei & Domaleski, 2006; Hu, Rogers & Vulkmirovic, 2008; Kim,
2006; Lee & Ban, 2010; Wingersky, Cook & Eignor, 1987), a limited number of studies
have been completed comparing the behaviour of the concurrent and separate approaches.
Petersen, et al. (1983) compared the CTST linear procedure, the 1PL and 3PL IRT
concurrent methods and the 3PL linear transformation method. They found that the
different methods produced similar results when the tests to be equated were parallel and
the groups in the two years were equivalent.
Wingersky et al. (1987) investigated the effects on IRT true-score equating results
of the characteristics of the linking items and concluded that the TCC procedure was
affected by the presence of linking items that function differently for the two groups used
to provide the data. Hills et al. (1988) compared CTST linear equating, the IRT 1PL and
3PL concurrent methods, the 3PL FCIP method and the 3PL linear transformation
method when the tests were parallel and the groups were equivalent. They found that the
different methods produced similar results. When they equated six test forms using a
single set of anchor items, Li, Griffith, and Tam (1997) found that the FCIP and TCC
approaches produced comparable equated ability estimates, except in case of students
with extreme ability under the TCC equating method.
Lee and Ban (2010) compared four different IRT equating procedures (CC, TCC,
Haebara and proficiency transformation) and found that separate-calibration procedures
performed better than the CC and proficiency transformation procedures. Kim and Cohen
(1998) compared the TCC and the concurrent procedures with two different estimation
procedures — marginal maximum likelihood and marginal maximum “a posteriori” —
using multiple-choice items. They found that the two procedures produced similar results
except when the number of common items was small, in which case the separate
approach provided more accurate results. Linn, et al. (1980) compared the TCC, M/M,
M/S and weighted M/S equating procedures. Their results indicated that the differences
in equating coefficients among these methods were small across different sample sizes
and numbers of common items.
Hanson and Belguin (2002) compared the CC, M/M, M/S, TCC and Haebrara
TCC procedures using computer simulation. They found that, overall, the CC procedure

5
resulted in smaller bias and less random error across replications than the separate
calibration and transformation procedures. Keller, et al. (2004) evaluated the ability of
four equating methods (CC, M/S, TCC and FCIP) to recover changes in the examinee
ability distribution using simulated data based on a standard normal-ability distribution.
They found that M/S performed the best while FCIP performed the worst.
Hu et al. (2008) conducted a simulation study to investigate ten variations of four
equating methods (CC, M/S, TCC and FCIP) in the absence and presence of outliers in
the set of common items. They concluded that “TCC and M/S transformations performed
the best . . . The CC and FCIP calibrations had a complex interaction with group
equivalence and number/score-points of outliers” (p. 311). When there were no outliers in
the set of common items, they found that the four methods were sensitive, but not
equally, to the presence of nonequivalent groups; when there was no difference between
the mean abilities of the two groups, the four procedures were equivalent (bias and
random error), but when the mean abilities of the two groups differed by one standard
deviation, the M/S and TCC produced small biases and had small random error, FCIP had
a moderate bias and random error and CC yielded the largest bias and largest random
error.
The results of the studies reviewed were inconsistent. Further, no comprehensive
research has compared the four equating methods using a) data that consist of
dichotomously and polytomously scored items; b) data that are not necessarily normally
distributed; c) nonequivalent groups; and d) assessments of multiple subjects.
As indicated earlier, the EQAO assessments consist of a combination of
dichotomously and polytomously scored items. The distributions of scores are not normal
in shape. The populations form year to year are not equivalent. Currently, separate
calibration followed by FCIP equating are used to link two consecutive years of each
assessment.
The CC procedure and the FCIP procedure were compared using 2005–2006 and
2006–2007 primary, junior, and Grade 9 EQAO assessments. Some differences in the
change in percentages of students classified into the four achievement levels (Levels 1, 2,
3 and 4) in adjacent years were observed for the two equating procedures. Consequently,

6
the intent of the present study is to examine comprehensively the degree to which these
two equating procedures could recover true change reflected in the percentage of students
in each achievement category between two consecutive years. At the same time, the TCC
and M/S approaches were examined to determine which of the four procedures best
recovered the true change.
Method
This study addressed the issue of how well equated IRT proficiency estimates
yielded by the CC, M/S, TCC and FCIP equating methods recovered true change in
student performance between 2005–2006 and 2006–2007, herein referred to as Year 1
and Year 2, respectively. In real test situations, it is impossible to know the true changes,
because students’ true ability is not known. If the required information cannot otherwise
be reasonably obtained analytically, simulation studies should be conducted
(Psychometric Society, 1979; Lehman & Bailey, 1968). Therefore, computer simulation
procedures were employed in the current study, in which estimated changes in student
performance were compared to the known true changes.
Data Simulations
Equating Design. To reflect realistic cases, simulated data were generated to
mimic EQAO’s common-item non-equivalent group matrix design. With this design, sets
of different field-test items are placed in multiple versions of the operational tests for
Year 1 using a matrix. The field test items that have good psychometric properties are
then used as the Year 2 operational items and serve as the linking items between the Year
1 and Year 2 assessments. A visual display of this equating design is presented in Figure
1. The upper left block contains the operational form for Year 1 and the upper right block
contains a different set of embedded field-test items (M_1, M_2 and M_3). The field-test
items that match the test blueprints, possess good psychometric characteristics and
produce the desired test information function are brought forward to construct the
operational test form for Year 2, shown in the lower right block. Consequently, all the
operational items for Year 2 have been previously field tested, which results in a much
stronger link between the two tests than those established by other equating designs in
which a limited number of items in common are used to equate forms (commonly 20

7
items or at least 20% of the total number of items) (Angoff, 1984; Kolen & Brennan,
2004).3
Year 1 Test Form Matrix Items
M_1 M_2 M_3
Year 2 Test Form
Figure 1 Equating design for EQAO assessments
There are additional advantages to this design. More items can be field tested
within the normal test administration period. Further, since the field-test items are
embedded among the Year 1 operational items and the students do not know which items
are being field tested and which are operational, the students are equally motivated for all
items. The effect of fatigue, which would influence the responses of field-test items if
they were placed at the end of the test, is avoided. Finally, the risk to test security is
greatly reduced. These advantages make the common-item non-equivalent group matrix
design, which has been employed in many large-scale assessment programs, appealing
(Hu et al. 2008).
Sample Size. Since the population of students for each assessment and the number
of matrix field-test booklets vary, the sample size for each matrix booklet also varies.
Generally the English primary and junior assessments and the OSSLT have the largest
matrix sample sizes (e.g., n≈5000 for the OSSLT) while the French primary and junior
assessments and the TPCL have the smallest matrix sample sizes (e.g. n≈526 for the
TPCL). English Grade 9 applied mathematics has medium matrix sample sizes
(n≈1500). To determine the possible effect of subject areas on the recovery rates,
different tests and subtests were selected for the simulation: English primary writing,
French primary writing, English junior reading, French junior mathematics, English
Grade 9 applied mathematics, and the OSSLT and TPCL.
3 The one exception is the long-writing items. These items require too much time for them to be included
as field-test items in an operational form.

8
Test Characteristics. The psychometric characteristics of the tests and subtests
used in this study are presented in Table 1. As shown, the assessments have different
numbers of multiple-choice and open-response items and different numbers of score
points for the open-response items. For example, for the OSSLT and TPCL, the score
categories range from three to 10 for the open-response reading, short-writing and long-
writing items. For Year 2, English junior reading and English Grade 9 applied
mathematics, the number of items was reduced; however, the basic test structure and
content to be measured were similar between the two years (refer to the Frameworks on
the EQAO Web site: www.eqao.com). For all assessments, the total number of points for
the multiple-choice items is fewer than the total number of points for the open-response
items.
The mean of the θ-distributions is negative but close to zero. This is likely due to
the negative skewness of the distributions (Lord, 1980, pp.49–50). The standard
deviations of the θ-distributions are slightly less than one. Some distributions were
slightly leptokurtic (e.g., English junior reading), others were essentially mesokurtic (e.g.,
OSSLT and English primary writing), while others were somewhat platykurtic (e.g.,
French primary writing).

9
Table 1
Psychometric Characteristics of the Tests and Subtests in the Study
# of items
Assessment Year N MC OR Mean SD Skew. Kurt.
OSSLT 1 150 000 39 12 (50)a -0.01c 0.81 -0.25 3.03
2 150 000 39 12 (50) -0.01 0.85 -0.26 3.03
TPCL 1 5 260 39 12 (50) -0.02 0.88 -0.11 2.80
2 5 260 39 12 (50) -0.02 0.79 -0.20 3.10
Eng Primary
Writing
1 110 000 8 6 (36) -0.01 0.92 -0.14 3.03
2 110 000 8 6 (36) -0.01 0.91 -0.13 3.03
Fre Primary
Writing
1 6 000 8 6 (36) 0.01 0.91 -0.14 2.90
2 6 000 8 6 (36) 0.01 0.90 -0.05 2.88
Eng Junior
Reading
1 132 000 32 12 (48) -0.01 0.93 -0.13 3.29
2 132 000 25 10 (40) -0.01 0.92 -0.24 3.34
Fre Junior
Mathematics
1 5 600 28 8 (32) 0.00 0.93 -0.05 2.64
2 5 600 28 8 (32) 0.00 0.94 -0.07 2.74
Eng Grade 9
Applied Math
1 37 500b 24 12 (30) -0.03 0.92 -0.04 3.20
2 34 441 24 7 (28) -0.03 0.90 -0.17 3.18
a x (y): number of open-response items and the total number of possible points for these items. b Combined winter and spring samples. c The descriptive statistics were based on the θ-scale from the operational calibrations.
IRT Models. The IRT model used to generate the item responses for the OSSLT
and TPCL was a modified Rasch model with guessing fixed to 0.20 for multiple-choice
items and the a-parameter fixed to 0.588. This value of the a-parameter effectively sets
the discrimination to 1.0 because the a-parameter is multiplied by 1.7 in the model. For
the primary, junior and Grade 9 subtests, the two-parameter model with a fixed guessing
parameter added was used for multiple-choice items. For all tests and subtests, the

10
generalized partial credit model was used for open-response items. These IRT models
appear to be the most appropriate for EQAO’s assessments (Xie, 2006).
Steps for Data Simulation. The following two questions guided the development
of the computer simulation for each assessment:
a. What are the true changes (in percentage) at each achievement level?
b. What would the gains be at each achievement level in a real testing situation
after the four equating processes of interest are applied, and how close are
these estimated changes to the true changes?
The following data simulation steps were carried out to help answer these questions.
1. True Percentages
To identify the true percentages in each achievement category, the known θ-
distributions for Year 1 and Year 2 were simulated using the Pearson type-four family
(mean, standard deviation, skewness and kurtosis) of the θ-distributions taken from the
Year 1 and Year 2 operational tests, respectively (see Table 1). Since true changes
between the two years are not known, five possible “true” changes (-0.3, -0.1, 0.0, 0.1
and 0.3 units on the θ-scale) were modelled in the data simulations to reflect different
performance changes. These values span the range of changes in performance that might
be seen in realistic educational settings, although the ±0.3 conditions represent changes
that are larger than those that have been generally observed in the EQAO assessments. To
create the five gain conditions for Year 2, the five gains were added to the mean of the
Year 1 θ-distribution. The known θ-distribution for Year 2 was then simulated for each of
the five gain conditions for each selected test or subtest. The sample sizes used in the
simulations were chosen to be close to the equating samples used in practice for each
assessment. In the equating samples, the students who were accommodated with special
versions and the students who did not respond were excluded. In the case of the OSSLT,
the students who had previously been eligible to write were also excluded from the
equating sample.
Cut scores were determined on the known Year 1 θ-distribution using the EQAO-
reported percentages for each achievement level. These cut scores were then applied to

11
the five simulated known Year 2 θ-distributions to identify the true percentage for each
achievement level.
2. Empirical Percentages
To obtain the empirical percentages, the matrix data that mimic EQAO
assessments have to be simulated. The data simulation includes two stages: a) simulate
the full data set for Year 1 and Year 2 students; b) use the full data set to generate the
matrix data set for calibration. To simulate the full data set, the operational-item
parameters from Years 1 and 2 were combined into one file. The known Year 1 θ-
distribution was also combined with each of the five known Year 2 θ-distributions. The
item-response vectors for the students were then generated for theYear 1 and Year 2 test
forms for each gain condition based on the combined parameter file and true θ-
distributions (see Figure 2).
Year 1 Test Form Year 2 Test Form Sample Year 1
Sample Year 2
Figure 2. Full Data Structure
The vertical axis of the diagram represents students. Those above the mid-point
on the vertical axis are from Year 1 and those below the mid-point are from Year 2. The
horizontal axis represents items. Items to the left of the mid-point on the horizontal axis
are included in the form administered in Year 1 and items to the right are included in the
form administered in Year 2. To create the Year 1 matrix equating sample and the Year 2
operational equating sample, the light grey parts in the diagram are removed from the full
data set. It is believed that the best way to get good information about changes in
students’ performance would be to have both cohorts of students take both tests.
Therefore, creating the equating samples from the ideal full data set seemed reasonable.

12
After the usual equating data sets were created, equating was conducted using the
CC, FCIP, TCC and M/S equating methods to obtain empirical percentages. For the CC
procedure, the Year 1 and Year 2 data sets were combined and calibrated together. In the
case of the TCC and M/S procedures, the Year 1 and Year 2 data sets were first calibrated
separately. Then the TCC and M/S procedures were applied to obtain the linear
transformation coefficients to scale the Year 1 test (equated) to the Year 2 test
(reference). With the FCIP procedures, the two tests were calibrated separately with the
matrix item parameters of the Year 1 test fixed at the values of the Year 2 operational-
item parameters to place the Year 1 test on the Year 2 scale. Similar procedures to those
used in Step 1 were applied to identify a cut score and obtain an empirical percentage for
each achievement level and each gain condition.
Computer Programs. The examinees’ item responses were simulated using
Matlab Datagengpcmv and Datagen3plt. Datagengpcmv was used to simulate responses
for the open-response items and datagen3plt was used to simulate responses for the
multiple-choice items. The simulated item-response distributions were compared with the
actual item-response distributions, and they showed very similar patterns for each of the
selected assessments. PARSCALE was chosen to conduct calibrations because EQAO
uses it for operational IRT calibration and scoring. MULTILOG and PARSCALE
generate similar parameter estimates (Childs and Chen, 1999; Hanson and Beguin, 2002).
However, PARSCALE produces an overall item location parameter and reproduces the
category parameters by centring them to zero (Childs & Chen, 1999). Further, the number
of examinees PARSCALE can handle is much greater.
Evaluation of the FCIP, CC, TCC and M/S Equating Methods. The performance
of the FCIP, CC, TCC and M/S equating methods was evaluated by comparing the
estimated percentage with the corresponding true percentage at each of the four
achievement levels for the primary, junior and Grade 9 assessments and for the successful
and unsuccessful categories for the OSSLT and TPCL. Twenty replications of each
simulation were carried out. The inclusion of a wide variety of assessments was also
considered to be very important for this study.
Descriptive statistics of the empirical percentages across the 20 replications were
computed for each achievement level, equating method and change condition. Each

13
average estimated percentage was compared to the corresponding true percentage to
determine the bias in the empirical estimate:
lillil
n
inBias Δ−Δ=Δ−Δ= Σ
=
)))(1
1, (1)
where il
n
iil n
Δ=Δ Σ=
))
1
1 ,
lΔ is the true value for achievement level l,
ilΔ)
is the estimated value for the ith replication at achievement level l, and
n = 20 is the number of replications (Sinharay & Holland, 2007).
If the bias is negative, then the true percentage is underestimated; if the bias is
positive, then the true percentage is overestimated.
The stability of the empirical percentages across replications was assessed using
the root mean square error (RMSE):
2
1)(1
lil
n
inRMSE Δ−Δ= Σ
=
) (2)
The smaller the RMSE is, the closer the estimated values are to the true values.
For the purposes of this study, bias and RMSE values smaller than or equal to 1%
were considered to be negligible. Differences in bias yielded by two methods had to
exceed 0.50 to be claimed as a meaningful difference. Many large-scale assessment
programs consider a change of 1% from one year to the next to be meaningful.
Results
The results for the OSSLT and TPCL are presented first, followed by the results
for the primary, junior and Grade 9 subtests selected for this study.
OSSLT and TPCL

14
OSSLT. The results for the OSSLT are reported in the top panel of Table 2. The
pattern of bias for the four equating methods is complex. For example, while the CC
method recovered the true change of zero, this procedure did not recover the other
changes as well. While the FCIP, TCC and M/S procedures recovered changes in the
percentages of unsuccessful students equally well across all change conditions, the TCC
and M/S procedures recovered the -0.1 and 0.3 changes much better than the FCIP and
CC procedures did. Overestimates were observed in the positive changes (i.e., an
increases in the percentage of unsuccessful students), with the bias of the CC procedures
being more pronounced than the bias of the FCIP, TCC and M/S procedures (e.g., 3.64%
vs. 0.72%, 0.38% and 0.37% for a true gain of 0.3 on the theta scale). Underestimates
were observed in the negative changes, with the bias of the CC equating procedure larger
than that for the other three procedures for a true change of -0.3 (-5.76% vs. -0.99%, -
1.06% and -1.05%). Overall, the TCC and M/S methods fared slightly better than the
FCIP method, and these three performed much better than the CC method. Expressed in
terms of average RMSE across the five gain conditions, the four equating methods rank
as follows: TCC (0.45%), M/S (0.49%), FCIP (0.59%) and CC (2.52%).
TPCL. As shown in the lower panel of Table 2, the performance of the CC
method was again the poorest at the changes in both directions, with large overestimates
in the positive changes (2.48% for a change of 0.1 and 4.29% for a change of 0.3) and
underestimates 1n the negative changes (-0.89% in a change of -0.1 and -4.57% in a gain
of -0.3). The FCIP, TCC and M/S procedures also overestimated the zero gain.
Interestingly, except for those of -0.3, FCIP, TCC and M/S procedures overestimated rest
of the gains, with -0.1 and 0.1 more pronounced. Again, FCIP, TCC and M/S were
ranked first with an average RMSE of around 1% across the five gain conditions. The CC
procedure showed an average RMSE of 2.66%, which was substantially larger. Lastly,
the magnitude of RMSE for the TPCL was generally larger than the bias for the OSSLT.

15
Table 2
Equating Results for the OSSLT and TPCL: Percentage Unsuccessful for Year 2 Theta
Distribution
Change Method -0.3 -0.1 0 0.1 0.3 OSSLT N = 150 000
True 23.76% 17.72% 15.04% 12.70% 8.65% CC Bias - 5.76% -1.69% -0.03% 1.39% 3.64%
RMSE 5.76% 1.70% 0.11% 1.39% 3.64% FCIP Bias - 0.99% -0.58% -0.11% 0.12% 0.72%
RMSE 1.00% 0.78% 0.18% 0.14% 0.83% TCC Bias - 1.06% -0.37% -0.15% 0.06% 0.38%
RMSE 1.07% 0.41% 0.22% 0.11% 0.44% M/S Bias - 1.05% -0.34% -0.20% 0.02% 0.37%
RMSE 1.09% 0.41% 0.31% 0.22% 0.41% TPCL N = 5260
True 24.43% 17.62% 14.33% 11.43% 7.64% CC Bias -0.17% 0.64% 0.90% 1.34% 0.95%
RMSE 4.59% 0.97% 0.76% 2.52% 4.48% FCIP Bias -0.20% 0.45% 0.66% 1.35% 0.99%
RMSE 0.71% 0.76% 0.75% 1.44% 1.09% TCC Bias -0.17% 0.64% 0.90% 1.34% 0.95%
RMSE 0.72% 1.12% 1.05% 1.46% 1.05% M/S Bias 0.00% 0.00% 0.01% 0.01% 0.01%
RMSE 0.76% 1.09% 0.99% 1.12% 0.84%
Primary, Junior and Grade 9 Assessments
There are four achievement categories for the primary, junior and Grade 9
assessment programs. EQAO also reports on an achievement category below Level 1, but
very few students are in this category so it was combined with Level 1 in this study. The
estimated and true percentages of students in each achievement category were compared
for the CC, FCIP, TCC and M/S procedures. Thus, there are 20 bias estimates (4 levels ×
5 gain conditions) for each test or subtest and equating procedure. The results for the five
subtests (English and French primary writing, English junior reading, French junior
mathematics and English Grade 9 applied mathematics) are presented below.

16
English Primary Writing. The results for English primary writing are provided in
Table 3. First, the bias for the zero change condition was negligible for each achievement
level and for each of the CC, FCIP, TCC and M/S equating methods. Likewise, the bias
was negligible for all of the remaining change conditions for achievement Level 1 for all
four equating methods. Differences appeared among the equating methods for the
remaining conditions and achievement levels. For example, the bias for the CC method
was greater than those for the other procedures at achievement Levels 2, 3, and 4 for
changes of -0.3, -0.1, 0.1 and 0.3. For example, for a change of -0.3 at achievement Level
2, the bias was -8.50% for the CC procedure, -2.47% for the FCIP procedure, -2.37% for
TCC procedure and -2.34% for the M/S procedure. The results for the FCIP, TCC and
M/S were comparable: each method essentially recovered the gain of 0.1 at all
achievement levels, the changes of -0.3 and -0.1 at achievement Level 4 and the change
of 0.3 at achievement Level 3. It is interesting to note that these three procedures were
positively biased at achievement Level 3 and negatively biased at Level 2 for gains of -
0.3 and -0.1, but negatively biased at Level 4 for a gain of 0.3. The results for English
primary writing reveal the poorer performance of the CC equating method with the
largest amount of bias and largest RMSE and the equal performance of the FCIP, TCC
and M/S procedures across the five change conditions.
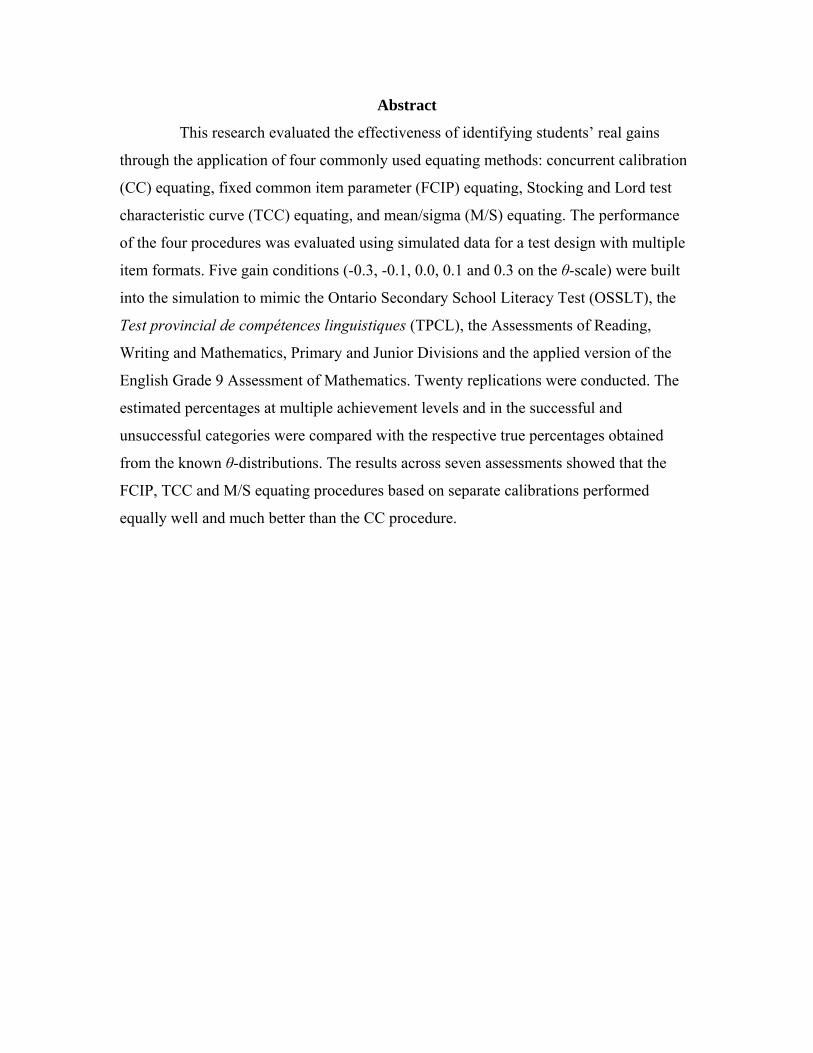
French Primary Writing. The equating results for French primary writing are
presented in Table 4. A comparison of these results with the results for English primary
writing reveals differences between the two subtests. For example, while the bias was
again small for all four equating procedures at achievement Level 1 for all change
conditions, the bias was relatively large for each equating procedure at Levels 2, 3 and 4.
Although the direction of bias was noticeable for all the changes but 0.0, it did not follow
a clear pattern.

17
Table 3 Equating Results for English Primary Writing: Percentage at Each Achievement Level for Year 2 Theta Distributions (N = 110 000)
CC FCIP TCC M/S
Change Level 4 3 2 1 4 3 2 1 4 3 2 1 4 3 2 1
-0.3 True 2.87 54.13 42.15 0.85
Bias 2.22 6.50 -8.50 -0.23 0.33 2.07 -2.47 0.08 0.35 1.96 -2.37 0.06 0.36 1.93 -2.34 0.06 RMSE 2.23 6.51 8.51 0.23 0.34 2.10 2.50 0.09 0.38 2.01 2.42 0.08 0.40 1.99 2.42 0.08
-0.1 True 4.87 60.52 34.05 0.55
Bias 0.86 2.10 -2.94 -0.02 -0.01 0.94 -0.99 0.05 0.01 0.97 -1.02 0.05 0.07 1.00 -1.12 0.05 RMSE 0.87 2.10 2.95 0.03 0.11 0.98 1.03 0.06 0.10 1.00 1.07 0.06 0.16 1.05 1.18 0.06
0 True 6.19 63.25 30.14 0.42 Bias -0.41 0.74 -0.42 0.09 -0.63 1.30 -0.76 0.09 -0.62 1.33 -0.80 0.08 -0.62 1.31 -0.78 0.09 RMSE 0.47 0.81 0.45 0.10 0.73 1.43 0.82 0.10 0.71 1.47 0.87 0.09 0.70 1.47 0.93 0.10
0.1 True 7.70 65.50 26.51 0.29
Bias -1.40 -0.80 2.04 0.16 -0.52 0.34 0.11 0.07 -0.55 0.38 0.10 0.08 -0.54 0.35 0.11 0.08 RMSE 1.42 0.85 2.05 0.16 0.67 0.52 0.23 0.08 0.62 0.46 0.24 0.08 0.65 0.44 0.30 0.09
0.3 True 11.64 67.90 20.31 0.15
Bias -4.66 -1.49 5.96 0.20 -1.31 0.48 0.76 0.07 -1.31 0.49 0.76 0.06 -1.24 0.35 0.82 0.07 RMSE 4.67 1.50 5.96 0.20 1.36 0.54 0.79 0.07 1.36 0.54 0.79 0.07 1.34 0.49 0.89 0.07
18
Table 4 Equating Results for French Primary Writing: Percentage at Each Achievement Level for Year 2 Theta Distributions (N = 6000)
CC FCIP TCC M/S
Change Level 4 3 2 1 4 3 2 1 4 3 2 1 4 3 2 1
-0.3 True 9.27 57.28 32.20 1.23
Bias 3.42 2.88 -5.83 -0.47 -0.03 0.01 -0.01 0.03 -0.08 -0.13 0.16 0.06 -0.18 -0.47 0.53 0.12 RMSE 3.45 2.97 5.87 0.48 0.54 1.24 1.12 0.28 0.72 1.30 1.25 0.30 1.36 1.64 2.03 0.37
-0.1 True 12.81 60.05 26.35 0.78
Bias 1.27 1.06 -2.19 -0.14 -0.56 0.22 0.31 0.03 -0.59 0.14 0.43 0.03 -0.46 -0.53 0.88 0.12 RMSE 1.34 1.25 2.26 0.16 0.92 1.10 0.87 0.14 1.00 1.12 1.07 0.15 1.50 1.25 1.89 0.23
0 True 16.49 60.45 22.63 0.42
Bias -0.80 0.49 0.24 0.08 -0.65 0.35 0.23 0.08 -0.52 0.24 0.20 0.09 0.18 -0.23 -0.04 0.11 RMSE 0.89 0.78 0.59 0.12 1.09 1.09 0.84 0.14 1.19 1.15 0.99 0.14 2.07 1.40 1.71 0.16
0.1 True 18.71 60.57 20.38 0.33
Bias -2.01 0.32 1.56 0.14 -0.10 -0.45 0.43 0.12 0.23 -0.57 0.23 0.12 1.44 -1.26 -0.31 0.13 RMSE 2.07 0.78 1.65 0.17 1.08 1.35 0.86 0.18 1.32 1.58 0.97 0.18 3.15 2.49 2.03 0.22
0.3 True 26.06 59.75 14.02 0.17
Bias -7.38 2.13 5.05 0.21 -2.01 0.73 1.22 0.07 -1.58 0.42 1.10 0.08 -0.31 -0.56 0.80 0.08 RMSE 7.39 2.18 5.05 0.22 2.40 1.45 1.33 0.09 2.18 1.56 1.22 0.10 2.93 2.38 1.40 0.11

19
With the CC procedure, negative estimates were observed for changes of
-0.1 and -0.3 at Levels 1 and 2, while for Levels 3 and 4 positive estimates were shown.
For the positive changes, positive estimates were observed for Levels 1, 2 and 3, and
negative estimates were shown at Level 4. For the FCIP and TCC procedures, except for
a change of 0.0 at Level 4, the bias was mostly positive. For the M/S procedure, positive
and negative biases were observed for Levels 1 and 2 and Levels 3 and 4, respectively.
The CC procedure showed a significantly larger bias and RMSE for all conditions but a
gain of 0.0. For all procedures, the farther the gain condition departed from 0.0, the
greater the observed bias and RMSE.
Over all five change conditions, the size of the bias and RMSE tended to be
greater than those for English primary writing. This may be attributable to the difference
in sample size, although the same finding was not observed for the OSSLT and TPCL
(where the difference between the number of French and English students was
approximately the same).
French Junior Mathematics. The results for French junior mathematics are
reported in Table 5. The CC procedure again resulted in a much larger bias and RMSE at
Levels 2 and 4 for a change of -0.1 and -0.3 and Levels 2 to 4 for a change of 0.3. In
contrast, FCIP and TCC performed similarly and yielded a negligible bias and much
smaller RMSE at all achievement levels across all gain conditions. Compared with the
FCIP and TCC procedures, the M/S procedure did not perform as well. For quite a few
cases the bias was negligible but the RMSE was fairly large, which indicates that the
behavior of the M/S procedure was not as stable as that of the FCIP and TCC. For
example, for a change of 0.3 at Level 3, the bias was -0.25 but the RMSE was 3.24. The
positive and negative estimates were observed and no clear pattern was shown. The
magnitude of the bias and RMSE tends to be smaller than those observed for English and
French primary writing in most cases. The three assessments showed that the
performance of the CC procedure was the poorest. The FCIP, TCC and M/S
demonstrated very similar performance. However, the M/S yielded larger RMSE in some
cases, indicating less stable performance than the other two procedures.

20
Table 5 Equating Results for French Junior Mathematics: Percentage at Each Achievement Level for Year 2 Theta Distributions (N = 5600)
CC FCIP TCC M/S Change Level 4 3 2 1 4 3 2 1 4 3 2 1 4 3 2 1
-0.3 True 19.44 52.51 26.64 1.41
Bias 3.99 0.20 -3.52 -0.67 0.39 0.14 -0.18 -0.34 0.73 -0.03 -0.34 -0.35 0.98 -0.49 -0.22 -0.27 RMSE 4.01 0.66 3.57 0.69 0.70 0.79 0.93 0.40 0.90 0.90 0.91 0.42 1.29 1.98 1.22 0.49
-0.1 True 26.69 50.63 21.85 0.82 Bias 1.55 0.41 -1.63 -0.33 0.46 0.32 -0.55 -0.22 0.68 0.05 -0.52 -0.21 1.47 -0.93 -0.41 -0.13 RMSE 1.62 0.75 1.68 0.35 0.75 0.92 0.87 0.28 0.89 0.82 0.80 0.27 1.87 2.44 1.69 0.31
0 True 29.3 52.22 17.93 0.55 Bias 0.62 -0.68 0.08 -0.02 0.36 -0.50 0.15 0.00 0.72 -0.77 0.06 0.00 1.48 -1.78 0.26 0.04 RMSE 0.95 1.03 0.42 0.15 1.09 1.13 0.62 0.17 1.26 1.32 0.43 0.17 2.13 2.80 1.08 0.23
0.1 True 32.28 50.33 17.05 0.34 Bias -0.64 0.37 0.15 0.12 0.06 0.30 -0.32 0.08 0.56 -0.13 -0.37 0.08 1.36 -0.96 -0.29 0.11 RMSE 0.81 0.83 0.63 0.16 0.77 1.22 0.67 0.14 1.01 1.27 0.77 0.14 1.91 2.35 1.22 0.18
0.3 True 42.01 45.44 12.35 0.2 Bias -4.92 2.73 2.10 0.10 -1.00 0.75 0.22 0.03 -0.54 0.24 0.25 0.05 -0.14 -0.25 0.32 0.07 RMSE 4.93 2.88 2.23 0.13 1.12 0.94 0.64 0.09 0.64 0.61 0.48 0.14 1.51 3.24 1.62 0.22

21
English Junior Reading. While the patterns of bias were not identical, the size of
the biases for English junior reading (Table 6) tended to be more similar to the values
observed for the OSSLT than for the other tests and subtests. This finding is likely
attributable to the larger sample sizes (132 000).
Although the CC recovered the true change of 0.0, it did not recover other
changes as well. For the negative changes, underestimates were observed for
achievement Levels 1 and 2 and overestimates for achievement Levels 3 and 4, with the
bias more pronounced for the change condition of -0.3. For the positive changes, the
pattern was reversed. Although the CC procedure performed better with English junior
reading than with other subtests and tests, compared to the other three procedures, much
larger bias and RMSE were observed for the change of -0.3 at all achievement levels, as
well as for the change of 0.3 at Levels 2 and 4. In contrast, the other three procedures
performed almost equally well, with the size of bias and RMSE less than 1%.
English Grade 9 Applied Mathematics. The results for this subtest were very
similar to those for English junior reading. Overall, the CC method performed the worst
(see Table 7). Substantial overestimates and underestimates were shown for the two
extreme change conditions. For a change of -0.3, overestimates were yielded for Levels 1
and 2 and underestimates for Levels 3 and 4. For a change of 0.3, the pattern was
reversed. The largest bias was greater than 5%. The other three methods performed much
better than the CC procedure, and equally well, with FCIP and TCC showing slightly
larger biases and RMSE than M/S at Level 2 for a change of 0.3. Otherwise, the
magnitude of bias was smaller than 1% across all conditions and achievement levels.

22
Table 6
Equating Results for English Junior Reading: Percentage at Each Achievement Level for Year 2 Theta Distribution (N = 132 000) CC FCIP TCC M/S
Change Level 4 3 2 1 4 3 2 1 4 3 2 1 4 3 2 1
-0.3 True 4.31 53.82 32.45 9.42
Bias 1.52 2.93 -2.19 -2.16 0.34 0.05 0.24 -0.53 0.36 -0.01 0.23 -0.47 0.37 -0.07 0.22 -0.43 RMSE 1.52 2.94 2.19 2.17 0.34 0.19 0.29 0.54 0.36 0.20 0.28 0.49 0.38 0.25 0.28 0.47
-0.1 True 6.76 59.39 27.08 6.77
Bias 0.55 0.40 -0.17 -0.78 0.12 -0.34 0.49 -0.27 0.13 -0.36 0.50 -0.26 0.16 -0.38 0.48 -0.26 RMSE 0.56 0.42 0.22 0.78 0.14 0.38 0.52 0.28 0.15 0.41 0.53 0.28 0.20 0.44 0.52 0.28 0 True 8.20 61.21 24.96 5.63 Bias -0.12 -0.40 0.76 -0.30 -0.03 -0.55 0.73 -0.15 -0.01 -0.52 0.66 -0.13 0.00 -0.57 0.68 -0.10 RMSE 0.13 0.41 0.80 0.31 0.10 0.60 0.76 0.17 0.10 0.54 0.68 0.15 0.12 0.63 0.70 0.16
0.1 True 9.79 63.19 22.33 4.68
Bias -0.97 -0.82 1.79 0.00 -0.11 -0.57 0.82 -0.14 -0.21 -0.46 0.81 -0.14 -0.19 -0.45 0.79 -0.14 RMSE 0.98 0.83 1.80 0.05 0.33 0.67 0.82 0.15 0.24 0.51 0.82 0.16 0.23 0.54 0.81 0.18
0.3 True 14.25 65.20 17.47 3.08
Bias -3.86 0.18 3.36 0.32 -0.90 0.08 0.94 -0.12 -0.91 0.10 0.93 -0.12 -0.89 0.05 0.94 -0.11 RMSE 3.86 0.22 3.36 0.33 0.91 0.20 0.94 0.12 0.93 0.21 0.94 0.13 0.91 0.23 0.95 0.12

23
Table 7
Equating Results for English Grade 9 Applied Mathematics: Percentage at Each Achievement Level for Year 2 Theta Distribution
(N = 34 441) CC FCIP TCC M/S
Change Level 4 3 2 1 4 3 2 1 4 3 2 1 4 3 2 1
-0.3 True 2.64 27.09 43.10 27.17
Bias 0.96 5.01 -0.43 -5.53 0.13 0.55 0.22 -0.90 0.08 0.35 0.27 -0.70 0.18 0.13 -0.27 -0.04 RMSE 1.00 5.26 0.58 5.77 0.15 0.60 0.47 0.99 0.14 0.53 0.61 0.90 0.27 0.64 0.86 1.01
-0.1 True 4.17 33.86 41.82 20.15
Bias 0.39 1.07 -0.32 -1.14 0.01 -0.07 0.39 -0.33 0.02 0.00 0.30 -0.33 0.19 0.08 -0.12 -0.14 RMSE 0.42 1.16 0.41 1.23 0.17 0.29 0.52 0.46 0.24 0.38 0.59 0.46 0.37 0.69 0.74 0.77 0 True 5.23 37.07 40.43 17.27 Bias -0.22 -0.52 0.52 0.22 -0.14 -0.25 0.38 0.00 -0.12 -0.25 0.32 0.05 0.08 -0.19 -0.05 0.17 RMSE 0.41 0.62 0.83 0.29 0.19 0.35 0.46 0.23 0.28 0.50 0.51 0.49 0.42 0.73 0.68 0.79
0.1 True 6.44 40.47 38.74 14.35
Bias -0.65 -2.02 1.09 1.58 -0.35 -0.55 0.58 0.33 -0.44 -0.41 0.71 0.14 -0.37 -0.39 0.61 0.16 RMSE 0.77 2.12 1.32 1.62 0.37 0.66 0.69 0.41 0.48 0.55 0.81 0.32 0.49 0.73 0.86 0.54
0.3 True 9.54 46.30 34.23 9.93
Bias -2.15 -4.39 3.38 3.16 -0.73 -0.90 1.14 0.49 -0.62 -0.91 1.01 0.52 -0.40 -0.74 0.72 0.41 RMSE 2.23 4.49 3.49 3.23 0.78 0.99 1.16 0.54 0.72 1.01 1.07 0.58 0.63 0.99 0.94 0.60

24
Discussion
The present study examined the performance of the CC, FCIP, TCC, and M/S
equating procedures in recovering the change in student performance between two
successive years using bias and RMSE. Five change conditions (-0.3. -0.1, 0, 0.1 and 0.3)
on the θ-scale were considered. Seven of EQAO’s tests or subtests with different
complexity and student sample sizes were selected: the OSSLT and TPCL, English and
French primary writing, French junior mathematics, English junior reading and English
Grade 9 applied mathematics.
The results revealed that bias and RMSE followed a complex pattern across the
five change conditions and seven assessments. The CC procedure yielded a substantially
larger bias than the other three equating procedures, except in the cases of the zero gain
condition. The magnitude of bias was as large as 8.50% in absolute value. For all
equating procedures, a larger bias was observed for the two extreme change conditions
(±0.3) but not always for a given assessment. This effect was more pronounced with the
CC method. In contrast, the FCIP, TCC and M/S produced much smaller biases. The
maximum bias was approximately 2% in absolute value. Smaller biases were found for
the English assessments than for the French assessments, which was likely due to the
differences in sample sizes. For the OSSLT and TPCL, underestimates were shown in the
negative gains while overestimates were indicated in the positive gains. Among the other
assessments with multiple achievement categories, underestimates and overestimates
varied.
The substantially large bias and RMSE revealed by the CC procedure with
change in group performance indicated that it generally failed to handle non-equivalent
groups. This finding was consistent with those of previous studies involving both
equivalent and non-equivalent groups (Petersen et al., 1983; Hills et al., 1988; Hu et al.,
2008).
Of the three separate-calibration and -equating procedures, the M/S procedure
seemed to be more sensitive to sample size. Greater variations in bias results across
replications were observed for the M/S procedure when the French tests and subtests
were used. The M/S procedure used the mean and standard deviation of the parameters to
determine the linear transformation coefficients. According to Yen and Fitzpatrick

25
(2006), there are two major limitations to this method: a) item parameters are treated as
independent entities and outliers can significantly affect the results and b) if one set of
item-parameter estimates is based on a smaller sample of examinees than another, the
error variances of the two sets of item parameters will be different. In this case, if the
variances of the two sets of estimates are set as equal (as in the M/S procedure), a
systematic bias in results will occur through “shrinking” in the set of results with greater
error variance to match the set with less error variance. That is, the variances of the
estimates will be equal, but the variances of the true values will not be equal (Yen &
Fitzpatrick, 2006). In the case of the French assessments, the sample sizes were small due
to the matrix design used to field-test items in Year 1. For example, for French junior
mathematics, there were 10 matrix blocks, resulting in a sample size of approximately
560 students. This may have led to unstable item-parameter estimates, which would
adversely affect the mean and standard deviation.
In contrast to the M/S procedure, the TCC equating procedure obtained linking
coefficients by minimizing the difference between the test characteristic curves for the
two test administrations. According to Yen & Fitzpatrick (2006), one of the most
important advantages of the TCC method is that it minimizes differences in expected
scores rather than in observed scores or parameters. In doing so, the parameters or thetas
are aligned, thereby reducing the variance across replications.
For the assessments with multiple performance levels, the largest bias was shown
for English and French primary writing. These two subtests had only 14 items and 38
maximum possible scores. These results seem to suggest that a short test may affect, to
varying degrees, the performance of the equating methods, with the CC method
substantially affected, followed by the M/S procedure. Still, the French primary writing
subtest was likely to produce the confounding effect of short test and small sample on the
equating methods (see Table 4).
Although the FCIP procedure outperformed the other equating methods in this
study, one has to be careful in its application. Yen & Fitzpatrick (2006) pointed out that
one of the important features of the FCIP procedure is that by holding the common item
parameters fixed, it forces the parameter estimation program to accommodate the

26
common item parameter values (i.e., to treat them as if they are true values). Therefore, in
applying this method, it is critical that the common item parameters fit the new sample of
data. Otherwise, the FCIP can adversely affect the estimation of the parameters of the
non-common items. When FCIP is used in linking, the shift in item parameters from field
test to operational test should be carefully scrutinized. An item with large parameter shift
should be dropped from the linking process.
Because of the complexity of the test structures, multiple subjects and
achievement levels of the assessments used in this study, a higher-level summary of the
results was necessary in order to get an overall impression of the performance of the four
equating procedures. Table 8 displays the average absolute value of bias and RMSE over
the five change conditions for the OSSLT and TPCL for each equating method.
Table 8
Average Bias and RMSE for the Assessments with Successful and Unsuccessful Categories
Assessment Gain CC FCIP TCC M/S Bias RMSE Bias RMSE Bias RMSE Bias RMSE
OSSLT -0.3 -5.76 5.76 -0.99 1.00 -1.06 1.07 -1.05 1.09 -0.1 -1.69 1.70 -0.58 0.78 -0.37 0.41 -0.34 0.41
N = 150 000 0 -0.03 0.11 -0.11 0.18 -0.15 0.22 -0.20 0.31 N = 51 0.1 1.39 1.39 0.12 0.14 0.06 0.11 0.02 0.22
0.3 3.64 3.64 0.72 0.83 0.38 0.44 0.37 0.41 Average Over
Conditions 2.50 2.52 0.50 0.59 0.40 0.45 0.39 0.49
TPCL -0.3 -4.57 4.59 -0.20 0.71 -0.17 0.72 -0.14 0.76 -0.1 -0.89 0.97 0.45 0.76 0.64 1.12 0.63 1.09
N = 5260 0 0.73 0.76 0.66 0.75 0.90 1.05 0.73 0.99 N = 51 0.1 2.48 2.52 1.35 1.44 1.34 1.46 0.95 1.12
0.3 4.29 4.48 0.99 1.09 0.95 1.05 0.71 0.84 Average Over
Conditions 2.59 2.66 0.73 0.95 0.80 1.08 0.63 0.96 Note: N = sample size; n = no. of items
Table 9 lists the average absolute value of bias and RMSE over the five change
conditions and four achievement levels for each primary or junior subtest and equating
method.

27
Table 9
Average Bias and RMSE for Assessments with Multiple Achievement Levels
Assessment Gain CC FCIP TCC M/S Bias RMSE Bias RMSE Bias RMSE Bias RMSE
French Junior Math
-0.3 2.09 2.23 0.26 0.71 0.36 0.78 0.49 1.24 -0.1 0.98 1.10 0.39 0.70 0.37 0.69 0.73 1.58
N = 5600 0 0.35 0.64 0.25 0.75 0.39 0.80 0.89 1.56 n = 35 0.1 0.32 0.61 0.19 0.70 0.29 0.80 0.68 1.41
0.3 2.46 2.54 0.50 0.70 0.27 0.47 0.20 1.65 Average Over
Conditions 1.24 1.42 0.32 0.71 0.34 0.71 0.60 1.49
English Junior Reading
-0.3 2.20 2.20 0.29 0.34 0.27 0.33 0.27 0.35 -0.1 0.48 0.49 0.31 0.33 0.31 0.34 0.32 0.36
N = 132 000 0 0.39 0.41 0.37 0.41 0.33 0.37 0.34 0.40 n = 36 0.1 0.90 0.92 0.41 0.49 0.40 0.43 0.39 0.44
0.3 1.93 1.94 0.51 0.55 0.52 0.55 0.50 0.55 Average Over
Conditions 1.18 1.19 0.38 0.42 0.37 0.41 0.36 0.42
English Junior Writing
-0.3 4.36 4.37 1.23 1.26 1.18 1.22 1.17 1.22 -0.1 1.48 1.49 0.50 0.55 0.51 0.56 0.56 0.61
N = 110 000 0 0.42 0.46 0.69 0.77 0.71 0.79 0.70 0.80 n = 14 0.1 1.10 1.12 0.26 0.38 0.28 0.35 0.27 0.37
0.3 3.08 3.08 0.65 0.69 0.66 0.69 0.62 0.70 Average Over
Conditions 2.09 2.10 0.67 0.73 0.67 0.72 0.66 0.74
French Junior Writing
-0.3 3.15 3.19 0.02 0.79 0.11 0.89 0.31 1.28 -0.1 1.17 1.25 0.28 0.76 0.30 0.84 0.49 1.18
N = 6000 0 0.40 0.60 0.33 0.79 0.26 0.87 0.13 1.31 n = 14 0.1 1.01 1.17 0.27 0.87 0.29 1.01 0.77 1.94
0.3 3.69 3.71 1.01 1.32 0.79 1.26 0.43 1.70 Average Over
Conditions 1.88 1.98 0.38 0.91 0.35 0.97 0.43 1.48
English Grade 9 Math
-0.3 2.98 3.15 0.45 0.55 0.35 0.55 0.15 0.70 -0.1 0.73 0.81 0.20 0.36 0.16 0.42 0.13 0.64
N = 34 441 0 0.37 0.54 0.19 0.31 0.19 0.45 0.12 0.65 n = 31 0.1 1.34 1.46 0.45 0.53 0.42 0.54 0.38 0.65
0.3 3.27 3.36 0.81 0.87 0.76 0.85 0.57 0.79 Average Over
Conditions 1.74 1.86 0.42 0.52 0.38 0.56 0.27 0.69 Note: N = sample size; n = no. of items
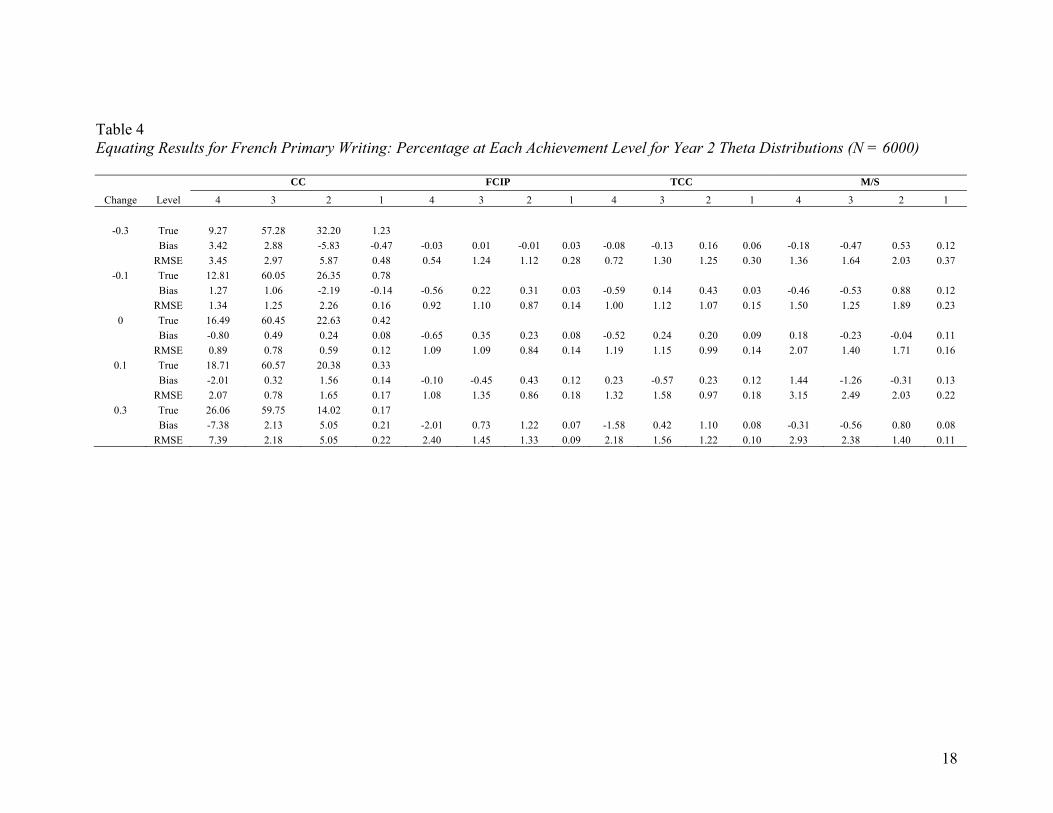
As shown in Tables 8 and 9, the average RMSE is substantially larger for the CC
procedure than for the other three equating procedures across all assessments. The FCIP
28
produced the most accurate and precise estimates, with less than 1% average RMSE over
the achievement levels and gain conditions regardless of assessment, test length or
sample size. The TCC procedure performed as well as FCIP in all cases except for the
OSSLT and TPCL, which showed slightly higher average RMSE (1.08%). The M/S
worked less well with assessments involving small samples (French primary writing and
French junior mathematics) showing substantially larger average RMSE. All equating
procedures seemed to be more affected by sample size than test length to some extent;
however, the M/S procedure seemed to be much more sensitive to sample size. An
overall picture of the study showed that FCIP and TCC performed equally well, followed
by M/S. The CC procedure ranked last.
The findings of this study are different from the findings of previous researchers.
For example, Keller et al. (2004) found that, of the CC, TCC, FCIP and M/S equating
procedures, the M/S procedure performed best in recovering changes. The CC procedure
tended to underestimate decreases in student performance and overestimate increases.
Skorupski et al. (2003) found that both the CC and FCIP procedures underestimated
growth, while Keller (2002) found that the CC and the FCIP procedures tended to
overestimate growth. In the present study, no clear pattern was observed across
achievement categories within and across subtests and tests. While average RMSE were
reported, these were taken across the categories and should not mask the presentation of
results by achievement category. As stated in the results section, the patterns of
performance of the four equating procedures across gain conditions and achievement
categories were somewhat complex.
Several factors likely contributed to the fact that the findings of the present study
differ from those of the previous studies. First, whereas in other research the true θ and
change were unknown or only the recovery of the true θ and parameters were examined,
this study examined the percentage at each achievement level, classified by the four
equating procedures. Second, most of the previous researchers used real data or simulated
data based on a standard normal-ability distribution, while data in this study were
simulated using students’ actual ability distributions, which were not normal in form, and
operational item parameters to model seven different real assessments. Third, the data in
the previous studies were usually simulated to mimic tests and assessments consisting

29
only of dichotomously scored items, while the simulated data in this study mimicked tests
and assessments consisting of both dichotomously and polytomously scored items.
Fourth, because of the matrix design used by EQAO in test construction, the number of
items used to link the two years’ assessments was much larger, and the linking
parameters estimated in the operational sample (rather than smaller field-test samples)
were more stable. All of this led to a much stronger linking effect in this study. Finally,
this study covered a wide range of subjects that used different sample sizes and
populations (English and French), while the previous studies were often focused on a
single subject matter.
To summarize, the major contribution of the current study is that it provided much
more comprehensive information concerning the performance of the four equating
methods than the previous studies.
Conclusion
The results obtained in the present study across the five change conditions and the
seven assessments suggest that it is reasonable for EQAO to continue its current
procedures (FCIP) for equating the primary, junior and Grade 9 assessments and the
OSSLT and TPCL. None of the other three procedures examined in this study
consistently yielded results that were better than those FCIP did.
In future research, when doing calibration using PARSCALE, multiple weights
updating distributions and multiple EM cycles (MWU-MEM) used in FCIP (Kim, 2006)
should be examined. According to Kim, the MWU-MEM estimation method produced
the best recovery of the parameters among other estimation methods. In addition, several
factors could also be included in future research designs. The impact of missing data,
which often occurs in large-scale assessments, could be considered. The impact that
outliers in the set of the common items (Hu et al., 2008) might have on the equating
methods could be examined. A more explicit investigation could be conducted on the
effect of different proportions of polytomous items and the interaction with different
sample sizes. One approach to a more explicit study of sample size would be to examine
French and English populations for all assessments. Finally, the number of replications
should be increased to determine if the consistency across replications is maintained.

30
References
Angoff, W. H. (1984). Scales, norms, and equivalent scores. Princeton, NJ: Educational
Testing Service.
Bishop, N. S., Sharairi, S., Swift, D., Lei, P. & Domaleski D. (2006). Comparing
achievement growth over multiple years using different IRT scale transformation
procedures. Paper presented at the Annual Meeting of the National Council on
Measurement in Education, San Francisco, April, 2006.
Childs, R. A. & Chen, W. H. (1999). Obtaining comparable item parameter estimates in
MULTILOG and PARSCALE for the two polytomous IRT models. Applied
Psychological Measurement. 23(4), 371–379.
Cohen, A. S. & Chen, Seock-Ho. (1998). An investigation of linking methods under the
graded response model. Applied Psychological Measurement, 22(2), 116–130.
Hanson, B. A. & Beguin, A. A. (2002). Obtaining a common scale for item response
theory item parameters using separate versus concurrent estimation in the
common-item equating design. Applied Psychological Measurement. 26(1), 3–
24.
Hills, J. R., Subhiyah, R. G. & Hirsch, T. M. (1988). Equating minimum-competency
tests: Comparison of methods. Journal of Educational Measurement, 25 (3), 221–
231.
Hu, H., Roger, W. T. & Vukmirovic, Z. (2008). Investigation of IRT-based equating
methods in the presence of outlier common items. Applied Psychological
Measurement. 32(4), 311–333.
Keller, L. A., Skorupski, W. P., Swaminathan, H. & Jodoin, M. G. (2004). An evaluation
of Item Response Theory equating procedures for capturing changes in examinee
distributions with mixed-format tests. Paper presented at the annual meeting of
the National Council on Measurement in Education, April, 2004.
Kim, S. (2006). A comparative study of IRT fixed parameter calibration methods.
Journal of Education Measurement, 43, 355–381.
Kim, S. & Cohen, A. S. (1998). A comparison of linking and concurrent calibration
under item response theory. Applied Psychological Measurement. 22, 131–143.
Kolen, M. J. & Brennan, R. L. (2004). Test equating, scaling, and linking: Methods and

31
Practices. New York: Springer.
Lee, W. & Ban, J. (2010). A comparison of IRT linking procedures. Applied
Measurement in Education, 23, 23–48.
Lehman, R. S. & Bailey, D. E. (1968). Digital computing: Fortran IV and its
applications in behavioral science. New York: John Wiley.
Li, Y. H., Griffith, W. D. & Tam, H. P. (1997). Equating multiple tests via an IRT linking
design utilizing a single set of anchor items with fixed common item parameters
during calibration process. Paper presented at the annual meeting of the
Psychometric Society, Knoxville, TN.
Li, Y. H., Lizzitz, R. W. & Yang, Y-N. (1999). Estimating IRT equating coefficients for
tests with polytomously and dichotomously scored items. Paper presented at the
Annual Meeting of the National Council on Measurement in Education, Montreal,
QC.
Linn, R. L., Levine, M. V., Hastings, C. N. & Wardrop, J. L. (1980). An investigation of
item bias in a test of reading comprehension (Technical Report No. 163). Urbana,
IL: Center for the Study of Reading, University of Illinois.
Lord, F. M. (1980). Applications of item response theory to practical testing problems.
New Jersey: Hillsdale.
Loyd, B. H. & Hoover, H. D. (1980). Vertical equating using the Rasch model. Journal
of Educational Measurement, 17, 179–193.
Marco, G. L. (1977). Item characteristic curve solutions to three intractable testing
problems. Journal of Educational Measurement, 14, 139–160.
Petersen, N. S., Cook, L. L., & Stocking, M. L. (1983). IRT versus conventional
equating methods: A comparative study of scale stability. Journal of Educational
Statistics, 8, 137–156.
Prowker A. & Camilli, G. (2006). Long-term stability of two common equating methods:
what no child left behind could mean for equating practices. Paper presented at
the Annual Meeting of the National Council on Measurement in Education, San
Francisco, April, 2006.
Psychometric Society. (1979). Publication policy regarding Monte Carlo studies.
Psychometrika, 44, 133–134.

32
Sinharay, S. & Holland, P. W. (2007). Is it necessary to make anchor tests mini-versions
of the tests being equated or can some restrictions be relaxed? Journal of
Educational Measurement, 44(3), 249–275.
Skorupski, W. P., Jodoin, M. G., Keller, L. A. & Swaminatthan, H. (2003). An
evaluation of equating procedures for capturing growth. Paper presented at the
meeting of the National Council on Measurement in Education, Chicago, IL.
Stocking, M. L. & Lord, F. M. (1983). Developing a common metric in item response
theory. Applied Psychological Measurement, 7, 201–210.
Wingersky, M. S., Cook, L. L. & Eignor, D. R. (1987). Specifying the characteristics of
linking items used for item response theory item calibration. (ETS research
Report 87 – 24). Princeton, NJ: Educational Testing Service.
Xie, Y., (2006). Study of psychometric issues for EQAO assessments. Unpublished paper,
Education Quality and Accountability Office.
Yen, M. W. & Fitzpatrick, A. R. (2006). Item Response Theory. Educational
Measurement (4th ed.).

Education Quality and Accountability Office, 2 Carlton Street, Suite 1200, Toronto ON M5B 2M9, 1-888-327-7377, www.eqao.com
© 2010 Queen’s Printer for Ontario