Embed Size (px)
Citation preview
International Journal of Economics, Commerce and Management United Kingdom Vol. IV, Issue 12, December 2016
Licensed under Creative Common Page 689
http://ijecm.co.uk/ ISSN 2348 0386
A COMPARISON OF FINANCIAL PERFORMANCE BETWEEN
SAUDI SAMBA BANK AND JORDANIAN ARAB BANK
BY USING DUPONT MODEL
Ahmad Aref Almazari
King Saud University, Community College, Administrative Sciences Department, Saudi Arabia
[email protected], [email protected]
Abstract
This study basically aimed at comparing the financial performance of Saudi Samba bank with
Jordanian Arab bank from 2010-2015 by using the DuPont model of financial analysis. Samba
and Arab banks are considered among the largest banks by market value in Saudi Arabia and
Jordan. The DuPont model is derived from an analysis of return on equity that divides
performance into three parts: Operating efficiency ratio which is measured by profit margin,
asset use efficiency which is measured by total asset turnover, and financial leverage which is
measured by the equity multiplier. The results of the study discover that, the SAMBA and Arab
bank ROE is greater than the ROA, which will ultimately lead to higher performance. In this
regard, SAMBA bank performance was much higher than the Arab bank. Net profit margin
shows a relative stability for SAMBA bank over the years of study with minimum volatility, while,
net profit margin for Arab bank was fluctuating over the years of study. The equity multiplier was
declining for SAMBA bank and was almost stable indicators for Arab bank, and it shows that
these banks has relied on debt to a higher degree. Asset utilization shows a decline for SAMBA
bank over the years of study, and with a minimum volatility for Arab bank. The author
recommends that empirical studies are required which would be a source of help to
academicians, bankers, and policy makers.
Keywords: DuPont analysis, Net profit margin, Total asset turnover, Equity multiplier, Return on
equity, Financial Statements, Net Income, Assets, Liabilities
© Almazari
Licensed under Creative Common Page 690
INTRODUCTION
The Du Pont model was developed as a tool for analyzing business performance. There are
three financial analysis measures used in this model: operating profit margin (OPM), asset
turnover ratio (ATR) and equity multiplier (EM). Operating profit or efficiency ratio which is also
known as financial performance ratio is measured by operating profit margin (OPM). The OPM
measures a business’ before tax returns in relation to its volume of sales. While the Asset
Turnover Ratio (ATR) measures the efficiency of the business’ asset and it is used to determine
if assets was utilized efficiently. In addition to that, financial leverage is used to measure the
equity multiplier which shows to what extent the bank relies on debts in it is business. In order to
increase operating profit margin a commercial banks might increase its interests and control
costs effectively. The higher the net profit margin of a business, the more effective it will be at
converting revenue into actualprofit. The asset utilization ratio measures how the bank
management could make the best utilization of it is assets to generate revenues. Financial
leverage ratio is measured by equitymultiplier. The equity multiplier which is measured by total
assets divided by stockholders equity, shows how a company’s could make the best use of it is
debts to finance its assets. Over time the Du Pont model has been expanded to include the
analysis of return on equity (ROE) which is also very important measure of profitability and it is
calculated by dividing earnings after taxes on stockholders equity. Return on equity show how
much a bank can gain revenues for it is shareholders. The higher the bank’s return on equity,
the better is performance.
The present study compares the financial performance of SAMBA bank of Saudi Arabia
with Arab bank of Jordan. Both banks are largest by market value and considered one of the
largest financial institutions in Middle East. These banks are operating in a very competitive
environment with huge amount of investments. The main objective of this paper is to compare
the financial performance of the SAMBA bank of Saudi Arabia with Arab bank of Jordan by
using the DuPont system of financial analysis which is based on analysis of net profit margin
ratio, total asset turnover, equity multiplier and return on equity during 2008-2013.
The importance of this study stems from using the DuPont model as a powerful analysis
tool to determine and assess the value of these banks and estimate the expected value of future
cash flows. During the period of study both banks witnessed many challenges and difficulties
internally and externally. In addition to that, there is a dearth empirical studies has been carried
out in the same area, an empirical investigation is required which would be a source of help to
academicians, bankers, and policy makers. Also this study may add new value on the finance
literature as regards measuring the performance and profitability of the banking systems.
International Journal of Economics, Commerce and Management, United Kingdom
Licensed under Creative Common Page 691
The paper is divided into sections. Section 1 proposes the introduction which includes the main
objective and importance of study. Section 2 explores the related literature review. Section 3
offers a concise identification on SAMBA of Saudi Arabia and Arab banks of Jordan. A financial
analysis model for financial institutions is displayed in section 4. Section 5 is discussing the
financial analysis of SAMBA and section 6 is also discussing the financial analysis of Arab bank.
Section 7 discussing the DuPont analysis for SAMBA and Arab Bank. The remainder of the
paper contains the summary and conclusion.
LITERATURE REVIEW
Raza et al. (2013) examined that most of the time investors do not prefer to highly profitable
companies. We investigate the DuPont equation on insurance sector of South Asian region.
Through DuPont analysis we see which types of companies are most fruitful for investor. We
are using two method of ranking, first one is based on profit (Net income) and second one is
based on DuPont equation. After that we see impact of independent variables (Return on asset
& financial leverage) on dependent variable (return on equity) by regression analysis. The result
shows that the ranking according to DuPont method are more reliable for investors as compared
to profit (net income). The finding of this paper is that investor should work on effort method as
judge against to effect method.
Carl, et al. (2011) suggested a model which can be used to analyze the financial position
of a bank based on the DuPont model of financial analysis used by Saunders (2000) and
applied by Collier, et al.,(2010). Return on equity of the bank is disaggregated into three parts:
1) net profit margin, 2) total asset turnover, and 3) the equity multiplier due to leverage. The
DuPont model was used to measure the performance of Bank Al Bilad. From analysis of the
ratios, we are able to deduce that Bank Al Bilad has relied on debt to a higher degree each year
to exhibit its return on equity figures, indicating a lower percentage of return on equity being
derived from sales activities, or income from banking operations, and profit margin. This is not
an abnormal symptom for a bank that has endured relatively few seasons. However, it should
be noted that indications to the contrary would be a good sign, if not ideal. It is anticipated, given
the conditions of the region’s developing capital market and its proximity to the lucrative oil
industry and profiting governments that Bank Al Bilad will recover from the inconveniences
evidenced in its most recent financial statements.
Collier, et al.,(2010) presents a model for the financial analysis of a bank in a rapidly
changing environment based on the DuPont system of financial analysis. The DuPont system of
financial analysis is based on analysis of return on equity which is disaggregated into net profit
margin, total asset turnover and the equity multiplier. AFFIN Bank Malaysia is one of the largest
© Almazari
Licensed under Creative Common Page 692
banks in Malaysia and is one of the core banks from the consolidation process of the banking
industry in response to the Southeast Asian economic crisis in 1997-98. The analysis covers
begins in 1999 which is the year that AFFIN Bank was formed until 2006. The DuPont system of
financial analysis shows the impact of the Asian financial crisis and the restructuring of the
banking industry in Malaysia on the financial performance of AFFIN Bank and the gradual
recovery of AFFIN Bank to return to steady performance over the past eight years.
Mihaela, et al.(2010). studied the most profitable top 20 firms over the world in 2009 –
through Du Pont Analysis model, but they discovered that they are not the most attractive ones
for investors. They found out that firms does not preserve their ranks when indicators or ratios
such as ROA (return on assets), ROE (return on equity) or ROS (return on sales) are taken into
consideration.
Soliman,(2008) found out that, Du Pont analysis is one of the tools of financial statement
analysis which divide return on net operating assets into two components: profit margin and
asset turnover. These two financial ratios measure different objects and have different
properties. Previous research discovered that a positive change in asset turnover is correlated
to future changes in earnings.
In the adjusted DuPont method, ROE will be still remained as the dominate factor but
with some necessary adjustments. ROE clearly demonstrates enterprise’s efficiency in
financing, investing, operating and capital management (Johansson 1998; Nissim& Penman
2001; Susan 2004; Milbourn, Haight 2005), so it serves as the most important indicator of how
to maximize profitability and stockholder’s wealth.
OVERVIEW ON SAMBA BANK OF SAUDI ARABIA AND ARAB BANK OF JORDAN
Samba Financial Group (Samba) is a joint-stock company incorporated in the Kingdom of Saudi
Arabia. Samba was established in 1980. This bank is considered as the second-largest bank by
market value in Saudi Arabia, it is widely spreaded internally and externally (Company Profile,
2011). Samba Financial Group provides various banking and financial services. It offers various
personal banking products and services, including accounts comprising current accounts, small
business accounts, and time deposits, as well as accounts for children and teenagers; personal
financing services for Saudi nationals, expatriates, and GOSI and PPA retirees; home finance
services; ladies banking services; banking solutions in accordance with the Islamic Shariah
principles; Speed Cash services; and credit cards. The company also offers business banking
services, such as accounts, time deposits, financing and credit services, liquidity management
and direct debit services, payment and collection solutions, cash pickup and delivery services,
as well as mobile and online banking services and some other services. It operates 72
International Journal of Economics, Commerce and Management, United Kingdom
Licensed under Creative Common Page 693
branches, 33 Speed Cash centers, 496 ATMs, and 26 ladies centers in the Kingdom of Saudi
Arabia; 1 branch and 12 ATMs in Dubai; and 28 branches and 28 ATMs in Pakistan, as well as
operates branches in London and Qatar. The company headquartered in Riyadh, the Kingdom
of Saudi Arabia (Company Profile, 2014).
Arab bank is one of the largest financial institutions in the Middle East. Established in
Jerusalem in Palestine in 1930 as a small bank, it has evolved into a group with the largest
worldwide Arab network with over 500 branches in 30 countries on five continents, participating
in financial markets and centers The Bank is constantly improving its disclosure levels and
introducing higher levels of transparency through its financial statements, enabling both
shareholders and customers to appreciate its ever-growing earning power, its low risk level, and
its strong financial position (Arab bank Annual Reports, 2010).
Arab Bank Group reported positive financial results in 2013 in spite of the challenging
environment in the region. These positive results come as a clear testament of the Bank’s
success in dealing with the regional and global circumstances as a result of the prudent and
sound policies which it adopts. Arab Bank Group’s accomplishments in 2013 were not just
limited to the growth in profitability, but it was also reinforced by the increase and improvement
in the financial indicators which demonstrate the strength of its financial position (Arab bank
Annual Reports, 2013).
The Bank during 2013 was able to achieve several key strategic objectives despite the
many challenges that have emerged during the year. The Bank focused on growing its profits by
increasing its operating revenues which has shown positive growth rates due to the increase in
the net interest and the commissions generated from the main banking operations. In addition,
the Bank was able to keep expenses under control which did not register any growth in 2013.
The Bank also continued to improve the quality of the credit portfolio with the provisions
coverage ratio for non-performing loans reaching 139%, excluding the value of the collaterals
held (Arab bank Annual Reports, 2013).
A FINANCIAL ANALYSIS MODEL FOR FINANCIAL INSTITUTIONS
DuPont model of financial analysis is used by Saunders in (2000) and applied in Collier, et al.,
(2010), the DuPont model for financial analysis is based on return on equity. According to the
formula, the three elements of return on equity are net profit margin, total asset turnover, and
the equity multiplier. Net profit margin alludes to a company's profitability in regards to their
ability to control costs. A more profitable company with more control over costs would exhibit a
profit margin higher than competitors. Total Asset Turnover is a measure of a company's
efficiency in using assets to generate sales. The higher this ratio is the better. The equity
© Almazari
Licensed under Creative Common Page 694
multiplier is a measure of leverage. A higher equity multiplier ratio shows that an institution is
relying more heavily on debt financing to obtain funds. As implied, these ratios can be useful
tools in comparing a company to its competitors or overall industry. Return on equity, as
computed from the other three ratios, is a measure of profitability, suggesting how much profit is
being generated with investors’ money. Through use of these ratios, authors will be able to
construct pro forma financial statements (Carl .M, et al, 2011)
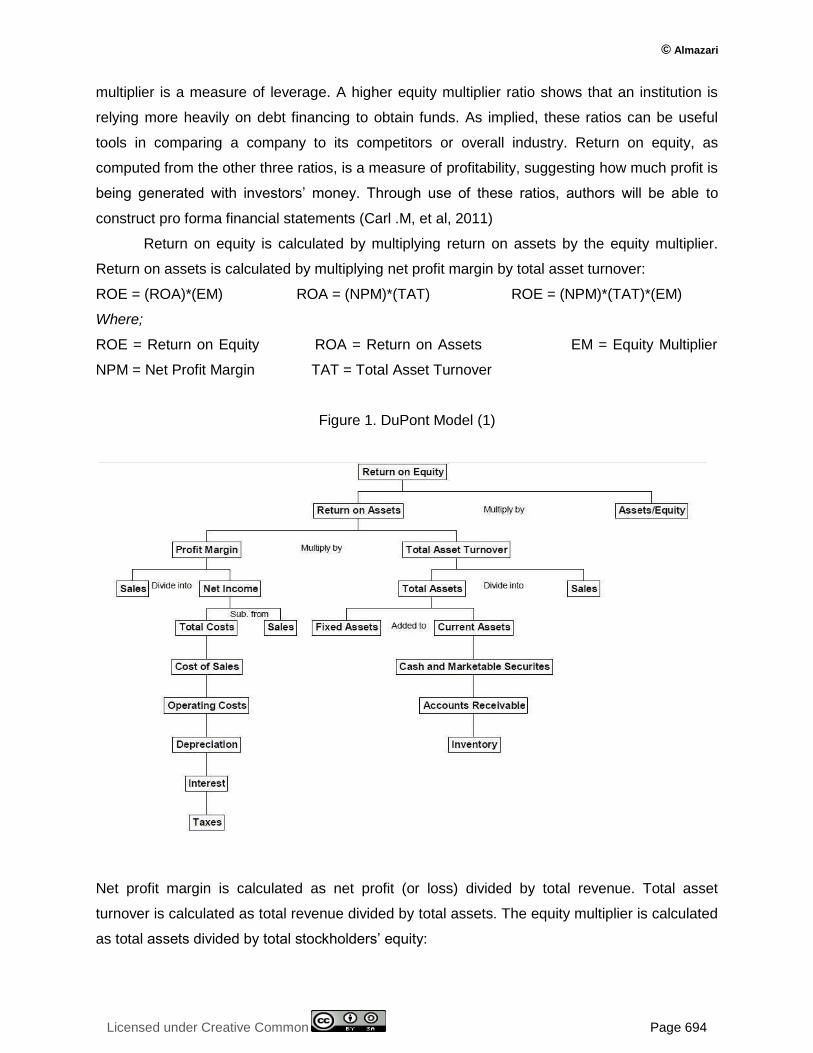
Return on equity is calculated by multiplying return on assets by the equity multiplier.
Return on assets is calculated by multiplying net profit margin by total asset turnover:
ROE = (ROA)*(EM) ROA = (NPM)*(TAT) ROE = (NPM)*(TAT)*(EM)
Where;
ROE = Return on Equity ROA = Return on Assets EM = Equity Multiplier
NPM = Net Profit Margin TAT = Total Asset Turnover
Figure 1. DuPont Model (1)
Net profit margin is calculated as net profit (or loss) divided by total revenue. Total asset
turnover is calculated as total revenue divided by total assets. The equity multiplier is calculated
as total assets divided by total stockholders’ equity:
International Journal of Economics, Commerce and Management, United Kingdom
Licensed under Creative Common Page 695
NPM = (NI) / (TR) TAT = (TR) / (TA) EM = (TA) / (TSE)
Where;
NPM = Net Profit Margin NI = Net Income TR = Total Revenue
TAT = Total Asset Turnover TA = Total Assets EM = Equity Multiplier
TSE = Total Stockholders’ Equity
FINANCIAL ANALYSIS OF SAUDI SAMBA BANK
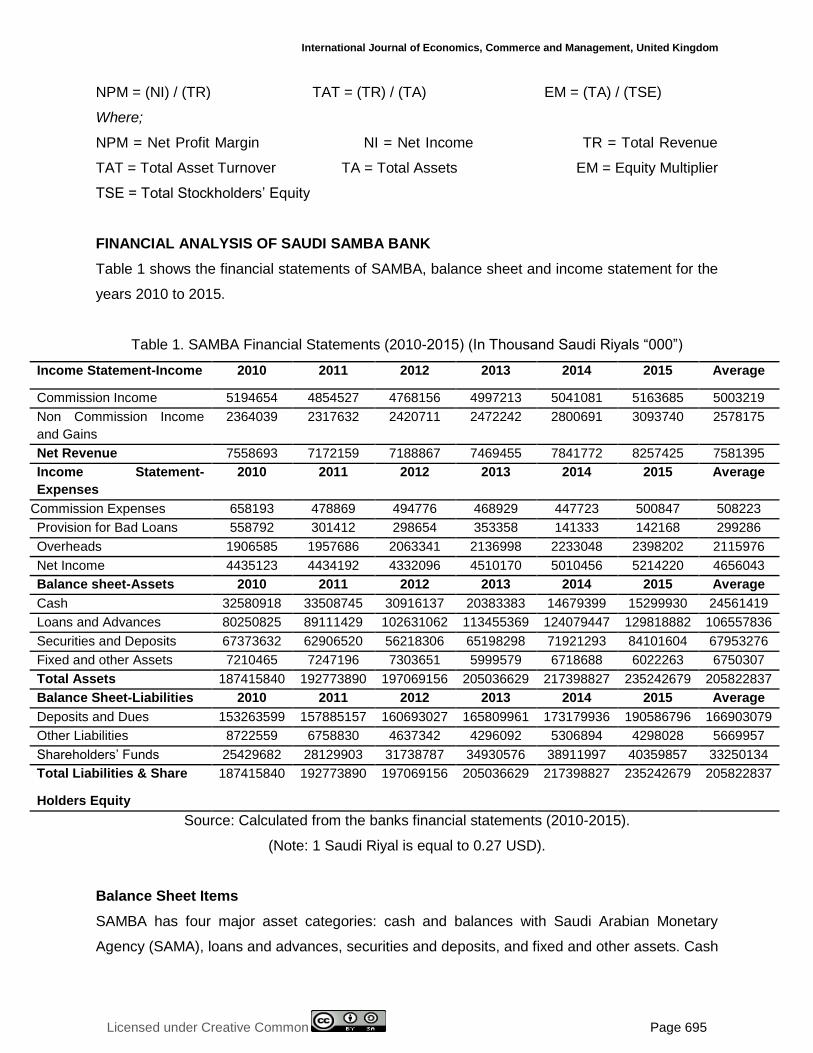
Table 1 shows the financial statements of SAMBA, balance sheet and income statement for the
years 2010 to 2015.
Table 1. SAMBA Financial Statements (2010-2015) (In Thousand Saudi Riyals “000”)
Average 2015 2014 2013 2012 2011 2010 Income Statement-Income
5003219 5163685 5041081 4997213 4768156 4854527 5194654 Commission Income
2578175 3093740 2800691 2472242 2420711 2317632 2364039 Non Commission Income
and Gains
7581395 8257425 7841772 7469455 7188867 7172159 7558693 Net Revenue
Average 2015 2014 2013 2012 2011 2010 Income Statement-
Expenses
508223 500847 447723 468929 494776 478869 658193 Commission Expenses
299286 142168 141333 353358 298654 301412 558792 Provision for Bad Loans
2115976 2398202 2233048 2136998 2063341 1957686 1906585 Overheads
4656043 5214220 5010456 4510170 4332096 4434192 4435123 Net Income
Average 2015 2014 2013 2012 2011 2010 Balance sheet-Assets
24561419 15299930 14679399 20383383 30916137 33508745 32580918 Cash
106557836 129818882 124079447 113455369 102631062 89111429 80250825 Loans and Advances
67953276 84101604 71921293 65198298 56218306 62906520 67373632 Securities and Deposits
6750307 6022263 6718688 5999579 7303651 7247196 7210465 Fixed and other Assets
205822837 235242679 217398827 205036629 197069156 192773890 187415840 Total Assets
Average 2015 2014 2013 2012 2011 2010 Balance Sheet-Liabilities
166903079 190586796 173179936 165809961 160693027 157885157 153263599 Deposits and Dues
5669957 4298028 5306894 4296092 4637342 6758830 8722559 Other Liabilities
33250134 40359857 38911997 34930576 31738787 28129903 25429682 Shareholders’ Funds
205822837 235242679 217398827 205036629 197069156 192773890 187415840 Total Liabilities & Share
Holders Equity
Source: Calculated from the banks financial statements (2010-2015).
(Note: 1 Saudi Riyal is equal to 0.27 USD).
Balance Sheet Items
SAMBA has four major asset categories: cash and balances with Saudi Arabian Monetary
Agency (SAMA), loans and advances, securities and deposits, and fixed and other assets. Cash
© Almazari
Licensed under Creative Common Page 696
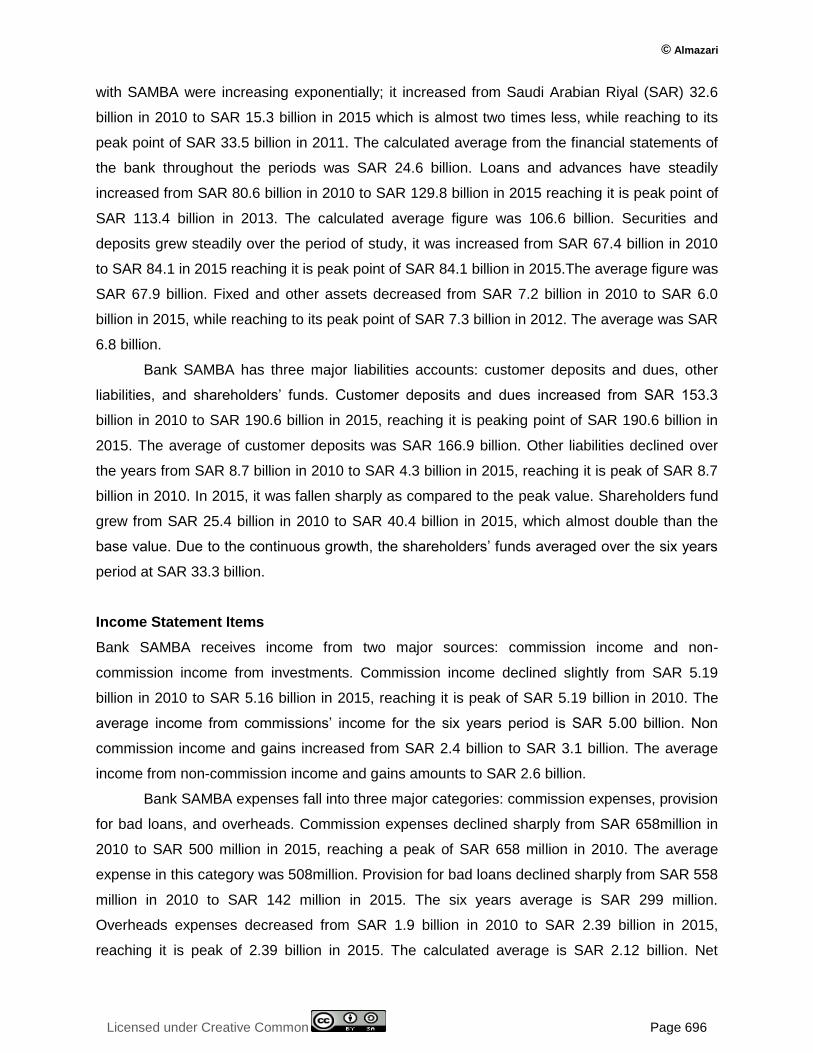
with SAMBA were increasing exponentially; it increased from Saudi Arabian Riyal (SAR) 32.6
billion in 2010 to SAR 15.3 billion in 2015 which is almost two times less, while reaching to its
peak point of SAR 33.5 billion in 2011. The calculated average from the financial statements of
the bank throughout the periods was SAR 24.6 billion. Loans and advances have steadily
increased from SAR 80.6 billion in 2010 to SAR 129.8 billion in 2015 reaching it is peak point of
SAR 113.4 billion in 2013. The calculated average figure was 106.6 billion. Securities and
deposits grew steadily over the period of study, it was increased from SAR 67.4 billion in 2010
to SAR 84.1 in 2015 reaching it is peak point of SAR 84.1 billion in 2015.The average figure was
SAR 67.9 billion. Fixed and other assets decreased from SAR 7.2 billion in 2010 to SAR 6.0
billion in 2015, while reaching to its peak point of SAR 7.3 billion in 2012. The average was SAR
6.8 billion.
Bank SAMBA has three major liabilities accounts: customer deposits and dues, other
liabilities, and shareholders’ funds. Customer deposits and dues increased from SAR 153.3
billion in 2010 to SAR 190.6 billion in 2015, reaching it is peaking point of SAR 190.6 billion in
2015. The average of customer deposits was SAR 166.9 billion. Other liabilities declined over
the years from SAR 8.7 billion in 2010 to SAR 4.3 billion in 2015, reaching it is peak of SAR 8.7
billion in 2010. In 2015, it was fallen sharply as compared to the peak value. Shareholders fund
grew from SAR 25.4 billion in 2010 to SAR 40.4 billion in 2015, which almost double than the
base value. Due to the continuous growth, the shareholders’ funds averaged over the six years
period at SAR 33.3 billion.
Income Statement Items
Bank SAMBA receives income from two major sources: commission income and non-
commission income from investments. Commission income declined slightly from SAR 5.19
billion in 2010 to SAR 5.16 billion in 2015, reaching it is peak of SAR 5.19 billion in 2010. The
average income from commissions’ income for the six years period is SAR 5.00 billion. Non
commission income and gains increased from SAR 2.4 billion to SAR 3.1 billion. The average
income from non-commission income and gains amounts to SAR 2.6 billion.
Bank SAMBA expenses fall into three major categories: commission expenses, provision
for bad loans, and overheads. Commission expenses declined sharply from SAR 658million in
2010 to SAR 500 million in 2015, reaching a peak of SAR 658 million in 2010. The average
expense in this category was 508million. Provision for bad loans declined sharply from SAR 558
million in 2010 to SAR 142 million in 2015. The six years average is SAR 299 million.
Overheads expenses decreased from SAR 1.9 billion in 2010 to SAR 2.39 billion in 2015,
reaching it is peak of 2.39 billion in 2015. The calculated average is SAR 2.12 billion. Net
International Journal of Economics, Commerce and Management, United Kingdom
Licensed under Creative Common Page 697
income increased steadily from SAR 4.4 billion in 2010 to SAR 5.2 billion in 2015, reaching it is
peak of 5.2 billion in 2015. The calculated average is SAR 4.6 billion.
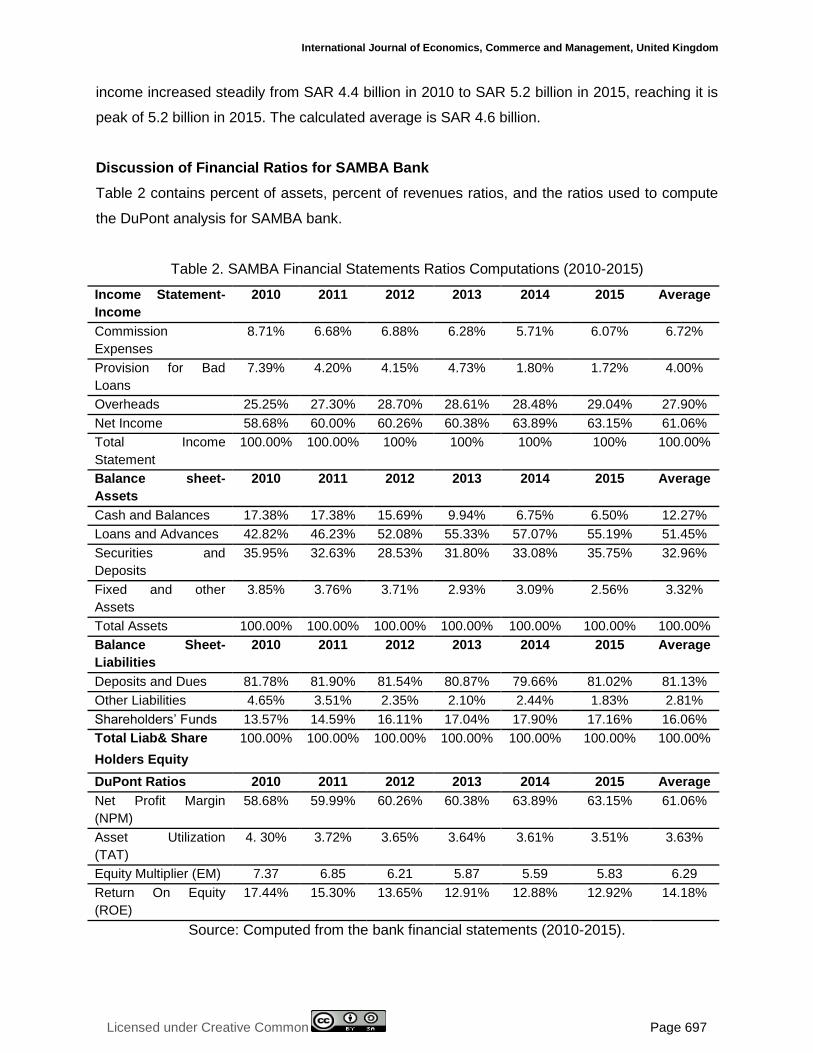
Discussion of Financial Ratios for SAMBA Bank
Table 2 contains percent of assets, percent of revenues ratios, and the ratios used to compute
the DuPont analysis for SAMBA bank.
Table 2. SAMBA Financial Statements Ratios Computations (2010-2015)
Average 2015 2014 2013 2012 2011 2010 Income Statement-
Income
6.72% 6.07% 5.71% 6.28% 6.88% 6.68% 8.71% Commission
Expenses
4.00% 1.72% 1.80% 4.73% 4.15% 4.20% 7.39% Provision for Bad
Loans
27.90% 29.04% 28.48% 28.61% 28.70% 27.30% 25.25% Overheads
61.06% 63.15% 63.89% 60.38% 60.26% 60.00% 58.68% Net Income
100.00% 100% 100% 100% 100% 100.00% 100.00% Total Income
Statement
Average 2015 2014 2013 2012 2011 2010 Balance sheet-
Assets
12.27% 6.50% 6.75% 9.94% 15.69% 17.38% 17.38% Cash and Balances
51.45% 55.19% 57.07% 55.33% 52.08% 46.23% 42.82% Loans and Advances
32.96% 35.75% 33.08% 31.80% 28.53% 32.63% 35.95% Securities and
Deposits
3.32% 2.56% 3.09% 2.93% 3.71% 3.76% 3.85% Fixed and other
Assets
100.00% 100.00% 100.00% 100.00% 100.00% 100.00% 100.00% Total Assets
Average 2015 2014 2013 2012 2011 2010 Balance Sheet-
Liabilities
81.13% 81.02% 79.66% 80.87% 81.54% 81.90% 81.78% Deposits and Dues
2.81% 1.83% 2.44% 2.10% 2.35% 3.51% 4.65% Other Liabilities
16.06% 17.16% 17.90% 17.04% 16.11% 14.59% 13.57% Shareholders’ Funds
100.00% 100.00% 100.00% 100.00% 100.00% 100.00% 100.00% Total Liab& Share
Holders Equity
Average 2015 2014 2013 2012 2011 2010 DuPont Ratios
61.06%
63.15% 63.89% 60.38% 60.26% 59.99% 58.68% Net Profit Margin
(NPM)
3.63% 3.51% 3.61% 3.64% 3.65% 3.72% 4. 30% Asset Utilization
(TAT)
6.29 5.83 5.59 5.87 6.21 6.85 7.37 Equity Multiplier (EM)
14.18% 12.92% 12.88% 12.91% 13.65% 15.30% 17.44% Return On Equity
(ROE)
Source: Computed from the bank financial statements (2010-2015).
© Almazari
Licensed under Creative Common Page 698
As a percent of total assets of SAMBA bank, cash and balances with SAMBA averages
12.27%, with a high of 17.38% in 2010 and 2011 respectively and a low of 6.50% in 2015.
Customer loans and advances average 51.45%, with a high of 57.07% in 2014 and a low of
42.82% in 2010. Securities and deposits average 32.96% with a high of 35.95% in 2010 and a
low of 28.53% in 2012. Fixed and other assets show the least variability with an average of
3.32% with a high of 3.85% in 2010 and a low of 2.56% in 2015.
As a percentage of total liabilities, customer deposits and dues averaged 81.13%, other
liabilities averaged 2.81% and shareholders fund averaged 16.06%. Customer deposits and
dues were at their highest percentage in 2011 at 81.90% and lowest percentage in 2014 at
79.66%. Other liabilities were at their highest percentage in 2010 at 4.65% and lowest
percentage in 2015 at 1.83%. Shareholders fund were at their highest percentage in 2014 at
17.90% and lowest percentage in 2010 at 13.57%.
As a percentage of total revenue, commission expenses were at their highest
percentage in 2010 at 8.71% and lowest percentage in 2014 at 5.71% with an average of
6.72%. Provision for bad loans was at their highest percentage in 2010 at 7.39% and lowest
percentage in 2015 at 1.72% with an average of 4.00%. Bank overheads were at their highest
percentage in 2015 at 29.04% and lowest percentage in 2010 at 25.25% with an average of
27.90%. Net income was at it is highest percentage in 2014 at 63.89% and lowest percentage in
2010 at 58.68% with an average of 61.06%.
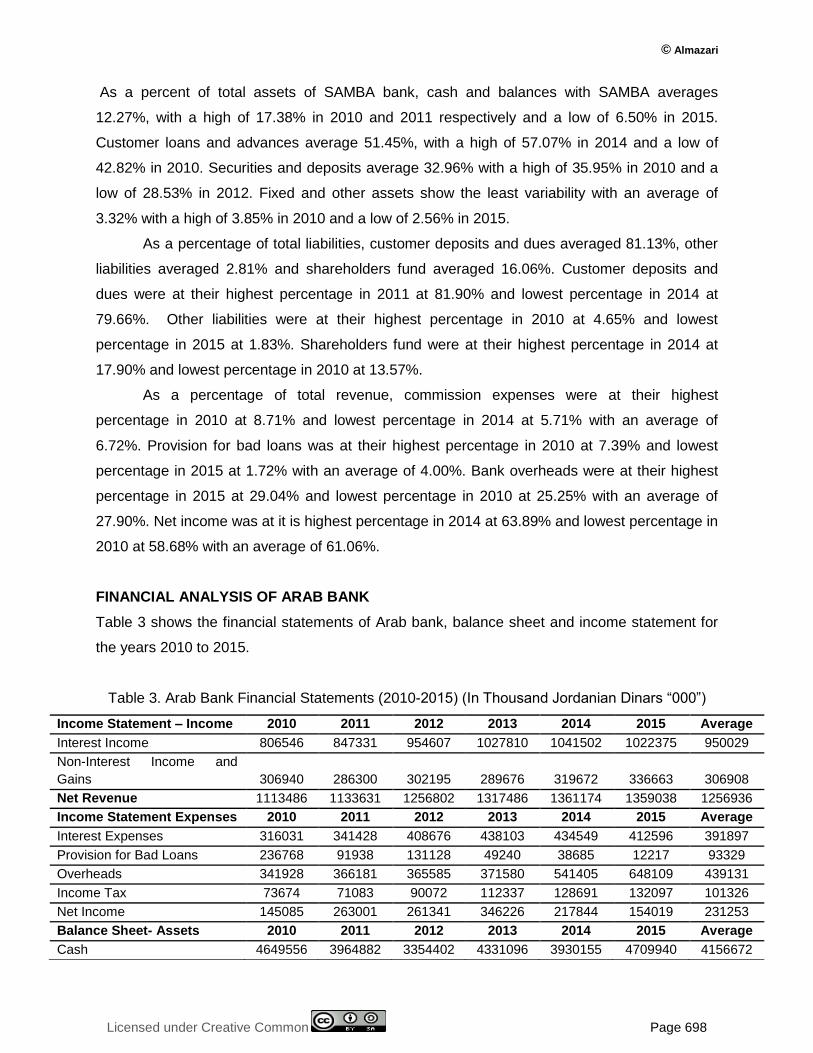
FINANCIAL ANALYSIS OF ARAB BANK
Table 3 shows the financial statements of Arab bank, balance sheet and income statement for
the years 2010 to 2015.
Table 3. Arab Bank Financial Statements (2010-2015) (In Thousand Jordanian Dinars “000”)
Income Statement – Income 2010 2011 2012 2013 2014 2015 Average
Interest Income 806546 847331 954607 1027810 1041502 1022375 950029
Non-Interest Income and
Gains 306940 286300 302195 289676 319672 336663 306908
Net Revenue 1113486 1133631 1256802 1317486 1361174 1359038 1256936
Income Statement Expenses 2010 2011 2012 2013 2014 2015 Average
Interest Expenses 316031 341428 408676 438103 434549 412596 391897
Provision for Bad Loans 236768 91938 131128 49240 38685 12217 93329
Overheads 341928 366181 365585 371580 541405 648109 439131
Income Tax 73674 71083 90072 112337 128691 132097 101326
Net Income 145085 263001 261341 346226 217844 154019 231253
Balance Sheet- Assets 2010 2011 2012 2013 2014 2015 Average
Cash 4649556 3964882 3354402 4331096 3930155 4709940 4156672
International Journal of Economics, Commerce and Management, United Kingdom
Licensed under Creative Common Page 699
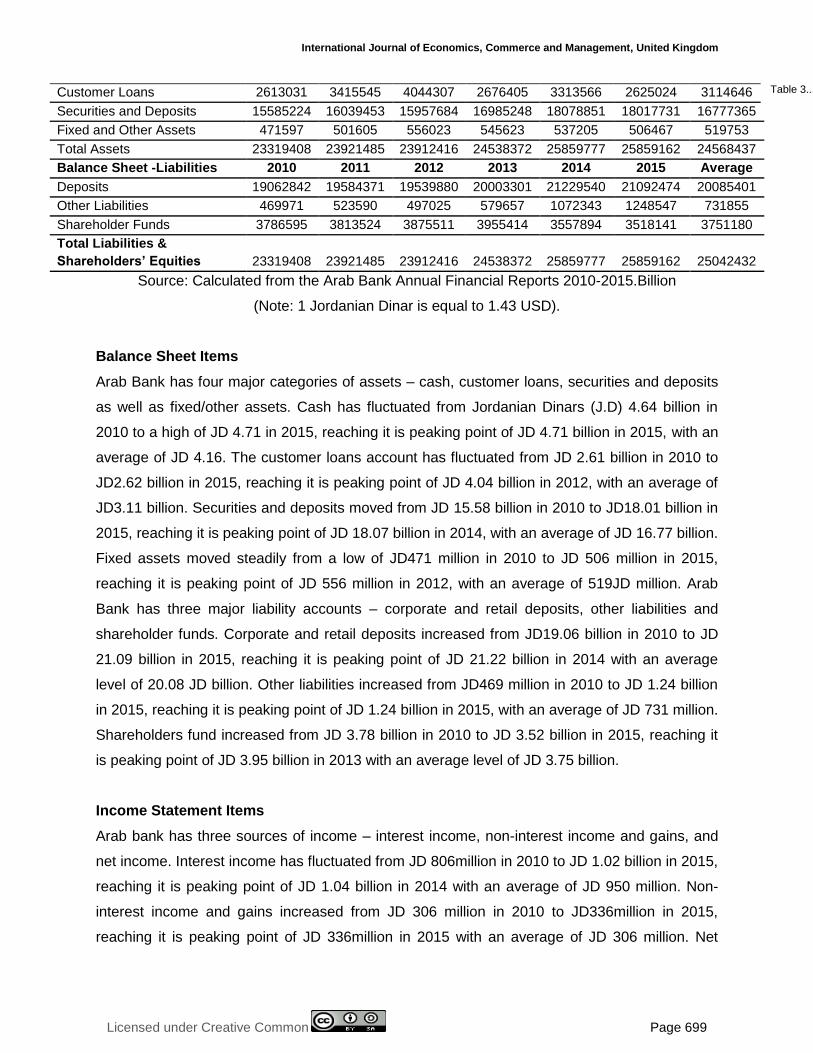
Customer Loans 2613031 3415545 4044307 2676405 3313566 2625024 3114646
Securities and Deposits 15585224 16039453 15957684 16985248 18078851 18017731 16777365
Fixed and Other Assets 471597 501605 556023 545623 537205 506467 519753
Total Assets 23319408 23921485 23912416 24538372 25859777 25859162 24568437
Balance Sheet -Liabilities 2010 2011 2012 2013 2014 2015 Average
Deposits 19062842 19584371 19539880 20003301 21229540 21092474 20085401
Other Liabilities 469971 523590 497025 579657 1072343 1248547 731855
Shareholder Funds 3786595 3813524 3875511 3955414 3557894 3518141 3751180
Total Liabilities &
Shareholders’ Equities 23921485 25042432 23319408 23912416 24538372 25859777 25859162
Source: Calculated from the Arab Bank Annual Financial Reports 2010-2015.Billion
(Note: 1 Jordanian Dinar is equal to 1.43 USD).
Balance Sheet Items
Arab Bank has four major categories of assets – cash, customer loans, securities and deposits
as well as fixed/other assets. Cash has fluctuated from Jordanian Dinars (J.D) 4.64 billion in
2010 to a high of JD 4.71 in 2015, reaching it is peaking point of JD 4.71 billion in 2015, with an
average of JD 4.16. The customer loans account has fluctuated from JD 2.61 billion in 2010 to
JD2.62 billion in 2015, reaching it is peaking point of JD 4.04 billion in 2012, with an average of
JD3.11 billion. Securities and deposits moved from JD 15.58 billion in 2010 to JD18.01 billion in
2015, reaching it is peaking point of JD 18.07 billion in 2014, with an average of JD 16.77 billion.
Fixed assets moved steadily from a low of JD471 million in 2010 to JD 506 million in 2015,
reaching it is peaking point of JD 556 million in 2012, with an average of 519JD million. Arab
Bank has three major liability accounts – corporate and retail deposits, other liabilities and
shareholder funds. Corporate and retail deposits increased from JD19.06 billion in 2010 to JD
21.09 billion in 2015, reaching it is peaking point of JD 21.22 billion in 2014 with an average
level of 20.08 JD billion. Other liabilities increased from JD469 million in 2010 to JD 1.24 billion
in 2015, reaching it is peaking point of JD 1.24 billion in 2015, with an average of JD 731 million.
Shareholders fund increased from JD 3.78 billion in 2010 to JD 3.52 billion in 2015, reaching it
is peaking point of JD 3.95 billion in 2013 with an average level of JD 3.75 billion.
Income Statement Items
Arab bank has three sources of income – interest income, non-interest income and gains, and
net income. Interest income has fluctuated from JD 806million in 2010 to JD 1.02 billion in 2015,
reaching it is peaking point of JD 1.04 billion in 2014 with an average of JD 950 million. Non-
interest income and gains increased from JD 306 million in 2010 to JD336million in 2015,
reaching it is peaking point of JD 336million in 2015 with an average of JD 306 million. Net
Table 3...
© Almazari
Licensed under Creative Common Page 700
income increased from JD 145 million in 2010 to JD 154 million in 2015, reaching it is peaking
point of JD 346 million in 2013 with an average of JD 231million.
Arab bank has four expense categories: interest expense, provisions for bad loans,
overhead costs, and income tax. Interest expense has declined from JD 316 million in 2010 to
JD 412 million in 2015, reaching it is peaking point of JD 438 million in 2013 with an average of
JD 391 million. Provision for bad loans dropped from JD 236 million in 2010 to JD 12 million in
2015 reaching it is peaking point of JD 236 million in 2010 with an average of JD 93 million.
Overhead costs moved from JD 341 million in 2010 to JD 642 million in 2015, reaching it is
peaking point of JD 642 million in 2015 with an average of JD 439 million. Income tax has
increased from JD 73 million in 2010 to JD 132 million in 2016, reaching it is peaking point of JD
132 million in 2015 with an average JD 101 million.
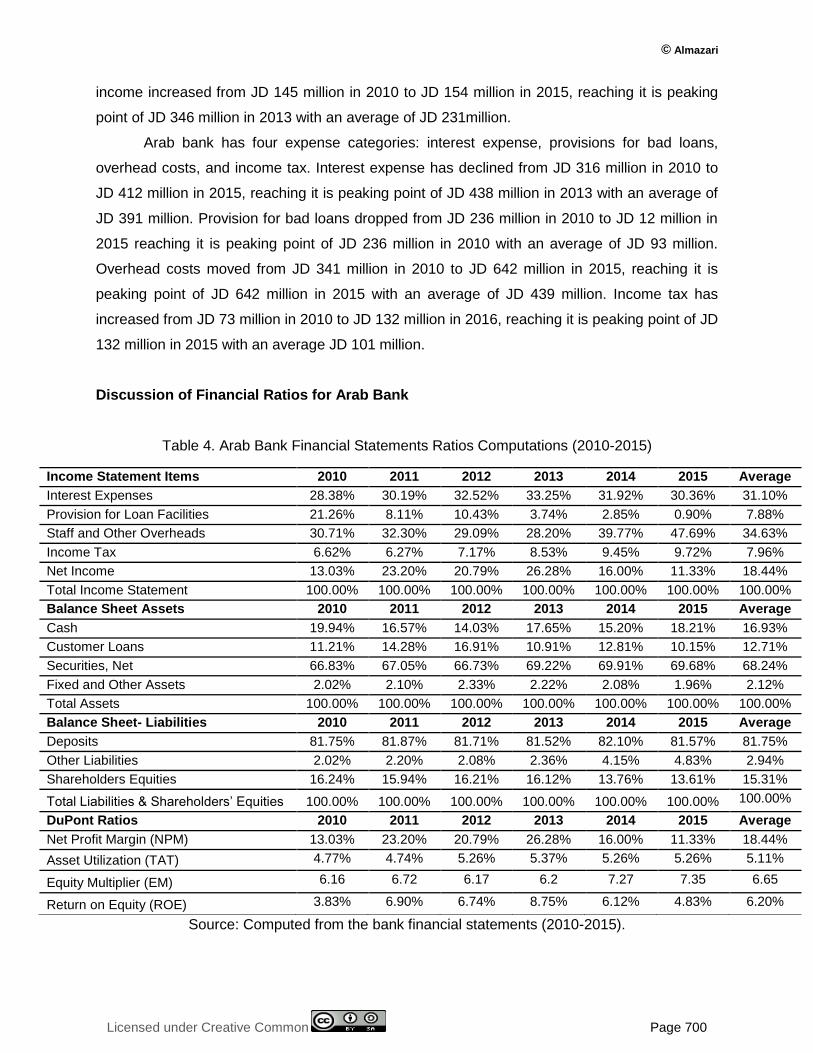
Discussion of Financial Ratios for Arab Bank
Table 4. Arab Bank Financial Statements Ratios Computations (2010-2015)
Source: Computed from the bank financial statements (2010-2015).
Income Statement Items 2010 2011 2012 2013 2014 2015 Average
Interest Expenses 28.38% 30.19% 32.52% 33.25% 31.92% 30.36% 31.10%
Provision for Loan Facilities 21.26% 8.11% 10.43% 3.74% 2.85% 0.90% 7.88%
Staff and Other Overheads 30.71% 32.30% 29.09% 28.20% 39.77% 47.69% 34.63%
Income Tax 6.62% 6.27% 7.17% 8.53% 9.45% 9.72% 7.96%
Net Income 13.03% 23.20% 20.79% 26.28% 16.00% 11.33% 18.44%
Total Income Statement 100.00% 100.00% 100.00% 100.00% 100.00% 100.00% 100.00%
Balance Sheet Assets 2010 2011 2012 2013 2014 2015 Average
Cash 19.94% 16.57% 14.03% 17.65% 15.20% 18.21% 16.93%
Customer Loans 11.21% 14.28% 16.91% 10.91% 12.81% 10.15% 12.71%
Securities, Net 66.83% 67.05% 66.73% 69.22% 69.91% 69.68% 68.24%
Fixed and Other Assets 2.02% 2.10% 2.33% 2.22% 2.08% 1.96% 2.12%
Total Assets 100.00% 100.00% 100.00% 100.00% 100.00% 100.00% 100.00%
Balance Sheet- Liabilities 2010 2011 2012 2013 2014 2015 Average
Deposits 81.75% 81.87% 81.71% 81.52% 82.10% 81.57% 81.75%
Other Liabilities 2.02% 2.20% 2.08% 2.36% 4.15% 4.83% 2.94%
Shareholders Equities 16.24% 15.94% 16.21% 16.12% 13.76% 13.61% 15.31%
Total Liabilities & Shareholders’ Equities 100.00% 100.00% 100.00% 100.00% 100.00% 100.00% 100.00%
DuPont Ratios 2010 2011 2012 2013 2014 2015 Average
Net Profit Margin (NPM) 13.03% 23.20% 20.79% 26.28% 16.00% 11.33% 18.44%
Asset Utilization (TAT) 4.77% 4.74% 5.26% 5.37% 5.26% 5.26% 5.11%
Equity Multiplier (EM) 6.16 6.72 6.17 6.2 7.27 7.35 6.65
Return on Equity (ROE) 3.83% 6.90% 6.74% 8.75% 6.12% 4.83% 6.20%
International Journal of Economics, Commerce and Management, United Kingdom
Licensed under Creative Common Page 701
13.03%
23.20% 20.79%26.28%
16.00%11.33%
58.68% 59.99% 60.26% 60.38%63.89% 63.15%
0%
10%
20%
30%
40%
50%
60%
70%
2010 2011 2012 2013 2014 2015
% N
PM
ARAB BANK SAMBA
Table 4 contains percent of assets, percent of revenues ratios, and the ratios used to compute
the DuPont analysis for Arab bank.
As a percent of total assets of Arab Bank, cash averages 16.93% of total assets with a
high of 19.94% in 2010 and a low of 14.03% in 2012. Customer loans average 12.71% of total
assets with a high of 16.91% in 2012 and a low of 10.15% in 2015. Net securities average
68.24% with a high of 69.91% in 2014 and a low of 66.73% in 2012. Fixed assets average
2.12%with a high of 2.33% in 2012 and with a low of 1.96% in 2015. Corporate and retail
deposits average 81.75%with a high of 82.10% in 2014 and a low of 81.52%in 2013. Other
liabilities average 2.94% with a high of 4.83% in 2015 and a low of 2.02%in 2010. Shareholder
funds average 15.31% with a high of16.24% in 2010 and a low of 13.61% in 2015.
As a percentage of total revenue, interest expenses were at their highest percentage in
2013 at 33.25% and lowest percentage in 2010 at 28.38%with an average of 31.10%. Provision
for bad loans was at it is highest percentage in 2010 at 21.26% and lowest percentage in 2015
at 0.90% with an average of 7.88%. Bank overheads were at their highest percentage in 2015 at
47.69% and lowest percentage in 2013 at 28.20% with an average of 34.63%. Income tax was
at it is highest percentage in 2015 at 9.72% and lowest percentage in 2011 at6.27% with an
average of 7.96%. Net income was at it is highest percentage in 2013 at 26.28% and lowest
percentage in 2015 at 11.33%with an average of 18.44%.
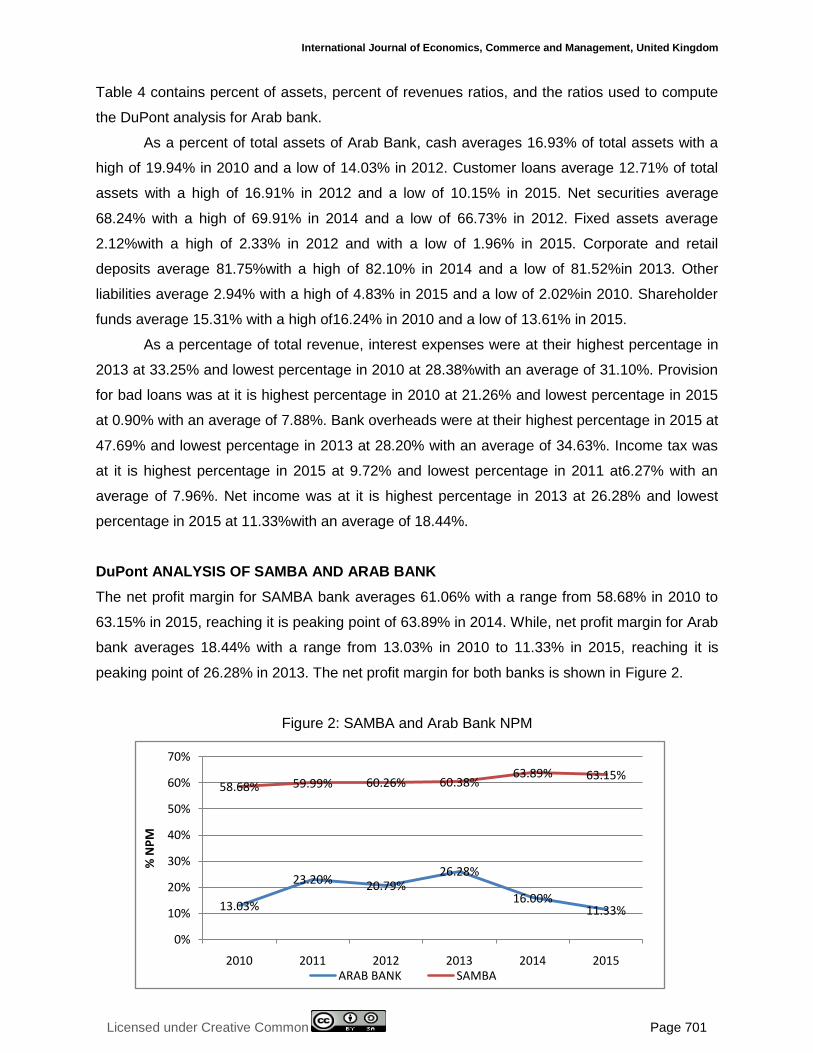
DuPont ANALYSIS OF SAMBA AND ARAB BANK
The net profit margin for SAMBA bank averages 61.06% with a range from 58.68% in 2010 to
63.15% in 2015, reaching it is peaking point of 63.89% in 2014. While, net profit margin for Arab
bank averages 18.44% with a range from 13.03% in 2010 to 11.33% in 2015, reaching it is
peaking point of 26.28% in 2013. The net profit margin for both banks is shown in Figure 2.
Figure 2: SAMBA and Arab Bank NPM
© Almazari
Licensed under Creative Common Page 702
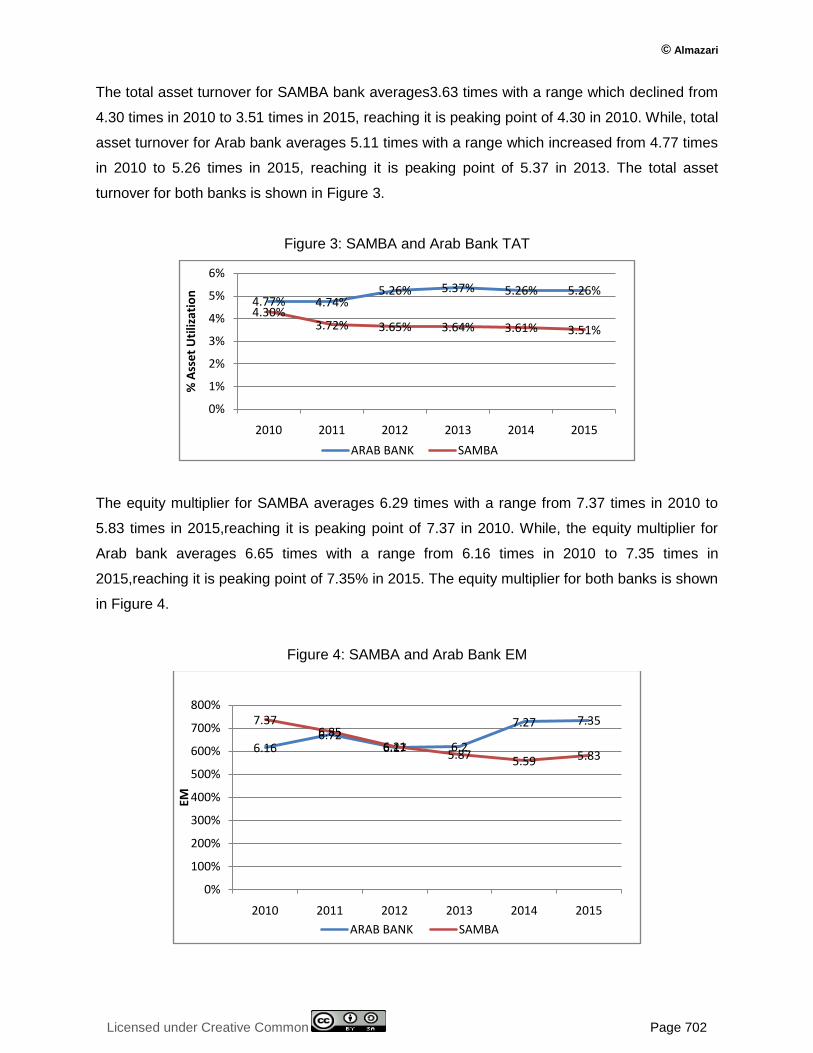
The total asset turnover for SAMBA bank averages3.63 times with a range which declined from
4.30 times in 2010 to 3.51 times in 2015, reaching it is peaking point of 4.30 in 2010. While, total
asset turnover for Arab bank averages 5.11 times with a range which increased from 4.77 times
in 2010 to 5.26 times in 2015, reaching it is peaking point of 5.37 in 2013. The total asset
turnover for both banks is shown in Figure 3.
Figure 3: SAMBA and Arab Bank TAT
The equity multiplier for SAMBA averages 6.29 times with a range from 7.37 times in 2010 to
5.83 times in 2015,reaching it is peaking point of 7.37 in 2010. While, the equity multiplier for
Arab bank averages 6.65 times with a range from 6.16 times in 2010 to 7.35 times in
2015,reaching it is peaking point of 7.35% in 2015. The equity multiplier for both banks is shown
in Figure 4.
Figure 4: SAMBA and Arab Bank EM
4.77% 4.74%5.26% 5.37% 5.26% 5.26%
4.30%3.72% 3.65% 3.64% 3.61% 3.51%
0%
1%
2%
3%
4%
5%
6%
2010 2011 2012 2013 2014 2015
% A
sse
t U
tiliz
atio
n
ARAB BANK SAMBA
6.166.72
6.17 6.2
7.27 7.357.376.85
6.215.87 5.59 5.83
0%
100%
200%
300%
400%
500%
600%
700%
800%
2010 2011 2012 2013 2014 2015
EM
ARAB BANK SAMBA
International Journal of Economics, Commerce and Management, United Kingdom
Licensed under Creative Common Page 703
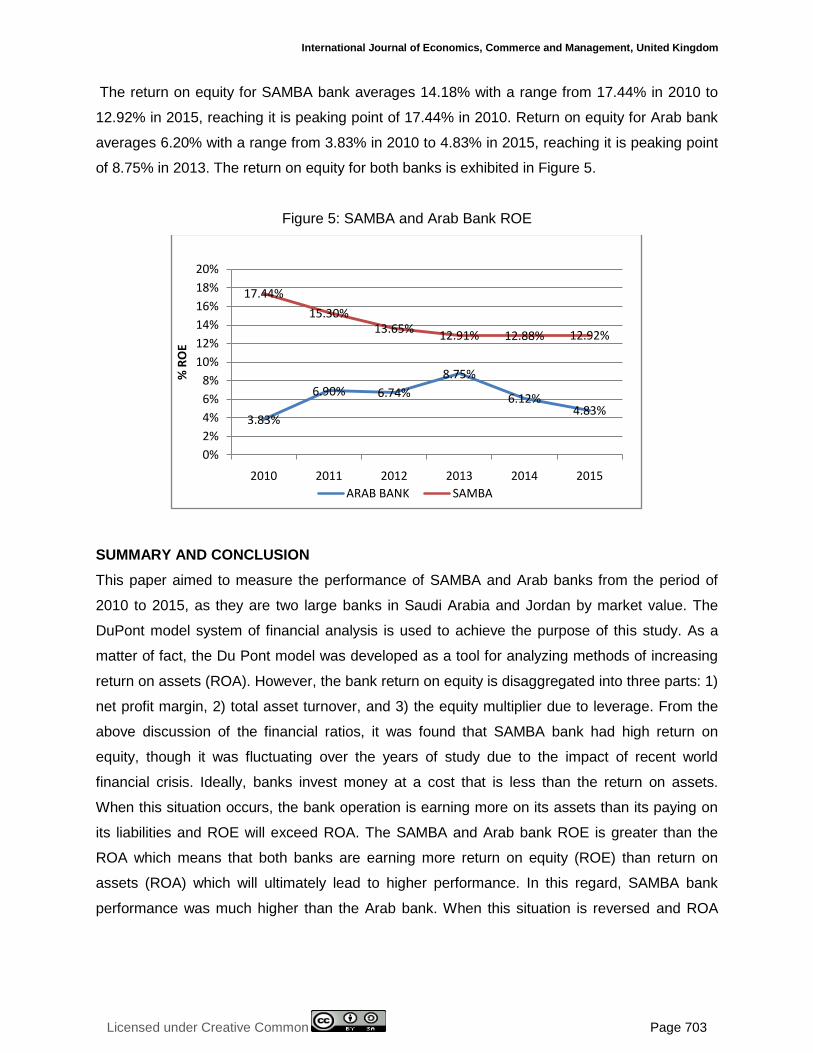
The return on equity for SAMBA bank averages 14.18% with a range from 17.44% in 2010 to
12.92% in 2015, reaching it is peaking point of 17.44% in 2010. Return on equity for Arab bank
averages 6.20% with a range from 3.83% in 2010 to 4.83% in 2015, reaching it is peaking point
of 8.75% in 2013. The return on equity for both banks is exhibited in Figure 5.
Figure 5: SAMBA and Arab Bank ROE
SUMMARY AND CONCLUSION
This paper aimed to measure the performance of SAMBA and Arab banks from the period of
2010 to 2015, as they are two large banks in Saudi Arabia and Jordan by market value. The
DuPont model system of financial analysis is used to achieve the purpose of this study. As a
matter of fact, the Du Pont model was developed as a tool for analyzing methods of increasing
return on assets (ROA). However, the bank return on equity is disaggregated into three parts: 1)
net profit margin, 2) total asset turnover, and 3) the equity multiplier due to leverage. From the
above discussion of the financial ratios, it was found that SAMBA bank had high return on
equity, though it was fluctuating over the years of study due to the impact of recent world
financial crisis. Ideally, banks invest money at a cost that is less than the return on assets.
When this situation occurs, the bank operation is earning more on its assets than its paying on
its liabilities and ROE will exceed ROA. The SAMBA and Arab bank ROE is greater than the
ROA which means that both banks are earning more return on equity (ROE) than return on
assets (ROA) which will ultimately lead to higher performance. In this regard, SAMBA bank
performance was much higher than the Arab bank. When this situation is reversed and ROA
3.83%
6.90% 6.74%
8.75%
6.12%4.83%
17.44%
15.30%13.65%
12.91% 12.88% 12.92%
0%
2%
4%
6%
8%
10%
12%
14%
16%
18%
20%
2010 2011 2012 2013 2014 2015
% R
OE
ARAB BANK SAMBA
© Almazari
Licensed under Creative Common Page 704
exceeds ROE, then the cost of liabilities is greater than the return on assets and invested
money is generating a negative margin that must be subsidized by the equity of the operation.
Net profit margin shows a relative stability for SAMBA bank over the years of study with
minimum volatility, while, net profit margin for Arab bank was fluctuating over the years of study,
there was a drop in the ratio of NPM in the year 2015 in Arab Bank. The equity multiplier was
declining for SAMBA bank and was almost stable indicators for Arab bank, and it shows that
these banks has relied on debt to a higher degree. Asset utilization shows a decline for SAMBA
bank over the years of study, and with a minimum volatility for Arab bank. The net profit margin
for SAMBA reached approximately to 63.89percent and to 26.28 percent for Arab with an
average of 61.06percent and 18.44 percent respectively. The total asset turnover reached it is
peak for SAMBA with 4.30percent and to 5.37 percent for Arab bank with an average of
3.63percent and 5.11 percent respectively. Equity multiplier reached approximately to 7.37
percent for SAMBA and to 7.35 percent for Arab bank with an average of 6.29percent and
6.65percent respectively. The return on equity for SAMBA reached approximately to 17.44
percent and to 8.75 percent for Arab bank with an average of14.18 percent and 6.20 percent
respectively. However, during the period of study both banks witnessed many challenges and
difficulties internally and externally.
As there is a dearth empirical studies has been carried out in the same area, the author
recommend an empirical studies is required which would be a source of help to academicians,
bankers, and policy makers. Also this study may add new value on the finance literature as
regards measuring the performance and profitability of the banking systems. Saudi and
Jordanian banks can perform better as they exist in a very save, sound and stable economic
environment.
ACKNOWLEDGEMENT
This project was supported by King Saud University, Deanship of Scientific Research,
Community College Research Unit.
REFERENCES
Arab bank Financial Statements, 2010-2015. http://www.ase.com.jo/ar/node/1660. Accessed Jun,2016.
Arab Bank Group Annual Report 2013. www.arabbank.com/en/investfinancials.aspx. Accessed,Aug,2016
Arab bank Group Annual Reports, 2010. www.arabbank.com/en/investfinancials.aspx Accessed Aug,2016.
Bank SAMBA Financial Statements, 2010-2015. Tadawul,www.tadawul.com.sa/ Accessed Jun,2016.
International Journal of Economics, Commerce and Management, United Kingdom
Licensed under Creative Common Page 705
Carl, B. McGowan, J. Andrew, R. and Stambaugh, Z.2011. “Financial Analysis Of Bank Al Bilad, International Business &Economics Research Journal, 10(3), pp12-13, 2011.www.cluteinstitute.com/ojs/index.php/IBER/article/download/.../4151 Accessed Dec,2015.
Collier, W. Carl, B. McGowan, J. and Junaina, M.2010. “Evaluating the Impact of a Rapidly Changing Economic Environment on Bank Financial Performance Using the Dupont System of Financial Analysis”, Asia Pacific Journal of Finance and Banking Research, 4(4), pp.25-35, 2010.http://ro.uow.edu.au/commpapers/1730/. Accessed Dec,2015
Johansson, S.1998. “The Profitability, Financing, and Growth of the Firm: Goals ,Relationships and Measurement Methods”. Lund, Sweden: Student literature, 1998. http://www.amazon.co.uk/Profitability-Financing-Growth-Firm-Relationships/dp/8763000334Accessed Oct,2015
Mihaela, H. Claudia, O and Lucian B.2011. “A Du Pont Analysis of the 20 Most Profitable Companies in the World”, 2010 International Conference on Business and Economics Research IACSIT, 1,2011,pp.45-48.www.ipedr.com/vol1/10-B00015.pdfAccessed Nov,2015
Milbourn, G. and Haight, T. 2005. “Providing Students with an Overview of Financial Providing Students with an Overview of Financial Statements Using the DuPont Analysis Approach”, Journal of American
Academy of Business, 6(1), pp.46-50.http://www.docstoc.com/docs/45107318/Providing-Students-with-
an-Overview-of-Financial-Statements-Using, Nov,2013Accessed Sep,2015
Nissim, D. and Penman, S. 2001. “Ratio Analysis and Equity Valuation: from Research to Practice”, Review of Accounting Studies ,pp.114-154, 2001.link.springer.com/article/10.1023%2FA%3A1011338221623Accessed Nov,2015
Raza, S.A., Jawaid,S.T and Adnan ,M.2013, “A DuPont Analysis on Insurance Sector of South Asian Region”,MPRA Paper No. 49289, posted 25. August 2013 20:58.
Samba Financial Group, Company Profile – 2014.www.bloomberg.com/research/stocks/snapshot/snapshot.asp?...SAMBAAccessed Dec,2015
Samba Financial Group, Company Profile – 2011. www.alacrastore.com/.../moodys-global-credit-research-Samb. Accessed Jul,2016
Saunders, A.2000. “Management of Financial Institutions”, McGraw Hill, Third Edition,1999. www.gettextbooks.co.in/author/Anthony_SaundersAccessed Jul,2015
Soliman,M.2008. “The Use of DuPont Analysis by Market Participants”, The Accounting Review, University of Washington, 83( 3), pp.823–853, May 2008.faculty.haas.berkeley.edu/kli/papers/Soliman-2008TAR.pdf Accessed Nov,2015
Susan, M.M. 2004. “Why The DuPont Model Is Important, Valuation Strategies”, 7(3), pp.24-31, May 2012.leidykla.vgtu.lt/conferences/BM_2012/.../262_268_Zhang.pdf Accessed Oct,2015.