Embed Size (px)
Citation preview
A comparison of energy systems in Birmingham,UK, with Masdar City, an embryonic city in AbuDhabi EmirateBraithwaite, Peter; Lee, Susan; Leach, J M; Rogers, Christopher
DOI:10.1016/j.rser.2016.07.019
License:Creative Commons: Attribution (CC BY)
Document VersionPublisher's PDF, also known as Version of record
Citation for published version (Harvard):Braithwaite, P, Lee, S, Leach, JM & Rogers, C 2016, 'A comparison of energy systems in Birmingham, UK, withMasdar City, an embryonic city in Abu Dhabi Emirate' Renewable and Sustainable Energy Reviews, vol. 65, pp.1299–1309. DOI: 10.1016/j.rser.2016.07.019
Link to publication on Research at Birmingham portal
General rightsUnless a licence is specified above, all rights (including copyright and moral rights) in this document are retained by the authors and/or thecopyright holders. The express permission of the copyright holder must be obtained for any use of this material other than for purposespermitted by law.
•Users may freely distribute the URL that is used to identify this publication.•Users may download and/or print one copy of the publication from the University of Birmingham research portal for the purpose of privatestudy or non-commercial research.•User may use extracts from the document in line with the concept of ‘fair dealing’ under the Copyright, Designs and Patents Act 1988 (?)•Users may not further distribute the material nor use it for the purposes of commercial gain.
Where a licence is displayed above, please note the terms and conditions of the licence govern your use of this document.
When citing, please reference the published version.
Take down policyWhile the University of Birmingham exercises care and attention in making items available there are rare occasions when an item has beenuploaded in error or has been deemed to be commercially or otherwise sensitive.
If you believe that this is the case for this document, please contact [email protected] providing details and we will remove access tothe work immediately and investigate.
Download date: 15. Sep. 2018
Renewable and Sustainable Energy Reviews 65 (2016) 1299–1309
Contents lists available at ScienceDirect
Renewable and Sustainable Energy Reviews
http://d1364-03
n CorrE-mURL
journal homepage: www.elsevier.com/locate/rser
A comparison of energy systems in Birmingham, UK, with Masdar City,an embryonic city in Abu Dhabi Emirate
Susan E. Lee n, Peter Braithwaite, Joanne M. Leach, Chris D.F. RogersSchool of Civil Engineering, University of Birmingham, Edgbaston, Birmingham B15 2TT, UK
a r t i c l e i n f o
Article history:Received 30 June 2015Received in revised form24 June 2016Accepted 4 July 2016Available online 13 August 2016
Keywords:SustainabilityResilienceEnergy systemsExperimentationLock-inFlexibilityGovernance
x.doi.org/10.1016/j.rser.2016.07.01921/& 2016 The Authors. Published by Elsevier
esponding author.ail address: [email protected] (S.E. Lee).: http://www.liveablecities.org.uk (S.E. Lee).
a b s t r a c t
Energy is a vital resource in modern life. With increasingly limited availability of traditional energy re-sources, e.g., oil, coal and nuclear, together with environmental concerns, there is raised awareness thatenergy needs to be both used more efficiently and generated in line with thinking on sustainability.Ready access to ‘clean’ energy is essential if we wish to maintain our current way of life without com-promising our wellbeing or the carrying capacity of the planet. This paper aims to analyse the differencesand similarities in energy supply and demand between two very different cities. Masdar City, founded in2008, is a dynamic new Middle-Eastern city being built in a desert environment. Its aim is to be the mostsustainable city in the world and offers an exciting opportunity to provide unique insights into the ap-plication of different innovative technologies as ‘new-build’ within an urban environment. Birminghamis a well-established post-industrial city that has evolved over fourteen hundred years. It was one of thefastest growing cities in 19th century England (Popp and Wilson, 2009) [1]. To do this a material flowanalysis approach has been adopted to provide a framework for the study. The energy-related oppor-tunities and mutual benefits that each city can gain from the experiences of the other are explored andfive emergent issues are identified: innovation and experimentation, lock-in, balance, resilience andgovernance. This work shows how a greater understanding of common issues can lead to more sus-tainable, resilient and robust cities, able to face the challenges of the next 50 years.& 2016 The Authors. Published by Elsevier Ltd. This is an open access article under the CC BY-NC-ND
license (http://creativecommons.org/licenses/by-nc-nd/4.0/).
Contents
1. Introduction . . . . . . . . . . . . . . . . . . . . . . . . . . . . . . . . . . . . . . . . . . . . . . . . . . . . . . . . . . . . . . . . . . . . . . . . . . . . . . . . . . . . . . . . . . . . . . . . . . . . . . . 12992. Methodology . . . . . . . . . . . . . . . . . . . . . . . . . . . . . . . . . . . . . . . . . . . . . . . . . . . . . . . . . . . . . . . . . . . . . . . . . . . . . . . . . . . . . . . . . . . . . . . . . . . . . . 1300
2.1. Urban Metabolism and Material Flow Analysis (MFA) . . . . . . . . . . . . . . . . . . . . . . . . . . . . . . . . . . . . . . . . . . . . . . . . . . . . . . . . . . . . . . . . 13003. Comparison between Masdar City and Birmingham . . . . . . . . . . . . . . . . . . . . . . . . . . . . . . . . . . . . . . . . . . . . . . . . . . . . . . . . . . . . . . . . . . . . . . . 1301
3.1. Key facts: Masdar City and Birmingham . . . . . . . . . . . . . . . . . . . . . . . . . . . . . . . . . . . . . . . . . . . . . . . . . . . . . . . . . . . . . . . . . . . . . . . . . . 13013.2. History: Masdar City and Birmingham . . . . . . . . . . . . . . . . . . . . . . . . . . . . . . . . . . . . . . . . . . . . . . . . . . . . . . . . . . . . . . . . . . . . . . . . . . . . 13013.3. Energy context: Masdar City and Birmingham. . . . . . . . . . . . . . . . . . . . . . . . . . . . . . . . . . . . . . . . . . . . . . . . . . . . . . . . . . . . . . . . . . . . . . 13023.4. Energy supply and demand: Masdar City and Birmingham . . . . . . . . . . . . . . . . . . . . . . . . . . . . . . . . . . . . . . . . . . . . . . . . . . . . . . . . . . . 1303
4. Discussion . . . . . . . . . . . . . . . . . . . . . . . . . . . . . . . . . . . . . . . . . . . . . . . . . . . . . . . . . . . . . . . . . . . . . . . . . . . . . . . . . . . . . . . . . . . . . . . . . . . . . . . . 13065. Conclusion . . . . . . . . . . . . . . . . . . . . . . . . . . . . . . . . . . . . . . . . . . . . . . . . . . . . . . . . . . . . . . . . . . . . . . . . . . . . . . . . . . . . . . . . . . . . . . . . . . . . . . . . 1307Authors’ Contribution . . . . . . . . . . . . . . . . . . . . . . . . . . . . . . . . . . . . . . . . . . . . . . . . . . . . . . . . . . . . . . . . . . . . . . . . . . . . . . . . . . . . . . . . . . . . . . . . . . . 1308Acknowledgements . . . . . . . . . . . . . . . . . . . . . . . . . . . . . . . . . . . . . . . . . . . . . . . . . . . . . . . . . . . . . . . . . . . . . . . . . . . . . . . . . . . . . . . . . . . . . . . . . . . . . 1308References . . . . . . . . . . . . . . . . . . . . . . . . . . . . . . . . . . . . . . . . . . . . . . . . . . . . . . . . . . . . . . . . . . . . . . . . . . . . . . . . . . . . . . . . . . . . . . . . . . . . . . . . . . . . 1308
Ltd. This is an open access article u
1. Introduction
Energy is a vital component in modern-day life and is re-sponsible for the survival (food production, cooking, heating,cooling, water, transport of essential resources) and day-to-dayactivities (mobility, lighting, machinery, equipment,
nder the CC BY-NC-ND license (http://creativecommons.org/licenses/by-nc-nd/4.0/).

S.E. Lee et al. / Renewable and Sustainable Energy Reviews 65 (2016) 1299–13091300
communications, entertainment) of billions of people across theglobe. Unfortunately, the current global resources supplying thisenergy demand are on the decline and, according to BP, we willhave consumed all known global oil and gas reserves by around2066. Coal is more abundant, but it too is predicted to run out byaround 2126 [2]. By 2050, nuclear and renewable energy are ex-pected to account for just under 30% of energy supply, with 40%still supplied by coal and the remaining 30% from oil and gas [3].At the same time, there is an unprecedented and increasing de-mand on such resources, especially from developing countries [2].Notwithstanding the contributions of shale gas and tight oil, thecommon concern of rising costs of energy and a greater awarenessof the need for sustainability has spurred many nations into actionto address dwindling resource supply.
Across the world there is an increasing awareness of rising CO2
levels and a changing climate. This has led many countries to adoptstrict limits on the amount of CO2 emissions permitted though thesevary in the degree of legislation, enforcement and penalties.
In the UK, the Climate Change Act (2008) states that: “It is theduty of the Secretary of State to ensure that the net UK carbonaccount for the year 2050 is at least 80% lower than the 1990baseline” [4]. The European Union has endorsed this objectivearising from the Kyoto Protocol, which came into force in early2005 [5]. This legislation has also fed through to the local levelwith many UK Councils, including Birmingham City Council (BCC),developing their own carbon reduction plan with even more am-bitious targets in terms of timeframes [6]. Renewable energy playsa major part of the Government's plans for decarbonising the UKnational electricity grid and for a reduction in the use of fossil fuelsin the UK's energy supply [7].
At the same time, over in the Middle East, one country taking alead in the development of sustainable energy, perhaps surpris-ingly given its dependence on and access to oil and gas, is theUnited Arab Emirates (UAE). There has been phenomenal growthin renewable energy initiatives in this region over the last 10 years,allied to a surge in development combined with generous gov-ernment funding. The Abu Dhabi Emirate has been particularlykeen to embrace the concept of sustainability and has produced aneconomic vision for 2030 which encompasses it [8]. This visionadopts the ideology of sustainability originally proposed in theBrundtland report [9] by addressing the quality of the public spaceand emphasising the importance of community identification andsocial links alongside the importance given to the development ofinfrastructure. In addition, the government of Abu Dhabi has atarget of 7% of renewable energy capacity by 2020 [10], whichequates to around 1500 MW [11]. However, since the economiccollapse of 2007/2008, expansion has occurred at a slower pace.Some projects have been reduced in scale or stopped, yet, in spiteof this; ambitious plans are still being achieved.
Masdar City was established with the aim of being an exemplarof sustainable energy development and to act as a showcase fornew technologies. US$15 billion have been committed to theproject, along with more than US$1.7 billion of equity in renew-able energy projects worth more than US$6.4 billion in Abu Dhabiand around the globe, including the London Array and solar pro-jects in Spain [10]. At its heart is the Masdar Institute, an educationestablishment with 337 students and the global headquartersbuilding for the Siemens electrical company [10].
Two key questions posed by the issue of diminishing fossil fuelsupplies are: what are the alternative energy supply options andhow successfully can renewable energy infrastructure be im-plemented within an urban environment? In addition, there areconcerns about the sustainability of many cities, particularly withgrowing populations, so fuel efficiency and the minimisation ofenergy use is also of interest. To try to address these questions andto highlight work that has been carried out in the Arabian eco-city,
Masdar City, which aims to be the most sustainable city in theworld, this paper investigates the similarities and differences be-tween the existing energy systems in the embryonic city, withBirmingham, a well-established post-industrial city in northernEurope. The approach adopted follows a Material Flow Analysis(MFA) whereby the inputs and output flows of the system arequantified and placed in the context of each city. Five core issuesare identified from this work: innovation and experimentation,lock-in, balance, resilience and governance. These are explained inmore detail within the paper.
The aim of this paper is to explore energy supply and use intwo very different cities – Birmingham, UK and Masdar City, UAE –
with very different histories, economies, climates and cultures,and to show how developments in both can lead to a commonunderstanding about the most efficient use of energy. To assess theenergy systems of the two cities and to compare them, a MaterialFlow Analysis (MFA) approach has been used. This approach buildson the theory of Urban Metabolism and its application to city re-source flows. Urban Metabolism and Material Flow Analysis (MFA)are briefly explained in Section 2 followed by a comparison be-tween the two cities in Section 3 and their associated energy use.We assume no major changes over the short-term. Section 4 dis-cusses the energy strategies within the context of the two cities,while the conclusion (Section 5) includes proposals for how thisunderstanding will help Masdar and Birmingham to be more re-silient, robust and sustainable over the next 50 years and beyond.
2. Methodology
2.1. Urban Metabolism and Material Flow Analysis (MFA)
Urban Metabolism examines the resource flows into and out ofa city and considers them from a biological point of view. Materialand energy flows are the inputs, waste and emissions are theoutputs, and buildings and infrastructure are the stock. The city isviewed as a living organism which is constantly restructuring anddeveloping. The term is attributed to Wolman [12] who originallyintroduced the method to study air and water pollution in Amer-ican cities, and has been used by numerous authors since, acrossmany disciplines [13–15]. For a full selection of reviews on thetopic see [16–18].
Material Flow Analysis (MFA) is a methodology that has arisenout of Urban Metabolism studies. It was originally developed byPaul Brunner [19] and quantifies flows and stocks in a systemacross space and time. This technique provides a framework inwhich production, stocks and consumption of energy can be as-sessed for each city. This paper focuses on the single resource ofenergy for a given year (2012) though some more recent data (upto 2015) are also presented. Birmingham is bounded by its mu-nicipal boundary and Masdar by its city plan area. However, theenergy consumption of each city is considered in its respectivecountry's context. Energy consumption is expressed in terms ofmass (Mtoe, Million tonnes of oil equivalent) at the country leveland in terms of electrical energy (kWh) at the local level.
Energy consumption data have been extracted for each city, aswell as energy production and consumption data for their re-spective countries (United Arab Emirates and the UK). These datawere then compared and assessed within the context of eachcountry taking account of the different climates, pricing systems,energy efficiencies and type of energy used by different sectors(e.g. domestic, industry, transport, etc.). The approaches to sus-tainability and local schemes were also compared as well as anassessment of the resilience of each city.

Table 1Summary of the key characteristics of each city.
Subject Masdar City Birmingham Metropolitan District
Current (2015) Projected by 2030 (estimated completion date)
Latitude/Longitude 24°25′45″N 54°37′6″E 52°28′59″N, 1°53′37″WClimate Subtropical Warm temperatePopulation (people living in city) 570 [20] 40,000 [23] 1,092,300 (2013) [29]Population density (people/km2) 95 13,000–16,000 [84] 4012 [28]People aged 16–64 n/a 699,700 (2013) [29]Commuters n/a 50,000 [23] 196, 089 (In); 83,495 (Out) [64]People employed in the city 1320 426,300 [29]Area of city (km2) 6 6 268
S.E. Lee et al. / Renewable and Sustainable Energy Reviews 65 (2016) 1299–1309 1301
3. Comparison between Masdar City and Birmingham
3.1. Key facts: Masdar City and Birmingham
Table 1 provides a summary of the key characteristics of eachcity including its population, population density, geographic areaand demography. The population of Masdar consists of staff andstudents at the Masdar Institute and employees of Siemens and afew other companies. For 2015, the daytime population of Masdarconsists of graduates and students at the Masdar Institute (around570 people) [20], as well as employees of Siemens (800 people(estimated 528 people in 2014)), IRENA (90 people), Masdar em-ployees in Masdar City (210), other companies such as Mitsubishiand General Electric, and with the staff at the Masdar Institute(220 people) [20] this equates to 1890 people which is furtherconfirmed by [21]. Many of these people currently commute toMasdar City, with Masdar Institute students making up the bulk ofthe residents of the city. This is expected to change as more re-sidential buildings are built. For 2014 the population was esti-mated to be 1618 people. The contrasts between the two cities areevident in their size, populations, density of people and climate.
3.2. History: Masdar City and Birmingham
Masdar City (24°25′45″N 54°37′6″E) is a large-scale mixed usedevelopment which lies 17 km south-east of the centre of the city ofAbu Dhabi, in Abu Dhabi Emirate, one of the seven United ArabEmirates (UAE). It is the first city in the world to be designed to be“zero-carbon” and “zero-waste”. It was established in 2006 throughthe Mubadala Development Company owned by the Abu DhabiGovernment with a view to building “the world's most sustainablecity” of 40,000 people with 50,000 commuters covering 6 km2 andproducing economic development and diversification in the Emi-rate. It was due to be completed in 2016, but with the global eco-nomic downturn this led to a revised completion date of 2025 [22].The city is designed to encourage walking, with any nearest publictransport link being within a maximum walking distance of 350 m.Residents and commercial tenants can walk or use public trans-portation for all their needs within Masdar City [23]. Additionally,Masdar City will be linked to Abu Dhabi City's upcoming publictransportation options of the LRT (light rail transport) which coversthe outskirts of the city and the Metro light rail system within AbuDhabi City, some of which may be underground [24]. Masdar City'sbuildings are only permitted to be up to five stories high, and arebuilt on narrow streets, with rooftops covered with solar panels andstreet-level “solar canopies” providing shade. The shaded paths andnarrow streets are designed to create a pleasant environment inwhich to walk in Abu Dhabi Emirate's hot climate. The City is ex-pected to consist of 10 neighbourhoods constructed one at a timeover seven phases and building on previous experience througheach phase. The city is to be surrounded by a wall to protect it from
the desert winds, as well as from the effects of dust and noisearising from the nearby Abu Dhabi airport.
The first six buildings of the Masdar Institute of Science andTechnology included three residential buildings, two laboratorybuildings and a Knowledge Centre – a total of 35,000 m2 of grossfloor area. Construction of the second phase of the Masdar In-stitute is now complete, which more than doubles the size of theInstitute to approximately 80,000 m2 with new student accom-modation, flats, science and sports facilities together with anumber of retail outlets [25]. The 10,000 m2 Incubator Building,the first commercial building in the city, is also now complete withcompanies like GE, Mitsubishi Heavy Industries, Schneider Electricand more than 50 small and medium-sized enterprises (SMEs)taking office space. In addition, the Siemens Middle East Head-quarters Building (23,100 m2) currently houses 800 employeeswith a further 700 expected to join them over the next few years.These buildings represent projects that are tripling the size of thecity, from 35,000 m2 to approximately 110,000 m2. The buildingfor the new Masdar HQ and the International Renewable EnergyAgency (IRENA) was completed in Jan 2015. The staff for thisbuilding, together with planned residential projects, will furtherincrease the city population. In 2013, Masdar City had an esti-mated population of around 1000, consisting mostly of students[26] but taking into account new employees at Siemens some ofwhom are likely to be day-time commuters into the city this hasnow risen to just under 2000.
The future of Masdar City is, however, beginning to look moreuncertain with many office blocks within the city unoccupied, andlarge areas of undeveloped land (only 5% of the total city area of6 km2 is built on) [21]. There are also concerns that some existingcompanies may move on to more profitable locations (in terms oftax, cost of living, proximity to markets etc.). Furthermore, anypeople employed in these companies are not emotionally bound tothe city through home ownership, as many rent their accom-modation [27].
Birmingham (52°28′59″N, 1°53′37″W) is in the English WestMidlands and is the UK's second city, in terms of size, after London.It grew during the Industrial Revolution mostly due to its easy ac-cess to coal, iron, limestone and water, and became famous for itsiron and steel-making. Birmingham Metropolitan District covers anarea of 268 km2 with a density of 4012 people/km2 [28]. It is hometo just over a million people with 426,300 people employed in thecity [29]. Birmingham has a young population, with 23% of its po-pulation under 16, and is multicultural with 42% of its populationfrom a non-UK background [30]. The city is 300 m above sea leveland has no major rivers. However, there are three small rivers – theCole, Tame and Rea – and six major canals covering around 161 km[31]. Despite its industrial past, Birmingham has 3200 ha of park-land [32] and was the first UK city to become a ‘biophilic’ city [33].
Established around the early 7th century [34], Birminghamprospered with the development of many industries linked to metal
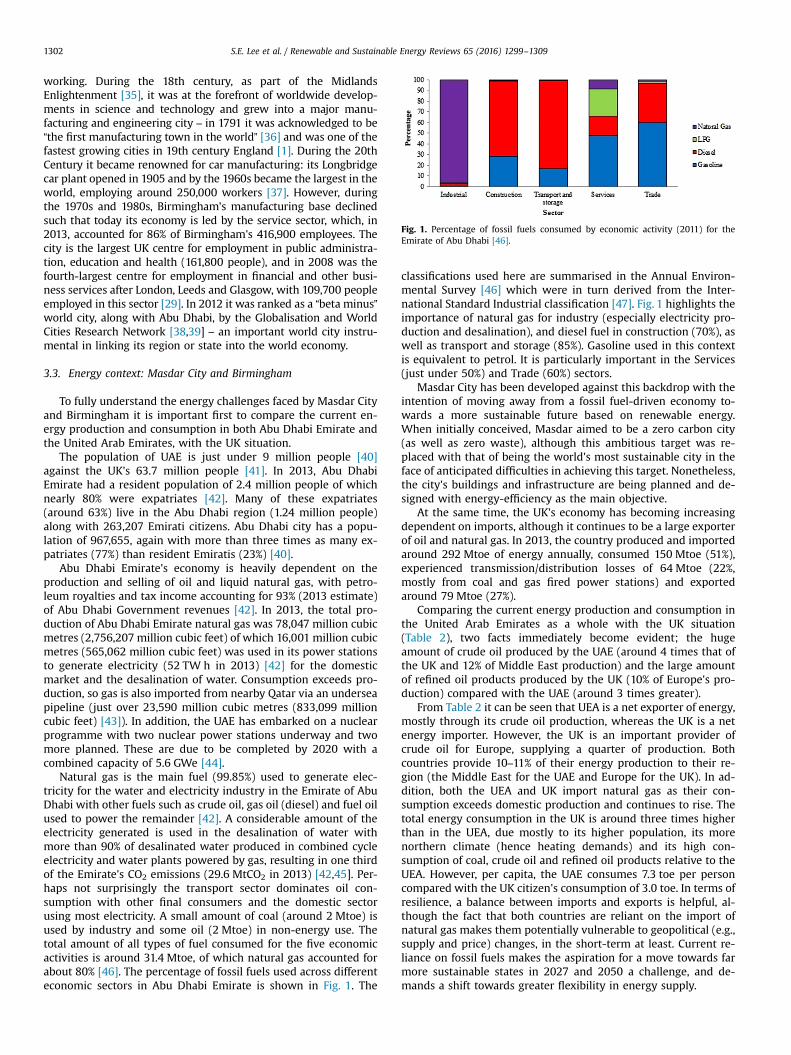
Fig. 1. Percentage of fossil fuels consumed by economic activity (2011) for theEmirate of Abu Dhabi [46].
S.E. Lee et al. / Renewable and Sustainable Energy Reviews 65 (2016) 1299–13091302
working. During the 18th century, as part of the MidlandsEnlightenment [35], it was at the forefront of worldwide develop-ments in science and technology and grew into a major manu-facturing and engineering city – in 1791 it was acknowledged to be“the first manufacturing town in the world” [36] and was one of thefastest growing cities in 19th century England [1]. During the 20thCentury it became renowned for car manufacturing: its Longbridgecar plant opened in 1905 and by the 1960s became the largest in theworld, employing around 250,000 workers [37]. However, duringthe 1970s and 1980s, Birmingham's manufacturing base declinedsuch that today its economy is led by the service sector, which, in2013, accounted for 86% of Birmingham's 416,900 employees. Thecity is the largest UK centre for employment in public administra-tion, education and health (161,800 people), and in 2008 was thefourth-largest centre for employment in financial and other busi-ness services after London, Leeds and Glasgow, with 109,700 peopleemployed in this sector [29]. In 2012 it was ranked as a “beta minus”world city, along with Abu Dhabi, by the Globalisation and WorldCities Research Network [38,39] – an important world city instru-mental in linking its region or state into the world economy.
3.3. Energy context: Masdar City and Birmingham
To fully understand the energy challenges faced by Masdar Cityand Birmingham it is important first to compare the current en-ergy production and consumption in both Abu Dhabi Emirate andthe United Arab Emirates, with the UK situation.
The population of UAE is just under 9 million people [40]against the UK's 63.7 million people [41]. In 2013, Abu DhabiEmirate had a resident population of 2.4 million people of whichnearly 80% were expatriates [42]. Many of these expatriates(around 63%) live in the Abu Dhabi region (1.24 million people)along with 263,207 Emirati citizens. Abu Dhabi city has a popu-lation of 967,655, again with more than three times as many ex-patriates (77%) than resident Emiratis (23%) [40].
Abu Dhabi Emirate's economy is heavily dependent on theproduction and selling of oil and liquid natural gas, with petro-leum royalties and tax income accounting for 93% (2013 estimate)of Abu Dhabi Government revenues [42]. In 2013, the total pro-duction of Abu Dhabi Emirate natural gas was 78,047 million cubicmetres (2,756,207 million cubic feet) of which 16,001 million cubicmetres (565,062 million cubic feet) was used in its power stationsto generate electricity (52 TW h in 2013) [42] for the domesticmarket and the desalination of water. Consumption exceeds pro-duction, so gas is also imported from nearby Qatar via an underseapipeline (just over 23,590 million cubic metres (833,099 millioncubic feet) [43]). In addition, the UAE has embarked on a nuclearprogramme with two nuclear power stations underway and twomore planned. These are due to be completed by 2020 with acombined capacity of 5.6 GWe [44].
Natural gas is the main fuel (99.85%) used to generate elec-tricity for the water and electricity industry in the Emirate of AbuDhabi with other fuels such as crude oil, gas oil (diesel) and fuel oilused to power the remainder [42]. A considerable amount of theelectricity generated is used in the desalination of water withmore than 90% of desalinated water produced in combined cycleelectricity and water plants powered by gas, resulting in one thirdof the Emirate's CO2 emissions (29.6 MtCO2 in 2013) [42,45]. Per-haps not surprisingly the transport sector dominates oil con-sumption with other final consumers and the domestic sectorusing most electricity. A small amount of coal (around 2 Mtoe) isused by industry and some oil (2 Mtoe) in non-energy use. Thetotal amount of all types of fuel consumed for the five economicactivities is around 31.4 Mtoe, of which natural gas accounted forabout 80% [46]. The percentage of fossil fuels used across differenteconomic sectors in Abu Dhabi Emirate is shown in Fig. 1. The
classifications used here are summarised in the Annual Environ-mental Survey [46] which were in turn derived from the Inter-national Standard Industrial classification [47]. Fig. 1 highlights theimportance of natural gas for industry (especially electricity pro-duction and desalination), and diesel fuel in construction (70%), aswell as transport and storage (85%). Gasoline used in this contextis equivalent to petrol. It is particularly important in the Services(just under 50%) and Trade (60%) sectors.
Masdar City has been developed against this backdrop with theintention of moving away from a fossil fuel-driven economy to-wards a more sustainable future based on renewable energy.When initially conceived, Masdar aimed to be a zero carbon city(as well as zero waste), although this ambitious target was re-placed with that of being the world's most sustainable city in theface of anticipated difficulties in achieving this target. Nonetheless,the city's buildings and infrastructure are being planned and de-signed with energy-efficiency as the main objective.
At the same time, the UK's economy has becoming increasingdependent on imports, although it continues to be a large exporterof oil and natural gas. In 2013, the country produced and importedaround 292 Mtoe of energy annually, consumed 150 Mtoe (51%),experienced transmission/distribution losses of 64 Mtoe (22%,mostly from coal and gas fired power stations) and exportedaround 79 Mtoe (27%).
Comparing the current energy production and consumption inthe United Arab Emirates as a whole with the UK situation(Table 2), two facts immediately become evident; the hugeamount of crude oil produced by the UAE (around 4 times that ofthe UK and 12% of Middle East production) and the large amountof refined oil products produced by the UK (10% of Europe's pro-duction) compared with the UAE (around 3 times greater).
From Table 2 it can be seen that UEA is a net exporter of energy,mostly through its crude oil production, whereas the UK is a netenergy importer. However, the UK is an important provider ofcrude oil for Europe, supplying a quarter of production. Bothcountries provide 10–11% of their energy production to their re-gion (the Middle East for the UAE and Europe for the UK). In ad-dition, both the UEA and UK import natural gas as their con-sumption exceeds domestic production and continues to rise. Thetotal energy consumption in the UK is around three times higherthan in the UEA, due mostly to its higher population, its morenorthern climate (hence heating demands) and its high con-sumption of coal, crude oil and refined oil products relative to theUEA. However, per capita, the UAE consumes 7.3 toe per personcompared with the UK citizen's consumption of 3.0 toe. In terms ofresilience, a balance between imports and exports is helpful, al-though the fact that both countries are reliant on the import ofnatural gas makes them potentially vulnerable to geopolitical (e.g.,supply and price) changes, in the short-term at least. Current re-liance on fossil fuels makes the aspiration for a move towards farmore sustainable states in 2027 and 2050 a challenge, and de-mands a shift towards greater flexibility in energy supply.
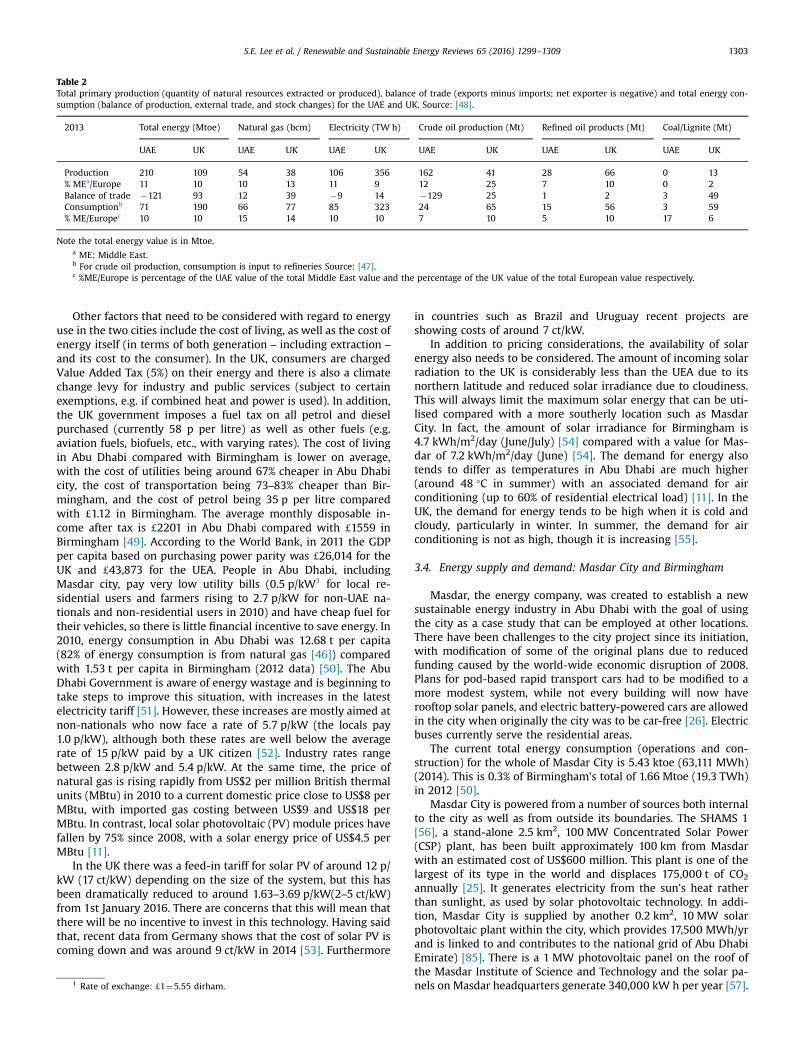
Table 2Total primary production (quantity of natural resources extracted or produced), balance of trade (exports minus imports; net exporter is negative) and total energy con-sumption (balance of production, external trade, and stock changes) for the UAE and UK. Source: [48].
2013 Total energy (Mtoe) Natural gas (bcm) Electricity (TW h) Crude oil production (Mt) Refined oil products (Mt) Coal/Lignite (Mt)
UAE UK UAE UK UAE UK UAE UK UAE UK UAE UK
Production 210 109 54 38 106 356 162 41 28 66 0 13% MEa/Europe 11 10 10 13 11 9 12 25 7 10 0 2Balance of trade �121 93 12 39 �9 14 �129 25 1 2 3 49Consumptionb 71 190 66 77 85 323 24 65 15 56 3 59% ME/Europec 10 10 15 14 10 10 7 10 5 10 17 6
Note the total energy value is in Mtoe.a ME: Middle East.b For crude oil production, consumption is input to refineries Source: [47].c %ME/Europe is percentage of the UAE value of the total Middle East value and the percentage of the UK value of the total European value respectively.
S.E. Lee et al. / Renewable and Sustainable Energy Reviews 65 (2016) 1299–1309 1303
Other factors that need to be considered with regard to energyuse in the two cities include the cost of living, as well as the cost ofenergy itself (in terms of both generation – including extraction –
and its cost to the consumer). In the UK, consumers are chargedValue Added Tax (5%) on their energy and there is also a climatechange levy for industry and public services (subject to certainexemptions, e.g. if combined heat and power is used). In addition,the UK government imposes a fuel tax on all petrol and dieselpurchased (currently 58 p per litre) as well as other fuels (e.g.aviation fuels, biofuels, etc., with varying rates). The cost of livingin Abu Dhabi compared with Birmingham is lower on average,with the cost of utilities being around 67% cheaper in Abu Dhabicity, the cost of transportation being 73–83% cheaper than Bir-mingham, and the cost of petrol being 35 p per litre comparedwith d1.12 in Birmingham. The average monthly disposable in-come after tax is d2201 in Abu Dhabi compared with d1559 inBirmingham [49]. According to the World Bank, in 2011 the GDPper capita based on purchasing power parity was d26,014 for theUK and d43,873 for the UEA. People in Abu Dhabi, includingMasdar city, pay very low utility bills (0.5 p/kW1 for local re-sidential users and farmers rising to 2.7 p/kW for non-UAE na-tionals and non-residential users in 2010) and have cheap fuel fortheir vehicles, so there is little financial incentive to save energy. In2010, energy consumption in Abu Dhabi was 12.68 t per capita(82% of energy consumption is from natural gas [46]) comparedwith 1.53 t per capita in Birmingham (2012 data) [50]. The AbuDhabi Government is aware of energy wastage and is beginning totake steps to improve this situation, with increases in the latestelectricity tariff [51]. However, these increases are mostly aimed atnon-nationals who now face a rate of 5.7 p/kW (the locals pay1.0 p/kW), although both these rates are well below the averagerate of 15 p/kW paid by a UK citizen [52]. Industry rates rangebetween 2.8 p/kW and 5.4 p/kW. At the same time, the price ofnatural gas is rising rapidly from US$2 per million British thermalunits (MBtu) in 2010 to a current domestic price close to US$8 perMBtu, with imported gas costing between US$9 and US$18 perMBtu. In contrast, local solar photovoltaic (PV) module prices havefallen by 75% since 2008, with a solar energy price of US$4.5 perMBtu [11].
In the UK there was a feed-in tariff for solar PV of around 12 p/kW (17 ct/kW) depending on the size of the system, but this hasbeen dramatically reduced to around 1.63–3.69 p/kW(2–5 ct/kW)from 1st January 2016. There are concerns that this will mean thatthere will be no incentive to invest in this technology. Having saidthat, recent data from Germany shows that the cost of solar PV iscoming down and was around 9 ct/kW in 2014 [53]. Furthermore
1 Rate of exchange: d1¼5.55 dirham.
in countries such as Brazil and Uruguay recent projects areshowing costs of around 7 ct/kW.
In addition to pricing considerations, the availability of solarenergy also needs to be considered. The amount of incoming solarradiation to the UK is considerably less than the UEA due to itsnorthern latitude and reduced solar irradiance due to cloudiness.This will always limit the maximum solar energy that can be uti-lised compared with a more southerly location such as MasdarCity. In fact, the amount of solar irradiance for Birmingham is4.7 kWh/m2/day (June/July) [54] compared with a value for Mas-dar of 7.2 kWh/m2/day (June) [54]. The demand for energy alsotends to differ as temperatures in Abu Dhabi are much higher(around 48 °C in summer) with an associated demand for airconditioning (up to 60% of residential electrical load) [11]. In theUK, the demand for energy tends to be high when it is cold andcloudy, particularly in winter. In summer, the demand for airconditioning is not as high, though it is increasing [55].
3.4. Energy supply and demand: Masdar City and Birmingham
Masdar, the energy company, was created to establish a newsustainable energy industry in Abu Dhabi with the goal of usingthe city as a case study that can be employed at other locations.There have been challenges to the city project since its initiation,with modification of some of the original plans due to reducedfunding caused by the world-wide economic disruption of 2008.Plans for pod-based rapid transport cars had to be modified to amore modest system, while not every building will now haverooftop solar panels, and electric battery-powered cars are allowedin the city when originally the city was to be car-free [26]. Electricbuses currently serve the residential areas.
The current total energy consumption (operations and con-struction) for the whole of Masdar City is 5.43 ktoe (63,111 MWh)(2014). This is 0.3% of Birmingham's total of 1.66 Mtoe (19.3 TWh)in 2012 [50].
Masdar City is powered from a number of sources both internalto the city as well as from outside its boundaries. The SHAMS 1[56], a stand-alone 2.5 km2, 100 MW Concentrated Solar Power(CSP) plant, has been built approximately 100 km from Masdarwith an estimated cost of US$600 million. This plant is one of thelargest of its type in the world and displaces 175,000 t of CO2
annually [25]. It generates electricity from the sun's heat ratherthan sunlight, as used by solar photovoltaic technology. In addi-tion, Masdar City is supplied by another 0.2 km2, 10 MW solarphotovoltaic plant within the city, which provides 17,500 MWh/yrand is linked to and contributes to the national grid of Abu DhabiEmirate) [85]. There is a 1 MW photovoltaic panel on the roof ofthe Masdar Institute of Science and Technology and the solar pa-nels on Masdar headquarters generate 340,000 kW h per year [57].
S.E. Lee et al. / Renewable and Sustainable Energy Reviews 65 (2016) 1299–13091304
Within Masdar, 75% of the total hot water is produced by solarenergy, and fresh air handling units in the Siemens building haveled to a 75% latent and sensible heat recovery. The SiemensBuilding, IRENA Building and the Incubator Building have angledfacades to reduce solar glare and heat gain (30% reduction for theIncubator Building) [25]. Other initiatives include a solar coolingproject, which is expected to work as a 170 kW chiller, and a geo-thermal cooling project, which has involved digging two 2.5 kmdeep wells [58]. A 45 m tower in Masdar City, based on traditionalArab technology, is also used as a cooler by directing hot air up andout of its surrounding area as well as bringing cooler air from aloftdown to the surface. A 100 kW thermal power plant is being es-tablished that will convert solar energy into thermal energythrough a set of reflective mirrors.
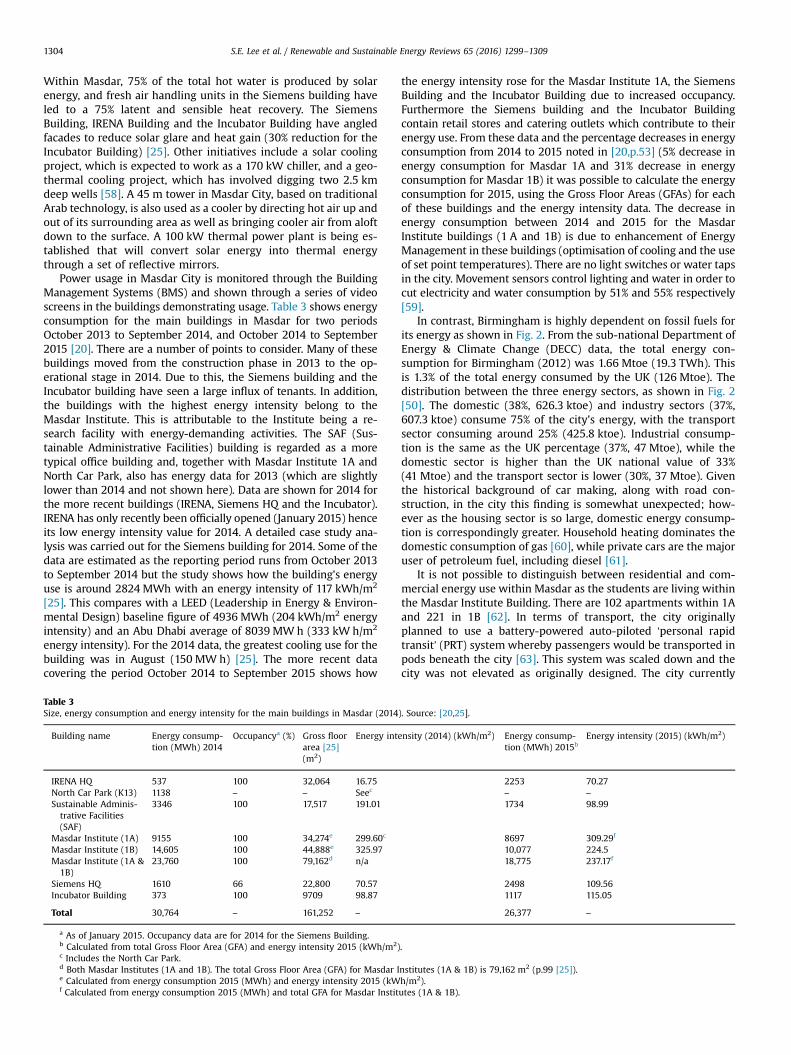
Power usage in Masdar City is monitored through the BuildingManagement Systems (BMS) and shown through a series of videoscreens in the buildings demonstrating usage. Table 3 shows energyconsumption for the main buildings in Masdar for two periodsOctober 2013 to September 2014, and October 2014 to September2015 [20]. There are a number of points to consider. Many of thesebuildings moved from the construction phase in 2013 to the op-erational stage in 2014. Due to this, the Siemens building and theIncubator building have seen a large influx of tenants. In addition,the buildings with the highest energy intensity belong to theMasdar Institute. This is attributable to the Institute being a re-search facility with energy-demanding activities. The SAF (Sus-tainable Administrative Facilities) building is regarded as a moretypical office building and, together with Masdar Institute 1A andNorth Car Park, also has energy data for 2013 (which are slightlylower than 2014 and not shown here). Data are shown for 2014 forthe more recent buildings (IRENA, Siemens HQ and the Incubator).IRENA has only recently been officially opened (January 2015) henceits low energy intensity value for 2014. A detailed case study ana-lysis was carried out for the Siemens building for 2014. Some of thedata are estimated as the reporting period runs from October 2013to September 2014 but the study shows how the building's energyuse is around 2824 MWh with an energy intensity of 117 kWh/m2
[25]. This compares with a LEED (Leadership in Energy & Environ-mental Design) baseline figure of 4936 MWh (204 kWh/m2 energyintensity) and an Abu Dhabi average of 8039 MW h (333 kW h/m2
energy intensity). For the 2014 data, the greatest cooling use for thebuilding was in August (150 MW h) [25]. The more recent datacovering the period October 2014 to September 2015 shows how
Table 3Size, energy consumption and energy intensity for the main buildings in Masdar (2014
Building name Energy consump-tion (MWh) 2014
Occupancya (%) Gross floorarea [25](m2)
Energy int
IRENA HQ 537 100 32,064 16.75North Car Park (K13) 1138 – – Seec
Sustainable Adminis-trative Facilities(SAF)
3346 100 17,517 191.01
Masdar Institute (1A) 9155 100 34,274e 299.60c
Masdar Institute (1B) 14,605 100 44,888e 325.97Masdar Institute (1A &1B)
23,760 100 79,162d n/a
Siemens HQ 1610 66 22,800 70.57Incubator Building 373 100 9709 98.87
Total 30,764 – 161,252 –
a As of January 2015. Occupancy data are for 2014 for the Siemens Building.b Calculated from total Gross Floor Area (GFA) and energy intensity 2015 (kWh/m2)c Includes the North Car Park.d Both Masdar Institutes (1A and 1B). The total Gross Floor Area (GFA) for Masdar Ie Calculated from energy consumption 2015 (MWh) and energy intensity 2015 (kWf Calculated from energy consumption 2015 (MWh) and total GFA for Masdar Instit
the energy intensity rose for the Masdar Institute 1A, the SiemensBuilding and the Incubator Building due to increased occupancy.Furthermore the Siemens building and the Incubator Buildingcontain retail stores and catering outlets which contribute to theirenergy use. From these data and the percentage decreases in energyconsumption from 2014 to 2015 noted in [20,p.53] (5% decrease inenergy consumption for Masdar 1A and 31% decrease in energyconsumption for Masdar 1B) it was possible to calculate the energyconsumption for 2015, using the Gross Floor Areas (GFAs) for eachof these buildings and the energy intensity data. The decrease inenergy consumption between 2014 and 2015 for the MasdarInstitute buildings (1 A and 1B) is due to enhancement of EnergyManagement in these buildings (optimisation of cooling and the useof set point temperatures). There are no light switches or water tapsin the city. Movement sensors control lighting and water in order tocut electricity and water consumption by 51% and 55% respectively[59].
In contrast, Birmingham is highly dependent on fossil fuels forits energy as shown in Fig. 2. From the sub-national Department ofEnergy & Climate Change (DECC) data, the total energy con-sumption for Birmingham (2012) was 1.66 Mtoe (19.3 TWh). Thisis 1.3% of the total energy consumed by the UK (126 Mtoe). Thedistribution between the three energy sectors, as shown in Fig. 2[50]. The domestic (38%, 626.3 ktoe) and industry sectors (37%,607.3 ktoe) consume 75% of the city's energy, with the transportsector consuming around 25% (425.8 ktoe). Industrial consump-tion is the same as the UK percentage (37%, 47 Mtoe), while thedomestic sector is higher than the UK national value of 33%(41 Mtoe) and the transport sector is lower (30%, 37 Mtoe). Giventhe historical background of car making, along with road con-struction, in the city this finding is somewhat unexpected; how-ever as the housing sector is so large, domestic energy consump-tion is correspondingly greater. Household heating dominates thedomestic consumption of gas [60], while private cars are the majoruser of petroleum fuel, including diesel [61].
It is not possible to distinguish between residential and com-mercial energy use within Masdar as the students are living withinthe Masdar Institute Building. There are 102 apartments within 1Aand 221 in 1B [62]. In terms of transport, the city originallyplanned to use a battery-powered auto-piloted ‘personal rapidtransit’ (PRT) system whereby passengers would be transported inpods beneath the city [63]. This system was scaled down and thecity was not elevated as originally designed. The city currently
). Source: [20,25].
ensity (2014) (kWh/m2) Energy consump-tion (MWh) 2015b
Energy intensity (2015) (kWh/m2)
2253 70.27– –
1734 98.99
8697 309.29f
10,077 224.518,775 237.17f
2498 109.561117 115.05
26,377 –
.
nstitutes (1A & 1B) is 79,162 m2 (p.99 [25]).h/m2).utes (1A & 1B).
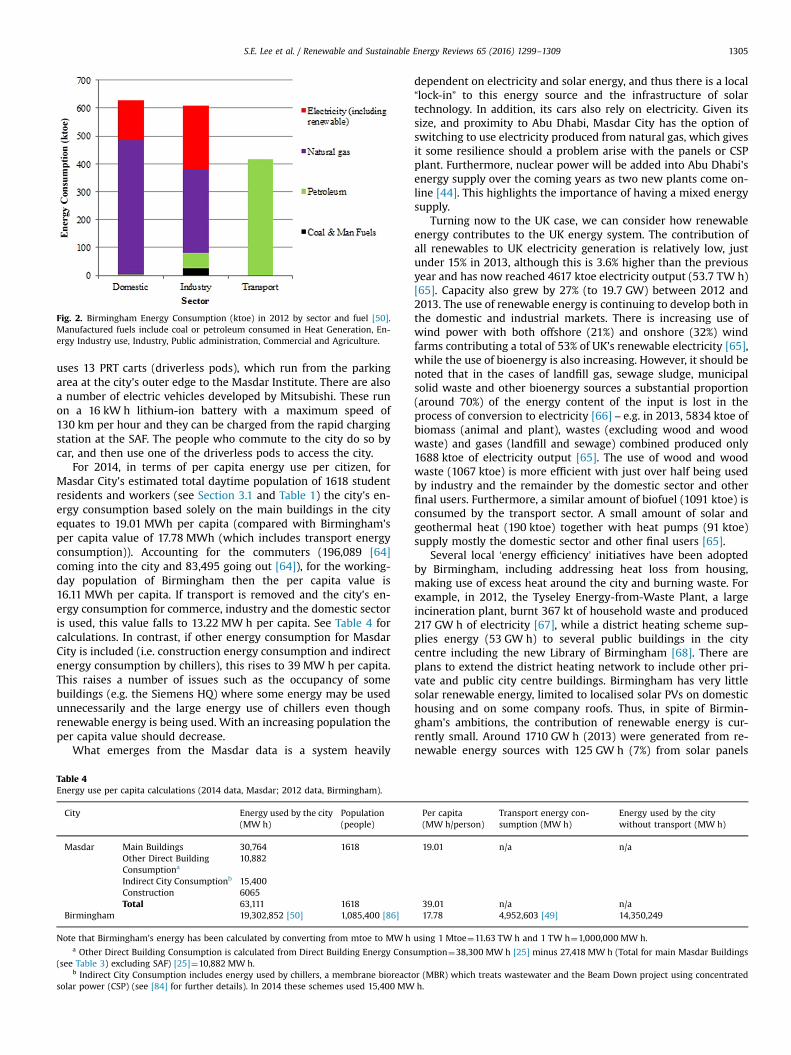
Fig. 2. Birmingham Energy Consumption (ktoe) in 2012 by sector and fuel [50].Manufactured fuels include coal or petroleum consumed in Heat Generation, En-ergy Industry use, Industry, Public administration, Commercial and Agriculture.
S.E. Lee et al. / Renewable and Sustainable Energy Reviews 65 (2016) 1299–1309 1305
uses 13 PRT carts (driverless pods), which run from the parkingarea at the city's outer edge to the Masdar Institute. There are alsoa number of electric vehicles developed by Mitsubishi. These runon a 16 kW h lithium-ion battery with a maximum speed of130 km per hour and they can be charged from the rapid chargingstation at the SAF. The people who commute to the city do so bycar, and then use one of the driverless pods to access the city.
For 2014, in terms of per capita energy use per citizen, forMasdar City's estimated total daytime population of 1618 studentresidents and workers (see Section 3.1 and Table 1) the city's en-ergy consumption based solely on the main buildings in the cityequates to 19.01 MWh per capita (compared with Birmingham'sper capita value of 17.78 MWh (which includes transport energyconsumption)). Accounting for the commuters (196,089 [64]coming into the city and 83,495 going out [64]), for the working-day population of Birmingham then the per capita value is16.11 MWh per capita. If transport is removed and the city's en-ergy consumption for commerce, industry and the domestic sectoris used, this value falls to 13.22 MW h per capita. See Table 4 forcalculations. In contrast, if other energy consumption for MasdarCity is included (i.e. construction energy consumption and indirectenergy consumption by chillers), this rises to 39 MW h per capita.This raises a number of issues such as the occupancy of somebuildings (e.g. the Siemens HQ) where some energy may be usedunnecessarily and the large energy use of chillers even thoughrenewable energy is being used. With an increasing population theper capita value should decrease.
What emerges from the Masdar data is a system heavily
Table 4Energy use per capita calculations (2014 data, Masdar; 2012 data, Birmingham).
City Energy used by the city(MW h)
Population(people)
Masdar Main Buildings 30,764 1618Other Direct BuildingConsumptiona
10,882
Indirect City Consumptionb 15,400Construction 6065Total 63,111 1618
Birmingham 19,302,852 [50] 1,085,400 [86]
Note that Birmingham's energy has been calculated by converting from mtoe to MW ha Other Direct Building Consumption is calculated from Direct Building Energy Cons
(see Table 3) excluding SAF) [25]¼10,882 MW h.b Indirect City Consumption includes energy used by chillers, a membrane bioreact
solar power (CSP) (see [84] for further details). In 2014 these schemes used 15,400 MW
dependent on electricity and solar energy, and thus there is a local“lock-in” to this energy source and the infrastructure of solartechnology. In addition, its cars also rely on electricity. Given itssize, and proximity to Abu Dhabi, Masdar City has the option ofswitching to use electricity produced from natural gas, which givesit some resilience should a problem arise with the panels or CSPplant. Furthermore, nuclear power will be added into Abu Dhabi'senergy supply over the coming years as two new plants come on-line [44]. This highlights the importance of having a mixed energysupply.
Turning now to the UK case, we can consider how renewableenergy contributes to the UK energy system. The contribution ofall renewables to UK electricity generation is relatively low, justunder 15% in 2013, although this is 3.6% higher than the previousyear and has now reached 4617 ktoe electricity output (53.7 TW h)[65]. Capacity also grew by 27% (to 19.7 GW) between 2012 and2013. The use of renewable energy is continuing to develop both inthe domestic and industrial markets. There is increasing use ofwind power with both offshore (21%) and onshore (32%) windfarms contributing a total of 53% of UK's renewable electricity [65],while the use of bioenergy is also increasing. However, it should benoted that in the cases of landfill gas, sewage sludge, municipalsolid waste and other bioenergy sources a substantial proportion(around 70%) of the energy content of the input is lost in theprocess of conversion to electricity [66] – e.g. in 2013, 5834 ktoe ofbiomass (animal and plant), wastes (excluding wood and woodwaste) and gases (landfill and sewage) combined produced only1688 ktoe of electricity output [65]. The use of wood and woodwaste (1067 ktoe) is more efficient with just over half being usedby industry and the remainder by the domestic sector and otherfinal users. Furthermore, a similar amount of biofuel (1091 ktoe) isconsumed by the transport sector. A small amount of solar andgeothermal heat (190 ktoe) together with heat pumps (91 ktoe)supply mostly the domestic sector and other final users [65].
Several local ‘energy efficiency’ initiatives have been adoptedby Birmingham, including addressing heat loss from housing,making use of excess heat around the city and burning waste. Forexample, in 2012, the Tyseley Energy-from-Waste Plant, a largeincineration plant, burnt 367 kt of household waste and produced217 GW h of electricity [67], while a district heating scheme sup-plies energy (53 GW h) to several public buildings in the citycentre including the new Library of Birmingham [68]. There areplans to extend the district heating network to include other pri-vate and public city centre buildings. Birmingham has very littlesolar renewable energy, limited to localised solar PVs on domestichousing and on some company roofs. Thus, in spite of Birmin-gham's ambitions, the contribution of renewable energy is cur-rently small. Around 1710 GW h (2013) were generated from re-newable energy sources with 125 GW h (7%) from solar panels
Per capita(MW h/person)
Transport energy con-sumption (MW h)
Energy used by the citywithout transport (MW h)
19.01 n/a n/a
39.01 n/a n/a17.78 4,952,603 [49] 14,350,249
using 1 Mtoe¼11.63 TW h and 1 TW h¼1,000,000 MW h.
umption¼38,300 MW h [25] minus 27,418 MW h (Total for main Masdar Buildings
or (MBR) which treats wastewater and the Beam Down project using concentratedh.
S.E. Lee et al. / Renewable and Sustainable Energy Reviews 65 (2016) 1299–13091306
across the entire West Midlands Region [69]. However, this is anincrease of nearly 70% from the previous year (including a rise of42% in the use of solar panels), so it is currently a growing market.Exemplars of good practice include Birmingham Airport's in-stallation of 200 solar panels on the roof of its terminal buildinggenerating 40 MW h and saving approximately 22 t of carbon di-oxide each year [70] and Severn Trent Water, now producingmethane gas from sewage to power homes (around 750 m3 of gasper hour (5 ktoe per year)) [71] alongside their current use of windturbines and solar panels.
The Birmingham Energy Savers scheme was launched in 2011with the aim of upgrading up to 60,000 homes with more efficientheating systems and better insulation, backed by the Govern-ment's Green Deal policy. It was designed to cut household fuelbills, cut greenhouse gas emissions and support the region'sgrowing green economy by creating thousands of jobs for sup-pliers. But in four years just 16 homes received the full Green Dealrefit, and another 3000 installations were carried out using otherfunds and grants. Birmingham's cabinet member for sustainability,Lisa Trickett, said increased interest on loans for installation andcuts in subsidies meant residents using the Green Deal could endup paying more, rather than making the promised savings, ontheir energy bills after the work was done. The Green Deal interestrate was seven per cent, but many homeowners taking out loansfor solar panels or a new boiler could access a personal loan atrates of three or four per cent. In the end the Council and itscontractor, Carillion, had agreed an “amicable divorce” and woundup the Birmingham Energy Savers scheme [72]. However, it isestimated that during its operation the scheme saved 20,000 t ofCO2 [73].
4. Discussion
Both the UK and the UAE have a history of reliance on the oileconomy, but with global trends of changes in climate and risingenergy costs there is growing interest in low-carbon and renew-able sources of energy. Birmingham and Masdar benefit differentlyfrom this increased interest and concomitant efforts to developand implement renewable energy. Birmingham has the advantageof having established processes and infrastructures into whichnew technologies can be integrated with minimal disruption tothe city's residents, workers and visitors, i.e. a known context inwhich interventions can be made and their effects determined.However, the converse effect of this existing set of infrastructuresystems concerns the lock-in to current paradigms of energysupply and distribution – there is a component of inertia in theseenergy and infrastructure systems to overcome when seeking tomake changes, thus compromising the ability to be flexible, andthis inertia extends also to governance systems. In contrast, Mas-dar benefits from the lack of such processes and infrastructures,allowing for more radical interventions to be implemented. Bothhave aspirations towards resilience in is broadest sense [74], i.e. toeffectively accommodate future change without serious disrup-tion, and sustainability.
The ability of a country or a city to finance renewable energytechnologies directly influences their development and im-plementation. With regard to Masdar and Birmingham, renew-ables are expensive when compared with the current (directeconomic) cost of oil and natural gas (the primary sources of en-ergy in the UK and UAE), and thus market-led economics tend tooverlook them. In the UK, the renewable energy market is gainingstrength, helped in part by policy and governance initiatives suchas feed-in tariffs for solar PV panels and planning law exemptionsfor some wind farm developments. However, there are severebudgetary restraints both at the National and Local Government
level, which limits the ambitions of many City Councils to advancethis renewable energy agenda. In Masdar City, finance, essentialfor the concept initially to be realised, has been far less of a con-cern, being derived from oil revenues, although financial limita-tions emerged with the 2007/2008 economic downturn. Masdarhas, however, demonstrated a vital need to be cost conscious sinceeconomic viability is a core component of sustainability. Energyhas been cheap and subsidised by the Abu Dhabi Government, butsteps are underway to link price with usage to make citizens moreaware of their energy use. Unlocking finance to support renewableenergy is crucial if a city is to reduce its carbon emissions, thoughfor projects as ambitious as Masdar City's the costs are substantialand beyond the reach of most countries, let alone cities.
Birmingham can learn much from Masdar City's experienceswith new technologies, particularly with regard to solar panelresearch and returns on investment. Although the UK climate isnot as sunny as the UAE's, it is helpful to establish different panels’performance and energy efficiencies under temperatures rangingup to the high end of global extremes. The use of the wind towerin Masdar City for cooling at street-level is also of interest, parti-cularly as the global climate warms and energy demand for airconditioning in the UK rises. Wind towers could possibly be usedto combat the'heat island’ effect in UK cities, alongside attention tobuilding shading, street width and orientation, and the creation ofwind tunnels, which are proving effective and should be con-sidered for new developments through building layout strategies.These can be integrated into the green infrastructure strategiesthat Birmingham is adopting as part of its biophilic city status,which afford cooling as part of their ecosystem service provision –
a further addition to city resilience by naturally lowering the en-ergy demand. The converse lessons to Masdar are, of course, in-hibited by its desert location, and serve to emphasise that sus-tainability is determined locally – local conditions set local prio-rities. It equally points to the interconnectedness of city utilityservice provision in a wider sense that for citizens’ needs: forgreen infrastructure provision in Masdar there would be a con-siderable water requirement for irrigation, which in turn is highlyenergy intensive to provide.
Masdar City's buildings provide a helpful demonstration ofimproved building efficiency in terms of both water and powerconsumption. Other areas of particular relevance to Birminghaminclude Masdar City's work on smart grids, metres and appliances,as well as studies into an urban systems management platformacross the whole city, green transportation, day lighting systems,and a sustainable supply chain. Masdar City’s power grid operatorshave access to comprehensive data on how energy is being used atany given time from each property and can directly control highrates of consumption to balance supply with demand. Masdar hasthe benefit of installing smart grids prior to building occupancyand thus the consumer knows what to expect, whereas in existingcities, such as Birmingham, energy fittings need to be modified toconvert to a smart grid while users’ concerns around a change totheir system need to be addressed.
Masdar is a young city and has much to learn from an estab-lished city such as Birmingham that has seen many transitionsover centuries, amongst which are the pitfalls of an over-relianceon one industry and a lock-in to infrastructure systems that incurlarge costs to change – flexibility and means of adaptation shouldbe designed into systems from the start. Governance systemsshould also reflect this desire to be flexible and adaptable, andavoid lock-in, but equally must reflect and be sensitive to drivers ofchange, which have the potential to change the context in which aset of proposed city interventions will be implemented [75].Moreover Masdar City must reflect the aspirations of its citizens,as well as its city leaders and the businesses that drive its pros-perity, suggesting that new forms of governance should be trialled
S.E. Lee et al. / Renewable and Sustainable Energy Reviews 65 (2016) 1299–1309 1307
and introduced as the city grows – a further compelling argumentfor experimentation. It is important that Masdar City develops asolid economic base and develops its focus on research and de-velopment to fund further growth. Moreover to achieve long-termsuccess the city must be resilient in the face of changes in theglobal economy (e.g. decreasing revenue from the sale of oil andnatural gas, on which it has relied) and an increasingly aridclimate.
As Masdar City matures, its population will grow. It will movefrom ‘creating something from nothing’ to ‘changing what alreadyexists’. In other words, it will create a legacy of which it will haveto take increasing cognisance as it further develops. It will becomeever more important to consider the wellbeing of its citizens, e.g.ensure there are adequate environmentally-attractive open spacesand naturally vegetated areas for people to relax in and ‘consume’the ecological ecosystem services they have to offer (citizens’connection to nature supporting wellbeing), as well as includingthem in decision making about the city's future development.Referring again to the city's context (a desert setting), this balanceof green versus built environments for communal use will bedifferent from that potentially available in Birmingham, whichplaces potentially greater value on green spaces – this perspectiveis helpful when implementing designs for urban form, since sen-sitive engineering of urban spaces can bring about a healthy bal-ance of social and environmental benefits from different ‘gather-ing’ spaces in cities.
Processes and infrastructures will increasingly benefit from in-tegration to increase security of supply as well as efficiencies. Forexample, Birmingham's research into hydrogen fuel cells for carscould prove applicable in Masdar as existing desalination plantscould be used to extract hydrogen. Other operational schemes usedby Birmingham City Council, such as the reuse of waste, energyfromwaste and district heating (the same principles apply to districtcooling), could also be relevant to Masdar, as well as methane gasextraction from sewage works and research on biofuels and cryo-genic energy storage. New technologies, processes and the linkagesbetween them must be carefully considered to prevent ‘lock-in’, i.e.their introduction should be designed with flexibility and adapt-ability in mind. This is a combination not only of the choices made(e.g. to prioritise solar power), but also of the sequencing of thosechoices (e.g. roof pitches must be set to maximise the effectivenessof roof-mounted solar panels, as must the orientation of building,otherwise the benefits of the panels will be reduced) [75]. This takesforesight and directed action, starting at the conceptual designphase, and should feature in the business case so that the invest-ment opportunity is transparent. Yet equally the business case mustembrace all of the potential benefits across the three pillars ofsustainability (economic, social and environmental), and these po-tential benefits should be tested in the current context – taking eachin turn, are the necessary conditions in place for that benefit to bedelivered – and in the far future. The Designing Resilient Citiesmethodology is helpful in this [66].
However there is another aspect to the design of resilient citesthat is embedded in ‘future-proofing’ design methods, such as[66]: the use of future scenarios. Crucially this provides a means ofexperimentation free from the concern that a City Council cannotbe allowed to fail when making investments – a concern that isperhaps felt more keenly in Birmingham with its budget con-straints and pressure on service delivery. There are several farfuture scenario techniques that can be employed (e.g. [76,77]) andall start by removing the users from the constraints of the currentcontext – they ask ‘what if? ’ questions. Sitting alongside the futurevisioning process, there needs to be a methodology that estab-lishes the current performance of a city, across all three pillars ofsustainability, and then allows future performance to be estab-lished with an intervention in place [78]. By testing a series of
potential interventions, and determining their likely efficacy inextreme-yet-plausible futures [66] and against aspirational futures[78] – i.e. a process of thought experiments – investments in in-novative solutions to the problems facing cities can be made withfar greater confidence of success.
5. Conclusion
Two very different cities have been compared. Masdar, in termsof size, is not currently a city, yet has aspirations to develop intoone. Whether this succeeds or not is dependent upon its attrac-tiveness for inward migration as a place to live, work and play andits ability to generate its own revenue for future growth. Moreover,as it develops the legacy, and ‘lock-in’, of today's decisions willecho the constraints and opportunities currently experienced byBirmingham. The development of Masdar has provided inspirationand ideas to neighbouring Gulf States, and raised on their politicalagenda the issues of renewable energy and sustainability by pro-viding a demonstration of what is possible.
Both Masdar and Birmingham have aspirations to be low-car-bon cities. Masdar has had a good start given its size and buildingrestrictions, which only allow low-rise energy-efficient buildings,and the introduction of smart metering to provide comprehensiveperformance data. Data from such buildings can inform both op-erational practicalities, including behavioural changes, and wherepotential savings can be made, and these lessons can translate intomore energy-efficient new and retrofitted UK buildings. Further-more, with the aridity of the UAE climate, it is instructive to seehow this climatic challenge is addressed since one potential futureUK climate context (longer periods of drought) is now demandingserious consideration. Masdar can learn from the mistakes of Bir-mingham such as the infrastructure lock-in that accompanied aphilosophy of development based on ‘domination of the car’ in the1960–70s, and, though this lesson appears to have been accountedfor in their focus on public transport and battery-powered ve-hicles, it must be recognised that whatever approach is adoptedwill have the potential to ‘lock in’ operations and behavioursaround physical infrastructures – today's decisions are tomorrow'slegacy. Masdar can also benefit from Birmingham's experiences ofcreating change in an existing ‘locked-in, legacy’ context, by de-signing to accommodate future change – adaptability, flexibilityand nimbleness become the designers’ watchwords.
Looking across all the lessons to be learnt by Birmingham andMasdar in relation to energy, five core issues emerge:
1. Innovation and experimentation. Innovation requires talentedpeople and, often but not always, money (constrained funds canbe a driver of innovation). Experimentation, however, tradi-tionally requires talent and money. Masdar City benefits fromattracting talented citizens, students and businesses and fromaccess to generous national funding. This has allowed it toblossom as an international demonstrator and ‘city lab’, andthus attract more talent and more money [27]. Birmingham,suffering from the combined effects of budget cuts and theglobal financial crisis, has limited means to take risks andexperiment with alternative energy paradigms, thus impedingits practical progress. Other drivers, such as a legal requirementto lower carbon emissions, therefore underpin radical change,with innovation providing the necessary enabler. Experimenta-tion here is best achieved via future scenario modelling andthought experiments.
2. Lock-in. Energy supply and demand form a complex system,sitting in an even more complex system-of-systems whenlinked with other resources such as water and food, and allother city systems with which it must effectively synthesise.
S.E. Lee et al. / Renewable and Sustainable Energy Reviews 65 (2016) 1299–13091308
Holistic understanding of these systems is essential if flexibilityand adaptability is to be designed in and lock-in is to be avoided[75]. In particular, existing infrastructures and forced compli-ance with existing processes and procedures (e.g. via regula-tion) can lead to undesirable lock-in. Masdar City benefits fromstarting from a blank slate, whereas Birmingham must negotiatea plethora of existing processes, procedures and (an ageing)infrastructure. However, with this comes experience and under-standing of the long-term risks. If Masdar City is unable to learnfrom what has gone before, it risks creating an unsustainablelegacy for future generations, particularly given that infrastruc-ture systems are both expensive to create and typically havelong design lives.
3. Balance. The economic, societal and environmental aspects ofsustainability are all critical. Unduly emphasising one can leadto negative consequences for the others. Despite Masdar City'ssustainability focus, with the additional cultural aspect includedin Estidama (Arabic for Sustainability) [8], there is evidence it isconcentrating upon economic goals at the particular expense ofsocial cohesion [27]. During the 20th Century Birmingham didthe same, focussing on the car industry. It has since moved to alargely service industry and has recently obtained biophilic citystatus [33], and though many social issues remain unresolved[79,80], new methodologies provide a means of achieving thisbalance [76,78].
4. Resilience. Despite increasingly-sophisticated predictions of thefuture, none are reliable and shocks such as extreme weatherdue to climate change and political instability increasinglyerode their efficacy. The use of future scenarios [66,76] shouldtherefore be adopted to explore likely vulnerabilities of strate-gies and new developments. Masdar City and Birmingham mayhave different experiences of shocks and slower yet fundamen-tal change, but to ensure their longevity both must make effortsto future-proof the decisions they take today so that theycontinue to deliver what was intended into the future [81].
5. Governance. It is encouraging that both cities have visionstatements [8,32] that include aims to be as sustainable andresource secure as possible, and that they are both intent onproviding demonstrations of how this might be achieved. To besuccessful, these aims must permeate all city policies and sit atthe heart of the city's vision [82]. Masdar City has been createdaround these aims, but as it grows the aims risk becomingdiluted amongst the melee of city life. In contrast, Birminghamhas to incorporate these aims into its existing governancestructures, policies and processes. To do this it must influenceand harness a variety of drivers for change including the will ofits politicians, citizens and businesses [83].
In the end the responsibilities lie with the cities of the world tolearn from each other. This will lead to a greater understanding ofwhat is required, and what can be appropriately applied – in termsof technology, investment, expected ‘user behaviours’, procedures,processes and governance – if it is to be sustainable. This will beparticularly important as the global climate changes and citiesneed to ensure that they are resilient, robust and sustainable in theface of, perhaps radical, change if they are to survive. What thispaper has demonstrated is that lessons from very different con-texts can be extremely valuable, spanning the temporal dimen-sions of sustainability and resilience (e.g. Masdar City's con-sideration now of the problems of future ‘lock-in’, and Birmin-gham's reaction to radical climate change).
Authors’ Contribution
SEL and PB conceived of the analysis. SEL led the analysis andassembled the data for the paper. PB, JML and CDFR contributed to
the structure of the analysis and its interpretation in the context offuture, liveable, sustainable and resilient cities. All authors co-wrote the paper.
Acknowledgements
The authors wish to thank the UK Engineering and PhysicalSciences Research Council (EPSRC) for their support under grantnumbers EP/J017698/1 and EP/F007426/1. We also wish to thankSteve Severance, Head of Programme Management and Strategy atMasdar City, for providing information on recent building devel-opments in Masdar. Underpinning data are available from varioussources as referenced. Detailed calculations are available from thelead author.
References
[1] Popp A, Wilson JF. The emergence and development of industrial districts inindustrialising England. In: Becattini G, Bellandi M, De Propris L, editors.Handbook of industrial districts. Edward Elgar Publishing; 2009.
[2] BP plc. Statistical review of world energy 2014; June 2014. ⟨http://tinyurl.com/qavj9b8⟩.
[3] IEA. The outlook to 2050 and the role of energy technology; 2014. ⟨https://www.iea.org/textbase/npsum/etp.pdf⟩.
[4] UK Government. Climate Change Act; 2008. ⟨http://www.legislation.gov.uk/ukpga/2008/27/Section/1⟩.
[5] Kyoto_Protocol UNFCCC; 1997. ⟨http://unfccc.int/kyoto_protocol/items/2830.php⟩.
[6] BCC. Birmingham carbon plan analysis. An illustrative look at future emissionsin Birmingham. 2013. ⟨http://www.birmingham.gov.uk/sustainability⟩.
[7] UK DECC. Renewable energy roadmap; 2013. ⟨http://tinyurl.com/pm688sj⟩.[8] Abu Dhabi Urban Planning Council, Abu Dhabi council for economic devel-
opment. Abu Dhabi economic vision 2030; 2014. ⟨http://www.upc.gov.ae/abu-dhabi-2030.aspx?lang¼en-US⟩.
[9] Brundtland GH. Report of the world commission on environment and devel-opment: our common future. Oxford, UK: Oxford university Press; 1987.http://www.un-documents.net/our-common-future.pdf.
[10] Masdar. Masdar Factsheet. Fast Facts; 2013. ⟨http://tinyurl.com/qea3yog⟩.[11] Masdar Institute/IRENA Renewable Energy Prospects: United Arab Emirates
RaI, Abu Dhabi. ⟨www.irena.org/remap⟩. Renewable energy prospects: UnitedArab Emirates. REmap 2030 analysis IRENA, Abu Dhabi; 2015. ⟨http://tinyurl.com/gmeqv4k⟩.
[12] Wolman A. The metabolism of cities. Sci Am 1965;213:179–90.[13] Barles S. Urban metabolism of paris and its region. J Indl Ecol 2009:13.[14] Kennedy C, Cuddihy J, Engele-Yan J. The changing metabolism of cities. J Ind
Ecol 2007;11(2):43–59.[15] Broto VC, Allen A, Rapoport E. Interdisciplinary perspectives on urban meta-
bolism. J Ind Ecol 2012;16:851–61.[16] D.V.L. Hunt, J.M. Leach, S.E. Lee, C.J. Bouch, P.A. Braithwaite, C.D.F. Rogers.
Urban metabolism assessment of liveable future UK cities. In: Proceedings ofthe 4th world sustainability forum; 2014. ⟨http://www.sciforum.net/presentation/1021⟩.
[17] Zhang Y. Urban metabolism: a review of research methodologies. EnvironPollut 2013;178:463–73.
[18] Kennedy C, Pincetl S, Bunje P. The study of urban metabolism and its appli-cations to urban planning and design. Environ Pollut 2011;159:1965–73.
[19] Brunner PH. Beyond materials flow analysis. J Ind Ecol 2002;6:8–10.[20] Masdar. Sustainability Report 2015; 2015. ⟨http://www.masdar.ae/assets/
downloads/content/669/masdar_sustainability_report_2015.pdf⟩.[21] The Guardian Newspaper. Masdar's zero-carbon dream could become world's
first green ghost town 2016. ⟨http://www.theguardian.com/environment/2016/feb/16/masdars-zero-carbon-dream-could-become-worlds-first-green-ghost-town⟩.
[22] Design Build Network. Masdar City, Abu Dhabi, United Arab Emirates; 2015.⟨http://www.designbuild-network.com/projects/masdar-city/⟩.
[23] Masdar. About Masdar City; 2015. ⟨http://tinyurl.com/qcj9bnq⟩.[24] Abu Dhabi Department for Transport. Surface transport master plan. A vision
for connecting Abu Dhabi; 2009. ⟨http://tinyurl.com/kl2cc65⟩.[25] Masdar. Powering Innovation. Sustainability Report 2014; 2015. ⟨http://tinyurl.
com/na5b56z⟩.[26] Leech, N. Masdar City role model for a sustainable future 2013. ⟨http://tinyurl.
com/hvhj8ng⟩.[27] Cugurullo F. How to build a sandcastle: an analysis of the genesis and de-
velopment of Masdar City. J Urban Technol 2013;20:23–37.[28] ONS. Population estimates for England and Wales, Mid-2011 (2011 Census-
based); 2012. ⟨http://tinyurl.com/9afw4vx⟩.[29] ONS. Labour market profile – Birmingham; 2013. ⟨http://tinyurl.com/
kcpmw5q⟩.
S.E. Lee et al. / Renewable and Sustainable Energy Reviews 65 (2016) 1299–1309 1309
[30] ONS. Regional profiles – population and migration – West Midlands, March2013. 2013. ⟨http://tinyurl.com/pu7xsbf⟩.
[31] Canal and River Trust. Birmingham canal navigations; 2015. ⟨https://canalrivertrust.org.uk/canals-and-rivers/birmingham-canal-navigations⟩.
[32] BCC. Birmingham's Green Commission. Building a green city. Birmingham;2013. ⟨http://tinyurl.com/jgzzl3m⟩.
[33] Morris S. Birmingham joins San Francisco and Oslo in global green citiesclub. The Guardian [Online]; 3rd April 2014. ⟨http://tinyurl.com/kdo7xsw⟩.
[34] Gelling M. Some notes on the place-names of Birmingham and the sur-rounding district. Trans Proc Birm Archaeol Soc 1956;72:14–7.
[35] Jones PM. Industrial enlightenment: science, technology and culture in Bir-mingham and the West Midlands, 1760–1820. Manchester University Press;2009. p. 1760–820.
[36] Hopkins E. Birmingham: the first manufacturing town in the world, 1760–1840.London: Weidenfeld & Nicolson; 1989.
[37] Sharratt B. Men and motors of the Austin: the inside story of a century of carmaking at longbridge. Sparkford: Haynes Publishing; 2000.
[38] Globalization and World Cities Research Network. The world according toGaWC 2012; 2014. ⟨http://www.lboro.ac.uk/gawc/world2012t.html⟩.
[39] Beaverstock JV, Smith RG, Taylor PJ. A roster of world cities. Cities1999;16:445–58.
[40] PopulationData.net. United Arab Emirates; 2014. ⟨http://tinyurl.com/ospdnle⟩.[41] ONS. Population estimates for UK, England and Wales, Scotland and Northern
Ireland, Mid-2011 and Mid-2012; 2014. ⟨http://tinyurl.com/pxmr2qu⟩.[42] SCAD. Statistical yearbook of Abu Dhabi 2014; 2014. ⟨http://tinyurl.com/
pyf2y2w⟩.[43] SCAD. Statistical yearbook of Abu Dhabi 2013; 2013. ⟨http://tinyurl.com/
nlghzwl⟩.[44] United-Arab-Emirates World-nuclear.org.; 2013. ⟨http://www.world-nuclear.
org/info/Country-Profiles/Countries-T-Z/United-Arab-Emirates/⟩.[45] Todorova, V. Reducing energy footprint of water desalination is priority, say
experts; 2015. The National. Abu Dhabi. ⟨http://tinyurl.com/omyxlkm⟩.[46] SCAD. Annual environment survey main results. Abu Dhabi Emirate 2010–
2011 تاءاصحإ . SCAD; 2013.[47] U.N. Statistics Division. International standard industrial classification of all
economic activities, Rev.4; 2015. ⟨http://tinyurl.com/3aeacph⟩.[48] Enerdata. Global energy statistical yearbook 2014; 2014. ⟨http://yearbook.en
erdata.net/⟩.[49] Adamovic M, Cost of living comparison between Birmingham and Abu Dhabi.
Numbeo; 2015. ⟨http://tinyurl.com/jv3nzy6⟩.[50] DECC. Sub-national total final energy consumption in the United Kingdom
2005–2012; 2014. ⟨http://tinyurl.com/cl2j6cf⟩.[51] Regulation and Supervision Bureau. New water and electricity tariffs struc-
ture; 2015. ⟨http://tinyurl.com/nbna5ef⟩.[52] DECC. Average variable unit costs and fixed costs for electricity for UK regions;
2015.[53] Agora Energiewende. Current and future cost of photovoltaics. Long-term
scenarios for market development system prices and LCOE of utility-scale PVsystems; 2011. ⟨http://www.agora-energiewende.de/en/topics/-agothem-/Produkt/produkt/88/CurrentþandþFutureþCostþofþPhotovoltaics/⟩.
[54] Boxwell A, Solar Irradiance Calculator; 2015. ⟨http://www.efficientenergysaving.co.uk/solar-irradiance-calculator.html⟩.
[55] Day AR, Jones PG, Maidment GG. Forecasting future cooling demand in Lon-don. Energy Build 2009:942–8.
[56] Masdar. Shams 1; 2015. ⟨http://www.masdar.ae/en/energy/detail/shams-1⟩.[57] Masdar. Masdar & IRENA Global HQ; 2015. ⟨http://tinyurl.com/nwk6gvu⟩.[58] Think GeoEnergy. Masdar City geothermal wells with 95 centigrade hot water;
2010. ⟨http://thinkgeoenergy.com/archives/6550⟩.[59] Kingsley P. Masdar: the shifting goalposts of Abu Dhabi’s ambitious eco-city.
Wiredcouk 2013. http://www.wired.co.uk/magazine/archive/2013/12/features/reality-hits-masdar.
[60] DECC. United Kingdom housing energy fact file; 2013. ⟨http://tinyurl.com/o4fupjp⟩.
[61] DECC. Sub-national road transport fuel consumption 2005–2012; 2013.⟨http://tinyurl.com/q9h5ejq⟩.
[62] Masdar Institute. Campus and community. Residential; 2016. ⟨https://www.masdar.ac.ae/campus-community/the-campus/residential⟩.
[63] Mueller K, Sgouridis SP. Simulation-based analysis of personal rapid transitsystems: service and energy performance assessment of the Masdar City PRTcase. J Adv Trans 2011;45:252–70.
[64] ONS. Area Based Analysis, Commuting Patterns from the Annual PopulationSurvey, Local Authorities, 2010 and 2011; 2013. ⟨http://tinyurl.com/lqypx3u⟩.
[65] DECC. DUKES 2014. Chapter 6. Renewable sources of energy, 2013; 2014.⟨http://tinyurl.com/mf5oo5f⟩.
[66] DECC. Renewable energy statistics data sources and methodologies; 2013.⟨http://tinyurl.com/od46vqc⟩.
[67] Veolia Environmental Services. Annual performance report for VESB TyseleyERF. Permit No. WP3239SJ Year 2012; 2013. ⟨http://tinyurl.com/pvpajgg⟩.
[68] Cofely GDF Suez. Birmingham District Energy Delivering Low Carbon Energy;2014. ⟨https://brumcitycentre.files.wordpress.com/2014/11/birmingham-de-brochure-a4-single-page-for-page.pdf⟩.
[69] DECC. Renewable electricity in Scotland, Wales, Northern Ireland and the re-gions of England in 2013; 2014. ⟨http://tinyurl.com/ogag58v⟩.
[70] Birmingham Airport. Airports commission. Birmingham airport submission;2013. ⟨http://tinyurl.com/qbu4re4⟩.
[71] BBC. First UK homes heated with 'poo power' gas from sewage; 2014. ⟨http://www.bbc.co.uk/news/uk-england-29443622⟩.
[72] Post. Birmingham City council green scheme for Birmingham homes scrapped2015. ⟨http://www.birminghampost.co.uk/news/regional-affairs/city-council-green-scheme-birmingham-10060185⟩.
[73] Birmingham Energy Savers (BES). Birmingham energy savers. Birminghamsustainability forum: BCC; 2013. ⟨http://www.birmingham.gov.uk/sustainability/forum⟩.
[74] Rogers CDF, Bouch C, Williams S, Barber ARG, Baker, Bryson CJ JR, ChapmanDN, Chapman L, Coaffee J, Jefferson I, Quinn AD. Resistance and resilience –
paradigms for critical local infrastructure. In: Proceedings of the institution ofcivil engineers (ICE): municipal engineer; 2012. vol. 165. pp. 73–83 ⟨http://www.icevirtuallibrary.com/doi/abs/10.1680/muen.11.00030⟩.
[75] Lombardi DR, Caserio M, Donovan R, Hale J, Hunt DVL, Weingaertner C, et al.Elucidating sustainability sequencing tensions and tradeoffs in developmentdecision-making. Environ Plan B 2011;38:1105–21.
[76] Rogers CDF. The value of foresight and scenarios in engineering liveable futurecities. In: Eames M, Dixon T, Hunt M, Lannon S, editors. Retrofitting cities fortomorrow's world. Chichester. West Sussex, UK: Wiley Blackwell; 2016.
[77] Government Office for Science. Foresighting for cities: a resource. foresightfuture of cities project; 2016. ⟨www.gov.uk/government/collections/future-of-cities⟩.
[78] Leach JM, Braithwaite PA, Lee SE, Bouch CJ, Hunt DVL, Rogers CDF. Measuringurban sustainability and liveability performance: the city analysis methodol-ogy (CAM). Int J Complex Appl Sci Technol 2016, http://www.inderscience.com/info/ingeneral/forthcoming.php?jcode=ijcast, in press.
[79] Bingham J, Birmingham is 'national disgrace’ says Ofsted chief inspector. TheTelegraph [Online]; 15th October 2013. ⟨http://tinyurl.com/n22aegy⟩.
[80] Kerslake B, The way forward: an independent review of the governance andorganisational capabilities of Birmingham City Council; 2014. ⟨http://tinyurl.com/pjlf5fz⟩.
[81] Rogers CDF, Lombardi DR, Leach JM, Cooper RF. The urban futures metho-dology applied to urban regeneration. In: Proceedings of ICE engineeringsustainability; 2012. vol. 165. pp. 5–20 ⟨http://www.icevirtuallibrary.com/doi/abs/10.1680/ensu.2012.165.1.5?journalCode=jensu⟩.
[82] Leach JM, Lee SE, Braithwaite PA, Bouch CJ, Grayson N, Rogers CDF, Whatmakes a city liveable? Implications for next-generation infrastructure services.In: P. Campbell, P. Perez, editors. Proceedings of the international symposiumof next generation infrastructure. October 1–4 2013. SMART InfrastructureFacility. University of Wollongong, Australia; 2013 ⟨http://ro.uow.edu.au/cgi/viewcontent.cgi?article=1030&context=isngi2013⟩.
[83] Rogers CDF, Shipley J, Blythe P, et al. Future urban living – a policy com-mission investigating the most appropriate means for accommodating chan-ging populations and their needs in the cities of the future Birmingham, UK:University Of Birmingham; 2014 http://www.birmingham.ac.uk/Documents/research/policycommission/future-urban-living/future-urban-living-policy-commission-report.pdf.
[84] Masdar. Exploring Masdar City. 2010. ⟨https://www.thefuturebuild.com/assets/images/uploads/static/1745/masdar_city_exploring1.pdf⟩.
[85] Enviromena Power Systems. 10 MW Solar Power Plant. Masdar City, AbuDhabi. Abu Dhabi, UAE2014. ⟨http://enviromena.com/2016/wp-content/uploads/2014/01/10MW-Masdar_PD_2013-WEB.pdf⟩.
[86] ONS. Labour Market Profile - Birmingham. Total population - Time series.2012. ⟨https://www.nomisweb.co.uk/reports/lmp/la/1946157186/subreports/pop_time_series/report.aspx⟩.


![Towards Sustainable Urban Development in Arid … › c223 › 69b2334efff254ebe...Figure 3: Masdar City, Abu Dhabi Emirate. Source [6] 3- Masdar City: an Overview Masdar City is located](https://img.pdfslide.us/doc/110x75/5f256363f44c30336f37978b/towards-sustainable-urban-development-in-arid-a-c223-a-69b2334efff254ebe.jpg)