Embed Size (px)
Citation preview
NASA/TM-2000-209584
A Comparison of
Center/TRACON Automation System and AirlineTime of Arrival Predictions
Karen R. Heere and Richard E. Zelenka
February 2000
https://ntrs.nasa.gov/search.jsp?R=20000033133 2018-09-01T15:38:10+00:00Z
The NASA STI Program Office... in Profile
Since its founding, NASA has been dedicated to the
advancement of aeronautics and space science. TheNASA Scientific and Technical Information (STI)
Program Office plays a key part in helping NASA
maintain this important role.
The NASA STI Program Office is operated by
Langley Research Center, the Lead Center forNASA's scientific and technical information. The
NASA STI Program Office provides access to the
NASA STI Database, the largest collection of
aeronautical and space science STI in the world.
The Program Office is also NASA's institutional
mechanism for disseminating the results of its
research and development activities. These results
are published by NASA in the NASA STI Report
Series, which includes the following report types:
• TECHNICAL PUBLICATION. Reports of
completed research or a major significant phase
of research that present the results of NASA
programs and include extensive data or theoreti-
cal analysis. Includes compilations of significantscientific and technical data and information
deemed to be of continuing reference value.
NASA's counterpart of peer-reviewed formal
professional papers but has less stringent
limitations on manuscript length and extent
of graphic presentations.
TECHNICAL MEMORANDUM. Scientific and
technical findings that are preliminary or of
specialized interest, e.g., quick release reports,
working papers, and bibliographies that containminimal annotation. Does not contain extensive
analysis.
• CONTRACTOR REPORT. Scientific and
technical findings by NASA-sponsored
contractors and grantees.
• CONFERENCE PUBLICATION. Collected
papers from scientific and technical confer-
ences, symposia, seminars, or other meetings
sponsored or cosponsored by NASA.
• SPECIAL PUBLICATION. Scientific, technical,
or historical information from NASA programs,
projects, and missions, often concerned with
subjects having substantial public interest.
• TECHNICAL TRANSLATION. English-
language translations of foreign scientific and
technical material pertinent to NASA's mission.
Specialized services that complement the STI
Program Office's diverse offerings include creating
custom thesauri, building customized databases,
organizing and publishing research results.., even
providing videos.
For more information about the NASA STI
Program Office, see the following:
• Access the NASA STI Program Home Page at
http ://www.sti.nasa. gov
° E-mail your question via the Internet to
• Fax your question to the NASA Access HelpDesk at (301) 621-0134
° Telephone the NASA Access Help Desk at
(301) 621-0390
Write to:
NASA Access Help DeskNASA Center for AeroSpace Information
7121 Standard Drive
Hanover, MD 21076-1320
NASA/TM-2000-209584
A Comparison of
Center/TRACON Automation System and AirlineTime of Arrival Predictions
Karen R. Heere
Raytheon, Moffett Field, California
Richard E. Zelenka
Ames Research Center, Moffett Field, California
National Aeronautics and
Space Administration
Ames Research Center
Moffett Field, California 94035-1000
February 2000
AcknowledgmentsThe authors would like to thank Rose Hsu of American Airlines for providing AAL arrival time data and
Michelle Foster of the Federal Aviation Administration, Ft. Worth Air Route Traffic Control Center,
for providing information on airport traffic conditions.
NASA Center for AeroSpace In formation7121 Standard Drive
Hanover, MD 21076-1320
(301) 621-0390
Available from:
National Technical Information Service
5285 Port Royal Road
Springfield, VA 22161(703) 487-4650

Abstract
Benefits from information sharing between an air traffic service provider and
a major air carrier are evaluated. Aircraft arrival time schedules generated by the
NASMFAA Center/TRACON Automation System (CTAS) were provided to the
American Airlines System Operations Control Center in Fort Worth, Texas, during
afield trial of a specialized CTAS display. A statistical analysis indicates that the
CTAS schedules, based on aircraft trajectories predicted from real-time radar and
weather data, are substantially more accurate than the traditional airline arrival
time estimates, constructed from flight plans and en route crew updates. The
improvement offered by CTAS is especially advantageous during periods of heavy
traffic and substantial terminal area delay, allowing the airline to avoid large pre-
dictive errors with serious impact on the efficiency and profitability of flight oper-ations.
1. Introduction
Research to investigate the benefits of collabora-
tion in arrival flow management between air traffic
control service providers and major air carriers is
ongoing at the NASA Ames Research Center, under
the sponsorship of the Collaborative Arrival Planning
(CAP) project. A discussion of the specialized hard-
ware and software developed for service provider-car-
rier communication and preliminary results showing
the benefits of data exchange have been reported by
Zelenka et al. (ref. 1). This Technical Memorandum
describes the portion of the CAP effort devoted to
improving predicted time of arrival accuracy. Specifi-
cally, the report discusses the sharing of arrival time
schedules generated by a set of NASA/FAA airspace
management software tools known as the Cen-
ter/TRACON Automation System (CTAS). In an
exploratory project with American Airlines (AAL),
arrival times predicted by CTAS, using aircraft trajec-
tory modeling and dynamic airspace constraints, were
provided to the airline as an alternative to its tradi-
tional forecasts based on flight plans and en route crew
updates. It is shown that the CTAS predictions have
greater accuracy and are potentially valuable for
improving the efficiency of airline flight operations.
coming two decades: revenue passenger miles world-
wide of 1.7 trillion in 1996 are anticipated to reach 3
trillion in 2006, then 4.5 trillion in 2016 (ref. 2). Exist-
ing demands on the air traffic system routinely exceed
the capacity of airports, leading to air traffic imposed
ground and airborne delays of aircraft, estimated to
cost domestic airlines as much as $3.5 billion per year
(ref. 3). In the increasingly competitive airline indus-
try, with its market-driven pricing and very thin profitmargins, such economic operating penalties are mag-nified.
Of paramount importance in the efficient opera-
tion and profitability of an airline is adherence to itsflight schedule. For large air carriers operating in "hub
and spoke" networks, the maintenance of the carrier's
flight schedule at its hubs drives the business effi-
ciency of the entire flight network, including outlying
spokes. In a hub and spoke network, many aircraftarrive at a central hub airport in rapid succession and
depart to other spoke cities with very little time at the
airport gate. This allows an airline to offer service to
more cities with fewer airplanes. The control of the
hub arriving blocks or "banks" of aircraft, and their
subsequent turn-around in departure banks of aircraft,
is called "bank management."
A need for closer collaboration between airlines
and air traffic control facilities has arisen from several
factors related to the increasing complexity of airline
operations. These include: increased air traffic volumeand aircraft delays, critical timing requirements in hub
and spoke operations, and increased air carrier eco-
nomic pressures. Domestic and world-wide air traffic
is expected to grow to unprecedented levels over the
The American Airlines operational control center
located in Ft. Worth, TX, called System Operations
Control (SOC), manages over 650 jet aircraft through
four major hubs, with over 2200 flight segments daily.
Their largest hub, at Dallas Ft. Worth (DFW) airport,
operates 58 gates and 9 major arrival/departure banks
every day. The largest and most complex bank has
over 60 aircraft arriving within 75 min, then 70 air-

craftdepartingin thefollowing90min.At maximumcapacityduringthisbank,AAL connectsover6000passengers,9000bagsand30tonsofcargo.
Reliableandefficient bank management is critical
to the success of a hub and spoke airline. Closely-
spaced arrivals and departures in hub and spoke net-
works are very sensitive to timing miscues, such as
those caused by bad weather or airport congestion.
Arrival timing miscues lead to missed passenger and
crew connections, inefficient ground operations
caused by incorrect gate assignments, and occasional
aircraft diversions to alternate airports. These cause
passenger inconvenience, flight delays and lost airlinerevenue.
The data generated and provided by the CTAS air
traffic management tool are directly relevant to an air
carrier's hub operations and associated bank manage-
ment. The system's highly accurate time of arrival
predictions, particularly during periods of airborne
delay and holding, can assist an airline with several
aspects of fleet operations. These include whether to
hold spoke flights for a late incoming flight (the "hold-
go" decision) and whether a flight should be diverted
to an alternate airport or continue in airborne holding.Typically, departing spoke flights are held if an
inbound feeder flight is expected to be no later than 15min from its scheduled arrival time, but released if the
feeder flight is over 15 rain late. Such a holdingthreshold balances the need to maintain the fleet-wide
scheduling against the desire to maintain individual
spoke flights. The time separation between the last
arrival in a bank and the first departure is critical tohub operations. Other factors that make specific air-craft arrival times critical include crew time limita-
tions, gate availability, passenger connections and
ground manpower. Late gate changes cause many
problems due to special procedures, equipment needs
and baggage processing demands. The efficiency of
all such bank management issues is directly tied to the
accuracy of aircraft time of arrival predictions.
Under the CAP project, real-time arrival schedul-
ing and airspace management data supplied by CTASsoftware to en route controllers at the Ft. Worth Air
Route Traffic Control Center (ARTCC) are being
shared with airline operations personnel at the AAL
SOC. The data exchange utilizes a specialized "CAP
Display System" which captures the arrival schedule
for AAL flights constructed by CTAS and used by the
ARTCC controllers. Analysis (ref. 1) has shown that
CTAS information sharing leads to improved pre-
dieted time of arrival accuracy, improved strategic
fleet arrival planning and improved divert/no divert
decisions when faced with uncertain airborne delays.
No adverse impact on FAA air traffic control opera-
tions was found to have resulted from this experimen-
tal data interchange.
A brief technical background covering basic air
traffic control concepts and the arrival time forecast-
ing methods employed by AAL and CTAS is includedas section 2 of this document. Sections 3 and 4
describe numerical and statistical methods for assess-
ing arrival time accuracy and inferences from a com-
parison of CTAS and airline arrival time predictions.
Some concluding remarks appear in section 5.
2. Background
2.1 Air Traffic Control Concepts
United States airspace is divided into contiguous
regions known as "Air Route Traffic Control Centers"
(ARTCCs). These regions, popularly called "Centers,"
provide air traffic control services to flights which are
en route to, but still outside of, the immediate vicinity
of a major airport. In figure 1, the darkly-shaded area
shown on the U.S. map, and in enlargement, is the Ft.Worth ARTCC. This Center, with an east-west dimen-
sion of about 400 miles, is further divided into a num-
ber of subregions known as "sectors." One or more air
traffic controllers directs flights traversing a sector toassure safe and efficient traffic flow.
The airspace within about 40 miles of a major air-
port is known as the "TRACON," an acronym for Ter-
minal Radar Approach Control. The map in figure 1shows the Dallas Ft. Worth (DFW) TRACON as a
lightly-shaded region within the Ft. Worth ARTCC.TRACON air traffic controllers issue final instructions
and clearances for arriving and departing aircraft. Airtraffic entering the DFW TRACON from the Center is
funneled through four reference points referred to as
"cornerposts." A typical traffic pattern is illustrated in
figure 2(a) by a set of aircraft "tracks" representing all
AAL flights landing at DFW on April 22, 1998,between 4:30 PM and 6:30 PM CDT. These tracks are
two-dimensional (X,Y) projections of three-dimen-
2
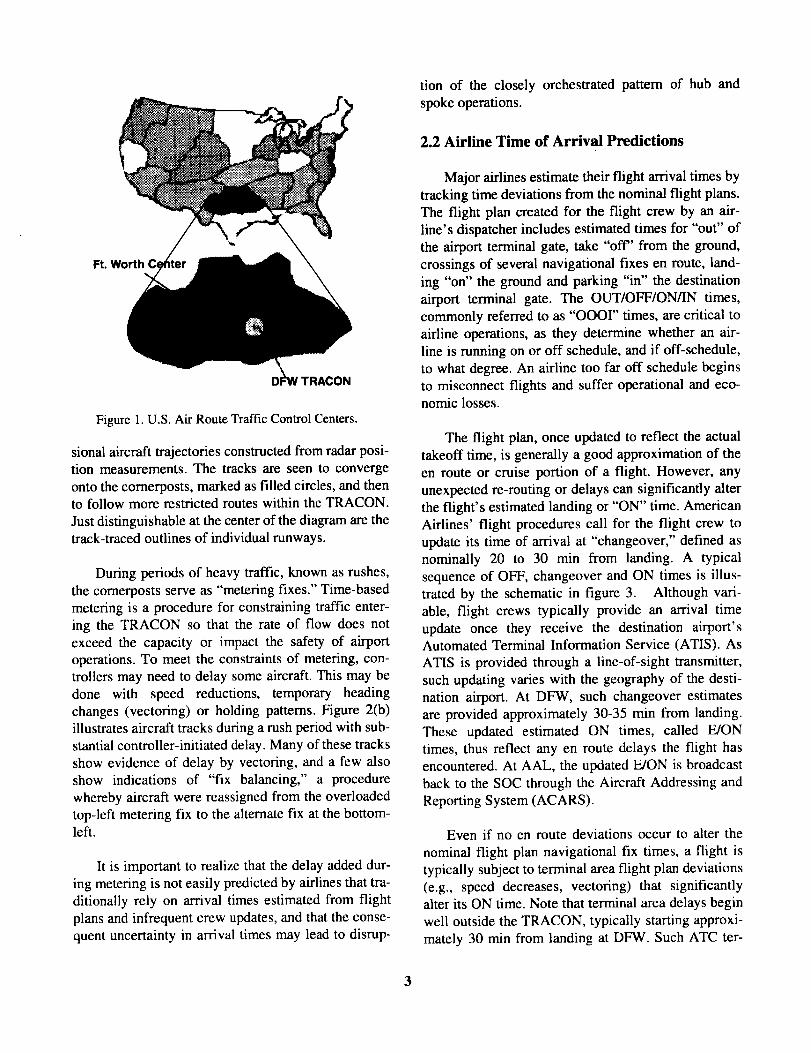
[ TRACON
Figure 1. U.S. Air Route Traffic Control Centers.
sional aircraft trajectories constructed from radar posi-
tion measurements. The tracks are seen to converge
onto the cornerposts, marked as filled circles, and thento follow more restricted routes within the TRACON.
Just distinguishable at the center of the diagram are thetrack-traced outlines of individual runways.
During periods of heavy traffic, known as rushes,
the cornerposts serve as "metering fixes." Time-based
metering is a procedure for constraining traffic enter-
ing the TRACON so that the rate of flow does not
exceed the capacity or impact the safety of airport
operations. To meet the constraints of metering, con-trollers may need to delay some aircraft. This may be
done with speed reductions, temporary heading
changes (vectoring) or holding patterns. Figure 2(b)illustrates aircraft tracks during a rush period with sub-
stantial controller-initiated delay. Many of these tracks
show evidence of delay by vectoring, and a few also
show indications of "fix balancing," a procedure
whereby aircraft were reassigned from the overloaded
top-left metering fix to the alternate fix at the bottom-left.
It is important to realize that the delay added dur-
ing metering is not easily predicted by airlines that tra-
ditionally rely on arrival times estimated from flight
plans and infrequent crew updates, and that the conse-
quent uncertainty in arrival times may lead to disrup-
tion of the closely orchestrated pattern of hub and
spoke operations.
2.2 Airline Time of Arrival Predictions
Major airlines estimate their flight arrival times by
tracking time deviations from the nominal flight plans.
The flight plan created for the flight crew by an air-
line's dispatcher includes estimated times for "out" of
the airport terminal gate, take "off" from the ground,
crossings of several navigational fixes en route, land-
ing "on" the ground and parking "in" the destination
airport terminal gate. The OUT/OFF/ON/IN times,
commonly referred to as "ooor' times, are critical to
airline operations, as they determine whether an air-
line is running on or off schedule, and if off-schedule,
to what degree. An airline too far off schedule begins
to misconnect flights and suffer operational and eco-nomic losses.
The flight plan, once updated to reflect the actual
takeoff time, is generally a good approximation of the
en route or cruise portion of a flight. However, any
unexpected re-routing or delays can significantly alter
the flight's estimated landing or "ON" time. American
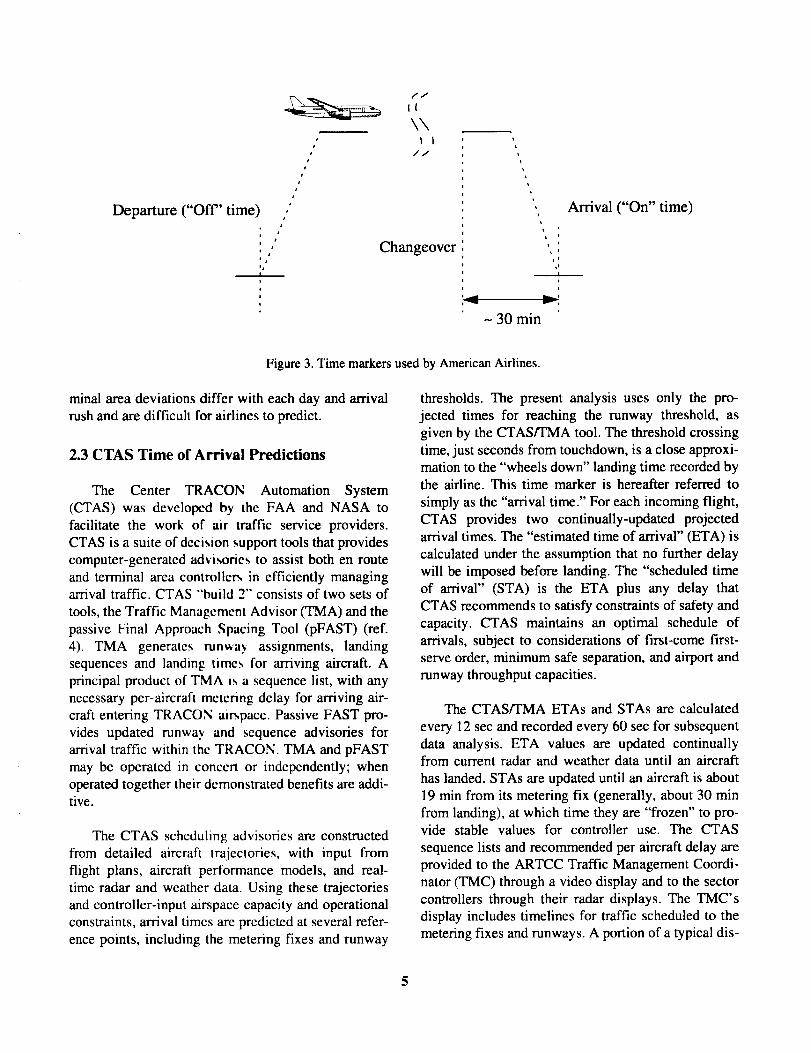
Airlines' flight procedures call for the flight crew to
update its time of arrival at "changeover," defined as
nominally 20 to 30 min from landing. A typical
sequence of OFF, changeover and ON times is illus-
trated by the schematic in figure 3. Although vari-
able, flight crews typically provide an arrival time
update once they receive the destination airport'sAutomated Terminal Information Service (ATIS). As
ATIS is provided through a line-of-sight transmitter,
such updating varies with the geography of the desti-
nation airport. At DFW, such changeover estimates
are provided approximately 30-35 min from landing.
These updated estimated ON times, called E/ONtimes, thus reflect any en route delays the flight has
encountered. At AAL, the updated E/ON is broadcast
back to the SOC through the Aircraft Addressing and
Reporting System (ACARS).
Even if no en route deviations occur to alter the
nominal flight plan navigational fix times, a flight is
typically subject to terminal area flight plan deviations
(e.g., speed decreases, vectoring) that significantlyalter its ON time. Note that terminal area delays begin
well outside the TRACON, typically starting approxi-
mately 30 min from landing at DFW. Such ATC ter-
3

.w
Ee'-
>-
O
8
8
8s--
/:
//
/
//
[
DFW Airport
• Cornerposts
200 400 600 800
X (n. mi.)
Figure 2(a). Aircraft tracks in Ft. Worth ARTCC and DFW TRACON during a typical rush period from 4:30 to6:30 PM on April 22, 1998.
t--v
>.
O
8¢O
8
85
/
• Cornerposts
200 400 600 800
x (n. mi,)
Figure 2(b). Aircraft tracks in Ft. Worth ARTCC and DFW TRACON during a heavy-traffic rush period from10:00 AM to noon on April 14, 1998.
/'f
\\• I I
a
, //
t
s
t
t
a
Departure ("Off" time) ,,'s
ti
r
' , Changeover, #
i i
' S
--&--
0
a
t
i
i
i
i
i
i
i '
i
it
- 30 min
Arrival ("On" time)
Figure 3. Time markers used by American Airlines.
minal area deviations differ with each day and arrival
rush and are difficult for airlines to predict.
2.3 CTAS Time of Arrival Predictions
The Center TRACON Automation System
(CTAS) was developed by the FAA and NASA to
facilitate the work of air traffic service providers.
CTAS is a suite of decision support tools that provides
computer-generated advb, ories to assist both en route
and terminal area controllers in efficiently managingarrival traffic. CTAS "'build 2" consists of two sets of
tools, the Traffic Management Advisor (TMA) and the
passive Final Approach Spacing Tool (pFAST) (ref.
4). TMA generates run_'ay assignments, landing
sequences and landing times for arriving aircraft. A
principal product of TMA is a sequence list, with any
necessary per-aircraft metering delay for arriving air-
craft entering TRACON airspace. Passive FAST pro-
vides updated runway and sequence advisories for
amval traffic within the TRACON. TMA and pFAST
may be operated in concert or independently; when
operated together their demonstrated benefits are addi-tive.
The CTAS scheduling advisories are constructed
from detailed aircraft trajectories, with input from
flight plans, aircraft performance models, and real-time radar and weather data. Using these trajectories
and controller-input airspace capacity and operational
constraints, arrival times are predicted at several refer-
ence points, including the metering fixes and runway
thresholds. The present analysis uses only the pro-
jected times for reaching the runway threshold, as
given by the CTAS/TMA tool. The threshold crossing
time, just seconds from touchdown, is a close approxi-
mation to the "wheels down" landing time recorded bythe airline. This time marker is hereafter referred to
simply as the "arrival time." For each incoming flight,
CTAS provides two continually-updated projectedarrival times. The "estimated time of arrival" (ETA) is
calculated under the assumption that no further delay
will be imposed before landing. The "scheduled time
of arrival" (STA) is the ETA plus any delay that
CTAS recommends to satisfy constraints of safety and
capacity. CTAS maintains an optimal schedule of
arrivals, subject to considerations of first-come first-serve order, minimum safe separation, and airport and
runway throughput capacities.
The CTAS/TMA ETAs and STAs are calculated
every 12 sec and recorded every 60 sec for subsequent
data analysis. ETA values are updated continuallyfrom current radar and weather data until an aircraft
has landed. STAs are updated until an aircraft is about
19 min from its metering fix (generally, about 30 min
from landing), at which time they are "frozen" to pro-vide stable values for controller use. The CTAS
sequence lists and recommended per aircraft delay are
provided to the ARTCC Traffic Management Coordi-
nator (TMC) through a video display and to the sector
controllers through their radar displays. The TMC's
display includes timelines for traffic scheduled to the
metering fixes and runways. A portion of a typical dis-
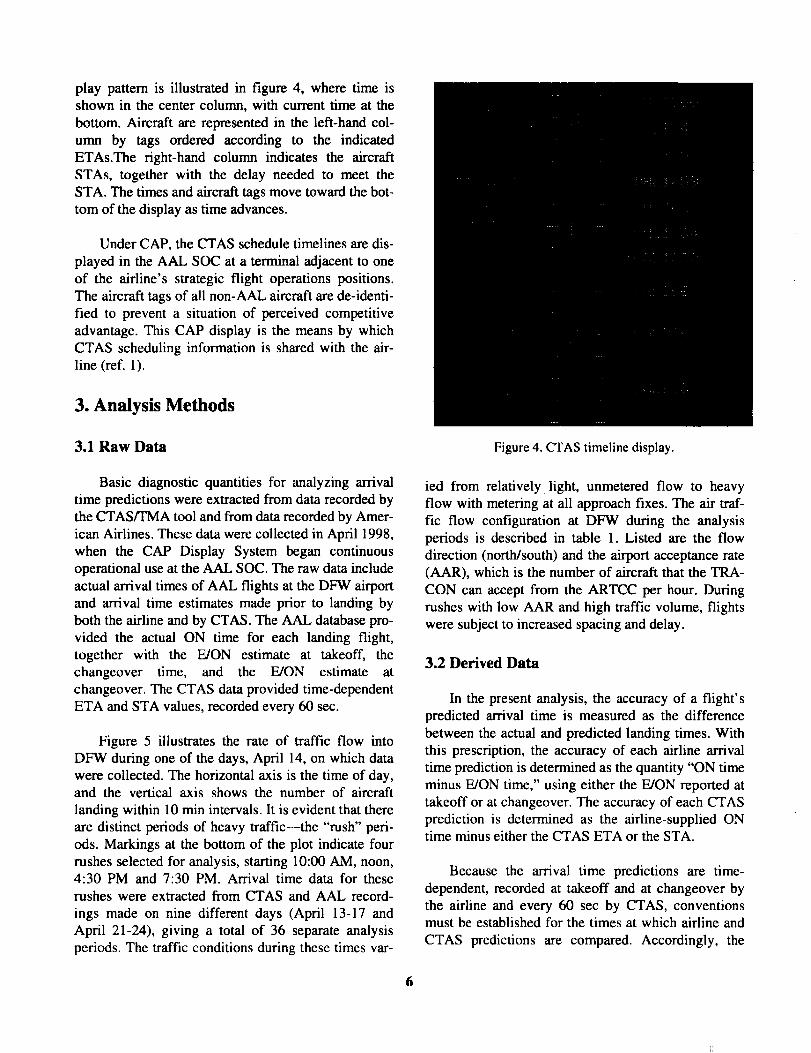
play patternis illustratedin figure4, wheretimeisshownin thecentercolumn,withcurrenttimeat thebottom.Aircraftarerepresentedin the left-handcol-umn by tags orderedaccordingto the indicatedETAs.Theright-handcolumnindicatesthe aircraftSTAs, togetherwith the delayneededto meettheSTA.Thetimesandaircrafttagsmovetowardthebot-tomof thedisplayastimeadvances.
UnderCAP,theCTASscheduletimelinesaredis-playedin theAAL SOCata terminaladjacentto oneof the airline'sstrategicflight operationspositions.Theaircrafttagsof allnon-AALaircraftarede-identi-fied to preventa situationof perceivedcompetitiveadvantage.ThisCAPdisplayis themeansby whichCTASschedulinginformationis sharedwith theair-line(ref.1).
3. Analysis Methods
3.1 Raw Data
Basic diagnostic quantities for analyzing arrival
time predictions were extracted from data recorded by
the CTAS/TMA tool and from data recorded by Amer-
ican Airlines. These data were collected in April 1998,
when the CAP Display System began continuous
operational use at the AAL SOC. The raw data include
actual arrival times of AAL flights at the DFW airport
and arrival time estimates made prior to landing byboth the airline and by CTAS. The AAL database pro-
vided the actual ON time for each landing flight,
together with the E/ON estimate at takeoff, thechangeover time, and the E/ON estimate at
changeover. The CTAS data provided time-dependent
ETA and STA values, recorded every 60 sec.
Figure 5 illustrates the rate of traffic flow into
DFW during one of the days, April 14, on which data
were collected. The horizontal axis is the time of day,and the vertical axis shows the number of aircraft
landing within 10 min intervals. It is evident that there
are distinct periods of heavy traffic--the "rush" peri-
ods. Markings at the bottom of the plot indicate four
rushes selected for analysis, starting 10:00 AM, noon,4:30 PM and 7:30 PM. Arrival time data for these
rushes were extracted from CTAS and AAL record-
ings made on nine different days (April 13-17 and
April 21-24), giving a total of 36 separate analysis
periods. The traffic conditions during these times var-
Figure 4. CTAS timeline display.
ied from relatively, light, unmetered flow to heavy
flow with metering at all approach fixes. The air traf-
fic flow configuration at DFW during the analysisperiods is described in table 1. Listed are the flow
direction (north/south) and the airport acceptance rate(AAR), which is the number of aircraft that the TRA-
CON can accept from the ARTCC per hour. During
rushes with low AAR and high traffic volume, flights
were subject to increased spacing and delay.
3.2 Derived Data
In the present analysis, the accuracy of a flight's
predicted arrival time is measured as the difference
between the actual and predicted landing times. With
this prescription, the accuracy of each airline arrival
time prediction is determined as the quantity "ON time
minus E/ON time," using either the E/ON reported at
takeoff or at changeover. The accuracy of each CTAS
prediction is determined as the airline-supplied ONtime minus either the CTAS ETA or the STA.
Because the arrival time predictions are time-
dependent, recorded at takeoff and at changeover by
the airline and every 60 sec by CTAS, conventionsmust be established for the times at which airline and
CTAS predictions are compared. Accordingly, the

o
o
O3
E
z
o g--------4i r
5:00 7:00 9:00 11:00 13:00 15:00 17:00
Rushes Analyzed
q J t
19:00 21:00 23:00
time (CDT)
Figure 5. AAL traffic flow into DFW airport on April 14, 1998.
analysis uses the concept of a "horizon time" for each
aircraft, defined as the continuously varying interval
between the local time and the final landing time. An
aircraft's horizon time approaches zero as it reaches
the runway. Arrival time accuracy was calculated atthree standard horizon times: 15, 30 and 60 min before
landing. The accuracy measure for the airline's arrival
time predictions (ON-E/ON) is based on the last E/ON
reported before the horizon time, i.e., the E/ON at
takeoff if the horizon time is before changeover, or the
E/ON at changeover if the horizon time is at or after
changeover. Similarly, the accuracy of the CTAS pre-
dictions (ON-ETA and ON-STA) uses the ETA or
STA at the recording time closest to the horizon time.
With the above conventions, an accuracy measure
was assigned to each arrival time predicted by the air-
line and by CTAS during the selected rush periods.
These data provide the basis for the analytical studies
described in the following sections.
3.3 Visualization and Interpretation Tools
Graphical and statistical methods were used touncover trends and draw conclusions from the large
quantity of diagnostic data. The fundamental visual-
ization tool employed was a histogram plot showingthe distribution of arrival time prediction accuracy
during one rush period. Representative examples ofthis distribution are displayed in figure 6.
The data plotted in figure 6 refer to AAL flights
arriving at DFW during a 2 hour rush period starting4:30 PM on April 22, 1998. A track diagram depicting
the trajectories of these flights in Center and TRA-
CON airspace is given in figure 2(a). In figure 6, thetop histogram was derived from AAL-recorded data
and the bottom histogram from CTAS data. On each
of these plots, the horizontal axis represents the accu-
racy of predicted arrival times (actual minus predicted
time), and the vertical axis shows the number of air-
craft with prediction accuracy within 1 min intervals.
The measure of accuracy was taken as ON-E/ON for
the airline predictions and ON-STA for the CTAS pre-
dictions. Positive values correspond to aircraft that
arrived later than predicted and negative values to air-

Table 1. Air Traffic Configuration at DFW Airport
13 April 99
14 April
15 April
16 April
17 April
21 April
22 April
23 April
24 April
Period AAR, Flow Direction
1000-1200CDT 120, South
1200-1400 120, South
1630-1830 108, South
1930-2130 120, South
1000-1200
1200-1400
1630-1830
1930-2130
1000-1200
1200-1400
1630-1830
1930-2130
ll4, South
ll4, South
120, South
120, South
114,
114,
120,
120,
1000-1200 120,
1200-1400 120,
1630-1830 120,
1930-2130 120,
South
South
South
South
North
North
North
North
1000- 1200 126, North
1200- 1400 126, North
1630-1830
1930-2130
1000-1200
1200-1400
1630-1830
1930-2130
1000-1200
1200-1400
1630-1830
1930-2130
126, North
126, North
126, North
126, North
126, North
126, North
126, North
126, North
126, North
126, North
120, South
120, South
120, South
120, South
120, South
120, South
120, South
120, South
1000-1200
1200-1400
1630-1830
1930-2130
1000-1200
1200-1400
1630-1830
1930-2130
8
cat_>"E<"6
enE.--tz
tt_v--
Om-
tt)
Q
PredictionHorizon:30 min
Mean = 0.3 rainSigma = 5 min
-25 -20 -15 -10
AAL Prediction Accuracy
-5 0 5
ON - E/ON (min)
Fractionwithin:+/- 2 min= 0.46+/- 5 min= 0.88
10 15 20 25
CTAS Prediction AccuracyU3T--
"6
.£} tO
Ez
O
PredictionHorizon:30 min
Mean = -0.7 minSigma = 1.9 min
Fraction within:+/- 2 min = 0.68+/- 5 min = 1
-25 -20 -15 -10 -5 0 5 10 15 20 25
ON - STA (min)
Figure 6. AAL and CTAS time of arrival prediction accuracy at the 30 minute prediction horizon during the 4:30-6:30 PM
rush on April 22, 1998.
craft that arrived early. For instance, the top plot indi-cates that three aircraft arrived 10 min later than the
airline predictions. Because the horizon time for this
example, 30 min from landing, is also the average time
at which changeover E/ON estimates were reported,
about half of the airline' s arrival time predictions were
based on the changeover E/ON and about half on the
E/ON at takeoff. As an aid in visualizing the shapes
of the data distributions, each histogram is overdrawnwith a Gaussian curve fit to the mean and standard
deviation of the prediction accuracy values.
To further assist in interpreting and comparingdata sets, the numerical values of several statistically-
based properties are shown on each histogram plot.
These include the mean value of the arrival time pre-
diction accuracy and three quantities representing the
width of the accuracy distribution: the standard devia-
tion with respect to the mean, and the fractions of
flights arriving within + 2 min and within _ 5 min of
their predicted times.
In the final stage of the analysis, airline and CTAS
predictions for all 36 rush periods were summarized
and compared. Section 4.3 describes this procedure indetail.
4. Analysis Results
4.1 Typical Rush Period
The data in figure 6 illustrate a rush period with
moderate traffic and minimal delay. Each histogram is
an accuracy distribution for a set of 57 AAL flightswhich landed during the 2 hour period beginning
4:30 PM on April 22, 1998, and had CTAS-recorded
STAs at the prediction horizon 30 min prior to land-ing. It is seen that the mean arrival time accuracy of
these aircraft is 0.3 min late in the airline predictions
and 0.7 min early in the CTAS predictions. A mean
accuracy within 1 min is typical for the rushes studied,
occurring in 75% of the CTAS predictions and 70% of
9
predictions by the airline.
The observation that the mean per-aircraft arrival
time error is generally small and comparable in the air-
line and CTAS predictions suggests that this statistic,
by itself, is not a meaningful measure of arrival time
prediction accuracy. The mean prediction accuracy
may be especially misleading if large positive and
negative values cancel in the averaging. That this
indeed occurs for the rush shown in figure 6 is evi-
denced by the larger width of the distribution repre-
senting the airline predictions. A better indicator of the
spread in the data from aircraft arriving significantly
early or late could thus be a statistic measuring the
mean absolute value of the prediction accuracy. One
such statistic is the standard deviation with respect to
the mean, shown on the plots with the entry labeled
"sigma." Because sigma is derived from the mean
square of the accuracy values, it is especially sensitive
to the largest values present. By this measure, the
CTAS arrival time predictions (sigma = 1.9 min) are
seen to offer substantial improvement over predictions
by the airline (sigma = 5.0 min).
An alternative measure of the spread in the predic-
tion accuracy is provided by entries on each histogram
plot giving the fraction of arrival times predicted to a
specified accuracy, either within + 2 min or within
+ 5 min of the actual arrival time. For the typical rush
of figure 6, it is seen that the airline predictions are
accurate to within + 2 min for 46% of the flights, but
that CTAS achieves this accuracy for a significantly
larger 68% of all flights. Moreover, accuracy within+ 5 min was achieved in 88% of the airline predic-
tions, but in all 100% of the predictions by CTAS.
Figure 6 also shows that the CTAS data contain
fewer outlier points representing prediction anomalies
large enough to disrupt flight operations. It has already
been noted that three flights arrived 10 min later than
the airline predictions, but it is even more significant
that one flight arrived 24 min earlier. With such uncer-
tainty in the arrival time, the airline was likely unpre-
pared with a gate for the flight. In contrast, no flightarrived more than 5 min earlier or 4 min later than the
times predicted by CTAS.
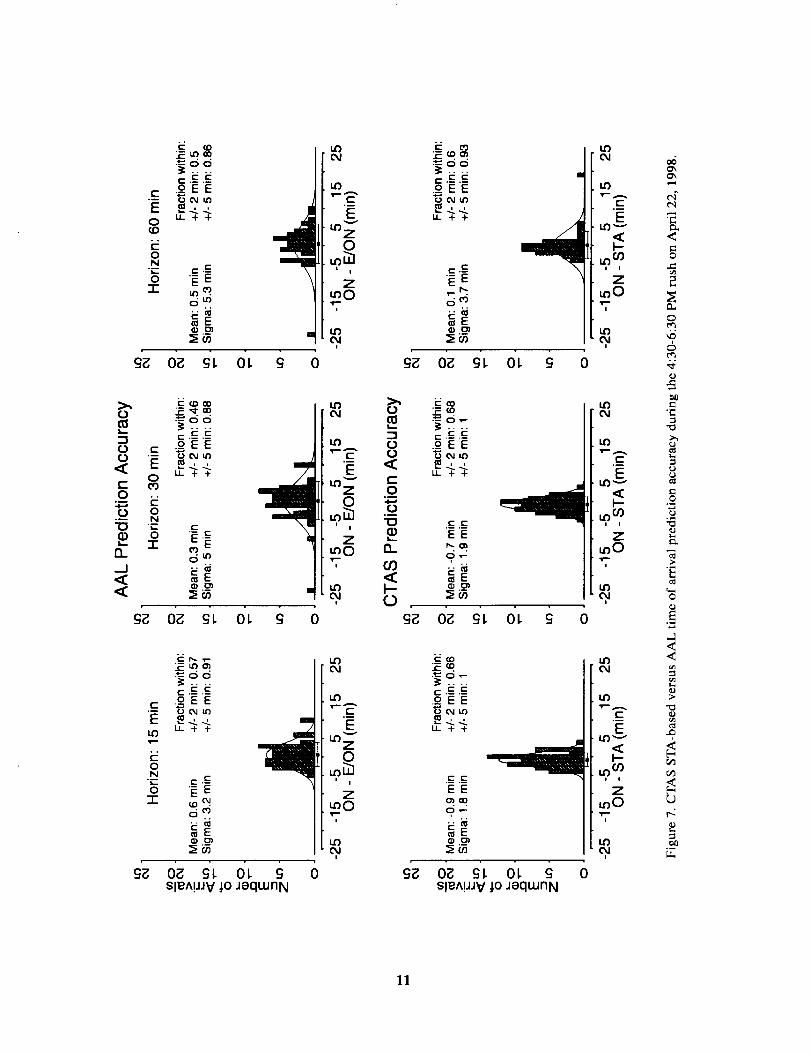
Additional analyses have shown that the improve-
ment in arrival time accuracy offered by CTAS at the
30 min horizon of the "typical" rush period of figure 6
extends to other rushes and prediction times. The his-
togram plots in figure 7 compare airline and CTAS
arrival time predictions for the typical rush at horizon
times 15, 30 and 60 min before landing. The diagrams
in the center for the 30 min horizon duplicate figure 6.
The 60 min horizon is generally close to the time when
an aircraft is acquired by center radar and first appears
in the CTAS recording. Consequently, some aircraft
are not yet recorded by CTAS at this horizon time, and
fewer data points are plotted. The 30 min horizon is
close to the time when the CTAS STA is frozen, and
the 15 min horizon is approximately the time when
aircraft enter the TRACON airspace, where controllers
rely on pFAST rather than TMA delay advisories. It is
evident that the airline's arrival time predictions are
similar at the 60 and 30 min horizons, as measured by
the accuracy distribution widths and the number of
outlier points. These predictions improve slightly by
the 15 min horizon time, when most changeover esti-
mates have been received. The improvement is evi-
denced by a 40% reduction in the standard deviation
parameter. In contrast, CTAS predictions improve
between the 60 and 30 min horizons but remain nearlyconstant inside of the 30 min horizon, where STA val-
ues are frozen. More significantly, however, it is seen
that the CTAS predictions are more accurate at all
horizon times. The widths of CTAS accuracy distribu-
tions are 50-70% of corresponding airline distributionwidths, and, whereas the airline distributions contain
outlier points with 10-24 min errors at each horizon
time, there is only one CTAS outlier. This occurred at
the 60 min horizon, when an arrival time forecast from
an initial flight-plan-based STA was inaccurate by 19
min. Upon receipt of radar positional data, CTAS
improved the aircraft's STA, and, by the 30 min hori-zon, it no longer appeared as an outlying point.
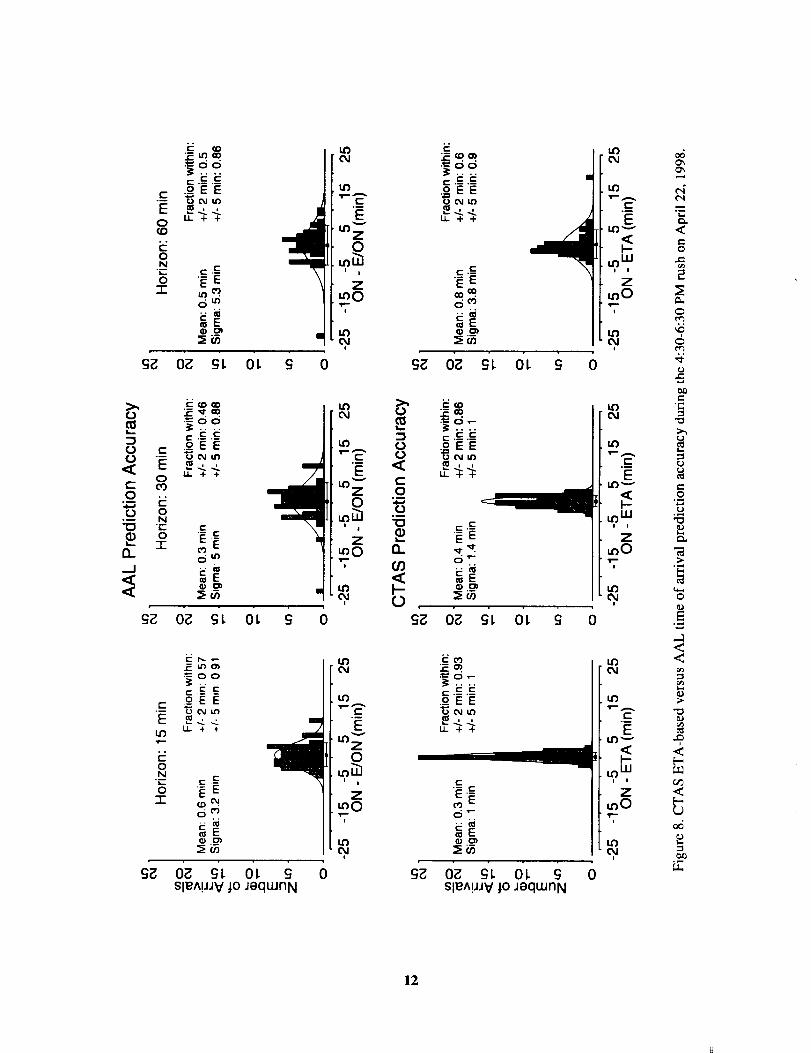
A similar set of accuracy distribution histogramsin figure 8 demonstrates that CTAS arrival time accu-
racy at small prediction horizons may be improved byusing ETAs in place of STAs. These plots refer to the
same rush period and prediction horizons used for fig-ure 7. The top row of plots showing airline prediction
accuracy is identical in the two figures, but the bottom
row is changed in figure 8 to show CTAS accuracymeasured as ON-ETA. It should be recalled that ETAs
are calculated under the assumption that aircraft will
have no further delay, and that the updating of ETAscontinues beyond the time at which STAs are frozen.
Thus, while the CTAS STAs are generally preferred in
10
EO(43
ON
O-r
l,r- (O
'F U_ O0
,.,..c_.c.OEE
_..c
T=ELn_.d_
ELr)
ONL.
O7-
g_
rl i_, ,r1
'F u_ o_._l C_ C_
c- ._ .c_.OEE"_
t-" ._
"_ E
OE gL OI gSleA!JJV ;0 JeqwnN
Lt)
ID
C:
u_z0
Z
u')
0
c'9
"_--C) O
= ._..c_._OEE
g_ OE SL OL g 0
0
00
0.i
0Ol
D_
O3
L)gE
g_
.c_._c.gEE
u_
¢1 e.-
EE
9'-
OE _L OL g 0
r ,_ ._
.gEE
u_-I--I-
EE
9"-
0g gL 0L cjSleA!JJV_0 JeqLunN
0
ur)oJ
ID
EIX)'--"
z
_)
ur)
r.1
EIX)'-"
z_nO
I
u_)
M')Od
cO
r-
EIz) "-"
z
"T
uC)
o6o_o_
¢Q
<
o
e_
6
¢)
ll:
(J
c_
r_
E
ocJ
<<
¢)
_or:
b:
]1
EO
0N
07-
.°C _D
._dd
| i
"_ E
d_
g_ O_ gL OL
0
(3 c
-_:<O
t'- CO
.OC3 O
O
__1
g 0
_CD_
_- .c .c.gEE
IJ. + +
C
OU_
_ O_ _L OL g 0
E14")
0N
0"1-
g_
c .c c.gEE
C -_
"_ E(Do4
c_ _
_65
0_ g_ OL S81BA!JJv JOJeqwnN
0
it)O4
143
_ZO
Z
Lt)
04
LD
,r-- ,_,
O
!!
z_nO
ID
Lt)
143
t-
O
z_O
O
OO
<t-O
O
0.
O
c ._c .c.oEE
c. __
d _
¢-
g_ 0_ gL OL
,°
d_
c .c .c.oEE
"_ E
O,r-
O_ _L OL g
"_o_
._o.-c .c_ =_
.gEE
I1
¢-
0_ gl. 01. g81e^!JJV jo JeqwnN
l.q
14)
ELO "-*"
<l--
Z
_O
143
0
LO04
IZ')
EIt)"-"
l--
Z
_O
0
If)
143
c
E143 ,,-._
<l-
z_O
L_
0
o6o_cf_
"C:ci.<
o
2
O
o
"O
c_
o
<<
<
<
8
,,=,_
12
r-
E
oco
t-oNL.-
O"r"
_T-tO
._dd ..
_- .c_ ._c.OEE
i1 + +
c.-
g_ O_ gl Ol
._dd::3 c- .__ ._0 c ._OEE
t"- CO
.oO O
"[_ -__ c- .Eo o _= E
-r- o,1 o_1
n _r_.,_1
g_ O_ gl Ol g 0
E
',r--
0N
0T
g_
_: (00D
o.o.,...c_ ._..oEE
,.-._
0_ gl 0lSIBA!JJv JO JeqwnN
ID
lO
C:
O
z
,,f.=!
0
ID
if}
(-
_zO
z_O
!
14")
0
.°
"=- o o
_- ._ ._=.lOEE
c.---
.,_ ,_-
g_ 0_ gl Ol g 0
°"o
c .c_ ._0 ._OEE
ii ++t-O
"_ ___
__ "_ E
..
0
g_ Og _l Ol g 0
"F ¢0 o_
l OlO"_l .{: .C
._OEE
,.j.,,_+
c. __
'F_E
0_ gl 0lSI_A!JJv _0 Joqwn N
0
ID
143
z
I:"
lO
I.O
t-°--
E
<I-
z
lO
lOCkl
tO
c-
E
I-
z_O
tO
_6o_
<
o
==
oo
,,
..-1
o
N
E
M<<
r._
-9,<
<
i:m
13

forecastingarrival times (especiallyduring rusheswith significantdelay),theETAmaybecomethebet-ter predictorinsidethe"freezehorizon"at about30min beforelanding.Moreover,theETA continuestoimproveandmaybecomea highlyaccuratepredictorasaircraftapproachlandingandall necessarydelayhasbeenabsorbed.Thesetrendsareevidentin figure7asa steepeningandnarrowingof theETA accuracydistributionwith decreasingpredictionhorizon.It isseenthat93%of ETAsareaccurateto within2minatthe15minhorizon,whereas,fromfigure6,only66%of theSTAshavethisprecision.In thisexample,theETAsalsoshowa distinct,althoughlessdramatic,advantageat the30 minhorizon,but thisadvantagemaynot holdduringperiodsof largerdelay.There-fore,furtheraccuracycomparisonsin thisreportarebasedonETAsatthe 15minpredictionhorizonandonSTAsatall largerhorizontimes.
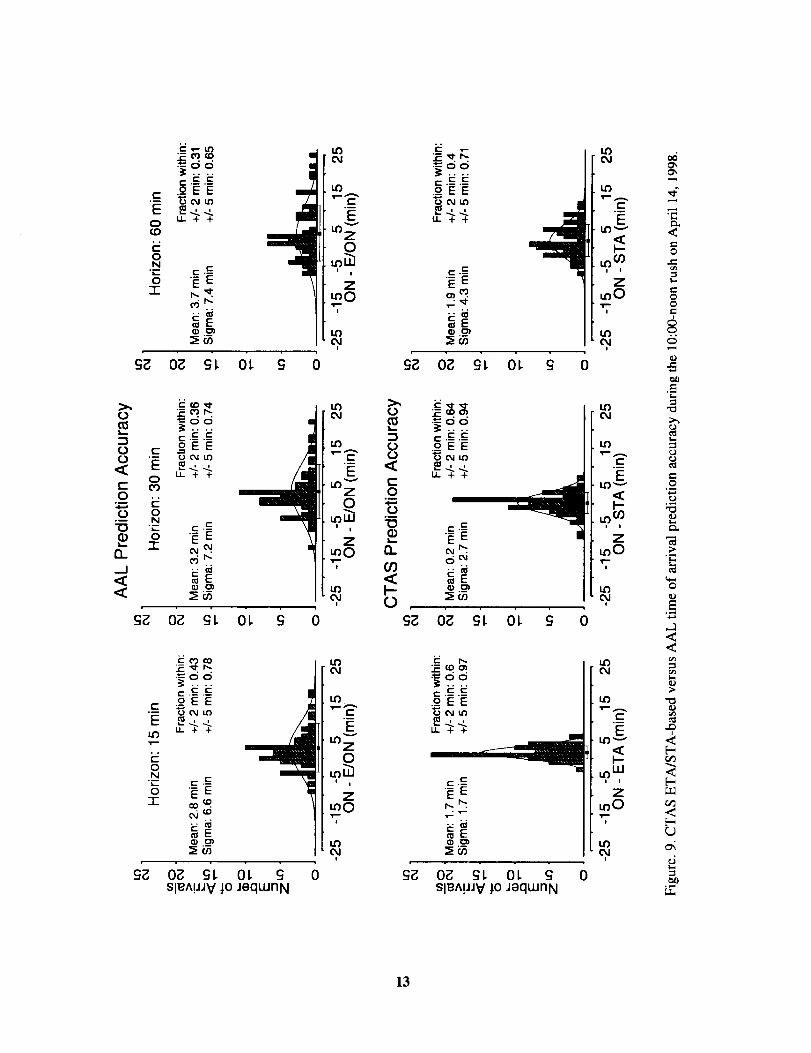
4.2 Large-delay Rush Period
Figure 9 illustrates arrival time accuracy for a rush
with particularly heavy traffic and large delay, cover-ing the period from 10:00 to noon CDT on April 14,
1998. This is the period for which aircraft tracks were
shown in figure 2(b). The top row of histogram plots
again shows the accuracy of the airline's arrival time
predictions and the bottom row the accuracy of CTAS
predictions. The format deviates slightly from previ-ous figures in that, for the reasons given in section 4.1,
CTAS predictions are based on the aircraft STAs atthe 60 and 30 min horizons and on ETAs at the 15 min
horizon.
The airline has more difficulty than CTAS in fore-
casting this high-traffic rush, as evidenced by the
larger widths of its accuracy distributions and by the
larger number flights arriving considerably early or
late. If flights with arrival times deviating by 10 or
more minutes from the airlines latest prediction are
designated as "outliers," then the airline accuracy dis-tribution is seen to have 10 outliers at the 60 min hori-
zon, 8 at 30 min, and 5 at 15 min. Most of these flightsarrive late--one as much as 25 min late. The CTAS
predictions, on the other hand, show in total only 2outliers, both at the 60 min horizon. At the 15 min
horizon, CTAS predicts all amvals to within 6 min.
Arrival time uncertainty can seriously disrupt an
airline's strategic planning and operations efficiency.
For example, in the instance of the aircraft arriving anunexpected 25 min late, the airline likely held a con-
necting flight that it should have released. The incor-
rect decision to hold might then have initiated a chain
of schedule disruptions propagating throughout the
system.
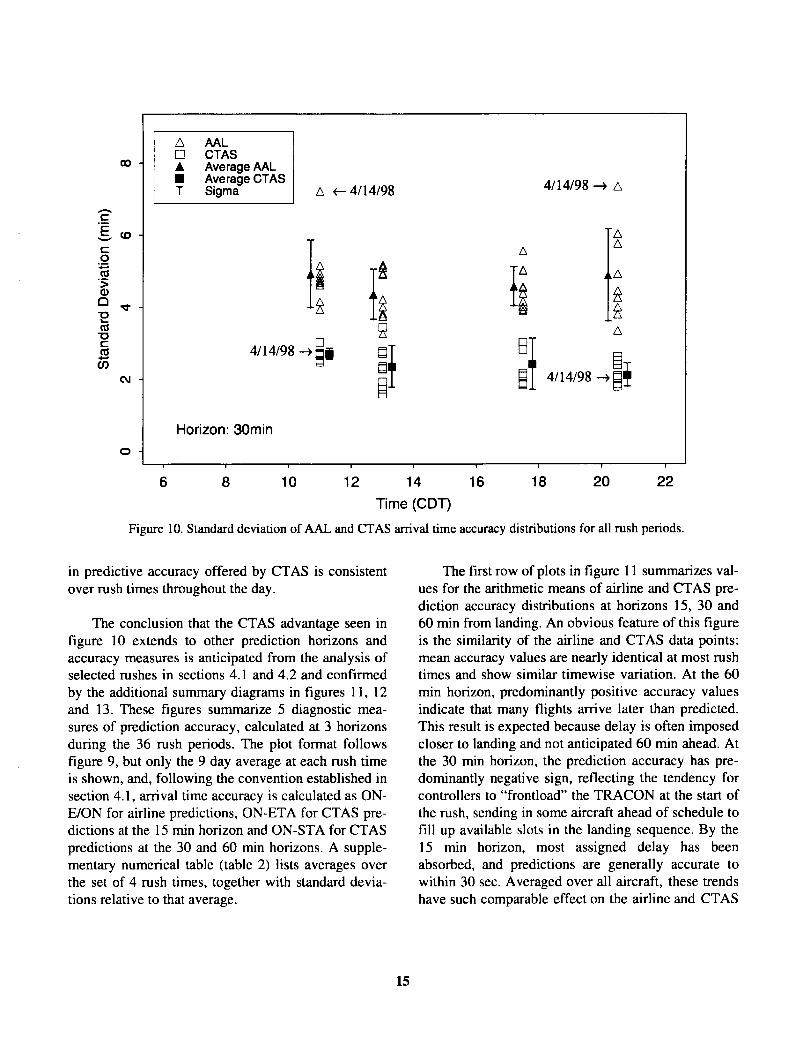
4.3 Statistical Summary for All Rush Periods
The analysis results presented in previous sections
refer to a single rush period, either the "typical" rush
or the sample "high-delay" rush. In this section, results
for all rushes studied are presented as a series of dia-
grams in summary format, beginning in figure 10 with
diagrams summarizing the uncertainty in arrival time
predictive accuracy as measured by the widths of
accuracy distributions. The data in this figure were
derived from 72 histogram distributions representing
airline and CTAS arrival time accuracy at the 30 min
horizon during 36 rush periods (4 rushes per day on 9
days). The standard deviation of the accuracy distribu-
tions is plotted as a function of the time of day at mid-rush, i.e., CDT one hour after the start of the two-hour
rush period. The 18 points at each rush time refer to
CTAS and airline predictions on each of the 9 days,
with the airline data represented by triangles and the
CTAS data by squares. Open symbols refer to the indi-
vidual rush periods and closed symbols to averages
over the 9 days.
At each rush time shown in figure 10, the standarddeviation points for airline accuracy distributions lie
generally above the corresponding CTAS points, with
an average factor of 2 separation. This distinction
between airline and CTAS predictions is especially
evident for the two rush periods on April 14 indicatedwith arrows. The period centered at 11:00 CDT is the
high-traffic, large-delay rush for which difficulties inthe airline's arrival time forecast were discussed in
section 4.2. Difficulties with the second period at
20:30 CDT on April 14 cannot be easily explained by
the traffic volume or delay, both of which are average
for the rushes at this time. During these two periods,
the standard deviations for the airline accuracy distri-
butions are abnormally large (7.2 and 7.3 min),
whereas much smaller widths for the corresponding
CTAS distributions (2.7 and 1.9 rain) indicate that
CTAS experienced no exceptional predictive diffi-
culty. Finally, it should be noted, from the small varia-
tion in the solid-point averages, that the improvement
14
E
t--O
I1)a
"10¢--
00
(D
Od
O
A AAL[] CTAS• Average AAL• Average CTAST Sigma A _ 4/14/98 4/14/98 _ a
ti[]4/14/98 ---)_i i_ 4/14/98---)
Horizon: 30min
i i i i i 1 ! 1 i
6 8 10 12 14 16 18 20 22
Time (CD'I')
Figure 10. Standard deviation of AAL and CTAS arrival time accuracy distributions for all rush periods.
in predictive accuracy offered by CTAS is consistent
over rush times throughout the day.
The conclusion that the CTAS advantage seen in
figure 10 extends to other prediction horizons and
accuracy measures is anticipated from the analysis ofselected rushes in sections 4.1 and 4.2 and confirmed
by the additional summary diagrams in figures 11, 12
and 13. These figures summarize 5 diagnostic mea-
sures of prediction accuracy, calculated at 3 horizons
during the 36 rush periods. The plot format follows
figure 9, but only the 9 day average at each rush timeis shown, and, following the convention established in
section 4.1, arrival time accuracy is calculated as ON-
E/ON for airline predictions, ON-ETA for CTAS pre-dictions at the 15 min horizon and ON-STA for CTAS
predictions at the 30 and 60 min horizons. A supple-mentary numerical table (table 2) lists averages over
the set of 4 rush times, together with standard devia-
tions relative to that average.
The first row of plots in figure 11 summarizes val-
ues for the arithmetic means of airline and CTAS pre-
diction accuracy distributions at horizons 15, 30 and
60 min from landing. An obvious feature of this figure
is the similarity of the airline and CTAS data points:mean accuracy values are nearly identical at most rushtimes and show similar timewise variation. At the 60
min horizon, predominantly positive accuracy values
indicate that many flights arrive later than predicted.
This result is expected because delay is often imposed
closer to landing and not anticipated 60 min ahead. At
the 30 min horizon, the prediction accuracy has pre-
dominantly negative sign, reflecting the tendency forcontrollers to "frontload" the TRACON at the start of
the rush, sending in some aircraft ahead of schedule to
fill up available slots in the landing sequence. By the
15 min horizon, most assigned delay has been
absorbed, and predictions are generally accurate to
within 30 sec. Averaged over all aircraft, these trends
have such comparable effect on the airline and CTAS
15
8
,--Jm_
_=-
E:(u!L),,,ueon°L- _-
0t'_
oO
,--_-
'-Eo_
e_ I'--
B 9 1_ 8 0(U!LU) uop,e!Ae(] pJepuels
"1-
O_O_
0
CO
,--_-
,'-O
"E_1.---
EmO
_4
O
_gc-o
E
b-,
<<o
o
16
E°_
EOCO
ON
O"T"
c-
EOCO
ON
.a
O"I-
c-
E
EON
°m
O"1-
O'L 8"0 9"0 VO EO
0"L 8"0 9"0 VO _'0
0"i. 8"0 9"0 17"0 ;_'0UlW _ -/+ U!LI],.!N_UO!_.OeJ-I
04
0O4
(3O
,.-#..,_a'," 0
"-Ee_l--
o
0o
0o4
0o,.-_._a'-0
"-E_I---
Q
o
,--_.
,--0v
"-Eo_
_1---
o
O'L 8"0 9"0 VO EO
O'L 8"0 9"0 VO _'0
0"1. 8"0 9"0 17"0 _'0u!w £ -/+ u!ql.!M uo!_.oeJ_..-I
O
,'- _.- >.,t...or'_ "_"0 '_
--- 9
"-E
o #
E _
_1 .__
£
0 _
"-.E_ ._
co -J
f-
<
,--o ._.
'-'E _
17

f.O
._N0"1-
c-
E0cO
E0N
,m
0"1-
c-
ELO
0N
°_
0"1-
, m
oi. _ o
OL 9 0
_m
_m
OL _ 0umw0 L-T-ep!s_noJequJnu
o_oJ
oo_
ao
corn,-fO
v
"-E
o
E°_
or)+1
OX
0
C_
E
o I_
O
E
e--
<
,,-0 .-_
_E r,.
o _
15

Table 2. Time-averaged Measures of Prediction Accuracy
Mean
Prediction Horizon
15 min 30 rain 60 min
AAL 0.21 ± 0.85 0.04 + 1.04 0.73 ± 1.41
CTAS 0.28 + 0.40 -0.34:1:0.72 0.83 +_1.04
Standard Deviation
Prediction Horizon
15 min 30 min 60 min
AAL 3.96 + 1.16 4.67 + 090 5.73 + 1.67
CTAS 1.25 + 0.29 2.39 + 0.52 3.89 + 0.83
Fraction within + 2 min
Prediction Horizon
15 min 30 min 60 min
AAL 0.57 + 0.06 0.51 + 0.08 0.43 + 0.08
CTAS 0.89 + 0.08 0.66 + 0.09 0.41 + 0.10
Fraction within + 5 min
AAL
CTAS
Prediction Horizon
15 min 30 min 60 min
0.88+0.05 0.82+0.06 0.73+0.10
1.00 + 0.01 0.95+0.04 0.81 +0.10
Number of outliers >_10 min
Prediction Horizon
15 min 30 min 60 min
AAL 1.1 + 1.2 2.8 + 2.1 4.5 + 4.0
CTAS 0.1 + 0.3 0.4 _+0.5 1.3 + 1.9
19

arrival time predictions, that an analysis based on the
arithmetic mean accuracy measure reveals no particu-
lar advantage for either set of values.
A more definitive parameter for comparing airline
and CTAS arrival time statistics is provided by the
standard deviation of the prediction accuracy distribu-
tions. Plots summarizing this measure for all rushes
and prediction horizons are displayed in the second
row of figure 11, with the plot at the 30 min horizon
duplicating data shown in figure 10. As noted in the
discussion of figure 10, the standard deviation mea-
sures the spread in accuracy values with an algorithmespecially sensitive to the effect of "outlier" points. In
figure 11, the CTAS data points lie consistently below
the corresponding airline points, indicating superiorCTAS predictive accuracy at all rush and horizon
times. Moreover, the improvement with CTAS is seen
to be greatest for predictions made close to the time of
landing. This qualitatively evident trend may be quan-tiffed with the data in table 2, from which a simple cal-culation shows that the ratio of CTAS to airline
standard deviation values decreases from 0.7 to 0.3 as
the horizon decreases from 60 to 15 min.
The greater precision of the CTAS arrival time
predictions is again evident from the plots in figure 12,which show the fraction of predictions accurate to
within 2 and 5 min. As in previous diagrams, theimprovement with CTAS is most obvious at the
smaller horizon times. At the 60 min horizon, the
CTAS advantage is minimal and seen only in theslightly larger fraction of predictions accurate towithin 5 min. Table 2 shows this fraction to be 81%
for CTAS versus 73% for the airline, averaged over allrush periods. At the 30 min horizon, CTAS predictions
had an average accuracy of 66% within 2 min and
95% within 5 min, versus the accuracy of 51% and
82% achieved by the airline. By the 15 min horizon,
CTAS predicted 89% of all flights within 2 min and a
full 100% within 5 min, a dramatic improvement over
the fractions 57% and 88% achieved by the airline.
A final set of summary plots in figure 13 illus-
trates the potentially most valuable advantage for
CTAS predictions: a significant reduction in the num-
ber of "outlier" flights with arrival time errors greaterthan or equal to 10 min. These plots reveal a distinct
improvement with CTAS at all rush and horizon
2O
times, but in this case the greatest benefit occurs at the
60 min horizon. At that time, the airline predictions
had almost 5 outliers per rush period, whereas with
CTAS the number of large magnitude errors was
reduced to approximately one.
The above analyses using a variety of accuracymeasures to contrast CTAS and airline arrival time
predictions compellingly demonstrate the be'nefits
derived from CTAS scheduling information, espe-
cially during heavy rush periods and for those flightsmost difficult to forecast by the airline's traditional
methods. This improved predictive ability should have
considerable value in minimizing the disruptive
effects of miscalculated delay on airline operations.
5. Concluding Remarks
An analysis of data recorded during an experimen-
tal test of the airline-CTAS information exchange sys-tem has demonstrated the utility of CTAS air traffic
management advisory software in predicting accurateaircraft arrival times. Compared with traditional air-
line arrival prediction, CTAS more precisely forecastsATC-imposed delay. Especially significant is the
reduction in prediction errors of 10 or more minutes,
which could invoke large disruptions in airline hub
and spoke operations. Furthermore, whereas conven-
tional airline schedules are not updated beyond about
30 minutes from landing, CTAS's predicted landingtimes become increasingly accurate as aircraft near the
terminal. Finally, the benefits realized from CTAS are
greatest during periods of heavy traffic and large
delay, the very conditions that cause the most disrup-
tion to an airline's operational efficiency.
Although the present research did not include a
comprehensive analysis of operational benefitsaccrued by the airline, an assessment of benefits to
American Airlines during the April 1998 CAP Display
System testing has been given by Zelenka et al.
(ref. 1). These authors report that, on several occasions
during the test period, AAL was assisted in equipment
move-ups and flight shuffling and in preventing diver-sions for flights into its DFW hub. Moreover, the
improvements in arrival time prediction and strategic
fleet arrival planning were accomplished with no
adverse impact on FAA air traffic control operations.

References
1. Zelenka, Richard E.; Quinn, Cheryl; Beatty, Roger; and
Heere, Karen: The Impact of CTAS Information on Air-
line Operational Control. Air Traffic Control Quarterly,
vol. 8, no. 1, 2000.
2. Perry, T.: In Search of the Future of Air Traffic Control.
IEEE Spectrum. Inst. of Electrical and Electronics Engi-
neers, New York, Aug. 1997, pp. 18-35.
3. Air Traffic Management in the Future Air Navigation
System. Air Transport Association of America, Wash-
ington, D.C., 1994.
4. Denery, Dallas G.; and Erzberger, Heinz.: The Cen-
ter/TRACON Automation System: Simulation and Field
Testing. NASA TM 110366, 1995.
21
Form Approved
REPORT DOCUMENTATION PAGE dubNo.o7o4-o188Public reportingburdenfor thiscollection of informationis estimated to average 1 hourper response, includingthe time for reviewinginstructions,searching existingdata sources,gathering an¢lmaintainingtha data needed, and completingand reviewingt_e collectionof information, Send comments regardingthis burden estimateor any other aspect of thiscollectionof information,includingsuggastionsfor reducingthis burden, to Wash.ngtonHeadquartersServices,Directorate for informationOperations and Reports.1215 JeffersonDavis Highway,Suite 1204, Arlington,VA 22202-4302, and to the Office of Managementand Budget,PaperworkReductionPr©act (0704-0188), Washington, DC 20503.
1. AGENCY USE ONLY (Leave blank) | 2. REPORT DATE 3. REPORT TYPE AND DATES COVERED
I February 2000 Technical Memorandum4. TITLE AND SUBTITLE S. FUNDING NUMBERS
A Comparison ofCenter/TRACON Automation System and AirlineTime of Arrival Predictions
6. AUTHOR(S) 727-01-24
Karen R. Heere* and Richard E. Zelenka
7. PERFORMINGORGANIZATIONNAME(S)ANDADDRESS(ES)
Ames Research Center
Moffett Field, CA 94035-1000
9. SPONSORING/MONITORING AGENCY NAME(S) AND ADDRESS(ES)
National Aeronautics and Space Administration
Washington, DC 20546-0001
8. PERFORMING ORGANIZATION
REPORT NUMBER
A-00V0006
10. SPONSORING/MONITORIN GAGENCY REPORT NUMBER
NASA/TM-2000-209584
11. SUPPLEMENTARY NOTES
Point of Contact: Karen R. Heere, Ames Research Center, MS 210-8, Moffett Field, CA 94035-1000
(650) 604-0291
*Ra_,theon, Moffett Field, CA121. DISTRIBUTION/AVAILABILITY STATEMENT 12b. DISTRIBUTION CODE
Unclassified -- Unlimited
Subject Category 03
Availability: NASA CASI (301) 621-0390
Distribution: Standard
13. ABSTRACT (Maximum 200 words)
Benefits from information sharing between an air traffic service provider and a majDr air carrier are
evaluated. Aircraft arrival time schedules generated by the NASA/FAA Center/TRACON Automation System
(CTAS) were provided to the American Airlines System Operations Control Center in Forth Worth, Texas, during
a field trial of a specialized CTAS display. A statistical analysis indicates that the CTAS schedules, based on
aircraft trajectories predicted from real-time radar and weather data, are substantially more accurate than the
traditional airline arrival time estimates, constructed from flight plans and en route crew updates. The
improvement offered by CTAS is especially advantageous during periods of heavy traffic and substantial
terminal area delay, allowing the airline to avoid large predictive errors with serious impact on the efficiency and
profitability of flight operations.
14.
17. SECURITY CLASSIFICATIONOF REPORT
Unclassified
NSN 7540-01-280-5500
SUBJECT TERMS
Air traffic control, Collaborative arrival planning, CAP, Center/TRACON
Automation System, CTAS
18. SECURITY CLASSIFICATIONOF THIS PAGE
Unclassified
19. SECURITY CLASSIFICATIONOF ABSTRACT
15. NUMBER OF PAGES
2618. PRICE CODE
A03
20. LIMITATION OF ABSTRACT
Standard Form 298 (Rev. 2-89)Prescribed by ANSI SId Z39-18
298-102