Embed Size (px)
Citation preview

Proceedings of the Third Middle East Conference on Global Business, Economics, Finance and Banking
(ME15Dubai October Conference), ISBN - 978-1-63102-286-9
16-18 October, 2015. Paper ID: DF517
1 www.globalbizresearch.org
A Comparison between “Religious” and
Conventional European Indices
T. Bouaricha,
Undergraduate Student,
ECE Paris School of Engineering, France.
___________________________________________________________________________
Abstract
Over past decade, the Financial Crisis has generated different types of investment such as
Religious and Ethical ones, as a consequence of increasing demand of transparent investment
noticed by Equity fund companies. This paper examines whether Religious Indices have a
better performance compared to their corresponding conventional ones by testing the
efficiency of Islamic, Christian and Conventional indices.
To measure the performance of investment based on religious values in Europe, comparison
of the performance of the two, Christian and Islamic, religious indices and a conventional
one will be made by calculating risk and performance ratio.
The period of study is covering from 2011 to 2015 due to the recent creation of Religious
indices.
A comparison of raw return and risk-adjusted return on short-run and long-run performance
shows that Islamic index outperforms Conventional one, contrary to Christian index which
underperforms both indices. It shows that Islamic screening rejects more Companies which
are subjected to change.
___________________________________________________________________________
Keywords: STOXX Europe Christian, STOXX Europe Islamic, STOXX Europe 600,
Performance, Comparative Analysis, Sharia-Compliant, Christian Values

Proceedings of the Third Middle East Conference on Global Business, Economics, Finance and Banking
(ME15Dubai October Conference), ISBN - 978-1-63102-286-9
16-18 October, 2015. Paper ID: DF517
2 www.globalbizresearch.org
1. Introduction
Financial Crisis has been strongly impacting the way investors choose their investment,
who pay attention to the type of investment and go away to ethical, religious or socially
responsible investments.
Nowadays, an increasing number of investors are willing to invest in performing index but
also according to their religious values, mainly Sharia or Christian one. Year after year,
socially responsible funds have increased significantly [13] as investors care about the origin
of their investment. Recently, the Islamic Financial market has been growing annually and is
attracting more and more investors unable to invest before the 90’s because of inexistence of
Sharia compliant products [13].
Because of the demand, FTSE launched the first Islamic equity index series, the FTSE
Global Islamic Index Series (GIIS) in 1998. In 1999, Dow Jones launched its first Islamic
index, the Dow Jones Islamic market index (DJIMI). Other possible differentiated
investments have also emerged in the last few years to respond to an increase of demand from
investors, such as Ethical Funds, Faith based investing, Sharia, Religious. The concept of
confessional fund appeared in the US since the 18th century with J. Wesley, founder of
Methodist Church, who thought that money has to be used for ethical purposes as relevant
from New Testament. Confessional investments started to grow at the beginning of XXth
century, but connexion between Finance and Religion is today more relevant than in last
decade after 2008 Financial Crisis openly showing the behaviour of financial actors which are
not compliant with ethical concepts. Main reasons are the instability of conventional finance,
its crisis, its contagious action, and globalization which pushed investors to turn to ethical
funds, a trend which has been confirmed since.
The paper examines the consequences of religious screening on STOXX Europe 600
performance. By using various financial measurement and performance ratios, it compares to
what extent returns earned by investors in STOXX Europe Islamic and STOXX Europe
Christian outperform their conventional STOXX Europe 600 index. It also analyses which
one of Islamic and Christian screening provides a better return on the short-run and long-run
periods.
Section 2 provides a brief background of Islamic Investment and Section 3 provides a brief
review of Christian Investment. Section 4 presents the data used in this study and Section 5
presents methodology and results which have been used while Section 6 concludes this study.
2. Religious Investments
2.1 Islamic Investment must be compliant with Sharia, the Islamic law based on Quran.
Sharia states that the use of money in financial investment lead to share of profit and loss
[14]. To be Sharia compliant, funds should not invest in a certain number of areas (Pork,

Proceedings of the Third Middle East Conference on Global Business, Economics, Finance and Banking
(ME15Dubai October Conference), ISBN - 978-1-63102-286-9
16-18 October, 2015. Paper ID: DF517
3 www.globalbizresearch.org
Non-halal food, Alcohol, Gambling, Tobacco, Drugs, Pornography, Gold and Silver,
Weapons and Arms). Sharia principles prohibit also usury and ambiguity [6]. All Islamic
investments are reviewed by a Committee which screens each company and excludes non
Sharia compliant ones.
2.2 In the same way as Islamic Funds are compliant with Islam, Christian Funds are
respectful of Christian moral. STOXX Europe Christian contains more than 500 values from
STOXX Europe 600. Christian Investment is not only limited to Christian but open to
everyone who cares about funds according to their moral. Financial crisis has been increasing
this phenomenon. The first Christian index is Catholic and American and it has been launched
in 1998 by FTSE, FTSE KLD Catholic 400 Values Index.
3. Data
The daily indices price has been taken for indices which represent capitalization
companies across Europe for the period between 2011 and 2015 from Bloomberg. One
Islamic index, one Christian index and one European index were selected to build a portfolio.
Indices were chosen according to Christian values and to be Sharia-compliant. STOXX
Europe 600 is derived from the STOXX Europe Total Market Index, itself derived from
STOXX Global 1800 index. The STOXX Europe 600 is composed of 600 companies from 18
countries of European Region.
STOXX Europe Christian (SEC) index is derived from STOXX Europe 600, it contains
companies from its derivative with significant level of Christian values (environmental,
social, ethical and economic responsibilities). The screening of companies is strictly limited
to revenues produced by companies from Weapons, Tobacco, Alcohol, Birth Control,
Gambling, Pornography area. The screening of this index is reviewed by an independent
committee.
STOXX Europe Islamic (SEI) index is also derived from STOXX Europe 600. Companies
with 33 % activity in financial institutions, Insurances companies, Gambling, Entertainment
& Music, Trading of gold & silver, Tobacco, Hotels, Weaponry & Arms, Alcohol,
Advertisement, Non-Islamic banks, Non-halal, Food production and Movies area are
excluded. The screening is reviewed by an independent Sharia Supervisory Board.
The portfolios contain 3 different indexes: SEI SEC and STOXX Europe 600 (SE6). The
EONIA rate has been used as the risk-free. To capture the risk factor, the Europe portfolio has
been used as a reference of market benchmark. SEI index has been launched in February 2011
and SEC index in April 2010. All closing data EUR price of these indexes have been saved in
EXCEL files.

Proceedings of the Third Middle East Conference on Global Business, Economics, Finance and Banking
(ME15Dubai October Conference), ISBN - 978-1-63102-286-9
16-18 October, 2015. Paper ID: DF517
4 www.globalbizresearch.org
4. Results and Discussion
4.1 Analysis of the performance of religious indices has been performed over 4 years. The
daily performance (basis 100) has been calculated from closing data EUR price of the
Religious and Conventional indices to represent the evolution of theses indices over 4 years
of study.
Figure 1: All Indices Price Evolution (100-Basis) (2011-2015)
Over the 4 years scale, the evolution of all the indices is identical. The MSCI Europe
benchmark performance is quite similar to the STOXX Europe 600.
4.2 This section highlights the methodology used to achieve the objective of this study. The
comparison of the three different previous indices has been performed by calculating
statistical and financial ratio. First, the monthly raw return and the monthly risk-adjusted
return have been both calculated. Secondly, the previous step has been applied for the long
run performance. Finally, two tests have been used to distinguish whether Religious indices
give abnormal returns for investors. The t-test and the signed-rank test have been used to test
whether abnormal returns from religious indices are equal to zero.
A. Analysis of Religious Indices vs Conventional Indices Normalized Performance
The behavioural evolution of Islamic and Christian indices has been compared to
Conventional one by calculating the normalized price of each index on a daily basis:
𝑆𝑖, 𝑡 =𝑃𝑖,𝑡
𝑃𝑛∗ 100 (1)
where:
- Si,t is the normalized price (basis 100),
- Pi,t is the index price at time t,
- Pn is the last index price.

Proceedings of the Third Middle East Conference on Global Business, Economics, Finance and Banking
(ME15Dubai October Conference), ISBN - 978-1-63102-286-9
16-18 October, 2015. Paper ID: DF517
5 www.globalbizresearch.org
Figure 2: STOXX Europe Indices Price Evolution (2011-2015)
Figure 3: STOXX Europe Religious Indices Price Evolution (2007-2014)
B. Raw Return Evolution
For further analysis, the arithmetical raw return has been calculated for the indices. The
behavioural evolutions of Islamic and Christian indices have been compared to Conventional
one. To do so, the price ratio has been calculated:
𝑅𝑖, 𝑡 =𝑃𝑖,𝑡
𝑃𝑖,𝑡−1 (2)
where:
- Ri,t is the price ratio,Pi,t is the index price at time t, - Pi,t-1 is the index price at time t-1.
Then, the raw return is given by:
𝑟𝑖, 𝑡 = 𝑅𝑖, 𝑡 − 1 (3)

Proceedings of the Third Middle East Conference on Global Business, Economics, Finance and Banking
(ME15Dubai October Conference), ISBN - 978-1-63102-286-9
16-18 October, 2015. Paper ID: DF517
6 www.globalbizresearch.org
Figure 4: STOXX Europe Indices Daily Performance Evolution (2007-2014)
As observed above, it is difficult to see the impact and the real performance evolution for
each index. The raw-return evolution is presented on a daily basis. Indeed, they seem to be
mingled. To highlight the difference between the three indices, it is more effective to
calculate the raw-return on a monthly basis, see Figure 5. Further analysis and ratio
calculation will be compared to show off the difference.
Figure 5: STOXX Europe Indices Monthly Performance Evolution (2007-2014)
Statistical Calculation Index Analysis
Analysis of raw daily returns of STOXX Europe Religious indices and conventional index
shows that STOXX Europe Islamic (SEI) has a better performance than STOXX Europe
Christian (SEC) and STOXX Europe 600 (SE6) over 2011-2014 periods. Indeed, the SEI
mean monthly return (0.0076) is superior to SE6 (0.0072) and SEI (0.0060), see Table I.
For all indexes, the variance is close of 0 which means that changes of index data market are
not significant. Both indices are not so risky and they can be predictable.

Proceedings of the Third Middle East Conference on Global Business, Economics, Finance and Banking
(ME15Dubai October Conference), ISBN - 978-1-63102-286-9
16-18 October, 2015. Paper ID: DF517
7 www.globalbizresearch.org
Table I: Indices Measures
SEC and SEI indexes represent the Europe area. To compare both, MSCI Europe has been
used as a common benchmark.
a. Covariance: a positive covariance means that the three indices exhibit a similar
behaviour and that they all move on the same way. The fact that the covariance is near 0
expresses the fact that the indices are quite independent, see Table II. Covariance calculation
is performed from the expression:
𝐶𝑜𝑣(𝑟, 𝑏) = (1
𝑝−1) − ∑ 𝑟𝑖 ∗ 𝑏𝑖
𝑝𝑖=1 (4)
where:
- bi is the benchmark return,
- ri is the index return,
- p is the length period.
b. Correlation: the correlations of SEI, SEC and SE6 are close to 1 which means that
each index is linked to their benchmark. The correlation is given by:
𝑝 =𝑐𝑜𝑣(𝑟,𝑏)
𝜎(𝑏)∗𝜎(𝑟) (5)
where:
- 𝜎(𝑏) is the volatility of benchmark,
- 𝜎(𝑟) is the volatility of the index.
Table II: Indices Covariance and Correlation results
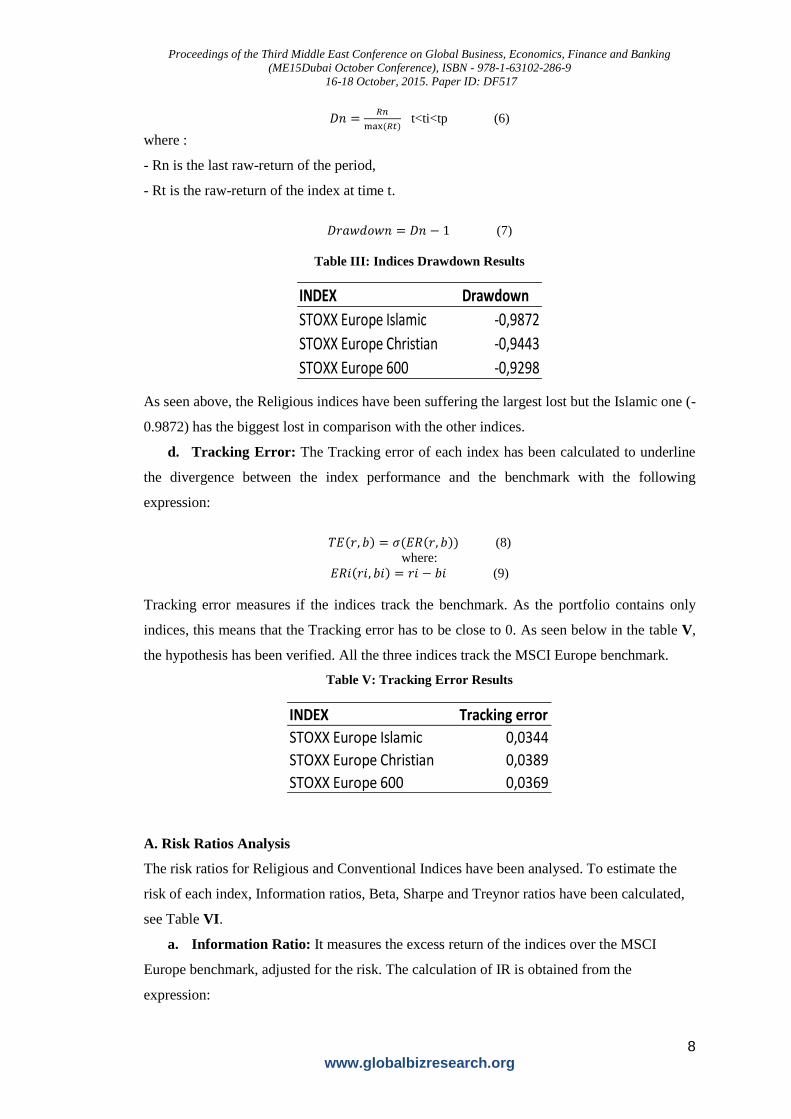
c. Drawdown: during the 4 years scale, the largest loss the indices have been suffered
of is presented in Table III. The calculations are developed from the following expression:
INDEX Mean Median Min. Max.
STOXX Europe Islamic 0,0076 0,0073 -0,0935 0,0827
STOXX Europe Christian 0,0060 0,0089 -0,1111 0,0847
STOXX Europe 600 0,0072 0,0095 -0,1049 0,0765
INDEX Variance Volatily Skew. Kurt.
STOXX Europe Islamic 0,0012 0,0340 -0,3812 1,4227
STOXX Europe Christian 0,0014 0,0379 -0,5713 1,1874
STOXX Europe 600 0,0013 0,0358 -0,6014 1,2322
INDEX Covariance Correlation
STOXX Europe Islamic 0,0012 0,9715
STOXX Europe Christian 0,0013 0,9869
STOXX Europe 600 0,0013 0,9995
Proceedings of the Third Middle East Conference on Global Business, Economics, Finance and Banking
(ME15Dubai October Conference), ISBN - 978-1-63102-286-9
16-18 October, 2015. Paper ID: DF517
8 www.globalbizresearch.org
𝐷𝑛 =𝑅𝑛
max (𝑅𝑡) t<ti<tp (6)
where :
- Rn is the last raw-return of the period,
- Rt is the raw-return of the index at time t.
𝐷𝑟𝑎𝑤𝑑𝑜𝑤𝑛 = 𝐷𝑛 − 1 (7)
Table III: Indices Drawdown Results
As seen above, the Religious indices have been suffering the largest lost but the Islamic one (-
0.9872) has the biggest lost in comparison with the other indices.
d. Tracking Error: The Tracking error of each index has been calculated to underline
the divergence between the index performance and the benchmark with the following
expression:
𝑇𝐸(𝑟, 𝑏) = 𝜎(𝐸𝑅(𝑟, 𝑏)) (8)
where:
𝐸𝑅𝑖(𝑟𝑖, 𝑏𝑖) = 𝑟𝑖 − 𝑏𝑖 (9)
Tracking error measures if the indices track the benchmark. As the portfolio contains only
indices, this means that the Tracking error has to be close to 0. As seen below in the table V,
the hypothesis has been verified. All the three indices track the MSCI Europe benchmark.
Table V: Tracking Error Results
A. Risk Ratios Analysis
The risk ratios for Religious and Conventional Indices have been analysed. To estimate the
risk of each index, Information ratios, Beta, Sharpe and Treynor ratios have been calculated,
see Table VI.
a. Information Ratio: It measures the excess return of the indices over the MSCI
Europe benchmark, adjusted for the risk. The calculation of IR is obtained from the
expression:
INDEX Drawdown
STOXX Europe Islamic -0,9872
STOXX Europe Christian -0,9443
STOXX Europe 600 -0,9298
INDEX Tracking error
STOXX Europe Islamic 0,0344
STOXX Europe Christian 0,0389
STOXX Europe 600 0,0369

Proceedings of the Third Middle East Conference on Global Business, Economics, Finance and Banking
(ME15Dubai October Conference), ISBN - 978-1-63102-286-9
16-18 October, 2015. Paper ID: DF517
9 www.globalbizresearch.org
𝐼𝑅(𝑟, 𝑏) =𝐸𝑅(𝑟,𝑏)̅̅ ̅̅ ̅̅ ̅̅ ̅̅ ̅
𝑇𝐸(𝑟,𝑏) (10)
where:
- 𝐸𝑅̅̅ ̅̅ =1
𝑝∗ ∑ 𝐸𝑅𝑖(𝑟𝑖, 𝑏𝑖)𝑛+𝑘
𝑖=𝑛+1 (11)
b. Beta Ratio: the Beta ratio of the indices measures the sensitivity of the index to its
benchmark. The expression of the Beta ratio is given by:
𝐵(𝑟, 𝑏) =𝑐𝑜𝑣(𝑟,𝑏)
𝜎2(𝑏) (12)
c. Sharpe Ratio: Sharpe ratio is equivalent to the information ratio, where the
benchmark is a risk-free security. Sharpe ratio is calculated using a risk-free rate time-series
as benchmark. The actual Ratio is calculated as:
𝑆𝑅(𝑟, 𝑓) = 𝐼𝑅(𝑟, 𝑓) (13)
where f is a risk-free rate.
d. Treynor Ratio: Treynor ratio is similar to Sharpe ratio except that Treynor uses Beta
to measure risk instead of volatility.
𝑇𝑝 =𝑅𝑖−𝑅𝑓
𝐵𝑝 (14)
The above table presents the four risk ratios which has been calculated.
Table VI: Risk Ratios Results
SEC IR ratio is negative while the SEI and SE6 ratio are positive. The excess return of SEI
and SE6 over the MSCI benchmark, adjusted for the risk is lower than SEC. It shows that SEI
(0.5018) has the best performance than SE6 (0.2943) over the entire period. SEI and SE6 beta
are higher than SEC. The two first indices are riskier than MSCI Europe benchmark. In
contrast, the SEC is less risky than its benchmark.
For all three indices, Sharpe ratio is negative, that means investors should not invest in any
of these indices. SEC Sharpe ratio is higher than the two others indices. The excess of raw
return for SEC compared to the risk free is lower than the risk taken.
The three Treynor ratios are positive. SEI and SE6 Treynor are quite equal while SEC
Treynor ratio is the lowest. SEI Treynor ratio is the highest that means SEI offers a better
performance compared to the risk taken.
INDEX IR Beta Sharpe Treynor
STOXX Europe Islamic 0,5018 1,0318 0,0065 0,0047
STOXX Europe Christian -0,1713 0,9386 0,0038 0,0034
STOXX Europe 600 0,2943 1,0059 0,0055 0,0043

Proceedings of the Third Middle East Conference on Global Business, Economics, Finance and Banking
(ME15Dubai October Conference), ISBN - 978-1-63102-286-9
16-18 October, 2015. Paper ID: DF517
10 www.globalbizresearch.org
Performance indicators analysis
Earning Frequency measures the percentage of the number of time for which the index has a
higher performance than its benchmark.
𝐹𝑟𝑒𝑞𝑢𝑒𝑛𝑐𝑦 =𝑅
𝑅𝑡∗ 100 (15)
where:
- R is the number of periods where the index outperforms its benchmarks,
- Rt is the number of total period.
Table VII: Earning Frequency
As seen above, the SE6 and the SEI outperforms their benchmark more often than SEC does.
Risk Adjusted Returns
SE6, SEI and SEC are not from the same category of risk which needs to be adjusted for
the raw returns. To predict the benchmark values, an economic approach will be used with the
Capital Asset Pricing Model (CAPM) model which includes the risk-free rate. The risk-
adjusted returns are calculated with the following formula:
𝑅𝑎𝑟 = 𝑅𝑖, 𝑡 − 𝑅𝑓, 𝑡 − 𝐵𝑖, 𝑡 ∗ (𝑅𝑚, 𝑡 − 𝑅𝑓, 𝑡) (16)
where:
- Rar is the risk-adjusted return,
- (Ri,t – Rf,t) is the excess return on the Index,
- (Rb,t – Rf,t) is the excess return on the Benchmark.
Based on equation (16), the calculation of index measures show that SEI outperforms SE6
while SEC underperforms the SE6.
Table VII: Risk-Adjusted Returns
The Mean Abnormal Return is defined as:
𝐴𝑅𝑖, 𝑡 = 𝐴𝑐𝑡𝑢𝑎𝑙 𝑅𝑒𝑡𝑢𝑟𝑛𝑠 −
𝑁𝑜𝑟𝑚𝑎𝑙 𝑅𝑒𝑡𝑢𝑟𝑛𝑠 (17)
The Normal Return [1] (Market Adjusted Returns) can be calculated as follows:
INDEX Frequency
STOXX Europe Islamic 49%
STOXX Europe Christian 45%
STOXX Europe 600 76%
INDEX Mean Median Min. Max.
STOXX Europe Islamic 0,0007 0,0000 -0,0148 0,0178
STOXX Europe Christian -0,0007 -0,0009 -0,0137 0,0132
STOXX Europe 600 0,0003 -0,0003 -0,0034 0,0032

Proceedings of the Third Middle East Conference on Global Business, Economics, Finance and Banking
(ME15Dubai October Conference), ISBN - 978-1-63102-286-9
16-18 October, 2015. Paper ID: DF517
11 www.globalbizresearch.org
𝐸(𝑅𝑖, 𝑡) = 𝛼𝑖 + 𝛽𝑖 ∗ 𝑅𝑚, 𝑡 (18)
where:
- Ri,t is the raw return of index i,
- Rm,t is the raw return of the market,
- α is the intercept,
- βi is the Beta of index i.
Another expression is:
𝑁𝑜𝑟𝑚𝑎𝑙 𝑅𝑒𝑡𝑢𝑟𝑛𝑠 = (1
𝑁−𝑛−1) ∗ ∑ 𝑅𝑖, 𝑡−𝑛
−𝑁 (19)
where:
- Ri,t is the raw return of index i,
- N is the number of average trading days in a given year,
- n is (event period – 1 day)/2.
For the calculation, the Market Adjusted Returns have been used which show to be more
effective than the second method. The later uses the average trading days and the result is not
always accurate due to day off and public holidays.
Both hypothesis H0 (the Mean Abnormal return is equal to zero by using a t-test) and
hypothesis H1 (the Median Abnormal return is equal to zero with a z-test) have also been
tested.
Table VIII: Abnormal Return
The average of previously measured sample is significantly different from the one
calculated with a confidence threshold of 5 % (5 possibilities to have a false result with null
hypothesis).
Table VIII shows that SEI does not differ from SE6 while SEC differs significantly from its
conventional index.
A. Buy-and-Hold (BHR) and Market Cumulative Return (MCR) Indexes
The long-run returns are examined in this part by calculating both Buy-and-Hold return
BHRi,t and Market Cumulative Return MCRi,t for SEI, SEC and SE6 indices. BHR is an
investment strategy for the long term, the investor buy assets and hold it for a long time. BHR
and MCR are respectively given by the following expressions:
𝐵𝐻𝑅𝑖, 𝑁 = ∏ (1 + 𝑅𝑖, 𝑡)𝑁𝑡=1 − 1 (20)
and
𝑀𝐶𝑅𝑖, 𝑁 = ∑ 𝑅𝑖, 𝑡𝑁𝑡=1 (21)
Jensen Market Adjusted Jensen Market Adjusted
mean abnormal return 0,0004 0,0005 -0,0009 -0,0009
t-test 0,3174 0,0684 -1,0186 -0,1580
median abnormal return -0,0001 0,0001 -0,0008 -0,0008
z-test 0,3068 0,0669 -0,9729 -0,1565
STOXX Europe Islamic STOXX EUROPE Christian

Proceedings of the Third Middle East Conference on Global Business, Economics, Finance and Banking
(ME15Dubai October Conference), ISBN - 978-1-63102-286-9
16-18 October, 2015. Paper ID: DF517
12 www.globalbizresearch.org
The long-run performances for the Raw-Returns and the Risk-Adjusted Returns have been
examined. Table IX indicates that SEI outperforms SE6 and SEI while SEI underperforms
SE6.
The following results are similar to the previous results concerning the comparison of short-
run performance of SEI, SEC and SE6 indices.
Table IX. Long-Run Performance
5. Conclusion
The results show that Sharia screening does not affect the performance of STOXX Europe
Islamic over 2011-2015 considered period. This index outperforms its conventional
counterpart both on short-run and long-run performance, while STOXX Europe Christian
underperforms STOXX Europe Islamic and STOXX Europe 600.
The analysis presented here shows that Islamic screening is more efficient during the
whole period of study in comparison to Christian screening. Ethical screening affects
performance indices in a positive way for Sharia-Compliant indices and in a negative way for
Christian ones.
In Islamic screening, companies the activity of which is more than 33% in Non-Islamic
Bank are excluded. This could be a reason why Islamic index outperforms the other indices as
Islamic Bank prohibits interest. During last year, the interest rate has been subjected to many
changes. Islamic screening is not too linked to such variation. This results suggests to further
investigate on the difference between the two religious screenings and on the type of
companies subjected to a large change year over year.
A further research will be necessary to study the performance of the three selected indices
over a longer period with variations of economy such a crisis, inflation, decrease of interest
rate or any economic impact. A highlight of this choice suggests an impact which will
underline the relevant phenomenon.
Acknowledgments
The author is very much indebted to ECE Paris School of Engineering to have provided
the environment where the work has been developed, and Pr M. Cotsaftis for discussion and
help in preparation of the manuscript.
INDEX CR BHR CR BHR
STOXX Europe Islamic 0,3745 0,4148 0,0338 0,0328
STOXX Europe Christian 0,2944 0,2966 -0,0281 -0,0286
STOXX Europe 600 0,3513 0,3772 0,0157 0,0158
Risk-Adjusted ReturnsRaw Returns

Proceedings of the Third Middle East Conference on Global Business, Economics, Finance and Banking
(ME15Dubai October Conference), ISBN - 978-1-63102-286-9
16-18 October, 2015. Paper ID: DF517
13 www.globalbizresearch.org
References
Assir, A.U.M., Mohamed, S., Hua, N.M.,: Selectivity and Timing: Evidence from the Performance of
Malaysian Unit Trusts, Pertanika J. Soc. Sci. & Hum, Vol.5(1), pp.45-57, 1997.
Attou, N., Blind, J.C., Bouaricha, T., Garcia, J., Haouriqui, A., Tahiri Jotey, O.,: Behavioral
Comparative Analysis between Sharia Compliant and Standard Indexes. (2015). In progress.
Barom, M.N.,: Social Responsibility Dimension in Islamic Investment: A Survey of Investors’
Perspective in Malaysia.
Brown, S.J., Warner, J.B.,: Using Daily Stock Returns: The Case of Event Studies. J. Financial
Economics, Vol.14, pp.3-31, 1985.
Causse, G., : La Finance Islamique, La Revue du Financier, n°182-183, pp 6-180, 2010.
Cowton, C.J.,: Managing Financial Performance at an Ethical Investment Fund, Accounting, Auditing
& Accountability J., Vol.17 (2). pp. 249-275, 2004.
Forte, G., Miglietta, F.,: A Comparison of Socially Responsible and Islamic Equity Investments. J. of
Money, Investment and Banking, Vol.11, pp.116-132, 2011.
Habib, M., ul Islam, K.,: Performance of Sharia Compliant Index: A Comparative Study of India and
Malaysia, Intern. J. of Interdisciplinary and Multidisciplinary Studies (IJIMS), Vol 1(6), pp.231-241,
2014.
Hakim, S., Rashidian, M.,: How Costly is Investors’ Compliance to Sharia? (2004).
Hakim, S., Rashidian, M.,: Risk & Return of Islamic Stock Market Indexes, Intern. Seminar of
Nonbank Financial Institutions: Islamic Alternatives, Kuala Lumpur, Malaysia, 2004.
Hoepnerab, A.G.F., Rammalc, H.G., Rezec, M.,: Islamic Mutual Funds: Financial Performance and
International Investment Style: Evidence from 20 Countries, Working Paper, School of Management,
St Andrew Univ., 2009.
Jawadi, F., Jawadi, N., Louhichi, W.,: Does Islamic Finance Outperform Conventional Finance.
Further Evidence from the Recent Financial Crisis, Working Paper IPAG n°2014-115, 2014.
Jouaber-Snoussi, K., Ben Salah, M., Rigobert, M.,: The Performance of Islamic Investment: Evidence
from the Dow Jones Islamic Indexes, Bankers, Markets & Investors, n° 121, pp.4-16, 2012, Groupe
Banque..
Wilson, R.,: Islamic Finance and Ethical Investment, Intern. J. Social Economics, Vol.24 (11),
pp.1325-1342, 1997.
Zwart, F.,: Blessed or Cursed? An Empirical Analysis of Islamic Mutual Funds, Master Thesis, Dept of
Finance, Faculty of Economics and Business, Univ. of Amsterdam, 2010; S. Elfakhani, Sidani, Y.,
Kabir Hassan, M.,: Comparative Performance of Islamic vs Secular Mutual Funds, Proc. 12th Annual
Conf. of the Economic Research Forum in Cairo, 2005.