Embed Size (px)
Citation preview
A COMPARISON ANALYSIS OF CEO COMPENSATION RELATED TO SHAREHOLDERS VALUE: SOUTH AFRICA VERSUS CHINA
HOLDING BANKS
Student: Danchen Meng
Student number: 3513242
A thesis submitted to the University of the Western Cape
in partial fulfillment of the requirements for the degree of
MASTER OF COMMERCE in Finance
School of Business and Finance
Faculty of Economic & Management Sciences
University of the Western Cape
Supervisor: Dr Rene Albertus
Date: August 2020

i
ABSTRACT
CEO’s compensation, as a global management problem, has been a matter of continuing
argument in Western economies, over the last two decades. However, the relationship
between CEO compensation and firm performance is still weak, resulting in the CEO
overpaid problem being more severe, since the financial turmoil experienced in
2008. The purpose of this study was to investigate whether firm performance justifies CEO
remuneration, by comparing South African and Chinese stock-holding banks. The motivation
for this study was to understand the correlation between CEO remuneration and the value
they added to shareholders. It was anticipated that the results would contribute to exploring
whether CEOs were overpaid for what they produced, and help companies to adjust their
compensation frameworks.
The researcher employed a quantitative approach to ascertain compensation alignment with
firm performance. The sample for this current research, from which the data were collected
consisted of ten (10) banking institutions (5 South African and 5 Chinese). The findings for
the South African banks revealed that the CEO’s remuneration was positively and
significantly related to the firm performance; however, the strength of the relationship
showed a declining tendency. Additionally, the non-apparent relationship between CEO
compensation and firm performance for Chinese banks, indicated the weakness of the
pay-performance structure in China. This result may help companies and shareholders to
adjust the existing management system, and standardize executives’ responsibilities that
would reduce, and avoid many enterprise management loopholes, while improving the
development of the nation’s economy, and attracting foreign investors.

ii
KEY WORDS
CEO compensation
CEO remuneration
China
Firm performance
Returns to shareholders
South Africa.

iii
ABBREVIATIONS
BRICS – Brazil, Russia, India, China and South Africa
CEO – Chief executive officer
CFPS – China Family Panel Studies
CIB – China Industrial Bank
CMB – China Merchants Bank
CMBC – China Minsheng Bank
CNCB – China CITIC Bank
CSR – Corporate Social Responsibility
FNB – First National Bank
GDP – Gross domestic product
GEAR – Growth, Employment and Redistribution
JSE – Johannesburg Stock Exchange
LTI – Long-term incentive
MLR – Multiple linear regression
MOF – Chinese Ministry of Finance
NOPAT – Net operating profit after tax
OLS – Ordinary least squares
PAS – Performance Appraisal System

iv
ROA – Return on assets
ROE – Return on equity
SAA – South African Airways
SD – Standard deviation
SOE – State-owned entity
SPDB – Shanghai Pudong Development Bank
SPSS – Statistical Package for the Social Science Programme
SSE – Shanghai Stock Exchange
STI – Short-term incentive
SZSE – Shenzhen Stock Exchange
TSR – Total shareholder returns
UK – The United Kingdom
USA – The United States of America

v
DECLARATION
I declare that the study “A Comparison Analysis of CEO Compensation Related to
Shareholders Value: South Africa Versus China Holding Banks” is my own work, and that
all the resources I have used, or quoted, have been indicated and acknowledged by complete
references.
I further declare that this study has not been submitted for any degree or examination in any
other university.
Student: Danchen Meng
Date: August 2020
Signature: ……………………………………….

vi
ACKNOWLEDGEMENTS
I would like to express my sincere appreciation to the following people, without whose
support and encouragement, I would not have had the chance to complete this research:
• First of all, my parents, who brought me into this world and gave me the opportunity
to study.
• My supervisor, Dr Rene Albertus, deserves my sincere gratitude for her assistance, for
accepting me as her student, for always being patient with me, and for sharing her
experience with me.
• Miss Pumla Nohaji, thanks for her time helping me with the requirements of the
thesis.
Thank you!

vii
TABLE OF CONTENTS
ABSTRACT.................................................................................................................................... i
KEY WORDS ................................................................................................................................ ii
ABBREVIATIONS ...................................................................................................................... iii
DECLARATION ........................................................................................................................... v
ACKNOWLEDGEMENTS ......................................................................................................... vi
TABLE OF CONTENTS ........................................................................................................... vii
LIST OF TABLES ..................................................................................................................... xiii
LIST OF FIGURES ................................................................................................................... xiv
CHAPTER 1: INTRODUCTION ................................................................................................. 1
1.1. Motivation for the study........................................................................................................... 1
1.2. Background to the study .......................................................................................................... 2
1.2.1. The political landscape and economy of China and South Africa ............................ 2
1.2.2. Financial Crisis and Executive Remuneration .......................................................... 5
1.3. Problem Statement ................................................................................................................... 6
1.4. Research Questions .................................................................................................................. 6
1.4.1. Question 1 ................................................................................................................. 6
1.4.2. Question 2 ................................................................................................................. 7
1.4.3. Question 3 ................................................................................................................. 7

viii
1.4.4. Question 4 ................................................................................................................. 8
1.4.5. Question 5 ................................................................................................................. 8
1.5. Hypothesis................................................................................................................................ 9
1.6. Research Aim and Objective .................................................................................................... 9
1.7. Significance and benefits of the study ..................................................................................... 9
1.8. Ethics considerations .............................................................................................................. 11
1.9. Limitations of the Study.......................................................................................................... 11
1.10. Structure of the Study .......................................................................................................... 12
1.11. Summary .............................................................................................................................. 12
CHAPTER 2: LITERATURE REVIEW ................................................................................... 14
2.1. Introduction ............................................................................................................................ 14
2.2. Role of the CEO ..................................................................................................................... 14
2.3. The CEO and Corporate Social Responsibility (CSR) .......................................................... 16
2.4. Executive Remuneration ........................................................................................................ 19
2.4.1. Origins and nature of executive remuneration ........................................................ 19
2.4.2. Issues in executive remuneration ............................................................................ 20
2.4.2.1. Remuneration Inequality ................................................................................ 20
2.4.2.2. Unreasonable remuneration ........................................................................... 22
2.5. Pay-Performance .................................................................................................................... 24

ix
2.5.1. Structure and components of executive pay ........................................................... 24
2.5.2. Shareholder value and the company’s performance ............................................... 27
2.6. The CEO compensation in South Africa and China .............................................................. 29
2.7. Chapter summary ................................................................................................................... 31
CHAPTER 3: RESEARCH METHODOLOGY ...................................................................... 32
3.1. Introduction ............................................................................................................................ 32
3.2. Overview of past research data and methodologies ............................................................... 32
3.3. Research Objectives ............................................................................................................... 34
3.3.1. The reason for comparing China and South Africa ................................................ 35
3.3.2. Research Questions ................................................................................................. 36
3.4. Research Approach ................................................................................................................ 39
3.5. Target Population ................................................................................................................... 39
3.6. Sample.................................................................................................................................... 40
3.6.1. The Ten Banks......................................................................................................... 40
3.6.1.1. The five South African Banks: ....................................................................... 41
3.6.1.2. The five Chinese Bank: .................................................................................. 42
3.7. Research Components ............................................................................................................ 42
3.7.1. Dependent variables ................................................................................................ 43
3.7.2. Independent variables ............................................................................................. 43
x
3.7.2.1. Return on Asset (ROA) .................................................................................. 44
3.7.2.2. Return on Equity (ROE) ................................................................................ 44
3.7.2.3. Total shareholder returns (TSR) ..................................................................... 44
3.7.2.4. Net Operating Profit after Tax (NOPAT) ....................................................... 45
3.8. Data collection ....................................................................................................................... 45
3.8.1. Source and nature of data ........................................................................................ 45
3.8.2. Data collection and Data collection process ........................................................... 46
3.9. Statistical methods ................................................................................................................. 47
3.9.1. Descriptive statistics ........................................................................................................... 48
3.9.2. Inferential statistics ............................................................................................................. 49
3.10. Summary .............................................................................................................................. 51
CHAPTER 4: RESEARCH FINDINGS ................................................................................... 52
4.1. Introduction ............................................................................................................................ 52
4.2. Descriptive Statistics .............................................................................................................. 53
4.2.1. Changes for each bank ............................................................................................ 53
4.2.2. Changes of Total Data Set ....................................................................................... 67
4.2.2.1. Company performance components .............................................................. 68
4.2.2.2. CEO remuneration ......................................................................................... 70
4.3. Inferential Statistics ............................................................................................................... 71

xi
4.3.1 China ........................................................................................................................ 72
4.3.1.1 Split periods: Period 1 (2007 to 2008) – Before the financial crisis ............... 72
4.3.1.2 Split periods: Period 2 (2008 to 2009) –During the financial crisis ............... 72
4.3.1.3 Split periods: Period 3 (2009 to 2018) – After the financial crisis ................. 73
4.3.1.4 Split periods: Total Period (2007 to 2018) ...................................................... 73
4.3.2. South Africa ............................................................................................................ 74
4.3.2.1 Split periods: Period 1 (2007 to 2008) – Before the financial crisis ............... 74
4.3.2.2 Split periods: Period 2 (2008 to 2009) – During the financial crisis .............. 74
4.3.2.3 Split periods: Period 3 (2009 to 2018) – After the financial crisis ................. 74
4.3.2.4 Split periods: Total Period (2007 to 2018) ...................................................... 75
4.4. Results of the research questions ........................................................................................... 85
4.5. Chapter Summary .................................................................................................................. 88
CHAPTER 5: DISCUSSION .................................................................................................... 89
5.1. Introduction ............................................................................................................................ 89
5.2. Discussion on research questions........................................................................................... 89
5.3. Limitations and future research ............................................................................................. 92
5.4. Chapter summary ................................................................................................................... 93
CHAPTER 6: CONCLUSION................................................................................................... 94
6.1. Introduction ............................................................................................................................ 94

xii
6.2. The original intention of this research ................................................................................... 94
6.3. Research methodology overview ........................................................................................... 95
6.4. Key Findings .......................................................................................................................... 95
6.5. Recommendations .................................................................................................................. 96
6.5.1. Recommendations to shareholders ......................................................................... 96
6.5.2. Recommendations for future research .................................................................... 97
6.6. Conclusion ............................................................................................................................. 97
REFERENCES ........................................................................................................................... 98
A – Z ........................................................................................................................ 98 – 117
APPENDICES............................................................................................................................ 118
Appendix A: English translation of Fu (2018) article ...................................................... 118
Appendix B: Editorial Certificate ................................................................................... 126
xiii
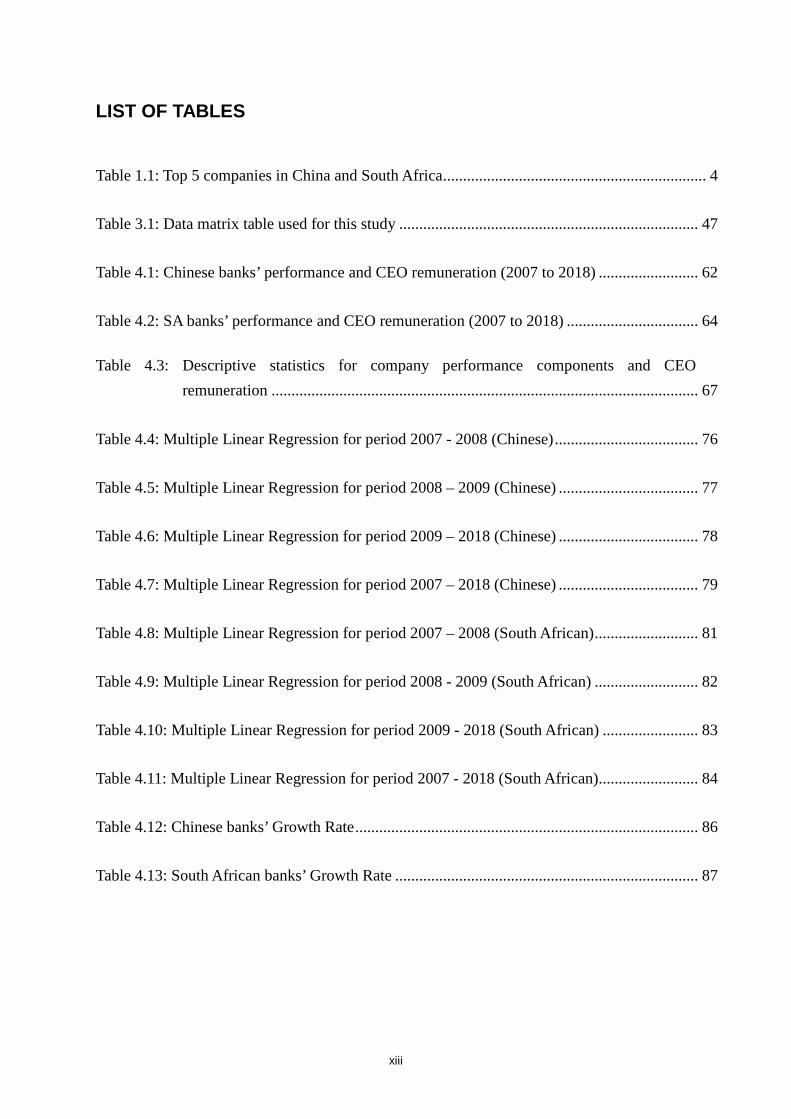
LIST OF TABLES
Table 1.1: Top 5 companies in China and South Africa .................................................................. 4
Table 3.1: Data matrix table used for this study ........................................................................... 47
Table 4.1: Chinese banks’ performance and CEO remuneration (2007 to 2018) ......................... 62
Table 4.2: SA banks’ performance and CEO remuneration (2007 to 2018) ................................. 64
Table 4.3: Descriptive statistics for company performance components and CEO remuneration ........................................................................................................... 67
Table 4.4: Multiple Linear Regression for period 2007 - 2008 (Chinese) .................................... 76
Table 4.5: Multiple Linear Regression for period 2008 – 2009 (Chinese) ................................... 77
Table 4.6: Multiple Linear Regression for period 2009 – 2018 (Chinese) ................................... 78
Table 4.7: Multiple Linear Regression for period 2007 – 2018 (Chinese) ................................... 79
Table 4.8: Multiple Linear Regression for period 2007 – 2008 (South African) .......................... 81
Table 4.9: Multiple Linear Regression for period 2008 - 2009 (South African) .......................... 82
Table 4.10: Multiple Linear Regression for period 2009 - 2018 (South African) ........................ 83
Table 4.11: Multiple Linear Regression for period 2007 - 2018 (South African)......................... 84
Table 4.12: Chinese banks’ Growth Rate ...................................................................................... 86
Table 4.13: South African banks’ Growth Rate ............................................................................ 87

xiv
LIST OF FIGURES
Figure 1.1: Personal disposable income table in China ................................................................ 10
Figure 2.1: Total Rewards Model ................................................................................................. 26
Figure 3.1: Analysis methods used for this study ......................................................................... 48
Figure 3.2: Correlation coefficient r2 ............................................................................................ 49
Figure 3.3: Coefficient of determination r2 ................................................................................... 50
Figure 3.4: Decision rule for interpreting p-value (based on 5% level of significance) ............... 50

- 1 -
CHAPTER ONE
INTRODUCTION
1.1. Motivation for the study
The CEO’s compensation, as a global management problem, has been a matter of continuing
argument in Western economies (Kato & Kubo, 2006). Over the past two decades,
specifically after the collapse of Enron and WorldCom, unlike in Western economies, this
topic has been ignored in most of developing countries (Singh & Agarwal, 2003). However,
the influence of the CEO’s compensation has attracted the attention of global company
shareholders, especially after the Lehman brothers’ company declared bankruptcy, and the
Merrill Lynch acquisition case, in the 2008 global financial crisis (Shim & Kim, 2015; Luo &
Jackson, 2012). The debate, therefore, concerns whether executives are paid too much, and
whether their compensation is connected to the value they add (Bezuidenhout, 2016).
Similar to the economic impact experienced elsewhere in the world, the South African
economy has been severely hit, as the yield in the mining industry declined by 33% in
the 2008 financial crisis (Marais, 2009). As a result, the South African government started to
realise the significance of the director’s remuneration structure, and the former president,
Jacob Zuma, appealed to executives, directors, and CEOs in the private sector, as well as
senior executives in the public sector, to consent to discontinue increases in bonuses and
fixed compensations, for the following year (Zuma, 2012). Ever since, corporate shareholders
in South Africa, as well, have started to realise the significance of the structure of the
director’s remuneration (Viviers, 2015).
As early as 2000 and 2004, the large remuneration packages of executives have attracted
attention in China (Wei, 2000; Mengistae & Xu, 2004). In 2009, the Chinese Ministry of
Finance (MOF, 2009) drew up a remuneration governance notification for state-owned

- 2 -
businesses. The aim of this notification was to set up a Performance Appraisal System (PAS)
to determine CEO remuneration adjustments that were commensurate with the annual
foundation levels. As a PAS pilot project, financial institutions have been updated with a set
of articles of association, as well as detailed regulations for bank performance evaluation by
the Chinese Ministry of Finance, at the end of 2009 (Lin & Zhang, 2009).
A survey reveals that, unlike other countries, which were experiencing economic downturn,
especially the 2008 global financial crisis, with reduced export rates, China has maintained a
comparable rate of increase, during the crisis period, exceeding other large economies with a
10% GDP growth in 2010 (Li, Willett, & Zhang 2012). Zhou, Georgakopoulos, Sotiropoulos,
and Vasileiou (2011) state that the attention paid to CEO compensation, and the Performance
Appraisal System regulations, could be the reason that China maintained a comparative rate
of increase, during the 2018 financial crisis period.
The motivation of this current research was to explore whether the high remunerations
offered to the executive directors have added value to the shareholders, and whether the
expanding gap between the compensation of the CEO and common staff members, is fair and
reasonable, by comparing South African and Chinese holding banks. In addition, the
researcher intends to provide recommendations to South African corporate shareholders on
ways of reducing the effects of the South African recessionary economy, as well as offer
advice to Chinese private stock-holding companies (especially banking sectors) regarding the
remuneration structure of their executives.
1.2. Background to the study
The main content of this section provides an overview of the background of the study.
1.2.1. The political landscape and economy of China and South Africa
China and South Africa are both developing states, and part of the association of five

- 3 -
emerging national economies (Brazil, Russia, India, China & South Africa), referred to
by the acronym, BRICS. However, as the biggest mixed economy countries in Asia and
Africa, the political structures in China and South Africa are slightly different. In this
section, the researcher discusses the Chinese and South African political and economic
situations.
China was a socialist country, with a planned economy, and the Chinese government
had the absolute power to control and adjust the market and business growth cycle.
Therefore, state owned enterprises (SOEs) emerged as required. The Chinese
government allocated the goods and services to individuals by subordinate state owned
enterprises. This increased the security for Chinese economic development, and
simultaneously, limited the speed of economic development. Consequently, in 1992, the
Chinese Communists stated that the new goal of China was to set up a socialist market
economy with Chinese Characteristics. However, even though China has transferred
from a planned economy to a market economy, the socialist (central government)
control of factors, remains of great importance (Chow, 2018). This new economic
model not only improved the speed of economic development, but also ensured
economic development safety (Virmani, 2005). According the Table 1.1, the top five
biggest enterprises in China are state owned, and they all perform well on the world
stage; therefore, it is evident that the goal of the government is to drive the
development of private enterprises, by state owned enterprises. In addition, Zhou,
Georgakopoulos, Sotiropoulos, and Vasileiou (2011) assert that the regulations for the
economic management issued by the government could be the reason that China
survived the financial crisis.
South Africa is a parliamentary republic, has a mixed capitalist market economy, as the
guideline, supplemented by government intervention. In 1996, the Minister of Finance
presented the GEAR strategy, which is Growth, Employment and Redistribution. One

- 4 -
of the three policy themes within GEAR was to free up markets and allowed the prices
to be determined by supply and demand. In addition, the Minister of Finance proposed
to free up the market by privatising some state-owned companies (Roux, 2017).
Although the GEAR strategy was not reacting well in the short term, it provided the
feasibility for future development and growth (Roux, 2017).
Feltham (2016) reported that, during the presidency of Mr Jacob Zuma, the number, as
well as the role of state owned enterprises, have been increased by the
government. However, the state lacked the expertise to operate companies. Many state
owned enterprises have solicited large subsidies from the government, because of poor
operation and large losses, for example, the SAA that has received approximately
US$2.25 billion government subsidies over the past two decades (Businesstech staff
writer, 2019). According to Table 1.1 (Fortune, 2018), the top five enterprises in South
Africa were privately owned (only Sasol has a 27% share-holding by the government).
Evidently, although the government increased the number, as well as the role of
state-owned enterprises, they still performed less than satisfactorily.
Table 1.1: Top 5 companies in China and South Africa
Resource: Fortune (2018)

- 5 -
1.2.2. Financial Crisis and Executive Remuneration
In September 2008, the financial crisis commenced in America, and rapidly spread
throughout the world (Kannan & Koehler-Geib, 2009). The financial crisis caused the
soaring prices of food and crude oil on the international market, and most industries
have been affected (Investopedia, 2020). Similar to other countries, the South African
economy has been affected negatively by the financial crisis. The price of gold had
depreciated radically to nearly half-price, from US$1030 at the start of 2008, to
US$750 in the last quarter (Peel, 2008), and approximately 1 million jobs were lost
(Brothwell, 2020). The unemployment rate rose to 25%, and the GDP growth rate
dropped dramatically, from 6.4 percent in the first quarter of 2009, to 2.8 percent in the
last quarter (Rena & Msoni, 2014).
The failure in corporate governance has been perceived as one of the main causal
factors of the 2008 crisis, with executives’ remuneration being a direct factor to affect
corporate governance (Kirkpatrick, 2009). To overcome the Great Financial Depression,
the Chinese Ministry of Finance (MOF, 2009) drew up a remuneration governance
notification to enhance management effectiveness. In South Africa, the King III Report
on corporate governance (King, Engelbrecht, Katz, & Ramalho, 2009) clarified the
meaning of effective and ethical leadership. In addition, the King IV Report on
corporate governance (King Committee on Corporate Governance & King, 2016) stated
that the remuneration and performance-related elements must be disclosed by
companies. The King IV Report on corporate governance (King Committee on
Corporate Governance & King, 2016) also suggested that the accountability of
executive directors to shareholders could be promoted by the compensation policy. The
remuneration packages of executives considered in this current study are fixed salaries,
pensions, perquisites, bonuses, and employee benefits paid to directors. The dividends,
returns, and surplus that the executives earn, as owners of shares of the company, are
not included, due to shortage of data furnished by some banks in their annual reports.

- 6 -
1.3. Problem Statement
The South African economy is confronted with a crisis, illustrated by the depreciation of the
Rand, and the technical recession. However, the collapse that organisations are facing, caused
by an unconscionable compensation structure, will devastate the South African economy
further (Bezuidenhout, 2016). In contrast, China has already become the world’s largest
trading country, after the 30 years of explosive growth, driven by the Chinese Ministry of
Finance. In the third quarter of 2018, the Gross Domestic Product (GDP) growth rate in
China grew 6.5%, year-on-year (Amadeo, 2019). However, the issue of unequal income in
the private enterprises followed the rapid development of the economy, as well as the
excessive gap between the rich and the poor, which currently, has become a serious problem
facing Chinese society (Leng, Fu, & Xu, 2015). According to the survey conducted by the
China Family Panel Studies [CFPS] (Leng et al., 2015), the top 1% of households in China
owned approximately one-third of the nation’s wealth, while the bottom 25% of households
owned only about 1%. Chinese policy-makers, therefore, have an urgent task of establishing a
way to reduce income inequality, which would involve adjusting the salary structure of
executives and employees, while maintaining the high growth rate of GDP.
1.4. Research Questions
The major research question in this current study is:
“Is there a relationship between CEO compensation and shareholders value for the
Chinese and South African banking industry?”
The following detailed questions and sub-questions will be used as a guide to the research
process.
1.4.1. Question 1
Is there a correlation between CEO compensation and shareholders value in the
banking sector of South Africa, for the period of 2007 to 2018?

- 7 -
• Sub-question 1.1: Is there a correlation between CEO remuneration and Return
on Equity in the South African banking industry, for the period 2007 to 2018?
• Sub-question 1.2: Is there a correlation between CEO remuneration and Return
on Asset in the South African banking industry, for the period 2007 to 2018?
• Sub-question 1.3: Is there a correlation between CEO remuneration and Total
shareholder return in the South African banking industry, for the period 2007 to
2018?
• Sub-question 1.4: Is there a correlation between CEO remuneration and Net
Operating Profit after Tax in the banking industry of South Africa, for the period
2007 to 2018?
1.4.2. Question 2
Is there a correlation between CEO remuneration and returns to shareholders for the
Chinese banking sector, for the period of 2007 to 2018?
• Sub-question 2.1: Is there a correlation between CEO remuneration and Return
on Equity in the Chinese banking industry, for the period 2007 to 2018?
• Sub-question 2.2: Is there a correlation between CEO remuneration and Return
on Asset in the Chinese banking industry, for the period 2007 to 2018?
• Sub-question 2.3: Is there a correlation between CEO remuneration and Total
shareholder return in the Chinese banking industry, for the period 2007 to 2018?
• Sub-question 2.4: Is there a correlation between CEO compensation and Net
Operating Profit after Tax in the Chinese banking industry, for the period 2007
to 2018?
1.4.3. Question 3
Did the relationship between CEO remuneration and returns to shareholders change,
over the period of 2007 to 2018?

- 8 -
• Sub-question 3.1: Did the relationship between CEO remuneration and returns
to shareholders change in the South African banking sector, over the period
2007 to 2018?
• Sub-question 3.2: Did the relationship between CEO remuneration and returns
to shareholders change in the Chinese banking sector, over the period 2007 to
2018?
1.4.4. Question 4
Does the strength of the relationship between CEO remuneration and returns to
shareholders transform before (2007), during (2008-2009), and after the global
financial crisis?
• Sub-question 4.1: The transformation of the correlation between CEO
compensation and returns to shareholders in the South African banking industry
before, during, and after the 2008 global financial crisis?
• Sub-question 4.2: The transformation of the correlation between CEO
compensation and returns to shareholders in the Chinese banking industry
before, during and after the 2008 global financial crisis?
1.4.5. Question 5
Can the companies from South Africa and China overcome their predicaments, by
adjusting the CEO compensation structure?
• Sub-question 5.1: How does a South African company overcome the
predicaments brought by the recession, in terms of adjusting the CEO
compensation structure?
• Sub-question 5.2: How do Chinese companies overcome the predicaments
brought by the big wealth gap, in terms of adjusting the CEO compensation
structure?

- 9 -
1.5. Hypothesis
The null hypothesis for this current research is:
• H0: CEO remunerations are not aligned to shareholder wealth creation.
The alternative hypothesis is proposed:
• H1: CEO remunerations and shareholders’ value are positively correlated.
• H2: CEO remunerations and shareholders’ value are negatively correlated.
1.6. Research Aim and Objective
The aim of this current study, therefore, is to ascertain whether the executive’s remuneration
and company performance has a correlation, and is justified. The objective is to evaluate
whether the performance of the companies and income inequality could be improved by
adjusting CEO remunerations, and comparing South African and Chinese holding banks.
1.7. Significance and benefits of the study
CEO remuneration has always been the trending topic in Western economies; however, it had
become a concern to economists and the media in developed countries for a long time, as it is
a significant system of governance to track, discipline, and stimulate managers
(Bezuidenhout, 2016). The attention on the correlation between executive compensation and
returns to shareholders was insufficient in South Africa (Bezuidenhout, 2016). After the
collapse of Enron and WorldCom, as well as the 2018 financial crisis, a continuing
controversy ensues in the case of whether the CEO’s performance is worth what
s/he received from the company, and could executives’ goals and interests somehow be
aligned with shareholders’ (Nicola, Giuseppe, Martina, & Giuseppe, 2016).
The imbalance between South Africa’s director compensations have been attacked by the
public, government, commerce, and academia (Bezuidenhout, 2016). According to the
statement reported by the South African Country Review of Collective Bargaining

- 10 -
(2010/2011, p. 34), the average annual compensation for a CEO was R10 227 997 in 2010.
According to a rough calculation, a low-salaried employee would have to work 255 years to
earn this R10 million, and raises the question of whether the CEO’s performance is worth the
high remuneration s/he receives from the company. The relationship between executive
remuneration and returns to shareholders is, therefore, a crucial task for South
African economists.
The international common index for measuring income inequality is the Gini coefficient. The
range of the Gini coefficient is from 0 to 1; a higher index indicating more income inequality,
with 0.4 being perceived as the warning cordon (Fu, 2018, see Appendix A for the English
translation). By 2017, the Gini coefficient in China reached 0.467, which had increased by
0.5% in three years (Fu, 2018). According to Fu’s (2018) report, the personal disposable
income for the top 20% of households in China, was nearly equal to the total personal
disposable income of the other 80% in 2016 (see Figure 1.1). The income inequality issue,
and the rationality problem of director compensation, therefore, becomes a huge challenge for
the Chinese economy.
Figure 1.1: Personal disposable income table in China
Resource: National Bureau of Statistics of China [NBoSoC] (2017).

- 11 -
From a rational perspective, three valuable contributions would be added to the research on
the correlation between executive compensation and shareholder value of the correlation
research. Firstly, unlike the research that was conducted by Western scholars, this current
study focusses on the CEO remuneration and performance conditions in the Chinese and
South African contexts (Kato, & Kubo, 2006). Secondly, the researcher offers reasonable
suggestions for the current CEO compensation structure in South Africa and China. Thirdly,
in the context of developing countries, China and South Africa represent two different
systems; therefore, in this current study, the researcher presents a concept for other
developing countries with the same requirements and situations as China, or South Africa.
1.8. Ethics considerations
The source of the data required in this current study are public disclosure documents in the
annual reports of the banking sector; therefore, usage permission of the data was not required.
The researcher explored CEOs’ salaries with shareholders’ value, but not of any specific
executive. In addition, the researcher would not falsify the information and data collected
from annual reports and other resources.
1.9. Limitations of the Study
This paper has a number of limitations related to the usage of data, research objects and
theoretical perspectives. Firstly, the researcher focusses on the 10 selected holding banks in
South Africa and China. Therefore, the other state-owned banks, private banks, and
companies from other sectors, are not discussed in this current study.
Secondly, because of time constraints, the researcher only chose four firm performance
indicators, to measure the correlation between CEO remuneration and returns to shareholders,
which is not comprehensive enough. In addition, CEO compensation might be influenced by,
not only firm performance, but also other elements, for example, CEO age and gender, which
is another limitation of this current study.

- 12 -
Thirdly, the researcher focusses on the highest paid CEO in each bank. Consequently, the
remuneration for other executives are not analysed. Additionally, the remuneration package
could include many elements; however, in this current study, the researcher only considers
the fixed salaries, pensions, perquisites, bonuses, and employee benefits, paid to directors.
1.10. Structure of the Study
This current study is divided into six chapters.
Chapter 1: Comprises the introduction, motivation and background of the research.
Chapter 2: The researcher enumerates previous literature, relevant to CEO compensation.
Chapter 3: The methodology and variables in the study are described.
Chapter 4: The researcher presents the research results.
Chapter 5: The results of this current study and previous researches are discussed.
Chapter 6: The researcher provides recommendations and concludes this thesis.
1.11. Summary
Over the past two decades, the CEO remuneration problem has been a protracted topic for all
stakeholders involved. Given the economic situation in South Africa and China, it is
reasonable to readdress this topic. Since the 1990s, executive compensation has increased
substantially, accompanied by not only the higher market value of companies, but also poor
company performance and collapse (Bezuidenhout, 2016). In this current study, the
researcher explores and analyses whether the CEO compensation is related to the returns to
shareholders (represented by company performance indicators). In this current research, the
CEO compensation consists of fixed salaries, pensions, perquisites, bonuses, and employee
benefits paid to directors. Performance indicators Return on Equity (ROE), Return on Asset
(ROA), Total shareholder return (TSR), and Net Operating Profit After Tax (NOPAT) are
used as variables to analyse company performance. The researcher assumes that the

- 13 -
correlation between CEO pay and these four performance variables are not slightly positively
related. In the following chapter, the researcher discusses CEO compensation and related
topics, by reviewing existing literature.

- 14 -
CHAPTER TWO
LITERATURE REVIEW
2.1. Introduction
In Chapter Two, the researcher aims to provide a better understanding of the correlation
between the CEO’s compensation and returns to the shareholders, by conducting a complete
literature review of related existing literature, in this current economic and management
science research study. This topic of the correlation between the CEO’s salary and returns to
the shareholders, is a controversial one, which has been explored, previously, by many
international researchers (Shaw, 2011). However, in this current study, the researcher aims to
conduct a further analysis regarding the directors’ compensation problem, by comparing the
South African banking sector to that of the Chinese.
The literature review is conducted in three phases. In the first phase, the researcher discusses
the review of the role of the CEO, as well as the social responsibilities of the CEO and
corporations. In the second phase, the researcher discusses the income inequality problem, as
well as other problems associated with the CEO emolument. In the third phase, the researcher
includes previous discussions on the pay-for-performance perspective, explored by other
researchers, and subsequently, focuses on the study of South Africa and China.
2.2. Role of the CEO
Lambrechts (1992) informs that, previously, the capital provider was the manager, as well as
the owner of the enterprise; however, in 1870, it was determined that the separation between
ownership and control of companies, could promote the development of companies better, as
hiring specialized agents to manage the company was more efficient and professional.
Consequently, the chief executive officer emerged, as the executive manager, authorized by
the board of directors of corporations, with the mission to lead corporations and achieve the

- 15 -
corporate performance expectations; therefore, the CEO, ultimately, is held responsible for
the profits of corporations (Shaw, 2011).
A CEO’s job is highly sophisticated (Core & Guay, 2010). Andrews (1980) posits that a CEO
is a designer of organizational intention, a company leader, as well as a personal leader. In
addition, the CEO must ensure that the management activities of the organization are
reasonable, by offering strategic direction and leadership in its enforcement (Andrews, 1980).
Ultimately, the CEO should have the capacity to make significant company decisions,
manage the company operations, plan the assets reasonably, act as a communication hub
between board and company operations, and be the face of the enterprise (Kenton, 2019).
Kotter (2001) adds that the personal charisma and vision of a CEO are also important.
The leadership role, as one of the most significant roles of CEOs, could affect all other roles
of an enterprise (Glick, 2013). Using an airline pilot metaphor, CEOs are like aviators,
driving through a rainstorm; even though they know how difficult it will be, they should
realise that their passengers (employees) are on the same airplane with them, and are waiting
for the good news over the intercom (Ayaba, 2012). Therefore, one of the major functions of
a leader is being able to motivate people (Farkas & Wetlaufer, 1996), which concurs with
Kotter (2001) opinion that leadership requires charisma and vision.
Currently, CEOs must possess professional management knowledge, abundant experience,
and creativity, to be able to contend with, or adapt to the increasingly fierce market
competition (Chen, Zhang, Xiao, & Li, 2011). To be an effective strategic planner, the CEO
must balance the orientation of both the chief and executive. As a chief, the orientation of a
CEO is operational, because the CEO must become the tactical planner and the decision
maker of the company; however, as an executive, the mission of the CEO is to mold the
enterprise atmosphere, as well as set up frameworks and processes, while focusing on
strategic issues (Leidecker, Bruno, & Yanow, 1988).

- 16 -
Xiao (2004) asserts that a CEO with good execution is more important for the success of the
enterprise, than the strategy of the enterprise itself. As the captain of the organization, the
chief executive has significant effects on the performance of the organization (Bezuidenhout,
2016). According to Bezuidenhout (2016), this is considered the reason for the substantial
escalation in CEO compensation over the last two decades. In addition, as early as 1998,
Finkelstein and Boyd (1998) reported in their study that CEOs, with a significant potential
effect on the gains and losses of companies, will be paid higher remuneration packages, and
so they should be. Besides, the CEO’s influence and authority far surpasses that of other
executives, as the decisions of CEOs could affect, not merely one unit, but the whole
enterprise (Hambrick & Quigley, 2014).
Mascarenhas (2009) raises eight key accountabilities for CEOs of major corporations,
especially transnational corporations. These eight key accountabilities includes, developing
growth channels, increasing productivity, competing for talent, managing risks, strengthening
corporate governance, combining sustainability, creating innovation models, and building
new infrastructure. Shaw (2011) concurs that the study of Mascarenhas has widespread
applicability, as it not only applies to major corporations, but could also be applied to middle
and small-sized enterprises. Therefore, individuals who aim to satisfy all the above
accountabilities, simultaneously, must be well-educated and skilled. Such talent, is infrequent;
therefore, Kim, Kogut, and Yang (2013) suggest that shareholders and enterprises need to
reward CEOs properly, to attract and retain them.
2.3. The CEO and Corporate Social Responsibility (CSR)
Lin (2013) asserts that CEOs manage firms that could affect every sector and every industry
on earth; consequently, by implication, CEOs run the world. Therefore, the role of CEOs and
corporations in society is important. The activities of the CEO, as well as the strategies of the
corporation, could have direct impacts on the world. A failed CEO could destroy the whole
company, thereby affecting the entire society, for example, after the collapse of Enron and

- 17 -
WorldCom, people became aware of the significance of CEOs and enterprises in society
(Singh & Agarwal, 2003). Therefore, corporate social responsibility (CSR) has become
another popular topic in the recent decade.
To participate in CSR implies that, generally, corporations operate in a manner that promotes
society and the environment, instead of negatively affecting them (Chen, 2020). In addition,
as the leader and the face of a corporation, the CEO should bear the responsibility of CSR
planner and executant (Hohnen & Potts, 2007). The concept of CSR is wide, as different
businesses and industries could adopt a different form of corporate social responsibility.
However, through corporate social responsibility programmes, charitable causes, and
volunteer efforts, enterprises could, not only benefit the society, but also enhance the
corporate brand image (Chen, 2020). In addition, Chen (2020) presupposes that corporate
social responsibility activities could create a stronger bond between employees and CEOs,
enhance morale, and help employees, as well as CEOs feel more connected to their
immediate environment.
Kotler and Lee (2008) propose six key types of corporate social responsibility in their study,
namely:
• Enterprise charity: enterprise contributes to philanthropy, including cash, materials,
and services;
• Volunteer efforts: enterprise-organized community volunteer efforts;
• Socially responsible business practices: ethically manufacture goods that appeal to a
customer segment;
• Cause promotions and activism: company donated publicity campaign;
• Cause-related marketing: charitable donations based on products sales;
• Corporate social marketing: enterprise-funded behavior-change campaigns.

- 18 -
Generally, a company does not have any profit motives when participating in Enterprise
charity and Volunteer efforts; however, some corporate social initiatives might have a dual
purpose of societal interest and profit motive (Organ, 2017). An enterprise that understands
social responsibility, firstly needs to take responsibility for itself and its shareholders. Usually,
an enterprise that becomes involved in CSR programmes, has grown to a stage, where it feels
obliged to give back to society; therefore, CSR, basically, is a strategy of major corporations.
Besides, the more prosperous the corporation, the greater its accountability to set standards of
ethical behaviour for its peers, rivals, and industry (Chen, 2020).
In the recent two decades, the relationship between corporate social responsibility and CEO’s
remuneration, has gained more and more attention and emphasis (Rekker, Benson, & Faff
2014). Wells (2002) refers to a business debate on whether to adopt social responsibility, or
create more financial returns for shareholders; in fact, some researchers think there is a
divergence of the two. The question that emerges is whether a higher engagement in social
responsibility would reduce financial returns for shareholders, and influence CEO
remunerations. Margolis and Elfenbein (2008) answers this question with a definite no. The
findings of their research reveals that only two percent of articles find negative
relationships between corporate social responsibility and returns to shareholders, as they
conclude that there are situations in which corporate social responsibility projects, in fact,
enhance company performance (Margolis & Elfenbein, 2008). Additionally, as early as 1997,
research conducted by Russo and Fouts (1997) reported that a company with a good social
responsibility atmosphere, positively influences on its technology, fame, as well as
employees, which could create more returns for shareholders.
Graafland, Kaptein, and Mazereeuw-van der Duijn Schouten (2010) assert that CSR could
reach the optimal level, if a CEO is strategically motivated, implying thereby that CEOs
should seek to raise corporate social responsibility activity, and create financial returns for
the shareholders. Naturally, it is assumed that growth in the financial performance for

- 19 -
shareholders, therefore, would enhance the CEO’s remuneration.
2.4. Executive Remuneration
Consequently, based on the information in the previous section, it is evident that CEOs offer
their skills to companies, to create value for shareholders, and in exchange, the
company/shareholders tender a salary as reward to CEOs, referred to as remuneration. Bussin
(2012) defines executive remuneration as the fixed pay, short term incentives (STIs), long
term incentives (LTIs), and related benefits awards to those, who occupy the most senior
decision-making position in public and private sector companies. In this section, the history
of remuneration problems are discussed.
2.4.1. Origins and nature of executive remuneration
Research on executive remuneration has a long history (Finkelstein & Boyd, 1998). As
a way of rewarding executives, the concept of executive remuneration could be traced
back to the 1930s (Shaw 2011). In 1932, Adolf Berle and Gardiner Means published a
widely praised book entitled, The Modern Corporation and Private Property, which
introduced issues of management responsibility, stemming from the separation of
ownership and control (Berle, & Means, 1932). The work of Berle and Means (1932)
originated from the path breaking work on the effect of management power, and the
incapacity of shareholders to control the enterprise (Bratton, 2001). In addition, the
contribution has been identified by Berle and Means as a foundation for the principle
agent theory. The executive contribution has been described as the fixed pay, short term
incentives (STIs), long term incentives (LTIs), and related benefits awards that are paid
to CEOs, and other senior executives of a company (Bussin, 2012).
Shaw (2011) states that the first discussions regarding the executive remuneration, in
the context of the modern enterprise, have widely been attributed to Chester Barnard’s
book, entitled, The functions of the executive (Barnard, 1968). In this path breaking

- 20 -
book, Chester Barnard highlights that the financial rewards are a key factor in
stimulating individuals to afford their discretionary effort (Barnard, 1968). In addition,
Barnard (1968) indicates that, in a variety of organizations, the allocation of suitable
rewards becomes the demonstrably emphasized task in their existence.
2.4.2. Issues in executive remuneration
As the topic of executive remuneration became more and more conspicuous, issues
created by executive remunerations, gradually appeared (Surve, 2008). Although,
discussions on executive remuneration appeared to be controversial for a while, a few
key issues recently attracted some attention, for example, remuneration inequality, as
well as unreasonable remuneration problems (Keeley, 2015).
2.4.2.1. Remuneration Inequality
Remuneration inequality (Income inequality) is a type of economic inequality that
could be described as, a small proportion of the populace, appropriates a large
proportion of the income (Kopp, 2020). The findings of a research study
conducted by Keeley (2015) revealed that many citizens, both rich and poor,
complained about income inequality affecting the social environment, negatively.
Therefore, Keeley (2015) propounds two strands of disadvantages about the
inequality. The first strand is that the inequality could diminish social mobility,
and increase the difficulty of climbing up the economic ladder. The other strand is
that inequality could affect people’s health and happiness.
The income ratio of the top 20 percent, to the bottom 80%, escalated rapidly,
from three to one in 1820, to eighty-six to one in 1991 (Hunt, 2004). Additionally,
the income inequality propensity has intensified after the 2008 financial crisis. A
research conducted by the American Economic Policy Institute reported that the
income ratio of the top 1 percent grew faster than the other 99 percent in the
United States of America, between 2009 and 2015 (Kopp, 2020). The Los

- 21 -
Angeles Times (Puzzanghera, 2014) reported that the richest 1 percent owns 46
percent of the world’s total fortune, and the total wealth of the top 85 billionaires
in the world, equals the total wealth of the bottom 50 percent of the world.
Economists found the wealth of the top 1 percent of the richest people in the
world grew by 28% in 1980, to 33% in 2016, while the wealth for the bottom 75
percent of people remained the same at 10 percent (Alvaredo, Chancel, Piketty,
Saez, & Zucman 2018). The world inequality report detailed that the income
inequality has caused some individual groups to become richer, while the
government and national economy has become poorer. (Alvaredo et al., 2018).
Additionally, the income inequality problem has become more apparent in
enterprises. According to the analysis of Standard & Poor’s 500-stock index
(Campbell, 2019), the remuneration of CEOs were nearly 300 times higher than
ordinary employees worldwide. However, Firth, Leung, Rui, and Na (2015) assert
that the average CEO’s compensation in Shanghai and Shenzhen, China, was only
6 times greater than their employees in 2015, and the ratio reveals an escalating
trend. Additionally, Bezuidenhout (2016) asserts that, in South Africa, CEOs earn
even more than 400 times the wages of an ordinary employee.
Vieito (2012) reports that the huge income gap is not only between the CEO and
ordinary employees, but also between the CEO and the Vice-President (VP) of an
enterprise. Regarding the Tournament Theory, proposed by Edward Lazear and
Sherwin Rosen (1981), the big remuneration gap between the CEO and the Vice-
President would promote the Vice-President’s instinct of competition, to strive for
the CEO’s position in the future, which competition will lead to an increase in
firm performance. However, the Behavioral Theory suggests that a smaller
remuneration gap between the CEO and the Vice-President could increase
cooperation and harmony between them, while the financial performance for

- 22 -
shareholders could be higher (Vieito 2012). Damilola (2020) asserts that the
increase of the director’s salary could help to improve the company’s
performance; however, it could generate negative reactions, if the remuneration
gap is too great. Plato believes that, in an ideal society, the richest should not earn
more than fivefold the income of the poorest (Damilola, 2020).
Lin and Lu (2009) observed that previous research conducted, by using ordinary
least squares (OLS) regression, proved that the income gap could motivate CEOs
to create more value for shareholders and enterprises; however, they also
determined that the findings of previous research were not complete.
Consequently, Lin and Lu (2009) used simultaneous regression and observed that
the effect created by the remuneration gap was higher in companies with high
operation ability.
2.4.2.2. Unreasonable remuneration
The perception exists that a high remuneration could influence CEOs to make
performance-maximizing decisions, since CEOs would want to retain their
position in enterprises (Core, Holthausen, & Larcker, 1999). However,
Tamasiunaite (2016) insinuates that shareholders do not know whether the CEO’s
decisions are the best, as a CEO, with a high remuneration package, could also be
seeking personal benefits, and concealing this fact with relatively profitable
company performances, without the shareholders’ knowledge.
Core, Holthausen, and Larker (1999) used 205 publicly traded American firms
during the period of 1982 to 1984, as variables, and observed that excessive
remuneration has a direct negative influence on company performance.
Kirkpatrick (2009) posits that, even though the risk of excessive CEO
compensation has been noted in academia, these problems are not widely
discussed and analysed.

- 23 -
It seems inconceivable that CEOs would concede publicly that they are being
overpaid; however, the discussion about CEO executive compensation has been
intensifying for some time (Bezuidenhout, 2016). A study, published by Forbes,
revealed that, in 1986, the top 10 highest remunerated CEOs in America earned
USD$ 57.88 million, on aggregate. This value has increased 10-fold in 26 years,
as the total remunerations for the top 10 CEOs was USD$616.4 million in 2012
(Sforza, 2013).
Bussin (2012) raises the question of whether the remuneration paid to CEOs are
warranted. Kim, Kogut, and Yang (2013) state that an individual, who wishes to
become a CEO, should have rare capabilities and be erudite, as such a talent
would obtain a proper reward from the enterprise. However, being properly
rewarded and receiving an excessive salary are two different concepts.
Hayes and Schaefer (2009) propose that the reason for the rapid increase in CEO
remuneration could be the Lake Wobegon Effect. Van Vugt (2013) describes the
Lake Wobegon Effect as the trend of individuals to overestimate their abilities, in
relation to those of others. Theunissen (2012) concurs that the Lake Wobegon
Effect is the reason for the surge in CEOs’ salaries. Hayes and Schaefer (2009)
add that no enterprise wants to acknowledge that it is managed by an incapable
CEO, so each enterprise wants to peg their CEO’s salary at higher level than the
median pay level of comparable enterprises. Therefore, when a company’s CEO
receives an increase, their competing company would increase the salary for their
CEO as well, without taking his/her performance into account (Hayes & Schaefer,
2009). The influence of the Lake Wobegon Effect is an endless bandwagon effect,
with enterprises increasing their CEO’s salary ever higher, without considering
their situations, and financial performance (Theunissen, 2012).

- 24 -
2.5. Pay-Performance
As mentioned previously, the topic of the correlation between CEO compensation and returns
to shareholders has intrigued academics and the media alike. Murphy (1985) was one of the
first researchers to display interest in the Pay-performance topic. Murphy analysed 501
managers from 72 enterprises, and observed that fixed pay, STIs and the CEO’s total
compensations are related positively to growth in sales, as well as the total shareholders’
returns. According to Shaw (2011), pay and performance sensitivity refers to the pertinence
between the executives’ compensations and the measures of returns for shareholders. In
addition, there is not only one measurement index, as instead, the term refers to a wide set of
variables (Shaw, 2011). In this section, the researcher aims to provide a brief review of
previous researches on the topic of pay and performance, and illustrate the major variables
that are used as measures of remuneration and returns. Subsequently, the researcher
generalizes the results of the nature of the correlation between remuneration and
performance.
2.5.1. Structure and components of executive pay
As a strategic tool, the executive compensation packages have been used widely by the
labour market to attract, retain, and motivate, outstanding talent (Bezuidenhout, 2016).
According to Bezuidenhout (2016), the executive compensation structure is the
relationship between fixed salary and the performance-based, variable components of
benefit. Bezuidenhout (2016) adds that the elements of the executives’ compensation
packages depend on the agreement between the executives and the board, as well as
corporate governance. He states that the components of executive pay are diverse, and
each component has its own effect on the total emolument that the CEO will receive
(Bezuidenhout, 2016).
The findings of a study conducted by Murphy (1998) revealed that the CEO’s
remuneration package usually comprised four elements, namely, base wages (fixed pay),

- 25 -
premiums tied to accounting profit, share options, and long term incentives. One year
after Murphy’s study, Abowd and Kaplan (1999) published a research article, in which
they considered the implications of Murphy’s article, and concluded that the
remuneration package should constitute the following four elements: salary, annual
bonus, benefits, and long term compensation.
Bussin (2012) describes executive pay packages as the combination of a fixed salary
and variable pay, as the four elements in his study are fixed pay, short term incentives,
long term incentives, and other benefits. According to Bezuidenhout (2016), the fixed
portion is the confirmed monthly, or annual salary, which is not influenced by
performance; however, the variable portion is floating, dependent on the results of
various measures of the enterprise performance.
WorldatWork (2015), the largest non-profit professional union in the USA devoted to
leadership in reward management, deemed that compensation is a single component in
the total rewards mix, which could be used as a company’s strategy to retain and
engage employees. The framework of the total rewards is made up of six basic
components, namely:
• Remuneration (compensation): pay provided by enterprises to its employees for
labour force rendered, and includes fixed, as well as variable pay tied to
performance levels;
• Benefits: programmes are used by enterprises to supplement the cash salary
employees receive. These health, income protection, and retirement
programmes provide security for employees and their families;
• Work-life effectiveness: a concept that could help employees to achieve success
at the company, as well as at home, including a specific set of organizational
practices, policies, and programmes;

- 26 -
• Recognition: either formal or informal, which acknowledges or pays special
attention to employee actions or performances, and supports the business
strategy by reinforcing behaviours that contribute to organizational success;
• Performance management: the alignment of organizational, group and
employees efforts, to achieve the business goals. Performance management
includes establishing expectations, skill demonstration, assessment, feedback,
and continuous improvement;
• Talent development: provides the opportunity and tools for employees to
advance their skills and competencies in their short- and long-term careers.
As one of the many benefits that enterprises offer employees, WorldatWork (2015)
maintains that remuneration has the power to attract, retain, and motivate employees.
The rewards model is affected by the culture and characteristics of the organization, as
well as its impact on employees and the organization, as a whole (WorldatWork, 2015).
A graphic representation of the Total Rewards Model is depicted in Figure 2.1.
Figure 2.1: Total Rewards Model
Resource: WorldatWork (2015)

- 27 -
A study conducted by Bender and Moir (2006) observed that the trend of executive
remunerations in Britain is as follows:
• Market benchmarks that determine remuneration and bonus levels.
• High levels of remuneration, which are related to performance.
• A desire for executives to hold equity in their businesses.
• Disclosure of total shareholder returns, compared to an index.
• A perceived need for accordance, in order to legitimize policies.
Huang (2010) indicates that the structure of executive compensation is very
complicated, and it is important to understand the special constitution of executive
remuneration packages, before discussing whether the CEO is overpaid. Frydman and
Jenter (2010) add that the relative importance of pay factors, to the CEO and the
enterprise alike, however, has changed significantly over time. Evidently, most of the
studies exclude the component of share options, as, when the researchers attempted to
gather information on share options from their samples, many had a similar lack of
information problem.
2.5.2. Shareholder value and the company’s performance
The concept of shareholders’ value has been used continually in the analysis of the
correlation between salary outcomes and the measures of the firms’ performance (Shaw,
2011). In a research article by Backdoor, Bequest, Milbourn and Thakur (1997), the
authors assert that the measures of company performance, used in the design of
executive compensation plans, should be aligned with the varying in the shareholder’
wealth, and should not be influenced by the internal factors of a company’s share price.
According to Murphy (1985), both the total shareholder return and growth in sales
should be used as indicators to measure the firms’ performance. Murphy (1998) adds

- 28 -
that executives’ wealth should be linked directly to the shareholders’ goal, namely,
creating shareholder wealth through share options and shareholding. In addition, it
should be indirectly linked to the share price performance, through accounting-based
bonuses, as well as in the year-to-year adjustments in salary. Murphy (1998), therefore,
added two shareholder value measures, namely, the rate of return realized by
shareholders, and the rate of return on the common share (excluding share issues and
repurchases).
Besides the studies conducted by Murphy, many research studies conducted by other
scholars also provided and used several indicators that could measure the maximization
of the company’s performance and shareholders’ returns. Abowd (1990) is one of the
earliest researchers, who used ROA and ROE as the performance variables to determine
the effects of performance-based remuneration on the firms’ performance. Pinto, Henry,
Robinson, Stowe, and Wilcox (2020) also used ROE and ROA in their research, and
illustrated that ROE measures the percentage return, based on the money provided by
the owner, which differs from ROA, which measures the percentage return, based on
the money provided by both shareholders and creditors. In addition, Bhagat and Bolton
(2008) used ROA as a firm performance variable in their study, while Theunissen and
Oberholzer (2013) used ROE as a performance variable in their research, to measure a
South African firms’ performance.
TSR is another popular measure for the topic of pay-performance. Jensen and Murphy
(1990) used TSR as the variable to verify the correlation between performance pay and
management incentives. Dalton and Aguinis (2013) concur that TSR is an excellent
indicator, as it can connect to shareholders directly. A research article by Coombs and
Gilley (2005) considers TSR, company size, and ROA, as measures of company
performance, while stakeholder management is used to predict executive remuneration,
and its influence on returns for shareholders. Ericson (2011), Farmer, Archbold, and

- 29 -
Alexandrou (2013), as well as Haynes, Campbell, and Hitt (2014), all use TSR as the
measure of financial performance.
Additionally, Fernandez (2001) uses NOPAT to measure the shareholder value creation
in his study. Weaver (2001) defines NOPAT as profits before interest and taxes, less
Invested Capital (IC) and taxes, as total assets. Goldberg and Godwin (2001) also used
NOPAT in their research, and described it as the cash generated by company operations.
Various researchers have different standpoints regarding the significance and necessity
of the same company performance measure (Bezuidenhout, 2016). Tosi, Werner, Katz,
& Gomez-Mejia (2000) provide six indicators that measure company performance,
namely: absolute financial performance levels; changes in financial levels; share
performance; ROE; ROA; and internal performance indicators. However, the findings
of a South African study, conducted by Scholtz and Smit (2012), reveal that the share
price, sales turnover, earnings before interest, tax depreciation and amortization, and
total assets, are infrequently used indicators in studies of the relationship between
executive pay and firm performance.
In conclusion, there is not one specific, or constant measure of firm performance, but
instead, a combination of, or range of, various and peculiar performance measures. It is
not necessary for researchers to use the same measures as others. Ultimately,
researchers should choose their own combination of measures that is suitable for their
own study.
2.6. The CEO compensation in South Africa and China
The literature regarding the CEOs’ and executives’ compensation is particularly limited in the
South Africa context (Shaw, 2011). However, Crotty and Bonorchis (2006) explore the level
of CEO pay in the South African context, and even uncovered some of the executive

- 30 -
remuneration problems for South African companies in their book. In addition, Du and Choi
(2010) argue that, even though only a few studies on performance-related executive pay have
been conducted in China, the results were surprising, as employee reaction to the
performance-related executive pay was extremely positive.
It is worth noting that the executive remuneration problems, which Crotty and Bonorchis
(2006) identified in their book, is caused by the South African context, as in such an unequal
society, the salary gap would definitely be a challenging dilemma. They illustrate this kind of
inequality by using the Gini coefficient, a measure of inequality in society, indicating that
South Africa has one of the greatest inequality scores in the world (Crotty & Bonorchis,
2006). Fu (2018) also used the Gini coefficient in his study, and states that the Gini
coefficient score of China had already exceeded the warning cordon in 2017.
In 2016, the income of the top 20% of Chinese citizens was nearly equal to the sum of the
other 80% (Fu, 2018). In South Africa, the difference in the executive’s and the employee’s
salary was 120 times in 2009; however, it has increased sharply to over 140 times in 2013
(Bezuidenhout, 2016). Collier, Idensohn, and Adkins (2010, p. 84) indicate that, based on the
wage gap between the rich and poor, South Africa continues to remain one of the most
unequal countries; consequently, the rationality of the executive’s salary must highlighted in
South Africa. Additionally, Fu (2018) proposes that the income inequality issue and the
rationality problem of director compensation, should become a critical discourse in the
Chinese economy.
To overcome the above problems, both the Chinese and South African governments have
implemented relevant measures. The South African government established the Committee of
Corporate to regulate corporations and executives (Collier et al., 2010). In addition, the King
code has been used to drive the governance of executive compensation (Collier et al., 2010).
The code has already evolved into a comprehensive framework in the third edition [King III

- 31 -
report] (Collier et al., 2010). The King IV report has proposed that the remuneration and
performance-related elements should be disclosed by companies, as well as that the
accountability of executive directors to shareholders could be promoted, by approving the
compensation policy (King Committee on Corporate Governance & King, 2016).
The Chinese Ministry of Finance enacted a remuneration governance notification for
state-owned businesses in 2009, the starting point of which is, establishing a Performance
Appraisal System (PAS), to determine whether the CEO remuneration adjustments abide by
the annual foundation levels (Lin & Zhang, 2009). The financial industry, the PAS pilot
project, has been updated through a range of articles of association, and detailed regulations
for bank performance evaluation, by the Chinese Ministry of Finance at the end of 2009 (Lin
& Zhang, 2009).
2.7. Chapter summary
The review of the literature focused on the role of CEOs, the executive compensation
principles, as well as the social responsibility that CEOs and corporations should demonstrate
in society. Subsequently, the researcher discusses the origin and nature of executives’
remuneration, as well as the remuneration inequality, and the CEO being overpaid problems.
Additionally, in this chapter, the researcher presented a discussion on the components of
remuneration, as well as performance measures, and the CEO compensation problems in
South Africa and China.
In Chapter Three, the focus is on the methodology used by the researcher in this current
research. The sampling, data collection, and analysis processes, as well as the variables used,
are discussed.

- 32 -
CHAPTER THREE
RESEARCH METHODOLOGY
3.1. Introduction
In this chapter, the researcher discusses the research methodology followed, to ascertain
whether there is a relation between CEO remuneration and returns to shareholders. The
research problem, questions, and purpose of this current research are reiterated in this chapter,
to assist in discussing the sampling selection, variables used, the data collecting process, as
well as the analysis of the variables. The data related to abnormal conditions and hypotheses
are discussed in this chapter, as well.
3.2. Overview of past research data and methodologies
The data-collection and methodologies from previous research papers are discussed in this
section to provide a general overview of this topic. One of the first studies on executive
compensation was written by Murphy (1986), in which he used a quantitative approach,
claiming that executive compensation is statistically linked to the firm performance
(shareholder returns and growth in sales), by analysing many samples of publicly held
companies in the USA. In a similar study, conducted in the Asian market, Hassan and Theo
(2003) used a sample of 100 listed companies, during the years 1996 to 1998, and concluded
that there is a positive, but weak, relationship between the executives’ remuneration and
returns to shareholders. In addition, they observed that, although the firms’ financial
performance had worsened, the executive’s compensation had continued to rise. A study
conducted by Gregg, Jewell, and Tonks (2005) also determined a positive, but weak
relationship between executives’ compensation and returns to shareholders, by analysing the
company data over the period of 1994 to 2002.
According to a study in the UK, the link between higher-performing companies and director’s

- 33 -
compensation are stronger, than with poor-performing companies (Stathopoulos, Espenlaub,
& Walker 2005). Girma, Thomson, and Wright (2007) adopted total remuneration without
share options as their dependent variable, and, using the regression analysis, observed a weak
relationship between director salary and returns to shareholders. However, Eichholtz, Kok,
and Otten (2008), employing an elasticity approach, observed a strong link between
executives’ compensation and returns to shareholders, while using the scale of a company as
a variable.
In Australia, Merhebi, Pattenden, Swan, and Zhou (2006) examined 722 domestic enterprises
from 1990 to 1999, using the Total value, Market value, RTS (return on stock), ROA, and
ROE, as variables, and observed that the CEO’s remuneration was dependent on the
enterprise/firm performance, as well as the scale of the company. There was a significant
positive link between the executives’ salary and returns to shareholders, and a strong, positive
correlation between the executives’ remuneration and the corporate size (Merhebi et al.,
2006). Clarkson, Walker, and Nicholls (2011) also found a positive link between the
executive’s remuneration and the Australian company performance. Another Australian paper,
written by Doucouliagos, Haman, and Askary (2007), highlighted that the correlation
between the directors’ salary and the shareholders’ value in the Australian banks, could also
be influenced by the scale of the bank (positive association), lagged values of executives’ pay
(positive association), age of the executives (positive association), and the specific bank
effects. In addition, they observed that the directors’ remuneration is correlated to the
enterprise performance, in the long term (Doucouliagos et al., 2007).
In an analysis article about China, Zhou, Georgakopoulos, Sotiropoulos, and Vasileiou (2011)
assessed a panel of Chinese banks from 2001 to 2009, and observed that there was a
significant relationship between CEO remuneration and ROE, as well as the performance of
non-performing loan ratios. In addition, there was no relationship observed between the
director’s income and bank performance; however, they determined that government

- 34 -
intervention could narrow the pay-performance sensitivity. Consequently, they concluded that
government interference was necessary to balance the equilibrium between CEO
remuneration and the value they created for shareholders.
The findings of a recent study, conducted by Scholtz & Smit (2012), using a quantitative
approach, as well as time-series, and cross-sectional regression, revealed that there was a
strong relationship between directors’ compensation and total assets, as well as turnover and
the share price of a company. By analysing the companies listed on the Alternative Exchange
in South Africa, between 2003 and 2010, they observed that the strong relationship remained
during the financial crisis period, regardless of the performance of the share price. A study
conducted by Naik (2016) examined the correlation between CEO income and returns to
shareholders, by using a sample of 49 JSE listed firms during 2014, with a total of 708
directors. The findings of the study revealed a weak correlation between income and
performance; however, he also observed that the regression analysis revealed evidence of a
significant positive relationship between the CEO compensation and total assets (Naik, 2016).
The study findings also highlighted that male directors, aged over 50, with six to ten years of
executive working experiences, attracted a higher amount of compensation, compared to
other directors (Naik, 2016). In the same year, Priem (2016) published a thesis about CEO
compensation and total shareholder returns in South Africa, and used Return on Equity,
Return on Asset, Tobin’s Q, Economic value added, and Total Shareholder Return, as
indicators to evaluate the firm performance. Priem (2016) concluded that good firm
performance had proven the reasonability of the director compensation, and according to his
research, the CEO’s annual percentage salary increases were much lower than the percentage
returns increases to the shareholder.
3.3. Research Objectives
The purpose of this current study was to ascertain whether the CEO income and returns to
shareholders had a correlation, and was justified, as well as to evaluate whether the

- 35 -
performance of companies and income inequality could be improved by adjusting CEO
remunerations. The researcher explores the answer by analysing South African and Chinese
holding banks, to facilitate a better understanding of the correlation between directors’
compensation and the financial performance of firms. Specific objectives of the main
research objective are as follows:
• To ascertain whether there was a relationship between directors’ compensation and
shareholders’ value in the Chinese and South Africa holding bank sector for the period
2007 to 2018;
• To conduct an analysis of the variation tendency of the relationship between directors’
compensation and shareholders’ value in the Chinese and South Africa bank sector for
the period 2007 to 2018;
• To inquire about the difference of the variation tendency about the relationship
between directors’ compensation and shareholders’ value in the Chinese and South
Africa bank sector, during the global financial crisis period (2007 to 2010), and the
period after the crisis (2010 to 2018);
• To investigate whether the financial predicament in the Chinese and South African
bank sector can be surmounted by adjusting the CEO compensation structure;
• To explore the income inequality problem and whether CEOs in the Chinese and
South African bank sector deserve the inflated salary they receive from the company.
3.3.1. The reason for comparing China and South Africa
China and South Africa are both developing countries, and part of the association of
five major emerging national economies, namely, Brazil, Russia, India, China, South
Africa [BRICS]. However, as the biggest mixed economy countries in Asia and Africa,
respectively, the political and economic systems in China and South Africa are quite
different. South Africa is currently facing an economic recession problem. South
Africa’s annual GDP growth rate indicates a falling trend, as the annual GDP growth
- 36 -
rate rapidly declined from 1.4% in 2017 to 0.8% in 2018 (Statistics South Africa
[StatsSA], 2018). At the same time, the Gini coefficient in China reached 0.467 in 2017,
which has increased by 0.5% in three years (Fu, 2018). Even though the Chinese
economy developed well in the past three decades, the drawback, which brought about
the income inequality, is becoming increasingly apparent (Fu, 2018).
3.3.2. Research Questions
The research questions emerged from the doubts that were expounded in Chapter Two.
As previously mentioned, CEO remuneration has always been a trending topic in
Western economies, and has concerned economists and the media in developed
countries, for a long time. However, unlike in Western economies, this topic has been
ignored in most developing countries (including South Africa and China). The research
questions directs the research in exploring the relationship between CEO remuneration
and shareholders’ value.
In addition, another question arises, regarding the poor performance of executives,
interrogating whether the CEOs in Chinese and South African holding banks deserve
the well-paid remuneration packages they receive from the shareholders. For this
research problem, the researcher reiterates the main research question that needs to be
addressed:
“Is there a relationship between CEO compensation and shareholders value for
the Chinese and South African banking industry?”
The following detailed questions and sub-questions will be used as a guide to the
research process.
Question 1
Is there a correlation between CEO compensation and shareholders value in the
banking sector of South Africa, for the period of 2007 to 2018?
- 37 -
• Sub-question 1.1: Is there a correlation between CEO remuneration and Return
on Equity in the South African banking industry, for the period 2007 to 2018?
• Sub-question 1.2: Is there a correlation between CEO remuneration and Return
on Asset in the South African banking industry, for the period 2007 to 2018?
• Sub-question 1.3: Is there a correlation between CEO remuneration and Total
shareholder return in the South African banking industry, for the period 2007 to
2018?
• Sub-question 1.4: Is there a correlation between CEO remuneration and Net
Operating Profit after Tax in the banking industry of South Africa, for the period
2007 to 2018?
Question 2
Is there a correlation between CEO remuneration and returns to shareholders for the
Chinese banking sector, for the period of 2007 to 2018?
• Sub-question 2.1: Is there a correlation between CEO remuneration and Return
on Equity in the Chinese banking industry, for the period 2007 to 2018?
• Sub-question 2.2: Is there a correlation between CEO remuneration and Return
on Asset in the Chinese banking industry, for the period 2007 to 2018?
• Sub-question 2.3: Is there a correlation between CEO remuneration and Total
shareholder return in the Chinese banking industry, for the period 2007 to 2018?
• Sub-question 2.4: Is there a correlation between CEO compensation and Net
Operating Profit after Tax in the Chinese banking industry, for the period 2007
to 2018?
Question 3
Did the relationship between CEO remuneration and returns to shareholders change,
over the period of 2007 to 2018?

- 38 -
• Sub-question 3.1: Did the relationship between CEO remuneration and returns
to shareholders change in the South African banking sector, over the period
2007 to 2018?
• Sub-question 3.2: Did the relationship between CEO remuneration and returns
to shareholders change in the Chinese banking sector, over the period 2007 to
2018?
Question 4
Does the strength of the relationship between CEO remuneration and returns to
shareholders transform before (2007), during (2008-2009), and after the global
financial crisis?
• Sub-question 4.1: The transformation of the correlation between CEO
compensation and returns to shareholders in the South African banking industry
before, during, and after the 2008 global financial crisis?
• Sub-question 4.2: The transformation of the correlation between CEO
compensation and returns to shareholders in the Chinese banking industry
before, during and after the 2008 global financial crisis?
Question 5
Can the companies from South Africa and China overcome their predicaments, by
adjusting the CEO compensation structure?
• Sub-question 5.1: How does a South African company overcome the
predicaments brought by the recession, in terms of adjusting the CEO
compensation structure?
• Sub-question 5.2: How do Chinese companies overcome the predicaments
brought by the big wealth gap, in terms of adjusting the CEO compensation
structure?

- 39 -
3.4. Research Approach
In this current study, the researcher adopts a longitudinal quantitative approach to ascertain
whether compensation aligns with firm performance. The quantitative approach allows the
researcher to determine the correlation of two or more variables, thereby, confirming the
authenticity of previous existing theories, or practices (Leedy & Ormrod, 2015). The research
is based on previous literature: therefore, the research approach is deductive. The timeframe
of the study is longitudinal; therefore, the research methodology is essentially archival, and
expeditionary. Relevant data were collected using a desk study and literature analysis, during
which the researcher gleaned secondary data from the disclosure of financial statements and
the financial network of the selected banks.
3.5. Target Population
A target population is an entire group of objects or individuals that share similar features
(Shaw, 2011). Researchers aim to generalize the conclusions through research on the target
population (Bezuidenhout, 2016). Bezuidenhout (2016) adds that a population has been
defined as the entire accumulation of factors that seek recommendations in the research.
The objective of this current study was to ascertain whether a correlation exists between
executive remuneration and firm performance in the South African and Chinese banking
sector. Therefore, the population for this current study was all the privately–owned banks in
South Africa and China that were listed on the JSE (Johannesburg Stock Exchange), SSE
(Shanghai Stock Exchange), or SZSE (Shenzhen Stock Exchange). Specifically, the target
population for this current study was holding banks, listed on the JSE, SSE, or SZSE.
The JSE founded in 1887 and is the largest, oldest stock exchange in Africa (Johannesburg
Stock Exchange [JSE], 2019). The JSE had an estimated 388 listed companies, with a market
capitalization of US$1.2 trillion in March 2018. At the end of 2018, the SSE had a total of
1450 listed companies, and was ranked the 4th largest stock exchange in the world, with a

- 40 -
market capitalization of US$5.5 trillion (Shanghai Stock Exchange [SSE], 2019). The
Shenzhen Stock Exchange [SZSE] was formed in 1990, and its market capitalization reached
US$2.285 trillion in 2015. At the end of June 2019, it ranked the 8th largest stock market in
the world, with a total of 2170 listed companies (Shenzhen Stock Exchange [SZSE], 2019).
3.6. Sample
A sample is a subset selected from a population through a specific procedure (Peck, Olsen, &
Devore, 2015). The investigation samples, used in this current study are five established,
privately-owned banks in South Africa, as well as 5 in China, for the period between 2007
and 2017. In this current research, a quantitative approach was adopted to ascertain whether
compensation aligns with firm performance. Relevant data were collected from the banks’
disclosed annual reports and financial statements. The five selected South Africa banks were
Capitec Bank, Standard Bank, Absa Bank, Nedbank, and First National Bank. The reason for
the choice of these specific five banks is that they are the most represented banks in South
Africa, and the directors’ remuneration problems at these banks are the most discussed topics
among investors and shareholders in the financial sector (McKenzie, Mfongeh, Mohamed,
Ncube, & Strauss, 2017). The selected Chinese Banks in this research were the China
Merchants Bank, China Minsheng Bank, China CITIC Bank, Industrial Bank, and Shanghai
Pudong Development Bank. The reason why the big five banks in China were not selected for
this current study is because the five biggest banks in China are all state-owned, and would
not represent the status of the whole industry, as an executive’s salary in a state-owned
company is controlled by the government; therefore, it is much lower than the salary in a
non-state-owned company in China. In addition, performance in a state-owned enterprise is
not only determined by the directors’ ability, but also by other factors, such as national
strategic planning (Chiu & Lewis, 2006).
3.6.1. The Ten Banks
All the banks’ data were collected from the information disclosed on the Banks’ official
websites.

- 41 -
3.6.1.1. The five South African Banks:
• Absa Bank: Founded in 1991, listed on the JSE on 31 July 2013. Absa is
one of Africa’s largest diversified financial services groups. The bank has
around 42 000 employees, across 12 countries in Africa (Absa Group
Limited [ABSA], 2019).
• Capitec Bank: Established in 2001, and listed on JSE in the following year.
Capitec has around 830 branches and over 13 333 employees. For the year
ended 28 February 2018, the shareholders’ fund of Capitec was R19
billion, and active clients were more than 10 million (Capitec Bank
Limited [Capitec], 2019).
• First National Bank (FNB): FNB is one of the oldest banks in South
Africa, formerly known as Eastern Province Bank, which was formed in
1838. The First Rand Group, established in 1998, listed on the JSE in the
same year. Currently, FNB is one of the big four commercial banks in
South Africa (First Rand Bank LTD, First National Bank [FNB], 2019).
• Nedbank: The Cape of Good Hope Bank was established in 1831, and was
the predecessor of Nedbank. Nedbank’s ordinary shares have been listed
on the JSE since 1969. According to the financial reports posted by
Nedbank, the total assets for Nedbank reached R1.1 trillion in 2019.
Nedbank has more than 30 500 employees, and 7.8 million clients over
the Africa continent (Nedbank Limited [Nedbank], 2019).
• Standard Bank: Standard Bank was a subsidiary bank of the British
overseas bank, Standard Bank. The bank was formed in 1862, in Port
Elizabeth, South Africa, and currently, has clients in over 20 countries on
the Africa continent. Standard Bank Group is the largest African banking
group by assets, with an approximately R277 billion market cap, as at 31
December 2019 (The Standard Bank of SA LTD [Standard Bank], 2019).

- 42 -
3.6.1.2. The five Chinese Bank:
• China Merchants Bank (CMB): Established in Shenzhen in 1987, listed in
2002. CMB is the first joint-stock commercial bank that is wholly owned
by legal persons’ enterprise in China, with the fifth-largest market value in
the Chinese banking sector (China Merchants Bank [CMB], 2019).
• China Minsheng Bank (CMBC): Established in 1996, listed in 2000.
CMBC is the first national commercial bank established by private capital
in China (China Minsheng Bank [CMBC], 2019).
• China CITIC Bank (CNCB): Established in 1979, listed on the Shanghai
Stock Exchange in 2007. It is the 7th largest bank in mainland China, with
1200 billion Hong Kong dollars in total assets and 16 000 employees
(China CITIC Bank [CNCB], 2019).
• China Industrial Bank (CIB): Established in 1988, listed in 2007, with
¥19.052 billion in registered capital. CIB ranked 213th on the American
Fortune 500 list in July 2019 (China Industrial Bank [CIB], 2019).
• Shanghai Pudong Development Bank (SPDB): Established in 1993, and
listed on the Shanghai Stock Exchange in the 1999. In 2018, SPDB ranked
the 70th on Forbes Top 2000 Global Enterprises, 25th on the Britain’s
Banker Top 1000 Global Banks, and 227th on the American Fortune 500
list (Shanghai Pudong Development Bank [SPDB], 2019).
3.7. Research Components
In this section, the researcher focuses on the components that will be discussed in this current
study. As previous research studies revealed, researchers generally used various measures to
analyse firm performance and directors’ compensation (Bezuidenhout, 2016; Bratton, 2001;
Bussin, 2011; Diamantopoulos, 2012; Shaw, 2011; Theunissen, 2012). In this current study,
the variables have been divided into two groups, namely, dependent and independent.

- 43 -
The dependent variable in this current study only has one factor, which is the CEO’s
remuneration, and the independent variables include, Total shareholder return (TSR), Return
on Asset (ROA), Return on Equity (ROE), and Net Operating Profit After Tax (NOPAT).
These factors have been used to illustrate the company’s financial performance.
3.7.1. Dependent variables
The dependent variable in this current study is the CEO’s income. The income
packages of executives considered in this study are, fixed salaries, pensions, perks,
bonuses, and employee benefits paid to directors. The dividends, returns, and surplus
that executives earn as owners of shares of the company, are not included, due to the
lack of data furnished by some banks in their annual reports. Since some banks have
more than one chief executive officer (for example, Standard Bank), in order to
improve the efficiency and accuracy of this current research, the researcher only used
the information of the CEO with the highest remuneration from each bank:
CEO total remuneration = fixed pay + pensions + perks + bonuses +
employee benefits
It is important to mention that the superannuation is categorized as part of fixed
remuneration at some banks; however, there was no clear description of the proportion
of the superannuation in the fixed pay from annual reports. In general, the
superannuation should be regarded as employee benefits; therefore, the position change
did not affect the CEO’s total remuneration.
3.7.2. Independent variables
The researcher uses four performance indicators, as independent variables, to measure
the company’s financial performance. The four independent variables are, Total
Shareholder Return (TSR), Return on Asset (ROA), Return on Equity (ROE), and Net
Operating Profit after Tax (NOPAT).

- 44 -
3.7.2.1. Return on Asset (ROA)
The two major measures of a firm’s profitability are the Return on Asset (ROA)
and Return on Equity (ROE). The ROA provides information regarding the profit
on average by each unit of the asset. Banks usually use the ROA as an indicator
of the bank’s operational efficiency (Burton, Lauridsen, & Obel, 2002). Previous
researchers, who used the ROA as an indicator of firm performance were: Hassan
and Theo (2003); Merhebi et al. (2006); Doucouliagos et al. (2007); and Naik
(2016).
ROA= net profit after tax / total asset
3.7.2.2. Return on Equity (ROE)
The other major measure of a firm’s profitability is the Return on Equity (ROE),
which measures a company’s performance, by indicating how much profit a
company generates with the shareholders’ investment (Bezuidenhout, 2016). The
higher the ROE, the higher the company’s efficiency is, in generating profit from
new investments. Previous researchers, who used the ROE as an indicator of firm
performance were: Hassan and Theo (2003), Merhebi et al. (2006), Doucouliagos
et al. (2007), and Zhou et al. (2011).
ROE= Net profit after tax / Total equity
3.7.2.3. Total shareholder returns (TSR)
The most effective measure for the creation of value is the Total Shareholder
Return (TSR). The TSR measures the performance of the firms’ various shares
and stocks, over a period. It uses an annualized ratio, which indicates the amount
of returns to the shareholder, expressed by integrating dividends paid, and the
appreciated part of the share price. Previous researchers, who used the TSR as an
indicator of firm performance were: Priem (2016), and Zhou et al. (2011).

- 45 -
TSR= (share price at the end-share price at the beginning +
dividends paid) ÷ share price at the beginning x 100
3.7.2.4. Net Operating Profit after Tax (NOPAT)
The Net Operating Profit after Tax is the amount of profits that the firm makes
after taxes, which could be distributed to the shareholders. NOPAT is a direct
measurement tool that could be used to evaluate the value created by directors for
all the shareholders. In addition, the NOPAT could be used, extensively, as the
measurement of operating efficiency. When analysts use NOPAT to calculate the
profitability of the company’s operations, they do not need to consider the
financing structure of the company (Investing answers, 2019). Bezuidenhout
(2016) used this measure in his research.
NOPAT= net profit after tax + after tax interest expense - after tax
interest income
3.8. Data collection
In this section, the researcher discusses the gathering of data.
3.8.1. Source and nature of data
For this current study, the researcher collected secondary data from the banks’ annual
reports and the information from the Stock Exchanges. By law, the listed company must
disclose its annual report to the public (Otieno, 2011). Odainkey and Simpson (2013)
also assert that annual reports, compiled by companies, are helpful instruments to
ensure accountability. Many researchers and authors collected secondary data from
annual reports, for example, Doucouliagos et al. (2007), Zhou et al. (2011), Scholtz &
Smit (2012), Naik (2016), and Priem (2016). The research requested quantitative data
(ROA, ROE, TSR, and NOPAT) to be collected from the financial statements of the
annual reports. The CEOs’ remuneration, and the directors’ related information were

- 46 -
gathered from the narrations in the company’s disclosed reports.
The Total Shareholder Return (TSR) was calculated by using the share prices and
dividends, which were collected from the reports released by the Stock Exchanges. The
relevant data for Return on Asset (ROA) and Return on Equity (ROE) were collected
from the Statement of Financial Position, while the data of Net Operating Profit after
Tax (NOPAT) was gathered from the Income Statement. The directors’ remuneration
were collected from the Directors, Supervisors and Senior Management statement.
One advantage of using secondary data, is that it is easy to obtain from a common
information source (Otieno, 2011), which avoids the challenge of obtaining primary
data. In most cases, the collection of secondary data is free, or moderately priced
(Otieno, 2011), as well as suitable for use by students and researchers. Additionally, the
use-value of secondary data is higher than raw data, since it has been classified by the
standard pattern (Swatdikun, 2013). The resource requirements for collecting secondary
data are much less than for the raw data; therefore, the degree of difficulty of collection
is much less, as well (Swatdikun, 2013).
3.8.2. Data collection and Data collection process
The data used in this current research were obtained from the selected banks’ websites.
The data that were not available on the website were collected from the McGregor’s
Bureau of Financial Analysis data stream. For each of the selected banks, the researcher
obtained the CEO’s total remuneration package, the ROE, ROA, NOPAT, and the
essential data required to calculate the TSR for the years 2007 to 2018. The researcher
selected the 2007 to 2018 period, to determine whether the relationship between the
executives’ emoluments and the shareholders’ value were affected by the 2008 global
financial crisis.
The researcher set up a data matrix table (Table 3.1) in a Microsoft Excel application to

- 47 -
capture the data and calculate the ratios that needed to be analysed. In order to test the
correlation between the dependent and independent variables, the researcher used
formulas in the Excel spreadsheet to calculate the required ratios for the concept
measures.
Table 3.1: Data matrix table used for this study
BANK NAME
ROE ROA TSR NOPAT (Billion)
CEO Total Remuneration (Million)
Share price
Dividend
2006
2007
2008
2009
2010
2011
2012
2013
2014
2015
2016
2017
2018
3.9. Statistical methods
Regression analysis and correlation analysis are instruments that could be used to test the link
between variables, as well as calculate the strength of the relationships (Wegner, 2012). The
researcher used the Statistical Package for the Social Science Programme (SPSS), as well as
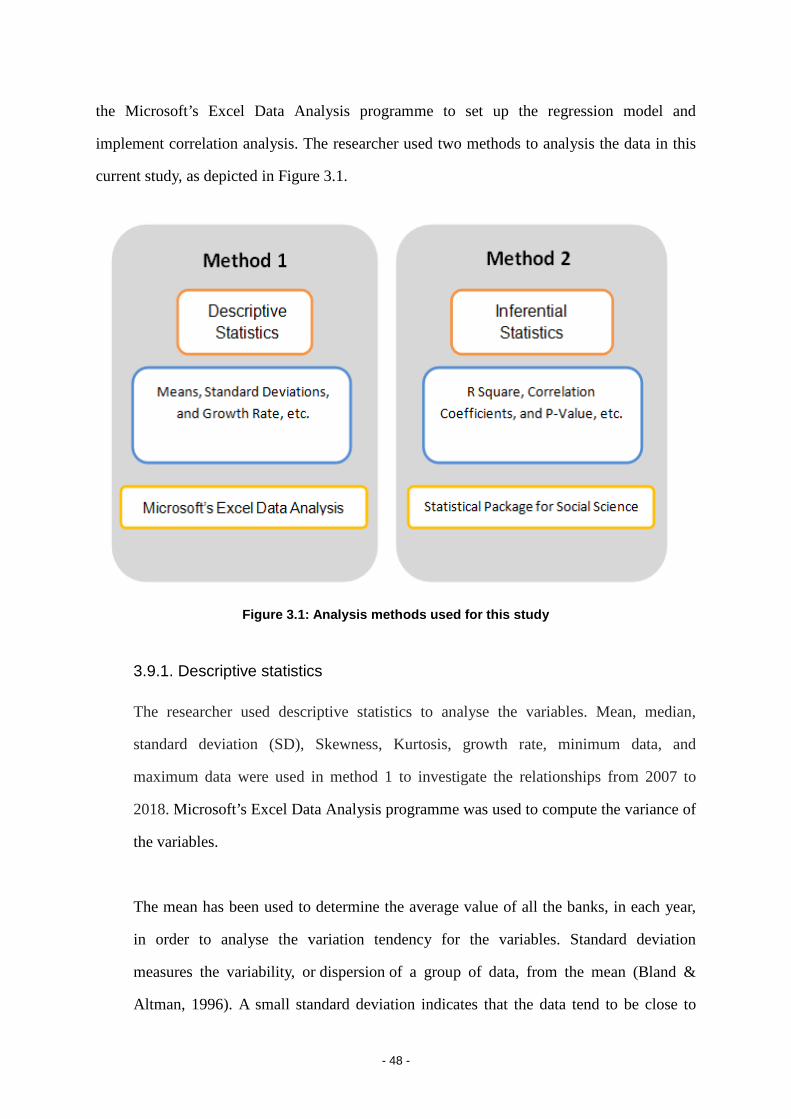
- 48 -
the Microsoft’s Excel Data Analysis programme to set up the regression model and
implement correlation analysis. The researcher used two methods to analysis the data in this
current study, as depicted in Figure 3.1.
Figure 3.1: Analysis methods used for this study
3.9.1. Descriptive statistics
The researcher used descriptive statistics to analyse the variables. Mean, median,
standard deviation (SD), Skewness, Kurtosis, growth rate, minimum data, and
maximum data were used in method 1 to investigate the relationships from 2007 to
2018. Microsoft’s Excel Data Analysis programme was used to compute the variance of
the variables.
The mean has been used to determine the average value of all the banks, in each year,
in order to analyse the variation tendency for the variables. Standard deviation
measures the variability, or dispersion of a group of data, from the mean (Bland &
Altman, 1996). A small standard deviation indicates that the data tend to be close to

- 49 -
the expected value (mean), while a large standard deviation indicates that the data tend
to be far away from the expected value (Bland & Altman, 1996). Additionally, the
growth rate was used to analyse the variation trend from year to year.
3.9.2. Inferential statistics
The researcher used the correlation coefficient (Multiple R), the coefficient of
determination (r²), and the p-value (Hypothesis testing for value significance) in the
inferential statistics section to investigate the relationships between the CEOs’
remuneration and the shareholders’ value.
• Correlation coefficient: It measures the strength of the linear relationship
between the relative movements of two variables x and y, and is represented by
the sample r, when computed from sample data (Wegner, 2012). The proportion
of r is always between -1 and 1. The interpretation is as Figure 3.2.
Figure 3.2: Correlation coefficient r
Resource: Wegner (2012)
• Coefficient of determination: The sample is r². It measures the ratio of variation
in the dependent variable y, which is explained by the independent variable x
(Wegner, 2012). R² is a significant indicator, because it scales how strongly x
and y are related (Wegner, 2012). The weaker the relationship between x and y,
the closer the r² is to 0%. The interpretation is as Figure 3.3.

- 50 -
Figure 3.3: Coefficient of determination r²
Resource:Wegner (2012)
• The P-value approach to the hypothesis testing: The p-value is a probability that
indicates whether the null hypothesis is true or false. Wegner (2012, p. 266)
described the p-value as, “it is a probability that indicates how likely it is to
observe the sample statistic (or a more extreme value) if the null-hypothesized
population parameter value is assumed to be true”. The author also described
the interpretation of the p-value as: the smaller the p-value, the lower the
evidence that the null hypothesis should be rejected; the larger the p-value, the
higher the evidence that the null hypothesis should be accepted (Wegner, 2012,
p. 266). The interpretation is as Figure 3.4.
Figure 3.4: Decision rule for interpreting p-value (based on 5% level of significance)
Resource: Wegner (2012)

- 51 -
3.10. Summary
In this chapter, the researcher outlined the research methodology used in this current study,
which was in line with previous research studies on the relationship between executives’ pay
and shareholders’ value. In this study, the researcher adopts a longitudinal quantitative
approach to ascertain whether compensation aligns with shareholders’ value (firm
performance) in the banking sector. The target population in this current study was listed
banks in South Africa and China, and the sample for investigation was five established banks
in South Africa and China, respectively. The researcher used the secondary data of banks’
annual reports for the period of 2007 to 2018, to investigate the relationships. The company
performance indicators used in this paper were ROE, ROA, NOPAT, and TSR. The CEO’s
total remuneration comprised fixed salaries, pensions, perks, bonuses and employee benefits.
In the next chapter, the researcher provides the results and findings of the study. The research
questions will be discussed in detail, and the researcher provides recommendations regarding
executives’ compensation.

- 52 -
CHAPTER FOUR
RESEARCH FINDINGS
4.1. Introduction
In this chapter, the researcher presents the findings regarding the significance of the
correlation between the CEO’s remuneration and returns to shareholders over an eleven year
period, beginning in 2007 and ending 2018. The researcher, objectively, discusses the data
collected from the 10 holding banks, and makes recommendations regarding the CEO
remuneration. Firstly, the researcher uses the descriptive statistics to describe the returns to
shareholders and CEO income. The researcher starts with the discussion of each of the
components of the business performance, and the correlation between each of the
performance components with the remuneration, for each bank, and each of the eleven years.
Subsequently, the researcher discusses the banks as a whole group, for each country, and
seeks to determine the difference between the two countries. The analysis tool that the
researcher uses in section one of this chapter, is the means, standard deviations, growth rate,
and frequency.
Secondly, the researcher uses inferential statistics to describe the correlation, as well as the
results of the correlation analysis. The researcher discusses the significant results of the
multiple regression analysis of the influence of executive compensation on shareholders’
returns for each country. The analysis tool used in section two is the R square, correlation
coefficient, and p-value.
Lastly, the research question and sub-questions are discussed in section three of this chapter.
The researcher correlates research questions with all the results discussed, and illustrated in
sections one and two. Additionally, in this section, the researcher explains whether the null
hypothesis of the main question should be accepted, or rejected.

- 53 -
4.2. Descriptive Statistics
In this current study, 10 holding banks have been selected as samples, from among all the
South African and Chinese banks. The researcher set the research period for 11 years, which
starts in 2007 and ends in 2018. Therefore, there were 110 (10 x 11) panel observations. The
five selected South African banks were Absa Bank, Capitec Bank, First National Bank, Ned
Bank, and Standard Bank. The selected Chinese Banks in this current research are China
Merchants Bank, China Minsheng Bank, China CITIC Bank, Industrial Bank, and Shanghai
Pudong Development Bank. Most banks had more than one CEO working during the same
period; therefore, the researcher only used the data of the CEO with the highest remuneration,
at each bank, as the object of this current study.
The descriptive statistics section starts with a brief description of each of the components of
the firm performance, and the relationship between each of the performance components,
with the remuneration for each bank. The eleven years have been split into three stages:
before the financial crisis (2007 to 2008), during the financial crisis (2008 and 2009), and
after the financial crisis (after 2009). This is followed by the discussion on the combined data
for each country. The researcher merged the data of banks from the same country, and
analyses them as an entire organization.
4.2.1. Changes for each bank
China Merchants Bank
a. Period 1: Before the financial crisis (2007 to 2008): In Table 4.1, the
researcher indicates that only TSR decreased during the eve of the financial
crisis period. ROE, ROA, and NOPAT, all displayed an escalating tendency,
specifically, the NOPAT increased by 35% from ¥ 40.96 billion in 2007, to
¥ 55.31 billion in 2008. With the increase in the ROE, ROA, and NOPAT, the
remuneration also increased, by 52%, from ¥5.2 million in 2007, to ¥7.9
million in 2008.

- 54 -
b. Period 2: During the financial crisis (2008 to 2009): In Table 4.1, the
researcher indicates that, unlike the performance growths on the eve of the 2008
financial crisis period, the ROE, ROA, and NOPAT, all decreased during the
crisis. The ROA decreased by 32%, from 1.46% in 2008 to 1.00% in 2009.
Additionally, the CEO remuneration also decreased, from ¥7.9 million to
¥5.31 million in one year.
c. Period 3: After the financial crisis (after 2009): In Table 4.1, the researcher
indicates that the 2010 CEO remuneration for China Merchants Bank remained
the same as the previous year, even though all the performance indicators
displayed positive increase rates (except the TSR). The ROE and ROA
displayed increasing trends after 2009; however, both plummeted in 2013,
which caused a lowest CEO remuneration rate in the eleven years (¥3.5
million).
d. Overall changing tendency: In Table 4.1, the researcher indicates that the ROE
decreased by 33% in the eleven years, from 24.76% in 2007, to 16.57% in 2018;
the ROA decreased by 9%, from 1.36% in 2007, to 1.24% in 2018; and the
remuneration also showed a decreasing tendency, from ¥5.2 million in 2007,
to¥4.69 million in 2018. NOPAT was the only performance indicator that
displayed an increasing trend, rocketing from ¥40.96 billion in 2007, to
¥248.6 billion in 2018.
China Minsheng Bank
a. Period 1: Before the financial crisis (2007 to 2008): ROA and NOPAT
increased during the period of 2007 to 2008; however, both the ROE and TSR
decreased (Table 4.1). The decrease in the ROE, and the share price, seems to
have affected remunerations; therefore, the CEO remuneration declined rapidly,
from ¥17.5 million in 2007, to ¥11.4 million in 2008.

- 55 -
b. Period 2: During the financial crisis (2008 to 2009): All the performance
indicators displayed increasing values between 2008 and 2009, specifically, the
ROE increased by 33%, and the NOPAT by over 50%. However, the CEO
remuneration decreased, even though the financial performance increased.
c. Period 3: After the financial crisis (after 2009): The remuneration in 2010
remained the same as 2009. The ROE and ROA displayed an increase at first,
and thereafter, a decreasing tendency.
d. Overall changing tendency: The ROE and ROA displayed a decreasing
tendency between 2007 and 2018; however, the value of the ROE reached the
highest point of 25.2% in 2012, while the ROA peaked in 2011 and 2013, with
1.3%. The NOPA displayed a steady growth trend until the peak in 2017
(¥50.92 billion), decreasing in the following year. CEO remuneration for
Minsheng Bank displayed a steady decreasing trend, from ¥17.5 million in
2007, to¥4.8 million in 2018. However, the remuneration value displayed an
upwards erratic fluctuation during 2012, as ¥5.5 million total remuneration
was paid to the CEO in that year.
China CITIC Bank
a. Period 1: Before the financial crisis (2007 to 2008): In Table 4.1, the
researcher indicates that CEO remuneration followed a decreasing trend, while
the performance indicators, ROE, ROA, and NOPAT, increased in 2008. The
TSR was the only indicator that allied to the change direction of the value of the
CEO remuneration. The TSR decreased and displayed a negative value of -61%
in 2008, which implies that the value of share price shrunk in 2008.
b. Period 2: During the financial crisis (2008 to 2009): Unlike the increasing
trend in 2008, the value of the ROA and ROE decreased by more than 10%
during the crisis. The NOPAT still displayed an increasing tendency; however,
the growth rate decreased from 61% (2007 to 2008) to 9% (2008 to 2009). The

- 56 -
remuneration in 2009 remained the same as 2008. However, according to the
TSR value (115%), obviously, the share price value in 2009 was much higher
than the previous year.
c. Period 3: After the financial crisis (after 2009): According to the Table 4.1,
after the financial crisis, the ROE and ROA displayed a sustainable growth
tendency, and peaked in 2011; however, both started to decrease thereafter. The
decreasing rate of remuneration reached its peak in 2011, having decreased
nearly 57%, when compared with the same period in the previous year.
d. Overall changing tendency: The overall performance tendency of the China
CITIC Bank was a progressive decrease; only NOPAT displayed an increasing
trend. The ROE value reached the lowest rate of 11.39% in 2018, while the
ROA reached the lowest rate of 0.74% in 2017. The CEO remuneration also
reached the lowest rate of ¥1.57 million in 2017, and remained static in the
following year.
Industrial Bank
a. Period 1: Before the financial crisis (2007 to 2008): According to Table 4.1,
all the performance indicators revealed growth tendencies, except TSR.
However, the remuneration displayed no changes from 2007 to 2008.
b. Period 2: During the financial crisis (2008 to 2009): The remuneration
increased by 1% in 2009, while the NOPAT increased by 17%. However, both
of ROA and ROE displayed a decreasing trend, with the ROA decreasing by 7%,
and the ROE by 6% in 2009.
c. Period 3: After the financial crisis (after 2009): After the crisis, both the
performances and remuneration increased in the year 2010. The NOPAT
increased by 39% in 2010. However, the lowest ROE and ROA values appeared
after the crisis, with the lowest ROE of 14.28% in 2018, and the lowest ROA of
0.92% in 2017.

- 57 -
d. Overall changing tendency: Similar to the China Merchants Bank, the highest
ROE and ROA value for the Industrial Bank appeared in 2012, with the value of
the ROE at 26.65%, and the ROA at 1.23%. In 2012, the growth rate for the
CEO’s remuneration also reached the highest value, increasing by 9% (¥3.62
million). After 2012, the ROE, ROA, and remuneration value started to decrease.
Consequently, the overall changing tendency for the Industrial Bank was a wavy
decline.
Shanghai Pudong Development Bank
a. Period 1: Before the financial crisis (2007 to 2008): The ROE, ROA and
NOPAT all increased in 2008. The ROE increased by 83%, from 20.10% in
2007, to 36.71% in 2008. Additionally, the NOPAT increased approximately
1.5 times during 2008. However, the TSR displayed a negative value in 2008,
and the CEO remuneration also decreased in the same year.
b. Period 2: During the financial crisis (2008 to 2009): The ROE and ROA
decreased during the financial crisis; however, the decreased value in 2009 was
still higher than the value of 2007. The remuneration remained unchanged
during the crisis, at ¥1.76 million.
c. Period 3: After the financial crisis (after 2009): After the crisis, the ROE
displayed a decreasing value in 2010, and subsequently, increased in the
following three years, until 2014, after which it started to decrease again. The
ROA had a similar trend as the ROE; it also displayed a wavy declining
tendency. The remuneration reached its highest value (¥2.1 million) in 2013,
when the ROE also reached its highest rate of 21.53%.
d. Overall changing tendency: The overall tendency of the ROE and ROA value
was a decline; however, the value reached the peak point for some years
between the duration, and the lowest ebb in the last two years. Therefore, the
variation of performances was fluctuant descending.

- 58 -
ABSA Bank
a. Period 1: Before the financial crisis (2007 to 2008): In Table 4.2, the
researcher indicates that, in 2008, the ROE and the ROA performed worse than
in 2007. The ROE decreased by 14% and the ROA, by 18.5%. However, the
remuneration increased, as did the NOPAT.
b. Period 2: During the financial crisis (2008 to 2009): All the performance
indicators displayed a decreasing trend during this period. The ROE dropped by
nearly 40%, from 23.4% in 2008, to 15.5% in 2009. The ROA also declined by
25.5%, from 1.37% in 2008, to 1.02% in 2009. The NOPAT decreased by more
than 25%, from R10.025 billion in 2008, to R7.5 billion in 2009. Moreover, the
total package of the CEO’s remuneration in ABSA also shrunk, from R22.36
million in 2008, to R18.76 million in 2009.
c. Period 3: After the financial crisis (after 2009): Performances started to
improve in 2010, when all the indicators displayed a positive growth tendency,
except the ROE. The executive remuneration also increased in 2010 and 2011.
d. Overall changing tendency: The ROE displayed a decreasing trend over the
research period of 2007 to 2018, declining by 62% in 11 years. Similarly, the
ROE and ROA also showed a declining tendency over this period. The ROE
declined by 61%, from 27.20 in 2007 to 10.40 in 2018, while the ROA
decreased by 54%, from the highest of 1.68% in 2007, to the lowest of 0.77% in
2018. The NOPAT hardly changed during the period of 2007 to 2018. Unlike
the decrease of the ROA and ROE, the CEO remuneration increased steadily
over the 11 years.
Capitec Bank
a. Period 1: Before the financial crisis (2007 to 2008): The ROE and ROA
declined during this period; however, the NOPAT increased by over 37%, from
R0.17 billion in 2007, to R0.23 billion in 2008. The CEO remuneration also

- 59 -
increased during this period, from R4.53 million in 2007, to R4.96 million in
2008.
b. Period 2: During the financial crisis (2008 to 2009): Unlike the economic
depression at other banks, the ROE and NOPAT financial performance
indicators of Capitec displayed an increasing trend during the global financial
crisis. Additionally, the executive’s pay and share price in 2009 was also higher
than in 2008.
c. Period 3: After the financial crisis (after 2009): Similar to the period during
the financial crisis, the ROE and NOPAT financial performance indicators of
Capitec also increased after the crisis. The CEO’s remuneration increased by
75.5%, from R5.1 million in 2009, to R8.95 million in 2010.
d. Overall changing tendency: Capitec Bank performed favourably during the
crisis period. The tendency of the ROE displayed an N-shaped change,
increasing from the lowest rate of 22% in 2008, to the highest rate of 34% in
2011. Thereafter it decreases to 23% in 2014, and increases again until reaching
27% in 2017. The ROA displayed a gradual declining trend, with its highest
value in 2007 (11.1%) and the lowest rate in 2016 (4.8%). The NOPAT
displayed an escalating trend during the eleven years, from its lowest level in
2007, to the highest level in 2018. The CEO’s remuneration also displayed an
increasing tendency, peaking at the highest point in 2018, from its lowest in
2007.
First National Bank
a. Period 1: Before the financial crisis (2007 to 2008): The ROE, ROA, and the
CEO’s compensation, all decreased from 2007 to 2008. The only positive
performance was the NOPAT, which increased by 29%, from R5.4 billion to R7
billion.

- 60 -
b. Period 2: During the financial crisis (2008 to 2009): All performance
indicators displayed a negative growth, during the financial crisis period. The
ROE decreased by 36%, the ROA decreased by 45%, and NOPAT declined by
44.2%, while remuneration reached its lowest rate of R9.9 million.
c. Period 3: After the financial crisis (after 2009): After the financial crisis, FNB
recovered its growth promptly. All the performance indices displayed positive
growth in 2010, with the ROA rising by 62%. Additionally, the CEO’s pay
escalated by 99.7%, from R9.9 million in 2009, to R19.8 million in 2010.
d. Overall changing tendency: The financial crisis impacted FNB significantly, as
all the performance indicators reached their lowest value in 2009.
Simultaneously, the CEO of FNB also received the lowest compensation, during
in this period.
Nedbank
a. Period 1: Before the financial crisis (2007 to 2008): According to the Table
4.2, all performances and remuneration decreased during this period, except for
the NOPAT. The revenue of Ned bank was severely impacted by the crisis
during this period.
b. Period 2: During the financial crisis (2008 to 2009): The ROE, ROA, and
NOPAT continued to perform badly during this period. The share price
increased in 2009, after falling in 2008; therefore, the TSR displayed a positive
value in 2009, and remuneration also increased during 2009.
c. Period 3: After the financial crisis (after 2009): The ROA displayed a slow
increase after 2009. However, during 2010, the NOPAT reached its lowest value,
while the ROE remained unchanged, and the CEO’s remuneration dropped by
nearly 15%, from R14.6 million in 2009, to R12.46 million in 2010.

- 61 -
d. Overall changing tendency: The ROA initially displayed a descending
tendency, ascending in the last, between 2007 and 2018, with the lowest in 2008
(1.09%), and the highest in 2018 (1.33%). The NOPAT also displayed a
decreasing tendency, firstly, and increased as time passed. The lowest NOPAT
value was R5.136 billion in 2010, and the highest, R12.3 billion in 2017,
implying that it had more than doubled in the last 7 years. However, compared
with 2007 (R11.8 million), the CEO’s remuneration had also doubled in 2018
(R24.6 million). The ROE hardly changed during the period of 2007 to 2018.
Standard Bank
a. Period 1: Before the financial crisis (2007 to 2008): The NOPAT increased
slightly from R16.6 billion in 2007 to R16.7 billion in 2008. All the other
performances displayed a decreasing tendency, while the CEO’s remuneration
also declined considerably, from R18.6 million to R14 million in a year.
b. Period 2: During the financial crisis (2008 to 2009): Unlike the increase in
period 1, the NOPA displayed a marked decrease in this period, which slipped
by 28% from R16.7 billion in 2008 to R12 billion in 2009. The rest of the
performance indicators still displayed downward trends.
c. Period 3: After the financial crisis (after 2009): The ROE still displayed a
decreasing trend in 2010, while all the other performance indicators had varying
degrees of growth after 2009, including the CEO’s remuneration.
d. Overall changing tendency: The ROE reached its highest value in 2007, and
dramatically declined during 2008 and 2010. Thereafter, the ROE started to
grow in a slow and fluctuant manner. The performance tendency of NOPAT
declined during the crisis period, increasing in recent years. The ROA had
hardly changed through the period from 2007 to 2018. The CEO’s remuneration
dropped to its lowest in 2009 (R8.5 million), and gradually increased to the
highest value in 2018 (R37.88 million).

- 62 -
Table 4.1: Chinese banks’ performance and CEO remuneration (2007 to 2018)
BANK YEAR ROE ROA TSR NOPAT ¥billion
Remuneration ¥million
China
Merchants
Bank
2007 24.76% 1.36% 144% 40.96 5.20
2008 28.58% 1.46% -68% 55.31 7.89
2009 21.17% 1% 50% 51.45 5.31
2010 22.73% 1.15% -27% 71.38 5.31
2011 24.17% 1.39% -4% 96.16 5.35
2012 24.78% 1.46% 21% 113.37 4.75
2013 22.22% 1.39% -16% 132.60 3.50
2014 19.28% 1.28% 58% 165.86 4.75
2015 17.09% 1.13% 13% 201.47 4.75
2016 16.27% 1.09% 2% 209.00 4.75
2017 16.54% 1.15% 70% 220.90 5.22
2018 16.57% 1.24% -10% 248.60 4.69
China
CITIC Bank
2007 12.70% 0.97% 11% 8.29 5.51
2008 14.84% 1.21% -61% 13.32 4.96
2009 12.71% 0.94% 115% 14.56 4.96
2010 19.24% 1.13% -36% 21.78 4.96
2011 21.07% 1.27% -20% 30.84 2.12
2012 16.70% 1.10% 10% 31.39 2.35
2013 18.48% 1.20% -4% 39.72 2.50
2014 16.84% 1.07% 110% 41.45 1.98
2015 14.55% 0.90% -9% 41.74 2.14
2016 12.58% 0.76% -8% 41.79 2.60
2017 11.67% 0.74% 1% 42.88 1.57
2018 11.39% 0.77% -8% 45.38 1.57

- 63 -
Industrial
Bank
2007 25.34% 1.17% 110% 8.586 2.750
2008 26.06% 1.22% -71% 11.385 2.750
2009 24.54% 1.13% 180% 13.282 2.785
2010 24.64% 1.16% -39% 18.521 3.040
2011 24.67% 1.20% -46% 25.597 3.314
2012 26.65% 1.23% 38% 34.927 3.615
2013 22.39% 1.20% -36% 41.511 3.615
2014 21.21% 1.18% 68% 47.53 3.254
2015 18.89% 1.04% 7% 50.65 0.936
2016 17.28% 0.95% -2% 54.327 1.003
2017 15.35% 0.92% 9% 57.735 1.003
2018 14.28% 0.93% -8% 61.245 1.054
Shanghai
Pudong
Develop-
ment Bank
2007 20.10% 0.60% 148% 5.498 2.200
2008 36.71% 0.96% -75% 12.516 1.760
2009 25.86% 0.81% 65% 13.215 1.760
2010 23.27% 0.88% -42% 19.179 1.500
2011 20.07% 1.02% -30% 27.355 1.500
2012 20.95% 1.09% 20% 34.311 2.078
2013 21.53% 1.12% 1% 41.2 2.099
2014 21.02% 1.13% 73% 47.36 2.099
2015 18.82% 1.01% 21% 50.997 2.099
2016 16.35% 0.92% -8% 53.678 0.920
2017 14.45% 0.90% -21% 55 1.095
2018 13.14% 0.91% 8% 56.5 1.059

- 64 -
China
Minsheng
Bank
2007 18.23% 0.69% 46% 6.335 17.486
2008 15.23% 0.75% -72% 7.893 11.366
2009 20.2% 0.9% 95.6% 12.108 7.1548
2010 18.3% 1.0% -35.3% 17.688 7.1548
2011 24.0% 1.3% 23.3% 28.443 5.1625
2012 25.2% 1.2% 36.0% 38.308 5.5023
2013 23.2% 1.3% -0.5% 43.282 5.3063
2014 20.4% 1.1% 42.4% 45.567 4.1939
2015 17.0% 1.0% -9.9% 47.022 4.4835
2016 15.1% 0.8% -4.1% 48.778 4.5737
2017 14.0% 0.9% -6.6% 50.922 4.4681
2018 12.9% 0.9% -27.6% 50.33 4.4708
Table 4.2: SA banks’ performance and CEO remuneration (2007 to 2018)
BANK YEAR ROE ROA TSR NOPAT R billion
Remuneration R million
ABSA Bank
2007 27.20% 1.68% -23.64% 8.266 18.77
2008 23.40% 1.37% -10.78% 10.025 22.36
2009 15.50% 1.02% 5.24% 7.502 18.76
2010 15.10% 1.12% -2.47% 8.589 19.56
2011 16.40% 1.31% 2.71% 10.184 20.7
2012 14.10% 1.17% 3.07% 7.482 16.66
2013 15.50% 1.08% -3.11% 8.735 28.65
2014 16.90% 1.08% -9.69% 9.3 28.57
2015 17.6% 1.11% -8.88% 10.047 28.21
2016 16.3% 1.06% 8.62% 9.919 29.51
2017 11.8% 0.91% -10.06% 8.477 37.96
2018 10.40% 0.77% 3.76% 8.022 29.70

- 65 -
Capitec
Bank
2007 26.0% 11.1% 19.4% 0.167 4.53
2008 22.0% 11.0% -23.1% 0.229 4.96
2009 27.0% 9.2% 163.7% 0.319 5.1
2010 32.0% 6.8% 122.0% 0.449 8.95
2011 34.0% 6.5% 5.5% 0.656 11.16
2012 29.0% 6.6% 8.3% 1.094 10.52
2013 27.0% 6.5% 9.3% 1.5 10.8
2014 23.0% 6.0% 62.2% 2 9.052
2015 25.0% 6.0% 66.5% 2.6 8.7
2016 27.0% 4.8% 30.3% 3.2 12.913
2017 27.0% 5.3% 59.1% 3.8 13.58
2018 27.0% 7.2% -2.2% 4.471 56.6
First Rand
Bank
2007 31.00% 2.00% -4.23% 5.388 16.453
2008 21.00% 1.40% -20.90% 6.961 15.4
2009 13.53% 0.77% 15.21% 3.886 9.9
2010 20.30% 1.25% 8.72% 5.57 19.769
2011 18.80% 1.29% 8.66% 7.986 23.543
2012 21.60% 1.84% 52.27% 9.717 22.481
2013 22.40% 1.48% 18.39% 11.038 26.039
2014 21.90% 1.51% 43.61% 12.513 29.49
2015 22.90% 1.69% -13.90% 15.453 33.42
2016 23.00% 1.75% 28.27% 17.57 43.58
2017 22.20% 1.71% 29.04% 18.326 46.34
2018 23.40% 1.76% -0.36% 20.404 49.4

- 66 -
NEDBANK
Bank
2007 21.40% 1.30% 4.67% 6.641 11.8
2008 17.70% 1.09% -27.95% 7.004 10.4
2009 11.80% 0.76% 34.13% 5.412 14.6
2010 11.80% 0.82% 6.55% 5.136 12.46
2011 13.60% 0.99% 11.76% 6.503 15.68
2012 14.80% 1.13% 33.76% 7.812 17.75
2013 15.60% 1.23% 13.49% 8.957 19.53
2014 15.80% 1.27% 18.62% 10.188 22
2015 15.70% 1.25% -20.05% 11.162 22.93
2016 15.30% 1.23% 29.28% 10.659 22.281
2017 15.30% 1.22% 10.19% 12.299 21.925
2018 16.80% 1.33% 9.63% 10.781 24.575
Standard
Bank
2007 26.70% 2.01% 12.97% 16.572 18.63
2008 19.10% 1.53% -19.00% 16.749 14.1
2009 13.70% 1.44% 25.22% 11.996 8.5
2010 12.70% 1.48% 7.84% 13.007 14.9
2011 14.30% 1.96% -5.90% 15.784 27.24
2012 14.20% 2.30% 23.26% 19.411 24.05
2013 14.10% 3.14% 10.91% 15.755 28.8
2014 12.90% 2.05% 13.18% 18.145 24.76
2015 15.60% 2.41% -18.53% 25.36 31.68
2016 15.30% 2.48% 36.97% 25.794 32.87
2017 17.10% 2.66% 31.84% 30.715 34.03
2018 18.00% 2.45% -6.01% 32.643 37.88

- 67 -
4.2.2. Changes of Total Data Set
In the previous section, the variation for each Bank’s CEO remuneration and
performance indicators of the 10 banks for the period 2007 to 2018 were illustrated.
Subsequently, the total data set over the eleven-year period is discussed in this section.
The researcher describes CEO remunerations and firm performance, separately. Table
4.3 contains a component summary for company performance and CEO remunerations,
with 110 observations between 2007 and 2018.
Table 4.3: Descriptive statistics for company performance components and CEO remuneration
TOOL ROE ROA TSR NOPAT REMUNERATION
China
Mean 0.196 0.0106 0.132 53649216666.67 3821608.00
Median 0.193 0.0109 0.0005 41763000000.00 3407050.00
SD 0.049 0.0020 0.557 53579503747.23 2704205.99
Minimum 0.114 0.0060 -0.746 5498000000.00 920000.00
Maximum 0.367 0.0146 1.795 248600000000.00 17486200.00
Skewness 0.63 -0.08 0.97 2.28 2.56
Kurtosis 0.94 -0.50 0.87 4.93 10.65
South Africa
Mean 0.195 0.026 0.146 10105500000 21757683.33
Median 0.177 0.015 0.087 8846000000 20234500
SD 0.058 0.025 0.323 7225361408 11175221.26
Minimum 0.104 0.008 -0.280 167000000 4530000
Maximum 0.340 0.111 1.637 32643000000 56600000
Skewness 0.59 1.94 2.36 1.09 0.89
Kurtosis -0.56 3.09 8.27 1.41 0.87

- 68 -
4.2.2.1. Company performance components
ROE: According to Table 4.3, the mean ROE for Chinese banks and South
African banks had similar resultant values, which were 0.196 and 0.195. The
median ROE for Chinese banks was 0.193, and for South African banks was
0.177, which were both lower than their mean; therefore, the distribution of data
is skewed to the right. South African banks’ ROE standard deviation was higher
than the Chinese banks, which implies that the group of data for South African
banks was more spread out from the mean. The difference between the minimum
and maximum value of the South African Banks was 0.236 (0.34-0.104), which
was lower than the Chinese banks value 0.253 (0.367-0.114). Therefore, the ROE
gap between South African banks was smaller than Chinese banks. Both Chinese
banks and South African banks had positive skewness values, which implies that
they were not normally distributed, and most of the banks’ ROE data were less
than the mean value. According to Jondeau and Rockinger (2003), the normal
distribution has a fixed kurtosis value 3; therefore, when the value is greater than
3, the distribution is longer and tails are fatter than the normal distribution, the
distribution is shorter, and tails are thinner can be signified by the less than 3
kurtosis value. Both Chinese and South African banks had values smaller than 3,
therefore, their distributions all had lighter tails and flatter peaks than the normal
distribution.
ROA: In Table 4.3, the ROA for Chinese banks was 0.0106, and for South
African banks was 0.026. The median value of Chinese banks was higher than the
mean, and the skewness values was lower than 0; therefore, the distribution of
data was skewed to the left. The Kurtosis value of Chinese banks was smaller
than 3; therefore, the distribution had lighter tails and flatter peaks than the
normal distribution. However, The South African banks’ median value was less
than the mean. The skewness values were lower than 0, and the courthouse was

- 69 -
higher than 3. The distribution of data, therefore, was longer, the tails were fatter
than the normal distribution, and the tail of the left side of the distribution was
longer or fatter than the tail on the right side. The ROA standard deviation of the
South African bank group was higher than the Chinese bank group, which implies
that the group of data was more spread out from their mean values. The difference
between the maximum value and minimum value of Chinese banks was 0.009,
and South African banks was 0.103. This indicates that the ROA gap between
South African banks was higher than Chinese banks.
TSR: The mean TSR for South African banks (0.146) was higher than Chinese
banks (0.132). The median TSR of South African banks was also higher than the
Chinese banks, and the medians of both countries’ banks were lower than their
mean value. Additionally, the skewness for both was higher than zero; therefore,
the distribution data were all skewed to the right. The kurtosis value of the South
African bank group was much higher than 3; therefore, the distribution was
longer, and the tails were fatter than the normal distribution. The kurtosis value of
the Chinese bank group was less than 3; therefore, the distribution was shorter
and tails were thinner than the normal distribution. The South African banks had a
lower standard deviation, which implied that the TSR data of each bank, and each
year, were close to the mean value of the combination of five banks. The Chinese
banks’ standard deviation was much higher than South African banks; therefore,
the group of data for Chinese banks was more spread out from their mean values.
The difference between the maximum value and minimum value of Chinese
banks was 2.541, and South African banks, 1.916. This indicates the TSR gap
between Chinese banks was higher than the South African banks.
NOPAT: The mean NOPAT for the five Chinese banks was ¥53649216666.67.
The median NOPAT for Chinese banks was ¥41763000000.00, which was less

- 70 -
than the mean. The skewness was higher than zero and kurtosis was greater than
three; therefore, it could be concluded that the distribution was longer, and the
tails were fatter than the normal distribution, while the distribution of data was
skewed to the right. The standard deviation of Chinese banks’ NOPAT
was ¥53579503747.2326. The maximum NOPAT value of Chinese banks was 45
times the minimum, while, in South Africa, the maximum value was 195 times
the minimum. The mean value of the South African banks was R10105500000,
and the median value was R8846000000. The median value for South African
banks was also lower than the mean value. The skewness was higher than zero
and kurtosis was smaller than three; therefore, the distribution of data was skewed
to the right. Additionally, the distribution was shorter and tails were thinner than
the normal distribution. The standard deviation of South African banks’ NOPAT
was R7225361407.88655.
4.2.2.2. CEO remuneration
The data reveal that the mean CEO remuneration of Chinese banks for the period
2007 to 2018 was ¥3821608.00. The median CEO remuneration of Chinese
banks was ¥3407050. Therefore, the median value of Chinese banks’ CEO
remuneration was lower than the mean value. The standard deviation for the
Chinese bank group was ¥2704205.98536002. In Table 4.3, the mean CEO
remuneration of South African banks for the period 2007 to 2018 was
R21757683.33. The median of South African banks was R 20234500. The
median value of South African banks’ CEO remuneration was also lower than the
mean value. The standard deviation for the South African bank group
was ¥11175221.26.
According to Table 4.3, the minimum CEO remuneration for Chinese banks was

- 71 -
¥920000, and the maximum was ¥17486200. The maximum salary was 19
times higher than the minimum salary. The maximum CEO remuneration for
South African banks was R56600000, and the minimum remuneration was
R4530000. The maximum salary was 12 times higher than the minimum
recompense. Therefore, it is obvious that the wage dispersion in China was worse
than in South Africa.
The skewness for Chinese banks was 2.56, and for South African banks, 0.89.
This suggested that the data were all skewed to the right. In addition, from Table
4.3, it was evident that the Chinese banks were highly skewed, while the South
African banks were slightly skewed. The kurtosis for the Chinese bank group was
much higher than 3; therefore, the distribution was longer, and the tails, fatter
than the normal distribution. However, the peak was higher and sharper than
mesokurtic (kurtosis=3). The South African bank group had a catharsis value
lower than 3; therefore, the distribution was shorter, tails were thinner, and the
peak was lower, and broader than mesokurtic.
The above statistics could not indicate a definite relationship between the CEO’s
remuneration and the financial performance of banks; therefore, further analysis
was required to test the availability of the premier statistics. Consequently, the
regression analysis was used to find further evidence to verify the relationship
between the CEO’s remuneration and firm performance, as well as explore the
strength of the relationship between salary and performance.
4.3. Inferential Statistics
The regression analysis was used to assess the significance of the correlation between the
CEO’s income and returns to shareholders over the eleven years (2007 to 2018). In Chapter
one of this current study, the researcher made the following assumption: CEO’s compensation

- 72 -
is not aligned to shareholder wealth creation (null hypothesis). Therefore, the multiple
regression analysis was used to validate whether the null hypothesis should be rejected, or
accepted. The eleven years were divided into three periods, namely: before the financial crisis
(2007 to 2008); during the financial crisis (2008 and 2009); and after the financial crisis (after
2009). The researcher describes each of the three periods, as well as the whole researching
period (from 2007 to 2018) for the two countries’ banks in this chapter.
4.3.1 China
4.3.1.1 Split periods: Period 1 (2007 to 2008) – Before the financial crisis
The outputs presented in Table 4.4, results from using CEO remuneration (y
variable) as the dependent variable and four company performance components
(x variable ) as independent variables. The Multiple R of 0.661 suggests a
moderate positive correlation (r² = 43.7%), indicating a weak to moderate
explanation of the percentage variation in CEO remuneration that could be
attributed to company performance indicators. The p-value of 49.8% is between
10% and 100% suggesting that the null hypothesis should be accepted. The
significant p-value for each of the firm performances is between 10% and 100%;
therefore, none of the performances had significant influences on the CEO
compensation for Chinese banks, during the period of 2007 to 2008.
4.3.1.2 Split periods: Period 2 (2008 to 2009) –During the financial crisis
The outputs presented in Table 4.5, results from using CEO remuneration (y
variable) as the dependent variable, and four company performance components
(x variable ) as independent variables. The Multiple R of 0.716 suggests a
moderate positive correlation (r² = 51.3%), indicating a moderate explanation of
the percentage variation in CEO remuneration that can be attributed to company
performance indicators, and a p-value of 0.378 is between 10% and 100%,
suggesting the null hypothesis should be accepted. The significant p-value for

- 73 -
each of the firm performances is between 10% and 100%; therefore, none of the
performance has significant influences on the CEO compensation for Chinese
banks during the period of 2008 to 2009.
4.3.1.3 Split periods: Period 3 (2009 to 2018) – After the financial crisis
The outputs presented in Table 4.6, results from using CEO remuneration (y
variable) as the dependent variable, and four company performance components
(x variable ) as independent variables. The Multiple R of 0.422 suggests a weak
positive correlation (r² = 0.178), indicating a weak explanation of the percentage
variation in CEO remuneration that can be attributed to company performance
indicators. The p-value of 6% is greater than 5%, which suggests that the null
hypothesis should be accepted. The significant p-value for each of the firm
performances is higher than 5%; therefore, none of the performances has a
significant influence on the CEO compensation for Chinese banks after the
financial crisis.
4.3.1.4 Split periods: Total Period (2007 to 2018)
The outputs presented in Table 4.7, results from using CEO remuneration (y
variable) as the dependent variable, and four company performance components
(x variable ) as independent variables. The Multiple R of 0.051 suggests a weak
positive correlation (r² = 3%), indicating a weak explanation of the percentage
variation in CEO remuneration that can be attributed to company performance
indicators. The p-value of 99.8% is ˃5%, suggesting the null hypothesis should
be accepted. The significant p-value for NOPAT is<5%, suggesting that the
NOPAT has a significant influence on the CEO remuneration. All the other
performance components are higher than 5%, which indicates that they have no
significant influence on the CEO performance.

- 74 -
4.3.2. South Africa
4.3.2.1 Split periods: Period 1 (2007 to 2008) – Before the financial crisis
The outputs presented in Table 4.8, results from using CEO remuneration (y
variable) as the dependent variable, and four company performance components
(x variable ) as independent variables. The Multiple R of 0.907 suggests a strong
positive correlation (r² = 82.3%), indicating a strong explanation of the
percentage variation in CEO remuneration that could be attributed to company
performance indicators. The p-value of 4% is <5% suggesting that the null
hypothesis should be rejected.
4.3.2.2 Split periods: Period 2 (2008 to 2009) – During the financial crisis
The outputs presented in Table 4.9, results from using CEO remuneration (y
variable) as the dependent variable, and four company performance components
(x variable ) as independent variables. The Multiple R of 0.804 suggests a strong
positive correlation. R² indicates that 64.6% of the variation in CEO remuneration
can be explained by firm performance indicators. The p-value of 19.5% is greater
than 5%, suggesting that the null hypothesis should be accepted. Additionally, all
the performance components have a greater than 5% significant value, which
indicates that they have no significant relationship with the CEO remuneration.
4.3.2.3 Split periods: Period 3 (2009 to 2018) – After the financial crisis
The outputs presented in Table 4.10, results from using CEO remuneration (y
variable) as the dependent variable, and four company performance components
(x variable ) as independent variables. The Multiple R of 0.713 suggests a
moderate to a strong positive correlation. R² indicates that 50.9% of the variation
in CEO remuneration could be explained by firm performance indicators. The
p-value is less than 5%, suggesting that the null hypothesis should be rejected.
Except for the ROA, all the other company performance components are

- 75 -
significant at the 5% level; therefore, TSR has a negative relationship with CEO
remuneration, and the other performances have positive relationships.
4.3.2.4 Split periods: Total Period (2007 to 2018)
The outputs presented in Table 4.11, results from using CEO remuneration (y
variable) as the dependent variable, and four company performance components
(x variable ) as independent variables. The Multiple R of 0.654 suggests a
moderate positive correlation (r² = 0.427), indicating a weak to moderate
explanation of the percentage variation in CEO remuneration that can be
attributed to company performance indicators. The p-value is less than 5%
suggesting that the null hypothesis should be rejected, however NOPAT is the
only performance indicator, which has a <5% p-value.

76
Table 4.4: Multiple Linear Regression for period 2007 - 2008 (Chinese)
Average for the 5 Chinese Banks 2007-2008
YEAR ROE ROA TSR NOPAT ¥billion Remuneration
¥million
2007 20.23% 0.96% 91.83% 13.9334 6.63046
2008 24.28% 1.12% -69.40% 20.0844 5.74612
Model Summaryb
Model R R Square Adjusted R Square Std. Error of the
Estimate
1 .661a .437 -.013 4.970829
a. Predictors: (Constant), Net operating profit after tax, Total shareholder return, Return on equity, Return on asset
b. Dependent Variable: CEO Remuneration
ANOVAa
Model Sum of Squares df Mean Square F Sig.
1 Regression 95.902 4 23.976 .970 .498b
Residual 123.546 5 24.709
Total 219.448 9
a. Dependent Variable: CEO Remuneration
b. Predictors: (Constant), Net operating profit after tax, Total shareholder return, Return on equity, Return on asset
Coefficientsa
Model
Unstandardized
Coefficients
Standardized
Coefficients t Sig.
95.0% Confidence
Interval for B Correlations
Collinearity
Statistics
B Std. Error Beta Lower
bound
Upper
Bound
Zero-
order Partial Part Tolerance VIF
1 (Constant) 22.518 8.821 2.553 .051 -.157 45.193
Return on equity -29.192 24.474 -.439 -1.193 .286 -92.104 33.720 -.416 -.471 -.400 .830 1.205
Return on asset -1256.931 917.475 -.751 -1.370 .229 -3615.376 1101.514 -.305 -.522 -.460 .374 2.671
Total shareholder return -1.341 1.811 -.256 -.740 .493 -5.997 3.316 -.106 -.314 -.248 .941 1.063
Net operating profit after tax .214 .158 .734 1.354 .234 -.192 .620 -.002 .518 .454 .383 2.609
a. Dependent Variable: CEO Remuneration

77
Table 4.5: Multiple Linear Regression for period 2008 – 2009 (Chinese)
Average for the 5 Chinese Banks 2008-2009
YEAR ROE ROA TSR NOPAT ¥billion Remuneration
¥million
2008 24.28% 1.12% -69.40% 20.0844 5.74612
2009 20.89% 0.95% 101.24% 20.9222 4.39352
Model Summaryb
Model R R Square Adjusted R Square Std. Error of the
Estimate
1 .716a .513 .123 2.870312
a. Predictors: (Constant), Net operating profit after tax, Total shareholder return, Return on equity, Return on asset
b. Dependent Variable: CEO Remuneration
ANOVAa
Model Sum of Squares df Mean Square F Sig.
1 Regression 43.343 4 10.836 1.315 .378b
Residual 41.193 5 8.239
Total 84.536 9
a. Dependent Variable: CEO Remuneration
b. Predictors: (Constant), Net operating profit after tax, Total shareholder return, Return on equity, Return on asset
Coefficientsa
Model
Unstandardized
Coefficients
Standardized
Coefficients t Sig.
95.0% Confidence
Interval for B Correlations
Collinearity
Statistics
B Std. Error Beta Lower
Bound
Upper
Bound
Zero-
order Partial Part Tolerance VIF
1
(Constant) 12.765 5.812 2.196 .079 -2.175 27.705
Return on equity -26.391 13.903 -.631 -1.898 .116 -62.129 9.346 -.510 -.647 -.593 .883 1.133
Return on asset -279.048 580.105 -.198 -.481 .651 -1770.255 1212.159 -.017 -.210 -.150 .577 1.732
Total shareholder return -1.400 1.093 -.439 -1.281 .257 -4.211 1.410 -.247 -.497 -.400 .829 1.207
Net operating profit after tax .068 .066 .386 1.021 .354 -.103 .239 .204 .415 .319 .681 1.468
a. Dependent Variable: CEO Remuneration

78
Table 4.6: Multiple Linear Regression for period 2009 – 2018 (Chinese)
Model Summaryb
Model R R Square Adjusted R Square Std. Error of the
Estimate
1 .422a .178 .105 1.625953
a. Predictors: (Constant), Net operating profit after tax, Total shareholder return, Return on equity, Return on asset
b. Dependent Variable: CEO Remuneration
ANOVAa
Model Sum of Squares df Mean Square F Sig.
1 Regression 25.836 4 6.459 2.443 .060b
Residual 118.968 45 2.644
Total 144.803 49
a. Dependent Variable: CEO Remuneration
b. Predictors: (Constant), Net operating profit after tax, Total shareholder return, Return on equity, Return on asset
Average for the 5 Chinese Banks 2009-2018
YEAR ROE ROA TSR NOPAT ¥billion Remuneration ¥million
2009 20.89% 0.95% 101.24% 20.9222 4.39352
2010 21.63% 1.06% -35.92% 29.7088 4.39332
2011 22.79% 1.23% -15.53% 41.6792 3.49074
2012 22.86% 1.21% 25.06% 50.4596 3.6588
2013 21.57% 1.25% -11.32% 59.662 3.40484
2014 19.75% 1.16% 70.58% 69.5542 3.25408
2015 17.27% 1.02% 4.48% 78.3758 2.88046
2016 15.52% 0.91% -4.14% 81.5138 2.767812
2017 14.41% 0.91% 10.41% 85.487 2.67088
2018 13.66% 0.94% -9.21% 92.4102 2.568264

79
Coefficientsa
Model
Unstandardized
Coefficients
Standardized
Coefficients
t Sig.
95.0% Confidence
Interval for B Correlations
Collinearity
Statistics
B Std. Error Beta Lower
Bound
Upper
Bound
Zero-
order Partial Part Tolerance VIF
1 (Constant) -.380 1.423 -.267 .791 -3.245 2.485
Return on equity 3.138 8.747 .076 .359 .721 -14.479 20.756 .236 .053 .048 .404 2.477
Return on asset 256.755 212.760 .268 1.207 .234 -171.766 685.276 .380 .177 .163 .371 2.692
Total shareholder return .410 .512 .110 .802 .427 -.620 1.441 .120 .119 .108 .979 1.022
Net operating profit after tax .006 .005 .179 1.058 .296 -.005 .016 .255 .156 .143 .638 1.567
a. Dependent Variable: CEO Remuneration
Table 4.7: Multiple Linear Regression for period 2007 – 2018 (Chinese)
Average for the 5 Chinese Banks
YEAR ROE ROA TSR NOPAT ¥billion Remuneration ¥million
2007 20.23% 0.96% 91.83% 13.9334 6.63046
2008 24.28% 1.12% -69.40% 20.0844 5.74612
2009 20.89% 0.95% 101.24% 20.9222 4.39352
2010 21.63% 1.06% -35.92% 29.7088 4.39332
2011 22.79% 1.23% -15.53% 41.6792 3.49074
2012 22.86% 1.21% 25.06% 50.4596 3.6588
2013 21.57% 1.25% -11.32% 59.662 3.40484
2014 19.75% 1.16% 70.58% 69.5542 3.25408
2015 17.27% 1.02% 4.48% 78.3758 2.88046
2016 15.52% 0.91% -4.14% 81.5138 2.767812
2017 14.41% 0.91% 10.41% 85.487 2.67088
2018 13.66% 0.94% -9.21% 92.4102 2.568264
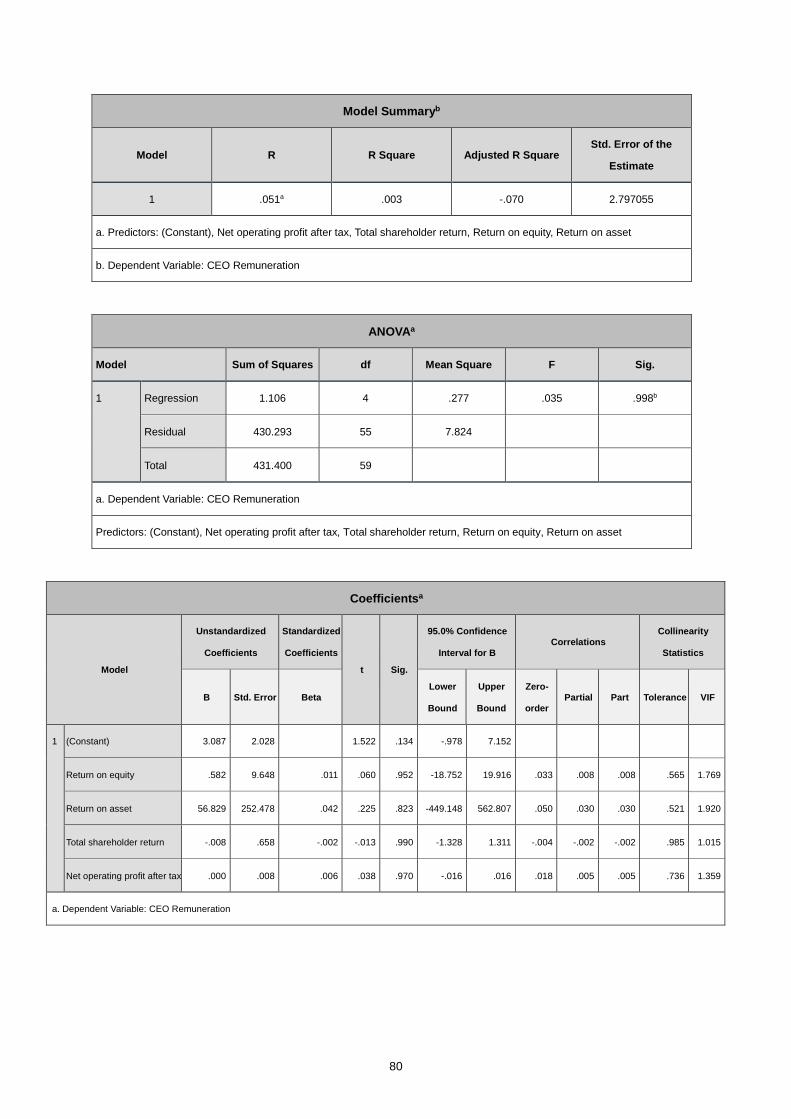
80
Model Summaryb
Model R R Square Adjusted R Square Std. Error of the
Estimate
1 .051a .003 -.070 2.797055
a. Predictors: (Constant), Net operating profit after tax, Total shareholder return, Return on equity, Return on asset
b. Dependent Variable: CEO Remuneration
ANOVAa
Model Sum of Squares df Mean Square F Sig.
1 Regression 1.106 4 .277 .035 .998b
Residual 430.293 55 7.824
Total 431.400 59
a. Dependent Variable: CEO Remuneration
Predictors: (Constant), Net operating profit after tax, Total shareholder return, Return on equity, Return on asset
Coefficientsa
Model
Unstandardized
Coefficients
Standardized
Coefficients
t Sig.
95.0% Confidence
Interval for B Correlations
Collinearity
Statistics
B Std. Error Beta Lower
Bound
Upper
Bound
Zero-
order Partial Part Tolerance VIF
1
(Constant) 3.087 2.028 1.522 .134 -.978 7.152
Return on equity .582 9.648 .011 .060 .952 -18.752 19.916 .033 .008 .008 .565 1.769
Return on asset 56.829 252.478 .042 .225 .823 -449.148 562.807 .050 .030 .030 .521 1.920
Total shareholder return -.008 .658 -.002 -.013 .990 -1.328 1.311 -.004 -.002 -.002 .985 1.015
Net operating profit after tax .000 .008 .006 .038 .970 -.016 .016 .018 .005 .005 .736 1.359
a. Dependent Variable: CEO Remuneration

81
Table 4.8: Multiple Linear Regression for period 2007 – 2008 (South African)
Average for the 5 South African Banks 2007-2008
YEAR ROE ROA TSR NOPAT ¥billion Remuneration ¥million
2007 15.36% 2.06% 29.02% 4.83 11.22
2008 16.14% 2.15% 4.00% 6.19 15.52
Model Summaryb
Model R R Square Adjusted R Square Std. Error of the
Estimate
1 .907a .823 .682 3.313266
a. Predictors: (Constant), Net operating profit after tax, Total shareholder return, Return on equity, Return on asset
b. Dependent Variable: CEO Remuneration
ANOVAa
Model Sum of Squares df Mean Square F Sig.
1 Regression 255.706 4 63.927 5.823 .040b
Residual 54.889 5 10.978
Total 310.595 9
a. Dependent Variable: CEO Remuneration
b. Predictors: (Constant), Net operating profit after tax, Total shareholder return, Return on equity, Return on asset
Coefficientsa
Model
Unstandardized
Coefficients
Standardized
Coefficients t Sig.
95.0% Confidence
Interval for B Correlations
Collinearity
Statistics
B Std. Error Beta Lower
Bound
Upper
Bound
Zero-
order Partial Part Tolerance VIF
1 (Constant) -3.214 9.197 -.349 .741 -26.856 20.428
Return on equity 69.039 31.311 .483 2.205 .079 -11.448 149.526 .283 .702 .415 .735 1.360
Return on asset -80.163 41.193 -.548 -1.946 .109 -186.053 25.726 -.783 -.656 -.366 .446 2.244
Total shareholder return -6.513 8.135 -.185 -.801 .460 -27.425 14.399 -.105 -.337 -.151 .659 1.518
Net operating profit after tax .367 .285 .352 1.284 .255 -.367 1.100 .675 .498 .241 .471 2.124
a. Dependent Variable: CEO Remuneration

82
Table 4.9: Multiple Linear Regression for period 2008 - 2009 (South African)
Average for the 5 South African Banks 2008-2009
YEAR ROE ROA TSR NOPAT ¥billion Remuneration ¥million
2008 19.10% 2.80% 12.54% 12.08 21.62
2009 19.80% 2.51% 30.67% 12.75 25.35
Model Summaryb
Model R R Square Adjusted R Square Std. Error of the
Estimate
1 .804a .646 .362 4.536997
a. Predictors: (Constant), Net operating profit after tax, Return on equity, Total shareholder return, Return on asset
b. Dependent Variable: CEO Remuneration
ANOVAa Model Sum of Squares df Mean Square F Sig.
1 Regression 187.562 4 46.891 2.278 .195b
Residual 102.922 5 20.584
Total 290.484 9
a. Dependent Variable: CEO Remuneration
b. Predictors: (Constant), Net operating profit after tax, Return on equity, Total shareholder return, Return on asset
Coefficientsa
Model
Unstandardized
Coefficients
Standardized
Coefficients t Sig.
95.0% Confidence
Interval for B Correlations
Collinearity
Statistics
B Std. Error Beta Lower
Bound
Upper
Bound
Zero-
order Partial Part Tolerance VIF
1 (Constant) 5.700 7.025 .811 .454 -12.358 23.758
Return on equity 65.793 42.444 .570 1.550 .182 -43.311 174.898 -.126 .570 .413 .525 1.905
Return on asset -151.239 69.754 -1.010 -2.168 .082 -330.547 28.069 -.670 -.696 -.577 .326 3.064
Total shareholder return -2.054 3.038 -.206 -.676 .529 -9.863 5.755 -.413 -.289 -.180 .767 1.304
Net operating profit after tax -.096 .426 -.086 -.227 .830 -1.190 .997 .515 -.101 -.060 .490 2.042
a. Dependent Variable: CEO Remuneration

83
Table 4.10: Multiple Linear Regression for period 2009 - 2018 (South African)
Model Summaryb
Model R R Square Adjusted R Square Std. Error of the
Estimate
1 .713a .509 .465 8.283491
a. Predictors: (Constant), Net operating profit after tax, Total shareholder return, Return on equity, Return on asset
b. Dependent Variable: CEO Remuneration
ANOVAa
Model Sum of Squares df Mean Square F Sig.
1 Regression 3198.583 4 799.646 11.654 .000b
Residual 3087.730 45 68.616
Total 6286.313 49
a. Dependent Variable: CEO Remuneration
b. Predictors: (Constant), Net operating profit after tax, Total shareholder return, Return on equity, Return on asset
Average for the 5 South African Banks 2009-2018
YEAR ROE ROA TSR NOPAT ¥billion Remuneration ¥million
2009 16.04% 3.26% -7.49% 6.87 11.45
2010 14.72% 2.78% 41.02% 5.83 9.70
2011 16.88% 2.35% 33.05% 6.49 14.37
2012 17.16% 2.42% 6.46% 7.83 18.54
2013 16.78% 2.69% 16.95% 9.10 19.34
2014 17.99% 2.95% 8.08% 7.14 15.94
2015 15.69% 2.57% 19.73% 8.17 15.35
2016 15.96% 2.55% 16.55% 9.85 17.03
2017 19.81% 2.68% 30.62% 11.59 23.14
2018 20.37% 2.85% 25.71% 13.45 25.83

84
Coefficientsa
Model
Unstandardized
Coefficients
Standardized
Coefficients t Sig.
95.0% Confidence
Interval for B Correlations
Collinearity
Statistics
B Std.
Error Beta
Lower
Bound
Upper
Bound
Zero-o
rder Partial Part Tolerance VIF
1 (Constant) 3.678 5.707 .644 .523 -7.818 15.173
Return on equity 77.365 34.654 .391 2.232 .031 7.568 147.162 -.100 .316 .233 .355 2.815
Return on asset -92.289 102.402 -.175 -.901 .372 -298.537 113.959 -.272 -.133 -.094 .290 3.446
Total shareholder return -10.553 4.503 -.304 -2.344 .024 -19.622 -1.484 -.422 -.330 -.245 .649 1.541
Net operating profit after tax .909 .174 .599 5.220 .000 .558 1.260 .621 .614 .545 .828 1.207
a. Dependent Variable: CEO Remuneration
Table 4.11: Multiple Linear Regression for period 2007 - 2018 (South African)
Average for the 5 South African Banks 2007-2018
YEAR ROE ROA TSR NOPAT ¥billion Remuneration ¥million
2007 26.46% 3.62% 1.84% 7.41 14.04
2008 20.64% 3.28% -20.35% 8.19 13.44
2009 16.31% 2.64% 48.69% 5.82 11.37
2010 18.38% 2.29% 28.53% 6.55 15.13
2011 19.42% 2.41% 4.55% 8.22 19.66
2012 18.74% 2.61% 24.12% 9.10 18.29
2013 18.92% 2.69% 9.79% 9.20 22.76
2014 18.10% 2.38% 25.59% 10.43 22.77
2015 19.36% 2.49% 1.03% 12.92 24.99
2016 19.38% 2.26% 26.69% 13.43 28.23
2017 18.68% 2.36% 24.03% 14.72 30.77
2018 19.12% 2.71% 0.97% 15.26 39.63
Model Summaryb
Model R R Square Adjusted R Square Std. Error of the
Estimate
1 .654a .427 .386 8.760241
a. Predictors: (Constant), Net operating profit after tax, Total shareholder return, Return on equity, Return on asset
b. Dependent Variable: CEO Remuneration

85
ANOVAa
Model Sum of Squares df Mean Square F Sig.
1 Regression 3147.448 4 786.862 10.253 .000b
Residual 4220.800 55 76.742
Total 7368.249 59
a. Dependent Variable: CEO Remuneration
b. Predictors: (Constant), Net operating profit after tax, Total shareholder return, Return on equity, Return on asset
4.4. Results of the research questions
Question 1
The findings from Table 4.11 indicate that there is a significant positive correlation between
CEO income and company performance components of the South African banking sector for
the period 2007 to 2008. However, the p-values of NOPAT were lower than the significance
level of 0.05, suggesting a higher correlation between the income and NOPAT, than the
relationship between compensation with ROE, ROA, and TSR, respectively.
Question 2
The findings from Table 4.7 indicate that there is no relationship between CEO compensation
and company performance components of the Chinese banking sector for the period 2007 to
Coefficientsa
Model
Unstandardized
Coefficients
Standardized
Coefficients t Sig.
95.0% Confidence
Interval for B Correlations
Collinearity
Statistics
B Std.
Error Beta
Lower
Bound
Upper
Bound
Zero-
order Partial
Part Tolerance VIF
1 (Constant) 8.082 5.193 1.556 .125 -2.325 18.489
Return on equity 32.852 25.610 .170 1.283 .205 -18.472 84.177 -.171 .170 .131 .596 1.677
Return on asset -60.814 62.521 -.138 -.973 .335 -186.108 64.481 -.340 -.130 -.099 .519 1.927
Total shareholder return -3.887 3.865 -.112 -1.006 .319 -11.632 3.858 -.255 -.134 -.103 .835 1.197
Net operating profit after tax .936 .177 .605 5.286 .000 .581 1.291 .629 .580 .539 .794 1.260
a. Dependent Variable: CEO Remuneration

86
2008. The p-value for all the performance components was higher than the significance level
of 5%; therefore, none of the performance components has a relationship with Chinese banks’
CEO compensation.
Question 3
The relationship did change for both Chinese banks and South African banks from 2007 to
2018. According to Table 4.12 and Table 4.13, the direction of growth for CEO salary and
returns to shareholders was the same for some period. In the year 2009, 2014, 2015, and 2016,
the CEO compensations of Chinese banks decreased, along with the decrease of company
performance components ROE, ROA and TSR. However, in other years, there were no
obvious correlations between salary and performance. From the Table 4.13, the CEO
compensations declined with the decline of ROE, ROA, and TSR in the years 2008 and 2009;
however, the CEO compensations increased with the growth of ROE, ROA, and NOPAT in
the years 2011, 2013, 2015, and 2018.
Table 4.12: Chinese banks’ Growth Rate
Chinese banks' Growth Rate YEAR ROE ROA TSR NOPAT ¥billion Remuneration ¥million
2007
2008 20.06% 16.91% -175.58% 44.15% -13.34%
2009 -13.96% -15.54% -245.87% 4.17% -23.54%
2010 3.54% 11.84% -135.48% 42.00% 0.00%
2011 5.32% 16.45% -56.78% 40.29% -20.54%
2012 0.34% -1.46% -261.38% 21.07% 4.81%
2013 -5.66% 2.97% -145.18% 18.24% -6.94%
2014 -8.43% -7.36% -723.52% 16.58% -4.43%
2015 -12.59% -11.57% -93.65% 12.68% -11.48%
2016 -10.10% -11.13% -192.55% 4.00% -3.91%
2017 -7.18% 0.44% -351.12% 4.87% -3.50%
2018 -5.17% 2.84% -188.48% 8.10% -3.84%

87
Table 4.13: South African banks’ Growth Rate
South African banks' Growth Rate YEAR ROE ROA TSR NOPAT ¥billion Remuneration ¥million
2007
2008 -22.00% -9.40% -1207.79% 10.62% -4.22%
2009 -21.00% -19.52% -339.26% -28.93% -15.41%
2010 12.72% -13.27% -41.42% 12.49% 33.03%
2011 5.66% 5.42% -84.06% 25.53% 29.99%
2012 -3.50% 8.13% 430.59% 10.71% -6.98%
2013 0.96% 2.99% -59.43% 1.03% 24.45%
2014 -4.33% -11.32% 161.44% 13.40% 0.05%
2015 6.96% 4.62% -95.98% 23.93% 9.72%
2016 0.10% -9.15% 2496.09% 3.90% 12.98%
2017 -3.61% 4.24% -9.98% 9.64% 8.98%
2018 2.36% 14.83% -95.96% 3.67% 28.81%
Question 4
The strength of the relationship between Chinese banks’ CEO compensation and shareholders’
value did not transform before (2007-2008), during (2008-2009), and after the global
financial crisis. However, the compensation and performance relationship did change in the
South African bank sector. Regarding Tables 4.4 to 4.6, the p-values were all higher than the
5% significance level, which means that the null hypothesis was accepted for all three periods.
In the South African bank sector, Tables 4.8 to 4.10 indicate that, before the financial crisis,
the p-value was less than 0.05 significant level, which indicated a significant relationship for
CEO compensation and shareholders’ value between 2007 and 2008. However, the p-value
was higher than 5% during the financial crisis; therefore, there was no relationships for CEO
compensation and shareholders’ value between 2008 and 2009. In addition, the p-value was
lower than 1% after the crisis, which implies that it was a highly significant to reject the no
relationships null hypothesis.

88
Question 5
South African and Chinese companies can overcome their predicaments by adjusting the
CEO compensation structure. From Tables 4.8 to 4.10 it is clear that banks performed better
during the period, in which the CEO compensation was aligned with the company
performance (before and after the financial crisis). However, the company performed badly in
the period that the CEO compensation had no relationship with firm performance.
4.5. Chapter Summary
The research results were discussed in this chapter. The researcher used descriptive statistics
to describe the variation of the CEO’s total remuneration and company performance
components for each bank in the first section, followed by a discussion of a bank set for each
country, and an illustration of the difference between the two countries. In the second section,
the researcher used multiple linear regressions to analyse the significance of the relationship
between CEO compensations and company performance components. In the final section, the
researcher answered the research questions from Chapter one and provided explanations.
The next chapter comprises a comprehensive discussion of the study findings within the
literature analysis.

89
CHAPTER FIVE
DISCUSSION
5.1. Introduction
The aim of this study was to explore the link between CEO remuneration and the returns for
shareholders in the Chinese and South African banking sector. In the previous chapter, the
researcher provided the findings of the research, which concentrated on the relevance of
variables. Subsequently, the researcher analysed the data collected from selected samples, by
using descriptive statistics and regression methods. In this chapter, the researcher provides a
discussion of the study results, as well as its incorporation with the previous researches and
studies on related topics, and details the similarities and differences. In addition, the
limitations and recommendations for the further research are discussed in this chapter. A brief
dissection of the key research questions follows.
5.2. Discussion on research questions
Research question one was aimed at analysing the correlation between CEO salary and
shareholders’ value in the bank sector of South Africa. The researcher used multiple linear
regression (MLR) to examine the relationship between the individual components of returns
of shareholders, and measures of total CEO compensation. Research question two was aimed
to analysing the relationship between CEO salary and shareholders’ value of the bank sector
of China. Similar to question one, the researcher also used multiple linear regression (MLR)
to examine the relationship between the individual components of returns of shareholders,
and measures of total CEO compensation. Research question three was aimed at exploring
the changes in the relationship between CEO compensation and performances over the years.
The researcher used a growth rate comparing method to detect this problem. The aim of
research question four was to investigate the strength changes of the relationship between

90
CEO compensation and shareholders’ value transform, before 2007, during 2008 to 2009, and
after the global financial crisis. The researcher performed multiple linear regressions (MLR)
for each period, to test the changes at each stage. The aim of question five was to explore the
effectiveness of the compensation structure to the economic predicaments of South Africa
and China, and combined all the results to assess the effectiveness.
The results from Table 4.11 indicates that the p-value was less than the significance level of
0.05, and the multiple R of 0.654 displayed moderate positive correlations between the
variables. These findings indicate that there was a significant positive relationship between
CEO remuneration and company performance components of the South African banking
sector, for the period 2007 to 2018. This finding concurs with the findings of studies
conducted by Murphy (1986), as well as Scholtz and Smit (2012), which also revealed a
strong relationship between executive remuneration and firm performance. From Table 4.3,
the maximum CEO remuneration of South African banks was 12.5 times the minimum.
Therefore, even though the CEO compensation and shareholders’ value were related to each
other, the huge salary gap was still the biggest problem in the South African banking sector. It
is obvious that the King code played a role in the pay-performance structure of the South
African banking sector, but produced little effect for the remuneration inequality problems.
The results in Table 4.7 indicate that the multiple R value was 5.1%, which implies that the
correlation was weak, and the p-value showed a 99.8% value; therefore, the findings indicate
that there was no significant relationship between CEO remuneration and company
performance components of the Chinese bank sector for the period 2007 to 2018. This
finding concurred with a study conducted by Gregg, Jewell, and Tonks (2005). In their
research article, they provided evidence to reveal that there was an insignificant relationship
between pay and performance. Additionally, even the maximum CEO remuneration was 19
times the minimum, according to Table 4.3, as the CEO remuneration for all Chinese banks

91
showed decreasing trends. Therefore, the findings revealed that the pay-performance in the
Chinese banking sector was still problematic, as the CEOs’ salaries were low, compared to
the value they created for shareholders. The remuneration gap issue was still not optimistic.
The Performance Appraisal System (PAS), which was enacted by the Chinese Ministry of
Finance (MOF) was useful, but to non-state-owned banks, it meant little.
According to Tables 4.12 and 4.13, the changing direction for CEO compensation and
financial performance was similar for some time. The strength of the relationship between
Chinese banks changed; however, not obviously, for the period before (2007-2008), during
(2008-2009), and after the global financial crisis. The data for the three periods showed no
related relationship between pay and performance. However, the strength of the
compensation and performance relationship did change in the South African banking sector
over the three periods. In Tables 4.8 to 4.10, the period analysis revealed strong positive and
significant relationships in the first period (2007 to 2008). The p-value was greater than the
0.05 significant levels, during the second period (2008 to 2009), and the results revealed an
irrelevant relation between CEO pay and firm performance. During the later period, 2009 to
2018, a moderate positive and significant relationship association was displayed. This finding
concurred with a study conducted by Bezuidenhout (2016), as well as Priem (2016), who
observed that the strength of relationships is quite different, in a different period. The findings
suggest that the CEO remuneration was aligned to the returns for shareholders, except for the
financial recession period, as the pay structure was not adjusted during the time that the firm
performance was poor.
The predicament of Chinese and South African companies could have been overcome by
adjusting the pay structure. The findings suggest that the South African banks had a better
relationship between CEO compensation and firm performance, with a smaller income gap
than the Chinese banks, which had a bad pay-performance structure. The researcher is of the

92
opinion that South African banks could improve the returns for shareholders, and reduce the
income gaps by optimizing the pay-performance structure, while Chinese banks could solve
their income inequality problems by practicing the pay for performance method.
5.3. Limitations and future research
This study provided meaningful insights into the association between the CEO income and
performance variables; however, the limitations of this research are obvious. The limitations
are as followings:
• Industry limitation: the researcher only considered the bank sector in this current
study. Therefore, the findings could not represent the situation of other industries, or
sectors. Future studies could add more companies from other sectors and industries.
• Time limitation: the researcher only selected five banks from each country and used
data from 2007 to 2018; therefore, the samples might be unrepresentative. Future
studies could extend the time range and the range of banks.
• Resource limitation: the remuneration package considered in this current study was
only fixed salaries, pensions, perquisites, bonuses, and employee benefits paid to
directors. Some of the banks did not disclose the exact amount for each component;
therefore, the researcher did not analyse the relationship between each remuneration
component to the firm performance. Future studies could distinguish the relationship
between firm performances with each of the salary components.
• Performance components limitation: In this current research, the researcher only
used four performance components, which is not comprehensive enough.
• Influencing factors limitation: The CEO remuneration might be influenced by other
factors, and not only corporation performance. However, in this current research, the
researcher only considered ROE, ROA, TSR, and NOPAT. Future studies could
explore whether the strength of the relationship between pay and performance varies,

93
when the company, or CEO, has different subject elements, such as Company size,
CEO gender, CEO age, and qualifications of CEOs.
5.4. Chapter summary
In this chapter, the researcher discussed the research results, analysed each question in-depth,
and linked the findings of this current study with relevant previous literature. This current
research accepts the null hypothesis that CEO remuneration is not aligned to enterprise
performance for Chinese banks, as the findings revealed that CEO income is not correlated to
the company performance of Chinese banks. However, this current study rejects the null
hypothesis that CEO remuneration is not aligned to firm performance for South African
banks, as the analysis revealed a strong positive and significant relationship between pay and
performance for South African banks. Additionally, the analysis results revealed that this
relationship presented as an irrelevant relationship, during the financial crisis from 2008 to
2009.
In the following chapter, the researcher reiterates the findings of the main question of this
current study, and presents the significance, as well as the conclusion of this current study.

94
CHAPTER SIX
CONCLUSION
6.1. Introduction
The relationship between CEO compensation and returns to shareholders has become a
widely discussed topic in academia and the public. Some scholars allege that most CEOs are
overpaid, in relation to the shareholders’ value they create (Bezuidenhout, 2016). Therefore,
if there is no meaningful relationship between CEOs’ compensation and the returns to
shareholders, this allegation is supported.
In the first chapter, the researcher introduced the research problems and the background of
this current research topic. In Chapter Two, a literature review of the research topic was
provided, which included a review of previous researches, and the theoretical basis of the
relationship between CEO remuneration and shareholders’ value was discussed. In Chapter
Three, the researcher discussed the research methodology and explained the variables of this
research. In Chapter Four, the data were analysed, and the findings of the research presented.
The previous chapter comprised a discussion for the key research questions, as well as the
limitations of this study.
In this chapter, the researcher first reiterates the original intention of conducting this study
and outlines the key points of the methodology. Subsequently, the researcher summarises the
key findings of this current study, which is followed by recommendations to shareholders,
and suggestions for further research.
6.2. The original intention of this research
The original intention in conducting this research was to explore the value that the CEOs
95
created for shareholders, as well as the high remunerations they enjoyed, by comparing South
African and Chinese holding banks. As explained in Chapter 1, the South African economy
was devastated during the financial crisis, and in recent years, the economy has showed a
declining tendency again. However, in contrast to the national economic downturn, CEO
compensation has increased year on year. In addition, although the Chinese economy
survived the global financial crisis, the “income inequality” and “different pay for the same
work” were still severe problems in the Chinese society. Therefore, the intention of the
researcher was to explore whether CEOs in China and South Africa were worth what they
were contributing to shareholders.
6.3. Research methodology overview
In this current research, the researcher applied a longitudinal quantitative approach to
ascertain whether compensation aligns with firm performance. Secondary data were collected
from 10 banks’ annual reports, and analysed, in an effort to answer the research question. The
researcher selected 5 banks each from South Africa and China, respectively, as the sample in
this current study. The variables comprised CEO compensation, as well as firm performance
components. The CEO compensation components were the independent variables, which
included fixed pay, bonuses, and benefits. The firm performance components, the dependent
variables, were ROE, ROA, TSR, and NOPAT. The researcher used SPSS to create multiple
linear regressions, and the p-value of 5% was used as a standard to test the significant
correlations between the variables. The results were discussed in Chapter 5 and Chapter 6.
The researcher divided the 11 years (from 2007 to 2018) into three periods, and explained the
results of each period for the South African, as well as Chinese banks.
6.4. Key Findings
Critics claim that the link between CEO compensation and returns to shareholders is weak, as
CEOs are overpaid, in relation to the value they create. The strong positive and significant

96
relationship that South African banks displayed, seems to contradict the claim. However, after
analysing the three divided periods, the strength of the relationship revealed a declining trend.
Although, the current situation is still acceptable, it is anticipated that the strength of the
correlation returns to the same level as before 2018 (Shaw, 2011).
No apparent correlation between CEO remuneration and firm performance for Chinese banks
indicates the weakness of the pay-performance structure in China. Whether CEOs are
overpaid, compared to what they create, or paid less, these types of results are all
disadvantageous to the companies’ development. Overpaying CEOs causes shareholders’
value to shrink, as well as an income inequality problem. However, underpaying a CEO,
could cause the brain drain problem, or CEO corruption problems.
6.5. Recommendations
6.5.1. Recommendations to shareholders
Regarding the results of this current study, the main challenge of the pay-performance
relationship was the inadequately designed CEO compensation framework, which
caused the CEOs’ self-interest behaviour. Therefore, it is recommended that South
African companies adjust the CEO compensation framework, according to the present
national conditions; and Chinese companies build a new compensation framework that
could link the CEO salary with the firm performance, perfectly. Additionally, the
income inequality problem could be solved by a reasonable compensation framework.
Additionally, an executive’s supervision department is crucial to ensure that CEOs
work for the interests of shareholders, and not their own. The development of financial
organizations requires a formidable legal environment, as well as an effective
regulatory system that could reduce, and avoid many enterprise management loopholes,
including, but not limited to, abuse of authority.

97
6.5.2. Recommendations for future research
In future research, a larger sampling group should be considered, as the researcher only
selected 10 banks as a sample in this current study. More compensation components, as
well as firm performance components should also be considered in the future, as more
variables could make the research more rigorous. Additionally, different types of
industries should be considered in the future, as the financial sector might not represent
the situation for the whole economic system. In the researcher’s opinion, more elements
that could affect the compensations, should be considered, as well.
6.6. Conclusion
In summary, the findings revealed that the relationship between CEO remuneration and
shareholders’ value at South African, as well as Chinese banks, were all weak. Whether the
irrelevant result of Chinese banks, or the declining situation of South African banks, they
were all unfavourable to economic development. Therefore, according to the researcher, the
need for an effective compensation structure, as well as an executives’ supervision
department, are significant and meaningful.

98
REFERENCES
Abowd, J. (1990). Does performance-based managerial compensation affect corporate
performance? Industrial and labor relations review, 43(3), 52S–73S.
Abowd, J. M., & Kaplan, D. S. (1999). Executive compensation: six questions that need
answering. Journal of Economic Perspectives, 13(4), 145–168.
Absa Group Limited [ABSA]. (2019). Overview. (Online). Retrieved from https://www.
absa.co.za/about-us/absa-bank/
Alvaredo, F., Chancel, L., Piketty, T., Saez, E., & Zucman, G. (Eds.). (2018). World
inequality report 2018. London, England, United Kingdom: Belknap Press.
Amadeo, K. (2019, December 19). It’s good that China’s growth is slowing. Really. The
Balance. Retrieved from https://www.thebalance.com/china-s-economic-growth-cause-
pros-cons-future-3305478.
Andrews, K. R. (1980). The concept of corporate strategy (Rev. ed.). Homewood, IL., USA:
R.D. Irwin.
Ayaba, O. H. (2012). Chief executive officer’s (CEO’s) educational background and firm
performance: An empirical study on manufacturing and IT listed firms in the Stockholm
Stock Exchange (Unpublished master’s thesis). Umeå School of Business and Economics,
Umeå, Sweden.
Bacidore, J. M., Boquist, J. A., Milbourn, T. T., & Thakor, A. V. (1997). The search for the
99
best financial performance measure. Financial Analysts Journal, 53(3), 11–20.
Barnard, C. I. (1968). The functions of the executive (Vol. 11). London, England, United
Kingdom: Harvard University Press.
Bender, R., & Moir, L. (2006). Does ‘best practice’ in setting executive pay in the UK
encourage ‘good’ behaviour? Journal of Business Ethics, 67(1), 75–91.
Berle, A. A., & Means, G. C. (1932). The Modern Corporation and Private Property. New
York, NY., USA: MacMillan.
Bezuidenhout, M. L. (2016). The relationship between CEO remuneration and company
performance in South African state-owned entities (Unpublished doctoral dissertation).
University of South Africa, Cape Town, Western Cape, South Africa.
Bhagat, S., & Bolton, B. (2008). Corporate governance and firm performance. Journal of
Corporate Finance, 14(2008), 257–273.
Bland, J. M., & Altman, D. G. (1996). Statistics notes: measurement error. British Medical
Journal, 312(7047), 1654.
Bratton, W. W. (2001). Berle and Means reconsidered at the century’s turn. Journal of
Corporation Law, 26(3), 737–770.
Brothwell, R. (2020, March 04). South Africa lost 1 million jobs because of the 2008
recession – Here’s why this one could be even worse. Businesstech. Retrieved from
https://businesstech.co.za/news/technology/379079/south-africa-lost-1-million-jobs-beca

100
use-of-the-2008-recession-heres-why-this-one-could-be-even-worse/.
Burton, R. M., Lauridsen, J., & Obel, B. (2002). Return on Assets loss from situational and
contingency misfits. Management science, 48(11), 1461–1485.
Businesstech staff writer. (2019, December 11). Eskom, SAA, SAPO and all the other state
companies the South African Government has run into the ground. Businesstech.
Retrieved from
https://businesstech.co.za/news/government/361454/eskom-saa-sapo-and-all-the-other-st
ate-companies-the-south-african-government-has-run-into-the-ground/.
Bussin, M. (2012). Remuneration handbook for Africa (3rd ed.). Randburg, Johannesburg,
Gauteng, South Africa: Knowledge Resources Publishing Pty Ltd.
Campbell, A. F. (2019, June 26). CEOs made 287 times more money last year than their
workers did. [online] Vox. Retrieved from
https://www.vox.com/policy-and-politics/2019/6/26/
18744304/ceo-pay-ratio-disclosure-2018
Capitec Bank Limited [Capitec]. (2019). Overview. (Online). Retrieved from https://www.
capitecbank.co.za/about-us/
Chen, J. (2020, February 22). Corporate Social Responsibility (CSR). Investopedia. Retrieved
from https://www.investopedia.com/terms/c/corp-social-responsibility.asp.
Chen, J. J., Zhang, H., Xiao, X., & Li, W. (2011). Financial crisis and executive remuneration
in banking industry–an analysis of five British banks. Applied Financial

101
Economics, 21(23), 1779–1791.
China CITIC Bank [CNCB]. (2019). Overview. (Online). Retrieved from https://www.group.
citic/en/About_CITIC/Brief_Introduction/
China Industrial Bank [CIB]. (2019). Overview. (Online). Retrieved from https://www.cib.
com.cn/en/aboutCIB/investor/profile/index.html
China Merchants Bank [CMB]. (2019). Overview. (Online). Retrieved from http://english.
cmbchina.com/CmbInfo/About/DetailInfo.aspx?guid=ce1230c5-de69-441a-8861-d520fe
3d287c
China Minsheng Bank [CMBC]. (2019). Overview. (Online). Retrieved from http://en.cmbc.
com.cn/CMBCToday/AboutCMBC/IntroductiontoCMBC/index.htm
Chinese Ministry of Finance [MOF]. (2009). Enterprise performance evaluation benchmarks
2009. ISBN: 9787505881600. Retrieved from https://book.douban.com/subject/3741288/
Chiu, B., & Lewis, M. (2006). Reforming China’s state-owned enterprises and banks.
Northampton, MA., USA: Edward Elgar Publishing. Retrieved from https://ideas.repec.
org/b/elg/eebook/3354.html.
Chow, G. C. (2018). China’s economic transformation. In R. Garnaut, L. Song & C. Fang
(Eds.), China’s 40 years of Reform and Development: 1978 – 2018, (pp. 93–115). Acton,
Canberra, ACT., Australia: ANU Press. Retrieved from http://library.oapen.org/bitstream/
id/c709fb14-9dbb-481a-be8d-a3fe23714ac8/book(5).pdf#page=121.

102
Clarkson, P. M., Walker, J., & Nicholls, S. (2011). Disclosure, shareholder oversight and the
pay– performance link. Journal of Contemporary Accounting & Economics, 7(2), 47–64.
Collier, D., Idensohn, K., & Adkins, J. (2010). Income inequality and executive remuneration:
assessing the role of law and policy in the pursuit of inequality. South African Journal of
Labour Relations, 34(2), 84–109.
Coombs, J. E, & Gilley, K. M. (2005). Stakeholder management as a predictor of CEO
compensation: Main effects and interactions with financial performance. Strategic
Management Journal, 26(2005), 827–840.
Core, J. E., & Guay, W. R. (2010). Is CEO pay too high and are incentives too low? A
wealth-based contracting framework. Academy of Management Perspectives, 24(1), 5-19.
Core, J. E., Holthausen, R. W., & Larcker, D. F. (1999). Corporate governance, chief
executive officer compensation, and firm performance. Journal of financial
economics, 51(3), 371-406.
Crotty, A., & Bonorchis, R. (2006). Executive pay in South Africa: Who gets what and why?
Cape Town, Western Cape, South Africa: Juta and Company Ltd.
Dalton, D. R., & Aguinis, H. (2013). Measurement malaise in strategic management studies:
The case of corporate governance research. Organizational Research Methods, 16(1),
88–99.
Damilola, A. O. (2020). The determinants of CEO compensation in Nigeria. Retrieved from
http://lnu.diva-portal.org/smash/get/diva2:1435916/FULLTEXT01.pdf.

103
Du, J., & Choi, J. N. (2010). Pay for performance in emerging markets: Insights from
China. Journal of International Business Studies, 41(4), 671–689.
Doucouliagos, H., Haman, J., & Askary, S. (2007). Directors’ remuneration and performance
in Australian banking. Corporate governance: an international review, 15(6),
1363–1383.
Eichholtz, P. M., Kok, N., & Otten, R. (2008). Executive compensation in UK property
companies. The Journal of Real Estate Finance and Economics, 36(4), 405–426.
Ericson, R. N. (2011). Benchmarking for executive incentive pay: The importance of
performance standards. Compensation and Benefits Review, 43(2), 92–99.
Farkas, C. M., & Wetlaufer, S. (1996). Managing people – The Ways Chief Executive
Officers Lead. Harvard Business Review on Leadership. May–June 1996 Issue. Boston,
MA., USA: Harvard Business School Press, Retrieved from https://hbr.org/1996/05/
the-ways-chief-executive-officers-lead.
Farmer, M., Archbold, S., & Alexandrou, G. (2013). CEO compensation and relative
company performance evaluation: UK evidence. Compensation & Benefits Review, 45(2),
88–96.
Feltham, L. (2016, August 23). President Zuma set to steer South Africa’s new parastatal
strategy. The Mail & Guardian. Retrieved from
https://mg.co.za/article/2016-08-23-president-zuma-set-to-sit-at-the-helm-of-south-africa
s-state-owned-enterprises/.

104
Fernandez, P. (2001, May 22). EVA, economic profit and cash value added do not measure
shareholder value creation. 18pp paper for IESE Business School. Camino del Cerro del
Aguila, 328023, Madrid, Spain. Retrieved from http://citeseerx.ist.psu.edu/viewdoc/
download?doi=10.1.1.201.9225&rep=rep1&type=pdf
Finkelstein, S., & Boyd, B. K. (1998). How much does the CEO matter? The role of
managerial discretion in the setting of CEO compensation. Academy of Management
Journal, 41(2), 179–199.
First Rand Bank Limited, First National Bank [FNB]. (2019). Overview. (Online). Retrieved
from https://www.fnb.co.za/about-fnb/about-us.html
Firth, M., Leung, T. Y., Rui, O. M., & Na, C. (2015). Relative pay and its effects on firm
efficiency in a transitional economy. Journal of Economic Behavior & Organization, 110,
59–77. http://dx.doi.org/10.1016/j.jebo.2014.12.001
Fortune (2018). Global 500. Retrieved from https://fortune.com/global500/
Frydman, C., & Jenter, D. (2010). CEO compensation. Annu. Rev. Financ. Econ., 2(1),
75–102.
Fu, Y. (2018, July 30). How big is the income gap in China? Retrieved from
https://www.huxiu.com/article/254979.html?h_s=h9
Girma, S., Thompson, S., & Wright, P. W. (2007). Corporate governance reforms and
executive compensation determination: Evidence from the UK. The Manchester
School, 75(1), 65–81.

105
Glick, M. B. (2013). The development of an instrument for measuring role perceptions of US
Chief Executive Officers. Modern Management Science and Engineering, 1(1), 58–78.
Goldberg, S. R., & Godwin, J. H. (2001). Your merger: Will it really add value? Journal of
Corporate Accounting & Finance, 12(2), 27–35.
Graafland, J., Kaptein, M., & Mazereeuw-van der Duijn Schouten, C. (2010). Motives of
Socially Responsible Business Conduct. Discussion Paper. Series No. 2010-74. Tilburg
University, Center for Economic Research, Tilburg, The Netherlands. Retrieved from
https://www.researchgate.net/publication/46433746_Motives_of_Socially_Responsible_
Business_Conduct
Gregg, P., Jewell, S., & Tonks, I. (2005). Executive Pay and Performance in the UK
1994-2002. Bristol, England, United Kingdom: The Centre for Market and Public
Organisation 05/122, Department of Economics, University of Bristol. Retrieved from
https://ideas.repec.org/p/bri/cmpowp/05-122.html
Hambrick, D. C., & Quigley, T. J. (2014). Toward more accurate contextualization of the
CEO’s effect on firm performance. Strategic Management Journal, 35(4), 473–491.
Hassan, S., & Theo, C. (2003). Directors’ remuneration and firm performance: Malaysian
evidence. Malaysian Accounting Review, 2(1), 57–67.
Hayes, R. M., & Schaefer, S. (2009). CEO pay and the Lake Wobegon effect. Journal of
Financial Economics, 94(2), 280–290.
Haynes, T. H., Campbell, J. T., & Hitt, M. A. (2014). When more is not enough: Executive

106
greed and its influence in shareholder wealth. Journal of Management, 20(10), 1–30.
Hohnen, P., & Potts, J. (2007). Corporate social responsibility: An implementation guide for
business. Winnipeg, Manitoba, Canada: International Institute for Sustainable
Development. Retrieved from https://www.iisd.org/pdf/2007/csr_guide.pdf
Huang, R. (2010). Because I’m worth it? CEO pay and corporate governance. Business
Review, Q3 (2010), 12–19. Retrieved from https://core.ac.uk/download/pdf/6322473.pdf.
Hunt, M. H. (2004). The World Transformed: 1945 to the Present. Boston, MA., USA:
Bedford/St. Martin’s. ISBN 978-0312245832.
Investing answers. (2019, 1st October). Net Operating Profit After Tax (NOPAT). Retrieved
from https://investinganswers.com/dictionary/n/net-operating-profit-after-tax-nopat
Investopedia. (2020, February 18). How did the 2008 financial crisis affect the oil and gas
sector? Investopedia. Retrieved from https://www.investopedia.com/ask/answers/052715/
how-did-financial-crisis-affect-oil-and-gas-sector.asp.
Jensen, M. C., & Murphy, K. J. (1990). Performance pay and top-management incentives.
Journal of Political Economy, 98(2), 225–264.
Jondeau, E., & Rockinger, M. (2003). Conditional volatility, skewness, and kurtosis:
existence, persistence, and comovements. Journal of Economic dynamics and
Control, 27(10), 1699–1737.
Johannesburg Stock Exchange [JSE]. (2019). Overview. (Online). Retrieved from

107
https://www.jse.co.za/about/history-company-overview.
Kannan, P., & Koehler-Geib, F. (2009, December 03). Why Did The Crisis Go Global? VOX,
CEPR Policy Portal. Retrieved from https://voxeu.org/article/why-did-crisis-go-global.
Kato, T., & Kubo, K. (2006). CEO compensation and firm performance in Japan: Evidence
from new panel data on individual CEO pay. Journal of the Japanese and International
Economies, 20(1), 1–19.
Keeley, B. (2015). Income Inequality: The Gap between Rich and Poor. Paris, France: OECD
Insights, OECD Publishing. http://dx.doi.org/10.1787/9789264246010-en
Kenton, W. (2019, August 18). How Chief Executive Officers (CEOs) Work. Investopedia.
Retrieved from https://www.investopedia.com/terms/c/ceo.asp
Kim, J., Kogut, B., & Yang, J. (2013). Executive Compensation, Fat Cats and Best Athletes.
Columbia Business School Research Paper [online]. Retrieved from http://ssrn.com
/abstract=1948531.
King, M., Engelbrecht, L., Katz, M., & Ramalho, A. (2009). The King III Report on
corporate governance for South Africa. Retrieved from https://cdn.ymaws.com/
www.iodsa.co.za/resource/resmgr/king_iii/King_Report_on_ Governance_fo.pdf.
King Committee on Corporate Governance, & King, M. E. (2016). King IV Report on
corporate governance for South Africa 2016. Institute of Directors in Southern Africa.
Retrieved from https://studynotesunisa.co.za/wp-content/uploads/2018/12/King-IV-
Report-on-Corporate-Governance-for-South-Africa-2016.pdf
108
Kirkpatrick, G. (2009). The corporate governance lessons from the financial crisis. OECD
Journal: Financial Market Trends, 2009(1), 61–87.
Kopp, C. (2020, June 17). How income inequality works. Investopedia. Retrieved from
https://www.investopedia.com/terms/i/income-inequality.asp
Kotler, P., & Lee, N. (2008). Corporate social responsibility: Doing the most good for your
company and your cause. Hoboken, NJ., USA: John Wiley & Sons.
Kotter, J. P. (2001). Best of HBR: What leaders really do. Havard Business Review
(December 2001), 1–12. Boston, MA., USA: Harvard Business School Publishing
Corporation. Retrieved from https://enterprisersproject.com/sites/default/files/What%
20Leaders%20 Really%20Do.pdf
Lambrechts, L. J. [Ed.]. (1992). Financial Management (4th ed.). Pretoria, Gauteng, South
Africa: J. L. van Schaik.
Lazear, E. P., & Rosen, S. (1981). Rank-order tournaments as optimum labor
contracts. Journal of political Economy, 89(5), 841–864.
Leedy, P. D., & Ormrod, J. E. (2015). Practical Research: Planning and Design (11th ed.).
London, England, United Kingdom: Pearson Education Limited.
Leidecker, J. K., Bruno, A. V., & Yanow, A. (1988). A delicate balance: The two functions of
the CEO. Management Review, 77(8), 18.
Leng, Z. H., Fu, C. J., & Xu, X. P. (2015). Family income structure, income gap, and land

109
circulation: A microscopic analysis based on CFPS data. Econ Rev, 195, 111–128.
Li, L., Willett, T. D., & Zhang, N. (2012). The effects of the global financial crisis on China's
financial market and macroeconomy. Economics Research International, 2012 (Article
ID 961694), 1–6. http://dx.doi.org/10.1155/2012/961694
Lin, T. C. (2013). CEOs and Presidents. UCDL Rev., 47(2013), 1351.
Lin, B. X., & Lu, R. (2009). Managerial power, compensation gap and firm performance
–Evidence from Chinese public listed companies. Global Finance Journal, 20(2),
153–164.
Lin, X., & Zhang, Y. (2009). Bank ownership reform and bank performance in
China. Journal of Banking & Finance, 33(1), 20–29.
Luo, Y., & Jackson, D. (2012). Executive compensation, ownership structure and firm
performance in Chinese financial corporations. Global Business and Finance
Review, 17(1), 56–74.
Marais, H. (2009). The impact of the global recession on South Africa. Elcano Newsletter,
(58), 1–9.
Margolis, J., & Elfenbein, H. (2008). Doing well by doing good: Don’t count on it. Harvard
Business Review, 86(1), 19–20.
Mascarenhas, B. 2009. The emerging CEO agenda. Journal of International Management,
15(3), 245–250.

110
McKenzie, R., Mfongeh, G., Mohamed, S., Ncube, P., & Strauss, I. (2017). The South
African Financial System. FESSUD, Johannesburg, South Africa. Retrieved from
http://fessud.eu/wp-content/uploads/2012/08/FESSUD_The-South-African-Financial-
System_15.pdf
Mengistae, T., & Colin Xu, L. (2004). Agency theory and executive compensation: The case
of Chinese state-owned enterprises. Journal of labor Economics, 22(3), 615–637.
Merhebi, R., Pattenden, K., Swan, P. L., & Zhou, X. (2006). Australian chief executive
officer remuneration: pay and performance. Accounting & Finance, 46(3), 481–497.
Murphy, K. (1985). Corporate performance and managerial remuneration: an empirical
analysis. Journal of Accounting and Economics, 7(1-3), 11–42.
Murphy, K. (1986). Incentives, learning and compensation: A theoretical and empirical
investigation of labour contracts. Rand Journal of Economics, 17(1), 59–76.
Murphy, K. J. (1998). Executive pay. CEO Publications. G98-9(397), 1–91.
Naik, M. (2016). Executive director remuneration, company performance and executive
director profiles for South African companies listed on the Johannesburg Stock Exchange
[JSE] (Unpublished doctoral dissertation). University of the Witwatersrand,
Johannesburg, Gauteng, South Africa. Retrieved from https://pdfs.semanticscholar.org/
d4ee/4ae3c380 c23a4daed497da1bd4d58a6f2fad.pdf
National Bureau of Statistics of China [NBoSoC]. (2017). China Statistical Yearbook
2017. Beijing, China: China Statistics Press.

111
Nedbank Limited [Nedbank]. (2019). Overview. (Online). Retrieved from https://www.
nedbank.co.za/content/nedbank/desktop/gt/en/aboutus/about-nedbank-group/Group-over
view.html
Nicola, C., Giuseppe, M., Martina, C., & Giuseppe, S. (2016). Relationship between CEO
pay and total shareholder return: an empirical analysis in the Italian context. Corporate
Ownership & Control, 13(4), 182–187.
Odainkey, H. N. & Simpson, S. N. Y. (2013). Ensuring accountability in state-owned
enterprises: Examining the role of annual reports from a middle income country’s
perspective. The Journal of Institute of Public Enterprise, 36(1 & 2), 2–19.
Organ, M. (2017). Cause Marketing – Definition. Retrieved from https://causemarketing.
com/research/cause-marketing-definition/
Otieno, D. O. A. (2011). The relationship between financial performance and executive
remuneration in South African State Owned Enterprises: An agency theory perspective.
(Unpublished master’s thesis). University of Johannesburg, Johannesburg, Gauteng,
South Africa.
Peck, R., Olsen, C., & Devore, J. L. (2015). Introduction to statistics and data analysis.
Boston, MA., USA: Cengage Learning.
Peel, G. (2008, November 24). Gold ready to rumble. FNArena. Retrieved from
http://staging.fnarena.com/index.php/2008/11/24/gold-ready-to-rumble/.
Pinto, J. E., Henry, E., Robinson, T. R., Stowe, J. D., & Wilcox, S.E. (2020). Equity Asset

112
Valuation. Toronto, Ontario, Canada: John Wiley & Sons.
Priem, C. M. (2016). Corporate governance, CEO compensation and total shareholder
returns in South Africa (Unpublished master’s thesis). University of the Western Cape,
Bellville, Western Cape, South Africa. Retrieved from http://etd.uwc.ac.za/xmlui/
bitstream/handle/11394/5586/Priem_cm_mcom_ems_2017.pdf?sequence=1&isAllowed=
y.
Puzzanghera, J. (2014, January 20). 85 richest people own as much as bottom half of
population, report says. Los Angeles Times. Retrieved from https://www.latimes.com/
business/la-fi-mo-oxfam-world-economic-forum-income-inequality-20140120-story.html
Rekker, S. A., Benson, K. L., & Faff, R. W. (2014). Corporate social responsibility and CEO
compensation revisited: Do disaggregation, market stress, gender matter? Journal of
Economics and Business, 72(2014), 84–103.
Rena, R., & Msoni, M. (2014). Global financial crises and its impact on the South African
economy: A further update. Journal of Economics, 5(1), 17–25.
Roux, A. (2017). Everyone’s guide to the South African economy (12th ed.). Cape Town,
Western Cape, South Africa: Zebra Press. Retrieved from https://books.google.co.za/
books?hl=en&lr=&id=iQ5bDwAAQBAJ&oi=fnd&pg=PT8&ots=9P6it_XldU&sig=6Yci
lJl45JaTECIKWCdJYAhQhsI&redir_esc=y#v=onepage&q&f=false
Russo, M. V., & Fouts, P. A. (1997). A resource-based perspective on corporate
environmental performance and profitability. Academy of Management Journal, 40(3),
534–559.

113
Scholtz, H. E., & Smit, A. (2012). Executive remuneration and company performance for
South African companies listed on the Alternative Exchange (AltX). Southern African
Business Review, 16(1), 22–38.
Sforza, L. (2013, November 22). Governance rules for executive pay – The EU and G20
perspectives [online]. Benefits & Compensation International. Retrieved from
https://www.slideshare.net/mslgroup/governance-rules-for-executive-pay-the-eu-and-g20
-perspectives-by-leonardo-sforza
Shanghai Pudong Development Bank [SPDB]. (2019). Overview. (Online). Retrieved from
https://www.sigchina.com/index.php?m=content&c=index&a=show&catid=72&id=12
Shanghai Stock Exchange [SSE]. (2019). Overview. (Online). Retrieved from
http://www.sse.com.cn/aboutus/sseintroduction/introduction/.
Shaw, P. (2011). CEO pay-performance sensitivity in South African financial services
company. (Unpublished MBA research report). Gordon Institute of Business Science,
University of Pretoria, Pretoria, Gauteng, South Africa.
Shenzhen Stock Exchange [SZSE]. (2019). Overview. (Online). Retrieved from
http://www.szse.cn/aboutus/sse/introduction/index.html.
Shim, E. D., & Kim, E. (2015). An empirical examination of the relationship between top
executive compensation and firm performance in the post Sarbanes-Oxley
period. Advances in Management Accounting, 25, 207-228.
Singh, P., & Agarwal, N. C. (2003). Executive compensation: Examining an old issue from

114
new perspectives. Compensation & Benefits Review, 35(2), 48–54.
South African Country Review of Collective Bargaining. (2010/2011). Collective Bargaining
support for building trade union organisation in Africa. Retrieved from
http://adapt.it/adapt-indice-a-z/wp-content/uploads/2015/02/ labour_relations_2010.pdf.
Stathopoulos, K., Espenlaub, S., & Walker, M. (2005). The compensation of UK executive
directors: lots of carrots but are there any sticks? Competition & Change, 9(1), 89–105.
Statistics South Africa [StatsSA]. (2018). P0441 – Gross Domestic Product [GDP] (4th
Quarter 2018). Statistics South Africa. Pretoria, Gauteng, South Africa. Retrieved from
http://www.statssa.gov.za/publications/P0441/P04414thQuarter2018.pdf
Surve, Y. (2008). The effect of institutional shareholders on the level and mix of South African
Chief Executive Officers’ compensation (Unpublished master’s thesis). University of the
Witwatersrand, Johannesburg, Gauteng, South Africa. Retrieved form https://core.ac.uk/
download/pdf/39666383.pdf
Swatdikun, T. (2013). Executive pay-performance sensitivity and its consequences: empirical
evidence on the role of ownership in Thailand (Unpublished doctoral dissertation).
University of Southampton, Southampton, England, United Kingdom. Retrieved from
https://eprints.soton.ac.uk/348683/1/Thesis_Trairong%2520Swatdikun%2520Final%252
0version.pdf
Tamasiunaite, I. (2016). CEO stock option compensation: Investigation of economic periods
(Unpublished master’s thesis). Erasmus School of Economics, Erasmus University
Rotterdam, Rotterdam, the Netherlands.

115
The Standard Bank of South Africa Limited [Standard Bank]. (2019). Overview. (Online).
Retrieved from https://standardbank.com/standimg/StandardBankGroup/web/aboutUs.
html
Theunissen, M. (2012). An application of Data Envelopment Analysis to benchmark CEO
remuneration (Unpublished doctoral dissertation). North-West University, Potchefstroom,
North West Province, South Africa.
Theunissen, M., & Oberholzer, M. (2013). An application of data envelopment analysis to
benchmark CEO remuneration: A South African study. The Journal of Applied Business
Research, 29(5), 1509–1522.
Tosi, H. L., Werner, S., Katz, J. P., & Gomez-Mejia, L. R. (2000). How much does
performance matter? A meta-analysis of CEO pay studies. Journal of Management, 26(2),
301–339.
Van Vugt, F. (2013). Examining the effects of a global crisis on CEO compensation: Fortune
100 evidence (Unpublished IBA Bachelor’s Thesis). University of Twente, Faculty of
Management and Governance, Enschede, The Netherlands.
Vieito, J. P. T. (2012). Gender, top management compensation gap, and company
performance: Tournament versus behavioral theory. Corporate Governance: An
International Review, 20(1), 46–63.
Virmani, A. (2005). China’s Socialist Market Economy: Lessons of Success. Working paper
No. 178). New Delhi, India: Indian Council for Research on International Economic
Relations (ICRIER).

116
Viviers, S. (2015). Institutional proxy voting in South Africa: Process, outcomes and
impact. South African Journal of Business Management, 46(4), 23–34.
Weaver, S. C. (2001). Measuring economic value added: A survey of the practices of EVA
proponents. Journal of Applied Finance, 11(1), 50–60.
Wegner, T. (2012). Applied Business Statistics. Methods and Excel-based applications.
Claremont, Cape Town, Western Cape, South Africa: Juta.
Wei, S. J. (2000). How taxing is corruption on international investors? Review of economics
and statistics, 82(1), 1–11.
Wells, H. (2002). The cycles of corporate social responsibility: An historical retrospective for
the twenty-first century. University of Kansas Law Review, 51, 77–140. Retrieved from
https://pdfs.semanticscholar.org/2388/284ee8b829a9fb1e4d53dd61a38f49ffa654.pdf.
WorldatWork. (2015). WorldatWork introduces Revised Total Rewards Model [online].
Retrieved from https://www.worldatwork.org/adimLink?id=78737
Xiao, C. (2004). What are the top executives responsible for? Discussion on CEO’s executive
power. Chinese and foreign enterprise culture Journal, 2004(05), 60–62.
Zhou, W., Georgakopoulos, G., Sotiropoulos, I., & Vasileiou, K. Z. (2011). The impact of
executive payment on firm performance of the financial enterprises in China. Asian
Social Science, 7(8), 65–80. http://dx.doi.org/10.5539/ass.v7n8p65
Zuma, J. (2012). Top executives should agree to wage freeze. Media statement by President

117
Jacob Zuma on the conclusion of the Social Dialogue Meeting on the State of the
Economy held on 17 October 2012 at Pretoria. Retrieved from
https://www.politicsweb.co.za/documents/top-executives-should-agree-to-wage-freeze--
jacob-
118
APPENDICES
Appendix A: English translation of Fu (2018) article.
HOW BIG IS THE INCOME GAP IN CHINA?
Author: Yifu Fu
At present, Chinese residents' consumption is showing a "grading" trend: On the one hand, the high-speed rail is full, the occupancy rate of five-star hotel rooms is rising, and the per capita shopping consumption abroad is leading the global consumption upgrade; on the other hand, the consumption can be cooked at home, never go to the restaurant, and the bicycle can be used as much as possible. The reason for this coexistence of ups and downs is that there is a large income gap between the residents, which in turn causes the differences in the marginal consumption tendencies of different income groups. So, how big is the income gap between Chinese people? After reading this article, you will have a relatively intuitive understanding. Resident income Gini coefficient has exceeded the warning line When measuring the income gap of residents, there is an internationally-used indicator called the Gini coefficient. Specifically, the value of the Gini coefficient is between 0 and 1. If the Gini coefficient is 0, it means that the income distribution between residents is an absolute average, that is, the income between people is completely equal; if the Gini coefficient is 1, then It shows that the income distribution among residents is absolutely unfair, and 100% of the income is completely occupied by the people in one unit. In other words, the smaller the Gini coefficient, the more even the income distribution, and the larger the Gini coefficient, the more uneven the income distribution. Internationally, 0.4 is usually used as a warning line for the gap between rich and poor. If the Gini coefficient is greater than this value, there is a

119
potential risk of social problems. Wind data shows that since the Gini coefficient of my country's residents' income exceeded the warning line for the first time in 2000, it generally showed a stable trend after climbing first. But it is worth noting that since 2003, the Gini coefficient has never been lower than 0.46, and in the past three years, it has increased year by year, from 0.462 in 2015 to 0.467 in 2017 (see Figure 1).
Figure 1
On this basis, we can further examine the number of residents in the country in five equal groups according to the statistical caliber of the China Statistical Yearbook and according to the different income levels. It can be clearly seen from Figure 2 below that the top 20% of residents with the highest income level in China had a per capita disposable income of 5,925,5 yuan in 2016, far ahead of the other 80% of the population; even the middle-level For the upper-income group, the per capita disposable income in 2016 was only 31990.4 yuan, just over half of the high-income group; while the lowest income 20%, the per capita disposable income in 2016 was only 5528.7 yuan, less than the high-income group 1 /10.

120
Figure 2
The wage gap between different industries is large From the perspective of the industry to which the Chinese work belongs, the income gap between people in different industries is quite different. Since wages are the main source of income for the vast majority of people, we can look at the changes in the average wages in various industries. According to the classification standards for industries in the China Statistical Yearbook, it can be clearly seen that since reform and opening up, the industries with the highest per capita wages include power and gas, mining, finance, and information and computer software industries. As well as the information computer software industry (see Table 1). These industries generally exhibit two characteristics: First, they belong to the knowledge and capital-intensive field, and second, they are monopolistic and resource-based. In contrast, the average wage of agriculture, forestry, animal husbandry and fishery is almost always the lowest in all industries, which may be related to the low added value of agricultural products and labor-intensive characteristics.

121
Table 1
From the perspective of the wage gap, the gap between the electricity and gas industry with the highest per capita wage in 1978 and the social service industry with the lowest per capita wage was only 458 yuan. However, over time, the gap between the highest and lowest per capita wages has widened. By 2017, the information computer software industry with the highest per capita wage was 96,646 yuan more than the agriculture, forestry, animal husbandry and fishery with the lowest per capita wage, which means that a financial practitioner with an average salary can earn more than a farmer a year. Nearly 100,000 yuan, and this gap has a tendency to continue to increase. However, from the perspective of the ratio, since 2005, the relative gap between the highest and lowest industries in China's average wage level has gradually narrowed, which was 3.65 in 2017, but this value is still much higher than before 2000, reflecting The level of wage income among industries in China is still increasing. The urban-rural per capita disposable income gap is increasing The income gap between Chinese people is also reflected between urban and rural residents. Since the reform and opening up, my country’s urban and rural residents’ income levels have increased significantly. However, it cannot be ignored that the income gap between urban and rural residents is increasing.

122
Figure 3
As can be seen from Figure 3 above, in 1978, the per capita disposable income of urban and rural residents in China was 343.4 yuan and 133.6 yuan respectively; by 2017, the per capita disposable income of urban and rural residents rose to 36396 yuan and 13432 yuan, respectively, 1978 106 times and 100.5 times of the year. Judging from the gap between the disposable income of urban and rural residents over the years, it was 209.8 yuan in 1978, and it has climbed to 22964 yuan in 2017. However, judging from the income ratio of urban and rural residents, after a long-term climb, it has begun to decline in recent years, which was 2.71 in 2017, which is much lower than the 3.23 in 2010. This shows that although the absolute difference in income between urban and rural residents is increasing, the relative difference has eased. In general, China's urban and rural development is still uneven, the dual economic structure is still serious, rural productivity levels have long been lower than urban areas, and the household registration system has restricted the flow of rural population to urban areas; at the same time, due to the characteristics of agriculture itself, The added value of agricultural products is lower than that of industrial and service products, resulting in a relatively slow increase in farmers' income.
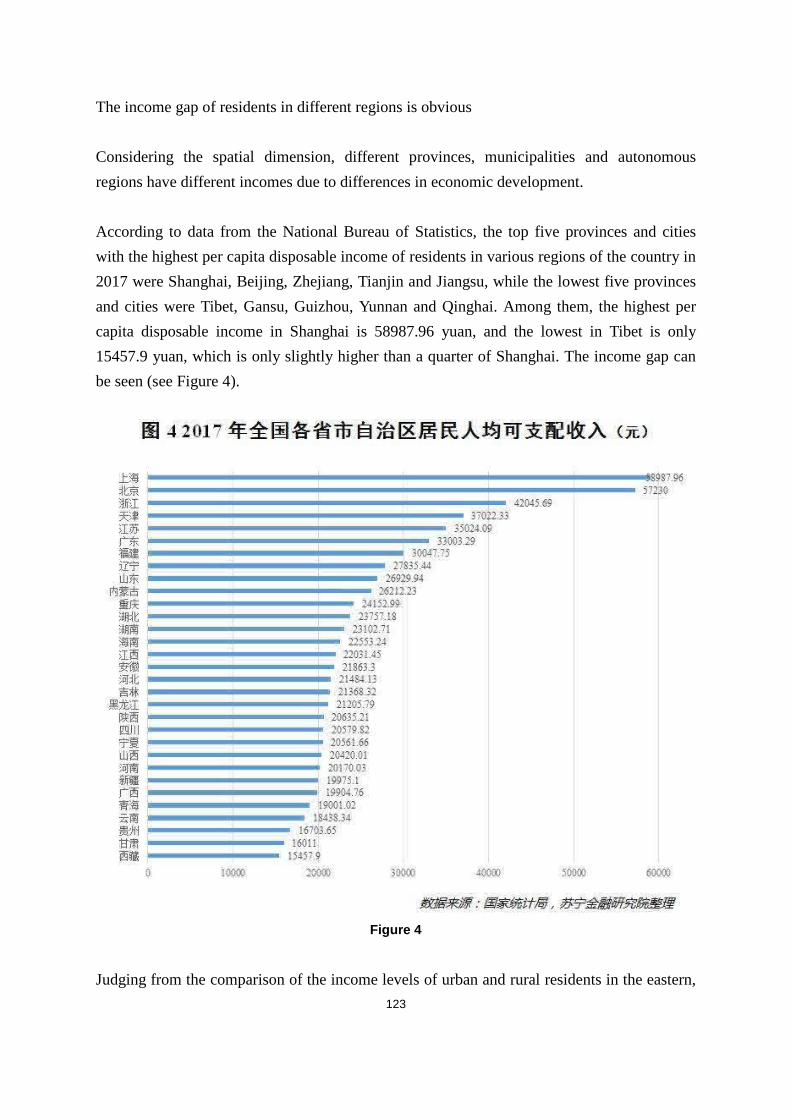
123
The income gap of residents in different regions is obvious Considering the spatial dimension, different provinces, municipalities and autonomous regions have different incomes due to differences in economic development. According to data from the National Bureau of Statistics, the top five provinces and cities with the highest per capita disposable income of residents in various regions of the country in 2017 were Shanghai, Beijing, Zhejiang, Tianjin and Jiangsu, while the lowest five provinces and cities were Tibet, Gansu, Guizhou, Yunnan and Qinghai. Among them, the highest per capita disposable income in Shanghai is 58987.96 yuan, and the lowest in Tibet is only 15457.9 yuan, which is only slightly higher than a quarter of Shanghai. The income gap can be seen (see Figure 4).
Figure 4
Judging from the comparison of the income levels of urban and rural residents in the eastern,

124
central, western and northeastern regions, the income levels of residents in the eastern region are significantly higher than those in the central, western and northeastern regions. According to 2016 data, from the perspective of per capita disposable income of urban residents, the eastern region is 1.39 times that of the western region; from the perspective of per capita disposable income of rural residents, the eastern region is 1.56 times that of the western region. If we compare the per capita disposable income of urban residents in the east and rural residents in the west, the gap is undoubtedly greater, the former is nearly four times that of the latter (see Table 2).
Table 2
It's time to strengthen the "people-oriented" thinking So far, through the inspection of the above dimensions, I believe that you have an overall grasp of the income status of the Chinese. No matter which aspect is analyzed, the large income gap between residents is not conducive to the long-term development of the national economy. It will not only cause insufficient domestic demand, but also affect the further optimization of the economic structure. Therefore, it is necessary for my country to make more efforts in regulating the distribution of national income, such as optimizing the redistribution link, rationally using fiscal and taxation tools, accelerating the pace of urbanization, and promoting the equalization of basic public services. In addition, as the country's material wealth is accumulating, we can appropriately change our thinking and shift the development theme to the overall improvement of the people's living standards and quality, that is, to strengthen the "people-based" thinking. For this, let’s take a look at the “National Income Multiplier Plan” that was launched in Japan in 1960 and achieved remarkable results ten years later. Its essence is to use the growth of national income to drive the growth of total economic growth, not the growth of total economic growth. To drive the growth of national income.

125
For ourselves, while facing the income gap of residents, we should also realize the value-added of ourselves and wealth through reasonable allocation of our assets, continuous improvement of our knowledge reserves, business level and various capabilities, so as to ensure that we can get more in the future. High income compensation.

126
Appendix B: Editorial Certificate