Embed Size (px)
Citation preview
International Journal of Business and Management Review
Vol.1, No.1, pp. 151-165, September 2013
Published by European Centre for Research Training and Development UK (www.ea-journals.org)
151
A COMPARATIVE STUDY ON PERFORMANCE EVALUATION OF PAKISTANI
MUTUAL FUNDS
Sadia Babar
MS Scholar
Department of Management Sciences
Muhammad Ali Jinnah University, Islamabad
Sania Nawaz
MS Scholar
Department of Management Sciences
Muhammad Ali Jinnah University, Islamabad
Sumaira Ashraf
Phd Scholar
Department of Management Sciences
Muhammad Ali Jinnah University, Islamabad
ABSTRACT: This paper evaluate and compare the performance of different categories of
Pakistani mutual funds, during seven year from 2004 to 2011.Mutual funds’ performance were
analyzed using various evaluation techniques; Sharpe, Treyno, Jensen’s alpha, Sortino,
Information/Appraisal ratio, Fama overall performance and performance attribution analysis.
The findings suggest that performance of the mutual funds measured with first five methods, does
not satisfy investors’ expectations based on the risk and return, mutual funds significantly under-
perform the market. Those mutual funds analyzed with the last two methods, are not offering
complete diversification thus managers fell short of matching expectations consistent with the
actual risk level of portfolio, they have also not made active decision involving both in allocation
of assets and in selection of individual security. This study facilitates the managers and investors
in taking effective investment decisions by measuring the performance of funds they can allocate
resources more efficiently in future.
KEYWORDS: Mutual funds, Pakistan, performance, Risk, Return, Investor
INTRODUCTION
Mutual fund industry has experienced remarkable growth in developed countries over the years;
however, it is still a present-day phenomenon in countries like Pakistan. In Pakistan, after
proving a considerable escalation of 62% of asset value during 2001 to 2008, the mutual fund
industry is experiencing hard times since 2008, lessening 40% from Rs.335 billion to close at
Rs.199 billion in Jun-10. Regardless of the robust growth in global mutual fund industry and the
heave of market capitalization, a typical investor in Pakistan is quiet dubious about investing in
the market. The basis for this skepticism is less information available about capital markets and
innate risk involved in various securities investment. All over the world, performance evaluation
International Journal of Business and Management Review
Vol.1, No.1, pp. 151-165, September 2013
Published by European Centre for Research Training and Development UK (www.ea-journals.org)
152
of mutual funds is a main issue of investigation in the field of investment/savings, primarily
because of its significance as medium for investment in the capital, bond and money markets for
both individuals and institutions.
Mutual funds were introduced in 1822, for the first time in Netherland; after a long time another
fund was formed in Scotland in 1880s, after few years American fund was established in 1889.
Although Pakistan was pioneer in establishing the mutual funds industry in South Asia when in
1962 government of Pakistan established first Open ended fund National Investment Trust
Limited (NITL), afterward in 1966 government body investment Corporation of Pakistan (ICP)
was established which launched series of 26 close ended funds, thereafter Pakistan experienced
aftershocks starting in 1988 due to adverse changes that flounced the Asian emerging markets.
To keep an eye on these changes historical assessment of funds is imperative to judge portfolio
performance and take remedial measures accordingly.
This is a comprehensive paper on all types of mutual funds in Pakistan by using survivorship
bias controlled sample. The main objective of paper is to compare and evaluate Pakistani mutual
funds’ performance with each other, with Bench mark (NIT) and with market (KSE 100 Index)
and also analyze which is the outperforming among all the funds during the period 2005 to 2011.
The techniques used for analysis of mutual funds are Sharp index, Treynor index, Jenson Alpha,
Fama overall performance, Information ratio, Sortino ratio and Tactical Asset Allocation. This
study facilitates the managers and investors in taking effective investment decisions; by
measuring the performance of funds they can allocate resources more efficiently in future.
Historical performance evaluation of funds will also help investors to judge portfolio manager’s
performance and therefore take corrective measures accordingly.
The paper proceeds as follows: the next section presents overview of the previous studies;
Section 3 describes sample, data sources and methodology used. Empirical results and
conclusion is discussed in section 4 of the study.
LITERATURE REVIEW
The background of mutual fund performance evaluation extends back over 50 years. In early
1960’s William F. Sharp worked on the portfolio theory. He was the first to introduce risk free
rate and the concept of efficient portfolio on Capital Market Line (CML). Further work on
expected rate of return led to Capital Asset Pricing Model (CAPM), undeniably well-known
model defined as the trade-off between risk and return for well diversified portfolios. Sharpe
(1964) while working on CAPM conceived a measure to assess the performance of mutual funds
and Sharpe (1966) developed the Sharp index of the historical returns in terms of risk free rate to
the standard deviation of portfolio returns. The study concluded that mutual funds underperform
the market and managers choose funds as good as market. Treynor (1965) concluded that
standard deviation measures systematic risk and unsystematic risk while in case of mutual fund
by creating portfolio, unsystematic risk is diversified and only systematic risk is left so beta
should be used in instead of standard deviation. Sharp (1966) also confirmed findings of Treynor
(1965) that Sharpe index and expense ratio is slightly not as good as Treynor index. Treynor and
Mazuy (1966) depicted investors are depended on the fluctuation in the market and the fund
manager cannot forecast the market changes
International Journal of Business and Management Review
Vol.1, No.1, pp. 151-165, September 2013
Published by European Centre for Research Training and Development UK (www.ea-journals.org)
153
.
Jensen (1968) argued that we are more concerned about the time series of expected returns of
portfolio. Managers who forecast market returns consistently and select undervalued returns will
earn higher returns; positive ∝ shows that the manager is superior in selection of stock, Jayadev
(1996).
Fama (1972) worked on the two main components of performance with main focus on overall
performance of funds. He argued that in case of fully diversified portfolio the difference between
the return an investor should have been earned according to the SML and would have been
earned according to the CML equals to zero. This paper also examined the measure for
unavoidable diversification due to the risk considered by managers.
Treynor (1973) presented information ratio also known as appraisal ratio, this statistic compute
average return on excess of that of a peer, benchmark, market and industry divided by the
standard deviation of that return in excess. Sortino (1986) states that risk is measured by
dispersion and it can be below or above the mean. Movement below the mean is risk because risk
is defined as probability of loss or actual outcomes differ from the expected outcome which
means deviation below the mean is risk not above the mean so downside risk should be
considered instead of total risk. Sharpe (1987) studied the integration of asset allocation which is
concerned with the optimization of net worth of the assets of investors, willingness to take risk
for the increase of the worth and also the future worth of the assets.
Howe and Pope (1996) first examined the relationship between funds Forbes equity fund rating
and performance, secondly predictability of Forbes equity fund rating. The results showed that
Forbes up-market rating helped in predicting beta and Forbes down-market rating predicts funds
returns and risk adjustment of returns of the time period greater than one year. Blake and
Timmerman (1998) evaluated the aggressive portfolio weights, individual fund’s portfolio
weights and active and passive management returns de-compositions into portfolios multiple
asset classes and reversion in the fund’s portfolio weights towards a common, time varying
allocation of mutual funds. It is analyzed that the revision of weights is slow and the cross
sectional variation arises from the strategic asset allocation, market timing and security selection
decision.
Redman, Gullett and Manakyan (2000) evaluated the risk-adjustment returns by using Sharp,
Treynor and Jensen Alpha measures during three sets of time period from 1985 to 1994, 1985 to
1989 and 1990 to 1994 for 5 international mutual funds the benchmark proxy is U.S market. The
result showed the market out-performed from 1985-1994 and during the period of 1985-1989 the
international funds out-performed both domestic and international market the third set of time
from 1990-1994 showed the decreased return of both international and domestic mutual funds.
Rao and Ravindran (2003) evaluated the Indian funds performance by using Relative
performance index, Risk-return analysis, Treynors, Sharpe, Jensen measure and Fama’s measure.
The return and risk was estimated 0.59% and 7.10% of the portfolio but market portfolio return
was 0.14% and risk 8.57.
Mebane (2006), Debasish (2009) and Amporn and Yosawee (2011) found that the returns of the
equity funds are positive and the investors can increase the risk-adjusted returns through
diversification of risk by taking timely moves. Kolbadi and Ahmadinia (2011) examined the
International Journal of Business and Management Review
Vol.1, No.1, pp. 151-165, September 2013
Published by European Centre for Research Training and Development UK (www.ea-journals.org)
154
effects of portfolio management on the investment companies of Tehran Stock Exchange by
using Sharpe, Sortino and Sterling ratio and taking period from 2005 to 2010. The outcome of
the Sharpe ratio illustrated better performance of investment companies compared to capital
market, but this was not supported by the results of Sortino and Sterling ratios.
Shah and Hijazi (2005) evaluated 13 mutual funds from 1997 to 2004 by using Sharpe, Treynor
and Jensen Alpha and find out that Sharpe measure of mutual funds 0.47 compared to market
which is 0.27 and Jensen measure also poses positive alpha, overall funds industry in Pakistan
outperform the market proxy by 0.86 percent. Sipra (2006) evaluated 33 mutual funds in
Pakistan from 1995 to 2004 and concluded that about 30% funds outperform the market. Gohar,
Ahmed and Urfa (2011) carried out a study on Pakistani mutual fund industry and concluded that
equity funds outperform income funds.
RESEARCH METHODOLOGY
To conduct the research following methodology is employed:
Sample Selection
The analysis includes 84 observations for each mutual fund, on monthly frequency. This study
gathered fund data of seven financial years from June 30, 2005 to June 30, 2011.
Data Collection
This research is entirely based on secondary data, gathered from different websites, journals and
managers reports of selected Mutual funds. The net asset value (NAV’s) of fund portfolio is
collected from (www.mufap.com, www.brecorder.com, www.alfalahsecurities.com and
www.kse.com). Risk free rate (6 month T-bill rate) and KIBOR rate are collected from website
of State Bank of Pakistan.
Methodology
Portfolio Returns
The monthly returns are computed as: NAV) beginning / NAV (endingln =RP
The return on the market portfolio is computed with KSE index as benchmark. KSE) beginningKSE/ (endingln = Rm
Measure of Risk
The risk is calculated on the basis of month-end NAV. The total risk of the fund returns and the
KSE returns were calculated as:
Eq (3)
Eq (4)
Systematic Risk: Beta
The measure of co-movement of fund with that of the market index Beta of a fund
1)-(N
^2 )Rf - Rp+Rf - (Rp=Funds)p(Mutual
1)-(N
^2 )Rf - Rm+Rf - (Rm=m(Market)
Var(rm)
,=
rmrpCov Eq (5)
Eq (2)
Eq (1)
International Journal of Business and Management Review
Vol.1, No.1, pp. 151-165, September 2013
Published by European Centre for Research Training and Development UK (www.ea-journals.org)
155
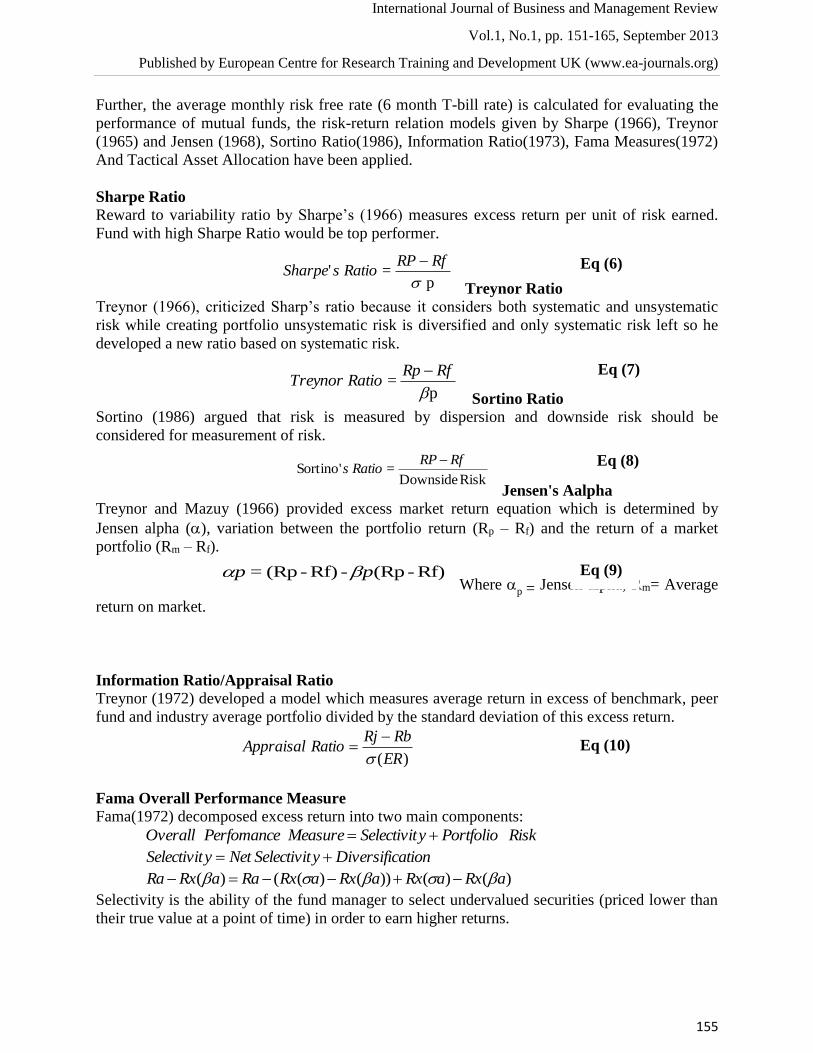
Further, the average monthly risk free rate (6 month T-bill rate) is calculated for evaluating the
performance of mutual funds, the risk-return relation models given by Sharpe (1966), Treynor
(1965) and Jensen (1968), Sortino Ratio(1986), Information Ratio(1973), Fama Measures(1972)
And Tactical Asset Allocation have been applied.
Sharpe Ratio Reward to variability ratio by Sharpe’s (1966) measures excess return per unit of risk earned.
Fund with high Sharpe Ratio would be top performer.
Treynor Ratio
Treynor (1966), criticized Sharp’s ratio because it considers both systematic and unsystematic
risk while creating portfolio unsystematic risk is diversified and only systematic risk left so he
developed a new ratio based on systematic risk.
Sortino Ratio
Sortino (1986) argued that risk is measured by dispersion and downside risk should be
considered for measurement of risk.
Jensen's Aalpha Treynor and Mazuy (1966) provided excess market return equation which is determined by
Jensen alpha (), variation between the portfolio return (Rp – Rf) and the return of a market
portfolio (Rm – Rf).
Where p = Jensen alpha, Rm= Average
return on market.
Information Ratio/Appraisal Ratio
Treynor (1972) developed a model which measures average return in excess of benchmark, peer
fund and industry average portfolio divided by the standard deviation of this excess return.
)(ER
RbRjRatioAppraisal
Fama Overall Performance Measure
Fama(1972) decomposed excess return into two main components:
RiskPortfolioySelectivitMeasurePerfomanceOverall
ationDiversificySelectivitNetySelectivit
)()())()(()( aRxaRxaRxaRxRaaRxRa
Selectivity is the ability of the fund manager to select undervalued securities (priced lower than
their true value at a point of time) in order to earn higher returns.
p='
RfRPRatiosSharpe
p=
RfRpRatioTreynor
Risk Downside='Sortino
RfRPRatios
Rf)-(Rp-Rf)-(Rp= pp
Eq (6)
Eq (7)
Eq (8)
Eq (9)
Eq (10)
International Journal of Business and Management Review
Vol.1, No.1, pp. 151-165, September 2013
Published by European Centre for Research Training and Development UK (www.ea-journals.org)
156
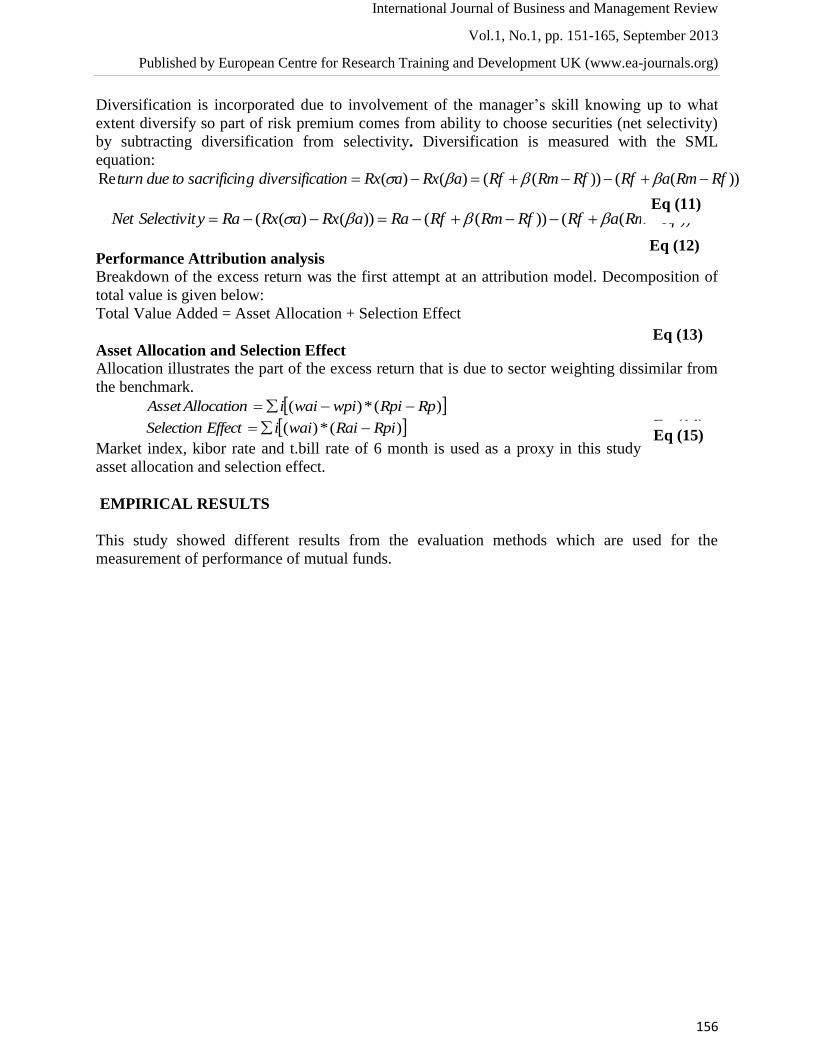
Diversification is incorporated due to involvement of the manager’s skill knowing up to what
extent diversify so part of risk premium comes from ability to choose securities (net selectivity)
by subtracting diversification from selectivity. Diversification is measured with the SML
equation:
))(())(()()(Re RfRmaRfRfRmRfaRxaRxationdiversificgsacrificintodueturn
))(())(())()(( RfRmaRfRfRmRfRaaRxaRxRaySelectivitNet
Performance Attribution analysis
Breakdown of the excess return was the first attempt at an attribution model. Decomposition of
total value is given below:
Total Value Added = Asset Allocation + Selection Effect
Asset Allocation and Selection Effect
Allocation illustrates the part of the excess return that is due to sector weighting dissimilar from
the benchmark.
)(*)( RpRpiwpiwaiiAllocationAsset
)(*)( RpiRaiwaiiEffectSelection
Market index, kibor rate and t.bill rate of 6 month is used as a proxy in this study to measure
asset allocation and selection effect.
EMPIRICAL RESULTS
This study showed different results from the evaluation methods which are used for the
measurement of performance of mutual funds.
Eq (11)
Eq (12)
Eq (14) Eq (15)
Eq (13)
International Journal of Business and Management Review
Vol.1, No.1, pp. 151-165, September 2013
Published by European Centre for Research Training and Development UK (www.ea-journals.org)
157
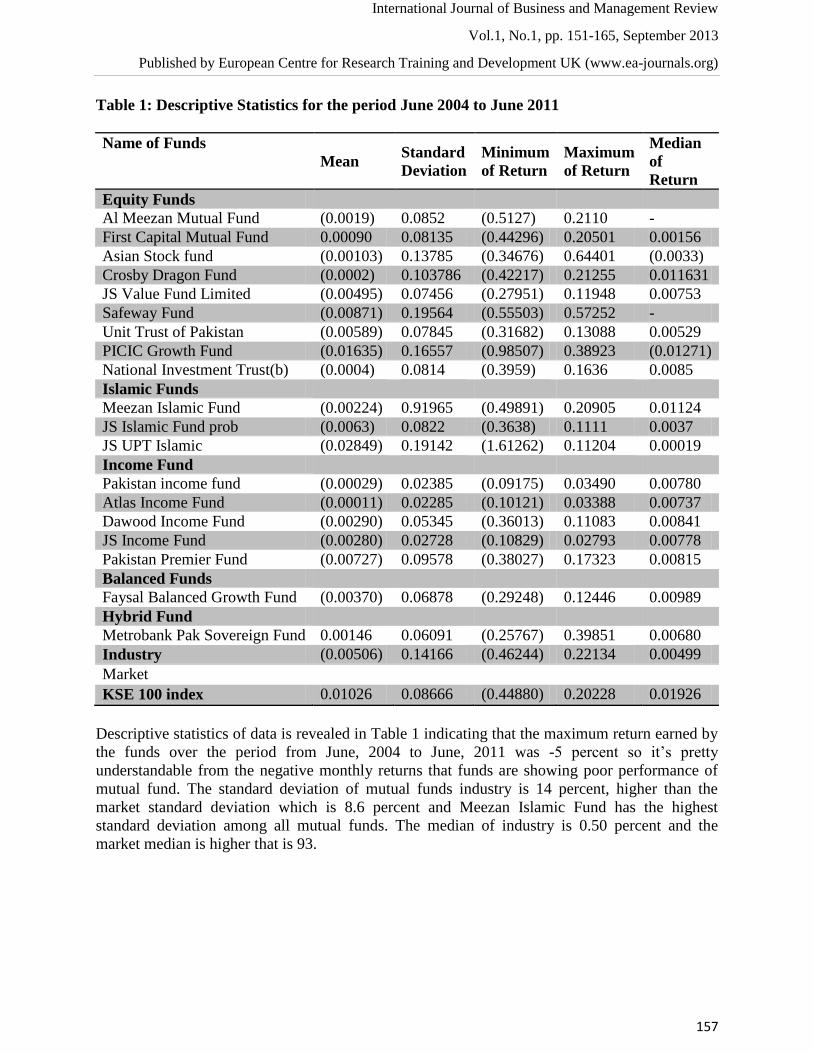
Table 1: Descriptive Statistics for the period June 2004 to June 2011
Name of Funds
Mean Standard
Deviation
Minimum
of Return
Maximum
of Return
Median
of
Return
Equity Funds
Al Meezan Mutual Fund (0.0019) 0.0852 (0.5127) 0.2110 -
First Capital Mutual Fund 0.00090 0.08135 (0.44296) 0.20501 0.00156
Asian Stock fund (0.00103) 0.13785 (0.34676) 0.64401 (0.0033)
Crosby Dragon Fund (0.0002) 0.103786 (0.42217) 0.21255 0.011631
JS Value Fund Limited (0.00495) 0.07456 (0.27951) 0.11948 0.00753
Safeway Fund (0.00871) 0.19564 (0.55503) 0.57252 -
Unit Trust of Pakistan (0.00589) 0.07845 (0.31682) 0.13088 0.00529
PICIC Growth Fund (0.01635) 0.16557 (0.98507) 0.38923 (0.01271)
National Investment Trust(b) (0.0004) 0.0814 (0.3959) 0.1636 0.0085
Islamic Funds
Meezan Islamic Fund (0.00224) 0.91965 (0.49891) 0.20905 0.01124
JS Islamic Fund prob (0.0063) 0.0822 (0.3638) 0.1111 0.0037
JS UPT Islamic (0.02849) 0.19142 (1.61262) 0.11204 0.00019
Income Fund
Pakistan income fund (0.00029) 0.02385 (0.09175) 0.03490 0.00780
Atlas Income Fund (0.00011) 0.02285 (0.10121) 0.03388 0.00737
Dawood Income Fund (0.00290) 0.05345 (0.36013) 0.11083 0.00841
JS Income Fund (0.00280) 0.02728 (0.10829) 0.02793 0.00778
Pakistan Premier Fund (0.00727) 0.09578 (0.38027) 0.17323 0.00815
Balanced Funds
Faysal Balanced Growth Fund (0.00370) 0.06878 (0.29248) 0.12446 0.00989
Hybrid Fund
Metrobank Pak Sovereign Fund 0.00146 0.06091 (0.25767) 0.39851 0.00680
Industry (0.00506) 0.14166 (0.46244) 0.22134 0.00499
Market
KSE 100 index 0.01026 0.08666 (0.44880) 0.20228 0.01926
Descriptive statistics of data is revealed in Table 1 indicating that the maximum return earned by
the funds over the period from June, 2004 to June, 2011 was -5 percent so it’s pretty
understandable from the negative monthly returns that funds are showing poor performance of
mutual fund. The standard deviation of mutual funds industry is 14 percent, higher than the
market standard deviation which is 8.6 percent and Meezan Islamic Fund has the highest
standard deviation among all mutual funds. The median of industry is 0.50 percent and the
market median is higher that is 93.
International Journal of Business and Management Review
Vol.1, No.1, pp. 151-165, September 2013
Published by European Centre for Research Training and Development UK (www.ea-journals.org)
158
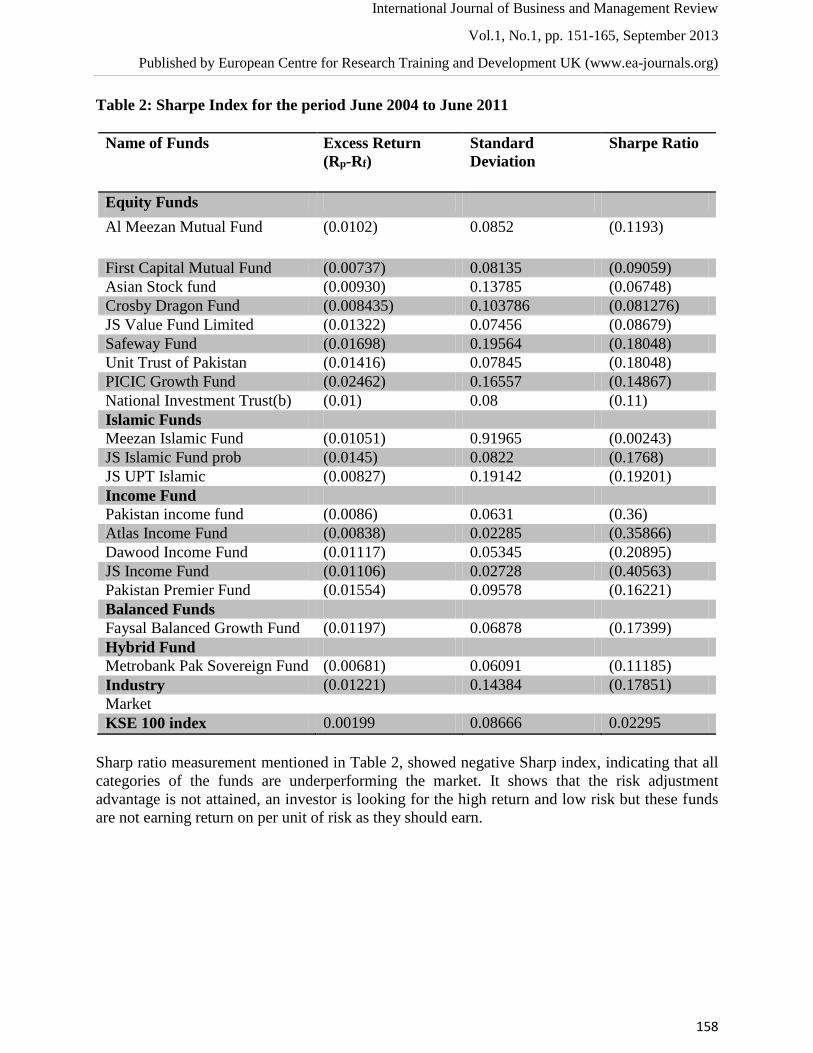
Table 2: Sharpe Index for the period June 2004 to June 2011
Name of Funds Excess Return
(Rp-Rf)
Standard
Deviation
Sharpe Ratio
Equity Funds
Al Meezan Mutual Fund (0.0102) 0.0852 (0.1193)
First Capital Mutual Fund (0.00737) 0.08135 (0.09059)
Asian Stock fund (0.00930) 0.13785 (0.06748)
Crosby Dragon Fund (0.008435) 0.103786 (0.081276)
JS Value Fund Limited (0.01322) 0.07456 (0.08679)
Safeway Fund (0.01698) 0.19564 (0.18048)
Unit Trust of Pakistan (0.01416) 0.07845 (0.18048)
PICIC Growth Fund (0.02462) 0.16557 (0.14867)
National Investment Trust(b) (0.01) 0.08 (0.11)
Islamic Funds
Meezan Islamic Fund (0.01051) 0.91965 (0.00243)
JS Islamic Fund prob (0.0145) 0.0822 (0.1768)
JS UPT Islamic (0.00827) 0.19142 (0.19201)
Income Fund
Pakistan income fund (0.0086) 0.0631 (0.36)
Atlas Income Fund (0.00838) 0.02285 (0.35866)
Dawood Income Fund (0.01117) 0.05345 (0.20895)
JS Income Fund (0.01106) 0.02728 (0.40563)
Pakistan Premier Fund (0.01554) 0.09578 (0.16221)
Balanced Funds
Faysal Balanced Growth Fund (0.01197) 0.06878 (0.17399)
Hybrid Fund
Metrobank Pak Sovereign Fund (0.00681) 0.06091 (0.11185)
Industry (0.01221) 0.14384 (0.17851)
Market
KSE 100 index 0.00199 0.08666 0.02295
Sharp ratio measurement mentioned in Table 2, showed negative Sharp index, indicating that all
categories of the funds are underperforming the market. It shows that the risk adjustment
advantage is not attained, an investor is looking for the high return and low risk but these funds
are not earning return on per unit of risk as they should earn.
International Journal of Business and Management Review
Vol.1, No.1, pp. 151-165, September 2013
Published by European Centre for Research Training and Development UK (www.ea-journals.org)
159
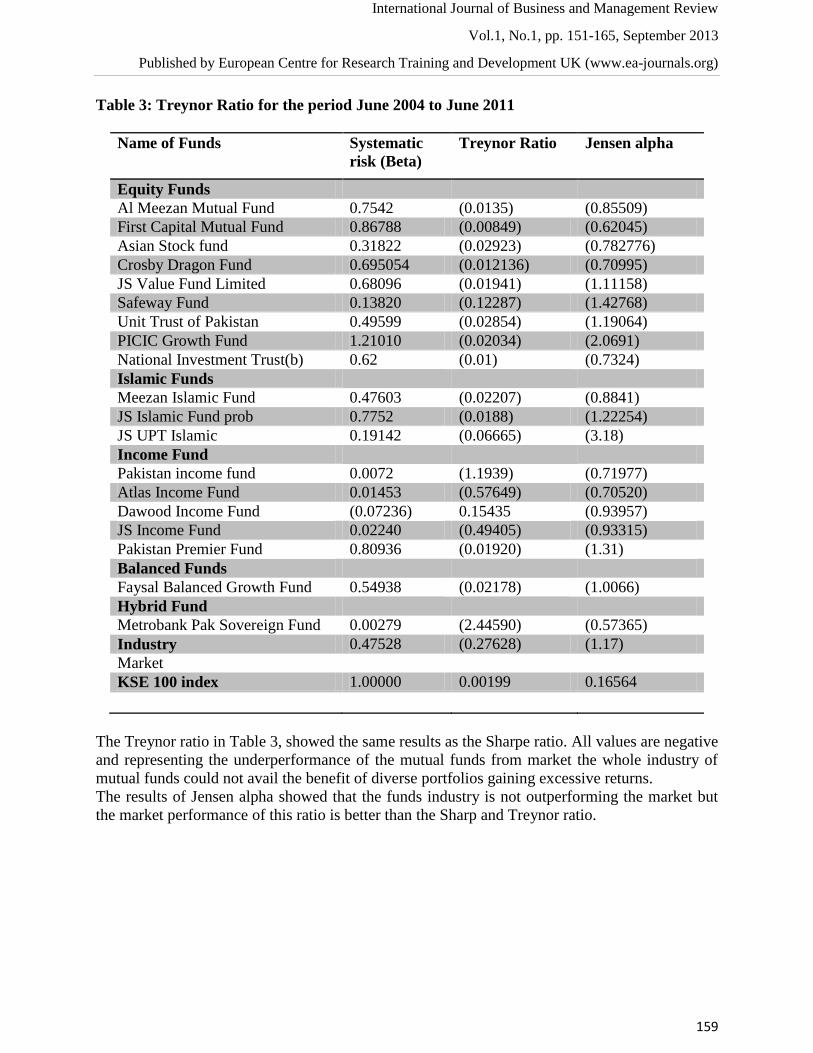
Table 3: Treynor Ratio for the period June 2004 to June 2011
Name of Funds Systematic
risk (Beta)
Treynor Ratio Jensen alpha
Equity Funds
Al Meezan Mutual Fund 0.7542 (0.0135) (0.85509)
First Capital Mutual Fund 0.86788 (0.00849) (0.62045)
Asian Stock fund 0.31822 (0.02923) (0.782776)
Crosby Dragon Fund 0.695054 (0.012136) (0.70995)
JS Value Fund Limited 0.68096 (0.01941) (1.11158)
Safeway Fund 0.13820 (0.12287) (1.42768)
Unit Trust of Pakistan 0.49599 (0.02854) (1.19064)
PICIC Growth Fund 1.21010 (0.02034) (2.0691)
National Investment Trust(b) 0.62 (0.01) (0.7324)
Islamic Funds
Meezan Islamic Fund 0.47603 (0.02207) (0.8841)
JS Islamic Fund prob 0.7752 (0.0188) (1.22254)
JS UPT Islamic 0.19142 (0.06665) (3.18)
Income Fund
Pakistan income fund 0.0072 (1.1939) (0.71977)
Atlas Income Fund 0.01453 (0.57649) (0.70520)
Dawood Income Fund (0.07236) 0.15435 (0.93957)
JS Income Fund 0.02240 (0.49405) (0.93315)
Pakistan Premier Fund 0.80936 (0.01920) (1.31)
Balanced Funds
Faysal Balanced Growth Fund 0.54938 (0.02178) (1.0066)
Hybrid Fund
Metrobank Pak Sovereign Fund 0.00279 (2.44590) (0.57365)
Industry 0.47528 (0.27628) (1.17)
Market
KSE 100 index 1.00000 0.00199 0.16564
The Treynor ratio in Table 3, showed the same results as the Sharpe ratio. All values are negative
and representing the underperformance of the mutual funds from market the whole industry of
mutual funds could not avail the benefit of diverse portfolios gaining excessive returns.
The results of Jensen alpha showed that the funds industry is not outperforming the market but
the market performance of this ratio is better than the Sharp and Treynor ratio.
International Journal of Business and Management Review
Vol.1, No.1, pp. 151-165, September 2013
Published by European Centre for Research Training and Development UK (www.ea-journals.org)
160
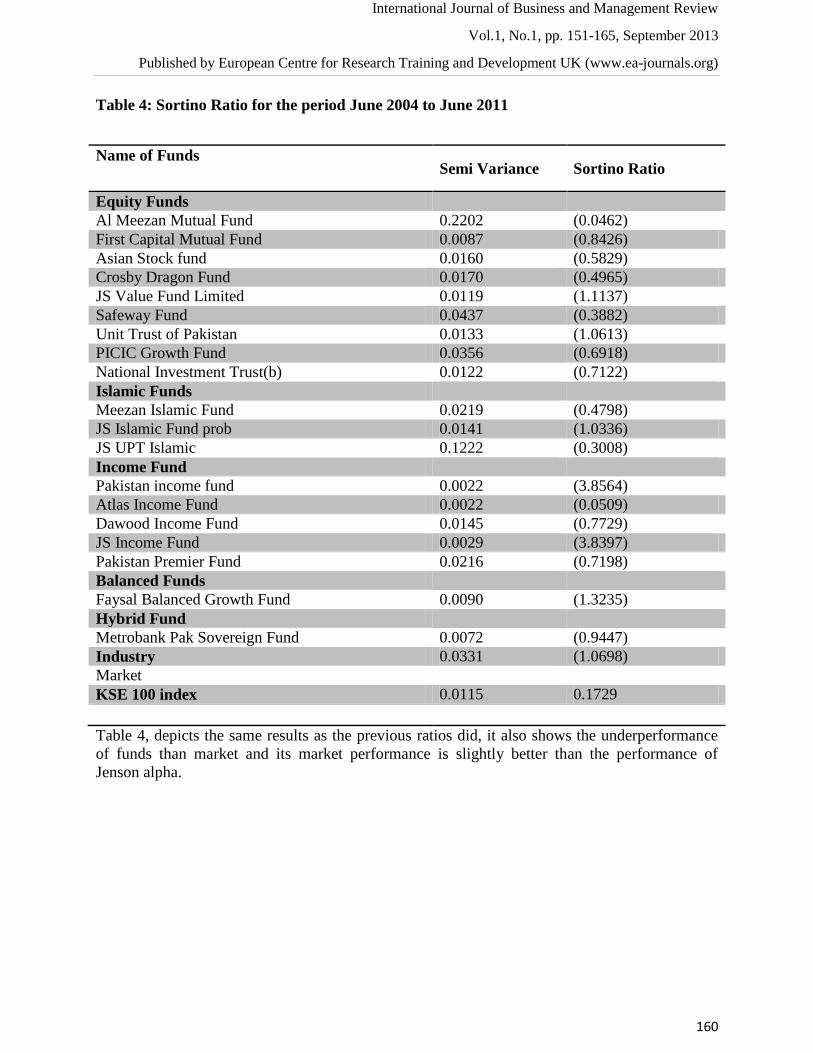
Table 4: Sortino Ratio for the period June 2004 to June 2011
Table 4, depicts the same results as the previous ratios did, it also shows the underperformance
of funds than market and its market performance is slightly better than the performance of
Jenson alpha.
Name of Funds Semi Variance Sortino Ratio
Equity Funds
Al Meezan Mutual Fund 0.2202 (0.0462)
First Capital Mutual Fund 0.0087 (0.8426)
Asian Stock fund 0.0160 (0.5829)
Crosby Dragon Fund 0.0170 (0.4965)
JS Value Fund Limited 0.0119 (1.1137)
Safeway Fund 0.0437 (0.3882)
Unit Trust of Pakistan 0.0133 (1.0613)
PICIC Growth Fund 0.0356 (0.6918)
National Investment Trust(b) 0.0122 (0.7122)
Islamic Funds
Meezan Islamic Fund 0.0219 (0.4798)
JS Islamic Fund prob 0.0141 (1.0336)
JS UPT Islamic 0.1222 (0.3008)
Income Fund
Pakistan income fund 0.0022 (3.8564)
Atlas Income Fund 0.0022 (0.0509)
Dawood Income Fund 0.0145 (0.7729)
JS Income Fund 0.0029 (3.8397)
Pakistan Premier Fund 0.0216 (0.7198)
Balanced Funds
Faysal Balanced Growth Fund 0.0090 (1.3235)
Hybrid Fund
Metrobank Pak Sovereign Fund 0.0072 (0.9447)
Industry 0.0331 (1.0698)
Market
KSE 100 index 0.0115 0.1729
International Journal of Business and Management Review
Vol.1, No.1, pp. 151-165, September 2013
Published by European Centre for Research Training and Development UK (www.ea-journals.org)
161
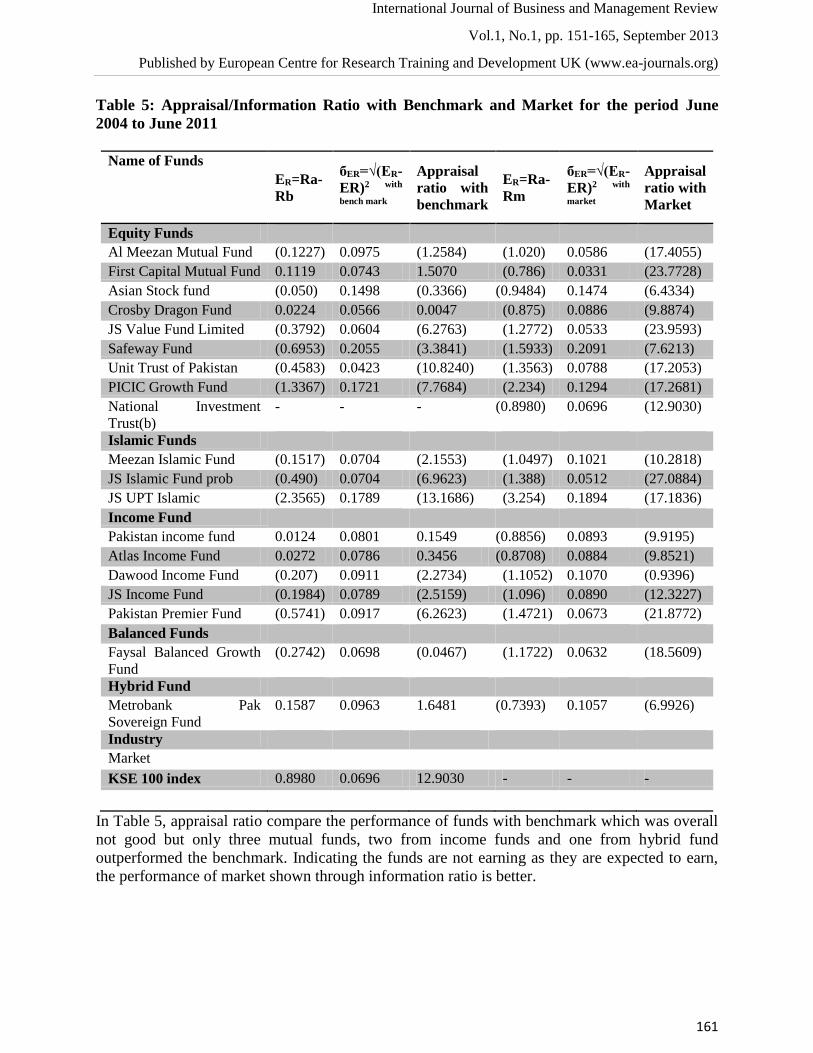
Table 5: Appraisal/Information Ratio with Benchmark and Market for the period June
2004 to June 2011
Name of Funds
ER=Ra-
Rb
бER=√(ER-
ER)2 with
bench mark
Appraisal
ratio with
benchmark
ER=Ra-
Rm
бER=√(ER-
ER)2 with
market
Appraisal
ratio with
Market
Equity Funds
Al Meezan Mutual Fund (0.1227) 0.0975 (1.2584) (1.020) 0.0586 (17.4055)
First Capital Mutual Fund 0.1119 0.0743 1.5070 (0.786) 0.0331 (23.7728)
Asian Stock fund (0.050) 0.1498 (0.3366) (0.9484) 0.1474 (6.4334)
Crosby Dragon Fund 0.0224 0.0566 0.0047 (0.875) 0.0886 (9.8874)
JS Value Fund Limited (0.3792) 0.0604 (6.2763) (1.2772) 0.0533 (23.9593)
Safeway Fund (0.6953) 0.2055 (3.3841) (1.5933) 0.2091 (7.6213)
Unit Trust of Pakistan (0.4583) 0.0423 (10.8240) (1.3563) 0.0788 (17.2053)
PICIC Growth Fund (1.3367) 0.1721 (7.7684) (2.234) 0.1294 (17.2681)
National Investment
Trust(b)
- - - (0.8980) 0.0696 (12.9030)
Islamic Funds
Meezan Islamic Fund (0.1517) 0.0704 (2.1553) (1.0497) 0.1021 (10.2818)
JS Islamic Fund prob (0.490) 0.0704 (6.9623) (1.388) 0.0512 (27.0884)
JS UPT Islamic (2.3565) 0.1789 (13.1686) (3.254) 0.1894 (17.1836)
Income Fund
Pakistan income fund 0.0124 0.0801 0.1549 (0.8856) 0.0893 (9.9195)
Atlas Income Fund 0.0272 0.0786 0.3456 (0.8708) 0.0884 (9.8521)
Dawood Income Fund (0.207) 0.0911 (2.2734) (1.1052) 0.1070 (0.9396)
JS Income Fund (0.1984) 0.0789 (2.5159) (1.096) 0.0890 (12.3227)
Pakistan Premier Fund (0.5741) 0.0917 (6.2623) (1.4721) 0.0673 (21.8772)
Balanced Funds
Faysal Balanced Growth
Fund
(0.2742) 0.0698 (0.0467) (1.1722) 0.0632 (18.5609)
Hybrid Fund
Metrobank Pak
Sovereign Fund
0.1587 0.0963 1.6481 (0.7393) 0.1057 (6.9926)
Industry
Market
KSE 100 index 0.8980 0.0696 12.9030 - - -
In Table 5, appraisal ratio compare the performance of funds with benchmark which was overall
not good but only three mutual funds, two from income funds and one from hybrid fund
outperformed the benchmark. Indicating the funds are not earning as they are expected to earn,
the performance of market shown through information ratio is better.
International Journal of Business and Management Review
Vol.1, No.1, pp. 151-165, September 2013
Published by European Centre for Research Training and Development UK (www.ea-journals.org)
162
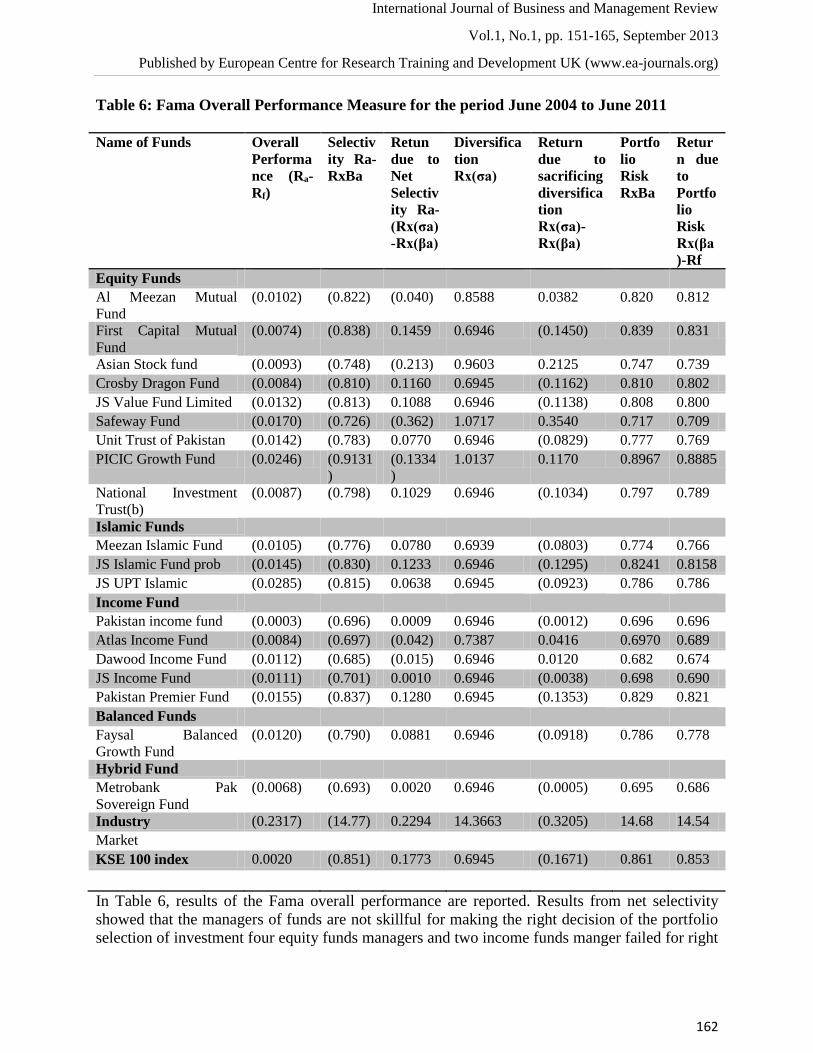
Table 6: Fama Overall Performance Measure for the period June 2004 to June 2011
Name of Funds Overall
Performa
nce (Ra-
Rf)
Selectiv
ity Ra-
RxBa
Retun
due to
Net
Selectiv
ity Ra-
(Rx(σa)
-Rx(βa)
Diversifica
tion
Rx(σa)
Return
due to
sacrificing
diversifica
tion
Rx(σa)-
Rx(βa)
Portfo
lio
Risk
RxBa
Retur
n due
to
Portfo
lio
Risk
Rx(βa
)-Rf
Equity Funds
Al Meezan Mutual
Fund
(0.0102) (0.822) (0.040) 0.8588 0.0382 0.820 0.812
First Capital Mutual
Fund
(0.0074) (0.838) 0.1459 0.6946 (0.1450) 0.839 0.831
Asian Stock fund (0.0093) (0.748) (0.213) 0.9603 0.2125 0.747 0.739
Crosby Dragon Fund (0.0084) (0.810) 0.1160 0.6945 (0.1162) 0.810 0.802
JS Value Fund Limited (0.0132) (0.813) 0.1088 0.6946 (0.1138) 0.808 0.800
Safeway Fund (0.0170) (0.726) (0.362) 1.0717 0.3540 0.717 0.709
Unit Trust of Pakistan (0.0142) (0.783) 0.0770 0.6946 (0.0829) 0.777 0.769
PICIC Growth Fund (0.0246) (0.9131
)
(0.1334
)
1.0137 0.1170 0.8967 0.8885
National Investment
Trust(b)
(0.0087) (0.798) 0.1029 0.6946 (0.1034) 0.797 0.789
Islamic Funds
Meezan Islamic Fund (0.0105) (0.776) 0.0780 0.6939 (0.0803) 0.774 0.766
JS Islamic Fund prob (0.0145) (0.830) 0.1233 0.6946 (0.1295) 0.8241 0.8158
JS UPT Islamic (0.0285) (0.815) 0.0638 0.6945 (0.0923) 0.786 0.786
Income Fund
Pakistan income fund (0.0003) (0.696) 0.0009 0.6946 (0.0012) 0.696 0.696
Atlas Income Fund (0.0084) (0.697) (0.042) 0.7387 0.0416 0.6970 0.689
Dawood Income Fund (0.0112) (0.685) (0.015) 0.6946 0.0120 0.682 0.674
JS Income Fund (0.0111) (0.701) 0.0010 0.6946 (0.0038) 0.698 0.690
Pakistan Premier Fund (0.0155) (0.837) 0.1280 0.6945 (0.1353) 0.829 0.821
Balanced Funds
Faysal Balanced
Growth Fund
(0.0120) (0.790) 0.0881 0.6946 (0.0918) 0.786 0.778
Hybrid Fund
Metrobank Pak
Sovereign Fund
(0.0068) (0.693) 0.0020 0.6946 (0.0005) 0.695 0.686
Industry (0.2317) (14.77) 0.2294 14.3663 (0.3205) 14.68 14.54
Market
KSE 100 index 0.0020 (0.851) 0.1773 0.6945 (0.1671) 0.861 0.853
In Table 6, results of the Fama overall performance are reported. Results from net selectivity
showed that the managers of funds are not skillful for making the right decision of the portfolio
selection of investment four equity funds managers and two income funds manger failed for right
International Journal of Business and Management Review
Vol.1, No.1, pp. 151-165, September 2013
Published by European Centre for Research Training and Development UK (www.ea-journals.org)
163
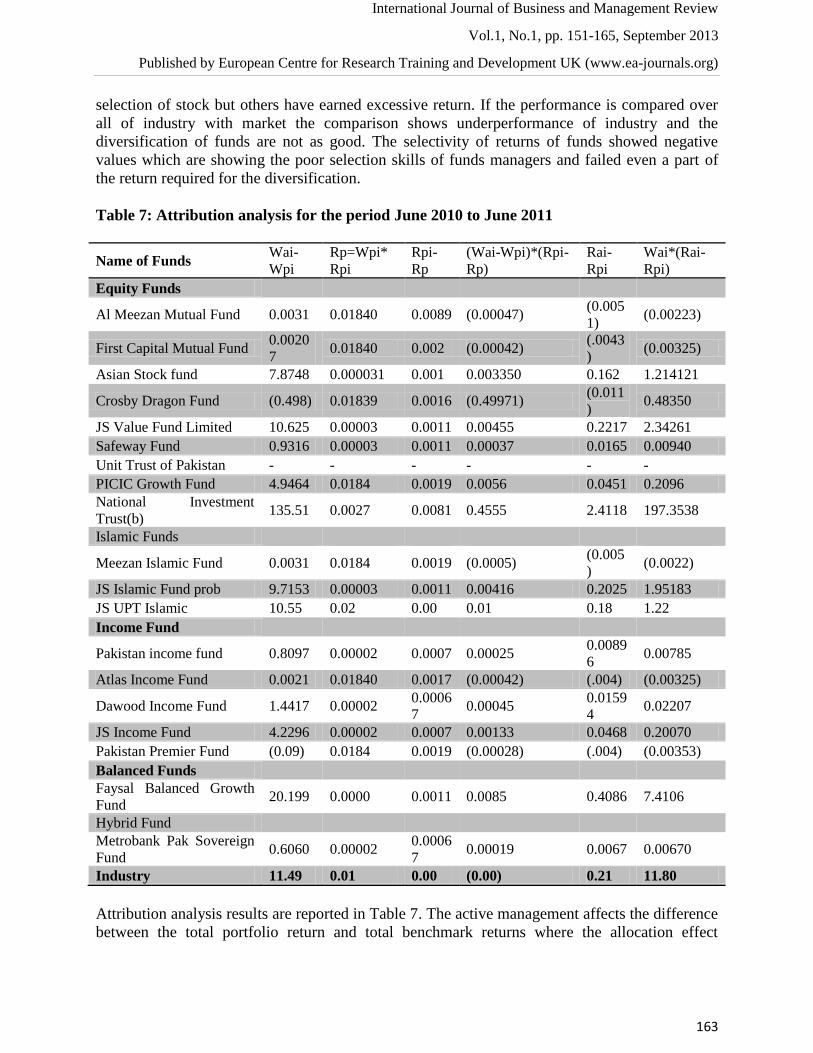
selection of stock but others have earned excessive return. If the performance is compared over
all of industry with market the comparison shows underperformance of industry and the
diversification of funds are not as good. The selectivity of returns of funds showed negative
values which are showing the poor selection skills of funds managers and failed even a part of
the return required for the diversification.
Table 7: Attribution analysis for the period June 2010 to June 2011
Name of Funds Wai-
Wpi
Rp=Wpi*
Rpi
Rpi-
Rp
(Wai-Wpi)*(Rpi-
Rp)
Rai-
Rpi
Wai*(Rai-
Rpi)
Equity Funds
Al Meezan Mutual Fund 0.0031 0.01840 0.0089 (0.00047) (0.005
1) (0.00223)
First Capital Mutual Fund 0.0020
7 0.01840 0.002 (0.00042)
(.0043
) (0.00325)
Asian Stock fund 7.8748 0.000031 0.001 0.003350 0.162 1.214121
Crosby Dragon Fund (0.498) 0.01839 0.0016 (0.49971) (0.011
) 0.48350
JS Value Fund Limited 10.625 0.00003 0.0011 0.00455 0.2217 2.34261
Safeway Fund 0.9316 0.00003 0.0011 0.00037 0.0165 0.00940
Unit Trust of Pakistan - - - - - -
PICIC Growth Fund 4.9464 0.0184 0.0019 0.0056 0.0451 0.2096
National Investment
Trust(b) 135.51 0.0027 0.0081 0.4555 2.4118 197.3538
Islamic Funds
Meezan Islamic Fund 0.0031 0.0184 0.0019 (0.0005) (0.005
) (0.0022)
JS Islamic Fund prob 9.7153 0.00003 0.0011 0.00416 0.2025 1.95183
JS UPT Islamic 10.55 0.02 0.00 0.01 0.18 1.22
Income Fund
Pakistan income fund 0.8097 0.00002 0.0007 0.00025 0.0089
6 0.00785
Atlas Income Fund 0.0021 0.01840 0.0017 (0.00042) (.004) (0.00325)
Dawood Income Fund 1.4417 0.00002 0.0006
7 0.00045
0.0159
4 0.02207
JS Income Fund 4.2296 0.00002 0.0007 0.00133 0.0468 0.20070
Pakistan Premier Fund (0.09) 0.0184 0.0019 (0.00028) (.004) (0.00353)
Balanced Funds
Faysal Balanced Growth
Fund 20.199 0.0000 0.0011 0.0085 0.4086 7.4106
Hybrid Fund
Metrobank Pak Sovereign
Fund 0.6060 0.00002
0.0006
7 0.00019 0.0067 0.00670
Industry 11.49 0.01 0.00 (0.00) 0.21 11.80
Attribution analysis results are reported in Table 7. The active management affects the difference
between the total portfolio return and total benchmark returns where the allocation effect
International Journal of Business and Management Review
Vol.1, No.1, pp. 151-165, September 2013
Published by European Centre for Research Training and Development UK (www.ea-journals.org)
164
determines the overweight or underweight of the segment related to benchmark contribute
positive or negative overall performance return. The allocation effect is positive. The results
showed that the fund’s managers possess the ability of right decision making for portfolio
selection but few funds; two from equity, one from Islamic and two funds of income fund are
underperforming the benchmark which showing the wrong selection of portfolio.
By summing up all results the industry is not outperforming the market and on the other hand the
comparison of funds shows that equity segment performance is better than that of others but as
compared to benchmark the fund’s performance is better. These are consistent with (Sharpe,
1964, Shape, 1987, Shah and Hijazi, 2005)
CONCLUSION
In this study an attempt is made to evaluate the performance of Pakistani mutual funds on the
basis of average monthly returns compared to benchmark returns. The results of the study
showed that the mutual funds give return not in synchronization with the benchmark. In this
study mutual fund returns measured with different methods cannot be attributed to the market
that is they were not in direct correlation with the market as they have shown negative returns
and the market outperformed all the mutual funds. It was also traced out that the mutual funds,
which embarked higher risk, did not always validate higher returns and the managers need to
review their asset allocation decisions. Finally, it is concluded that in Pakistan, overall mutual
funds are not able to add value due to the slowdown in the overall economy and liquidity crisis in
the market, the mutual fund industry is experiencing a declining trend in returns.
Mutual funds existence marks 49 years in this country, the ride all the way through in these 49
years is not been smooth. The mutual fund industry has ability to change the way investment
institutions do business in the near future as they are set to give hard competition to national
saving schemes and banks if the regulators along with the institutions encourage best practices,
spread awareness to the investors and maintain their confidence as the market is still largely
untapped so this industry has great potential to grow in future.
This study is only based on few funds of Pakistan as most of the mutual funds in Pakistan are
newly established. The sample size is also selected on survivorship bias of funds, traded
frequently. Although the finding can be extended to international funds but the current study is
solely on Pakistan. Moreover, lack of data availability on the systematic risk assumed by
investors and manager and also weights of only one year is used was one of the main limitations
of this paper.
FUTURE RESEARCH
Future scope of the study exists we have used only quantitative measures to evaluate
performance evaluation of funds the behavioral aspect is still untouched in this area in Pakistan.
The behavioral aspect can define attitudes of investor and managers towards investment and
allocation of assets.
International Journal of Business and Management Review
Vol.1, No.1, pp. 151-165, September 2013
Published by European Centre for Research Training and Development UK (www.ea-journals.org)
165
References
Blake, D., and Timmermann, A. (1998). Mutual Fund Performance: Evidence from the UK.
European Finance Review 2 , 57-77.
Cuthbertson, K., Nitzsche, D., andO’sullivan, N. ( 2010). Mutual Fund Performance:
Measurement. Financial Markets, Institutions and Instruments, 19 (2).
Debasish, S. S. (2009). Investigating Performance of Equity-based Mutual Fund Schemes in
Indian Scenario. KCA Jornal of Business Management, 2 (2), 1-15.
Faber, M. T. (2006). A Quantitative Approach to Tactical Asset Allocation. Journal of Wealth
Management, Working Paper , 2-13.
Fama, E. (1972). Components of Investment Performance. Journal of Finance, 27 (3), 551-567.
French, C. W. (2003). The Treynor Asset Pricing Model. The Journal of Investment management
, 1 (2), 60-72.
Gohar, R., Ahmed, S., and Niazii, U. (2011). Performance comparison of mutual funds in
Pakistan. African Journal of Business Management, 5 (14), 5583-5593.
Howe, T. S., and Pope, R. A. (1996). Equity Mutual Fund Historical Perfomance Rating as
Predictors of Future Perfomance. Journal Of Financial And Strategic Decisions , 9 (1), 33-43.
Jayadev, M. (1996). Mutual Fund Performance: An Analysis of Monthly Returns. Finance India,
10 (1), 73–84.
Jensen, M. C. (1968). The Performance of Mutual Funds in the Period 1945-1964. Harvard
Business Review, 23 (2), 389 – 415.
Kolbadi, P., and Ahmadinia, H. (2011). Examining Sharp, Sortino and Sterling Ratios in
Portfolio Management, Evidence from Tehran Stock Exchange. International Journal of
Business and Management, 6 (4), 222-236.
Rao, D. S., and Ravindran, M. (2003). Performance Evaluation of Indian Mutual Funds. Working
paper http://papers.ssrn.com/so13/papers.cfm?abstract_id=433100 , 1-24.
Redman, A. L., and Manakyan, N. G. (2000). The Performance of Global and International
Mutual Funds. Journal of Financial and Strategic Decisions , 13 (1), 75-85.
SHAH, S. M., and HIJAZI, S. T. (2005). Performance Evaluation of Mutual Funds in Pakistan.
The Pakistan Development Review, 44 (4), 863–876.
Sharpe, W. F. (1987). Integrated Asset Allocation. Financial Analysts Journal, 43 (5), 25-3.
Sharpe, W. F. (1966). Mutual Fund Performance. Journal of Business, 39 (1), 119-138.
Sipra, N. (2006). Mutual Fund Performance in Pakistan, 1995-2004. CMER Working Paper No.
06-45 Lahore: Lahore University of Management Sciences.
Soongswang, A., and Sanohdontree, Y. (2011). Open -Ended Equity Mutual Funds. International
Journal of Business and Social Science, 2 (17), 127-136.
Treynor, J. L. (1965). How to Rate Management of Investment Funds? HarvardBusiness Review,
43 (1), 63-75.
Treynor, J. L., and Mazny, K. K. (1966). Can Mutual Funds Outguess the Market? Harvard
Business Review, 44 (4), 131-136.


![Fatima jinnah [1893 1967]](https://img.pdfslide.us/doc/110x75/55ae48b01a28abe0178b45fc/fatima-jinnah-1893-1967.jpg)