Embed Size (px)
Citation preview

A COMPARATIVE STUDY ON NIS (NATIONAL INNOVATION SYSTEM) IN THE BRIC ECONOMIESZheng Bingwen*
Zhong Huibo**
The BRIC (Brazil, Russia, India and China) are the developing countries with the most prospective economic growth in the next generation. Many factors, such as natural resources, land and a large and cheap labor market contributes to the economic growth of this countries. However, in a knowledge-based economy, innovation is far more important than land, physical capital, or labor as the primary factor affecting a nation’s economic growth and development. Thus, given the importance of the studies of NIS (national innovation system) in the BRIC countries, this research is to characterize and compare the NIS of the four countries pointing out differences and similarities, common bottlenecks and complementarities, as well as identifying current and potential connections. Particular attention will be given to discuss policy implications and put forward policy recommendations, extract lessons that can be useful not only for these countries but also for other developing countries.
ESTUDO COMPARATIVO SOBRE SISTEMAS NACIONAIS DE INOVAÇÃO NAS ECONOMIAS BRIC
O bloco Brasil, Rússia, Índia e China (BRIC) é formado pelos países em desenvolvimento com os maiores potenciais de crescimento econômico para a próxima geração. Muitos fatores, como recursos naturais, terra e mão de obra farta e barata, contribuem para o crescimento econômico destes países. No entanto, em economias do conhecimento, a inovação é muito mais importante enquanto fator de crescimento e desenvolvimento econômico de uma nação do que terra, capital físico ou mão de obra. Assim, dada a importância dos estudos sobre Sistemas Nacionais de Inovação (SNIs) nos países do BRIC, esta pesquisa tem como objetivo caracterizar e comparar o SNI dos quatro países, apontando diferenças e semelhanças, gargalos comuns e complementaridades, bem como identificar conexões atuais e potenciais. O estudo dedica especial atenção à discussão das implicações e das recomendações sobre políticas, e às lições úteis, não apenas para estes países, mas também para outros países em desenvolvimento.
1 INTRODUCTION
It is well known that the BRIC consists of the four largest developing countries –Brazil, Russia, India and China – with the world’s best economic growth prospects for the next generation. Together, in 2009, they generated 22.3% of the global GDP (PPP), shared 28.9% of the geographical area and represented 43.2% of the world’s population. The huge potential of BRIC’s economic growth can be attributed to advantages in affluent natural resources and land, combined with a large and cheap labor market, and a high density of foreign direct investment.
* Prof. Zheng Bingwen is the Director General of the Institute of Latin America Studies (ILAS) at the Chinese Academy of Social Sciences (CASS).** Dr. Zhong Huibo is a senior research fellow at ILAS/CASS.

116 The Perspective of the World Review |RTM | v. 2 | n. 2 | Aug. 2010
However, in a knowledge-based economy, innovation is considered far more important than land, physical capital or labor when taking into account a nation’s economic growth and development. Studies on the NIS (national innovation system) of the BRICS are important, especially when considering that effective innovation management is key for corporate success, technological prowess and national economic sustainable development.
This research will characterize and compare the NIS of Brazil, Russia, India and China, pointing out differences and similarities, common bottlenecks and complementarities, as well as identifying current and potential connections. Particular attention will be given to policy implications and recommendations, extracting lessons that may be useful not only for the BRIC, but for other developing countries as well.
Section 2 develops a conceptual framework that analyzes NIS in these countries, including a broader and systemic understanding of these systems. Section 3 compares several of the key economic parameters and social indicators between the four countries, summarizing a few broader economic and institutional characteristics. Section 4 examines several of the support system’s chief indicators, including production, trade, investment and education. Section 5 outlines the characteristics of the main players of innovation (including enterprises, research institutes, technology talents and universities) under three aspects: quantity, structure and innovation. Section 6 analyzes the U.S. Patent and Trademark Office granted patents and indexed data of the four countries between 1979 and 2006, focusing on innovation performance characteristics - innovation, field and innovative pattern - while attempting to discover the causes of the differences in performance. Finally, section 7 reviews the lessons that may be drawn from this comparison and the evaluation trends of BRIC national innovation systems.
2 NIS (NATIONAL INNOVATION SYSTEM): A CONCEPTUAL FRAMEWORK
The concept of national innovation systems – NIS – was introduced by Freeman (1982, 1987) and Lundvall (1985). This concept stresses the interactivity between production and innovation, the importance of incremental and radical, technical and organizational innovations, as well as their different and simultaneous sources. Enterprises are seen as organization embedded within specific socio-economic-political environments that reflect particular historical and cultural trajectories. Over ten years ago, Chinese scholars introduced this conceptual analysis, producing results and publications on NIS (BINGWEN, 1998; BINGWEN; DUARCOURT, 1994).

A Comparative Study on National Innovation System in the BRIC Economies 117
Since the beginning of the 1990s this concept has been used as an ana-lytical tool and framework for policy analysis in both developed and undevel-oped countries. As a result: (1) research and policy activities, which explicitly focus on systems of innovation, may be found in most countries and a rapidly growing number of studies on specific national systems of innovation have been produced; (2) most countries, BRIC included, have been discussing and implementing public and private policies that focus on innovation, learning and capacity building.
In our opinion, NIS is part of the social system, contributing to the development, dissemination and sustainability of technological innovation. This System encompasses three sub-systems; the first is the micro-level innovation sub-system, including innovative enterprises, universities, research institutes, technology parks, technology, human resources, among others. The second is the meso-level innovation support subsystem, including the structure of production, trade, industry, employment, the financing platform, infrastructure, etc. The third is the macro-level innovation environmental subsystem, including population, economic output, economic growth and income distribution. These three subsystems interact and promote each other, forming a systematic national innovation system. Figure 1 presents the three subsystems of NIS. These will be considered when comparing the NIS between BRIC economies.
Under this analytical framework, a broader and systemic understanding of the innovation process is instrumental when avoiding an overemphasis on R&D, encouraging policy-makers to take a far-reaching perspective on the opportunities for learning and innovation. Considering the historical dependence of the formation and evolution of a national innovation system, deeply rooted in the economic and social environment, emphasis is put on interactions and the role of the historical process. These account for the differences between socio-economic capabilities, development trajectories and institutional evolution, creating systems of innovation with very specific local features and dynamics.

118 The Perspective of the World Review |RTM | v. 2 | n. 2 | Aug. 2010
FIGURE 1Structure of NIS
Source: International Development Research Centre. Available at: <http://brics.redesist.ie.ufrj.br/proj_idrc/>.
3. SUB-SYSTEM: INNOVATION ENVIRONMENT
3.1 Basic Economic and Social Indicators
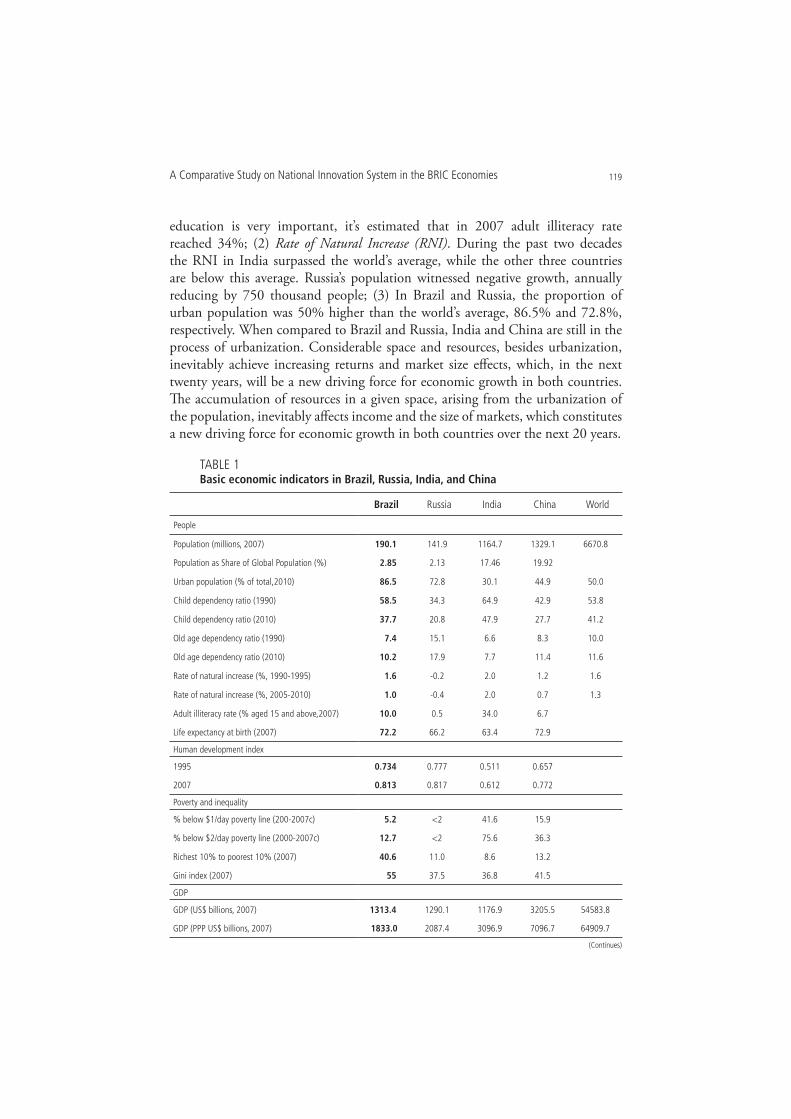
A large population is a common characteristic between the BRIC countries. China and India are the two most populous countries in the world, accounting for 20% and 17.5% of the population, respectively (Table 1). Brazil has the fifth largest population in the world accounting for almost 2.9%, and Russia has the seventh largest population accounting for 2.13% of the global population. Large population and labor supply are major factors leading to BRIC’s rapid economic growth. Considering the development process and its trend, there are several aspects to be discussed: (1) Child Dependency Ratio (CDR). The CDR has obviously decreased during the last two decades. However, CDR in India and Brazil is relatively high, 37.7% and 47.9%, respectively, while Russia and China are significantly lower, 20.8% and 27.7%. The decrease in the CDR indicates that these two latter countries are gradually experiencing the aging of their population, which means that a labor-dependent economy would not be an advantage in the future, especially for China. As we may see, economic growth has no other choice than to rely on the quality of labor; therefore, China must achieve sustainable economic development based on innovation. In India the improvement of
A Comparative Study on National Innovation System in the BRIC Economies 119
education is very important, it’s estimated that in 2007 adult illiteracy rate reached 34%; (2) Rate of Natural Increase (RNI). During the past two decades the RNI in India surpassed the world’s average, while the other three countries are below this average. Russia’s population witnessed negative growth, annually reducing by 750 thousand people; (3) In Brazil and Russia, the proportion of urban population was 50% higher than the world’s average, 86.5% and 72.8%, respectively. When compared to Brazil and Russia, India and China are still in the process of urbanization. Considerable space and resources, besides urbanization, inevitably achieve increasing returns and market size effects, which, in the next twenty years, will be a new driving force for economic growth in both countries. The accumulation of resources in a given space, arising from the urbanization of the population, inevitably affects income and the size of markets, which constitutes a new driving force for economic growth in both countries over the next 20 years.
TABLE 1Basic economic indicators in Brazil, Russia, India, and China
Brazil Russia India China World
People
Population (millions, 2007) 190.1 141.9 1164.7 1329.1 6670.8
Population as Share of Global Population (%) 2.85 2.13 17.46 19.92
Urban population (% of total,2010) 86.5 72.8 30.1 44.9 50.0
Child dependency ratio (1990) 58.5 34.3 64.9 42.9 53.8
Child dependency ratio (2010) 37.7 20.8 47.9 27.7 41.2
Old age dependency ratio (1990) 7.4 15.1 6.6 8.3 10.0
Old age dependency ratio (2010) 10.2 17.9 7.7 11.4 11.6
Rate of natural increase (%, 1990-1995) 1.6 -0.2 2.0 1.2 1.6
Rate of natural increase (%, 2005-2010) 1.0 -0.4 2.0 0.7 1.3
Adult illiteracy rate (% aged 15 and above,2007) 10.0 0.5 34.0 6.7
Life expectancy at birth (2007) 72.2 66.2 63.4 72.9
Human development index
1995 0.734 0.777 0.511 0.657
2007 0.813 0.817 0.612 0.772
Poverty and inequality
% below $1/day poverty line (200-2007c) 5.2 <2 41.6 15.9
% below $2/day poverty line (2000-2007c) 12.7 <2 75.6 36.3
Richest 10% to poorest 10% (2007) 40.6 11.0 8.6 13.2
Gini index (2007) 55 37.5 36.8 41.5
GDP
GDP (US$ billions, 2007) 1313.4 1290.1 1176.9 3205.5 54583.8
GDP (PPP US$ billions, 2007) 1833.0 2087.4 3096.9 7096.7 64909.7
(Continues)
120 The Perspective of the World Review |RTM | v. 2 | n. 2 | Aug. 2010
Brazil Russia India China World
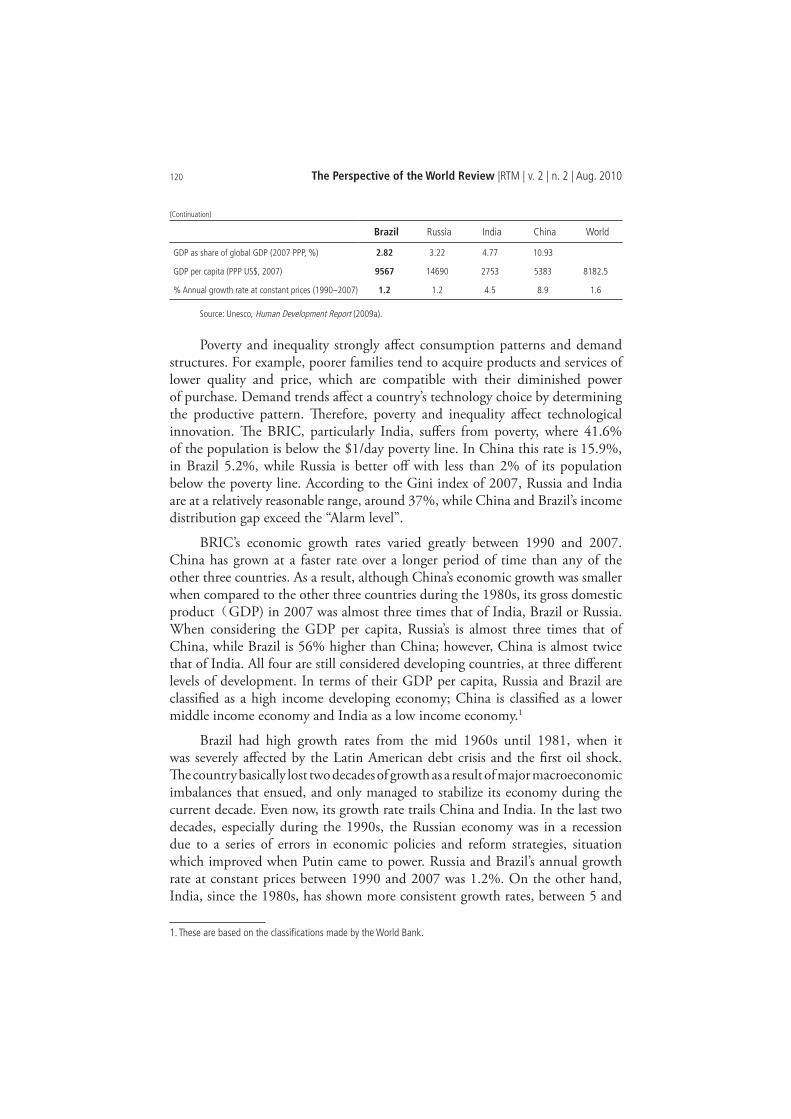
GDP as share of global GDP (2007 PPP, %) 2.82 3.22 4.77 10.93
GDP per capita (PPP US$, 2007) 9567 14690 2753 5383 8182.5
% Annual growth rate at constant prices (1990–2007) 1.2 1.2 4.5 8.9 1.6
Source: Unesco, Human Development Report (2009a).
Poverty and inequality strongly affect consumption patterns and demand structures. For example, poorer families tend to acquire products and services of lower quality and price, which are compatible with their diminished power of purchase. Demand trends affect a country’s technology choice by determining the productive pattern. Therefore, poverty and inequality affect technological innovation. The BRIC, particularly India, suffers from poverty, where 41.6% of the population is below the $1/day poverty line. In China this rate is 15.9%, in Brazil 5.2%, while Russia is better off with less than 2% of its population below the poverty line. According to the Gini index of 2007, Russia and India are at a relatively reasonable range, around 37%, while China and Brazil’s income distribution gap exceed the “Alarm level”.
BRIC’s economic growth rates varied greatly between 1990 and 2007. China has grown at a faster rate over a longer period of time than any of the other three countries. As a result, although China’s economic growth was smaller when compared to the other three countries during the 1980s, its gross domestic product GDP) in 2007 was almost three times that of India, Brazil or Russia. When considering the GDP per capita, Russia’s is almost three times that of China, while Brazil is 56% higher than China; however, China is almost twice that of India. All four are still considered developing countries, at three different levels of development. In terms of their GDP per capita, Russia and Brazil are classified as a high income developing economy; China is classified as a lower middle income economy and India as a low income economy.1
Brazil had high growth rates from the mid 1960s until 1981, when it was severely affected by the Latin American debt crisis and the first oil shock. The country basically lost two decades of growth as a result of major macroeconomic imbalances that ensued, and only managed to stabilize its economy during the current decade. Even now, its growth rate trails China and India. In the last two decades, especially during the 1990s, the Russian economy was in a recession due to a series of errors in economic policies and reform strategies, situation which improved when Putin came to power. Russia and Brazil’s annual growth rate at constant prices between 1990 and 2007 was 1.2%. On the other hand, India, since the 1980s, has shown more consistent growth rates, between 5 and
1. These are based on the classifications made by the World Bank.
(Continuation)
A Comparative Study on National Innovation System in the BRIC Economies 121
6%, except for a severe financial crisis in 1991, which forced the country to liberalize the economy and eventually reach a higher growth rate. During the last four years, the country has been growing at more than 8% per year, closely approaching China’s growth rates.
3.2 Broader Economic and Political Characteristics
This section examines some of the broader macroeconomic and political issues, including inflation rate, savings and investments, telecommunication infrastruc-ture, administrative efficiency, political system and the role of government.
Inflation
At the macroeconomic level, Brazil is the most unstable country within the BRIC, having experienced twenty years of high inflation rates between 1980 and 2000. At the beginning of the 1980s, when the country began to face the effects of the second oil shock and the rise of interest rates in the international financial market, the process of industrial development planning, that characterized the previous decades, was abandoned. Throughout the 1980s, the Brazilian economy evolved under extremely high inflation rates: in 1988 this rate was nearly 400% per year, and rose to 2000% in 1990, increasing to 2700% in 1993. Russia faced macroeconomic instability in the 1990s, when the inflation rate reached 1468 %; nonetheless, in 1999 it decreased to 36.5%. Since 2000, the Russian inflation rate has been under 20 percent; however, it still remains relatively high. In a high inflation economy, financial engineering and managing supplier’s credits and re-ceivables is more important than reducing production costs, improving quality or developing new products, factors which apparently reduce the incentives for in-novation. In turn, when considering macroeconomic control, China is the most stable country within the Bric, maintaining a low inflation rate since 1980s. In the past three decades, China’s inflation rate witnessed a 3% for the period. When compared to Brazil and Russia, India has a relatively stable macroeconomic en-vironment, nevertheless not as good as what may be expected from the Chinese.
Saving and investment
Since 1990 and during most part of the period, China’s Gross National Savings/GDP and Gross Domestic Investment/GDP have exceeded 40% (Table 2). For example, in 2003, China's savings rate was more than twice that of Brazil, nearly twice that of India, while Russia is close to 65% of China’s rate. Thanks to high savings rate, Chinese investment rate has been, for a while, one of the highest in the world. During the last decade, China's investment rate was almost twice as high as the other three countries. The “three highs”: high savings, high investment and high growth have been the main characteristics of China's economy over the past three decades. High savings, however, also has a negative influence on the

122 The Perspective of the World Review |RTM | v. 2 | n. 2 | Aug. 2010
economy. In China’s economy, high savings and corresponding low consumption would be the key cause of an over-dependency on exports and investments.
TABLE 2Saving and investment of BRIC
CountryGross national savings/GDP (%) Gross domestic investment/GDP (%)
1983 1993 2002 2003 1983 1993 2002 2003
Brazil – 20.2 18.5 20.7 16.7 20.8 19.8 20.1
Russia – 33.7 28.6 28.9 - 27 20.2 20.6
India 18.4 23.1 26.3 24.4 19.7 21.3 22.8 23.8
China 35.1 41.8 43.2 47.6 33.8 43.3 40.4 44.4
Source: World Bank. Available at: <www.worldbank.org>.
Information and communication infrastructure
Dissemination and use of knowledge are the major functions of the innovation system and require the support of the information infrastructure. When compared to the other three countries and considering its huge population size, China’s information and communication infrastructure is more efficient and modern (see Table 3). China manifests its advantages, especially when compared to India, which has almost the same population. Except for a small number of indicators, such as information and communication technology (ICT) expenditure and price basket for internet, the numbers presented by India represent approximately one third of China, or less. Russia’s indicators are slightly ahead of Brazil, however in 2005, when comparing the ICT expenditure it represented less than half of Brazil and the lowest of the BRIC countries.
TABLE 3Information and communication infrastructure of BRIC
Actual Brazil Russia India China Total telephones per 1,000 people (2004) 587.10 773.10 84.50 499.40
Main telephone lines per 1000 people (2004) 230.40 255.80 40.70 241.10
Mobile phones per 1,000 people (2004) 356.70 517.30 43.80 258.30
Computers per 1,000 people (2004) 105.20 132.20 12.10 40.90
Households with television (%) (2004) 90.00 98.00 37.00 91.00
Daily newspapers per 1,000 people (2000) 46.00 – 60.00 59.00
International internet bandwidth (bits per person) (2004) 149.30 99.90 11.40 57.40
Internet Users per 1,000 people (2004) 119.60 111.20 32.40 72.50
Price Basket for Internet (US$ per month) (2003) 28.00 10.00 8.70 10.10
ICT expenditure as % of GDP (2005) 7.82 3.58 5.91 5.28
Source: World Bank. Available at: <www.worldbank.org>.
A Comparative Study on National Innovation System in the BRIC Economies 123
Bureaucracy and transaction costs
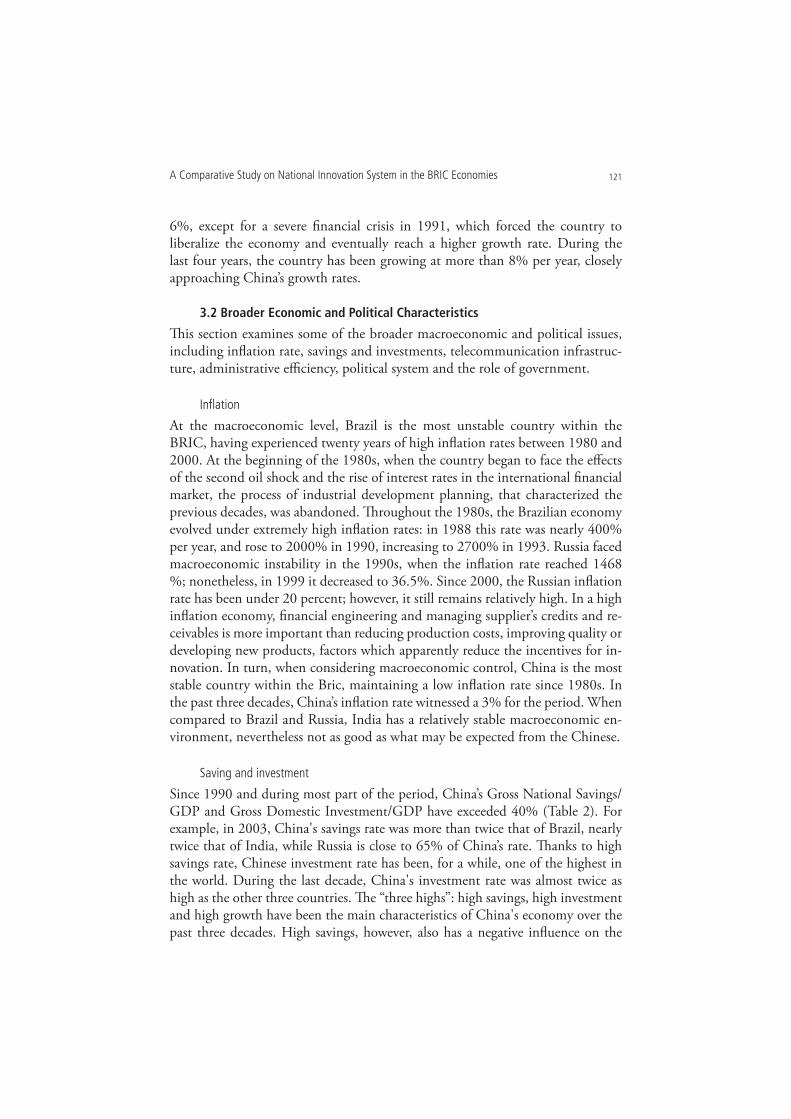
All four countries have complicated government procedures. Although there are different procedures for different needs, deriving from specific functions, we can see that India has the highest transaction costs. The cost of registering a business in India is the highest of the four countries, 7% of GNI per capita, 7.4 times that of Brazil, 7.9 times that of China, and 27.3 times that of Russia. It’s well-known that Brazil has the lowest level of efficiency in relation to bureaucratic procedures, starting a business needs 152 days, that is to say 124 more days than Russia and 117 more days than in China and India.
TABLE 4Compare of bureaucratic transactions costs of BRIC
Bureaucratic transactions costsBrazil Russia India China
High Low Very high Medium
Cost to register a business as % of GNI per capita (2006) 9.9 2.7 73.7 9.3
Days to start a business (2006) 152 28 35 35
Cost to enforce a contract (% of debt) (2006) 15.5 13.5 35.7 26.8
Source: World Bank. Available at: <www.worldbank.org>.
Role of government
During the period of planned economy, everything was controlled by the Chinese government. Since the 1980s, the Chinese government began a market-oriented reform, accelerating the process after entering WTO in 2001. Many state-owned enterprises closed or restructured during this period, private enterprises developed fast, while private property was officially recognized in 2007. By the end of 2007, the number of private enterprises exceeded 70% of the total number of enterprises in the country. Nevertheless, China’s share of state-owned economy is still one of the highest in the world. In 2009 the output value of state-owned enterprises accounted for 67.1% of the GDP. An active private economy and a strong state-owned economy coexistence as the two engine of sustained rapid economic growth in the country. An important manifestation of China’s government role is that it controls and regulates the macro economy through state-owned enterprises.
India became a democracy after its independence, however, during the early years it mainly remained a government-controlled economy. The Soviet’s five-year economic plan was opposed to large businesses and the government restricted the growth of large private enterprises. In the 1980s, these restrictions were loosened and since the 1990s have led to further liberalization. Although India’s economy has been partly privatized, the state continues to have a strong presence

124 The Perspective of the World Review |RTM | v. 2 | n. 2 | Aug. 2010
in industry and services. Russia experienced a rapid period of privatization between 1991 and 2000, including energy, banking and so on. After President Vladimir Putin came into power in 2000, Russia chose a government-led market economy, which completely controls the country’s economic lifeline - such as energy, the military, communications and aeronautic, among others. Brazil is the most market oriented of the three economies. Nevertheless, during the military government, the State had a strong role in the economy, including the creation of many large state owned enterprises, in critical areas. During the 1990s, there were significant privatizations in Brazil; however, the State still is an important presence in the service sector (DAHLAM, 2009).
4 SUB-SYSTEM: SUPPORT SYSTEM OF INNOVATION
For developing countries, technological progress comes mainly from two sources: Opening up of international technology spillovers and domestic innovation. Large numbers of studies suggest that trade and investment liberalization generated from the spillover of technology - including learning, imitation, demonstration and competition effects - are an important source of technological progress for developing countries. Meanwhile, international experiences also show that opening to technology spillovers would produce a “threshold effect”. Technology spillovers can become a reality only if the host country has a specific technical base and level of human capital; these two aspects are related to the productive structure and the level of education in the country. Trade, FDI, production and education are the support system of innovation.
4.1 Production structure of BRIC comparisons
As Table 5 shows that Brazil’s industrial structure has changed significantly since 1985. The industry’s share in total GDP declined, while services were in high growth. The industry’s and service share of the total GDP in 2003 represented 19.11% and 75.12%, respectively. It’s worth noting that agricultural products play an important role in Brazilian international trade, even though its share in GDP declined from 10.9% in 1985 to 5.77% in 2003.
In India, the agriculture sector showed a downward trend in its share of the total GDP, reaching 22.21% in 2003 compared to 36.6% in 1985. In the past twenty years, the manufacturing industry maintained its contribution rate to the total GDP, averaging around 26%. The service sector is the fastest growing sector in India, especially when considering IT sectors. The share of services in GDP grew from 37.6% in 1985 to 51.2% in 2003.
In Russia, the share of the agriculture sector fell from 14.9% in 1985 to 5.16% in 2003. The participation of the manufacturing sector in the total GDP declined from 62.3% in 1985 to 34.17% in 2003 (and remains highly concen-

A Comparative Study on National Innovation System in the BRIC Economies 125
trated on heavy industries – oil, energy, metallurgy and machinery). The share of services in the total GDP increased from 22.8% in 1985 to 60.67% in 2003.
China’s industry led its evolution in a different way. The share of the man-ufacturing industry has improved greatly and exceeds 50% of the total GDP, 44.6% in 1985, to 52.29% in 2003. Although most of the labor force still resides in the rural area, there is a huge drop in the agricultural GDP share, from 33% in 1985 to 14.62% in 2003. The share of services in the total GDP grew from 22.4% in 1985 to more than 30% in 1990, remaining at the same level ever since.
TABLE 5BRIC – value added by sector(% of GDP)
Country Year 1985 1995 2000 2002 2003
Brazil
Agriculture 10.90 7.60 7.28 5.84 5.77
Industry 44.00 41.60 27.97 20.61 19.11
Manufacturing 33.20 25.00 12.40 11.40
Services 45.10 50.80 64.75 73.55 75.12
Russia
Agriculture 14.9 8.30 6.43 5.75 5.16
Industry 62.3 44.60 37.95 33.75 34.17
Manufacturing –
Services 22.8 47.10 55.62 60.50 60.67
India
Agriculture 36.60 31.00 24.62 22.67 22.21
Industry 25.80 26.30 26.60 26.61 26.59
Manufacturing 16.30 16.10 15.60 15.80
Services 37.60 42.80 48.78 50.72 51.20
China
Agriculture 33.00 19.90 16.35 15.38 14.62
Industry 44.60 47.40 50.22 51.09 52.29
Manufacturing 36.50 34.50 35.40 39.30
Services 22.40 32.70 33.42 33.53 33.08
Source: World Bank, World Development Indicators Database.
4.2 Trade
When considering the total amount of imports and exports and their trends, China has a closer integration with the global economy than the other three countries. Tables 6 and 7 show the exports and imports of the BRIC in current US$ and as a percentage of world exports and imports, during 2000 and 2004. After a phase of stagnation between 2000 and 2002, world exports grew significantly from US$ 6,481 billion in 2002 to US$ 9,123 billion in 2004. Imports also followed the same trend. The participation of the BRIC has varied significantly.
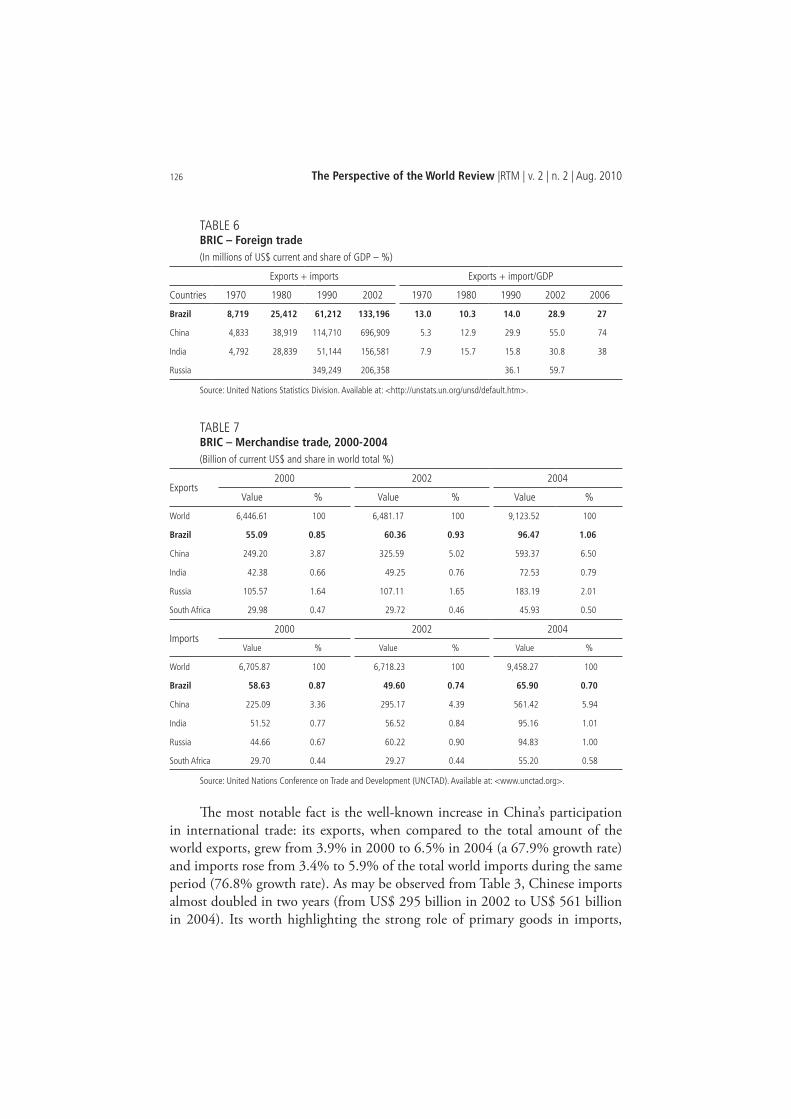
126 The Perspective of the World Review |RTM | v. 2 | n. 2 | Aug. 2010
TABLE 6BRIC – Foreign trade (In millions of US$ current and share of GDP – %)
Exports + imports Exports + import/GDP
Countries 1970 1980 1990 2002 1970 1980 1990 2002 2006
Brazil 8,719 25,412 61,212 133,196 13.0 10.3 14.0 28.9 27
China 4,833 38,919 114,710 696,909 5.3 12.9 29.9 55.0 74
India 4,792 28,839 51,144 156,581 7.9 15.7 15.8 30.8 38
Russia 349,249 206,358 36.1 59.7
Source: United Nations Statistics Division. Available at: <http://unstats.un.org/unsd/default.htm>.
TABLE 7BRIC – Merchandise trade, 2000-2004(Billion of current US$ and share in world total %)
Exports2000 2002 2004
Value % Value % Value %
World 6,446.61 100 6,481.17 100 9,123.52 100
Brazil 55.09 0.85 60.36 0.93 96.47 1.06
China 249.20 3.87 325.59 5.02 593.37 6.50
India 42.38 0.66 49.25 0.76 72.53 0.79
Russia 105.57 1.64 107.11 1.65 183.19 2.01
South Africa 29.98 0.47 29.72 0.46 45.93 0.50
Imports2000 2002 2004
Value % Value % Value %
World 6,705.87 100 6,718.23 100 9,458.27 100
Brazil 58.63 0.87 49.60 0.74 65.90 0.70
China 225.09 3.36 295.17 4.39 561.42 5.94
India 51.52 0.77 56.52 0.84 95.16 1.01
Russia 44.66 0.67 60.22 0.90 94.83 1.00
South Africa 29.70 0.44 29.27 0.44 55.20 0.58
Source: United Nations Conference on Trade and Development (UNCTAD). Available at: <www.unctad.org>.
The most notable fact is the well-known increase in China’s participation in international trade: its exports, when compared to the total amount of the world exports, grew from 3.9% in 2000 to 6.5% in 2004 (a 67.9% growth rate) and imports rose from 3.4% to 5.9% of the total world imports during the same period (76.8% growth rate). As may be observed from Table 3, Chinese imports almost doubled in two years (from US$ 295 billion in 2002 to US$ 561 billion in 2004). Its worth highlighting the strong role of primary goods in imports,

A Comparative Study on National Innovation System in the BRIC Economies 127
which also benefits countries specialized in these goods. China is a typical export-oriented economy. Table 6 illustrates that the share of imports and exports in China was 74% of the total GDP in 2006, compared to a 38% in India and only a 27% in Brazil. Purchases of foreign products and services are a key way to gain access to knowledge embodied in those goods and services. In China, trade is an important support for the National Innovation System.
India and Russia experienced a mild growth in both exports and imports Brazilian imports decreased their relative share of the world imports during the period (from 0.87% to 0.70%), even if the absolute value increased from US$59 to US$66 billion.
4.3 Foreign direct investment
Table 8 provides a comparison between 1990 and 2008 of the FDI annual overview across BRIC economies and the FDI as percentage of Gross Fixed Capital Formation (GFCF). It is clear that among the BRIC economies, China tops the annul FDI inflow, followed by Russia, Brazil, and India. However, in terms of FDI as percentage of GFCF, Russia tops the table, followed by Brazil, India and China. According to the growth rate, over the past 20 years Russia’s FDI had the fastest growth rate in 2008, it was 35 times that of 1990. Table 9 provides a comparison of FDI inward stocks across BRIC economies and FDI inward stock as a percentage of the GDP. It is clear that since 2000 China leads in terms of FDI stocks inflow, followed by Russia, Brazil and India. However, in terms of FDI inward stocks as a percentage of GDP, Brazil tops the list followed by Russia, China and India. Overall, Tables 8 and 9 show that FDI inflow to Bric economies grew significantly between 2006 and 2008, with few exceptions.
TABLE 8Comparison of foreign direct investment – overview across BRIC economies
FDI inwardn flows
Millions of US$Gross fixed capital
formation (%)
1990-2000(annual avg.)
2006 2007 20081990-2000
(annual avg.)2006 2007 2008
World 492674 1461074 1978838 1697353 8.2 13.5 16.6 12.8
Brazil 12000 18822 34585 45058 10.8 10.5 14.8 15.1
China 30104 72715 83521 108312 11.9 6.4 6.0 6.0
India 1705 20336 25127 41554 1.9 6.9 6.5 9.6
Russia 1941 29701 55073 70320 3.3 16.2 20.2 19.5
Source: UNCTAD (2009).

128 The Perspective of the World Review |RTM | v. 2 | n. 2 | Aug. 2010
TABLE 9Comparison of foreign direct investment – inward stocks across BRIC economies
FDI inward stocks
Millions of US$Gross fixed capital
formation (%)
1995 2000 2007 2008 1990 2000 2007 2008
World 2915311 5757360 15660498 14909289 9.1 18.1 29.1 25.0
Brazil 47887 122250 309668 287697 8.5 19.0 23.2 18.3
China 101098 193348 32 087 378083 5.1 16.2 9.7 8.7
India 5641 17517 105429 61765 0.5 3.7 9.2 9.9
Russia 5601 32204 491232 213734 – 12.4 38.4 12.7
Source: UNCTAD (2009).
China is far more attractive for FDI than any of the other three countries, the reasons are listed below. First, China opened its regulatory regime for Foreign Direct Investment more extensively than India and 10 years before. With the development of investment, the Chinese government has introduced tax incentives and other such policies to attract FDI. Second, China’s larger and richer market has been an important pull factor, even surpassing Russia and Brazil. Third, China has many cost advantages over the others countries, although its labor costs are now generally higher than India’s. Fourth, China has a better infrastructure and a more efficient administrative system. Fifth, China has a more stable macro economy, over the past twenty years, low inflation, interest rates, exchange rate fluctuations has created a good environment for investment. As a result, China has been very attractive not only as a production platform for global markets, but also the Chinese market is the world’s fastest growing market. This strong pull towards producing in China has also permitted the government to encourage strong competition among foreign multinational firms so they may bring the very best technologies when locating in China, even though they are aware of poor intellectual property protection and the risk that their technology may be pirated. The most important contribution of FDI to China has not been capital, once China has had high levels of savings and investment rate. More important has been the access to advanced technology and management through FDI. Equally important is the entry into global markets, once foreign investors integrate their Chinese operations into their global supply chains (DAHLAM, 2009).
A Comparative Study on National Innovation System in the BRIC Economies 129
4.4 Education
Education is the basis for using new technologies, the basis for innovation. The more education people get, the faster mastering new technologies are. Empirical studies show that education leads to higher productivity and higher growth and also show that they lead to higher earnings for individuals.2
This section will compare education across the four countries by comparing basic education attainment, followed by secondary and higher education enrollment rates and a few concluding comments on life long learning.
Basic education
Thirty years ago, as a very poor developing country, China’s education level was very low. Nevertheless, China made huge investments in education and implemented a nine-year-compulsory education plan in 1986. The rate of adult literacy in China, the world’s most populous country, is 90.9%, less than Russia; however it’s a great achievement to attain a 30% higher rate than India (table 10).
Tertiary education
Since the mid 1990s, China conducted a national expansion of higher education aiming to repair the higher education system, severely damaged during the Cultural Revolution (1965 to 1975). By 2005, China’s higher education enrollment rate reached 19%. Due to its huge population base, the number of students in higher education in China is higher than the U.S. and 40% of the students are concentrated in engineering and science. Since the 1950s, India has created seven Institutes of Technology and later several Institutes of Management, producing a critical mass of well educated English speaking professionals, who have been instrumental in India’s development of software and ICT enabled services. Despite India’s efforts to expand enrollment rates in higher education, in 2005 there was a gap of more than 7%, when compared to China. Also, the quality of higher education is poor. The low quality of tertiary education and the regulatory constraints on expanding institutions of high quality will be a major bottleneck for India’s continued rapid growth of knowledge intensive services. Brazil is well ahead of China and India in relation to tertiary education; however, it has expanded the least, albeit being slightly ahead of China in tertiary enrollment rates (DAHLAM, 2009, P. 18-20). On the other hand, when considering higher education these three countries are far behind Russia, which has an enrollment rate of 68.20%.
2. There are other benefits from more education. Many analyses show a positive causal relationship between higher educational attainment better mental and physical health, and lower rates of unemployment and to get jobs with higher income. With higher income they can spend more on health. Education can increase a person’s self-esteem, problem-solving and social skills, and the capacity to respond to adversity. In addition, research has shown a positive relationship between literacy and participation in voluntary community activities, and between greater civic knowledge and higher levels of civic participation (OECD, 2006).

130 The Perspective of the World Review |RTM | v. 2 | n. 2 | Aug. 2010
TABLE 10Education indicators of BRIC
Brazil Russia India China
Adult literacy rate (% age 15 and above) (2006) 88.6 99.4 61.00 90.9
Average years of schooling (2000) 4.88 10.03 5.06 6.35
Gross secondary enrollment (2004) 102.00 92.90 53.50 72.50
Gross tertiary enrollment (2004) 22.30 68.20 11.80 19.10
Internet access in schools (1-7) (2006) 3.60 3.80 3.80 4.00
Public spending on education as % of GDP (2005) 4.0 3.8 3.2 2.2
Quality of science and math education (1-7) (2006) 2.90 4.50 5.70 4.10
Extent of staff training (1-7) (2006) 4.20 2.90 4.80 3.40
Quality of management schools (1-7) (2006) 4.10 3.60 6.00 3.40
Brain drain (1-7) (2006) 3.90 3.50 3.70 3.80
Source: World Bank. Obs.: First, countries are ranked from best to worst, using their scores on each variable. Then the scores are normalized on a scale of zero to ten for all countries.
Education quality
According to the data divulged by the World Bank in 2006, when considering Internet Access in Schools, China has the best performance, scoring 4. When considering the Quality of Science and Math Education, India ranked the best at 5.9, which is twice that of Brazil. When examining the Extent of Staff Training, Russia scored the lowest, only a 2.9, while the other three countries are above 4. Considering the Quality of Management Schools, India scored 6, higher than Brazil who rank second (Table 10). This may be due to the fact that English is India’s official language. When analyzing the Brain Drain phenomenon, there is a slight difference between these four countries. Its noteworthy that the GDP share of Chinese investment on education is 1% less than India, which is alarming when considering that the lack of government investment in education may in the long-term affect human resources and China’s international competitiveness.
5 SUB-SYSTEM: MAIN PLAYERS OF INNOVATION
Innovations and new emerging knowledge always result from the efforts of research institutions. Research institutions in enterprises, government and universities are the main players of innovation. This section will make a comparative study of the quantities and distribution of researchers, and the innovation efforts carried out by research institutions belonging to the government, enterprises and universities.
5.1 Researchers
Table 11 reveals that China dominants when considering the quantities of researchers, representing 1/5 of the total amount in the world. When it comes to the research expenditures per researcher, the level in China is very low. However,

A Comparative Study on National Innovation System in the BRIC Economies 131
it has increased in 51% between 2002 and 2007. Although it is 50% higher than Russia, it is only 58% of India and 50% of Brazil. During 2002 and 2007, the number of researchers increased by 75.6% in China, 64.8% in Brazil, 33.6% in India, while a decreasing trend was observed in Russia. Russia’s proportion of the total researchers in the world has decreased in 2% during the period, representing 1/3 of the total amount of researchers in China. However, when taking into account the amount of researchers per million inhabitants, the rate was highest in Russia, three times that of China, five times that of Brazil and 24 times that of India. Possibly due to a well-developed higher education system, the foundation for research in Russia is still strong.
TABLE 11Researchers in BRIC (2002 and 2007)
Researchers (thousands) World researchers (%)Researchers per million
inhabitantsGERD per researcher
(thousands PPP$)
2002 2007 2002 2007 2002 2007 2002 2007
Brazil 71.8 118.3 1.2 1.7 400.7 624.8 167.8 146.6
China 810.5 1423.4 14 20.1 629.1 1071.3 48.7 73.7
India 115.9 154.8 2.3 2.2 110.8 136.5 102.8 126.7
Russia 491.9 469.1 8.5 6.6 3365.8 3291.8 32.5 50.1
Source: Unesco (2009).
Table 12 compares the the distribution of BRIC researchers by sector of employment. In sum, enterprises in China holds the largest group of researchers with a 62.3%, while the universities hold 19.8% of the total and the remaining 17.9% are in the government. In India, 49% of the researchers were in government institutions of, 37% in enterprises and 14% in the universities (the smallest rate of the four countries). It is different in Brazil, where 56.3% of the researchers are in universities, and 37.6% in enterprises, only 5.3% in government. The situation of Russia is similar to China. About 51.2% of the researchers are gathered in enterprises, while the proportion of governments and universities were 33.3% and 15.2%, respectively. According to changing trends, the proportion of researchers’ distribution in enterprises has increased in China, while the amount in government has decreased, contrary to Russia. In India, the amount of researchers in enterprises between 2000 and 2005 increased in 7%. During the same period, the percentage of researchers in universities and the government decreased in 5% and 2%, respectively. In Brazil this rate decreased slightly and was similar to India.

132 The Perspective of the World Review |RTM | v. 2 | n. 2 | Aug. 2010
TABLE 12Researchers by sector of employment, full-time equivalents
Researchers - Total Business enterprise (%) Government (%) Higher Education (%)
2000 2005 2000 2005 2000 2005 2000 2005
Brazil 64002 109420 31.4 37.6 7.4 5.3 60.5 56.3
Russia 506420 464577 57.2 51.2 28.1 33.3 14.3 15.2
India 115936 154827 30.0 37.0 51.0 49.0 19.1 14.0
China 695062 1118700 50.9 62.3 27.8 17.9 21.3 19.8
Source: GDP: World Bank (World Development Indicators, as of February 2009), and UIS estimations.
Population: United Nations Population Division; World Population Prospects: The 2006 Revision, and UIS estimations.
5.2 Domestic innovation effort
Table 13 shows that the expenditures on R&D in China increased rapidly from 2002 to 2007. The Gross Expenditure on Research and Development (GERD) was 104.9 billions in 2007, compared to 39.4 billions in 2002, increasing by 3 times. The percentage of R&D expenditures in the world also increased to 10% in 2007, which was higher than 2.2% in India, 2.1% in Russia and 1.6% in Brazil. China’s ratio of R&D expenditures to GDP was 1.5% in 2007, coming in first place among the developing countries (while the data for Russia was 1.1%; for Brazil, 0.8%; and for India, 1.0%). However, there’s a large gap when compared to developed countries. Although R&D expenditures per capita increased rapidly in China, it was still far below the level the OCDE countries and even lower than several developed countries. In 2007, the data was less than 1/2 of Russia, and lower than Brazil. It was only higher than India, which represented 1/4 of China’s expenditure.
Figure 2 shows that the ratio of R&D expenditures to GDP has increased since the mid-1990s, and that this trend is continuous. In Russia, the process developed in two stages: an increase during 1990 and 2003, and a decrease between 2003 until the present. In Brazil and India trends were similar, after a period of oscillation there’s been an increase in this ratio over the past three years.

A Comparative Study on National Innovation System in the BRIC Economies 133
TABLE 13R&D expenditure (GERD) of BRIC (2002 and 2007)
GERD (in billions PPP$)
GERD(% world )
GERD (% of GDP)
GERD (per capita in PPP$)
2002 2007 2002 2007 2002 2007 2002 2007
Brazil 12.1 17.3 1.5 1.6 0.9 1.0 67.2 91.6
China 39.4 104.9 5.0 9.2 1.1 1.5 30.6 79.0
India 12.9 24.8 1.6 2.2 0.7 0.8 11.9 21.2
Russia 16.0 23.5 2.0 2.1 1.2 1.1 109.4 164.8
Sources: GERD, researchers data and related indicators: Unesco Institute for Statistics (UIS) estimations, May 2009.
FIGURE 2GERD as a percentage of GDP
Source: Unesco (2009a).
When analyzing the sources and flow directions of R&D expenditures, one may observe that the real flagships have always been enterprises, with the exception of India. According to the distribution of the sources of R&D expenditures, there are a few market economy characteristics in China. Enterprises are the main source of R&D, 72.3% of the R&D expenditures are made by enterprises. Only 8.5% of the expenditures come from universities. In Russia and India, the R&D expenditures invested by universities was only 6.3% and 4.9%, respectively. At the same time, the R&D expenditures of universities were rather high in Brazil, around 38.4%, close to the rate of enterprises. With a share of 75.3%, India’s government made the largest investments in R&D

134 The Perspective of the World Review |RTM | v. 2 | n. 2 | Aug. 2010
FIGURE 3GERD by sector of performance – 2007(In %)
Source: Unesco (2009b).
6 CHARACTERISTICS OF INNOVATION PERFORMANCE
We realized a comparative study on the innovation system considering the environment, supporting system, main body and the innovation efforts. This section will compare the innovation performance of the four countries under three aspects: innovation capability, innovational configuration and innovation strength.
6.1 Innovation capability
We used patent count and citation ratio to evaluate innovation capability. The patent and citation data used in this study consists of all patents granted by the U.S. Patent and Trademark Office (USPTO) to BRIC inventors between 1976 and 2006.
Figure 4 compares the patent counts for the BRIC countries between 1995 and 2006. Before 1995 there are no significant changes, however the changes realized after this date may be divided into two stages. The newly authorized patents of each country were always less than 100 per yea, only Russia manifested a significant increase of the patents, while the other three countries remained as they were. Since 2001, the increase of new patents in China and India has been a dominant and continuous trend, which coincided with economic development in both countries. At the same time, the number of new patents decreased in Russia. During 2002 to 2004, there was a rapid increase of new patents in Brazil, after which it entered a period of stagnation.

A Comparative Study on National Innovation System in the BRIC Economies 135
When analyzing the total amount of new patents between 1976 and 2006, China is in first place with the number of 4745 and India follows with a total amount of 3679. The amount was 3029 and 2134 in Russia and India. Considering that between 1995 and 1999, the quantity of authorized patents were approximately the same between China and Brazil, the gap between them has increased. Since 2000, the discrepancy between China and Brazil has been continuously growing, considering they were at the same level in 1995. This becomes clearer than ever after 2005.
Since the qualities of patent are very different, citation ratio has been used to evaluate the qualities of similar patents (SCHANKERMAN; PAKES, 1986). Citation ratio is defined as the average number of a country’s patents cited by later patents. As Table 1 shows, the citation ratios respectively are 5.3, 4.7, 3.6, and 3.6 for Russia, Brazil, India and China in 2006.
FIGURE 4Number of utility patents given for U.S. origin patents
Source: Tseng (2009).
TABLE 14Citation ratio of BRIC – 1976-2006
Country Patent countCited by later patents
Citations Citations ratio
Brazil 2134 10014 4.69
Russia 3029 15948 5.26
India 3679 13424 3.65
China 4745 16857 3.55
Source: Tseng (2009).
136 The Perspective of the World Review |RTM | v. 2 | n. 2 | Aug. 2010
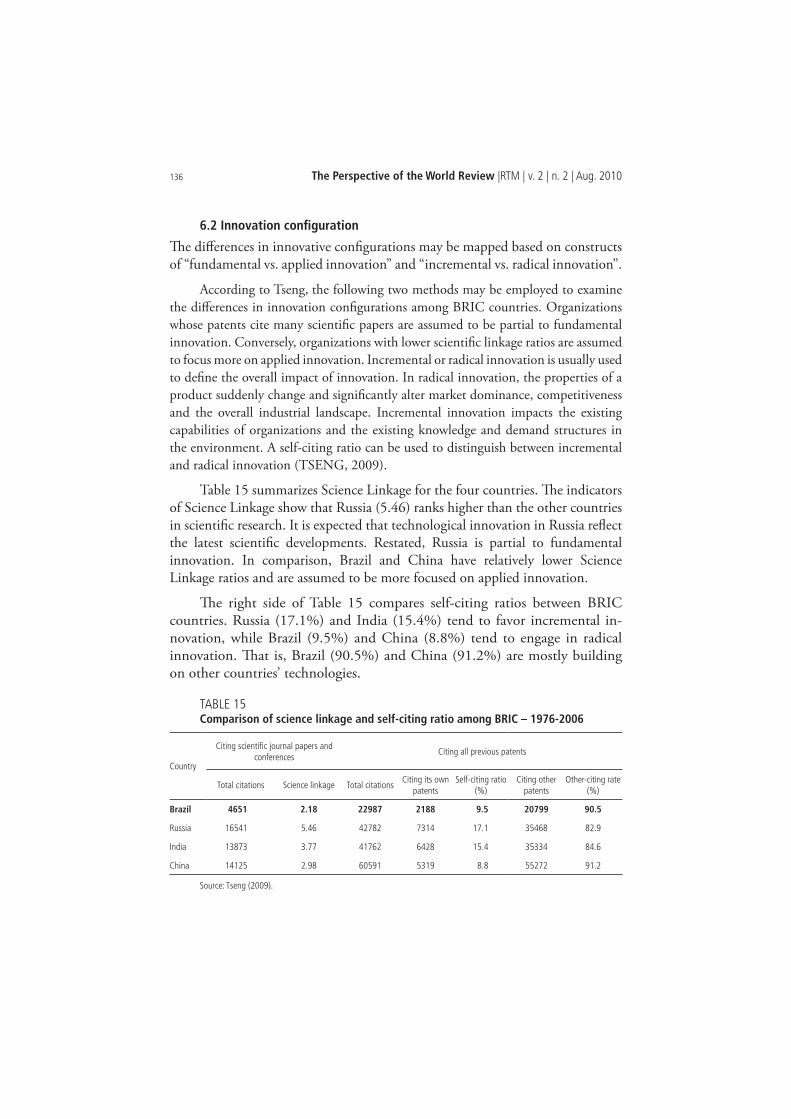
6.2 Innovation configuration
The differences in innovative configurations may be mapped based on constructs of “fundamental vs. applied innovation” and “incremental vs. radical innovation”.
According to Tseng the following two methods may be employed to examine the differences in innovation configurations among BRIC countries. Organizations whose patents cite many scientific papers are assumed to be partial to fundamental innovation. Conversely, organizations with lower scientific linkage ratios are assumed to focus more on applied innovation. Incremental or radical innovation is usually used to define the overall impact of innovation. In radical innovation, the properties of a product suddenly change and significantly alter market dominance, competitiveness and the overall industrial landscape. Incremental innovation impacts the existing capabilities of organizations and the existing knowledge and demand structures in the environment. A self-citing ratio can be used to distinguish between incremental and radical innovation (TSENG, 2009).
Table 15 summarizes Science Linkage for the four countries. The indicators of Science Linkage show that Russia (5.46) ranks higher than the other countries in scientific research. It is expected that technological innovation in Russia reflect the latest scientific developments. Restated, Russia is partial to fundamental innovation. In comparison, Brazil and China have relatively lower Science Linkage ratios and are assumed to be more focused on applied innovation.
The right side of Table 15 compares self-citing ratios between BRIC countries. Russia (17.1%) and India (15.4%) tend to favor incremental in-novation, while Brazil (9.5%) and China (8.8%) tend to engage in radical innovation. That is, Brazil (90.5%) and China (91.2%) are mostly building on other countries’ technologies.
TABLE 15Comparison of science linkage and self-citing ratio among BRIC – 1976-2006
Country
Citing scientific journal papers and conferences
Citing all previous patents
Total citations Science linkage Total citationsCiting its own
patentsSelf-citing ratio
(%)Citing other
patentsOther-citing rate
(%)
Brazil 4651 2.18 22987 2188 9.5 20799 90.5
Russia 16541 5.46 42782 7314 17.1 35468 82.9
India 13873 3.77 41762 6428 15.4 35334 84.6
China 14125 2.98 60591 5319 8.8 55272 91.2
Source: Tseng (2009).

A Comparative Study on National Innovation System in the BRIC Economies 137
Figure 5 compares the innovation configuration among BRIC countries on the basis of data consisting of Science Linkage and a self-citing ratio, through the standardization process. Obvious differences in innovation configuration are apparent in the BRIC countries. Russia appears to be highly focused on both fundamental and incremental innovation; India is working closely with applied and incremental innovation, while Brazil and China tend to focus on applied and radical innovation.
FIGURE 5Innovation configurations differ between the BRIC countries
Source: Tseng (2009).
6.3 Innovation strength
Table 16 presents innovation strength in 30 technological fields for BRIC countries between 1976 and 2006. Innovation strength analysis includes both absolute and relative innovation strength. Absolute innovation strength is measured by the number of patents invented by a country when compared to BRIC countries, in a specific technological field. Relative innovation strength is measured by the number of patents in a specific technological field compared to the total number of patents in the country.

138 The Perspective of the World Review |RTM | v. 2 | n. 2 | Aug. 2010
TABLE 16Comparison of innovation strengths of BRIC countries in 30 technological fields
Brazil Russia India China Total
Technological fields Patents (%) Patents (%) Patents (%) Patents (%) Patents (%)
Electrical engineering 108 5.1 190 6.3 151 4.1 939 19.8 1,388 10.2
Audiovisual technology 54 2.5 280 9.2 555 15.1 377 7.9 1,266 9.3
Telecommunications 77 3.6 161 5.3 659 17.9 155 3.3 1,052 6.8
Information technology 75 3.5 148 4.9 474 12.9 224 4.7 921 6.8
Semiconductors 33 1.5 163 5.4 308 8.4 252 5.3 756 5.6
Optics 79 3.7 241 8.0 155 4.2 244 5.1 719 5.3
Control technology 134 6.3 73 2..4 52 1.4 348 7.3 607 4.5
Medical technology 114 5.3 144 4.8 112 3.0 200 4.2 570 4.2
Organic chemistry 133 6.2 164 5.4 74 2.0 115 2.4 486 3.6
Polymers 102 4.8 57 1.9 179 4.9 121 2.6 459 3.4
Drugs 79 3.7 133 4.4 11. 3.0 90 1.9 412 3.0
Biotechnology 34 1.6 104 3.4 187 5.1 85 1.8 410 3.0
Materials 46 2.2 177 5.8 33 0.9 148 3.1 404 3.0
Food chemistry 53 2.5 91 3.0 144 3.9 114 2.4 402 3.0
Basic materials chemistry 67 3.1 164 5.4 58 1.6 68 1.4 357 2.6
Chemical engineering 20 0.9 34 1.1 60 1.6 225 4.7 339 2.5
Surface technology 119 5.6 105 3.5 42 1.1 55 1.2 321 2.4
Materials processing 116 5.4 68 2.2 21 0.6 97 2.0 302 2.2
Thermal processes 140 6.6 38 1.3 19 0.5 103 2.2 300 2.1
Environmental technology 75 3.5 82 2.7 14 0.4 117 2.5 288 2.1
Machine tools 7 0.3 101 3.3 24 0.7 136 2.9 271 2.0
Engines 115 5.4 34 1.1 20 0.5 78 1.6 247 1.8
Mechanical elements 95 4.5 45 1.5 22 0.6 79 1.7 241 1.8
Handling 61 2.9 47 1.6 20 0.5 104 2.2 232 1.7
Food processing 80 3.7 42 1.4 47 1.3 58 1.2 227 1.7
Transport 13 0.6 45 1.5 46 1.3 118 2.5 222 1.6
Nuclear engineering 33 1.5 9 0.3 44 1.2 21 0.4 107 0.8
Space technology 44 2.1 14 0.5 12 0.3 37 0.8 107 0.8
Consumer goods 23 1.1 18 0.6 9 0.2 14 0.3 64 0.5
Civil engineering 5 0.2 26 0.9 15 0.4 9 0.2 55 0.4
Others 0 0.0 31 1.0 10 0.3 14 0.3 55 0.4
Total 2,134 100 3,029 100 3,679 100 4,745 100 13,587 100
Source: United States Patent and Trade Mark Office. Available at: <www.uspto.gov>.
By analyzing Table 17, the absolute innovation strength and relative innovation strength of the four countries can be defined clearly. It is obvious that BRIC countries markedly differ in the technological fields in which they exhibit innovative strength.

A Comparative Study on National Innovation System in the BRIC Economies 139
TABLE 17Comparison of absolute and relative innovation strength of BRIC countries
Country Absolute innovation strength (Top Five) Relative innovation strength (Top Four)
BrazilSurface technology, materials processing, thermal processes,
engines, mechanical elements
Thermal processing , control technology, organic chemistry,
and surface technology
RussiaOrganic chemistry, drugs, materials, basic materials chemistry,
and civil engineering
Audiovisual technology, optics, electrical engineering, and
materials
IndiaAudiovisual technology, telecommunications, information
technology, semiconductors, polymers
Telecommunications, audiovisual technology, information
technology, and semiconductors
ChinaElectrical engineering, optics, control technology, medical
technology, chemical engineering
Electrical engineering, audiovisual technology, control
technology, and semiconductors
Source: United States Patent and Trade Mark Office. Available at: <www.uspto.gov>.
7 CONCLUSIONS
7.1 Lessons learned
The first lesson is the importance of effectively tapping into the global economy. China has done this extremely well, in many ways. With the opening to the overseas market, especially the entrance to WTO and tariff and non-tariff barriers reduction, China has been continuously opening its domestic market. International trade and investment are the key strategies for China’s economic globalization. During this process, we can absorb and consume new knowledge and enhance technological capabilities.
The second lesson is that effective use of FDI is more important than the amount of FDI. China’s capability of absorbing and effectively using FDI, results from low labor costs and the development of a large domestic market, which strengthens bar-gaining power. Along with these advantages, China extended its range of options regarding projects and technologies. Another important factor is that China, after a long period of innovation and opening to foreign markets, has developed a sound base of human resources capable of absorbing the spillover of technologies.
The third lesson is the importance of competition. Foreign enterprises in China operate in both the domestic and international market, which results in the following: (1) foreign-investment attracts the best technologies and management experiences to China, considering that these enterprises compete in the global market; and (2) domestic enterprises in China must compete with foreign enterprises, incentivizing the enhancement of technologies. After joining the WTO, China’s creativity has improved significantly, attesting the importance of open policy and competition.

140 The Perspective of the World Review |RTM | v. 2 | n. 2 | Aug. 2010
The fourth lesson is the importance of education. In China, the high literacy rate and low labor costs are prime attractions for FDI. Investments in high-level human capital have been critical for Brazil’s excellence in aeronautic technology, deep oil exploration, and agricultural research. Nonetheless, good education alone may not be effective. Russia has the best education among BRIC countries and the highest percentage of higher educated population, however the effectiveness of innovation has been low. One may conclude that innovation is a kind of systematic engineering.
Fifth is the importance of macroeconomic conditions. China has a relatively stable macroeconomic environment, including low inflation, low interest rates and stable exchange rates. This has created a predictable business environment which, both, domestic and foreign investors like. Since the 1980s, India also has had a relatively stable macroeconomic environment, except during the financial crisis of the late 1980s, which culminate in 1991. Brazil, on the other hand, went through a period of macroeconomic instability between 1980 and the early 2000s, when it finally attained stability. This also happened in Russia, which experienced a very turbulent 1990s.
The sixth lesson concerns the importance of continuous effort. An emblematic case is that of the aeronautics’ industry in Brazil, whose development has been included in national strategies and has received continuous investment since the 1930s.
The seventh lesson is high investment rates. China has grown faster than any of the other three countries because its investment rate is around twice as high. While it is true that much of this investment has been inefficient, it is also true that high rates of investment allows for new technologies.
Eighth is the importance of the role of government. We do not refer to the amount of the R&D expenditures invested by government, but the definition of policies and laws for innovations. In China, enterprises are the main executors of innovation. At the same time, the government has been the leading proponent of political liberalization, absorbing of foreign capital, the construction of special economic zones, the construction of high-tech development zones, the creation of a tech-business incubator and the Torch Programme for developing new/high tech industries.
Ninth is the attention given to the variation of the population. Along with innovation and opening up to the world, there is a family planning policy in China that plays an important role in the development of the economy. India’s population has increased, while Russia’s population has decreased, resulting in the depression of the economy.
A Comparative Study on National Innovation System in the BRIC Economies 141
7.2 Economic implications for BRIC
There are predominant individual characteristics and commonalities among the BRIC countries regarding the construction and evolution of the innovation system. The similarities in future trends are explained below.
Open approach
The process of trade liberalization provides access to the global economy, knowledge and advanced technologies, increasing national capacity for innovation. There are three tasks at hand. The first is to enhance education and develop high-tech human resources to improve learning and the competing abilities of national enterprises. The second is to improve the ability to negotiate with foreign capital and make reasonable choices regarding productive or technological factors, maintaining a balance between the protection of domestic industries and opening to the world market. Finally, create a good local system, law environment and infrastructure that attract foreign high-tech company investment. An attractive investment destination may arouse competition between different projects, where capital and technologies will be filtered.
Construct a competition system
It’s crucial to construct a system capable of absorbing foreign advanced technologies and incentivizing domestic enterprises to invest in innovation. Nationally, the competition system may drive domestic enterprises to keep learning and absorbing new knowledge and carry out innovations. Internationally, competition may motivate foreign enterprises to bring the most advanced technologies to the local market.
Government leadership
As Lundvall (1985) observed, institutions (such as enterprises, research in-stitutes or universities), rather than individuals, promote innovation in the economy by interacting with each part of the innovation system and gen-erating mutual influences within the social system. The government is the first instance to promote activities among these interactive activities. The success of a country’s innovation policies is based on the continuous efforts of public and private elements, as well as national intervention. Under this model, the government may guide development and promote the creation of new knowl-edge and its applications. Undoubtedly, government intervention doesn’t mean that the government should invest in R&D directly, but that it should formulate and implement better innovation policies and promote cooperation among gov-ernments, enterprises, research institutes and universities, motivate enterprises to invest in and implement R&D. Meanwhile, the government should also supply the necessary public goods that promote innovation.
142 The Perspective of the World Review |RTM | v. 2 | n. 2 | Aug. 2010
Emphasis on enterprises
In a system of market economy, enterprises are the main players, while the innovation of technologies promotes economic progress. Simply follow this rule and there will be a market-driven path to innovation, moreover market demand will be met. Enterprises should take the lead in R&D investment, technical innovation and its application. Within the BRIC countries China leads in NIS, whereas the other three countries, especially India, still have a long way to go.
From the standpoint of individual characteristics, there are many advantages and disadvantages of the BRIC’s innovation systems. In China a stable macroeconomic environment, a powerful government, a large market, economic globalization and the continuous increase in investment in innovation support the national innovation system. The disadvantages are the increase of labor cost and the bottleneck of environmental resources. In India the main advantages are abundant human resources, which have shown an increasing trend, while the development of education is a weakness. In Russia there is a sound higher education system, many natural resources and a strong technology base, however, the continuous decrease of the population, the lack of innovation expenditures and the fluctuation of the macroeconomic environment are its weaknesses. The main advantages of Brazil reside in its reasonable industrial structure and advanced aeronautic industry technology, while its disadvantages are the unfair distributions system and low levels of R&D expenditures.
Likewise, the differences in the configurations of the NIS among BRIC countries allow for complementarities and possibilities of cooperation. On one hand, Russia tends to focus mostly on fundamental innovation, unlike India, while Brazil and China have preferred to pursue applied innovation. On the other hand, Russia and India tend to exhibit incremental innovation systems, while China and Brazil tend to pursue radical innovation systems. The four countries can make full use of each other’s comparative advantages and carry out activities of cooperation; otherwise, there are large discrepancies among their innovation strengths.
REFERENCES
BASKARAN, Angathevar; MUCHIE, Mammo. Foreign Direct and International-ization of R&D: The Case of BRICS Economics. In: ASIALICS INTERNATION-AL CONFERENCE: FROM MANUFACTURING TO SERVICES: CHANG-ING ROLE OF INNOVATION SYSTEMS, 5., Bangalore, India, April 2-4, 2008.
BINGWEN, Zheng. The Key for Reconstructurding the SNIs is the State-From Point of View of Economics, in Acknowledge-based Economiy and National In-novation Systems. Publishing House of Economic Management, 1998.
A Comparative Study on National Innovation System in the BRIC Economies 143
BINGWEN, Zheng; DUARCOURT, Pierre. Review on SNIs, in Economic Per-spectives (Jingjixue Dongtai), CASS, n. 12, p. 53-57, 1994.
DAHLMAN, Carl. Innovation Strategies of three of the BRICS: Brazil, India and China-What can we learn from Three Different Approaches? Sanjaya Lall Pro-gramme for Technology and Management for Development. University of Oxford Department of International Development, 2009 (Working Paper, n. 23).
FREEMAN, Christopher. Technological infrastructure and international competitiveness, draft paper submitted to the OECD ad hoc group on sci-ence, technology and competitiveness. Paris: OECD, 1982.
______. Technology policy and economic performance: lessons from Japan. London: Frances Pinter, 1987.
GOKHBERG, Leonid; GORODNIKOVA, Natalia. Russia’s Innovation Sys-tem in Transition – BRICS National Innovation Systems, IDRC. In: SEMINAR COMPARATIVE STUDY OF THE NATIONAL INNOVATION SYSTEMS OF BRIC COUNTRIES, Rio de Janeiro, 2010.
GOLDMAN, Sachs. Dreaming with BRICs: The path to 2050. Global Eco-nomics Paper, New York, n. 99, 2003.
JOSEPH, K. J. National System of Innovation: India, IDRC. In: SEMINAR COMPARATIVE STUDY OF THE NATIONAL INNOVATION SYSTEMS OF BRIC COUNTRIES, Rio de Janeiro, 2010.
KAPLINSKY, Raphael. Globalization, Poverty and Inequality: Between a Rock and a Hard Place. Cambridge: Polity Press, 2005.
LALL, Sanjaya. Reinventing Industrial Strategy: The Role of Government Poli-cy in Building Industrial Competitiveness. Oxford: Queen Elizabeth House, Oct. 2003 (Working Paper, n. 111).
LIU, Xielin; LV, Ping; TiePen. China’s Innovation System in Transitions in Tran-sition-BRIC National Innovation Systems, IDRC. In: SEMINAR COMPARA-TIVE STUDY OF THE NATIONAL INNOVATION SYSTEMS OF BRIC COUNTRIES. Rio de Janeiro, 2010.
LUNDVALL, Bengt-Ake. Product innovation and user-producer interaction. Aalborg: Aalborg University Press, 1985.
ORGANISATION FOR ECONOMIC CO-OPERATION AND DEVELOP-MENT (OECD). Education at a Glance 2005. Paris, 2006.
PELTOLA, Kaisa-Kerttu. Russian innovation system in international compari-son: Opportunities and challenges for the future of innovation development in Russia. Electronic Publications of Pan-European Institute. Nov. 2008.

144 The Perspective of the World Review |RTM | v. 2 | n. 2 | Aug. 2010
RUSHING, Francis W.; BROWN, Carole G. (Org.). National Policies, or De-veloping High Technology Industries: International Comparisons. Boulder: Westview Press, 1986.
SCHANKERMAN, Mark; PAKES, Ariel. Estimates of the value of patent rights in European countries during the post-1950 period. The Economic Journal, n. 96, p. 1052-1077, 1986.
SOARES, Maria C. C. Description and Dynamics of the Brazilian Innovation System, IDRC. In: SEMINAR COMPARATIVE STUDY OF THE NATION-AL INNOVATION SYSTEMS OF BRIC COUNTRIES, Rio de Janeiro, 2010.
TSENG, Chun-Yao. Technological Innovation In The BRIC Economies. Re-search. Technology Management, Mar./Apr., p. 29-35, 2009.
UNITED NATIONS CONFERENCE ON TRADE AND DEVELOPMEN (UNCTAD). World Investment Report. Geneva, 2009.
UNITED NATIONS EDUCATIONAL, SCIENTIFIC AND CULTURAL ORGANIZATION (UNESCO). Human development report. Paris, 2009a.
______. Science and Technology Report. Paris, 2009b.
______. GERD, researchers data and related indicators: UNESCO Institute for Statistics (UIS) estimations. Paris, 2009c.
UNITED NATIONS POPULATION DIVISION. World Population Pros-pects: the 2006 Revision, see. New York, 2006. Disponível em: <www.un.org.>.
WALZ, Rainer; OSTERTAG, Katrin. Absorptive Capacities for Sustainability Technologies: Perspectives from the BRICS and China. Chinese Journal of Pop-ulation, Resources and Enviroment, China, v. 7, n. 2, p. 3-10, 2009.
YAO, Xuening; WATANABE, Chihiro. Co-evolutionary Dynamism between in-novation and Systems in the BRICs. In: CONFERENCE PAPER OF JAPAN ADVANCED INSTITUTE OF SCIENCE AND TECHNOLOGY. 2007. Dis-ponível em: <https://dspace.jaist.ac.jp/>. Acesso em: 2008.
______. Co-evolutionary Dynamism between innovation and Systems in the BRICs. In: CONFERENCE PAPER OF JAPAN ADVANCED INSTITUTE OF SCIENCE AND WORLD BANK, World Development Indicators, Wash-ington DC, 2009.
<http://unstats.un.org/unsd/default.htm>.
<www.uspto.gov>.YALLAPRAGADA, Ram Mohan; PARUCHURI, Madhu R. Foreign Direct Investment in India: A Lost Opportunity. Southwestern Eco-nomic Proceedings, St. Louis, Missouri, v. 30, n. 1, 2001.

A Comparative Study on National Innovation System in the BRIC Economies 145
ZHANG, Kevin H. Does Foreign Direct Investment Promote Economic Growth? Evidence from East Asia and Latin America. Contemporary Economic Policy, v. 19, n. 2, p. 175-185, 2001.
______. Foreign Direct Investment and Economic Growth in China: Panel Data Study for 1992-2004. Illinois: State University, 2006.