Embed Size (px)
Citation preview

W&M ScholarWorks W&M ScholarWorks
Dissertations, Theses, and Masters Projects Theses, Dissertations, & Master Projects
1958
A Comparative Study of Meristic Variation in the American Eel A Comparative Study of Meristic Variation in the American Eel
(Anguilla rostrata) and Atlantic Anchovy (Anchoa mitchilli) (Anguilla rostrata) and Atlantic Anchovy (Anchoa mitchilli)
Ernest C. Ladd College of William and Mary - Virginia Institute of Marine Science
Follow this and additional works at: https://scholarworks.wm.edu/etd
Part of the Fresh Water Studies Commons, Morphology Commons, Oceanography Commons, and the
Zoology Commons
Recommended Citation Recommended Citation Ladd, Ernest C., "A Comparative Study of Meristic Variation in the American Eel (Anguilla rostrata) and Atlantic Anchovy (Anchoa mitchilli)" (1958). Dissertations, Theses, and Masters Projects. Paper 1539617372. https://dx.doi.org/doi:10.25773/v5-dd73-y349
This Thesis is brought to you for free and open access by the Theses, Dissertations, & Master Projects at W&M ScholarWorks. It has been accepted for inclusion in Dissertations, Theses, and Masters Projects by an authorized administrator of W&M ScholarWorks. For more information, please contact [email protected].
A COMPARATIVE STUDY OF MERISTIC VARIATION IN THE AMERICAN EEL (ANGUILLA ROSTRATA)
AND ATLANTIC ANCHOVY (ANCHOA MITCHILLI)
byErnest Cooiidge Ladd
A THESIS SUBMITTED IN PARTIAL FULFILLMENT OF REQUIREMENTS FOR THE DEGREE OF MASTER OF ARTS
JJ KUM. TtiiS
COLLEGE OF WILLIAM AND MARY
1958
£>
TABLE OF CONTENTS« Rays. * . 9 - * « * C
Sublect Page** *. i - > a *• * * * « . * « « . *. / « ' * 9 ♦ -5
INTRODUCTION. . .............................*. / *- u ; u 'Wr - ''■•:• ■'*£
1Economic Importance of Eel and Anchovy . . 1
~t>it - History and Purpose of Her Is tic Studies. . 2
Purpose of Present Investigation . . . . . 4
Heristic Variation in the American Eel . . • • • • • © • ‘5
Meristic Variation in the Atlantic Anchovy •■ a-, a • • • • 6
MATERIALS AND METHODS . . . . . . . . . . . . . 7
STATISTICAL ANALYSES. .' . vjf. .rv .if.?id. . y- 1% I • *&:
• • • » 8. ., -. t r vi ■, * *. ■ *. & « * i * <*? *. ■** * w > * - s * 7
THE AMERICAN EEL. . . . . . . . . . . . . . . . 1 • t # 10r. •' - « • * < - - * » -V ■ v » v « * - * ■* . * to **- r .{ i £
Numbers of Vertebrae . . . . . . . . . . . • • * • • * • 10■ f y *‘, V' -'if“» b . ,iaD. r- • « . - » ' * * ' * » V V »• « * * to . ■£* > « '* « a- ■ ■ .* ■ i
Variation in Vertebral Counts with Length. • • • • • • • 10
— Precaudal and Caudal Vertebrae . ♦ . . . . « « « • • * a 11
Structural Variations................ . . •# • • • • • ♦ 12
Numbers of Fin Rays. . . . . . . . . . . . * • •>
• • • * 14
Relationship Between Numbers of Body Segmentsand Fin Rays • • . • . 15
THE ATLANTIC ANCHOVY. . .......... ............. 15
Numbers of Vertebrae • • • * • • • 15
Variation in Vertebral Counts with Length. ♦ • ♦ • • .' • 16
Precaudal and Caudal Vertebrae . . . . . . • • a • • f • 16
Structural Variations. . . . . . . . . • • 17
Numbers of Fin Rays. .................... 18Dorsal Fin Rays . , . ..................... 18
mrr
Z5£e
Anal Fin Rays. . . . . . ............... 18Pectoral Fin Rays. ........... 19Relationship Between Numbers of Body Segments * ' vm* r,." > 4and Fin Rays ........... „ . . . . 19
COMPARISON OF MERISTIC VARIATION IN EEL AND ANCHOVY. . . . . . . 20K-; .} i „ w ■: » •'< * «* »
Numbeis of Vertebrae ..................................... 201 *’ * ... *J - * ‘■J *. f . t‘, . I ,. '■- *-e ' \ ? y
Variation in Vertebral Counts with Length. . . . . . • • • 21H ■’ ,. ■' , ... * n - *••; ii;i v, Ci /i
Structural Variations............... 21v ■ , v..- - • ...* ..*.■?•■ x , i*Numbers of Fin Rays. . • • . . . . . . . . . . . 22Relationship Between Numbers of Body Segmentsand Fin Rays . . . . . . . . . . . . . . . . . . . . . . . 23
SUMMARY . . . . . . . . . . . . . . . . . . . . . .... . . . 24LITERATURE CITED. . * « . . » «. . . > « . . « . . . • . -■» . . * 26
* *' ift .»;■> t « t * ■:-> C <
.■ -s1 \ ? A l t.
. •. . "5 . *• J 4 > -■* . ‘i’v-'Uj . \'.y -'-.h
‘i. "* ft-1*; r ?*.■'' * L . > i-... U *" .• t ?; •.< • ’ :
k’j f . I , : • .. *ii*. "...
■, ;..T. i v v i ’ \ v • . i i 'it. * . i«v V. i i ■- i. - ^
•*. . *. r - ■ - ■: ?%.. t <• I: * -a . • • i . i *■«. . ivv - L . - ■* ; c v .• t,} •. i-yiA ‘ . tjf <*>t

•* * > -
ACKNOWLEDGEMENfs. . . . . . . . .. j.1 ; „ i t i n
i The writer wishes to express his appreciation to the many people who assisted in this study, :r 77. I : l . -.1 -.--v . 'y
The sample of elvers from Nova Scotia was provided by Dr. A. W.H. Needier and the New Hampshire sample by Professor C. Floyd Jackson, Clarence Richards and Maurice Pare. Elvers from Virginia and all anchovies were collected with Mr. William H. Massmann of the Virginia Fisheries Laboratory.'. 7 ... i. ■. * .5. ■ . I'.-j rivs if.*''.a ,'’°^rCK,v
r Special thanks are due to Messrs. H. E. Stevens, B. B. Lineberry and W. W . Cloe of the Statistical Section and M. L. Winkler, Staff Photographer, of the American Viscose Corporation, Fredericksburg, Virginia.The .typing was done by Mrs. Lois Grigsby, Miss Miriam Richards and Mrs.
Edith Briscoe,, and Miss Particia Conner. - ; sry d ‘s. vur- ■- „ r- 1The writer is grateful to Dr. J. L. McHugh, Director of the
Virginia Fisheries Laboratory, for his technical advice and guidance throughout the study. The persistent confidence and help given by Dr.McHugh and the author1s wife, Alice Ladd, are largely responsible for completion of the study. Special thanks are also due Dr. G. W. Low, Jr., Plant Manager, and Dr. C. W. Tasker, Technical Superintendent, of the American Viscose Corporation, Fredericksburg, Virginia, and to the entire staff of the Virginia Fisheries Laboratory for their assistance, understanding and encouragement. a . M>i : - '-r i, >.£*..)

u-’ -» . * INTRODUCTION :Economic Importance of Eel and Anchovy v \ i r; r „■.. ■. v \ ;
? The eel has long been a food fish of secondary importance in Chesapeake Bay and its tributaries, Hildebrand and Schroeder (1927) reported that in the commercial catch of 1920 it ranked eleventh in qu^ptity and tenth in value* 318*000 pounds worth $33*704. Quantity taken and value have increased since 1920* but relative importance has dropped.Anderson and Power (1955) reported that the 1955 catch in Chesapeake Bay was 873*000 pounds worth $94*000* ranked sixteenth and thirteenth* respectively* among migratory food fishes. In 1955 in the United States 1*386*000 pounds of eels* worth $186*000* were landed. Chesapeake Bay.landings were 63 per cent by weight, and about 50 per cent by value* of this total. If eels were in greater demand in the United States* landings undoubtedly could be increased considerably, for the resource now is underexploited.
rv. The eel is considered by some to be very destructive of other fish. This belief was so strong in the latter part of the nineteenth century that a bounty was paid by the State of Maryland for their destruction. Eels probably are no more voracious than other predatory fishes* such as striped bass* but their superficial resemblance to the parasitic lamprey may have been responsible for this strong public feeling. However* they
* » i • - £ ; J # 4 O * * V J '-do cause trouble by entering crab shedding floats and by damaging shad and
other fishes in gill nets.The importance of anchovies as food for other fishes is greater
'' i • ft • t. : . ; ; . . 'uthan their direct importance to man. Hildebrand and Schroeder (1927)• • t ' * ■ t - • v* - • .VO ■ • ' ‘
stated that the abundance of A. mitchilli in Chesapeake Bay and its
- 2 -
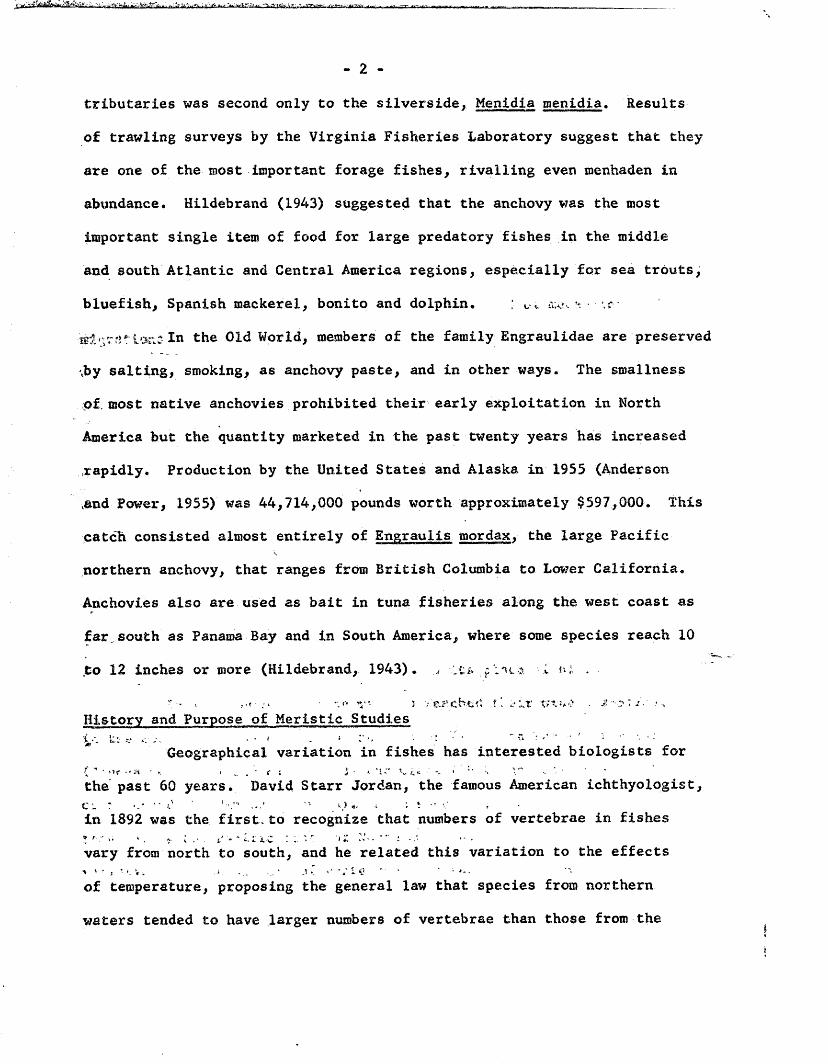
tributaries was second only to the silverside, Menidia roenidia. Results of trawling surveys by the Virginia Fisheries Laboratory suggest that they are one of the roost important forage fishes, rivalling even menhaden in abundance, Hildebrand (1943) suggested that the anchovy was the most important single item of food for large predatory fishes in the middle and south Atlantic and Central America regions, especially for sea trouts, bluefish, Spanish mackerel, bonito and dolphin,
t^e Old World, members of the family Engraulidae are preserved ,by salting, smoking, as anchovy paste, and in other ways. The smallness of. most native anchovies prohibited their early exploitation in North America but the quantity marketed in the past twenty years has increased rapidly. Production by the United States and Alaska in 1955 (Anderson \and Power, 1955) was 44,714,000 pounds worth approximately $597,000. This catch consisted almost entirely of Engraulis mordax, the large Pacific northern anchovy, that ranges from British Columbia to Lower California. Anchovies also are used as bait in tuna fisheries along the west coast as far. south as Panama Bay and in South America, where some species reach 10
to 12 inches or more (Hildebrand, 1943). ; u .f -i n; , -* - ■ -f. ?■■*. j v'ef’ch cft t * s i x
History and Purpose of Meristic Studiest:- c c ■ ■ > . * '• r’ - ‘ ’■"» : / ‘
Geographical variation in fishes has interested biologists for? ■* • op .* a ■ .. * „ . • r « i • * *1" ■' *- ' “ *•the past 60 years. David Starr Jordan, the famous American ichthyologist, in 1892 was the first, to recognize that numbers of vertebrae in fishes* r " . r * • t '***-£ iC 1 - ' r- '»Zvary from north to south, and he related this variation to the effects of temperature, proposing the general law that species from northern
wafers tended to have larger numbers of vertebrae than those from the

- 3 -tropics. Friedrich Heincke (1898) first demonstrated clearly that this principle could be applied to local groups within a single species by
showing that mean number of vertebrae in Clupea harengus, the Atlantic herring, decreased from north to south. Johannes Schmidt (1920) showed that mean numbers of vertebrae were inherited, but that they could be altered by varying temperatures during embryonic development. .r x<H < c/ - These findings provided an indirect method of measuring fish migrations. If it could be shown that mean numbers of vertebrae in a wide-ranging species varied in some regular fashion with latitude, and that variation between regions was greater than would be expected by chance, then it might be assumed that fish from these different regions did not intermingle freely, for if they did, these differences would
* , ' 1 i, J . ... V ' ' * ' t 1 <
disappear. This would have a bearing upon management of the fishery, for if it were evident that the resource was being overexploited in a certain region, the management program necessary to correct the situation, if the species migrated freely throughout its entire geographic range, would be quite different from the program required to prevent over-fishing of a local population that did not move far from its place of birth.
In North America these methods reached their widest application
in the work of Rounsefell (1930) and Tester (1937) on Pacific herring■-.? . , r- .... • ~ ^
(Clupea pallasii) and Hart (1933) and Clark (1936) on Pacific sardine.• . .... .. - .. « . ... - .** • -*•••'
or pilchard (Sardinops caerulea). Both species inhabit a wide latitudinalrange along the Pacific coast of North America, and both exhibit considerablevariation in mean numbers of vertebrae, decreasing from north to south,
v. s. . - v . 1 . ^ ‘fS % v: V o*. j * ' '* > ■ i t t * • * >'
i , *„l . - i n vt :i iiiliv% Z % o x vor fccbz-it* n .v *
XX" ;.i - ;• •v'-s*- two
2

y::'M . The Pacific northern anchovy (Engraulis mordax) occupies much the same geographic range as the herring and sardine. Mean numbers ofvertebrae in this species also decrease from north to south, but variationsin mean numbers of dorsal, anal, and pectoral fin rays are even more striking (McHugh, 1951). The common anchovy of the Atlantic coast (Anchoa mitchilli) exhibits similar variation in mean vertebral number (Hubbs and Perlmutter, 1942). - c' ^’r v '\‘A *■ *' c-
c d S . t rV s ts z o t h e .Euro;. t a n r t i c c o a - t r , l 'c ■. :.<?<> - . v e tPurpose of Present Investigation£.4,1, - ' . , ~ • V r H l.U f .* * I £4 £ % • '
Individual variation in organisms of the same species, as Darwin:;;uv ir * 4.. . v y '• * ■**; ^
and others have recognized, is the basis of evolutionary change. For thispr,( ■-xt■ ■ -sv,. -v ' : • /V - - ■. --c -- ,reason, variation is of fundamental interest to biologists. Fishes arear-'i -4 4.,. .#c- . 4 - * * -i-o xparticularly useful in the study of variation, for they have evolved into
■. r. •. Xv , ‘‘S' ... - v . '{'2. • » '»a large number of dissimilar groups, possess many well-defined morphological structures that can be expressed numerically, and can be obtained in largeC'ifi ;.&15 . . '4 4- . tkU- •»»»> »>• »< r t,numbers with little effort.esriiact t**. •. ->* . jy c. .. dv>.V.r..?»: *. ■ v •?•*•’» of E>v , x* o*.
For a comparison of individual variation in two dissimilar fish 1 0£ in t .no • v; tj. m*v. - ••• v- • 4vi... •:species, the American eel (Anguilla rostrata) and the common Atlanticvarxtty.anchovy (Anchoa mitchilli) were chosen. The eel is long-bodied, with
...4 ■ ... j, i . v<4 ‘ • - • 4-1 »•. »■' i < i* • *• '
about 107 body segments, and a long and continuous median fin, beginning a% the nape, extending posteriorly to join with the caudal fin, occupying
- -1'h - f ; .. .r.-
the mid-ventral line of the body as far forward as the anus, and containingto dirxf ' -vs.'■•vra .1* :•... •. nc* .. ♦ » '• «.about 440 supporting rays. The anchovy, on the other hand, has only about
• £ t £ «? •: . ■ - ' % •’ - • - >. *• ‘ ••42 body segments, and relatively short and distinct dorsal and anal fins,cun*.‘ e v :.".ac - ..A - ■ •. - • - ‘ > ■ ' - ' -with about 15 and 28 rays respectively. It was decided to investigate similarities and differences in variability of numbers of vertebrae and
fin rays between these two species.

Meristic Variation in the American EelThe fascinating story of spawning and migrations of the European-i'
and American eels, discovered by Johannes Schmidt (1914, 1916) is well known. By systematic collection and interpretation of biological and
s.
physical oceanographic observations he found that both species spawn in- :7 *•’3 { ;
the open Atlantic, in the vicinity of the Sargasso Sea, and that their larvae, hatching out at different depths, are carried by different sets of
■tf! '• ■>'/.: j i - ■currents to the European and Atlantic coasts. He found also that the
; ^ i - ' 'period of larval development is nicely timed with the drift of these
5\ icurrents, so that the European eel does not metamorphose from the trans-
i r .parent larval stage to the pigmented elver until three years have passed,' * ' *■"and the larvae have' arrived off the coast of Europe. The American eel,
-£-v/ v... ■'faced with a much shorter journey, undergoes metamorphosis at the end of
r;‘ r * ~ \ i■ \ . ■* •- ‘a year, in time to swim up the coastal streams of the United States and Canada. Schmidt was able to distinguish the two species, even at the
'■"*t 4 .ij-. «•*.,x •earliest stages, by the sharp difference in number of body segments, about 107 in the American species, and 114 in the more slowly-developing European
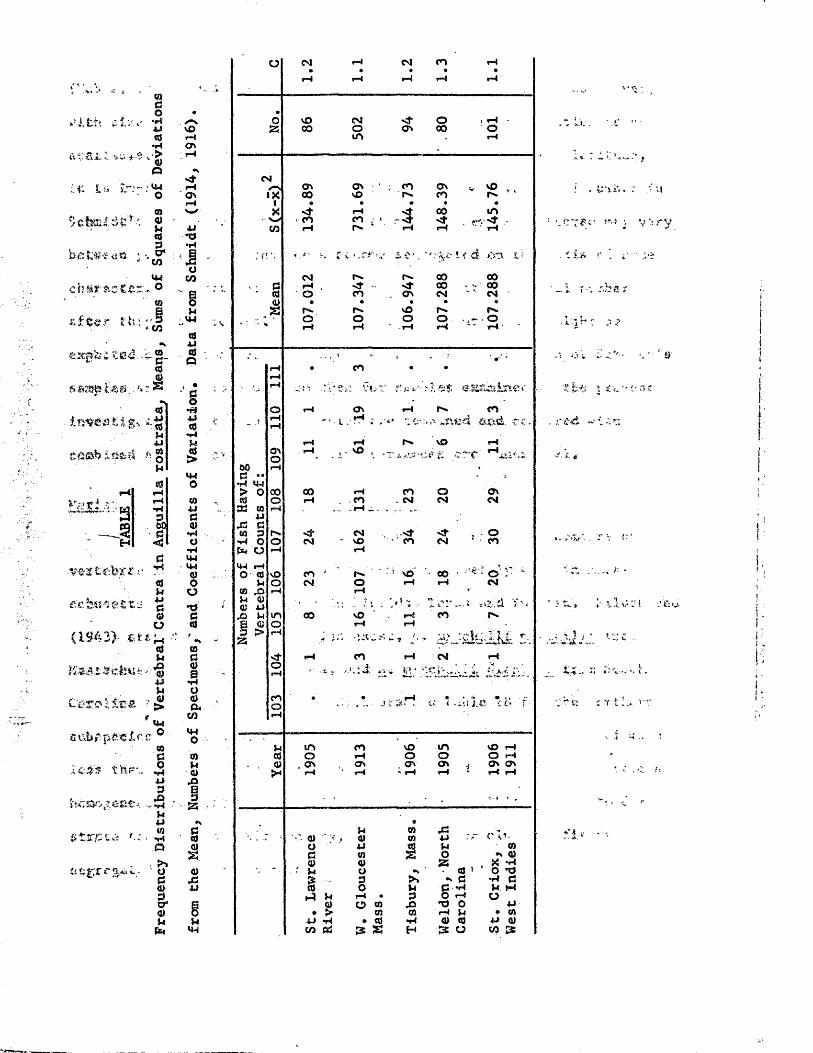
.V- -hi'f.ri /• • ' S'variety. - 5 r ,:* ! .. l:sl,. *. . "ill. \ ■ ■■Although he recognized a difference in mean numbers of vertebrae
>; . .■ i . - - » -' v -r . * . ■ *"between European and American eels, Schmidt concluded that there was no regular difference with latitude in groups of American eels that migrated
r t - »■>to different rivers along the Atlantic Coast (Table 1).( Applying modern
f. I-statistical methods to the analysis, however, there is only about one
; ■ z . * * ,
chance in 100 that his five samples could have been drawn from the same> j ; ~
population (F ~ 3.24, Fq q I = 3.34). We know from other investigations
COGO•MG*
111. A„ . < * V<u
i f i fc uhOSsfeGidfc*'-'. g
GjP
uh
A f t e r *h.i
oa* w
**<3G>sssmi;*?;®,-. «S.•l«jm•u
* gM«S
M
wttetozi,-.:' T?
*43)- ct* <d MM .£Sc|SUtr ’g4-5*■*
■C&T<V&- £
sutifpsseXc.fr a *#3 t n.r-‘-„
h&O&' e&t'.-v
«H C
oa G o*ri 4-iP £> *r4M 4J
irtrpwt #..‘.--4S aSoO8g*a)M
?rrr3
vOpHO'(H•vHfrrH
O '
JoCOuuhG54-iGQ
§h*4J«M
5
l«oCO4JGV
144CM<yOO•OG
COS3u<ua .cocw0COMfl>153§
a)jc■W
V4CM
O CM rH CM CO rH• • * • •
rH pH pH rH rH
•o vO CM < t O i rH -
53 00 O O ' 00 Om rH
CMy**s O ' O ' ‘ ; CO O ' V vO „IX 00 vD co r s
1 • • '« • •X <(• pH co mw CO CO . » r < t * -v < f -CO rH r v * pH rH rH
* > ' c >, a-' v &. sj * ■~xk.£‘ i ( d i O
CM r ^ r^. 00 00c ■ pH , < t - 00 • 00
■ CO o CO .. O ' CM ' ' CMa> « • ' • • •
S vO- * O o O o O-■ rH rH • rH rH rH
M. . . i
• CO♦ ' -
•pH
■v rH ■ * \ * &■ ; v i- ?■ Pjvi,- e S i l U j s l n e v
O rH O ' rH r>. co
- .i rHH * • i i • «-* *'■ <r- :.r-;* .svcd. a v i d , - r c .
rH pH r-. vO rHO ' rH „ MO , ~ ...T-,-, 4- -o .- i ■ ■ ,i. /.V-J ’
00 rH ,•G • a >
H CM> 0 00 00 rH CO O O 'CO O rH . CO - CM CM CM
93 CO rH , «H » _ .■4J
•G aCO p < r CM Mf Hf- , O
H o o CM vO ■ c o CM * COE* u rH rH
CM H ..0 «s vO CO ' fH ’ : i vO 00 ■ O ; *
M O CM o pH rH CMCO .a H rHu o - ( ' , 1 o »«■ ■;. r*) V sa> M ’•■ * : .-F- - ^ t. * •— : -* J>X-\ 4
,jO U m 00 vD rH co n»B Q O rH rHP
S3> r-4
y - * *' -C-l •» y - C - J l j v 51'.
< f rH co rH CM rHOH - ■ - i . J;'*-:i - li» ‘ •>«^
00 • • rH * • * ■ „ * i « ■ ro ' ■■ . - ■ j i: .-s- i ' 1 I i. 4 • V I* :pH
u m CO vO i n vO pHG o rH O O O rH<D . O ' O ' a% O ' 4 O ' O '
S* rH tH *■ rH rH s rH rH
M CO ^5= 0) " y <U CO 4J <' v ’ .
o U cfl M COd V) J s O r\ Q)a> 0) S3 • ^ ^•'■ M o •v . GJ J O *0
p So C •rl GGJ o u G -H U M
M rH • P O rH Oo ® -O T3 O M
• > CO CO rH M • CO4J H • <d tH 0> <0 m a)CO 03 3 : S H ■Ds w W 3
“ U ; . ’ X
: , trni-i.. 7 % u
■-Ct #c-’ **'■* •■ v'trv
• I t-v -r.bCY. i ,j t**
i. t X ■?,.- ' ' ! * V
\. jf'
:* ofec
•- r, *iv-. «.h-•r t v
(Hubbs, 1925; Ford, 1933; McHugh, 1951) that numbers of vertebrae vary with size of fish within a sample, but because such information is not available, and the variation exhibits no regular trend with latitude, it is impossible to explain the variability in mean vertebral number in Schmidt * s data, except to suggest that mean number of vertebrae may vary between yearbroods or that eels become segregated on the basis of some characteristic that varies in regular fashion with vertebral number after they reach coastal waters. Errors in counting also might be expected but this should increase the variances. Variances of Schmidt's samples are much more uniform than for samples examined in the present investigation, but when his samples are combined and compared with
fcombined samples examined recently, variances are .identical.
^ ■ ' ■■■"': *■;-- - ei -• t\-
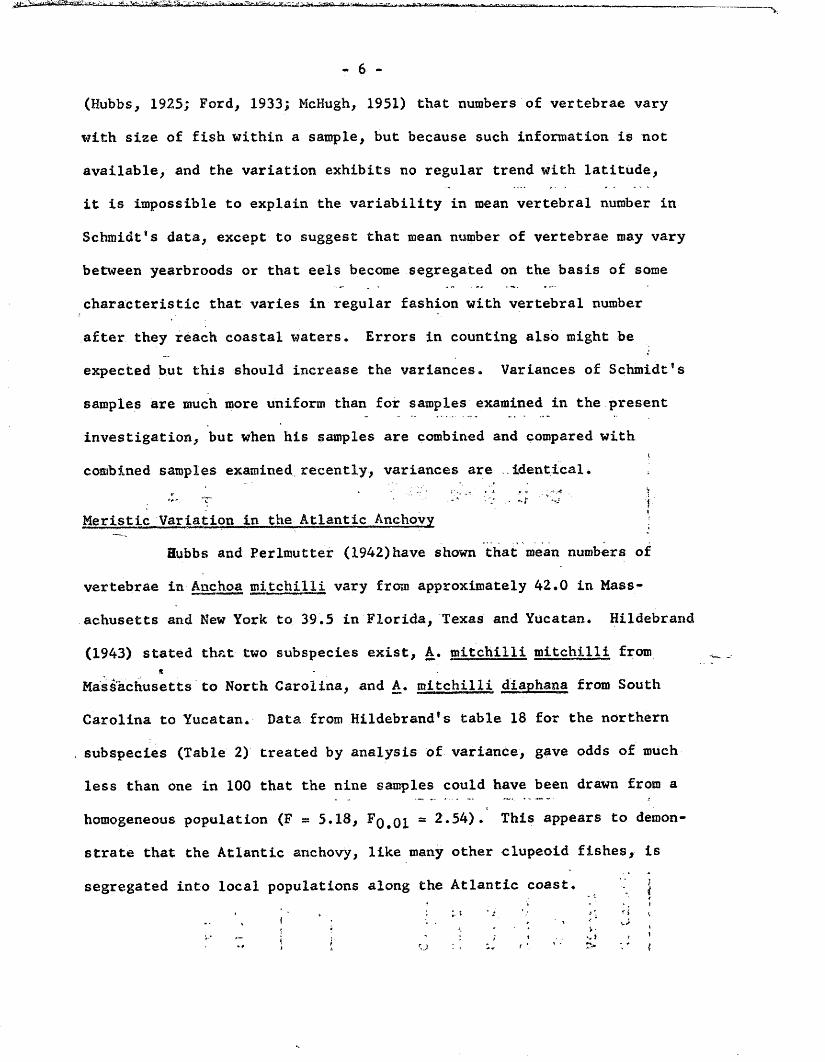
Meristic Variation in the Atlantic Anchovy |Bubbs and Perlmutter (1942)have shown that mean numbers of
vertebrae in Anchoa mitchilli vary from approximately 42.0 in Massachusetts and New York to 39.5 in Florida, Texas and Yucatan. Hildebrand(1943) stated that two subspecies exist, A. mitchilli mitchilli from
* - Massachusetts to North Carolina, and A. mitchilli diaphana from SouthCarolina to Yucatan. Data from Hildebrand's table 18 for the northern subspecies (Table 2) treated by analysis of variance, gave odds of much less than one in 100 that the nine samples could have been drawn from a homogeneous population (F ~ 5.18, Fq#q^ = 2.54). This appears to demonstrate that the Atlantic anchovy, like many other clupeoid fishes, is
segregated into local populations along the Atlantic coast, J
f *
*
j* •
TAB
LE
2 ^
Frequency
Distributions
of Total
Numbers
of Vertebrae
in Anchoa Mitchilli
mitc
hill
i, Means, Sum
s of
Squares
rd£uX>Q>tJ
U4W
a
a*HK5oto4J3<y
COStO'
O
cm»XtXvhto
60C ••
•H iM> Q <3 33 tn •u C 3 O U
st
CM i n vO I-*. 00 i n 00 OS rH• • • r • « • *CM rH rH rH rH rH rH H CM
vO00 CM OSCM 00 vOr. in O inr>« o orH rH
st 00 • -Or.
XT',> CM \D00 os-4”on
ursrv.st
mso00CM
COvOsfrvO
St OS • >Osn*
cm m cn os \o osr-i cm os o oo rs• e • • • •
CM CM H N H HSt Sf <t St ^
so cnP*>» vO
oCMCOmCM
• CM
i n i n s f s o
f s rH «-l oth st st m
n. to co coH CM H
• • CM CM
os r* orH rH
< t CO COSf Sf lT>
r*-, vo»h c n c\j
m cm oo
co
<nuu»33Oaitoto(0E
-dator—4(Qw<u•do
•P3OH4JO<UC3OO
.iduoJH$<u5S
>sowP4>•o&0>s
o*H§
rHCD«
•dc<srH>SU.S
00u
oJhdo
'"yss-;
- 7 -MATERIALS AND METHODS
Samples of unpigmented elvers were collected in minnow seines ordrift nets in the spring of 1951 from Nova Scotia, New Hampshire andseveral locations within Chesapeake Bay and its tributaries. Anchovies
were collected in a surface trawl (Massmann, Ladd and McCutcheon, 1952) from the James River, York Spit and the Rappahannock River in Virginia; and at Elk Point, Maryland, near the head of Chesapeake Bay.| Samples were preserved in 10 per cent formalin. For accuratei.. _ .___enumeration of bony body parts, specimens were processed by a modification of the staining method described by Taning (1944). After rinsing in Tap water, they were placed in 4 per cent potassium hydroxide until cleared. This required about 18 to 20 hours for both species. Next, sufficient acidic alizarin was added to color the potassium hydroxide a deep red. After~8 to 12 hours in staining solution, the following transfers weremade; (1) 70 per cent KOH, 30 per cent glycerin, (2) 40 per cent KOH,60 per cent glycerin, (3) 10 per cent KOH, 90 per cent glycerin, and (4 ) 1 0 0 per cent glycerin to which a crystal of thymol was added as a mold inhibitor. Schmidt (1914) used an alizarin method developed by
A. Strubberg.All meristic counts were made under a dissecting microscope at
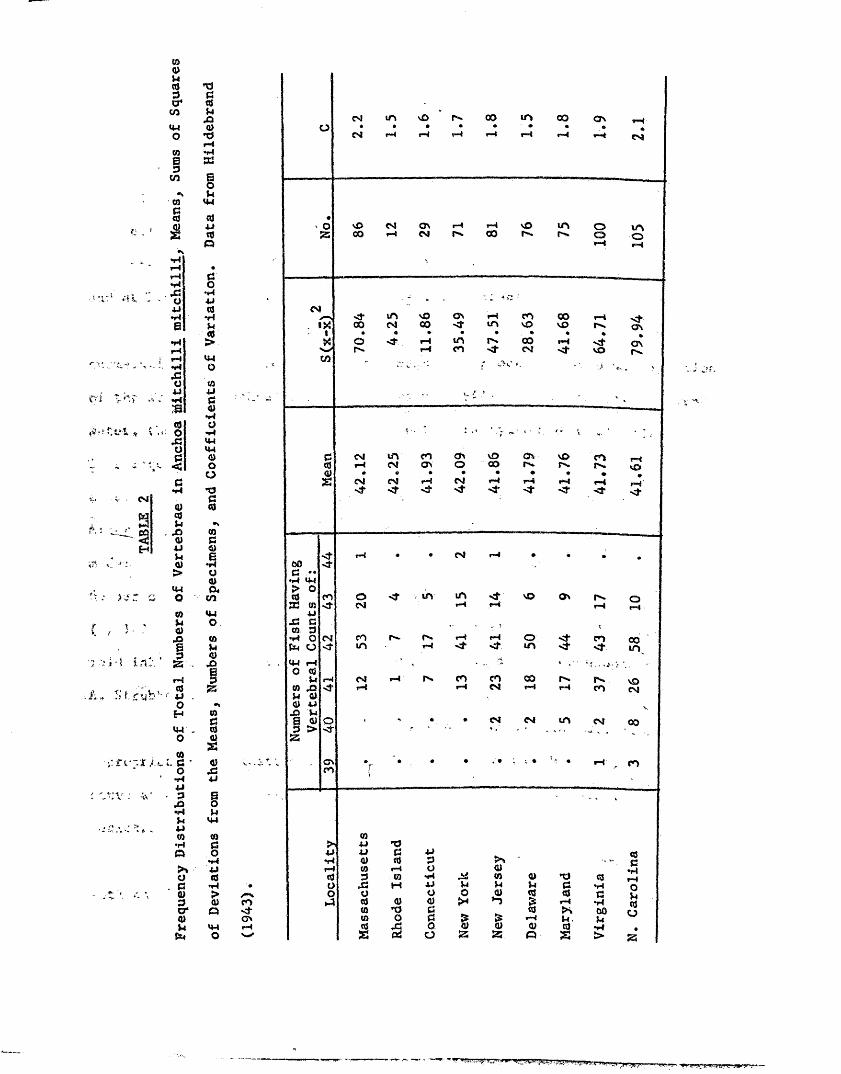
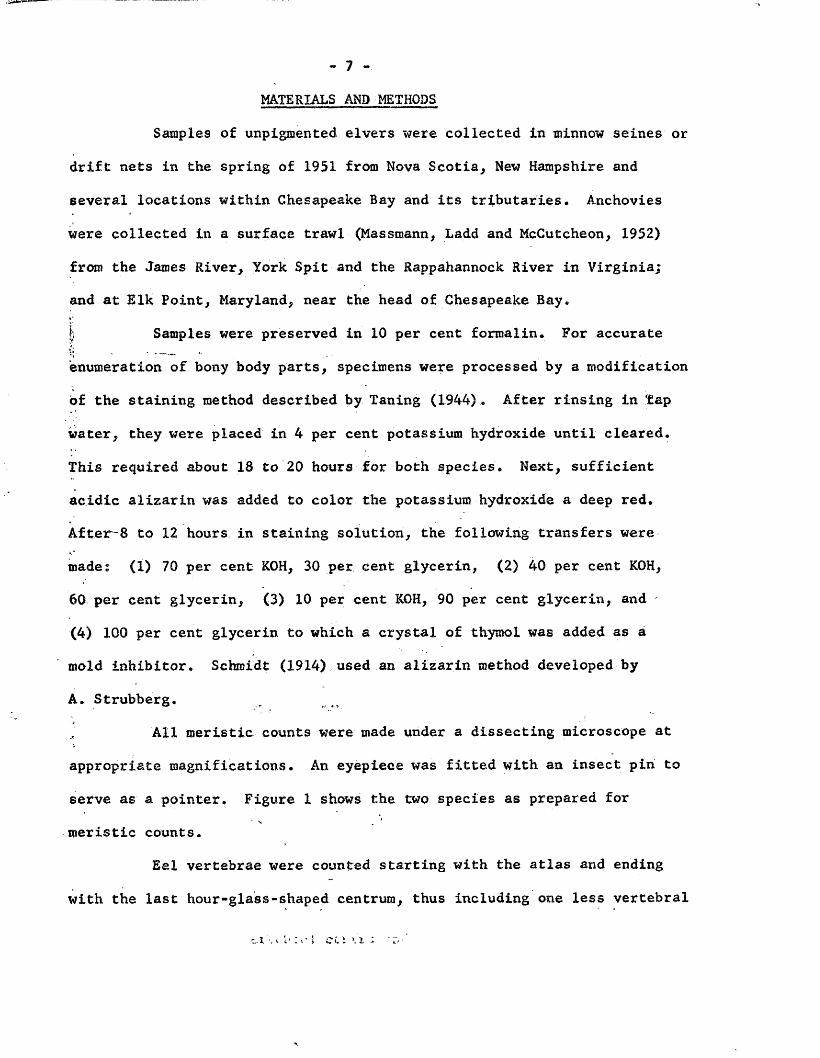
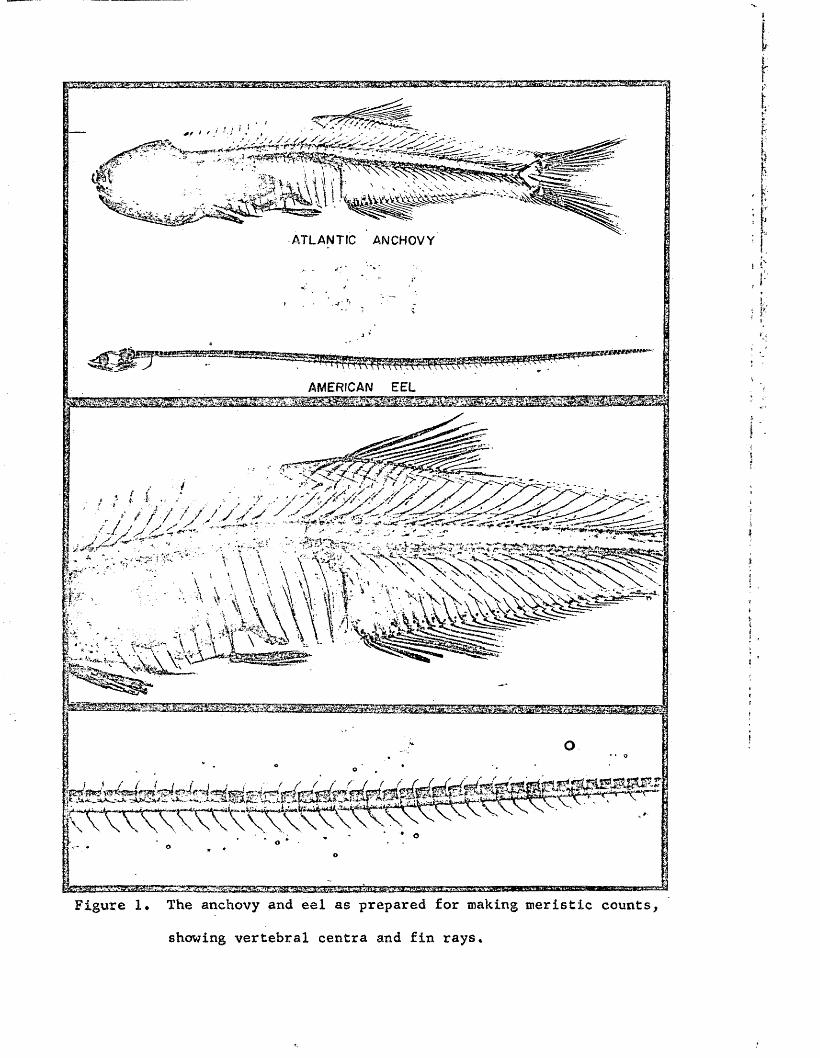
appropriate magnifications. An eyepiece was fitted with an insect pin to serve as a pointer. Figure 1 shows the two species as prepared for
' V *meristic counts.Eel vertebrae were counted starting with the atlas and ending
with the last hour-glass-shaped centrum, thus including one less vertebral
*.x ■. 1': • I a i >. i
ATLANTIC ANCHOVY
AMERICAN EEL
v"% *> fy t> / S / f/ ■' /■'/■■/ '
' . V •' r / >‘/ / / J ' y-'-t j /L, <*■**-'"■■’■ . ■•
v v > , - .
. v- * v
V. \ \ \ A v ^ N V ' x
V v ' A 'A \A \\ * 4 - V' '.v-
I'. '• •. ' . .-- A ' Ai * A \ \ \ i /}\ ^ 2!«•-«%* fa&H \ \ \ { \ i '• ; •-••^§1 L *,*’ ■. *\ --V. \' \^^-\jU=4iS5mgamimSB^
**$ «?**??£*? *** ' ' * / * - / / j i i ," / / <* & £ # ' $ & ? • ’r fs?r?|?$?* «*£»*?$*$• ,1* _T3iAw«u,X• *i*.- \>%...id***
Figure 1. The anchovy and eel as prepared for making meristic counts, showing vertebral centra and fin rays.

- 8 -
segment than was counted by Schmidt (1914)* A count of total vertebraewas made on 693 specimens; 298 from Nova Scotia, 296 from New Hampshireand 99 from Virginia. Counts of precaudal vertebrae, caudal vertebrae,neural and haemal spines, and dorsal, anal, caudal and total fin rayswere made on 100 specimens from each location* Standard length, thedistance from tip of snout to end of the hypural plate, was recorded for
all individuals* J'ur- nc.srl? i.li b'loXc«£t,*ni c ,ck. dfaarrL' ft The following characters were counted or measured on 704 anchoviesfrom five Chesapeake Bay locations: , precaudal, caudal and total vertebrae;neural and haemal spines; dorsal, anal, and pectoral fin rays; standardlength. Vertebral counts of anchovies were made by a method similar to ’u*that described for eels, starting with the atlas and ending with thecentrum just anterior to the urostyle. O..: — J_' Sketches were made of deviations from normal structure of
vertebral centra or their processes.! If there was indecision regardingthe proper count when fused centra were encountered, the specimen was
not used. ./rs*#" to. the chexectern voder iucdr- I - rioceheterOgvTieitv * is " b- ' h» ••d F or * Va &.: ur*; t v . : Avi:.o* * ;
STATISTICAL ANALYSES coast, : . i - - •< j-.'?-'" it * >•••■* r *'
In analysing observational data such as this, two quite differentt ' .1 A.. • .'"-t . ■ t -■ •- I-.. ••• ■methods have been employed by biologists. The first is to arrange the information in some systematic fashion, so that characteristics can be•Oi “• . -- ‘ .. • - - -■ -■-*. *• v • ■ - • • *compared sample by sample, and a subjective interpretation may be made of any difference that appears. If the information can be expressed in numerical terms it is often compared graphically. This method, still commonly used in biology, especially by taxonomists, permits no estimate
of the probability that the difference is real.

The second method begins with an hypothesis, the truth of which can be tested by examining samples and treating the data by statistical methods. If conducted properly, this method removes the possibility of personal bias. It is not intended to infer that the first method always gives incorrect results, for if the observed differences are sufficiently clear-cut, and especially if there is no overlap, statistical treatment is not necessary. But since nearly all biological observations are based on samples rather than on the entire population, and since estimates based on Samples always are subject to error, it usually is advantageous to be able to state the odds that the decision is correct, ^hen differences between samples are relatively small, as they proved to be in the study reported here, statistical analysis is necessary, for there is no other way to test the hypothesis that the differences are not real. - , : rep
»' Although the primary purpose of this study was to compare individual variation in the two species, it was also of interest to test the hypothesis that individual samples of each species were drawn from populations homogeneous with respect to the characters under investigation, since heterogeneity has been demonstrated for the anchovy along the Atlantic coast, and since there is some heterogeneity also in Schmidt*s data for the eel. In the comparative study of variation, however, it is immaterialwhether the individual species were drawn from homogeneous populations or
TO-'; J i ■ , V*# y- , , * . t \ 't 1not. Therefore, details of statistical analysis have been eliminated in"*v * i , f * . ■ i* U . " iv . , " * i y V •.'*'? V ' ”* • * * * f - * •'
discussing heterogeneity within species, to avoid excessive use of V&\ • /.** . -v- . - I *- j-' i n " *~.z. *'*&.. - v * » - . ’
statistical terminology..c lz tecfietie • otvdi-.- ch . *fcV h-i r i •

- 10 -Absolute variability is greatest when the characteristic being
measured is large. Thus, the variance of body parts in two species as dissimilar as the eel and anchovy cannot be compared directly. To permit comparison, a statistic called the coefficient of variation (C) is introduced, which expresses the standard deviation as a percentage of the mean: C = 10 0 s.
M ; Jl
The American Eel (Anguilla gostrata) - ’ iNumbers of Vertebrae ^ -t-? •- ’ - ^
- Total numbers of vertebral centra were counted for 693 elvers (Table 3). Analysis of variance gave no indication that- the samples could have been drawn from different populations. As mentioned already, these means compare closely, in magnitude and variance, with those reported by Schmidt (Table 1). The range in total counts of individual fish was considerable, however, for the highest counts were about eight per cent greater than the lowest, but the coefficient of variation was consistent with that calculated from Schmidt's data, only a little more than 1 per
cent of the mean.
Variation in Vertebral Counts With LengthIt has been shown for Pacific anchovy (McHugh, 1951), Atlantic
herring (Ford, 1933), and various other species that numbers of vertebrae within a fish sample may vary in regular fashion with body length.Various reasons have been advanced to explain the phenomenon, but the
knowledge is important in meristic studies chiefly because fish often are segregated in estuarine waters according to size, hence variations in

»- : ' v« / •- *. j V.4* Cv.r*. t i; < ; .CJ. XL , *1'. tT i 5v>.
.*■ ..‘ij. '«cr ■ ■* *
•o- , t J ■ l?* : u: ■Ji” '-!;. 1 real Che : he »•;.: lo c r’l ' fci ‘ t
tv , 5 • « v - » n, ? ?•<£, jo ‘r rSiS, t t d V i: r n i & * I - i t - z : s . : -C€
a*'. t « U . 4 . n o i . * *.ctS; 4 r ; ';■. Vv-.: «u f hr.t ^ I tc - v^vr>. ; & z . i .r: ; *
•.. ~<• .1 * 1ft '-tt ?arc ; *r ■• . i.'!-",y.t. ii h ‘> • \> t v t : v<* - ,i~TABLE 3
•C *» • ■* , ' *. $ *. I <..*• i'li'Ktr-P .■■ . a ' * : € * : j . t n . ; i7 . ' t* r .- '/v j -j*.c i t *•
Frequency Distributions of Total Numbers of Vertebral Centra in Anguilla rostrata, Means, Suras of Squares of Deviations from the Mean, Numbers of Specimens and Coefficients of Variation from Three Localities, •*•.*. • *. fc
i’V .*1,4 3L*i tt;.i VT ' nu«- f-a.■■■;■. >t.-i- - : Numbers of Fish Having
Total Vertebral Counts of:S (x-x) Locality 103 104 105 106 107 108 109 Mean No. C
Nova Scotia . 9 > 22 55 96 72 .35 9 106.14 510.79 298 1 .2
New Hampshire 6 15 64 104 71 24 12 106.15 446.75 296 1 . 2
Virginia 2 3 ‘" ' * L"19 42 22 11 106.13 113.29 99 1 . 0
c tc.'sr a vten ot wrrtcbra 'v..th -s. in jj>; j ;#‘t ». .ii. at b I ■&
* 0L,n £& CimCli V-iT.CS • <*se *■ T- 4* bter '1937^ £t-und i ru.t \ * : x,; 1 i •;■ i- *: Jff" 4
c ;-vr.: ;> ci jL" *-*' i 1 / - i.-.- v- be. eeu 1 on n 1 it i *&?* ues .cor ’'it*i'-,4 ■ ^’ V • fc- ?' , * * *. , * *?*. ci chii -Ir aicb ne, i4c.-l>2,h -v194i.) found t;V i:,: i r * ■t:
_V/i* V rJ. ;£rv»‘ 1.1 c ,£ 1.K ;rin; ** 5? • f’ h* hi j o o r»: e t u. •*v ? • ■ *. * * *' -v*. i*nd. . e s k *y cort:«2<?Sed-wi\a adai - q :. r y
.r,
V
i- t ii* f I i l' ,V. h & I ; efeo,- t h a t - uo ss.g--.ifi cant d : t .V.TC !• .. t 'i - i H
.. lsj .rr:i*i iv'js th.* it . ,|o; \j.*\ „**I- X „i * l is,* rcr*'' ti-‘ :tir XL tc uTttT i-; t i * j.ia?

- IX -mean numbers of vertebrae, and perhaps other characters, may be merely an expression of this differential schooling.
Average lengths of elvers from the three localities were: NovaScotia, 57.5 mm; New Hampshire, 56.4 mm; and Virginia, 54.5 ram. Differences between localities in total vertebral numbers also were insignificant.The total range in standard length of individual fish was 48 to 66 millimeters. Treating the three samples as one, mean numbers of vertebrae and sums of squares of deviations from the means were calculated for fish 48 to 57 mm. and 58 to 66 mm. in standard length (Table 4). The difference of 0.39 ^vertebrae could occur by chance less than once in 100 trials. Therefore, to interpret observed differences in mean vertebral numbers of elvers, itwould be necessary to know something about their geographical distribution} • , ; - - < :with sise. It is possible that the differences between Schmidt*s mean vertebral counts (Table 1) were caused by such a phenomenon.
\ ' * "*' ■ * T % * .-Tr fe*. ‘ ♦ I- 4«c k » , * f b'} I
Precaudal and Caudal Vertebrae *' ^ ’: v Anterior vertebrae with haemal arches open are known as abdominalor precaudal vertebrae, posterior vertebra with closed haemal arches are known as caudal vertebrae. Tester (1937) found that variation in vertebral counts of adult Pacific herring between localities was confined to the abdominal portion of the backbone. McHugh (1942) found that total vertebral counts in young Pacific herring were highly correlated with abdominal vertebral counts and only weakly correlated with caudal counts.
It has been shown already that no significant difference exists between mean total vertebral counts in elvers from the three localities
sampled, but it was of interest to determine if counts in particular

t •• r-5* "i's'i iH 1 •■’bi i ••• V*-,•« ' 2. n * v? r a t „ '
;h ' -pr*-: «\.r • ;Kd loir• ic •:• ♦. '^i **-; wnlfiej, i f»‘
i.‘. o»; ec*.-nti» ir« fcpe t *' ri'"io:
: t. , ''C..vSt.» ct ' ixi-.'t U*-: ,• c •
•* It
•■ ■■■••■»v : • ;1f h? bo,* j *.
; i •.:; t* i t .
TABLE 4*. K
Variation in Mean Numbers of Vertebrae with Length in Combined Samples• -I’C.: i; > :, , a., ‘ * ' • ‘l •>*. .-*d
of Elvers, Anguilla rostrata.J 5 19" i.) . i ;
Length mm. Mean S(x-x)^ No. c48 - 57 105.98 37.70 407 0.958 > 66 106.37 21.23 286 0.8
* ; L u : , ; v f •' ;vi •- . • . - *‘.K ' - . . - ■
•, <. 'I V ; M id I t . .‘ 'Sit i 'i of $ & . - •' n L>; tS‘ rk _.v«? f-.
- e i f-lvers * %i 1 ».• i C- a * ? "i. • ^ »i - , t . r . c hT. *'i t. i * .« 2: *3 ai'.d sp i ceil v ar<‘-.”'ysv c‘‘■i ; v '. Ifi* * t Z* *
J fr'iyu*:-.- 2 ) . :•;? rt t v j M .*’*4 • *. mf i 1 k * i 5 - 4
/;*;■ t f i r;C itt 36 p-2t r .;*»£ of all <«4l .•<: **.. ■: ; A. .1
t.-c : u v t. *»''r:,; Jtotis oe : '■*? • y it* *. c.u !* rsf*.-*
’ r ' ■* ti ?■' li, fe-oc^rdiag C-o fc-q/ti f .*.v 13) a.ut .-.-cHt .;;h , i 9 ‘- , *;• Ari.*'£ f lv
V *ii.* U'-oy &?<*.'itru&i l / <v? »oc..*\n u v i :*i t> *• * -*o *»v. *.«$£*is tVe •**-*i, nearly Vo pi?/ ~ M i
-o ^st'vlcr vhycofcLVy.a .
regions of the backbone were more variable geographically. Mean numbers of precaudal and caudal vertebrae in elvers from three different localities differed by slightly greater amounts than did total counts (Tables 5 and 6), but the differences were not highly significant statistically (P 0.05). Relative variabilities of counts in the two regions of the backbone, asexpressed by the coefficients of variation, also were similar.
‘ 'A*.
Structural Variations;:*.•»& a t r f I - h : - J y - K ^ l a
Considerable variation was observed in structure of vertebralA.- .» " i> c •. 1 ' i : ■ > :! . i /columns of eels. Variations in structure of centra have been described':lv * * ‘ - i * i ‘ C ?. •* '< A•'*' t Ok, , - fby Schmidt (1921a), Ford and Bull (1926), Kandler (1932), Ford (1933),McHugh (1942), and Gabriel (1944). Their interest in such "abnormalities" arose from difficulties in ascertaining true numbers of vertebrae in backbone in which such variations appeared.. Only seven of 700 elvers
< 5 ' 1—• . ” - t rhad abnormalities in centrum structure that led to doubt as to the correct
i . 1 ; ?count, but 397 individuals had one or more minor "abnormalities". Table 7 : . i . i
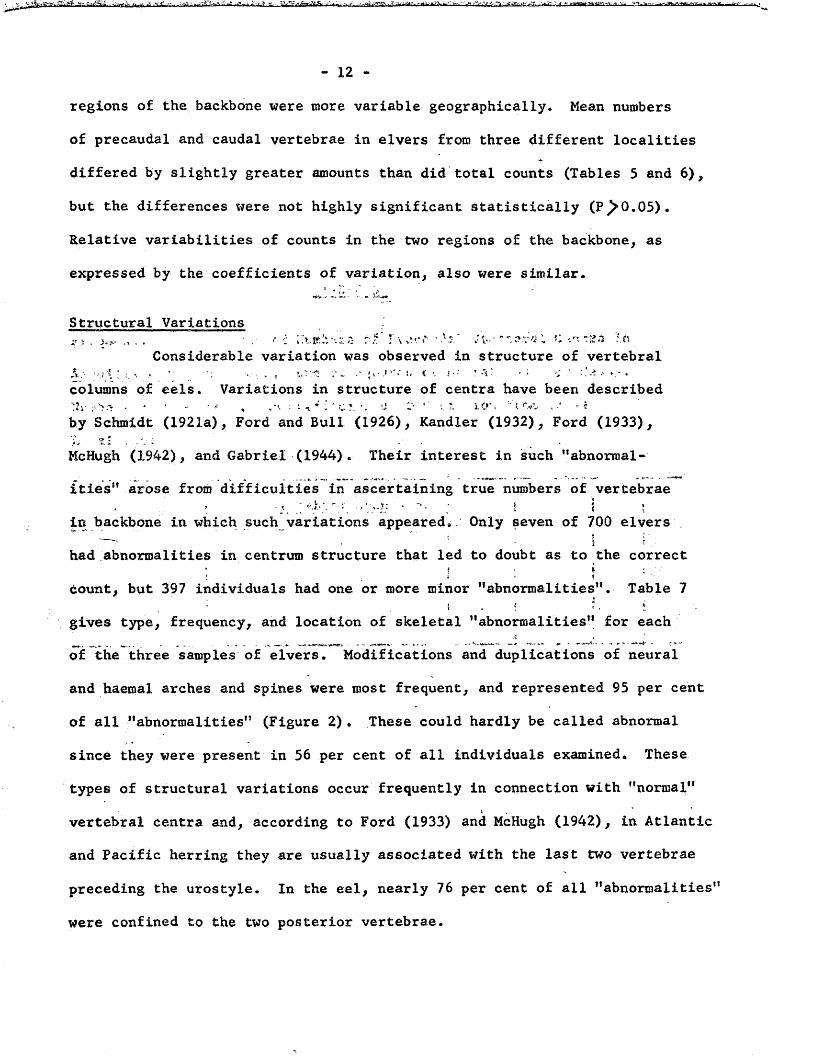
gives type, frequency, and location of skeletal "abnormalities" for eachof the three samples of elvers. Modifications and duplications of neuraland haemal arches and spines were most frequent, and represented 95 per centof all "abnormalities" (Figure 2). These could hardly be called abnormalsince they were present in 56 per cent of all individuals examined. Thesetypes of structural variations occur frequently in connection with "normal"
ivertebral centra and, according to Ford (1933) and McHugh (1942), in Atlantic and Pacific herring they are usually associated with the last two vertebrae preceding the urostyle. In the eel, nearly 76 per cent of all "abnormalities" were confined to the two posterior vertebrae.

TABLE 5 “~r, i
Frequency Distributions of Numbers of Precaudal Vertebral Centra in/ 1
Anguilla rostrata, Means, Sums of Squares of Deviations from Means, Numbers of Specimens, and Coefficients of Variation from ThreeLocalities.
**' 'I1*C3.
V* i •I* i
]. "
Numbers of Fish Having Precaudal Vertebral Counts of:
Locality 41 42 43 44 45 46 Mean S(x-x> No. C
Nova Scotia 18 96 143 37 4 .. . 42.71 195.61 298 1.9
New Hampshire 20 83 156 39 2 1 ... 42 • 84 151.28 286 1.7
Virginia 4 25 55 v • [16; . -V 42.83 54.11 100 1.7

TABLE
6
*3 «u•M .34JcOUuc i<M
iuCM3
o m 0•HH 3 ■UCO o COu •»4 •MS> ■U M
... ■ <U CO CO4J •H >M<D. >OJ CM- > <=» or—i «w Cd<0 O M-a3 ta 3(0<0 0) •MO m O
cd •M3 CM
O cr CM<0u
cnCM
OOO
<y O«Q
V 53ta
co
-33<0**
!‘ CM O ■ •>
CO3m 0)
<0 3 S'» e CO •H
o 0) O*H S 0}4J3 •V a .CO.3 CO •*M ■M CM toM CO o 0)
U *M« ■U (0 4J•H ta u v*4Q O Qi *~4
M ja cO5>n S uo CO 3 o3 525 ►-I3 s * <uO* 3 3 <w<U So cd MM 3 aj J3ftt < S H
*«" ’ i i t *O . ' (% J ■
■ - ■ ’ •_ * ‘ * V; i
H NOO • • *
CM H H
C - ...o NO r>- ON525 ON ON ONCM CM
CM/"S H NO ON1* tn o CM1 • • •
CM NO CON_> O in oCO in CO r~C
3 co m Hcd MS’ CM CO<tf • •s CO co COvO NO VO
r*- H • •vO• •
CM vUD O vD ON CO CM3 10 ..•M to> 4JtO 3 to m NO ON33 3 M5 cn CO
OJ3 O(0 r>. 00 o*r4 r-4 v0 O IN* COf*4 CO H
Ucm SiO <0 CO 00 in m4J V© C*. rM COU M M<0 oS >B CM CM 00 rs.3 r-S NO in H525 COT5
3 M CO m COcd NO rM HU
o rM CMn£>
<u> uM cd *w♦M •H rS3r-4 U (0cd o a cdU o s •Mo CO cd a
EC ♦Mcd CO> Mo 0) *M& >
- i.

\
Irl
\.’j :
o©©
1u
r-4a
§CO CO©
»~3 ©
. d©
oa x v — H* COf « Mf- a O* *H mi 3*
CO •->\ M d
O 3aa o
©©
✓ ° ■U
{ •"O©■u
* © o1 o ©*. — *f4 ><r~- 4-4
\ .-♦ CM\ A <S JO
4-4u•A
. ° rA©
/ © S
1 *Huo
1 : ° di d - a
© <©3.... q . «
. a £n 4J
(X4•V - d
O© •A© X
_ a .&
H "■ d
> *
*H
* 4J «i *r4 Hi - „ . r-S . . _ «\ © 3
\ p "OWo
*r4>
d •HJO *d
* < dM
cwO 4-4
© ’, O A
© ©h4 uO ©d© e§ •
3.25.
© •.n s
ft. d©
• od •s© ©
©©U
u X© ©
4JB u3 ©ts >
*
s
■ '•VJlMk.C
t~i3oq<u-4o
co0)iH 5C
IU 4J.£> r~! C3 3 3 0 > H O Q U
U coa) o)5 SO H
CO©*r<Wt4r-4©eO6-O<
oc©•©d©313<
CO, CO o ON• • • •o CO CO 00vO m lO m
COovO rovO
<S1
evj vO CO
in m r» ON• • •CO rn vO «n00 S3 r*» r .
r-4 vOCO O <!■ oorM r-4 CM
■ud3O
4-1 CJ CO CO
-*
oO • • •
r-4 \ 3 r-4 o© m uo VO3O
, *
©©3
4-4 ^ CO CMO H • • •
co lO mS'S r—4 ON ON ON
r-4<J
oz;
691 154 09
• -o o o o
s s o o oCO CO r-4
uOOCOCd>o25
ovf
CM
ONinm
mon
rococooor-
©00
r-4 ©© MU ©o
H <1
/
—
ii
i. 1
•'■ X .
■ /~ v — - v - ■■ *W“*
J *
f
■1i .
?■
XZ
FX
\ X
Figure 2. Diagramatic representation of (A) "normal'’ and (B-H)
various types of ’’abnormal" neural spines in the last three vertebrae preceding the urostyle• Similar varia* tions also occur in haemal spines.

r - 13 -The number of "abnormalities" per skeleton ranged from one to
41 as shown by the following frequency distribution: '• “ T 1 vv■
(A) 0 - 1 2 3 4 5 6 7 8 ; 9 10 11 12 13 14 15 16 17 41(B) 296 194 69 30 17 13 11 15 14 12 6 6 6 3 1 ; 1 4 1 1
-a.vj in (A) ss Number of abnormalities per vertebral column * inn o • 15 ~(B) sr Number of vertebral columns
If.Z-lXtr , > . ; _ w, r, - n *Usually only one "abnormality" appeared in a vertebral column, but
■, . .• , - , , .. occasionally larger segments of the backbone were involved. Anomalies
involving two centra were fairly common, but less frequent, and the1 C : • i ~ - . . : * <. k *• : t . ' 5 . . v. „ ■ i „ .* -v. *frequency of "abnormalities" affecting more than one vertebra decreased steadily as the numbers of vertebrae affected increased. Distributions of this type, in which mean values are low and frequencies decreasepro - u- <• ; - • ' ; 1. L l* . • -■< .* *• ijrapidly to the right, are known as Poisson frequency distributions. They are common in many biological phenomena, such as counts of oyster strike,
W i - < 'W *■ t ' ' * * « r p f - * ' ' , * *" * K «£ ‘ j 1 ' * *where the mean may be relatively small and large deviations to the right^ - - ‘ * V . • / - , « CT-iZ i - v . i. i >*•-. C ,4 -> - * . ' i.:- • «,
of the mean may be more probable.P k &* ""“Si? 1, ^ ^ *
As demonstrated by Ford (1933) for European herring and McHugh1.(1942) for Pacific herring, the mean for "abnormal" vertebral columns was approximately half a vertebra lower., Schmidt (1921a) and Ford and Bull
(1926) concluded that the difference was caused by fusion of two adjacent vertebrae, and suggested that this reflected a tendency for individual fish to possess fractional total numbers of vertebrae. Ford and Bull (1926) Prestored" the "normal" count by adding 0 .5 to the mean number of "abnormal" vertebrae, but it is difficult to see the merit of this adjustment. McHugh (1942) pointed out that "abnormality" was a purely subjective concept, and it is obvious that a structural modification that occurs in 56 per cent of eels
in a sample cannot be considered truly abnormal."Cl&RARV
of inn ymO^lA H^HSStESi^SORATO^L

- 1 4 - ■ j
Table 8 gives the frequency distribution of numbers of vertebrae for ’’normal11 eel skeletons and those having abnormalities in the vertebral
processes. The differences exceeded their own standard errors by factors of 3.14 in Nova Scotia (P< 0.01); 2.52 in New Hampshire (P « 0.01); and 2.03 in Virginia (P = 0.02), and therefore, were highly significant statistically. Analysis of variance gave odds of less than one in 100 that the difference between ’’normal” and "abnormal” means could occur in sampling a population where no such difference occurred. There also was no evidence that locality means were derived from a heterogeneous population. It seems clear, therefore, that although so-called ”abnormal” vertebral columns give lower
A
mean vertebral counts than ’’normal” skeletons, the discrepancy should produce no bias in mean vertebral number. Ratios of ’’normal” to "abnormal”
i . v t ' :
backbones appear to be constant, regardless of locality, hence their influence upon mean counts need not be considered in measuring latitudinal variation, as long as counts derived from such fish are made according to
-if Vi -M ,
pre-established criteria. |"-s*?
Numbers of Fin Rays | * u, K.. -j * j * i■ ■■ -.r»s r*% r- *Counts were made of dorsal, anal, caudal and total fin rays for
the first 100 specimens from each of the three localities. Where injuries or other abnormalities appeared to affect accuracy, counts were not used
* tin the calculations. Counts of caudal rays were made because this fin is continuous with the other unpaired fins, and it was difficult to recognize the distinction between the three fins. * *

toft)M(83-,■•>• cr cocmJ*„.;ul> 2 - cr. -v* o (0
he rr.» v'■ *5*&cue '3to«\
n ; : t ' : t l i i . ; - i r % »c3ft)
i v?*4 Abl. SS •\
(-') >■ T : .ic.K §■u<u£n£al estffitA ' t** <0
.M— coCiu ‘.it i'- ... i*t i- ii-. „ "
*1? Th * ' ctv r «t
H V- ■' I I A
CO
sa.,'. §
vcrte. wC.
Jteys lor
tooc
X<•0e
re
o •:
or »*. :■ v o*
yp .
3M•HH4J(0
>>O3<u3o rft)$•4
(8O0
»~)
ft)ft)Uxs
H
1UH3o
•pH•U«J•HJhft)>MMO
CO4Jsft)
Ho-HCMCMft)O
U
T3S
ft) p Oft) '■ rH— ■U • •pH ft) twft) )-e 00 OP 4J 3 r>.E to •H COO0 o > u pH25 u to 3** K 3ft! O)h pH X a kO<8 pH CD o•pH *■ •H pH pHJ-l 3 U* 3ft) 6J dX 3 UH XB <1 ’ o ft)in3 4J Oz; UH CO U pH■ ° ' d ft)pH 3 >ft) U Xu CD B t-4X H 3 3 oft) ~ " 25 U pH4J 3 Ou Hft) .> ‘ •» CO3 ODM ft) pHo ft)
■sr*
ft)5iM
ft)•pH>ft)
(3
CM/H v& o- m s tlO m <T cn i— Os
1 c • • t « •vO 00 00 o fs.S / Os Os 00 Mf S t vOCO pH CM pH CM
3ft)ft).-..2
oo
CM CM• •pH pH
pH n%CM rspH pH
CM O
VO o vO cncn vo cn i£>pH pH
CO m St oo CM tH.<t On co os S t CV• • • • » •vO m vO m VO i n
O o O O O opH pH pH pH pH pH
m st
i—• stCM pH
CM Ocn s t
m »hco vo
H Stcm cn
in r-*H
CM r>.
o v
CM CM H H
cm asCO CO
c \ i nst m
pH COco co
CO CM
vO
vo m
O CMH pH
m r-»pH CM
st mpH
: -i > t'p‘• CO
• *■
pH * " pH-
ft)eoss
ft)BdOax>< oz
ft)
oax<$
tooz
o5<c
3 •H> *H X
- -d U 3•pH O 3 . 3pH U H ‘pH3 CO 3 3O 3J •pHO 3 60
*3 > Mk O 3 •pH25 2 >
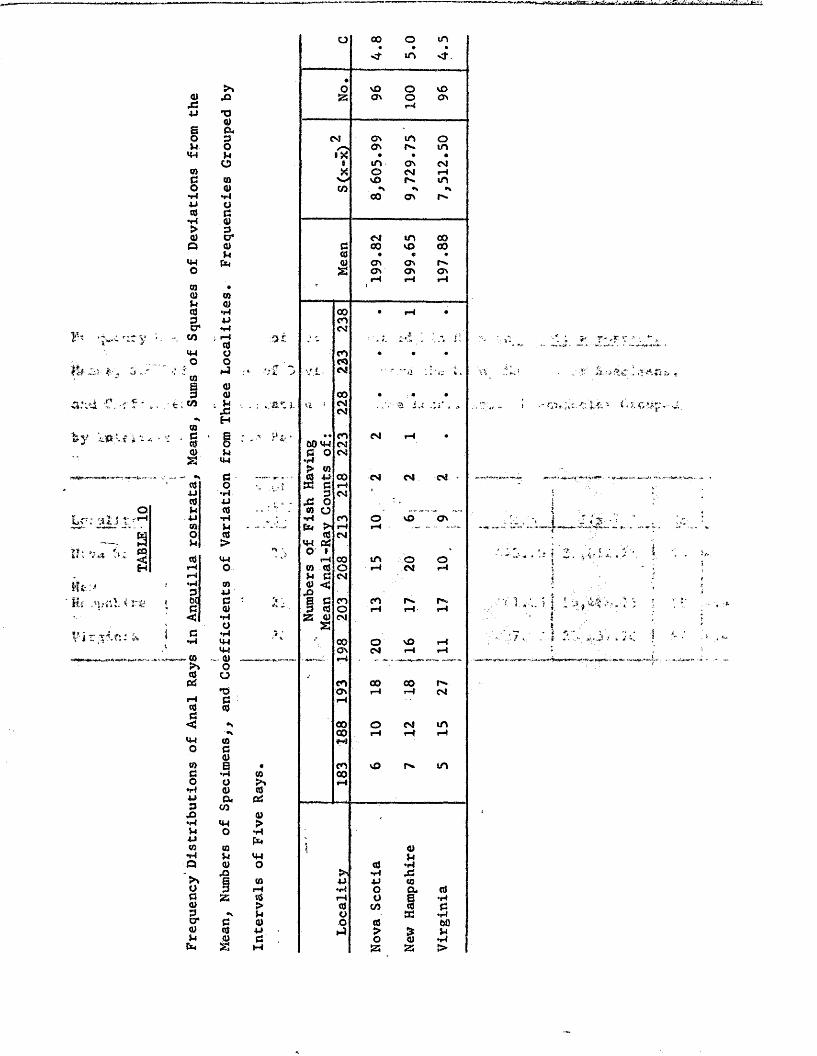
- 15 -Frequency distributions of numbers of dorsal, anal and total
(dorsal + anal + caudal) rays are presented in tables 9, 10 and 11.t
Analysis of variance gave no evidence that samples were drawn from a heterogeneous population with respect to these characters. Though some of the differences seem large, they are insignificant in relation to the great variability of individual counts. The coefficient of variation (C), which expresses variability in relative terms, was somewhat less for total counts and this was not unexpected in view of the difficulty of distinguishing dorsal and anal from caudal rays.i. ?. r ; ]
i-* | hr/ fs. r** u% 1.. • N- ' f
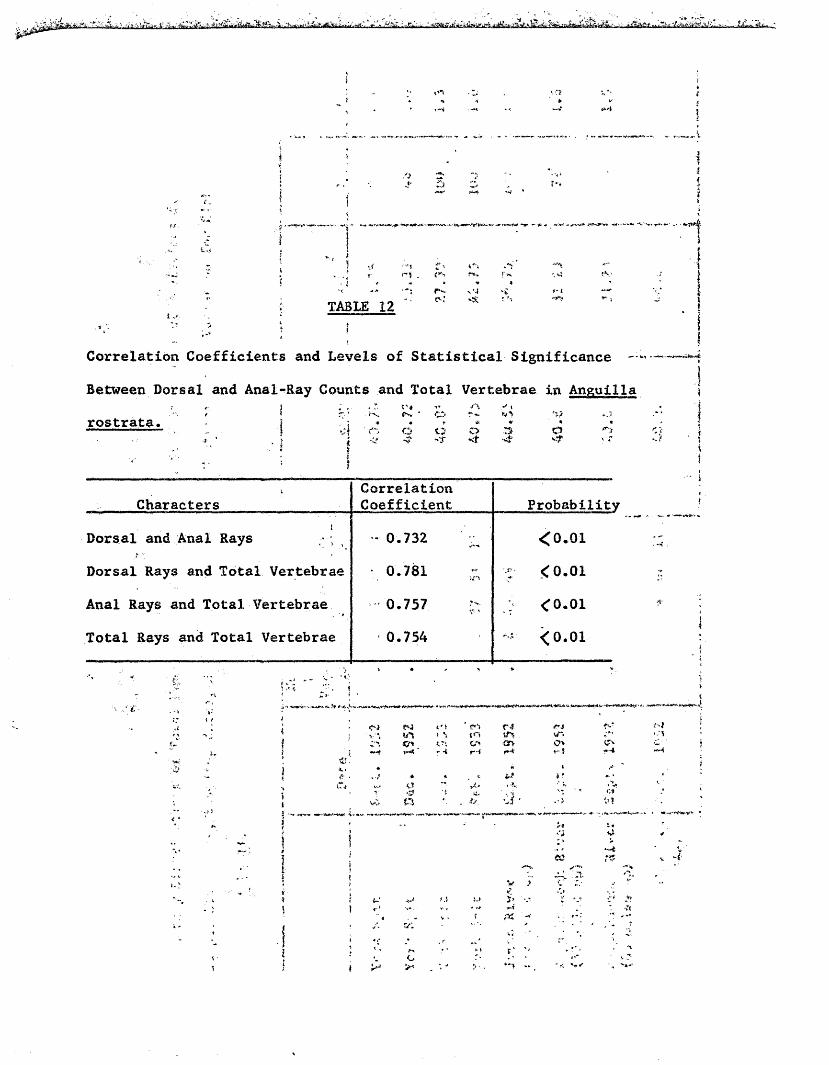
Relationship Between Numbers of Body Segments and Fin RaysCasual observation suggested that variations in numbers of dorsal
and anal fin rays were associated with variations in numbers of body segments. Correlation analysis confirmed this hypothesis (Table 12). These fins, especially the dorsal, are long and extend over most of the bodylength, hence occupy linear distances similar to those occupied by the
. ■ * • vertebral column. There appear to be two rays in each myomere, or two
v. • , . * • nrays for each vertebral centrum. Because the fins do occupy almost allavailable space, it is easy to understand, on physical grounds alone, howvariations in numbers of rays are linked With variations in numbers of body
segments. 4 . - ?v | vf •(* •" . j.! » r»*- * i'~ r' -X I" ! . > ’S r ) ■* ;
* : THE. ATLANTIC ANCHOVY — .... :s .’n' r“ 1... ■;’• . I - i ‘ iNumbers of Vertebrae T * * f_ — . . . ^ ^ j
Frequency distributions of total numbers of vertebrae in eight' f * V
samples of Anchoa mitchilli, 704 specimens in all, are given in table 13. Analysis of variance showed statistically significant heterogeneity at

Os
H
Q O r-4 CM• • - •
i n m m
X)•
O VO o3 25 a v o ONf e r-4
o p *5 OM 3 CM o m o
IM O /— r—4 r-» oIX • • •
W CO . I CO 003 3 X O cO Ho t-4 w O 00 o
•rl o CO •s *» •VJ~S 3 CO CO CO3 V r-4 i—4 r-4
■H P> c r
3 ■■—» Cx m Of t M 3 CM o o
Pn 3 • • •*M 3 CO CM oO 2 CO CO CO
• CM CM CM« m0) 0M •rt3 4JP •H ,» . . -A aO' i—1 00 CM ' ’.I CO.
CO 3 u*>O CM
*W OO r4
CO r-> r-43 0 mg 0 CMP U
CO xsH 00 4s- . T>». i n
•>1 o -CO E CMa o • »3 *440 *w O CO r-4 r-4 i—4
2 * 60 Ht i—1 r-4 r-43 3 3 CM
•n 0 •rf 4J3 *r4 > 34J •M 3 P oo Mf? O ',3 3 S3 0 co r-4 r-4U •W - u CM•M M X*CO 3 3 >o > •rl 3 CO CO CMU t*< od CO r-4 CM r-4 .
*4-4 1 CM3 O CM r-4
H O 3r-t 3 3 00 VO O 00•rl 4J M M CM »H. i—4 r-4P 3 3 O CM6( 3 tO 3 )3 •r-4 6
<S O P 3 CO CO Os oH Z 3 CM r-4 . r—4
3 *W 3 CMH *4H 203 O 00 r>. oo CM>s O r-4 r-43 CMCd •3
3t—4 3 CO m sO r-43 r-4 r-4,3 •\ CMM 3O 3
f t 3 00 r-4 CO CM
*4-1 5 .OCM -
O O 33 >»
to Q* 3 CO • H , .*■.3 CO a ; OO CM
-r-4 *W 3U O >P t-4
X 3 &y*i-4 U iU 3 *4-1 i4J X O*0 § 3
•ft P 3 Uf t 2 ! r-4 3 •H
3 r* •H XS>1 *N > U 4J 3O 3 M •r-4 O a 33 3 3 r-4 o ♦ri3 3 4J 3 CO 3 3P 2 3 a 35 •t-4cr M o 3 603 3 3 > Sc MM X So o 3 •H
5* 4J x 2 2 >
-.1
Ilf .V. U -*
« ..> i </V , «• -
&y .km.f iv
OL f : xLi t
— " a »•• ••■■* ■** gHi'U.: ’Ei .n?r.y < re {
V-i r nf.tM «* *
O 00• o♦us
! 4.
5
5n•o NO o vO<u us !3 a\ o ON
US rHU -oQ>B (X *O 3 css GN us OU O ON fs. US»w M tX • • •
O t tfV ON CMn X o CM r-4d CO vO r*. USo ft) C/3 •N •s■H •H 00 ON r-4~) Oto d0)> 3ft) cr CM US 00O ft) d 00 VO 00M d • « 9cm Cn <y a% ONo £ ON ONr-4 rH r-4CO • r !0) CON 0)0) •H 00 • rH •3 ■u cncr t-4 CMCO ; H ■;0£ •* c 1 > /. C*.t 1 ; n i 5
dCM o cn • • •o o •. ■*? ** I * • / <L h*
cn(“1 ■ ••/1 ■■ CM ."a . • ‘ i*-* % C~ CO
S <u3 <u oo • ■ • '•i «* . n
42 . : >:&*Lh H ' CMCM ■a i.,t .:r. r•s HTO
. c ‘ B s. \i » • • cn CM rH •css O (10 <44 CM0) M d O CM£ CM *i*4> Cfl~ c *'♦«•■• ■*»*- ► -" d 44 00 CM CM CM -d O , , * d r-44J •H 3 CMd 4-) . . - U3 OM d CO O - - -4J •H •H cn O vO ONTO M Cn >■r-4 rH - .. —O CSt d CMM > U-4 os! O 1 .d cm r"i oo US O orH O co d o rH CM rHH M d CM
(0 0) <3 4J ust>£ d **", 6 d cn CO K r -d ft) 3 d o rH rH «H< •H S3 d CMO £d •H ./ *•H 4-i * 00 O vO rHCM ON CM rH rH
... <y .. - „ ■ .,.____ . ■ r-4 ,__5 O<8 O JP8 c n 00 00 f*15 ON rH rH CMH d r-4o3 <8d< •» 00 o CM US*\ 00 rH rH rHcm COo da»w B • c n vO USd •H CO co0 O r*» *—i♦M ft) as<U a OS3 CO
ft)*H CM >U o t 44J Cnto CO 5, ft)
•H M <44 S4Q ft) O d •H- US t* H us>n s to 4-1 4J coO 3 rH •**4 o a. dd ss d rH o H<u > d C/3 § d3 *\ u O 3S •r4cr d ft) o d Ml<u d 44 Hi > ? S4
H o d' o ft) H&4 S3 M !Z 25
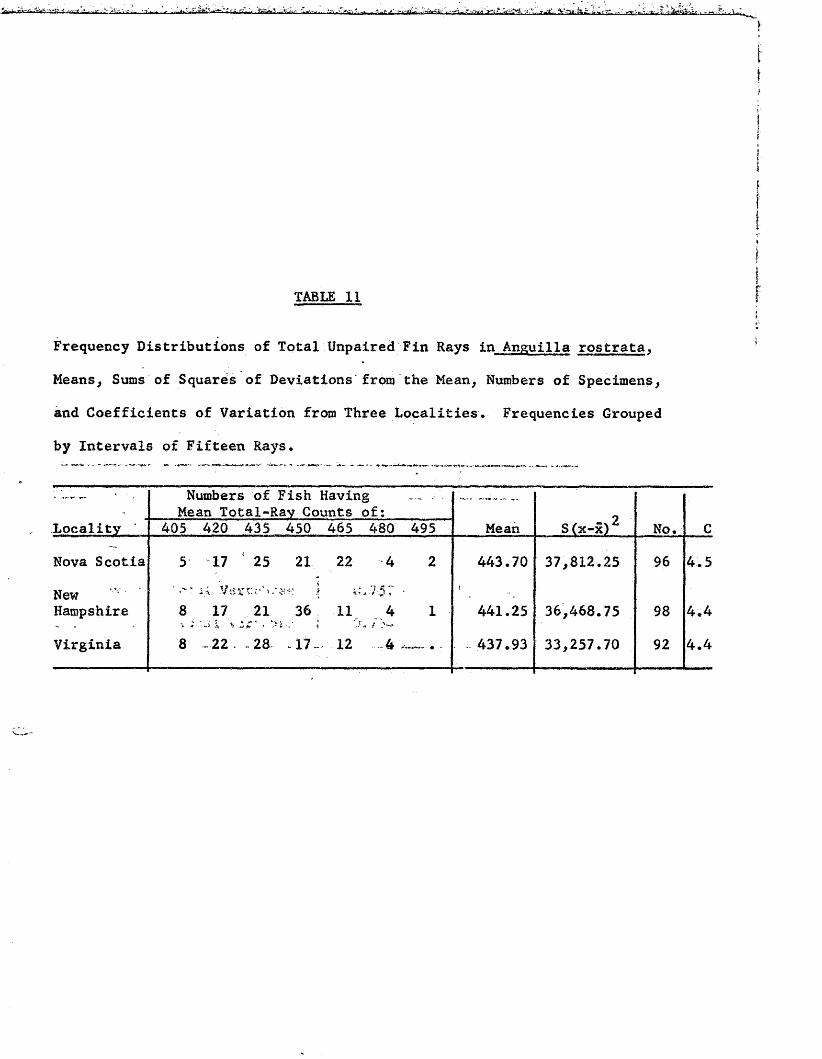
TABLE 11
Frequency Distributions of Total Unpaired Fin Rays in Anguilla rostrata. Means, Sums of Squares of Deviations from the Mean, Numbers of Specimens, and Coefficients of Variation from Three Localities. Frequencies Grouped by Intervals of Fifteen Rays.
— • - Numbers of Fish Having Mean Total-Ray Counts of:
Locality 405 420 435 450 465 480 495 Mean No. CNova Scotia 5 17 25 21 22 4 2 443.70 37,812.25 96 4.5NewHampshire
u.-'Ver 8 17 21 36
I11 4 1 441.25 36,468.75 98 4.4
Virginia 8 - 22. 28 17 .. 12 4.
437.931
33,257.70 92 4.4
i
TABLE 12
o —1'--*»* '■< ‘ 1-*
t'S'— , ft, * JV-* .*
^ . E'-'i *** '<*** 4 fV
r*. v£r-.’ >s r S -if** ;
Correlation Coefficients and Levels of Statistical Significance ~ Between Dorsal and Anal •'Ray Counts and Total Vertebrae in Anguillarostrata. • j ^
•I 1- •- I S t i
* * * * f
*. r. o# ■***. ^' r ’ o o o
•V 'T
ify \ fZ.} .T« 4 *^ o ^■4* vf
; CorrelationCharacters Coefficient Probability
Dorsal and Anal Rays - 0.732 ^ < 0 . 0 1
Dorsal Rays and Total Vertebrae • 0.781 ~ : < 0 . 0 1
Anal Rays and Total Vertebrae 0.757 •- < 0 . 0 1
Total Rays and Total Vertebrae 0.754 *
/V o • o H-*
">* - r. t v. * * o-•>. V » v*„5 ''•* ‘ ‘ . ?*-L.v ^ y *•’»* *4' ■£ 5»> f
> • *■ ■%
f} r4.V*v > *5 5>"t tnC*v t.n C/-
? «“«! t-*< " ■i ri& ■■*.» * *iT • • <■* • « *■ 4>-tT ■* a * -*j;
T .& ■ i a.a *; . -«/. ’.j
[V-%
vr.s
esj
r/*.
o
V ^v,
-*•
E *
CV-•4
.4

vi
data>£atJ3
i ,, .r ;■; O>4iwfct* ^ i - -f i « d o-r4tc •> :r > . tfto•H>-v.-viu*'.; -:g
iwoo< ; ■ i-1 a 20)<ov.V vM^c^C Jj
■&• - -p
'IZ-’Hity- cn
fy ,.V'-Ha
■€\ d ■;•. §H
jCT '.Jtfp *
©cpur Ivy <:mich&vy *1*
>escisser i- r.
0>atvo<y44}4<U>M4o
.fc' .tv "' '. .
.fc
*- v.3‘
t944OHU4OWdo*»44J,Q•*4V;4409
>Vo003cr*atwto
44O
(0
jd 60 -r4
* o(W *• <do*r444 .?'at•*4Mat - , >M4O -i .
. r
■' 't *>'"}
cvm. *:'
*•o
35oa)aC/504 OCOH<u40
010)uat•eoodi4
C/5
t r c;
<;.• £
'V :
O
vt , ?-rf, * ■ ■:._ e - </4 VO cn ov in m 00 cn o*x r-4 cn cn r*. r-. CM CM o1 • • • • • • • •X t-4 «n r- cm vO , H f—<w05 CM r-4 CM Mt- cn cn cn
a/- C.v 1: •* i .-.g i t *
: . .wv i Vs . - L.i.fits* e a ii ,• ■ C'r«*.r •d GO CM i-4 in in H oat r- >- CO m 00 vO 00<u • ♦ • • • ■« • •o O o o o o o o<r 4± <t Mf
13
(44OCO44*"4 Gat 344 O
o o H60 tdd u*r4 .O> <0 at 4J 33 u <u >
4fr-4
cn vo »r» vO in
oo vO O4t O(4oo ooH
CMf'*. vO00■■..-.(
oo
*.«** i-ied *4v,:o ;v*) i.y *
cm m cm
mr-4 o CMr* ■<*’) rH cn CMCM r4 CMr4 H r4
x...... - t-* a,. V / . 'Mt1 vj 4, - H r-l
49 * 48 62
45 18 32 CMCM. y.art04*;!-iisr4 .■;uii4N
V ,-i *,. vc *’ ^ l» i* :s •• I n ’ *f Ktm'
CM CM cn cn CM CM «CM
m m m m in in ina^ Ov ov ov ov ov ov OVr-4 i-4 t-4 t-4 r-4 i-4 r-4 t-4
<u4-J • • • • -at 44 '« • • ■44 44 44 •O a a d rO . a P* a, > 44
a) at d atS-
- ' CL) a* OCO a •n to CO co O
•> ■ "V - t4 u U4«1 • CD at O0) -r4 > > • /4•i4 • t-4 -i4 . . 4-i T) Pn44 - r-4 " V . ' . Kx . X ” ai ■ - oi at att4 •H a) cqr-4 .£ a M O. 4d Or ffid O »4 d o d O d vyo 44 \ — (U o Oo »r-l 44 44 44 44 > w d 03 d to 44E -r-4 *H •H *t4 •r4 CL) d at d a) dOr Pu Or a. Pd t-4 at r-4 Ol r-4 •Ha> at CO CO CO CO •r4 43 t4 JG -»4 Or-4 O m B at S at B (U(X JG rM -Id rid M 0) a. Or& o M t4 U u B CM Pu O a. o rid3 c o o Q O 3 t-4 at m at oo r-4co < . p* >* *“) V/ OS Pd
- 16 - - * - -r —
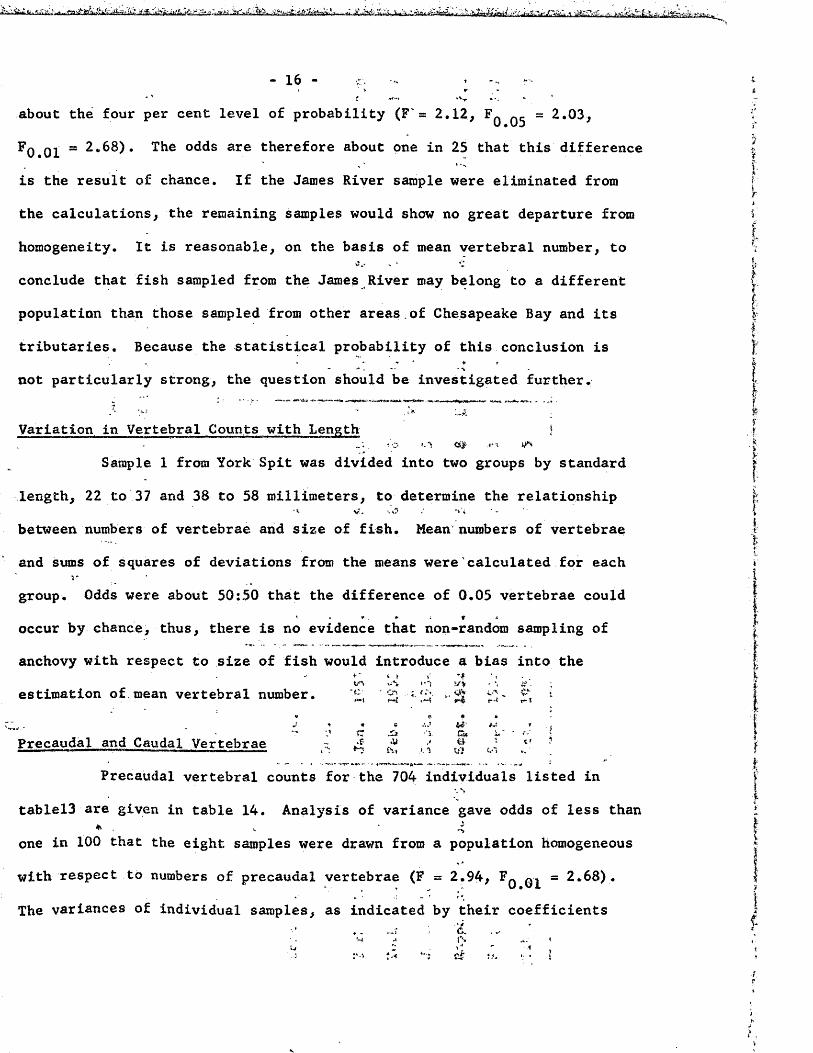
about the four per cent level of probability (F = 2 .12v F^ = 2.03,
F0.0i = 2.68). The odds are therefore about one in 25 that this difference is the result of chance. If the Jaimes River sample were eliminated from the calculations, the remaining samples would show no great departure from homogeneity. It is reasonable, on the basis of mean vertebral number, to conclude that fish sampled from the James River may belong to a different population than those sampled from other areas.of Chesapeake Bay and its tributaries. Because the statistical probability of this conclusion is
< - + r
not particularly strong, the question should be investigated further.
Variation in Vertebral Counts with Length f■el v**
Sample 1 from York Spit was divided into two groups by standard length, 22 to 37 and 38 to 58 millimeters, to determine the relationship
<*• v. •.tf ; Vibetween numbers of vertebrae and size of fish. Mean numbers of vertebrae and sums of squares of deviations from the means were calculated for each group. Odds were about 50:50 that the difference of 0.05 vertebrae could occur by chance, thus, there is no evidence that non-random sampling of anchovy with respect to size of fish would introduce a bias into the estimation of mean vertebral number.
t ■ * if t’ ’ ,S f S a'-
"C ' ... Oft*4 £*•r - •<'
• .* * c Aj tI i
‘"k «s* • h
yC'lt K *5 Hi t / l
— «... .... ...
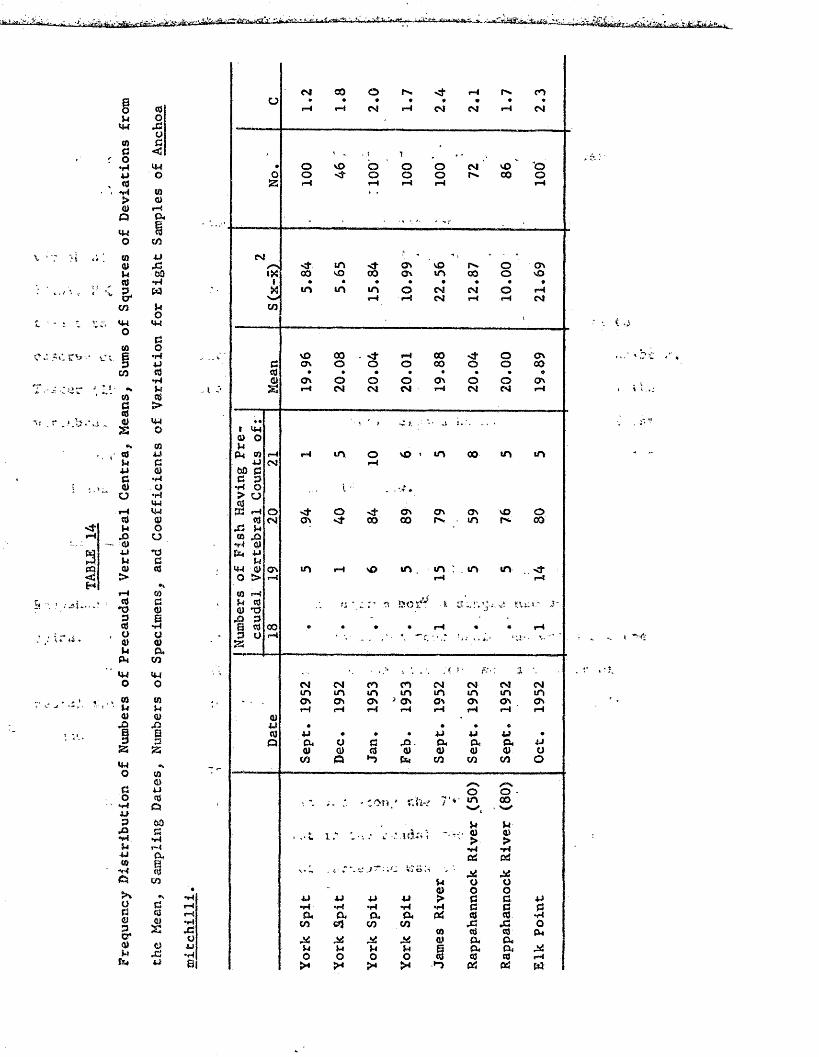
Precaudal and Caudal Vertebrae
Precaudal vertebral counts for the 704 individuals listed in tablel3 are given in table 14. Analysis of variance gave odds of less than one in 10 0 that the eight samples were drawn from a population homogeneous with respect to numbers of precaudal vertebrae (F = 2.94, Fq = 2.68).The variances of individual samples, as indicated by their coefficients
-’ykset Z&^-XiMi .-,£%.7.
>{
v •- •‘■i-
■: : ir i
uMMCOdO
>a;acwoCO©u©&Cft
IHO
CO.' .,:> r* J * i ■ •»' ’ *" CO
a©i ;}.■ i O" — £
<0kMc©o©kJ3<U4JMa>•§3O©kp-<iwoosk©JQ
twOao•hjjpXSCO
>%oG©3O*©kfc*
C$1OXHOS5!CMoCO©rHa,
cnuXS00•MtakO
CM
Go«HU©*Hkc$
cnCMO83k©
X3epS3(0©•U©©OOs•M
cn
§1©X3M
I
CM© t c n
© O83 k<U P-« WG ■U© 00 G•r! C PO • H O♦r4 > VCM ©» M 33 H© ©O X i k
o » -Q•M ©
-d Em ma k© C M ©
O t>m © rMG k ©© © TJ
5X I P B ©
U P ©©rs. a
x:o4-5•t-48
o
• o NO o1o o
No orH <s- ©rH or*i orH
cm
(*SV-fcn
cm
ON
oo
CM 00 o rv rH r>. CO• • • • • • • #H r-4 CM rH CM CM rH CM
CMr. NOoo oo
Mf in ON NO rs. © ON00 NO 00 ON in CO © NO• • « • • • « •CO cn m O CM CM © rHH tH CM «H H\
CM
NO 00 Mf rH 00 o ONON o o O CO o o 00• • • • »■ • © «ON o o o ON © © ONrH CM CM CM iH CM CM rH
• ' » ■■Cl, -■ '•■ -l i.
iH m o NO i «n CO m mrH
- -<t © ON ON ON NO oON Mt CO © rv m IH. oo
cn rH NO m . m : m «n .rH rH
n \ :ac?*v< I s ** ' * ,3 “ i'• • • • rH « • t—4
- - ' . •.. • ji k . 4. ■ *■> Y- , 'r"
.CM CM © © CM CM CM CMin m m m m in m mON ON ON 3 ON ON ON ON OnrH rH rH rH rH rH rH r-4• • • e
M • • • M 4J M •CU o G r© a Or CU M© © © © © © © O
cn a *”3 cn cn cn o
n /TVO O .- -: on/ r.h^ inN ( CO. NH
k kL i ? • \ c -*■ 4 > -•» ©> ©>•t-4 •H
CS Cd. i- r*- - C V7SN
u o O© o O■M 4J M M > d d M•rl •H •H •rl •rl d d da, a a a od © © •rlw. & i cn cn jd .d o© © © tk
M ,« © a c«k u M M S Or CM 5O o O O © © © rH>< P* >* >4 © 03 ed w
t -i
. .. > -*4t

of variation (C), also were heterogeneous (chi square = 72.16; P< 0.01),and it was interesting that the sample with lowest means (James River and
'• - * IElk Point) also had the largest variances. ‘ jThere was some indication also of. heterogeneity in caudal
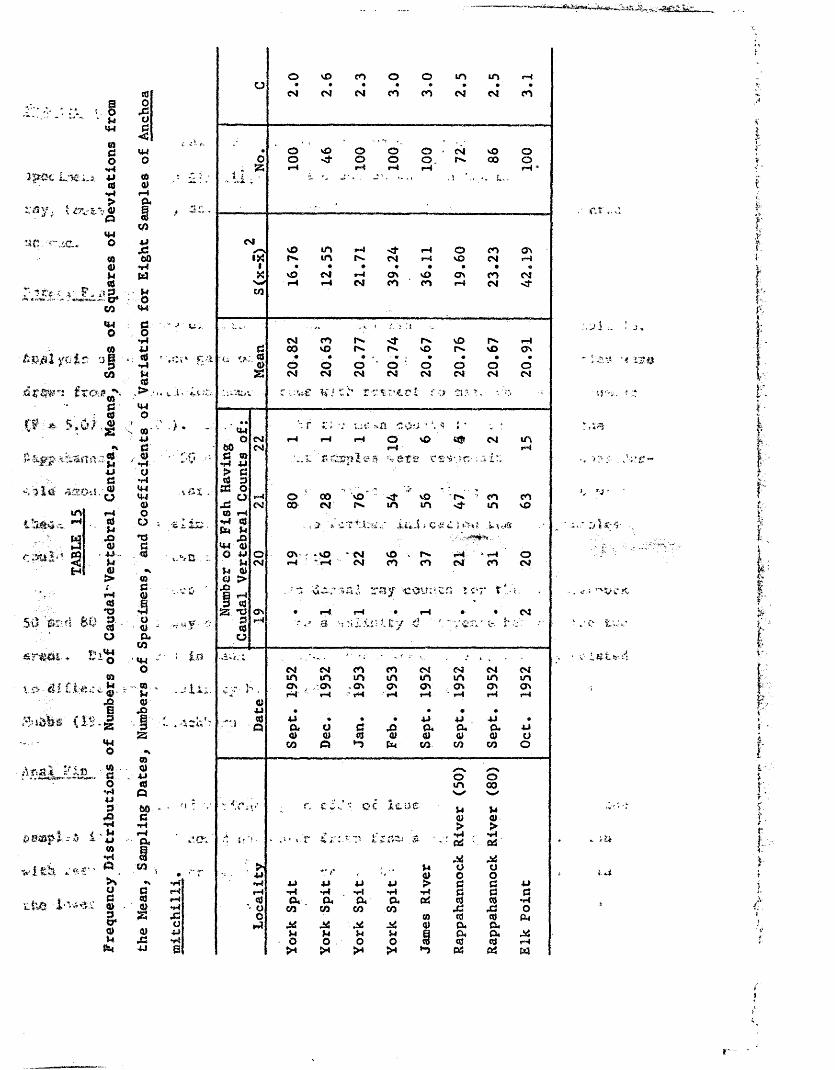
i*vertebral counts (F = 2.33, Fq = 2.03) and in their variances (chi square32.39; P <0.01). Counts of caudal vertebrae (Table 15) were more variable
*than total counts, and this may have been caused partially by failure toobserve consistent criteria for separation of the two regions of the backbone,
I ‘ r V .• *
Tester (1937) found that the best method of separating the two parts of thei i i
vertebral column was to recognize the first closed haemal arch as the firsti '
caudal vertebra. This was not easy in this study because the lateral bridge' ' " Tcould not always be seen clearly in side view.
; © co. ^ fJo-*. to CM ?*»• ir» ir, * *• tft j;
' t ' *Structural Variations f ■ « *} & *
In the four samples from York Spit, the James River and’■ ; !Rappahannock River 80 samples, each centrum bore a single neural arch and
spine. The Rappahannock 50 samples contained four skeletons which had one extra neural and haemal spine each, and one skeleton lacked a pair of
, ,*s» to - , * 'neural spines. One skeleton in the Elk Point sample bore an extra pairof neural spines, -■? 1 i * } ’**c.;'- . c* ft x , a % :3* 4 ,t ..1 .• } ,
Aside from these variations in neural and haemal spines no structural abnormalities were observed among the 704 Anchoa.skeletons.Two individuals had a slight twist in the caudal section of the vertebral
icolumn, but the number and size of vertebrae was not affected. ]
i'AY. totsfi. •XL*
* h <h01Go•H43TO•h> -v a a
o
■ -'T?
m <o u to
. . *-r*\ M’rrtwi *•£,.* ■ .* %0CO
(MOw"£»#! yfiis 'j|
CO
frcw* .G
.C*?> 5,0>.|•V£& .s. sdiing\
43c*x6tl.‘g
©
aatu40at43-uat>rat*oH fee g -O
w l oe»u
i b.s' {IS Jmo
&«L£42-.lo*H4J3XI
oumpl- * i
v.iek *■«€••'
. (4 43(0
Snagg.atM
ft*
<0
tt4U-!OCOatr Ha§co4Jifl00•H«
8<w
g*H4Jat•H$3at
,>..IWO<043da)
<44M3atooM3G. at(0G
IoatCuco
»woCOwat
jo
COat*jatQ00Gcu§w
«N§*at
4343
. „i - ».v;t-
/
\C:
r S
. M V"
.Jus
: i *.'
ifloB
o vO cn © o »n m rHO • • • • • « • •
CM CM CM CO cn CM CM CO
• O vO © o o * CM © oo o <J- © © o. r->. CO o
S5 ?—4 rH rH rH rH *i £ - . • ■ ■ *' '* , L ..
CM/* , vO i n rH rH o cn ©
r^. t n r ^ CM rH © CM rHI • • • • • • • «X vO CM •H o s © Os cn CM
w rH rH CM cn CO rH CMCO
,., i,,-CM co r** <r rN. © n . iHG 00 vO n* n* © © ©
-ii *j~ at « • • «- • • • •a t o © o * o © O o ©
S CM CM CM CM CM CM CM CM
'..-■XU' C i'. : \se K : w »”* rV.%Z'1LCl f
• : CM r ; 1 L- f 0'-> ’ ’« i * - 'O CM rH rH rH o © ttjf CM ©
00 CM rH rHG at•H 43
>5j. 'i .. f S' cS'S-.fr.- : -j it> GTO 3
03 O -> ■ '* H ;r - - *_ O t“ C © 00 vO © ; CO cn
43 CM CO CM r^. i n m © ©CO H
•H to|X4 M . '* c - r t s : .1 ; C AU-i#
43<X4 atO 43 O OS > *vO * CM © . n» »H ■■ » rH ©
f»i CM rH ■ * rH CM cn CO CM co CMvj at& >X 6 ■»-* . ' *: 4 4 '. r -■j.r*. * r a y n o u ; * t n t c ' 7- f 1, '3 TO
25 *Q o s • rH. rH - • rH • • CM■ ■ S
TOT . 3 •T X rl ' 1“ t •
O
' r?CM CM <n CO CM CM CM CMiO i n m m i n i n © ©OS ; OS . Os o s a s a s © ©v •" rH rH rH rH rH rH rH rH
at4J • • • •at • • • 43 43 43 •-i Q a o c rO Or 04 a 43
at at at at at at at Ot o © *n PH CO CO CO o
<r-N© ©m ©
• * '.r. v ' r , C «■ " o c it iJC- V4 0at at> >
-i - •*' > «•—, *•' r >' , *H . •H' » 4 * . * * , r > i. ’ ■ iV' - cd ■ 04
44 445* , O Ou • f ' 1 ‘ at O O*r4 *> 43 43 > G G 43r~4 ' r l %r4 •H H H G G Cat a. cu a a 04 TO TO •HO CO CO CO CO 43 43 OO to TO TO PUX 44 44 at a 04u J-4 M U i 04 04 Xo o O o TO TO TO rH
>* >4 >4 ♦n 04 04 oa
nr,.,:
.j.’ . * j.it *<
;SO|. _ f *
t *3 *
tf.i ’'VI '•
m
i.*4
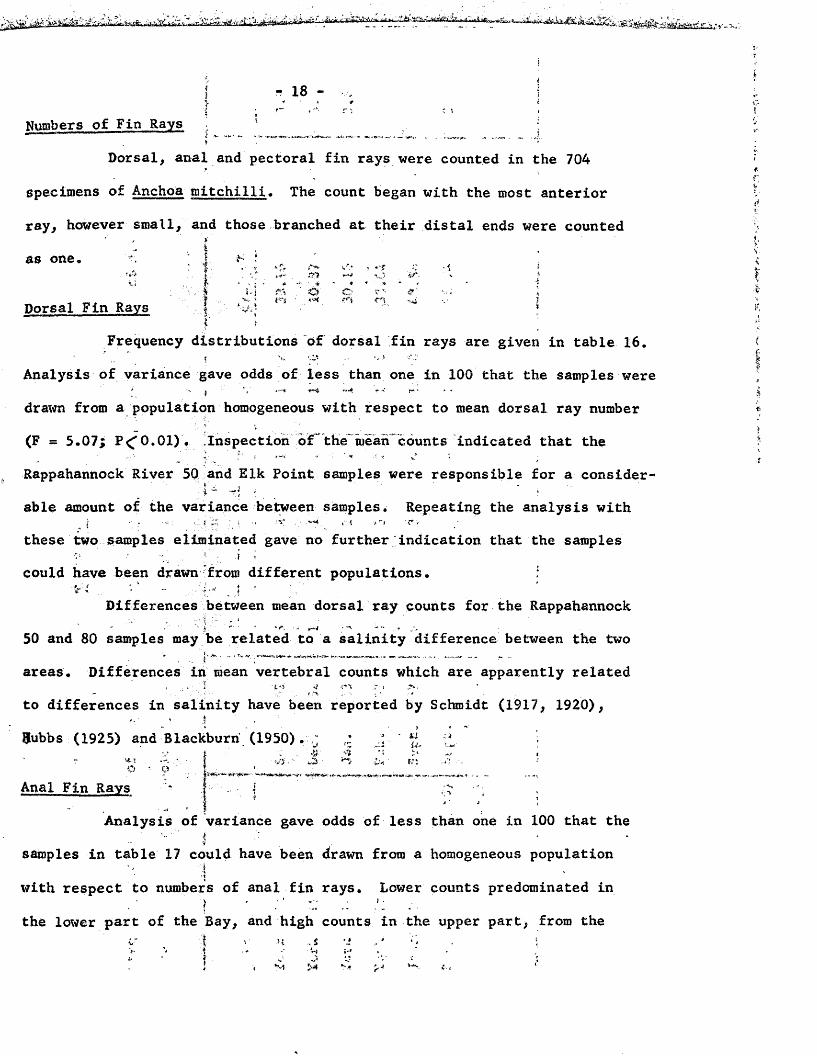
Numbers of Fin Rays ,
Dorsal, anal and pectoral fin rays were counted in the 704
specimens of Anchoa mitchilli. The count began with the most anteriorray, however small, and those branched at their distal ends were counted*
• ! ias one, I h '‘ I «• v vf. W - .*? -i ‘- ‘*'i , i ■ . \ * w tit*. ' > |
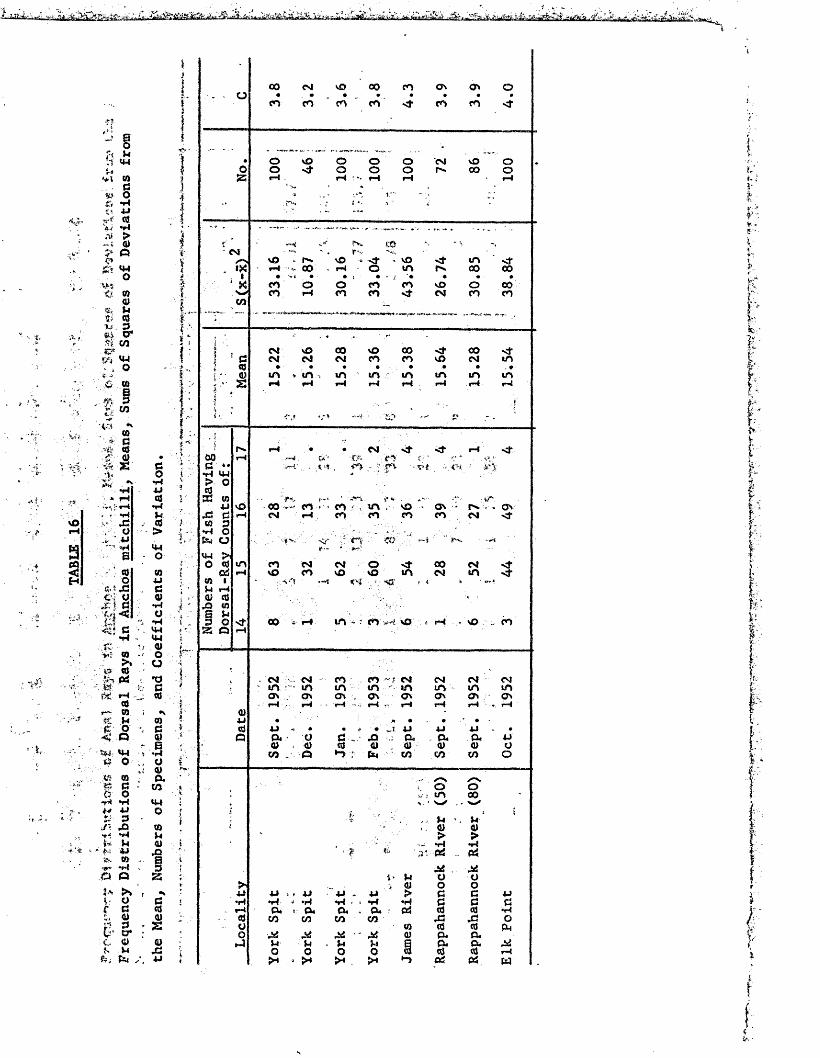
: }••! « O' C*' t* i. S . V, i frj - rt( »*n ^ --U ’ ’ 1Dorsal Fin Rays | Vi) - »i v
Frequency distributions of dorsal fin rays are given in table 16, Analysis of variance gave odds of less than one in 100 that the samples were drawn from a population homogeneous with respect to mean dorsal ray number (F as 5.07; P^O.Ol) , Inspection of"the~mean counts indicated that the Rappahannock River 50 and Elk Point samples were responsible for a consider-
■ i - iable amount of the variance between samples. Repeating the analysis with
i ■■ *■ i 7- i- •• 4" ■? '■» '■» '■Tv
these two samples eliminated gave no further indication that the samples *• ; i •
could have been drawn from different populations. :Differences between mean dorsal ray counts for the Rappahannock
50 and 80 samples may be related to a salinity difference between the twoareas. Differences in mean vertebral counts which are apparently related
, ’i-i v ’C*'s :?■ i ,?*.
to differences in salinity have been reported by Schmidt (1917, 1920),ijubbs (1925) and Blackburn (1950) . j ^ yv
'*•» ■ I S.- r-;; .5' ••0 ■ O ' :L *
Anal Fin Rays •> I | .;'c1 ? - ,• ; -
- •. -*Analysis of variance gave odds of less than one in 100 that the
Isamples in table 17 could have been drawn from a homogeneous population■ iwith respect to numbers of anal fin rays. Lower counts predominated in
I ' ::the lower part of the Bay, and high counts in the upper part, from the
sOr la9
§u
>4HI•+\ (0GOit •rJK> 44«4'i/ •rlA* >*-; &4*p» OJS5:y*
IWOis W<USi5.5 Gr.» 3&> cr■*».
■ £* co■SO <M«■ .i. 0to
§V,*-••■COrtoGto<y •
X. c1 0.»*4 •\•rl
1-t•u■-■ * r l to
'.■‘*4>J H •rl•rl u
S'. ■-JCS -f COO ■■■■■" >..(•' u
•rl tMB O. •_- ’RJ toO 44£-;X . G■ c: OX 1 d •rl< OW J’, *rl
C . mT-l M-4
.-.<i !./ a»:*»r to - 0
>> O-. ' V CO: $h 05 t J■*. M t; g
Hto to«
. | *• * T
['! :■■i •> ' .'-; v ■■»
r
i■
-.-■£■ 0 g J ... B
>.'r... Ml * •rl ■*■• '
*3 Q , O ii. (U ■ r»->.,' Cr » . (X•f* _ ■ r- g • to .* '•■O' 0 '. •>fl •rl Ml *
’>- * 44 O t&• 3/• JQ to•rl •rli' • J- Jl <u }44 '• - \ ■SF-- to • i•rl > 5 {a « £5t-s >» r •» ti-t
OG Gto i
£>■O3 .cr :
<us ~ ■■'• <.. 0 a)u u xs >44 V1
00 CM vO co CO os OS 0• . • • • • • • • •CO CO CO CO It to co If
...• 0 sO 0 0 0 'CM sO ....
0O 0 0 0 0 n» CO 0ss rl rl rl rl rl‘ %*- ', 1.
1”'V
.... - •--. !*v. CO -»CM 'r-s r-vO r r>. vO . VO m <rIX rl '* ’ > 00 rl O in CO 00t • •v< • • ; • '• • * •>4 CO O O CO CO vO 0 coCO rl CO co <fr CM co toCO • r rti» 11&1 . ;
?1 CM s£>' •
00 vO CO 'd' CO{ c CM CM CM CO CO sO CM m» to r • • • • • • .Q> to > m m m m in m inj S rl rl rl rl rl rl rl rl
'■'4 -r ' if.f
: i r>. rl • • CM If <r rl <1*00 H Ca * •cr* C' ’ <* -c • • t.-l <0 $n V* C-1 ■a">•rl IW 1 • -f> Otg* (0 ■ -•*'■■1.1vO 00 to •' <CO / tm •SO ...V os 1 r>. .■ ■»Osxs d rl CM rl CO CO CO CO CM Ifto 3•H O ’• _..ix. O tv. ■if’- w +w ■' “ r. -*<.**— * '-abrr'M-l >O tO to CO CM CM 0 If CO CM <tod rl vp CO vO vo m CM m Ifto 1 A-'! •4 K'l r 4 * J»v*Hto to ■x> toU§ O •Cf 00 rl m ■«**vi-4 vO f rl .sO ■ CO25 Q r—i
- CM CM CO CO CM CM CM CM' »o m in in in m in mos cts os . crs ov os os OS.-•' rl rl •rl '■•••■rl rl rl rl ■■ •*.rl--'<04-1 • A • • •tO 4J • • «* • • 4J 4-1 44 •O Cu O c. Xs a, Qu a. 4JQ> » Q) to 0 <u <u a) OCO O *-> ;■ ■f*4 CO CO CO O
n> ^sO 0Jin 00 ■\ *\y .• £- U Jl i
, . O O> >■ •iw •rl •wIS ;iV 05 . 05
-M .. J!d■i‘ u O O> J <u O O4-t 41 i , •M 4J - 44 > d d 44•rl •rl .-•rl •rl . >•rl •rl d d drl a* 1.a. a* . a. od d RJ •Hto CO CO CO CO XJ X2 OO to R3 RJ PiO •Jd <y a« a.Jl u u u § a (X M0 0 0 0 3 d RJ rl>* •0 «? 05 W
cif,
■ y» *
-*!
eV\> *3.
.'8Vi- fc\*6 ;i
H
«* V/t ’ , »,1
45X•u
><y
U4o<u
<93O *CO< WO
«6305
WCoj©X
Xo44•«48tsjjOfx|ofd |< 1
r i dw
\ 'i l >•'
r ■ s. v-
&
< <# ss <« 4O
®■’ S3 O •H 44
- 3 X •X >>4 ■ 44m
Pso34>§■©f-ife«
co**4•M©•H54Cf>U-i©
m44C©•t4O*H<W<44©Oo
•X5S3<3
cas©a«HO45SX05
<44©©5445X
a<945X
u
CM
I
* w05
014JS330 O
? N
s1
r-4CtJS3<
© cS3 •*ft U4> O
33X 10 •p4SX<44o
<0f40)X5323
cn< r
C N !
<rco Ps » * •
< t v f < f
P s
N ?
o<r
oo
oorH
vOsf o o oo o o CMp »
M >oo oo
P scnvfrp *•f " sUN
a\CMos<fr cnP»
vo
UNvO
UNCM•COCMr H
CT*os
OSO S
o oco oo
p .CMp sCM
cnpsC M
MIPS.•Pv
CM
r>sp*.P sCM
ooPs
P'SCM
cncnooCM
oosP sCM
O S05P sCM
s • cm cn H CM • CM
rH • sO 00 00 rH 00 OrH rH: v 4. pr'-c I r t‘ ■* r U ..r- c n ? i
cn 0© CO rH 00 rH Os CMH rH rH rH CM rH CMi h - . U IP (, ‘ ‘j fir ,• ...
rH rH OO OS cn CM CM vOcn rH cm cn cn CM CM cn
rH Ps. rH CN Ps sCf- O socn rH cn cm CM rH cn rH
vO ps <r cn 00 ' rH ps rHrH rH rH rH
ps. cn rH CM ’st’ rH rH
t» ..... rrH .« «H . »H • - - -* cm"
CM CM cn cn CM CM CM CMUN UN UN UN UN UN UN UNOS OS os os OS os OS OSrH rH rH rH *H rH rH iH• _ ' “* ' I • ' « « i;
■U • • ■ • J 4J 44 u •a a S3 X a a sx 4445 45 <9 45 . <y 6) 45 aCO S3 •n p*4 CO CO CO o
/N P"Vr' » o O *■UN 00\4 w
• > 4 • p 6 .. j Is £ i 1 54 544) 45> >t f ■;U-rirr tSs*. . H03 *r403
X X54 O O4) o oa u 40 4J > S3 S3 44*r4 •H •H H •H S3 S3 S3CX a P< SX el 45 <6 •r4CO CO CO CO X .X O0) (9 «S SXX x X X 0) (X aS4 54 54 M @ cx sx Xo 0 O O cO «9 cd H
>* >• iH >4 e! stf Sd
i r t ... „,l. r, T - I t . '
r,«*Ss: ,m&
.i-wzJ rn*>
rt at
u, yerfcr-fci *1l: -ifrvl.. ions %j. .
•• ’.*? | y ,
4*oT <c>Vi V<:T/.^ntcL;
v.-hvia

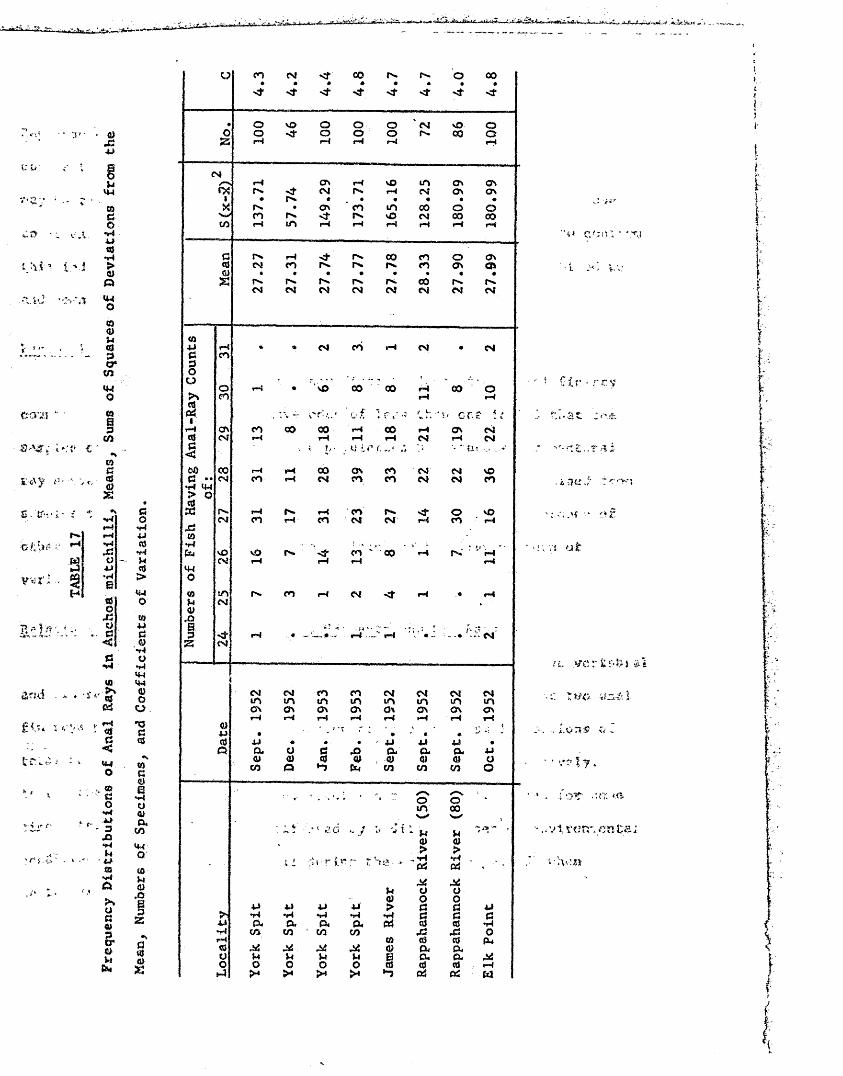
Rappahannock River to Elk Point. As with dorsal fin-ray counts, anal-ray :ounts for the Rappahannock River 50 and 80 samples differ in a manner that say be related to a salinity difference. A series of samples would have o be examined from each area of the Rappahannock River in order to confirm his indication, especially in view of the reverse variation exhibited up ad down Chesapeake Bay. 1,
sctoral Fin RaysTable 18 gives the frequency distributions of pectoral fin-ray
unts. Analysis of variance gave odds of less than one in 100 that the raples could have been drawn from a population homogeneous for pectoral y number (F » 5.64; P < 0.01). The two extreme values were obtained fromnples collected off the mouth of the York River, and in the absence ofler evidence it is not possible to explain the peculiar pattern of “iation.
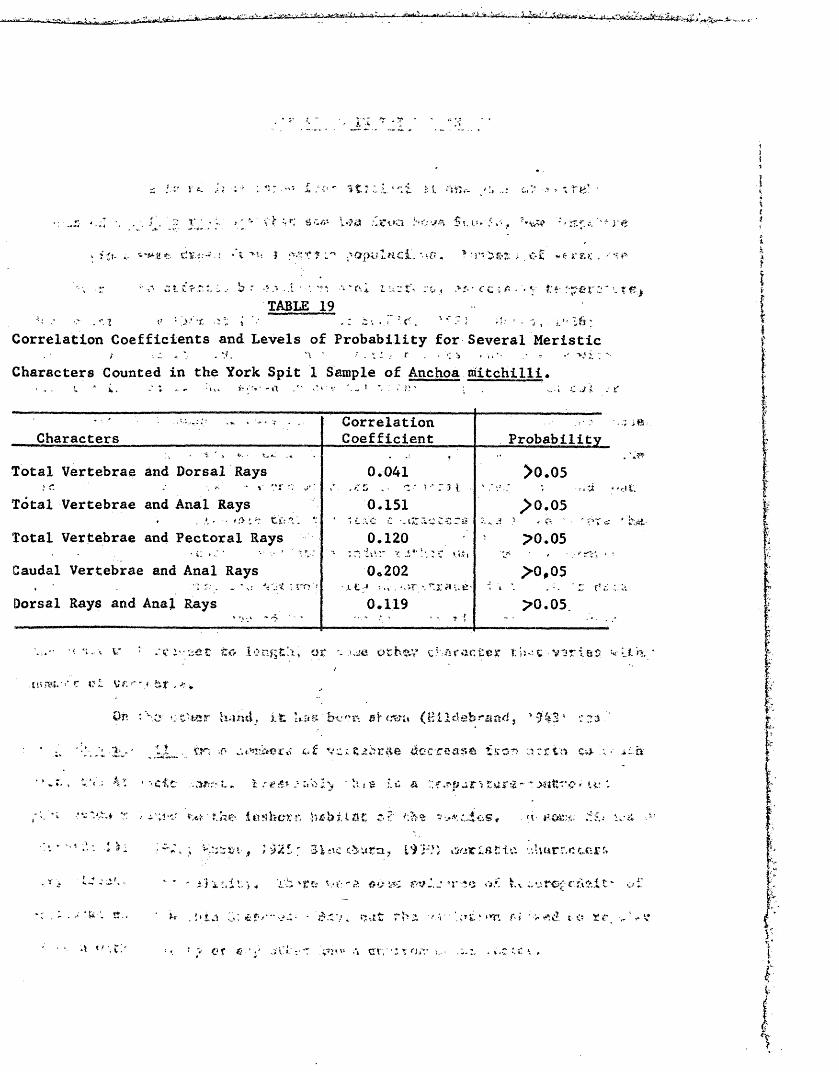
ationshlp Between Numbers of Body Segments and Fin RaysThere was no apparent correlation in the anchovy between vertebral
fin-ray counts (Table 19) • Usually there were two dorsal and two analrays per myomere, but the fins occupied relatively small portions ofil body length, only about eight and fourteen centra, respectively. xi other clupeoid fishes (Gwyn, 1940) fin rays are not formed for some after hatching, hence are affected by a different set of environmental itions than those that prevail during the embryonic period, when »br®l number is determined. * j

Frequency
Distributions
of Pectoral Ray
s in
Anchoa roltchilli, M
eans,
Suras
of Squares
and Deviations from
£o•H4.1cC*HJ4><4-1o«uC03v)O«H03Ouc0}tosao03aw
IMO<n(U•8;§G<Uss01xs
00 MS' ON vO ON «n V0a • • • « • • • •
(A i n Hi- i n Mf un i n
e O VO o © O CM 10 Oo O <fr o o O 00 o
S3 rH rH rH rH rH
CM✓”S cn m rH Hf rH cnIX on cn in . ON CM rH CM
1 • • • ® • • • •X 00 CM
3cn 00 i n ON
rH cn cn CM c n CMCO
?
/CM vO i n cn
y - .
Hf IN<-
rH < rc lA in. vO O CN. vO IN. CO<a • • • • • • • •<u rH rH rH CM rH rH rH i—f
s rH rH rH rH rH rH rH rH
DOCO i n «n " cn cn n ' ~Mf
*" W ‘ 'C O• « rH CM
£ <w i *.. ; is>•H O * ■*.
> t I(0 i
« uG CM fN m rH 00 vO CM Mf CO
x ; 3 <H H t CM VO i n vO Mf Mf V0m O (
*H u it» 1 N r% 1-V s
.► 1U4 (9 !o Ptf ♦H cn vO Hi- , CO IN. Mt Mt
I rH Mi rH on rH CM CM cn CM(ft r-t »14 G |113 U , # < * |
X3 o v *" ■* . j fb 44 ! *o U © en « CM r*4 CM __CM , rH •
S3 03 ft ~ ' ~ 'V' '
A
CM CM cn cn CM CM CM CMun i n m n i n m n i non ON On ON ON ON ON ONft rH rH rH rH rH rH rH
0344 • • • *(tf 44 • • • 44 44 44 •O a o £ 43 A a A 44
03 03 0J 03 03 03 03 C3co a *n A CO CO CO O
/% rHo On ooV4
U *40) 03 i
>H Hfi4 CtS44 44
> W O a44 03 O o•H 44 44 44 44 > £ £ 44rH •rl •H •H H •H a £ £«d a . a a Or C4 (S3 « HO CO CO co CO 43 r£ Oo (ft cd £ A
r-J X4 M X4 44 03 A AKi u u E a A 44o o o O «d (d rH I
s* >< >» Jx ►-> A 04 w 1
0.‘i
- !i- r e. .u : -«• i n - .:i. >n i - L ..j t.;’ Tt>%- •
■: 4 - . j ", . '. i , T ' i ' ’’ ' I" is ;**V- * r- ’••-J - * 'O V A $ M* 5 »• ^ '* v<’ i? ; ' ft
v ?Ut- i- e *\ 'n, 1 jw;? ? i'' /’Orpulnci. '• if«“. *■ -. r ztifzi.is hr .?.%..*•■•.'?* -i*n; n c ^ ;g, '»y ?;*■ r-per:***- ?e>
TABLE 19'•; -• ■' . i t* : >-*'x ->*; i '•• . : i>. ..< ?r . ' ** ~ < ih- • , <.?« 16':.
Correlation Coefficients and Levels of Probability for Several Meristic/ ».-* . . 'J. ' .f . * : > r . - .• •» ■- x u ; v
Characters Counted in the York Spit 1 Sample of Anchoa ciitchilli.l * .i. : * — :u . - a / • .*.»•* tv ; ' ,/A . r
CharactersCorrelationCoefficient Probability• "t- ' > ••
Total Vertebrae and Dorsal Rays> J* * .o'- * »-V -v ,* ■ 0*041 >0.05Total Vertebrae and Anal Rays 0.151 >0.05* . -.-<«> i*» ti: *- * L. X C C ■.. c. -0 :•. „ ji • . yi - • - f<?Total Vertebrae and Pectoral Rays 0.120 >0.05Caudal Vertebrae and Anal Rays 0o202 >0,05. - . s.-. ~ ;ro -* ■ j. c. > ; >4 . •-••r ,';r ;..e- J. i *. 'Z fUvDorsal Rays and Anal Rays 0.119 >0.05.* ’.4 . - * . *
.‘c jyijet to iongtlii or .viie athev c- a meter -vsrias vUh./
\& *.■ t'rtar hah'd, it Las* be**. sJ* (Hildebrand« -943 s errs ''
..'kL~ *.*£ vc.; titbr&e decrease fxon nrri'n c** >, •• -ith•••etc .-.anr?? t. i /■ ** .■?* »i v> I % ’hi* ir a ?.? ,*p.±T'->Ztig$~ ~ Mttve, ur ;
• f.he in??horn •habitat rr i&e *-•.«•* * 4 . ‘t ror.'f.. .ii.* ..-cv, ', f ) 92!. r 3-liicxbutta, 19K*} .oiciatic •.;Utirr.ct.ert»
' ’ * iivr.iv.} ‘rb -%re vr-as evir n’ o .vi* tv orc - c.riM t' oi’ '** ; *>*.a o'. - 'd.X7\ rj.it rba -'.-v ■ f»n /•-* •’> t-<?•■sr, ^ ^ %
- 20 -
COMPARISON OF MERISTIC VARIATION IN THE EEL AND ANCHOVYNumber of Vertebrae 'V?
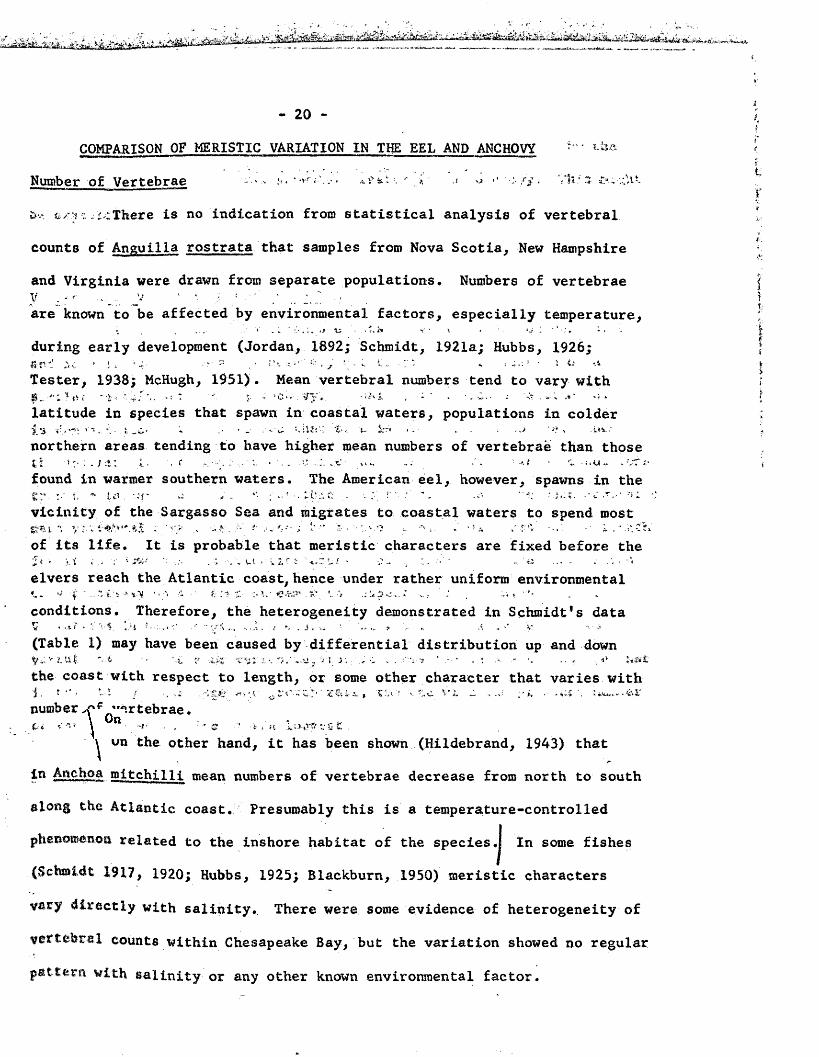
*>•-» i ;There is no indication from statistical analysis of vertebralcounts of Anguilla rostrata that samples from Nova Scotia, New Hampshireand Virginia were drawn from separate populations. Numbers of vertebraeV . y ’ * v *. : ■' _•. _ ,are known to be affected by environmental factors, especially temperature,during early development (Jordan, 1892; Schmidt, 1921a; Hubbs, 1926;a:r m f j , '4' •••'• * ,• ;*•-■ - i:> ■■ J - «. •• •• ■ ’• *- *-*Tester, 1938; McHugh, 1951). Mean vertebral numbers tend to vary with
?t*» ' ’i < ■’>; • *- r - ‘C**-. Vy.. "‘‘“'i - ■'*• • '- -4.- .i 4? . •«• 4 '* *■latitude in species that spawn in coastal waters, populations in colderi ' j ’■* « , . . *, * „• > -■ .••<•*: 5» n ^ i t* *-.■ *** , .uv.-
northern areas tending to have higher mean numbers of vertebrae than those" £• t * ' * *■ $ n 4. * ' * ''' * ' ' ■*• * v V i *. -. • *■ 'A £ * - i « KA *£ - ’V * •*found in warmer southern waters. The American eel, however, spawns in the
:• 5, ^ . - : r ■* - *'• r~-; ' *. ...• .-v.vicinity of the Sargasso Sea and migrates to coastal waters to spend most p n ;; -** .v - - #■ .».■ v ; y- • •«* .-.tV iof its life. It is probable that meristic characters are fixed before the*4? • 't.i i '• »**•■' '■ . ul > viT i ' -i-Z i * -4 , 1. ‘ ~..'a ... ■■ . . • ■«elvers reach the Atlantic coast, hence under rather uniform environmental
■ .. “ i.;i -*■ v V •' £.'■?■■■£.• e-r.P' .5?. '..'V .; !* v r. - , -'-i *
conditions. Therefore, the heterogeneity demonstrated in Schmidt’s data (Table I) may have been caused by differential distribution up and down^ 4 .v ? . u | '-i P 4 > * v ’jjl.;' ' i; J v ; ■ .*■ ‘ * . • ..V .» f .. 4* U & l
the coast with respect to length, or some other character that varies with5-. * ’ - ' *• ' ^ '' r=. ^ f. % '■>*■ ’ X- > C ^ <• *" * Sr.* , >
number of vertebrae.1 > j ~:. > ■- «'h U > ^ r s t .
along the Atlantic coast. Presumably this is a temperature-controlled phenomenon related to the inshore habitat of the species .j In some f ishes (Schmidt 1917, 1920; Hubbs, 1925; Blackburn, 1950) meristic characters vary directly with salinity. There were some evidence of heterogeneity of
vertebral counts within Chesapeake Bay, but the variation showed no regular pattern with salinity or any other known environmental factor.
the other hand, it has been shown (Hildebrand, 1943) that in Anctjoa mltchiili mean numbers of vertebrae decrease from north to south
- 2 1 -
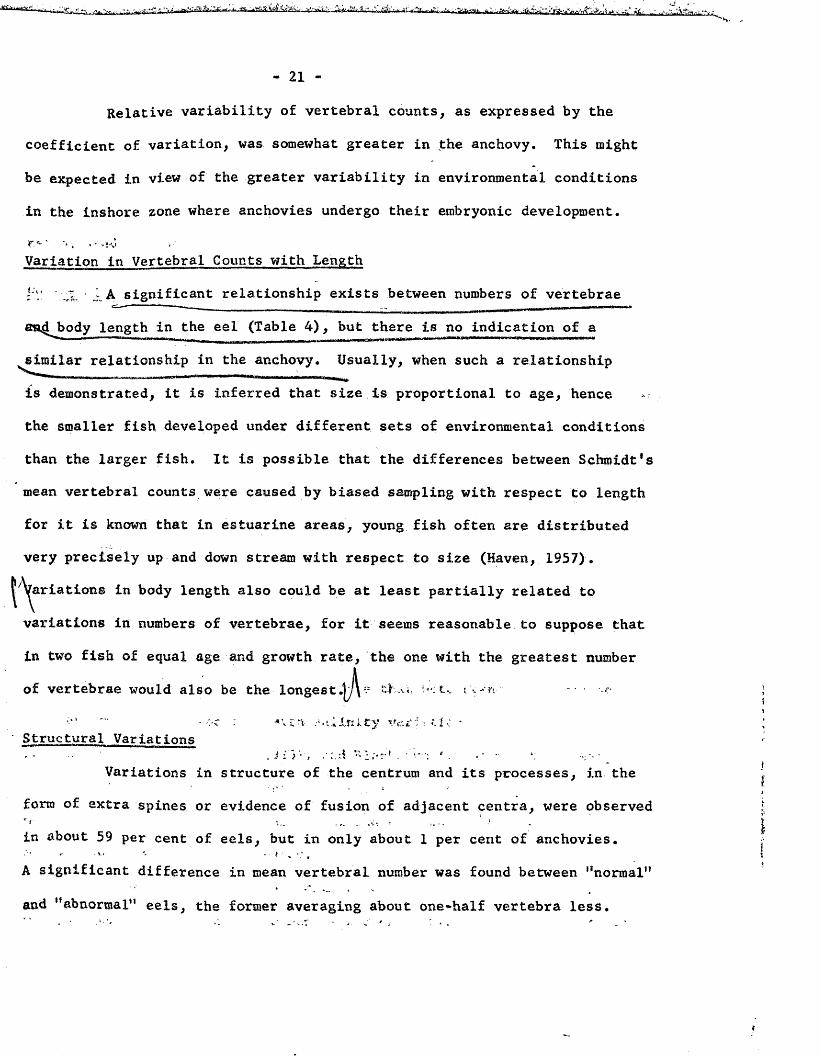
Relative variability of vertebral counts, as expressed by the coefficient of variation, was somewhat greater in jthe anchovy. This might be expected in view of the greater variability in environmental conditions in the inshore zone where anchovies undergo their embryonic development.r ' >•. • •Variation in Vertebral Counts with Length
A significant relationship exists between numbers of vertebraelength in the eel (Table 4), but there is no indication of a
similar relationship in the anchovy. Usually, when such a relationshipis demonstrated, it is inferred that size is proportional to age, hence the smaller fish developed under different sets of environmental conditions than the larger fish. It is possible that the differences between Schmidt*s mean vertebral counts were caused by biased sampling with respect to length for it is known that in estuarine areas, young fish often are distributed very precisely up and down stream with respect to size (Haven, 1957).
|A^riations in body length also could be at least partially related to variations in numbers of vertebrae, for it seems reasonable to suppose that in two fish of equal age and growth rate, the one with the greatest number of vertebrae would also be the l o n g e s t . s K u , '.-ru <
• ->c : Unity t i c *Structural Variations
Variations in structure of the centrum and its processes, in the form of extra spines or evidence of fusion of adjacent centra, were observed in about 59 per cent of eels, but in only about 1 per cent of anchovies.A significant difference in mean vertebral number was found between "normal"
and "abnormal” eels, the former averaging about one-half vertebra less.
- 2 2 -
However, ratios of “abnormal" to “normal" backbones appeared to be constant* regardless of locality, hence the influence of “abnormalities" upon meanvertebral counts need not be considered in measuring latitudinal variation,as bng as counts derived from such fish are made according to pre-
established criteria. ; r #ou‘l : i •• . ..4= a* •
I f ■ '--i ."** rr.,Number of Fin Rays
;• ; ?F- (*■?.> t ' " - •*Analysis of the eel sample means for dorsal, anal and total fin-
v •• - ‘ '• • i •' " - • •ray counts gave no indication that the three samples could have been drawn from separate populations. On the other hand, mean dorsal, anal and pectoral fin-ray counts in Anchoa mitchilli all gave evidence of heterogeneity, although the samples responsible were not the same for all fins. Variations in fin-ray numbers may be caused by environmental factors and since the various fins complete their development at different times their individual patterns of variability need not be similar. Little is known concerning the extent of anchovy migrations within Chesapeake Bay. However, if they migrate extensively, one would not expect to find variations that could be related to latitude, temperature or salinity. : ■- v r-v . v,
t .There was no particular evidence that heterogeneity in Anchoa fin-ray counts was associated with salinity variations, as the work of Schmidt (1917, 1920), Hubbs (1925), and Blackburn (1950) might suggest, except in the Rappahannock River where a sample taken 80 miles above the mouth, in fresh water, had lower dorsal and anal counts than one taken 30 Kilos downstream in brackish water. -.-..I r -v ;
' t ' * ®ay be that observed differences in Anchoa fin-ray countswet© due to variation in environmental factors during the period when fin-

ray numbers were determined, factors perhaps more variable than during the smbryo stage when vertebral number was determined. It also seems possible '.hat these differences could arise from sampling a statistically complex biological population and, if so, a great many more samples, particularly rom year to year in the same locations, would need to be examined to define he underlying patterns more clearly. - * *• ! -
vOFin-ray counts were relatively much more variable than counts of artebrae. In the eel, counts of total rays were somewhat less variable lan counts for individual; fins, and this probably reflects the difficulty: distinguishing between caudal, dorsal and anal rays inaa fin that is
y.-\mtinuous. Dorsal fin-ray counts in the anchovy were relatively less
J‘„ : l ' \\t ■ vatfacie u Ck. . ' -■ * ...* ;■ ' • ’ ; •rtable than in the eel, but variability of anal rays was quite similar
. ,u-. ,• New snite • ‘i'ui ^j, 's, -both species.t-.j *<«. Ch&9&p&$Kt* .£sy -sr?d % . r i / ' • f. i-tv c-. ■>
iationship Between Numbers of Body Segments and Fin Rays ' v '■"- v -Variations in numbers of dorsal and anal fin rays were strongly sociated with numbers of vertebrae in the eel, but, in the anchovy, no .h relationship was evident. In the eel these fins, especially the :w sal, occupy linear distances similar to that occupied by the vertebral umn. The primitive median fin, though present in larval anchovies, does persist in adults and the separated remnants that form the adult fins associated with a relatively small fraction of the total number of oeres whereas the vertebral column is immediately associated with the r segments. Such differences in physical association of vertebrae and rays with body segments could be largely responsible for the different Is of correlation between these characters in the two species.
- 2 4 -
Another clue to the lack of relationship between vertebral andfin-ray numbers in the anchovy is contained in the work of Ford and Bull(1926) on Clupea harengus and McHugh (1942, 1951) on Clupea pallasii andEngraulis mordax respectively. Following development of dorsal and analfin rays in these clupeoids, and while they are still developing, thesefins migrate forward over a. considerable number of myomeres to take uptheir adult positions. It. is obvious that there cannot be a very closeassociation between body segments and fin rays under such circumstances, andthat theie is no reason to expect that a relationship should exist.
1 \ £ f.:»• numbtirs •©£ • -tLn r&/a- \*&em lySUMMARY
V > -1 *v. s -V: , ‘ ■ >■»**] -•* rlo-^h i ;>-oA study of variation of meristic characters of Anguilla rostrata
! »..•,« • i •••* ‘3 *.** f- --'-V ' ’ *•:, .t' f,r .t I ••••■' .rom Nova Scotia, New Hampshire and Virginia, and Anchoa mitchilli from
.2 . '• •* > ■ by- ’."‘vi'C,51 -***>-;■ i«».»:i . r -•ive locations within Chesapeake Bay and its tributaries was made to compareariabillty in numbers of vertebrae and fin rays in two fish species that
• ;\* '.vi. •• ‘ L\&z er.cusi nr-let p i n the 1. •;Iffer widely in numbers of body segments.. *• r„ *. c . • ' ' v? ■.■*. •£* s ,• •• duri'CiT T 1' ' £ f r*7 J--, . f "i ?§
Statistical analysis of numbers of vertebrae and fin rays in eel■’ «
md anchovy suggest that populations along the Atlantic coast are hetero- neous. Whether these differences are genetic or environmental in origin, whether they are caused by segregation according to other factors, it not possible to determine. This has no particular bearing on the major erpose of this study which was to compare variation between the two species
Relative variability of vertebral counts, as expressed by the efficient of variation (C), was somewhat greater in the anchovy. This may
due to difference in environmental factors during embryonic development the two species. Fin-ray counts were relatively more variable than
nts ©£ vertebrae in both species.
- 25 »Numbers of vertebrae are significantly related to body length
in the eel, but in the anchovy there is no evidence that variations inthese characters are related. ’ '
Structural variations occurred in about 59 per cent of eels, but in only one per cent of anchovies. "Abnormal" eel skeletons averaged about one-half vertebra less than "normal*1 skeletons, but as the ratios of "abnormal** to "normal" backbones appeared to be constant regardless of locality, the effect of "abnormalities’* on mean vertebral counts was of no consequence.
>In Anguilla, variations in numbers of fin rays were strongly related to numbers of vertebrae, but no relationship was evident between these characters in Anchoa. It is suggested that these differences may be related to the degree of physical association of vertebral centra and fin rays to body segments. It is also possible that the poor relationship ‘in the anchovy may be due to differential growth in the post larval stage,as has been shown for other clupeoids, during which time fin migrationsoccur. " • *•

- 26 -
t t t f .RATURE CITED
Anderson, A. W. and E. A, Power M *. t4’ / *•- 1 -m***: - ' *1955* Fishery Statistics of the United States. U. S. Fish and
■ ■■?**.- Wildlife Serv., Statistical Digest 41. 446 pp.
Blackburn, M. • ~ "1950. A biological study of the anchovy, Engraulis australis (White),
in Australian waters. Australian Jour. Marine and Freshwater
i * . Res. 1(1): 3-84.Clark, Frances N.
1936. Variations in the number of vertebrae of the sardine, Sardinops . n caerulea (Girard). Cope la 1936(3): 147-150.
Ford, E. . 0. :• . rv *•'1933. The number of vertebrae in the herring and its variations.
Jour. Conseil 8(2): 211-222. '• - ;r
Ford, E. and H. 0. Bull •' - - ^ -1926. Abnormal vertebrae in herrings. Jour. Marine Biol. Assoc. 14:
599-517. . ‘‘.if.-ii.: :*•». * - w * ‘*
Gabriel, M. L.. ’-1-' **■* *-v v-iv-.; to -*v:•1944. Factors affecting the number and form of vertebrae in Fundulus
heteroclitus• Jour. Exp. Zool• 95: 105-143.Gwyn, Agnes M. ^. j ; v «*. - : - -A
1940. The development of the vertebral column of the Pacific herring, Clupea pallasii. Jour. Fish. Res. Bd. Canada 5(1): 11-22.
Hart, John L. i .v-: ic* *. v ist. * ;< '1933. Statistical studies on the British Columbia pilchard: Vertebrae
counts. Trans. Roy. Soc. Canada 1933(3), P. 27£ (5): 79-85.

- 27 -Haven, D.
1957. Distribution, growth and availability of juvenile croaker,Micropogon undulatus. in Virginia. Ecology 38(1): 88-97.
Heincke, Friedrich ?. v. :.a n1898. Naturgeschichte des Herings: I - Die Lokalforraan und die
Wanderungen des Herings in den europaischen Merren. Berlin: i ,223 pp.
Hildebrand, S. F. vtr- in I - i1943. A review of the American anchovies (Family Engraulidae).
Bull. Bing. Oceanogr. Coll. 8(2). 165 pp.Hildebrand, S. F. and W. C, Schroeder ( .11. i-v*.. ^
1927. Fishes of Chesapeake Bay. Bull. U. S. Bur. Fish. 43. 388 pp.Hubbs, Carl L.
1925. Racial and seasonal variation in the Pacific Herring,California sardine and California anchovy. California Fish and Game Comm., Fish. Bull 8. 23 pp. °
; * 1926. The structural consequences of modifications of the development■'A. rate in fishes, considered in reference to certain problems
of evolution. Amer. Nat. 60: 57-81. _
Hubbs, C. L. and A. Perlmutter , t. * cions* in >v. ’1942. Biometric comparison of several samples, with particular reference
to racial investigations. Amer. Nat. 76: 582-592.
Jordan, D. S. • c-.*-.*•, t. «*:.«'ix I \ „ :x1892. Relations of temperature to vertebrae among fishes. Proc.
U. S. Nat. Hus. 14: 107-120.

Kandler, R. r • • **-. "*
1932, Uncertainty in the determination of vertebral number as ai is ■ result of apparent deformities. Jour. Gonseil 7(3): 373-385.
Masstnann, W. H., E. C. Ladd and H. N. McCutcheon
1952. A surface trawl for sampling young fishes in tidal rivers.. vi ; . No. Amer. Wildlife Conf. 17: 386-392.McHugh, J. L. ^ mf-ri.3tLs c- -
1942. Variation of vertebral centra in young Pacific herring (Clupeapallasii). Jour. Fish. Res. Bd. Canada 5(4): 347-360.
1951. Meristic variations and populations of northern anchovy(Engraulis mordax mordax)♦ Bull. Scripps Inst. Oceanogr.
-6(3): 123-160.Rounsefell, G. A. • «£' terrla# .-V
1930. Contribution to the biology of Pacific herring. Clupea pallasii. and the condition of the fishery in Alaska. Bull. U. S. Bur. Fish. 45: 227-330. - - Cuts,!CU-.C
Schmidt, Johannes1914. First report on eel investigations. Rapports et Process-
Verbaux des Reunions, Conseil Perm. Int. Exp 1. Her. 18.1916. Second report on eel investigations. Ibid. 23.1917. Racial investigations. I. Zoarces viviparu9 L. and local
races of the same. Compt. Rend. Lab. Carlsberg 13(3): 279-397.1920. Racial investigations. V. Experimental investigations with
Zoarces viviparus L. Ibid. 14(9): 1-14.
1921a. Racial investigations. VIX. Annual fluctuations of racialcharacters in Zoarces viviparus L. Ibid. 14(15); 19-23.
Snedecor, G. W. -
1946. Statistical Methods. 4th Edit. Collegiate Press, Ames, Iowa,485 pp.
Taning, A. Vedel
1944. Experiments on meristic and other characters in fishes. I.On the influence of temperature on some meristic characters in sea trout and the fixation-period of these characters.Medd. fra. Koran. Danmarks Fisk. Havunder., Ser. Fish.11(3): 66 pp.
Tester, A. L.1937. Populations of herring (Clupea pallasii) in the coastal waters
of British Columbia. Jour. Biol. Bd. Canada 3: 108-144,1938. Variation in the mean vertebral count of herring (Clupea pallasii)
with water temperature. Jour. Conseil 13(1): 71-75.