Embed Size (px)
Citation preview

IJIRST –International Journal for Innovative Research in Science & Technology| Volume 1 | Issue 6 | November 2014 ISSN (online): 2349-6010
All rights reserved by www.ijirst.org 139
A Comparative Study of Individualism Vs
Collectivism and its Impact on Indian Youth
Culture with Special Reference to Television
Commercials
Prof. Mrs. Anamika Singh1,2
1Research Scholar
2Assistant Professor
1Dr. D.Y. Patil Vidyapeeth, Pimpri, Pune, 2SKN Sinhgad School Business Management, Pune
Abstract
This study compares the cross-cultural western advertisements and its impact on Indian youth, considering two cultural
dimensions, Individualism and Collectivism, the cultural dimensions of Geert Hofstede. Cross-cultural advertisements would
imply the advertisements of western countries manifested in select product category and its impact on Indian youth. The study
elaborates the impact of cultural dimensions extensively Individualism and Collectivism, on advertisements and further the
extent of impact of cross- cultural advertisements on Indian youth. The main objective is to compare the cultural dimensions and
provide better understanding of impact of cross-cultural advertisements on Indian youth to aid the advertisers in arriving at
suitable advertising strategy for an optimum promotional mix.
Keywords: Cross-Culture, Cultural Dimensions, Individualism, Collectivism, Youth
_______________________________________________________________________________________________________
I. INTRODUCTION
This study compares the two dimensions i.e. Individualism and Collectivism through the comparison of two western
advertisements depicting these two value dimension and also investigates the cross-cultural impact of western advertisements on
Indian youth. Specifically it investigates the extent to which the western advertisements are affecting the values and beliefs of
Indian culture particularly the Youth of India. Though there are many areas of cross cultural differences like communication
style in cross cultural advertising, language in cross cultural advertising, colours, numbers and images in cross cultural
advertising and cultural values in cross cultural advertising but this research emphasizes on cultural values shown in the content
and execution and its effect on the youth of India.
Culture and its Impact on Advertisement: A.
The national culture of any country is shaped with its values. These values are usually reflected in advertisements because
advertisement is considered as cultural institution as well as form of social communication (Yuan Zhang, 2004). As discussed
above advertising reflects as well as affects the culture and so the society, it may be said that it would reflect what is happening
in society, what are the values prevailing. But sometime this reflection will be selective and would reflect only those values by
the dint of which the merchandise may move or the sale may increase. It does not stop here but also distort the reflection
sometimes to make it more interesting and spicy. Thus advertising has the potential to be an agent of cultural change by
gradually reconfiguring the relative importance of different cultural values for individuals, cultures and societies (Pollay, 1983).
Importance of Values B.
Considering these characteristics of advertising (affecting and reflecting the culture) it may be found out that to what extent the
values of Indian culture have changed. Are we really finding any change or many changes in the attitude of individuals in society
because value influences the individuals‟ perception, attitude, preferences and behavior. Rokeach (1973) defined values as a
person‟s enduring belief and/or organization of beliefs concerning preferable modes of conduct or states of existence along a
continuum of relative importance. Also “a value is a broad tendency to prefer certain states of affairs over others” ( Hofstede,
cultural consequences).
Advertisement and its Impact: C.
Advertising is defined as “the paid form of non personal communication and promotion of ideas, goods and services by an
identified sponsor” this advertisement is the interface of culture and economy. The objective of the advertisement is to make
aware, persuade, remind and reinforce the customers. While making aware or persuading the customers in order to increase the
sale of products or services the advertisers need to influence the attitude of customer towards advertisement likeability. It is

A Comparative Study of Individualism Vs Collectivism and its Impact on Indian Youth Culture with Special Reference to Television Commercials (IJIRST/ Volume 1 / Issue 6 / 024)
All rights reserved by www.ijirst.org 140
always found that if customers do not like the advertisements that influence their purchase decision. Advertising which is called
as cultural product affects attitude and society defines and redefines social roles by influencing through advertisement for
moving the merchandise and also influences the cultural values.
Individualism / Collectivism: D.
The main issue which is addressed in this dimension is the degree of interdependence which prevails in the society. This
dimension has been defined as “Individualism refers to the relationship between an individual and collectivity that prevails in
society” (Jana Moller & Martin Eisend, 2010). It portrays whether people in the society portray their self-image as „I‟ or „We‟. In
individualist society people are looked after by themselves whereas in collectivist society people are looked after by the group to
which they belong in exchange of their loyalty. The existence of this dimension has been established by many researchers in
their studies (Bass & Burger, 1979; Converse, 1972; Hofstede & Bond, 1984). In individualist society self decision are always
considered whereas in collectivist society group decision are always valued. Individuals are never bound to take anybody else‟s
opinion while taking any decision. Even the communication in individualist society is more explicit and verbal. Individualist
society has low context culture.
As Hofstede mentions in his index score, India scores low i.e. 48 for individualist culture. India clearly in his index score
reflects the collectivist traits. Collectivist traits emphasize on “We” consciousness and people are identified based on their social
system they belong to. In this society whatever good or bad happens, entire group is made responsible for that. Collectivist
society has high context culture. Hofstede study reveals that most of the western countries are Individualistic whereas most the
Asian countries are collectivist. Those countries which score high on Individualism will show inclination towards personal
responsibility, and the individuals in these countries would make their own decisions and would be motivated by their own
preferences and inner drives” (Jana Moller & Martin Eisend, 2010). In individualist culture the individual‟s pleasure and their
beliefs are preferred over any group norm or social norms. In case of showcasing advertisements Individualist culture will depict
independence, personal autonomy, personal achievement, uniqueness/ individuality, non-confirmity, and competitiveness/
competition whereas in collectivist culture the advertising appeal is depicted as: veneration of elderly, filial piety, harmony with
others, courtesy and nurturance. The individualist dimension is found in western advertisements and collectivist dimension is
found in easter countries (Yuan Zhang, 2009).
Assignment of Pollay's Appeals to Theories' Dimensions E.Table - 1.1
Pollay's Appeals to Theories' Dimensions (Pollay, 1983)
Dimensions Score Pollay’s
Appeal Operational Definition
(IDV) High Independence
Self-sufficiency, self-reliance, autonomy, unattached, to do-it-yourself, to do your own thing, original
unconventional, singular, nonconformist
Security Confident, secure, processing dignity, self-worth, self-esteem, self-respect, peace of mind
Collectivism High
Family, Nurturance within the family, having a home, being at home, family privacy, companionship for
siblings, kinship getting married
Community Relating to community, state, national, publics, public spiritedness, group unity, national identity,
society patriotism, civic and community organizations or other social organizations
II. REVIEW OF LITERATURE
Critical Appraisal A.
Cross- cultural advertising research is an evolving concept. The study started long back based on the concept of standardization
of advertisement or impact of these advertisements. Many studies have been conducted in cross-cultural and intercultural
advertising research over last many years. Most of the research which evolved over a period of time tried to emphasize on
content analysis of advertisements of different countries. Studies tried to dig out the differences and similarities in culture of
different countries. As the trade barriers are dismantling and the entire globe is being considered one because of the concept of
globalization, advertisers need to understand whether one standardized advertising strategy should be adopted or it should be in
congruence with the local culture. This becomes more important when the concept of „cultural imperialism‟ come in existence. It
becomes very important to understand to what extent the culture is influenced by this cultural imperialism. If this influences to
large extent or homogenization of globe has happened this will be great relief to advertisers and so they could standardize the
advertisement. But if the influence is not so evident then the standardized advertisement may act as alien for the host culture.
In order to find out the gap in literature, many research papers have been reviewed and it was identified that though many
research in cross- cultural advertisement has been done so far and most of the study relied on analyzing the advertising content
but besides Zang and Gelb (1996) and Dahl (2004) no other researcher made attempt to find out the customers perception about
the appeal depicted in cross- cultural research and the comparison between Individualism and collectivism in Indian perspective.
Though, both studies advocate that consumers appear to favour the appeal which is in congruence with their own culture. But
both the studies are relatively very small and still no extensive data available for this issue. Also, there are many researches on

A Comparative Study of Individualism Vs Collectivism and its Impact on Indian Youth Culture with Special Reference to Television Commercials (IJIRST/ Volume 1 / Issue 6 / 024)
All rights reserved by www.ijirst.org 141
other Asian countries like Korea, China, Thailand and Japan but very few research have been conducted on India. Though, Niaz
Ahmad has submitted his Doctoral thesis on content analysis of U.S and Indian advertisements. Also the other studies like “A
cross cultural comparison of ethical attitudes of business managers: India, Korea and U.S.”. But these studies do not consider the
consumers point of view and particularly the two dimensions called Individualism and Collectivism and its thus the researcher
proposes to study the comparison of two dimensions i.e. „Collectivism and Individualism and its impact on Indian youth for
consumer point of view in order to gather extensive data in this regard.
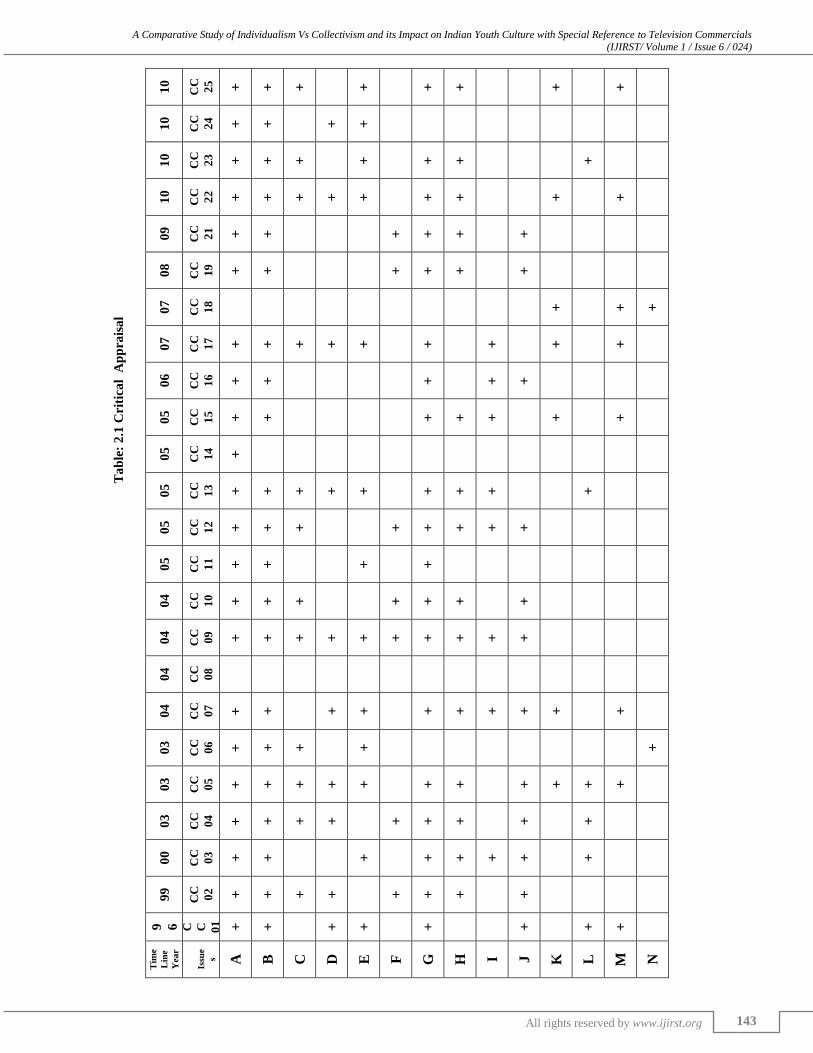
Therefore to identify the research gap and to aid advertisers to formulate the advertising strategy the review of literature have
been done which are Cross Cultural Advertising Research, CCAR(01) (Albers-Mueller and Gelb, 1996), CCAR(02) (Bongjin
et.al, 1999), CCAR(03) (Daechun An, 2003), CCAR(04) (Daechun An, 2003), CCAR(05) ( Daechun An, 2003), CCAR(06)
(Christie et.al, 2003) CCAR(07) (Sho et.al, 2004), CCAR(08) (Francis and Vrience, 2004), CCAR(09) (Okazaki, 2004),
CCAR(10) (Zhang, 2004), CCAR(11) (Nilaweera, 2005) CCAR(12) (Singh et.al., 2005), CCAR (13) (Dahl, 2005), CCAR(14)
(Twing, 2005), CCAR(15) (Weller et.al. 2005), CCAR(16) (Morris . A. Kalliny, 2005) CCAR(17) (Shyan Fam, 2006),
CCAR(18) (Shyan Fam et.al. 2007), CCAR(19) (lemanski, 2007), CCAR(20) (Khairullah, 2008) CCAR(21) (Ngoe, 2009),
CCAR(22) (Zhang, 2009), CCAR(23), (Seo, 2010) CCAR(24) (Emery et.al., 2010), CCAR(25) (Sills, 2010), It is noted that
„CCAR‟ stands for cross-cultural advertising research which has been chronologically arranged in the Table 2.1 with total
number 25.
We eventually find growth in the literature of cross-cultural advertisements. Here it is sequentially arranged to provide
continuous update in learning from the findings of previous studies. Several researchers have given varying perspectives and
using different methodologies to discuss following issues:
Defining Culture
Definition of Cross-Cultureulture
Cultural values of Hofstede
Impact of Different Cultural Dimensions
Cross-Cultural Content Analysis
Cross-Cultural Impact on Advertisement.
Empirical Research on Content Analysis of Advertisement.
Cross-Cultural Impact on Perception of Advertiesments Cultural Values and Appeal
Impact of Appeal on Attitude
Attitude Components
Standardisation of Advertisement
Consumer Acculturation
Comparative Advertisement‟s Analysis
Youth Culture
Some Key Findings of Literature Review: B.
Many researcher have attempted to define concept of culture and cross-culture (Albers Mueller and Gelb, 1996);
(Daechun An, 2003); (Morris .A. Kalliny, 2005) which is considered as reflection of value in people of that culture.
Many of the research have considered either the value dimensions of Hofstede or the context of Hall for the cross-
cultural study. Though concept of culture and cross-culture has been comprehensibly studied in most of the research.
Many researcher have done the content analysis (Mueller and Gelb, 1996), (Bongjin, et.al, 1999), (Daechun An, 2003),
CCAR(04) ( Daechun An, 2003), (Christie et.al, 2003) for the study of cross-cultural research whereas very few have
done research on perception ( Daechun An, 2003); (Sho et.al, 2004), (Weller et.al., 2005) about the cross cultural
western advertisements.
Only little empirical evidence on cross-cultural advertisement are found coming on India (Singh et.al., 2005), (Ahmad
Niaz, 1996), (Shyan Fam et.al., 2007), (Srivastava, 2010).
Most of the researchers have taken value dimensions of either Hofstede as the base of their study or the context of Hall
but very few researchers have taken the base of both (Daechun An, 2003) for the study.
Although there are many studies which discuss about both theme and execution (Bongjin, et.al, 1999) of advertisement
and its impact in general, however very few studies discuss about the impact on youth (Weller et.al., 2005), (Gupta,
2011).
This research discusses about the impact of cross-cultural western advertisement on Indian youth which is demographic
dividend. Moreover this study has taken personal care products for the reference and will benefit the advertising
agencies to understand the impact because youth are the one who consumes personal care products most. Further it
discusses that to what extent the values/ cultural dimensions are affected.
Research Gap C.
Most of the research done so far discusses about content analysis of either print advertisement or electronic advertisement (e.g.
Daechun An, 2007; Nelson & Paek, 2008; Okazaki and Mueller, 2007). Generally the execution of advertisements and the

A Comparative Study of Individualism Vs Collectivism and its Impact on Indian Youth Culture with Special Reference to Television Commercials (IJIRST/ Volume 1 / Issue 6 / 024)
All rights reserved by www.ijirst.org 142
language of advertisement changes as per the requirement (Taylor & Johnson, 2006) but these adaptations even are not
prevalent; it is always a trial and error process with little knowledge about how to adapt according to country specific
characteristics. Also, there are researches which investigate that how the advertisements of stark different countries are perceived
and evaluated by the host culture. But there is no research so far which compares and measures that how and to what extent
(Particularly these two dimensions called Individualism and Collectivism) the standardized execution and element of
advertisements of western culture has impacted the culture of India and how the youth of India are responding to this
standardized advertisement in terms of element and execution both. Therefore this current investigation explores comparison of
these two dimensions i.e. Individualism and Collectivism the youth reaction towards the western advertisement with western
cultural values and thus to what extent these youth are in the purview of acculturation. For this study, out of several frameworks
of cultural dimensions the most frequently employed framework to date which was developed by Hofstede in (2001) has been
recognized and used.
Following Table covers the research gap based on the various research studies in different „Timeline Year‟ and the issues
covered.
A Comparative Study of Individualism Vs Collectivism and its Impact on Indian Youth Culture with Special Reference to Television Commercials (IJIRST/ Volume 1 / Issue 6 / 024)
All rights reserved by www.ijirst.org 143
10
CC
25
+ + + + + + + +
10
CC
24
+ + + +
10
CC
23
+ + + + + + + 1
0
CC
22
+ + + + + + + + +
09
CC
21
+ + + + + +
08
CC
19
+ + + + + +
07
CC
18
+ + +
07
CC
17
+ + + + + + + + +
06
CC
16
+ + + + +
05
CC
15
+ + + + + + +
05
CC
14
+
05
CC
13
+ + + + + + + + +
05
CC
12
+ + + + + + + +
05
CC
11
+ + + +
04
CC
10
+ + + + + + +
04
CC
09
+ + + + + + + + + +
04
CC
08
04
CC
07
+ + +
+ +
+
+
+
+ +
03
CC
06
+ +
+ + +
03
CC
05
+ +
+
+
+ +
+ +
+
+
+
03
CC
04
+ +
+
+ +
+
+ + +
00
CC
03
+
+ + +
+
+
+ +
99
CC
02
+
+
+
+ +
+
+ +
9 6
C C 01
+
+ +
+ + + +
+
Tim
e
Lin
e
Yea
r
Issu
e
s A
B
C
D
E
F
G
H
I J
K
L
M
N
Ta
ble
: 2
.1 C
riti
cal
Ap
pra
isa
l
A Comparative Study of Individualism Vs Collectivism and its Impact on Indian Youth Culture with Special Reference to Television Commercials (IJIRST/ Volume 1 / Issue 6 / 024)
All rights reserved by www.ijirst.org 144
III. RESEARCH METHODOLOGY
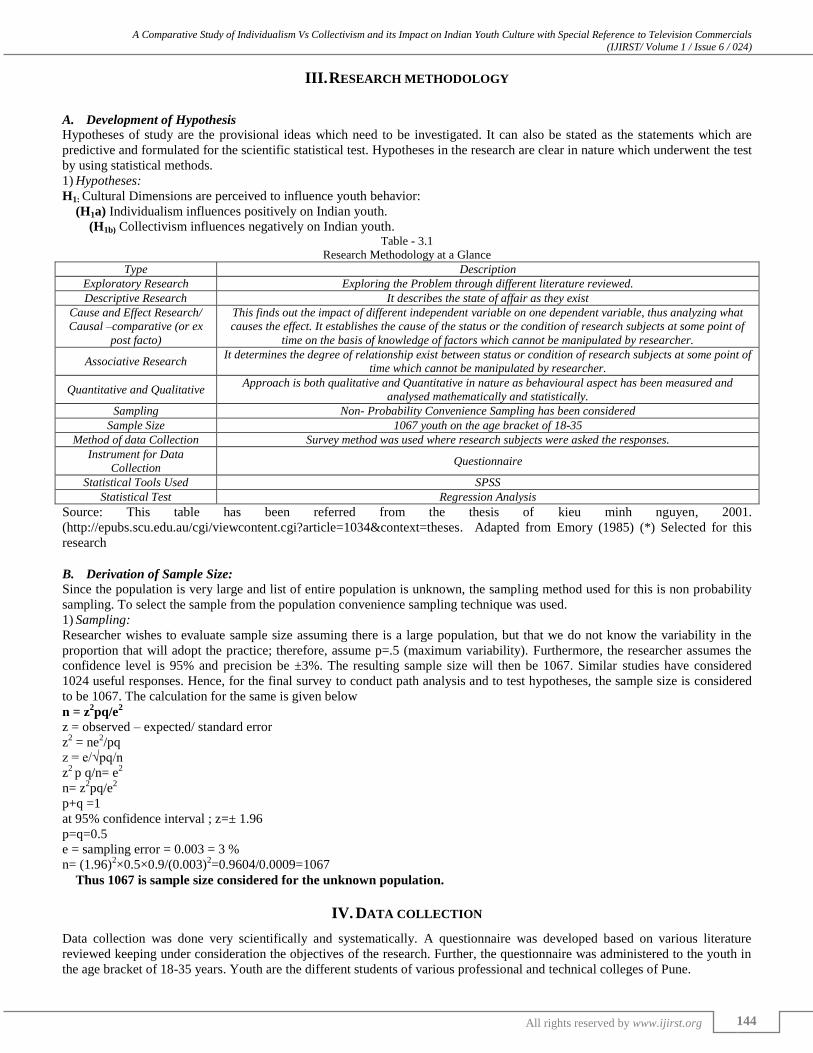
Development of Hypothesis A.
Hypotheses of study are the provisional ideas which need to be investigated. It can also be stated as the statements which are
predictive and formulated for the scientific statistical test. Hypotheses in the research are clear in nature which underwent the test
by using statistical methods. Hypotheses: 1)
H1: Cultural Dimensions are perceived to influence youth behavior: (H1a) Individualism influences positively on Indian youth.
(H1b) Collectivism influences negatively on Indian youth. Table - 3.1
Research Methodology at a Glance
Type Description
Exploratory Research Exploring the Problem through different literature reviewed.
Descriptive Research It describes the state of affair as they exist
Cause and Effect Research/
Causal –comparative (or ex
post facto)
This finds out the impact of different independent variable on one dependent variable, thus analyzing what
causes the effect. It establishes the cause of the status or the condition of research subjects at some point of
time on the basis of knowledge of factors which cannot be manipulated by researcher.
Associative Research It determines the degree of relationship exist between status or condition of research subjects at some point of
time which cannot be manipulated by researcher.
Quantitative and Qualitative Approach is both qualitative and Quantitative in nature as behavioural aspect has been measured and
analysed mathematically and statistically.
Sampling Non- Probability Convenience Sampling has been considered
Sample Size 1067 youth on the age bracket of 18-35
Method of data Collection Survey method was used where research subjects were asked the responses.
Instrument for Data
Collection Questionnaire
Statistical Tools Used SPSS
Statistical Test Regression Analysis
Source: This table has been referred from the thesis of kieu minh nguyen, 2001.
(http://epubs.scu.edu.au/cgi/viewcontent.cgi?article=1034&context=theses. Adapted from Emory (1985) (*) Selected for this
research
Derivation of Sample Size: B.
Since the population is very large and list of entire population is unknown, the sampling method used for this is non probability
sampling. To select the sample from the population convenience sampling technique was used.
Sampling: 1)
Researcher wishes to evaluate sample size assuming there is a large population, but that we do not know the variability in the
proportion that will adopt the practice; therefore, assume p=.5 (maximum variability). Furthermore, the researcher assumes the
confidence level is 95% and precision be ±3%. The resulting sample size will then be 1067. Similar studies have considered
1024 useful responses. Hence, for the final survey to conduct path analysis and to test hypotheses, the sample size is considered
to be 1067. The calculation for the same is given below
n = z2pq/e
2
z = observed – expected/ standard error
z2 = ne
2/pq
z = e/√pq/n
z2 p q/n= e
2
n= z2pq/e
2
p+q =1
at 95% confidence interval ; z=± 1.96
p=q=0.5
e = sampling error = 0.003 = 3 %
n= (1.96)2×0.5×0.9/(0.003)
2=0.9604/0.0009=1067
Thus 1067 is sample size considered for the unknown population.
IV. DATA COLLECTION
Data collection was done very scientifically and systematically. A questionnaire was developed based on various literature
reviewed keeping under consideration the objectives of the research. Further, the questionnaire was administered to the youth in
the age bracket of 18-35 years. Youth are the different students of various professional and technical colleges of Pune.

A Comparative Study of Individualism Vs Collectivism and its Impact on Indian Youth Culture with Special Reference to Television Commercials (IJIRST/ Volume 1 / Issue 6 / 024)
All rights reserved by www.ijirst.org 145
Examining data using ‘Cronbach’s Alpha’ through testing ‘Reliability’ for dimensions: To develop the instrument for the research various researches of previous authors have been reviewed and referred. The
instrument was initially evaluated by the expert committee comprising members either academician or the advertisers who could
give expert opinion about the content of the instrument. The experts were requested to give insight about the instrument for its
relevance and clarity. An appropriate scale i.e. five point Likert scale (1= No, 2= Little, 3= Moderate, 4= Very much, 5= Great)
was used to measure the responses of youth.
Regression Analysis has been done through SPSS in order to find out the impact of different independent variables on one
dependent variable. In order to check the reliability of different items in the study, Cronbach Alpha method was used which gave
the satisfactory and acceptable result. To find out the normal distribution of Data, Descriptive statistics analysis was done which
describes the normal distribution of the data by opting the normal distribution of curve. In this study the findings produced are
backed by statistical methods.
There were 1067 respondents surveyed. Two advertisements were selected to showcase to the respondents in order to refresh
the recall of advertisements. These advertisements are the advertisements of select product category i.e. personal care product
viz. Hair Care and Skin Care products. These advertisements depict the different cultural dimensions and cultural context. The
researcher targeted the students of different institutes from undergraduate to post graduate. The different advertisements chosen
for the study are L’oreal Paris Hair Colour and the Dettol Soap.
Reliability for L’oreal Hair Colour: A.

A Comparative Study of Individualism Vs Collectivism and its Impact on Indian Youth Culture with Special Reference to Television Commercials (IJIRST/ Volume 1 / Issue 6 / 024)
All rights reserved by www.ijirst.org 146
Reliability for Dettol Soap: B.
Data Preparation for Hypotheses Testing C.
Descriptive statistics: The control variables in the study are age, gender, marital status, income, education and religion
where the total size of independent sample was 1067. Based on the data collected it was found that 1067 respondents
surveyed, 33.4% are in the age group of 18-23 years i.e. 356 people were in this age bracket, 33.4% are in the age group
of 24-29 years i.e. 356 people were in this age bracket and 33.3% people are in the age group of 30-35 years, i.e. 355
people were in this age bracket. Also, out of 1067 respondents 552 are male i.e. 51.7% are male and 515 respondents
are female i.e. 48.3% are female. It was found that out of 1067 respondents 552 are married i.e. 51.7% and 515
respondents are unmarried i.e. 48.3%. The monthly income of respondents were as out of 1067 respondents 711
respondents have monthly income of less than Rs. 1500 which was 66.6% of total respondents. 266 respondents fell in
the category of having monthly income up to Rs. 25000 which was 24.9%. 62 respondents fell in the category of having
income of up to Rs. 50000 which is 5.8% of total number of respondents. 28 people were found in the category of
having monthly income above Rs. 50000 which was 2.7% of total respondents. Also it was found that out of 1067
respondents 682 respondents belong to Hindu religion which was 63.9% of total respondents. 99 respondents belong to
Muslim religion which was 9.3% of total number of respondents. 286 respondents belong to Christen religion which is
26.8% of total number of respondents.
Dependent Variable: The dependent variable is culture, a youth culture. Youth culture may be represented by a series
of variables since it is difficult to directly measure the youth culture. Thus the two dimension of Hofstede i.e.
Individualism and Collectivism has been considered to measure the impact of these two cultural dimensions on youth.
Eight variables were identified to compare and estimate the impact of two dimensions on youth culture in the current
Indian context.
Independent Variable: The different independent variables to measure the youth culture are the impact of two
dimensions of Hofstede i.e. Individualism and Collectivism and the Pollay‟s dimensions associated with these two
dimensions i.e. Independence and Security, and Family and community. These two dimensions only depicts whether
these dimension are manifested in these two advertisements or not and finally how these two dimensions are responded
by the youth i.e. what is their attitude towards these advertisements.
V. RESULTS AND DISCUSSION
This study has used three alternative models using multiple regression analysis, which is listed below:
Regression Model for L’oreal Paris Hair Colour: A.
For the advertisement L‟oreal Hair Colour which predominantly depicts Individualism, the four models which are proposed are
as follows:
Model 1: CULTURE = BO + B1 (ATTI) +B2 (FEEL) + B3 (THOU) + B4 (FIND)
Model 2:CULTURE= BO + B1(ATTI)+B2 (FEEL)+B3(THOU)+B4(FIND)
+B5(INDI)+B6+(INDE)+B7(SECU)+B8(COLL)+B9(FAMI)+B10(COMM)

A Comparative Study of Individualism Vs Collectivism and its Impact on Indian Youth Culture with Special Reference to Television Commercials (IJIRST/ Volume 1 / Issue 6 / 024)
All rights reserved by www.ijirst.org 147
Model3:CULTURE=BO+B1(ATTI)+B2(FEEL)+B3(THOU)+B4(FIND)+
B5(INDI)+B6+(INDE)+B7(SECU)+B8(COLL)+B9(FAMI)+B10(COMM)+B11(AGE)+B12(GENDER)+B13(MARITAL
STATUS)+B14(MONTHLYINCOME)+B15(RELIGION)+B17(EDUCATION Table - 5.1
Variables Entered/Removeda
Model Variables Entered Variables Removed Method
1 [FIND] , [ATTI]b Enter
2 [IND], [INDE]b Enter
3 AGE, EDUCATION, MONTHLY INCOME, MARITAL STATUS, GENDERb Enter
a. Dependent Variable: CULTURE
b. Tolerance = .000 limits reached.
Table - 5.2
Model Summary
Model R R Square Adjusted R Square Std. Error of Estimate
Change Statistics
R Square Change F Change df1 df2 Sig. F Change
1 .085 .007 .005 1.433 .007 4.842 2 1064 .001
2 .750 .563 .557 .957 .555 133.406 10 1054 .000
3 .750 .564 .556 .958 .001 .573 5 1049 .720
a. Predictors: (Constant), [FIND] , [ATTI]
b. Predictors: (Constant), [FIND] , [ATTI], [IND], [INDE],
c. Predictors: (Constant), [FIND] , [ATTI], [IND], [INDE], , [AGE], [EDUCATION], [MONTHLY INCOME], MARITAL] STATUS],
[GENDER]
Interpretation: Now looking at model summary, which compares each of the three models (one, two, or three predominant
predictors). Here we note that for model 1, with only the component of attitude as predictor, r is the same as the zero-order
correlation between culture and component of attitude. But the associated R square is significant (i.e., the regression equation is
better than using the mean of Y as a predictor) at F (2, 1064) = 4.842, p < .005. Model 2, with two of the three main predictors,
are even better, with an r of .750 and an R square of .563 of the variance accounted for. This change in R square is significant (F
(10, 1054) = 133.406, p<.005), indicating that the second predictor, cultural Dimensions, added significantly to the regression
equation after the first predictor had done its work. But the third predictor, control variables, came up short. It only increased R
square by a tiny bit, from .563 to .564, and the change in R square was not significant (F (5, 1059) = .573, not significant).
Interpretation: The box called variables entered/ removed gives a summary of what is in the model
and the information about the order in which it was entered or removed. Here in above table, all three
components of attitude including attitude as a variables, all variables of cultural dimensions and control
variables are entered and it is going to be comparing three different “models” or regression equations;
one with only attitude and its components as a predictor, another where all components of cultural
dimensions and components of attitude as predictor in second model and finally a model with all three
of the predictors combined i.e. all components of attitude, all components of cultural dimensions and all
control variables as predictors.

A Comparative Study of Individualism Vs Collectivism and its Impact on Indian Youth Culture with Special Reference to Television Commercials (IJIRST/ Volume 1 / Issue 6 / 024)
All rights reserved by www.ijirst.org 148
Table - 5.3
ANOVA Table
Model Sum of Squares df Mean Square F Sig.
1
Regression 15.781 2 7.891 3.842 0.001b
Residual 2185.195 1064 2.054
Total 2200.977 1066
2
Regression 1236.515 12 103.043 112.609 0.000c
Residual 964.461 1054 0.915
Total 2200.977 1066
3
Regression 1239.144 17 72.891 79.497 0.000d
Residual 961.833 1049 0.917
Total 2200.977 1066
(1) Dependent Variable: CULTURE
(2) Dependent Variable: CULTURE
(3) Predictors: (Constant), [FIND] , [ATTI], [IND], [INDE], , [SECU],
(4) Predictors: (Constant), [FIND] , [ATTI], [IND], [INDE], [SECU], [AGE], [EDUCATION], [MONTHLY INCOME],
[MARITAL STATUS], [GENDER]
Interpretation: ANOVA table gives us the significance of each of the three models one (CA) predictor, two (CA and CD)
predictors, three (CA, CD and CV) predictors and we see that the F is largest for the two-predictor model i.e. model 2(CA and
CD). [These Fs are for the overall predictive effect and are different than the F for the amount of change we get when adding in
an additional variable as in the previous table (model summary)]. Thus, we may consider firmly that the model 2 is most
significant model. Table - 5.4
Coefficients
Model Unstandardized Coefficients Standardized Coefficients
t Sig
B Std. Error Beta
1
(Constant) 1.003 .643 1.560 .119
[ATTI] .269 .115 .093 2.333 .020
[FIND] -.062 .172 -.014 -.359 .720
2
(Constant) .819 .891 .041 .002
[ATTI] .191 .082 .066 2.329 .020
[FIND] -.025 .122 -.006 -.207 .836
[IND] 1.466 .041 .740 35.997 .000
[INDE] .701 .306 .047 2.287 .022
[SECU] .599 .962 .209 .623 .533
3
(Constant) .888 .900 .097 .036
[ATTI] .195 .082 .067 2.359 .018
[FIND] -.023 .122 -.005 -.188 .851
[IND] 1.473 .041 .744 35.862 .000
[INDE] .714 .308 .048 2.323 .020
[SECU] .642 .969 .223 .662 .508
AGE .009 .036 .005 .237 .813
GENDER -.043 .096 -.017 -.451 .652
EDUCATION -.005 .032 -.003 -.157 .875
MARITAL STATUS -.037 .028 -.027 -1.293 .196
MONTHLY INCOME .034 .034 .021 1.010 .313
Interpretation: The best value of „R2‟ has been obtained for Model 2 as 0.563, which means that 56.3% of variation is
explained (see table of model summary), which does establish discriminant validity, which is the extent to which a measure does
not correlate with other constructs from which it is supposed to differ. The „Adjusted R2‟ adjusts for the number of explanatory
terms independent variables) in a model and increases only if the new independent variable(s) improve(s) the model more than
would be expected by chance.

A Comparative Study of Individualism Vs Collectivism and its Impact on Indian Youth Culture with Special Reference to Television Commercials (IJIRST/ Volume 1 / Issue 6 / 024)
All rights reserved by www.ijirst.org 149
This regression result indicates H1a is completely supported in general. This implies that attitude of Indian youth is positively
influenced by the Individualism an Independence i.e. Indian Youth loves to see independence and individualism in advertisement
and they consider these attributes as their attitude.
Selecting the Best Multiple Linear Regression Model for Hypotheses Testing: B.
(H1a) Individualism influences positively on Indian youth culture.
The best model has been found to be Model 2, which is, whose regression results are shown in Table 6.. Additionally, regression
results have been shown in Tables 7 for Model 1, Model 2 and Model 3, respectively. According to Tables, 7 , the best model as
„Model 2‟ can be written as:
CULTURE= .819 +(.191)ATTI+(-.025) FIND +(1.466)INDI+(.701)INDE+(.599)SECU+(-.101)..Eq 5.1 It is to be seen from the Table 7 and Eq. 1 that the variables FEEL, THOU, COLL, FAMI, COMM, has not been included in
model 2 and variables FIND and SECU, are not significant. This establishes nomological validity, which is the extent to which
the scale correlates in theoretically predicted ways with measures of different but related constructs.
Regression Models for Dettol Soap: For the advertisement Dettol Soap which predominantly depicts the
„collectivism‟ cultural dimension, under which the different appeals like family and community has been grouped, three
models are proposed :
Model 1: CULTURE = BO + B1 (ATTI)+B2 (FEEL)+B3(THOU)+B4(FIND)
Model 2:
CULTURE=BO+B1(ATTI)+B2(FEEL)+B3(THOU)+B4(FIND)+B5(INDI)+B6+(INDE)+B7(SECU)+B8(COLL)+B9(FAMI)+B10(C
OMM)
Model 3:
CULTURE= BO + B1(ATTI)+B2 (FEEL)+B3(THOU)+B4(FIND)
+B5(INDI)+B6+(INDE)+B7(SECU)+B8(COLL)+B9(FAMI)+B10(COMM)+B11(AGE)+B12(GENDER)+B13
(MARITALSTATUS)B27(MONTHLYINCOME)+B28(RELIGION)+
B29(RELIGION)+B30(EDUCATION)
Table - 5.5
Variables Entered/Removed
Model Variables Entered Variables Removed Method
1 [FIND] , [THOU]b Enter
2 [COLL], [FAMI], [SECU], [MATU], [INDI], Enter
3 AGE, EDUCATION, RELIGION, MARITAL STATUSb Enter
Interpretation: The box called Variables Entered/ Removed gives a summary of what is in the model and the information about
the order in which it was entered or removed. Here in above table, all three components of attitude including attitude as a
variables, all variables of cultural dimensions and control variables are entered and it is going to be comparing three different
“models” or regression equations; one with only attitude and its components as a predictor, another where all components of
cultural dimensions and components of attitude as predictor in second model and finally a model with all three of the predictors
combined i.e. all components of attitude, all components of cultural Dimensions and all control variables as predictors Table - 5.6
Model Summary
Model R R Square Adjusted R Square Std. Error of the Estimate Change Statistics
R Square Change F Change df1 df2 Sig. F Change
1 .085a .007 .005 1.433 .007 3.842 2 1064 .002
2 .749b .562 .557 .956 .554 148.261 9 1055 .000
3 .750c .563 .556 .957 .001 .667 4 1051 .615
a. Predictors: (Constant), [FIND] , [THOU]
b. Predictors: (Constant), [FIND] , [THOU], [COLL], [FAMI],, [SECU], [INDI],
ECU], [INDI], AGE, EDUCATION, RELIGION, MARITAL STATUS
c. Predictors: (Constant), [FIND] , [THOU], [COLL], [FAMI], Table - 5.7
Anova Table
Model Sum of Squares df Mean Square F Sig.
1
Regression 15.781 2 7.891 3.842 .002b
Residual 2185.195 1064 2.054
Total 2200.977 1066
2 Regression 1236.120 11 112.375 122.873 .000c
A Comparative Study of Individualism Vs Collectivism and its Impact on Indian Youth Culture with Special Reference to Television Commercials (IJIRST/ Volume 1 / Issue 6 / 024)
All rights reserved by www.ijirst.org 150
Residual 964.857 1055 .915
Total 2200.977 1066
3
Regression 1238.563 15 82.571 90.171 .000d
Residual 962.414 1051 .916
Total 2200.977 1066
a. Dependent Variable: CULTURE
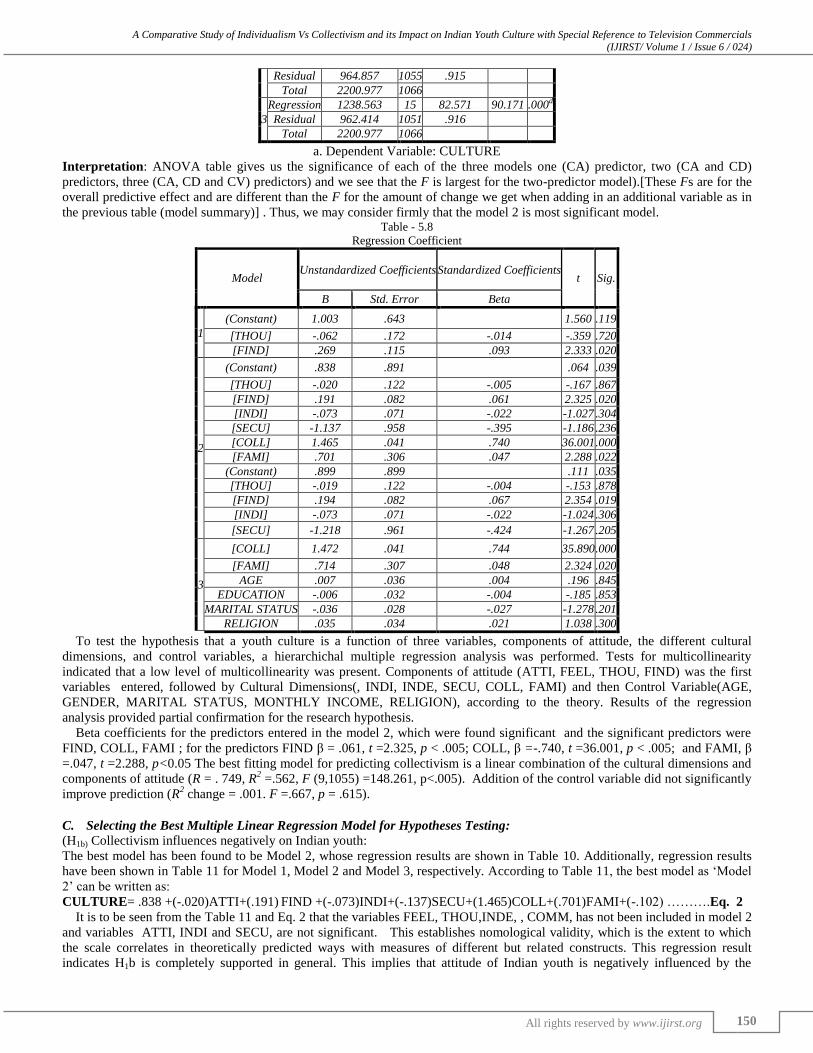
Interpretation: ANOVA table gives us the significance of each of the three models one (CA) predictor, two (CA and CD)
predictors, three (CA, CD and CV) predictors) and we see that the F is largest for the two-predictor model).[These Fs are for the
overall predictive effect and are different than the F for the amount of change we get when adding in an additional variable as in
the previous table (model summary)] . Thus, we may consider firmly that the model 2 is most significant model. Table - 5.8
Regression Coefficient
Model Unstandardized Coefficients Standardized Coefficients
t Sig.
B Std. Error Beta
1
(Constant) 1.003 .643 1.560 .119
[THOU] -.062 .172 -.014 -.359 .720
[FIND] .269 .115 .093 2.333 .020
2
(Constant) .838 .891 .064 .039
[THOU] -.020 .122 -.005 -.167 .867
[FIND] .191 .082 .061 2.325 .020
[INDI] -.073 .071 -.022 -1.027 .304
[SECU] -1.137 .958 -.395 -1.186 .236
[COLL] 1.465 .041 .740 36.001 .000
[FAMI] .701 .306 .047 2.288 .022
(Constant) .899 .899 .111 .035
[THOU] -.019 .122 -.004 -.153 .878
[FIND] .194 .082 .067 2.354 .019
[INDI] -.073 .071 -.022 -1.024 .306
[SECU] -1.218 .961 -.424 -1.267 .205
3
[COLL] 1.472 .041 .744 35.890 .000
[FAMI] .714 .307 .048 2.324 .020
AGE .007 .036 .004 .196 .845
EDUCATION -.006 .032 -.004 -.185 .853
MARITAL STATUS -.036 .028 -.027 -1.278 .201
RELIGION .035 .034 .021 1.038 .300
To test the hypothesis that a youth culture is a function of three variables, components of attitude, the different cultural
dimensions, and control variables, a hierarchichal multiple regression analysis was performed. Tests for multicollinearity
indicated that a low level of multicollinearity was present. Components of attitude (ATTI, FEEL, THOU, FIND) was the first
variables entered, followed by Cultural Dimensions(, INDI, INDE, SECU, COLL, FAMI) and then Control Variable(AGE,
GENDER, MARITAL STATUS, MONTHLY INCOME, RELIGION), according to the theory. Results of the regression
analysis provided partial confirmation for the research hypothesis.
Beta coefficients for the predictors entered in the model 2, which were found significant and the significant predictors were
FIND, COLL, FAMI ; for the predictors FIND β = .061, t =2.325, p < .005; COLL, β =-.740, t =36.001, p < .005; and FAMI, β
=.047, t =2.288, p<0.05 The best fitting model for predicting collectivism is a linear combination of the cultural dimensions and
components of attitude (R = . 749, R2 =.562, F (9,1055) =148.261, p<.005). Addition of the control variable did not significantly
improve prediction (R2 change = .001. F =.667, p = .615).
Selecting the Best Multiple Linear Regression Model for Hypotheses Testing: C.
(H1b) Collectivism influences negatively on Indian youth:
The best model has been found to be Model 2, whose regression results are shown in Table 10. Additionally, regression results
have been shown in Table 11 for Model 1, Model 2 and Model 3, respectively. According to Table 11, the best model as „Model
2‟ can be written as:
CULTURE= .838 +(-.020)ATTI+(.191) FIND +(-.073)INDI+(-.137)SECU+(1.465)COLL+(.701)FAMI+(-.102) ……….Eq. 2
It is to be seen from the Table 11 and Eq. 2 that the variables FEEL, THOU,INDE, , COMM, has not been included in model 2
and variables ATTI, INDI and SECU, are not significant. This establishes nomological validity, which is the extent to which
the scale correlates in theoretically predicted ways with measures of different but related constructs. This regression result
indicates H1b is completely supported in general. This implies that attitude of Indian youth is negatively influenced by the

A Comparative Study of Individualism Vs Collectivism and its Impact on Indian Youth Culture with Special Reference to Television Commercials (IJIRST/ Volume 1 / Issue 6 / 024)
All rights reserved by www.ijirst.org 151
collectivism and Family i.e. Indian Youth does not like to see the concept of family and collectivism in advertisement and they
consider these attributes as influencing their behavior to some extent but not to the attitude.
VI. CONCLUDING REMARK
This is quite notable from this paper that the youth of India and the values and culture of Indian youth is changing. The broad
foundation which was laid by Geert Hofstede about the cultural dimension of India that India is collectivist country, has been
changing. By above study it is noted that Indian culture is changing and so the value dimensions. Geert Hofstede had established
India as collectivist country and he had given the score for the same, mentioning India is collectivist country whereas this study
establishes the fact that India scores high on Individualism because the value dimensions grouped under this dimension i.e.
Independence and Security are significantly and positively impacting on culture Indian youth and so they show positive attitude
towards western advertisements depicting western culture with western values.
Responses were taken very sincerely in the research to ensure participants answered the questions based on their
understanding. Despite these precautions, key limitations in the study are present. These include the lack of correct participant
database, weaknesses associated with cross-sectional surveys and constraints on the depth of information provided in survey
methodology research. A single cross-sectional survey limits this study‟s ability to capture long-term effects and changes
Further research area in cross-cultural advertisement and its impact on Indian youth is interesting and it can be expanded with
the impact of rest of cultural dimensions and the appeals grouped under those dimensions. To truly measure the attitudes of
youth in India at improve the external reliability and generalizability of this research, participants from throughout India should
be considered and either stratified or multistage sampling can be considered. Also, the future research can apply structural
equation modeling which is a technique to effectively include a whole range of standard multivariate analysis methods, including
regression, factor analysis and analysis of variance.
VII. BIBLIOGRAPHY
[1] Albers, N. D. (1994). Relating Hofstede‟s Dimensions of Culture to International Variations in Print Advertisements: A Comparison of Appeals. (1994). Relating Hofstede’s Dimensions of Culture to International Variations in Print Advertisements: .
[2] Albers-Miller, N. a. (1996). Business Advertising Appeals as a Mirror of Cultural Dimensions: A Study of Eleven Countries. Journal o f Advertising, , XXV
(4), pp. 57-70. [3] Albers-Miller, N. D. (1996). Designing Cross-Cultural Advertising Research: A Closer Look at Paired Comparisons. International Marketing Review, , 13
(5), pp. 59-75.
[4] Hofstede, G. H. (1980). Culture’s Consequences: International Differences in Work-related Values. Beverly Hills. [5] Hofstede, G. H. (1983). Dimensions of National Cultures in Fifty Countries and Three Regions.
[6] Hofstede, G. H. (1984). Hofstede‟s Cultural Dimensions: An Independent Validation Using Rokeach‟s Value Survey. Journal of Cross-cultural Psychology
, 15, pp. 417-433. [7] Hofstede, G. H. (1984). National Cultures and Corporate Cultures. In L.A. Samovar& R.E. Porter .
[8] Hofstede, G. H. (2001). Culture’s Consequences: Comparing Values, Behaviors, Institutions, and Organizations across Nations.
[9] Kluckhohn, C. &. (1945). The Concept of Culture. In R. Linton (Eds.), The Science or Man in the World Crisis. New York: Columbia University Press. [10] Kluckhohn, C. (1951). Values and Value Orientations in the Theory of Action. Cambridge: Harvard University Press.
[11] Kluckhohn, F. R. (1961). Variations in Value Orientation. Greenwood Press.
[12] Levitt, T. (1983). “The Globalisation of Markets”,. Harvard Business Review May/Jun. [13] Lutz, R. J. (1985). "Affective and Cognitive Antecedents of Attitude towards the Ad: A conceptual framework".
[14] Mooij, M. D. (2002). Convergence and Divergence in Consumer. Journal of Retailing , 78, pp. 61-69.
[15] Mooij, M. D. (2009). Global Marketing and Advertising. London: Sage Publication. [16] Pollay, R. W. (1983). Measuring the Cultural Values Manifest in Advertising. Current Issues and Research in Advertising , pp. 71-92.
[17] Pollay, R. W. (1990). Advertising and Cultural Values: Reflections in the Distorted Mirro. International Journal of Advertising , 9, pp. 359-372.
[18] Singh Nitish, Z. H. (2005). Analyzing the cultural content of web sites: A cross-national comparision of China, India, Japan,.US. International Marketing Review , 22 (2), pg.
[19] Zikmund, W. G. (1997). Business Research Method. Orlando, Florida.: The Dryden press, Harcourt Brace College Publishers,.
[20] Zhang Young, a. N. (1997). The Inflence of Culture on Advertising Effectveness in China and the Cross-cultural StudyUSA. European Journal of Marketing , 31 (2), pp. 134-149.
[21] Zhang, Y. &. (1996). Matching Advertising Appeals to Culture: The Influence of Product Use Conditions. Journal o f Advertising , 25 (3), pp. 29-46.
[22] Zhang, Y. B. (2004). Modernization and Tradition in an Age of Globalization: Cultural Values in Chinese Television Commercials. Journal of Communication , 54 (1), pp. 156-172.