Embed Size (px)
Citation preview
RC-SAR Vol. 15 - Nº 1 - Pag. 109-142 ISSN: 1138-4891 - Dep. Legal: MA-1436/97
Enviado/Submitted: 8/10/2010Primera Revisión/First revision: 22/12/2011Aceptado/Accepted: 30/1/2012
A COMPARATIVE STUDY OF DIFFICULTIES IN ACCOUNTING PREPARATION AND JUDGEMENT IN AGRICULTURE USING FAIR VALUE AND HISTORICAL COST FOR BIOLOGICAL ASSETS VALUATION*1
ESTUDIO COMPARATIVO DE LAS DIFICULTADES PARA LA REALIZACIóN DE LA CONTABILIDAD Y LA INTERPRETACIóN DE LA INFORMACIóN EN LA AGRICULTURA APLICANDO COSTE HISTóRICO Y VALOR RAZONABLE EN LA VALORACIóN DE LOS ACTIVOS BIOLóGICOS
JOSEP Mª. ARGILÉS BOSCH, Universitat de Barcelona, [email protected]
ANNA SABATA ALIBERCH, Universitat de Vic
JOSEP GARCÍA BLANDÓN, IQS (Faculty of Economics)
ABSTRACTThis paper presents empirical research comparing the accounting difficulties that arise from the use of two valuation methods for biological assets, fair value (FV) and historical cost (HC) accounting, in the agricultural sector. It also compares how reliable each valuation method is in the decision-making process of agents within the sector. By conducting an experiment with students, farmers, and accountants operating in the agricultural sector, we find that they have more difficulties, make larger miscalculations and make poorer judgements with HC accounting than with FV accounting. In-depth interviews uncover flawed accounting practices in the agricultural sector in Spain in order to meet HC accounting requirements. Given the complexities of cost calculation for biological assets and the predominance of small family business units in advanced Western countries, the study concludes that accounting can be more easily applied in the agricultural sector under FV than HC accounting, and that HC conveys a less accurate grasp of the real situation of a farm.
KEY WORDS: fair value, historical cost, biological assets, farm accounting, agriculture.JEL Classification: M40, M41, Q10, Q14.
* The authors are grateful to the Universitat de Barcelona and the Spanish Ministerio de Educación y Ciencia (SEJ2005-04037/ECON) for granting this research, as well as to some students, farmers, accountants, firms and institutions (that prefer to remain anonymous) that agreed to participate in the experiment that made possible this study.
110 J. M. Argilés, A. Sabata y J. García-Blandón
RESUMENEste estudio realiza un investigación empírica comparando las dificultades que se derivan de la utilización del valor razonable (VR) y del coste histórico (CH) en el sector agrícola. Se analiza también la fiabilidad de ambos métodos de valoración para la interpretación de la información y la toma de decisiones por parte de los agentes que actúan en el sector. Mediante un experimento realizado con estudiantes, agricultores y contables que operan en el sector agrícola, se halla que estos tienen más dificultades, cometen mayores errores e interpretan peor la información contable realizada a CH que la realizada a VR. Entrevistas en profundidad con agricultores y contables agrícolas desvelan prácticas contables defectuosas derivadas de la necesidad de aplicar el CH en el sector en España. Dadas las complejidades del cálculo del coste de los activos biológicos y el predominio de pequeñas explotaciones en el sector en los países occidentales avanzados, el estudio concluye que la contabilidad a VR constituye una mejoría de utilización y desarrollo de la contabilidad en el sector que la confeccionada a CH. Asimismo, el CH transmite una peor representación de la situación real de las explotaciones agrícolas.
PALABRAS CLAVE: valor razonable, coste histórico, activos biológicos, contabilidad agrícola, agricultura.Clasificación JEL: M40, M41, Q10, Q14.
Accounting preparation and judgement in agriculture 111
INTRODUCTION
The trend towards the use of fair value (FV) accounting has raised controversial issues, both for practitioners and for academics. The debate is usually concerned with financial instruments. Academics critical of FV argue that its usefulness has not been demonstrated; it is subject to more manipulation, leads to less efficient investment decisions, is not reliable, may induce greater volatility, produces misleading information, and so on. (e.g. Watts, 2003 and 2006; Ball, 2006; Rayman, 2007; Ronen, 2008; Liang and Wen, 2007; Plantin and Sapra, 2008). Proponents argue that FV is an improvement on historical cost (HC) accounting in that it entails lower volatility, contributes to improving firm efficiency, provides stronger signals of financial distress, provides more relevant information and fosters transparency, etc. (e.g. Bleck and Liu, 2007; Gigler et al., 2007; Barlev and Haddad, 2003). Barth and Landsman (1995) conclude that in perfect and complete markets a FV accounting-based balance sheet reflects all value-relevant information. However, in more realistic market settings, management discretion applied to fair valuation can detract from balance sheet and income statement relevance.
Empirical research has mainly focused on relevance and has also been mainly applied to financial instruments. While Nelson (1996), Hann et al. (2007) and Laswad and Baskerville (2007) did not find relevance for FV accounting, Barth (1994), Barth et al. (1996), Bernard et al. (1995) and Danboldt and Rees (2008) did. Further, Barth et al. (1995) found that FV-based earnings and capital are more volatile than HC within a sample of banks.
The IAS 41 introduced FV for all biological assets in agriculture, which entailed a major change from established accounting practices in the sector and brought the debate into the agricultural accounting domain. Most authors are critical of using FV for agriculture. Penttinen et al. (2004) claim that fair valuation would cause unrealistic fluctuations in the net profit of forest enterprises. Herbohn and Herbohn (2006) emphasize the increased volatility, manipulation and subjectivity of reported earnings under this standard. Calculating coefficients of variation for profits, and for gains and losses from timber assets, across eight public companies and five state and territorial government departments, the authors argue that the figures provide an insight into the volatility caused by FV measurement. Dowling and Godfrey (2001) provide data on the preference of HC over FV for a sample of 30 Australian farms. Pricewaterhouse-Coopers (2009) reports 18 forest companies applying FV through discounted cash flows and 4 through market value, while 7 apply HC in a sample of 19 farms (some of which apply multiple methods) from different countries. Elad (2004) complains that the IAS 41 is a major departure from HC; this could signal the demise of the French Plan Comptable Général Agricole (PGCA) model, entailing the recognition of unrealized gains and increasing profit volatility. Additionally, Elad (2007) argues that FV ignores the social and environmental production relations that underlie market exchanges, legitimating unjust socio-economic relations. However, Argilés and Slof (2001) welcome FV measurement for biological assets because it avoids the complexity of calculating their costs for the bulk of the small family
1
112 J. M. Argilés, A. Sabata y J. García-Blandón
farms operating in the sector. Elad (2004) points out that where there is no active market for a biological asset, simplicity is not a merit of FV. Argilés and Slof (2001) state that the IAS 41 conceptual framework has already been widely and successfully implemented in the EU through the Farm Accountancy Data Network (FADN). The FADN has been fulfilling the role of a quasi-standard-setting body in the absence of previous pronouncements on agricultural standards from other authorities (Poppe and Beers, 1996).
Beyond this discussion, no previous research found significant empirical evidence on the appropriateness of either valuation method for the agricultural sector. Tomkins and Grove (1983) comment on the need for accounting research to acquire knowledge of the natural setting in which the accounting is produced, as well as of the behaviour and interactions of agents involved. Agriculture in advanced Western economies is predominantly characterized by the existence of small business units (Schmitt, 1991). According to Allen and Lueck (1998), seasonality and fluctuations from climate and market conditions are the key factors that explain this predominance and prevent farm organization from evolving towards factory processes. These small family farms have neither accounting skills nor resources to accurately perform complex cost calculations that require the existence of joint-cost situations and the typical characteristics of procreation and growth of biological assets. Chittenden et al. (1998) warn about the serious burden on small firms represented by formal procedures, such as record keeping and accounting procedures. Kroll (1987) regretted that the complexity of cost calculation in the French PGCA was an important barrier to its use. Therefore, given the characteristics of the agricultural sector in advanced Western countries, simplicity is a key element for successful implementation and usefulness of accounting in the sector. However, no previous study has tested the simplicity of both valuation methods (HC and FV) for the bulk of farmers and accountants operating in Western countries in the agricultural sector.
The contribution of this paper is to make an empirical comparison of the difficulties faced by farmers and accountants in understanding and using the two valuation methods for biological assets, FV and HC. We also compare the reliability of the two valuation methods in decision-making. We find that FV is friendlier than HC, both for accounts preparation and for enhancing judgement in decision-making. Participants in our experimentation had more difficulties and made more miscalculations in preparing accounts with HC than with FV. They also exercised relatively poorer judgement with HC in comparison to FV, making riskier, less appropriate decisions. In-depth interviews reveal flawed accounting practices in the sector under HC, and a marked preference for FV accounting. However, the main disadvantage of FV is that there are no active markets for some biological assets.
The remainder of the paper is organised as follows: the next section states our hypotheses, the third section describes the research method, the results are explained in fourth section, discussion and in-depth interviews appear in the fifth section, and concluding remarks are in the last section.
Accounting preparation and judgement in agriculture 113
HYPOTHESES
The nature of farming makes any HC-based valuation of biological assets inherently difficult. Biological assets are affected by procreation, growth and death, as well as joint-cost situations. Allocation of costs is subject to arbitrariness and difficulties when biological assets generate offspring or additional biological assets, as well as when the additional biological assets are also used in the enterprise’s own activity. The existence of joint production in biological transformation creates situations in which the relationship between inputs and outputs is ill-defined, leading to complex and arbitrary cost allocation. All these factors entail substantial complexities in cost calculation. Considerable accounting skills and expertise are required to cope with these difficulties.
Allocation of indirect costs is another source of complexity for cost calculation on farms. The agricultural sector is affected by frequent market price fluctuations and random climate factors. Seasonality is also a well-known characteristic of the sector. In addition to costly insurance policies, farmers usually try to manage these significant risks through product diversification. Complex and/or arbitrary criteria must be applied to cost allocation for different products.
FV makes easier not only the mere valuation of biological assets, but also the subsequent preparation and completion of accounts, and more specifically the income calculation for the accounting period. It avoids typical complexities of monitoring the existence of different costs (e.g. LIFO or FIFO valuation techniques), allows for global valuations (for example, of a whole herd), provides greater significance for the figures on financial performance over a given period, etc.
The predominant business units operating in the sector are very small, but also very complex in terms of cost calculation. These difficulties of cost calculation are acute problems for small family households. Farmers usually have no accounting skills (Poppe, 1991; Poppe and Breembroek, 1992). They consider accounting as a mere formal procedure consigned to the bottom end of their priorities (Argilés and Slof, 2003), and focus on technical problems concerning the productive and commercial areas of their business. They can hardly afford fees for skilled and specialised accounting preparation and consultancy to cope with the complexities inherent to their business. They give precedence to allocating resources to other areas of their business. The use of accounting in agriculture is scarce (Mishra et al., 1999): farmers usually do not prepare accounts because, due to the small size of their business, they have no legal obligation to do so.1 Most European farms that do adopt accounting only do so for fiscal purposes (Poppe and Beers, 1996; Sabaté and Enciso, 1997). When they are required to prepare financial statements, they use standardized, poorly skilled and/or low-cost
1 As an example, in Spain only incorporated businesses (sociedades) have the obligation to disclose financial state-ments.
2
114 J. M. Argilés, A. Sabata y J. García-Blandón
accounting services. For most accountants the agricultural sector does not offer an outstanding professional career, either in terms of earnings or professional recognition. Accountants operating in the sector are usually poorly skilled. They are juniors at the start of their careers, go to a large number of clients to perform accurate and reliable cost calculations, or have no specialisation on agricultural accounting. Consequently, accounting is scarcely used and ill developed in the sector.
FV implementation is conditioned on the existence of active markets for assets and the subsequent availability of market-determined prices, a condition that is not fulfilled for certain assets. However, a range of alternative measurements may be applied in these cases (IAS41, paragraphs 18-24 and B27-B31).
We then formulate the following hypothesis:
H1. Given the characteristics and circumstances of agriculture and agents operating in the sector, and assuming the availability of FV measurements, the preparation of accounts entails more difficulties under HC than under FV with respect to problems specific to biological transformation.We can split this hypothesis into the following three:
H.1.1. Valuation of biological assets presents more difficulty under HC than under FV.H.1.2. Completion of accounting, and specifically income calculation for the accounting period, presents more difficulty under HC than under FV.H.1.3. FV accounting provides agents operating in the sector a more meaningful and accessible tool than HC for accounts preparation.
One of the main arguments against FV is volatility. However, it is generally accepted that the HC model fails to accurately reflect the recent past or the situation of the firm at the time of preparing the financial statements, and that the FV model gives rise to more relevant information for the users of financial statements (Herranz and Garcia Osma, 2009). In spite of the controversial issues raised by FV, there is a certain agreement among practitioners and standard-setters that it is more relevant in decision-making (e.g. Chartered Financial Analyst Institute, 2007; IASC, 2000). Barlev and Haddad (2003) argue that, as a consequence of giving priority to reliability and conservatism, HC accounting is a source of irrelevance and obscures the real performance of the firm. They argue that FV accounting increases management efficiency and decreases the principal-agent conflict. Additionally, FV accounting figures provide information that serves the purpose of evaluating potential payments and the risk of default. In general terms, as the authors hold, HC accounting allows the firm to conceal information and manipulate figures, while FV accounting improves them and reflects reality more accurately. More specifically, HC fails to adequately deal with biological transformations of living animals or plants managed by agricultural activity. Its ability to reflect these kinds of processes is limited. Under a transaction-based HC model an entity with biological assets may
Accounting preparation and judgement in agriculture 115
report no revenue until their maturing, harvest and sale. The whole process may take a very long time (perhaps 30 years after planting). Moreover, HC valuation of most biological assets generated and grown in the farm is controversial and subject to complex calculations and arbitrary cost allocation criteria. In contrast, FV recognizes and measures biological growth and transformation using current values and reports changes throughout the whole period. Therefore, it is more able to reflect processes involving biological assets. Additionally, FV measurement provides greater significance in deriving a measure of financial performance or position for a given period, especially for long biological transformations.
There is a well-known phenomenon of data fixation in management accounting: the extent to which decisions become fixated on the output of accounting systems. This means that decision makers display an inability to look behind the labels attached to accounting numbers in order to judge the appropriateness of the information for a given decision (Briers et al., 1997). The characteristics of the agricultural sector mentioned above (small business units, lack of accounting skills by farmers and profile of accountants operating in the sector) may accentuate the disadvantages of HC with respect to FV, to the effect that untrained or unskilled subjects are more exposed to data fixation.
We then formulate the following hypothesis:
H2. Given the characteristics and circumstances of agriculture and agents operating in the sector, and assuming the availability of FV measurements, FV accounting provides better judgement than HC for users and preparers of accounting information.We can split this hypothesis into two:
H.2.1. With respect to HC, FV conveys a more understandable grasp of the real situation of the farm.H.2.2. With respect to HC, FV accounting of biological assets provides more efficient cues to overcome data fixation.
RESEARCH METHOD
An experiment was designed and conducted to test the hypotheses raised in the previous section. Dearman and Shields (2001) and Briers et al. (1997) conducted similar studies to test hypotheses on judgement and data fixation. This section first describes the tasks and procedures, then the methodology employed in data analysis, and lastly the subjects participating in the experiment.
3
116 J. M. Argilés, A. Sabata y J. García-Blandón
3.1. Tasks and procedure
The experimental design consists of performing written exercises on the accounting of biological assets with both valuation methods, FV and HC. Hereafter we refer to them as FV and HC versions. Two different exercises are given to participants. Exercise 1 focuses on accounting preparation, while exercise 2 focuses on judgement.
Exercise 1 involves completing a few simple accounting figures and calculations. It contains data related to the accounting facts of a pig farm: expenses, sales, physical data on growth and procreation, etc. It contains elementary accounting records and incomplete financial statements (balance sheet and profit and loss statement), as well as sheets for responses. In order to avoid complexities of cost allocation, it does not contain different types of products. Participants are asked to indicate the values of biological assets, calculate farm income and give an opinion on the economic situation of the farm. Exercise 2 consists of similar data, but with all calculations and financial statements completed. Participants are simply asked to give an opinion on the economic viability of the farm.
Exercises 1 and 2 are given to participants in both versions: HC and FV. As a result, each participant completes four written responses.
We designed preliminary versions of these exercises, asked colleagues for comments, tested them in a pilot experiment with Master’s students, and then drafted the final versions of exercises 1 and 2 (displayed in the annexes) that we used in our experiment.
Exercises are suited to sessions consisting of a fifteen-minute presentation, followed by fifty minutes for written exercise 1 (in both versions: HC and FV), fifteen minutes for exercise 2 (also in both versions: HC and FV), and a closing speech of five minutes, totalling eighty-five minutes for the whole session. The presentation consists of a brief explanation on HC and FV valuation, focusing on the valuation of biological assets, income calculation and information content for both methods. Usually the presentation and closing speech were followed by a few minutes of participant questions, which slightly lengthened the session. In order to control for a likely learning effect, half of the participants began solving exercise 1 with the FV version, we then collected responses, gave the HC version to participants and collected responses, while the other half of participants did it in reverse order: first the HC version and then FV. The same applied to exercise 2. Participants that began exercise 1 with the FV version, followed in reverse order for exercise 2: first the HC version and then FV.
Accounting preparation and judgement in agriculture 117
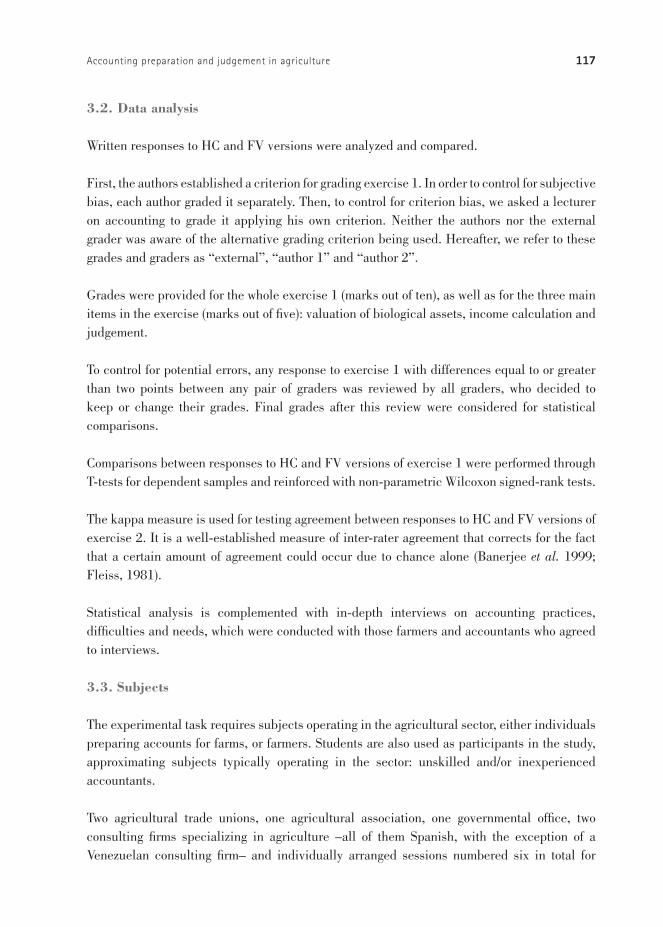
3.2. Data analysis
Written responses to HC and FV versions were analyzed and compared.
First, the authors established a criterion for grading exercise 1. In order to control for subjective bias, each author graded it separately. Then, to control for criterion bias, we asked a lecturer on accounting to grade it applying his own criterion. Neither the authors nor the external grader was aware of the alternative grading criterion being used. Hereafter, we refer to these grades and graders as “external”, “author 1” and “author 2”.
Grades were provided for the whole exercise 1 (marks out of ten), as well as for the three main items in the exercise (marks out of five): valuation of biological assets, income calculation and judgement.
To control for potential errors, any response to exercise 1 with differences equal to or greater than two points between any pair of graders was reviewed by all graders, who decided to keep or change their grades. Final grades after this review were considered for statistical comparisons.
Comparisons between responses to HC and FV versions of exercise 1 were performed through T-tests for dependent samples and reinforced with non-parametric Wilcoxon signed-rank tests.
The kappa measure is used for testing agreement between responses to HC and FV versions of exercise 2. It is a well-established measure of inter-rater agreement that corrects for the fact that a certain amount of agreement could occur due to chance alone (Banerjee et al. 1999; Fleiss, 1981).
Statistical analysis is complemented with in-depth interviews on accounting practices, difficulties and needs, which were conducted with those farmers and accountants who agreed to interviews.
3.3. Subjects
The experimental task requires subjects operating in the agricultural sector, either individuals preparing accounts for farms, or farmers. Students are also used as participants in the study, approximating subjects typically operating in the sector: unskilled and/or inexperienced accountants.
Two agricultural trade unions, one agricultural association, one governmental office, two consulting firms specializing in agriculture –all of them Spanish, with the exception of a Venezuelan consulting firm– and individually arranged sessions numbered six in total for

118 J. M. Argilés, A. Sabata y J. García-Blandón
the two kinds of experimental subjects: farmers and agricultural accountants. We arranged three additional sessions with graduates and Master’s students in business administration, of different nationalities. We conducted all sessions, with the exception of one, which was conducted by a Venezuelan colleague in Venezuela. We trained him and provided detailed written instructions. All sessions were held during 2008.
Table 1 displays data on the number of volunteers who participated in the experiment: a total of 83 subjects completed at least one response form in all sessions. Some subjects did not respond to exercises after the presentation phase of the session, others stopped before the end of the session and did not complete all responses. For example, as can be seen in table 1, there are 18 farmers’ responses to the HC version of exercise 1 with only 16 to the FV version; in addition, there are 38 accountants’ responses to the HC version compared to 39 to the FV version. In the same vein, while 81 participants responded to exercise 1, only 77 responded to exercise 2. The low number of farmers (18) reflects their reluctance to participate and their scarce interest in accounting. The order of responses was not appropriately monitored for 15 participants in exercise 1 and 2 participants in exercise 2, almost all of them in the session in Venezuela.
TABLE 1. NUMBER OF SUBJECTS PARTICIPATING IN THE EXPERIMENT
Students Farmers Accountants Total
Total participants 25 18 40 83
Exercise 1:
Responses for FV version 25 16 39 80
Responses for HC version 25 18 38 81
Order:
1st HC 2nd FV 11 8 13 32
1st FV 2nd HC 13 8 15 36
No data on order 1 2 12 15
Exercise 2:
Responses for FV version 25 16 36 77
Responses for HC version 25 16 36 77
Order:
1st HC 2nd FV 13 7 13 33
1st FV 2nd HC 12 7 23 42
No data on order 0 2 0 2

Accounting preparation and judgement in agriculture 119
RESULTS
Testing for normality and homogeneity of variances between the sub-samples of FV and HC responses lends itself to the use of non-parametric tests for almost all comparisons. Therefore, we include and display non-parametric tests in al tables.
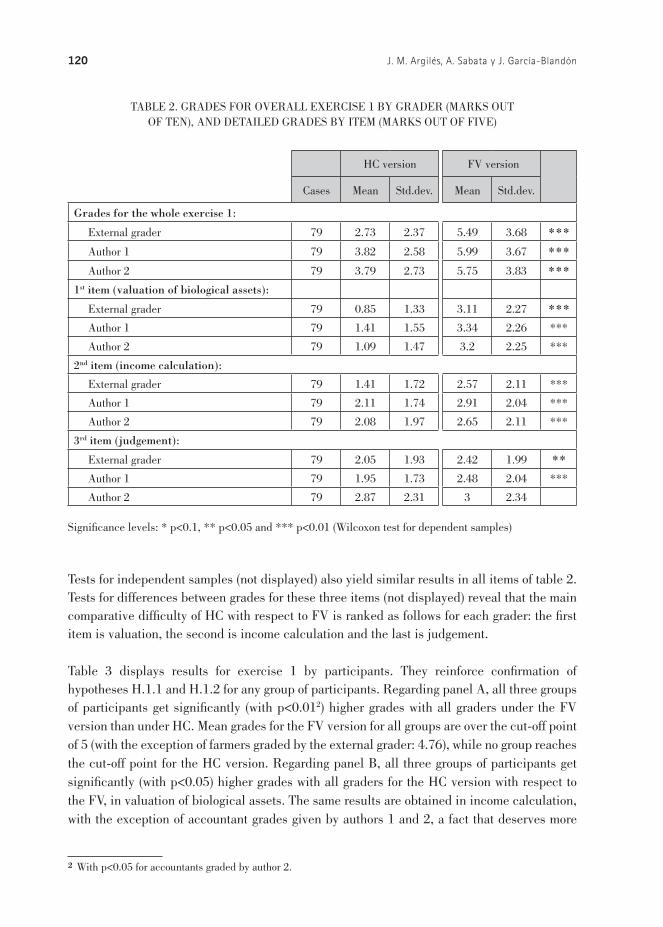
Table 2 displays grade results for FV and HC versions of exercise 1. Results show that participants found important difficulties in performing HC accounting. Grades for the HC version of the whole exercise 1 are substantially under the cut-off point of 5, with a minimum mean grade of 2.73 by the external grader compared to a maximum of 3.82 by author 1. However, participants on average passed the above cut-off point with the FV version, ranging from a minimum mean grade of 5.49 by the external reviewer to a maximum of 5.99 points by author 1. All parametric and non-parametric tests find significant differences, with p<0.01, between HC and FV versions for any of the three graders. Differences are significant irrespective of the criterion or subjective assessment applied. In spite of the fact that there are significant differences (p<0.01) between grades from the authors and the external grader, as a consequence of the different criteria used, all grade the FV version significantly higher than the HC, strongly confirming the overall hypothesis H1. The intraclass correlations reveal consistency between the three graders. For the HC version of exercise 1 the estimated standard deviation of grader effect is 0.5483, while the estimated standard deviation within grader is 2.5682. Consequently, the corresponding intraclass correlation is 0.0436, thus indicating that the proportion of all variance between graders is very small. Results for the FV version reveal even more consistency, with its intraclass correlation truncated at zero, as the estimated standard deviation of grader effect is also truncated at zero, and the estimated standard deviation within grader is 3.7375.
Table 2 also displays results for the three different items making up the whole exercise. 1. All graders grade the valuation and the income calculation items under the FV version significantly higher, with p<0.01, than under HC, confirming specific hypotheses H.1.1 and H.1.2, respectively. Most grades for the judgement item are significantly higher for the FV version than for the HC (with p<0.05 for the external grader and with p<0.01 for author 1), confirming hypothesis H.2.1. However, differences are not significant, with p<0.1, for author 2, suggesting the existence of subjective bias in the assessment of judgement.
4
120 J. M. Argilés, A. Sabata y J. García-Blandón
TABLE 2. GRADES FOR OVERALL EXERCISE 1 BY GRADER (MARKS OUT OF TEN), AND DETAILED GRADES BY ITEM (MARKS OUT OF FIVE)
HC version FV version
Cases Mean Std.dev. Mean Std.dev.
Grades for the whole exercise 1:
External grader 79 2.73 2.37 5.49 3.68 ***
Author 1 79 3.82 2.58 5.99 3.67 ***
Author 2 79 3.79 2.73 5.75 3.83 ***
1st item (valuation of biological assets):
External grader 79 0.85 1.33 3.11 2.27 ***
Author 1 79 1.41 1.55 3.34 2.26 ***
Author 2 79 1.09 1.47 3.2 2.25 ***
2nd item (income calculation):
External grader 79 1.41 1.72 2.57 2.11 ***
Author 1 79 2.11 1.74 2.91 2.04 ***
Author 2 79 2.08 1.97 2.65 2.11 ***
3rd item (judgement):
External grader 79 2.05 1.93 2.42 1.99 **
Author 1 79 1.95 1.73 2.48 2.04 ***
Author 2 79 2.87 2.31 3 2.34
Significance levels: * p<0.1, ** p<0.05 and *** p<0.01 (Wilcoxon test for dependent samples)
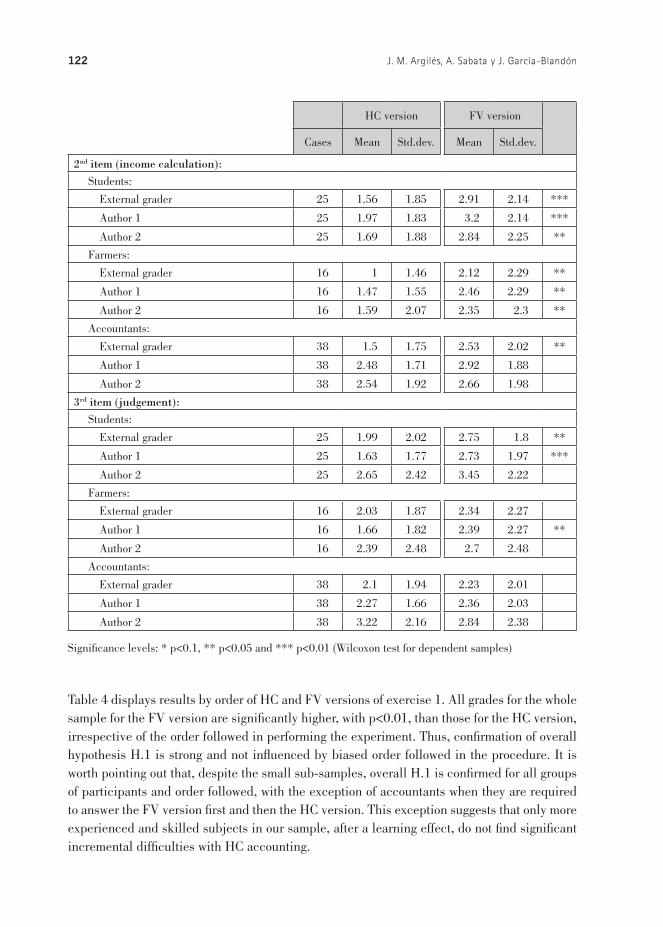
Tests for independent samples (not displayed) also yield similar results in all items of table 2. Tests for differences between grades for these three items (not displayed) reveal that the main comparative difficulty of HC with respect to FV is ranked as follows for each grader: the first item is valuation, the second is income calculation and the last is judgement.
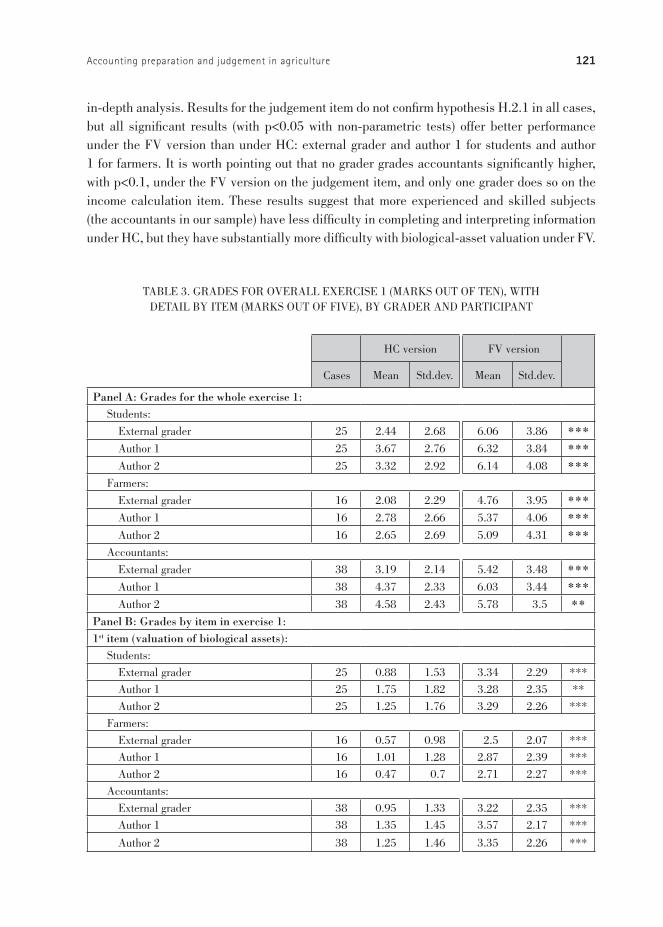
Table 3 displays results for exercise 1 by participants. They reinforce confirmation of hypotheses H.1.1 and H.1.2 for any group of participants. Regarding panel A, all three groups of participants get significantly (with p<0.012) higher grades with all graders under the FV version than under HC. Mean grades for the FV version for all groups are over the cut-off point of 5 (with the exception of farmers graded by the external grader: 4.76), while no group reaches the cut-off point for the HC version. Regarding panel B, all three groups of participants get significantly (with p<0.05) higher grades with all graders for the HC version with respect to the FV, in valuation of biological assets. The same results are obtained in income calculation, with the exception of accountant grades given by authors 1 and 2, a fact that deserves more
2 With p<0.05 for accountants graded by author 2.
Accounting preparation and judgement in agriculture 121
in-depth analysis. Results for the judgement item do not confirm hypothesis H.2.1 in all cases, but all significant results (with p<0.05 with non-parametric tests) offer better performance under the FV version than under HC: external grader and author 1 for students and author 1 for farmers. It is worth pointing out that no grader grades accountants significantly higher, with p<0.1, under the FV version on the judgement item, and only one grader does so on the income calculation item. These results suggest that more experienced and skilled subjects (the accountants in our sample) have less difficulty in completing and interpreting information under HC, but they have substantially more difficulty with biological-asset valuation under FV.
TABLE 3. GRADES FOR OVERALL EXERCISE 1 (MARKS OUT OF TEN), WITH DETAIL BY ITEM (MARKS OUT OF FIVE), BY GRADER AND PARTICIPANT
HC version FV version
Cases Mean Std.dev. Mean Std.dev.
Panel A: Grades for the whole exercise 1: Students:
External grader 25 2.44 2.68 6.06 3.86 *** Author 1 25 3.67 2.76 6.32 3.84 *** Author 2 25 3.32 2.92 6.14 4.08 ***
Farmers:
External grader 16 2.08 2.29 4.76 3.95 *** Author 1 16 2.78 2.66 5.37 4.06 *** Author 2 16 2.65 2.69 5.09 4.31 ***
Accountants:
External grader 38 3.19 2.14 5.42 3.48 *** Author 1 38 4.37 2.33 6.03 3.44 *** Author 2 38 4.58 2.43 5.78 3.5 **
Panel B: Grades by item in exercise 1:1st item (valuation of biological assets):
Students: External grader 25 0.88 1.53 3.34 2.29 *** Author 1 25 1.75 1.82 3.28 2.35 ** Author 2 25 1.25 1.76 3.29 2.26 ***
Farmers: External grader 16 0.57 0.98 2.5 2.07 *** Author 1 16 1.01 1.28 2.87 2.39 *** Author 2 16 0.47 0.7 2.71 2.27 ***
Accountants: External grader 38 0.95 1.33 3.22 2.35 *** Author 1 38 1.35 1.45 3.57 2.17 ***
Author 2 38 1.25 1.46 3.35 2.26 ***
122 J. M. Argilés, A. Sabata y J. García-Blandón
HC version FV version
Cases Mean Std.dev. Mean Std.dev.
2nd item (income calculation): Students:
External grader 25 1.56 1.85 2.91 2.14 ***
Author 1 25 1.97 1.83 3.2 2.14 ***
Author 2 25 1.69 1.88 2.84 2.25 **
Farmers:
External grader 16 1 1.46 2.12 2.29 **
Author 1 16 1.47 1.55 2.46 2.29 **
Author 2 16 1.59 2.07 2.35 2.3 **
Accountants:
External grader 38 1.5 1.75 2.53 2.02 **
Author 1 38 2.48 1.71 2.92 1.88
Author 2 38 2.54 1.92 2.66 1.98
3rd item (judgement): Students:
External grader 25 1.99 2.02 2.75 1.8 **
Author 1 25 1.63 1.77 2.73 1.97 ***
Author 2 25 2.65 2.42 3.45 2.22
Farmers:
External grader 16 2.03 1.87 2.34 2.27
Author 1 16 1.66 1.82 2.39 2.27 **
Author 2 16 2.39 2.48 2.7 2.48
Accountants:
External grader 38 2.1 1.94 2.23 2.01
Author 1 38 2.27 1.66 2.36 2.03
Author 2 38 3.22 2.16 2.84 2.38
Significance levels: * p<0.1, ** p<0.05 and *** p<0.01 (Wilcoxon test for dependent samples)
Table 4 displays results by order of HC and FV versions of exercise 1. All grades for the whole sample for the FV version are significantly higher, with p<0.01, than those for the HC version, irrespective of the order followed in performing the experiment. Thus, confirmation of overall hypothesis H.1 is strong and not influenced by biased order followed in the procedure. It is worth pointing out that, despite the small sub-samples, overall H.1 is confirmed for all groups of participants and order followed, with the exception of accountants when they are required to answer the FV version first and then the HC version. This exception suggests that only more experienced and skilled subjects in our sample, after a learning effect, do not find significant incremental difficulties with HC accounting.

Accounting preparation and judgement in agriculture 123
TABLE 4. GRADES FOR OVERALL EXERCISE 1 (MARKS OUT OF TEN) BY ORDER, WITH DETAIL BY GRADER AND PARTICIPANT.
HC version FV version
Cases Mean Std.dev. Mean Std.dev.
Panel A: 1st HC - 2nd FV
Grades for the whole sample: External grader 30 2.25 2.27 5.37 3.81 *** Author 1 30 3.23 2.68 5.8 3.87 *** Author 2 30 3.21 2.78 5.53 4.1 ***
Grades for students: External grader 11 2.97 3.03 5.97 3.9 ** Author 1 11 4.02 3.13 6.27 3.95 * Author 2 11 3.75 3.18 6.11 4.12 *
Grades for Farmers: External grader 6 1.66 2.02 5.37 4.15 ** Author 1 6 2.58 3.2 5.58 4.72 ** Author 2 6 2.38 2.7 5.25 5.1 **
Grades for Accountants:
External grader 13 1.9 1.54 4.86 3.82 *** Author 1 13 2.86 2.01 5.5 3.69 *** Author 2 13 3.14 2.57 5.17 3.88 **
Panel B: 1st FV - 2nd HCGrades for the whole sample:
External grader 35 2.65 2.55 5.15 3.66 *** Author 1 35 3.7 2.59 5.78 3.53 *** Author 2 35 3.62 2.83 5.52 3.67 ***
Grades for students: External grader 13 1.75 2.27 6.13 4.14 *** Author 1 13 3.11 2.39 6.3 4.05 ** Author 2 13 2.7 2.66 6.06 4.36 **
Grades for farmers: External grader 8 1.68 2.37 3 3.09 ** Author 1 8 2.37 2.48 4.06 3.36 * Author 2 8 2.15 2.52 3.73 3.49 **
Grades for accountants: External grader 14 4.03 2.4 5.46 3.18
Author 1 14 5 2.39 6.28 3.01
Author 2 14 5.31 2.41 6.02 2.94
Significance levels: * p<0.1, ** p<0.05 and *** p<0.01 (Wilcoxon test for dependent samples)
124 J. M. Argilés, A. Sabata y J. García-Blandón
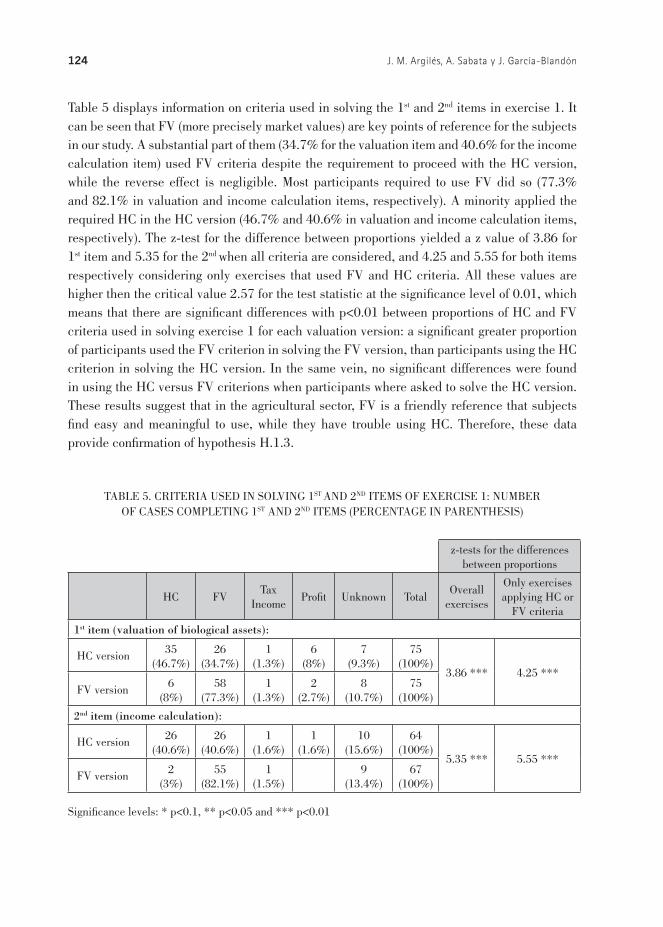
Table 5 displays information on criteria used in solving the 1st and 2nd items in exercise 1. It can be seen that FV (more precisely market values) are key points of reference for the subjects in our study. A substantial part of them (34.7% for the valuation item and 40.6% for the income calculation item) used FV criteria despite the requirement to proceed with the HC version, while the reverse effect is negligible. Most participants required to use FV did so (77.3% and 82.1% in valuation and income calculation items, respectively). A minority applied the required HC in the HC version (46.7% and 40.6% in valuation and income calculation items, respectively). The z-test for the difference between proportions yielded a z value of 3.86 for 1st item and 5.35 for the 2nd when all criteria are considered, and 4.25 and 5.55 for both items respectively considering only exercises that used FV and HC criteria. All these values are higher then the critical value 2.57 for the test statistic at the significance level of 0.01, which means that there are significant differences with p<0.01 between proportions of HC and FV criteria used in solving exercise 1 for each valuation version: a significant greater proportion of participants used the FV criterion in solving the FV version, than participants using the HC criterion in solving the HC version. In the same vein, no significant differences were found in using the HC versus FV criterions when participants where asked to solve the HC version. These results suggest that in the agricultural sector, FV is a friendly reference that subjects find easy and meaningful to use, while they have trouble using HC. Therefore, these data provide confirmation of hypothesis H.1.3.
TABLE 5. CRITERIA USED IN SOLVING 1ST AND 2ND ITEMS OF EXERCISE 1: NUMBER OF CASES COMPLETING 1ST AND 2ND ITEMS (PERCENTAGE IN PARENTHESIS)
z-tests for the differences between proportions
HC FVTax
IncomeProfit Unknown Total
Overall exercises
Only exercises applying HC or
FV criteria
1st item (valuation of biological assets):
HC version 35 (46.7%)
26 (34.7%)
1 (1.3%)
6 (8%)
7 (9.3%)
75 (100%)
3.86 *** 4.25 *** FV version 6
(8%)58
(77.3%)1
(1.3%)2
(2.7%)8
(10.7%)75
(100%)
2nd item (income calculation):
HC version 26 (40.6%)
26 (40.6%)
1 (1.6%)
1 (1.6%)
10 (15.6%)
64 (100%)
5.35 *** 5.55 *** FV version 2
(3%)55
(82.1%)1
(1.5%)9
(13.4%)67
(100%)
Significance levels: * p<0.1, ** p<0.05 and *** p<0.01
Accounting preparation and judgement in agriculture 125
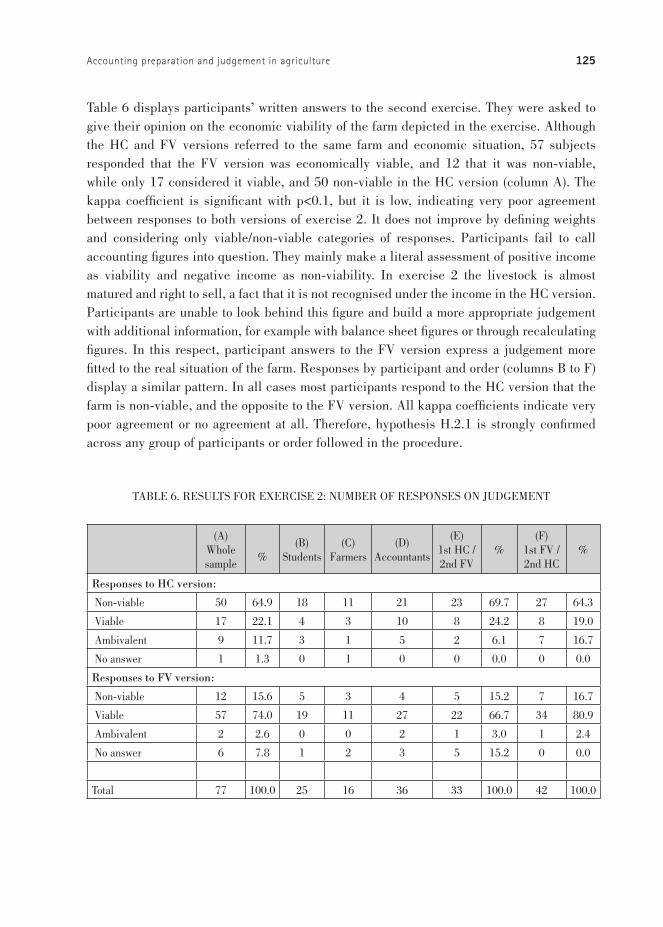
Table 6 displays participants’ written answers to the second exercise. They were asked to give their opinion on the economic viability of the farm depicted in the exercise. Although the HC and FV versions referred to the same farm and economic situation, 57 subjects responded that the FV version was economically viable, and 12 that it was non-viable, while only 17 considered it viable, and 50 non-viable in the HC version (column A). The kappa coefficient is significant with p<0.1, but it is low, indicating very poor agreement between responses to both versions of exercise 2. It does not improve by defining weights and considering only viable/non-viable categories of responses. Participants fail to call accounting figures into question. They mainly make a literal assessment of positive income as viability and negative income as non-viability. In exercise 2 the livestock is almost matured and right to sell, a fact that it is not recognised under the income in the HC version. Participants are unable to look behind this figure and build a more appropriate judgement with additional information, for example with balance sheet figures or through recalculating figures. In this respect, participant answers to the FV version express a judgement more fitted to the real situation of the farm. Responses by participant and order (columns B to F) display a similar pattern. In all cases most participants respond to the HC version that the farm is non-viable, and the opposite to the FV version. All kappa coefficients indicate very poor agreement or no agreement at all. Therefore, hypothesis H.2.1 is strongly confirmed across any group of participants or order followed in the procedure.
TABLE 6. RESULTS FOR EXERCISE 2: NUMBER OF RESPONSES ON JUDGEMENT
(A)
Whole sample
%(B)
Students(C)
Farmers(D)
Accountants
(E)1st HC / 2nd FV
%(F)
1st FV / 2nd HC
%
Responses to HC version:
Non-viable 50 64.9 18 11 21 23 69.7 27 64.3
Viable 17 22.1 4 3 10 8 24.2 8 19.0
Ambivalent 9 11.7 3 1 5 2 6.1 7 16.7
No answer 1 1.3 0 1 0 0 0.0 0 0.0
Responses to FV version:
Non-viable 12 15.6 5 3 4 5 15.2 7 16.7
Viable 57 74.0 19 11 27 22 66.7 34 80.9
Ambivalent 2 2.6 0 0 2 1 3.0 1 2.4
No answer 6 7.8 1 2 3 5 15.2 0 0.0
Total 77 100.0 25 16 36 33 100.0 42 100.0

126 J. M. Argilés, A. Sabata y J. García-Blandón
(A)
Whole sample
%(B)
Students(C)
Farmers(D)
Accountants
(E)1st HC / 2nd FV
%(F)
1st FV / 2nd HC
%
kappa (SD) with default weights
0.0766 *
(0.0497)
0.0196(0.0825)
0.234 **
(0.1125)
0.343(0.073)
0.005(0.0771)
0.0926 *
(0.0644)
kappa (SD) defining weights1
0.0693(0.0571)
-0.0316(0.0927)
0.2000 *
(0.1272)
0.0734(0.0841)
-0.0251(0.0907)
0.1119 *
(0.0714)
kappa (SD) considering only viable/non-viable
0.0866 *
(0.0645)
-0.0123(0.1023)
0.1651(0.1527)
0.1256 *(0.0951)
0.0178(0.0978)
0.1260 *
(0.0833)
Significance levels: * p<0.1, ** p<0.05 and *** p<0.01
Notes:1. Weights defined with non-viable and viable as opponents, and ambivalent and /no answer as equivalents in the middle term:
Non-viable Viable Ambivalent No answer
Non-viable 1
Viable 0 1
Ambivalent 0.5 0.5 1
No answer 0.5 0.5 0 1
Column E displays results for the sub-sample in which the HC version of exercise 2 was delivered in the first instance and then the FV version, while column F displays results for the reverse order. When there is no previous information, 69.7% of participants respond to the HC version that the farm is non-viable and 6.1% provide an ambivalent judgement (column E), but when participants had previously responded to the FV version, the judgement of non-viability for the HC version decreases to 64.3% and 16.7% of responses call the income figure into question providing an ambivalent answer (column F). A plausible explanation for this change is that previous FV-based information guided participants towards a more appropriate judgement. On the other hand, when the FV version is delivered in the first instance, 80.9% of participants respond to this version that the farm is viable (column F). However with the reverse order, prior analysis of HC-based information leads to confusion in the FV judgment, to the extent that responses of viability to the FV version decrease to 66.7%, and 15.2% are so confused that they are unable to provide any judgement (column E). Therefore, these results confirm hypothesis H.2.2. Non-significant kappa coefficients, with p<0.1 in column E, indicate no agreement between judgement under the two valuation methods. When judgement for the HC version is preceded by FV-based information, all kappa coefficients indicate a significant agreement beyond chance with p<0.1 (column F), although it is very poor. This slight improvement in agreement indicates the difficulties of overcoming data fixation, but it also suggests that FV provides certain cues to do so, reinforcing confirmation of hypothesis H.2.2.
Accounting preparation and judgement in agriculture 127
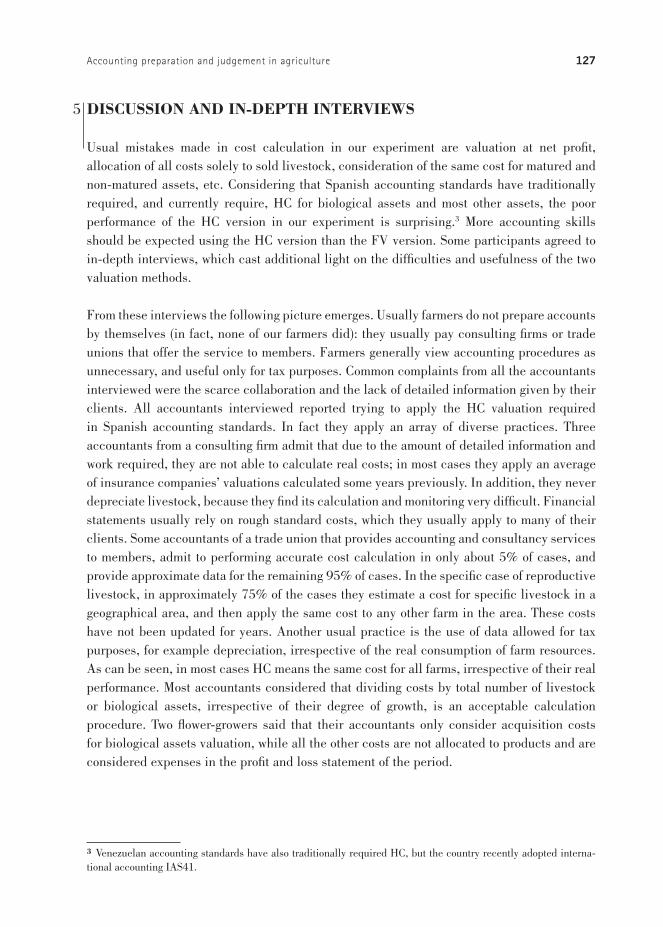
DISCUSSION AND IN-DEPTH INTERVIEWS
Usual mistakes made in cost calculation in our experiment are valuation at net profit, allocation of all costs solely to sold livestock, consideration of the same cost for matured and non-matured assets, etc. Considering that Spanish accounting standards have traditionally required, and currently require, HC for biological assets and most other assets, the poor performance of the HC version in our experiment is surprising.3 More accounting skills should be expected using the HC version than the FV version. Some participants agreed to in-depth interviews, which cast additional light on the difficulties and usefulness of the two valuation methods.
From these interviews the following picture emerges. Usually farmers do not prepare accounts by themselves (in fact, none of our farmers did): they usually pay consulting firms or trade unions that offer the service to members. Farmers generally view accounting procedures as unnecessary, and useful only for tax purposes. Common complaints from all the accountants interviewed were the scarce collaboration and the lack of detailed information given by their clients. All accountants interviewed reported trying to apply the HC valuation required in Spanish accounting standards. In fact they apply an array of diverse practices. Three accountants from a consulting firm admit that due to the amount of detailed information and work required, they are not able to calculate real costs; in most cases they apply an average of insurance companies’ valuations calculated some years previously. In addition, they never depreciate livestock, because they find its calculation and monitoring very difficult. Financial statements usually rely on rough standard costs, which they usually apply to many of their clients. Some accountants of a trade union that provides accounting and consultancy services to members, admit to performing accurate cost calculation in only about 5% of cases, and provide approximate data for the remaining 95% of cases. In the specific case of reproductive livestock, in approximately 75% of the cases they estimate a cost for specific livestock in a geographical area, and then apply the same cost to any other farm in the area. These costs have not been updated for years. Another usual practice is the use of data allowed for tax purposes, for example depreciation, irrespective of the real consumption of farm resources. As can be seen, in most cases HC means the same cost for all farms, irrespective of their real performance. Most accountants considered that dividing costs by total number of livestock or biological assets, irrespective of their degree of growth, is an acceptable calculation procedure. Two flower-growers said that their accountants only consider acquisition costs for biological assets valuation, while all the other costs are not allocated to products and are considered expenses in the profit and loss statement of the period.
3 Venezuelan accounting standards have also traditionally required HC, but the country recently adopted interna-tional accounting IAS41.
5

128 J. M. Argilés, A. Sabata y J. García-Blandón
Many farms that attempt to apply (or disclose) HC valuations ultimately rely on market values. For example, in some cases the accountants admitted to calculating HC through market price minus the percentage applied in the Spanish tax procedure to get the profit for tax calculations.4 One of the accountants argued that applying the market price is the simplest and most efficient procedure for valuation, because it is seldom higher than cost in agriculture.
Therefore, a great deal of flawed accounting practices are applied in the sector. HC is the valuation method indicated in Spanish accounting standards, but it is defectively applied. Consequently, it is not surprising that even accountants get low grades in the experiment in exercises using the HC version.
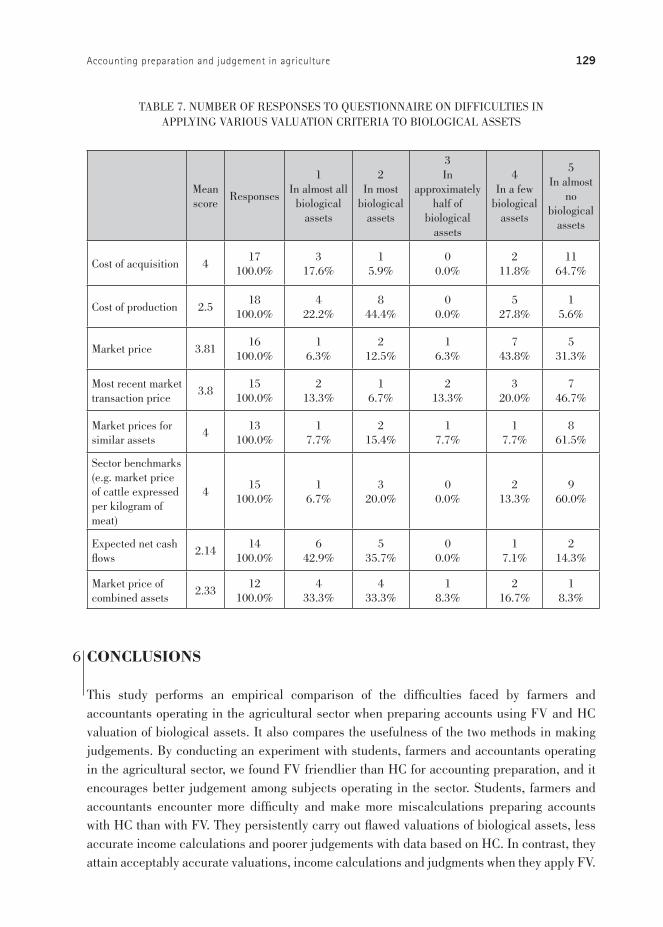
We asked interviewees to complete a questionnaire on their perceived difficulties in applying various valuation criteria for biological assets, using a Likert scale with five ordered response levels from 1 (difficulties in almost all biological assets) to 5 (difficulties in almost no biological assets). Results displayed in table 7 reveal that cost of production is perceived as difficult to calculate for most biological assets, together with expected net cash flows and the market price of combined assets. Acquisition cost, market prices for similar assets and sector benchmarks are perceived as the easiest valuation criteria. Most respondents do not find difficulties in applying market price and most recent market transaction prices for most of their biological assets. The kappa coefficient between HC production and market price is low (0.111 with standard error 0.115) and non-significant with p<0.1, indicating that there is no agreement between perception of difficulties for the two valuation criteria. That is, according to participants’ responses, HC-based cost of production is significantly more difficult than the FV valuation of biological assets. However, given the low number of responses and sample representation bias, any statistical inference should be drawn cautiously on this point.
4 As mentioned, in Spain only incorporated businesses (sociedades) have the obligation to disclose financial state-ments. Most farms, as well as most small businesses in other sectors, determine their taxes on the basis of a hypo-thetical profit calculated by means of a standard percentage of sales, previously specified by the Spanish Ministry. This procedure is called Estimación Objetiva Singular. Only when sales exceed a certain level is it necessary to determine a direct estimation of earnings through recorded revenues and expenses.
Accounting preparation and judgement in agriculture 129
TABLE 7. NUMBER OF RESPONSES TO QUESTIONNAIRE ON DIFFICULTIES IN APPLYING VARIOUS VALUATION CRITERIA TO BIOLOGICAL ASSETS
Mean score
Responses
1In almost all
biological assets
2In most
biological assets
3In
approximately half of
biological assets
4In a few
biological assets
5In almost
no biological
assets
Cost of acquisition 417
100.0%3
17.6%1
5.9%0
0.0%2
11.8%11
64.7%
Cost of production 2.518
100.0%4
22.2%8
44.4%0
0.0%5
27.8%1
5.6%
Market price 3.8116
100.0%1
6.3%2
12.5%1
6.3%7
43.8%5
31.3%
Most recent market transaction price
3.815
100.0%2
13.3%1
6.7%2
13.3%3
20.0%7
46.7%
Market prices for similar assets
413
100.0%1
7.7%2
15.4%1
7.7%1
7.7%8
61.5%
Sector benchmarks (e.g. market price of cattle expressed per kilogram of meat)
415
100.0%1
6.7%3
20.0%0
0.0%2
13.3%9
60.0%
Expected net cash flows
2.1414
100.0%6
42.9%5
35.7%0
0.0%1
7.1%2
14.3%
Market price of combined assets
2.3312
100.0%4
33.3%4
33.3%1
8.3%2
16.7%1
8.3%
CONCLUSIONS
This study performs an empirical comparison of the difficulties faced by farmers and accountants operating in the agricultural sector when preparing accounts using FV and HC valuation of biological assets. It also compares the usefulness of the two methods in making judgements. By conducting an experiment with students, farmers and accountants operating in the agricultural sector, we found FV friendlier than HC for accounting preparation, and it encourages better judgement among subjects operating in the sector. Students, farmers and accountants encounter more difficulty and make more miscalculations preparing accounts with HC than with FV. They persistently carry out flawed valuations of biological assets, less accurate income calculations and poorer judgements with data based on HC. In contrast, they attain acceptably accurate valuations, income calculations and judgments when they apply FV.
6
130 J. M. Argilés, A. Sabata y J. García-Blandón
Only more skilled and experienced participants took advantage of a learning effect to attain similar performance with HC and FV methods. FV is a more meaningful point of reference than HC for subjects operating in the sector. Results are robust and not influenced by bias in criterion evaluation, subjective assessment, dominance of a certain group of participants or the order applied in the experimental procedure.
Our research also uncovers rough practices in cost calculation. Agriculture is usually characterized by the predominance of small family business units in advanced Western countries, while product diversity, growth, procreation, joint-cost situations, etc. entail considerable complexities in cost calculation. Most farms can neither afford the cost of full-time experienced accountants nor pay for advanced consulting and accounting services. In this situation HC cannot be expected to be as reliable and relevant as FV. Given these characteristics, FV is a simpler, friendlier, more useful tool than HC for the spread of accounting throughout the sector. Our results lend credence to this preference shown by subjects operating in the sector. FV can be more easily applied, produces fewer mistakes, is more understandable and encourages better judgements. Given the characteristics of subjects operating in the sector, HC conveys a less accurate grasp of the real situation of the farm and provides no efficient cues to overcome data fixation. This comparatively entails greater risk of sub-optimal decision-making.
The main disadvantage of FV is that there are no active markets for some biological assets. Elad and Herbohn (2011) state that some accountants have voiced concern over the applicability of the FV model, particularly to some biological assets in developing countries with inactive markets. Moreover, the IASB (2007) recognized the difficulties of applying FV in inactive markets and developing countries, and admitted the use of HC for small and medium-sized entities. However, when market values are available, it is worth making use of their advantages. It would also be useful to implement simple rules of thumb to apply market values when they are not clearly known. For example, a time-based calculation can be easily applied in the case of certain non-matured biological assets for which active markets only exist in the case of matured assets, as is often the case for livestock or in the forest industry. In the EU the FADN is successfully applying a FV-based model for most agricultural production, and it fulfils the role of a practical and useful accounting guide for agricultural holdings, and specifically for the predominant small family business units operating in the sector. Farmers and accountants participating in our research reveal that HC valuations for produced biological assets are more difficult to apply than most market-based values. Our research focuses on livestock farms, and specifically pig farms. Most of our findings are generalizable to other products with active markets. However, more research is needed with other types of agricultural production and wider samples.

Accounting preparation and judgement in agriculture 131
REFERENCES
Allen, D.W. and Lueck, D. (1998). ‘The nature of the farm’. Journal of Law and Economics, XLI (2): 343-386.
Argilés, J.M. and Slof, J. (2001). ‘New opportunities for farm accounting’. European Accounting Review, 10 (2): 361-383.
Argilés, J.M. and Slof, J. (2003). ‘The use of financial accounting information and firm performance: an empirical quantification for farms’. Accounting and Business Research, 33 (4): 251-273.
Ball, R. (2006). ‘International Financial Reporting Standards (IFRS): pros and cons for investors’. Accounting and Business Research, 36 (special issue): 5-27.
Banerjee, M., Capozzoli, M., McSweeney, L. and Sinha, D. (1999). ‘Beyond kappa: a review of interrater agreement measures’. Canadian Journal of Statistics, 27 (1): 3-23.
Barlev, B. and Haddad, J.R. (2003). ‘Fair value accounting and the management of the firm’. Critical Perspectives on Accounting, 14: 383-415.
Barth, M.E. (1994). ‘Fair value accounting: evidence from investment securities and the market valuation of banks’. Accounting Review, 69 (1): 1-25.
Barth, M.E. and Landsman, W.R. (1995). ‘Fundamental issues related to using fair value accounting for financial reporting’. Accounting Horizons, 9 (4): 97-107.
Barth, M.E., Landsman, W.R. and Whalen, J.M., ‘Fair value accounting: effects on banks’ earnings volatility, regulatory capital, and value of contractual cash flows’. Journal of Banking and Finance, 19 (3-4), 1995.
Barth, M.E., Landsman, W.R. and Whalen, J.M. (1995). ‘Fair value accounting: effects on banks’ earnings volatility, regulatory capital, and value of contractual cash flows’. Journal of Banking and Finance, 19 (3-4): 577-605.
Barth, M.E., Beaver, W.H. and Landsman, W.R. (1996). ‘Value-relevance of banks’ fair value disclosures under SFAS nº 107’. Accounting Review, 71 (4): 513-537.
Bernard, V., Merton, R. and Palepu, K. (1995). ‘Mark-to-market accounting for banks and thrifts: lessons from the Danish experience’. Journal of Accounting Research, 33 (1): 1-32.
Bleck, A. and Liu, X. (2007). ‘Market transparency and the accounting regime’. Journal of Accounting Research, 45 (2): 229-256.
Briers, M., Luckett, P. and Chow, Ch. (1997). ‘Data fixation and the use of traditional versus activity-based costing systems’. Abacus, 33 (1): 1-20.
Chartered Financial Analyst Institute, (2007). A comprehensive business reporting model: financial reporting for investors. http://www.cfapubs.org/doi/ pdf/10.2469/ccb.v2007.n6.4818
Chittenden, F., Poutziouris, P. and Mukhtar, S.M. (1998). ‘Small firms and the ISO 9000 approach to quality management’. International Small Business Journal, 17 (1): 69-84.
Danbolt, J. and Rees, W. (2008). ‘An experiment in fair value accounting: UK investment vehicles’. European Accounting Review, 17 (2): 271-303.
132 J. M. Argilés, A. Sabata y J. García-Blandón
Dearman, D.T. and Shields, M.C. (2001). ‘Cost knowledge and cost-based judgement performance’. Journal of Management Accounting Research, 13: 1-18.
Dowling, C. and Godfrey, J. (2001). ‘AASB 1037 sows the seeds of change: a survey of SGARA measurement methods’. Australian Accounting Review, 11 (1): 45-51.
Elad, Ch. (2004). ‘Fair value accounting in the agricultural sector: some implications for the international accounting harmonization’. European Accounting Review, 13 (4): 621-641.
Elad, Ch. (2007). ‘Fair value accounting and fair trade: an analysis of the role of International Accounting Standard Nº. 41 in social conflict’. Socio-Economic Review, 5: 755-777.
Elad, Ch. and Herbohn, K. (2011). Implementing fair value accounting in the agricultural sector. Edinburgh: The Institute of Chartered Accountants of Scotland.
Fleiss, J.L. (1981). Statistical methods for rates and proportions. John Wiley & Sons, Toronto.Gigler, F. Kanodia, Ch. and Venugopalan, R. (2007). ‘Assessing the information content of
market-to-market accounting with mixed attributes: the case of cash flow hedges’. Journal of Accounting Research, 45 (2): 257-276.
Hann, R.N., Heflin, F. and Subramanayam, K.R. (2007). ‘Fair-value pension accounting’. Journal of Accounting and Economics, 44: 328-358.
Herranz, S. and Garcia-Osma, B. (2009). ‘Background and recent developments in fair value measurement: From FASB’s 1996 four decisions to the recent financial crisis’. Revista Española de Financiación y Contabilidad, XXXVIII (144): 647-660.
Herbohn, K. and Herbohn, J. (2006). ‘International Accounting Standard (IAS) 41: what are the implications for reporting forest assets?’ Small-scale Forest Economics, Management and Policy, 5 (2): 175-189.
IASC (2000) Joint working group of standard setters. Draft standard and basis for conclusions, financial instruments and similar items. London: IASC.
IASB (2009) Basis for conclusions IFRS for SMEs. London: IASB.Kroll, J.C. (1987). ‘Le nouveau plan comptable: les occasions perdues’. Économie Rurale, 180:
20-25.Laswad, F. and Baskerville, R.F. (2007). ‘An analysis of the value of cash flow statements of
New Zealand pension schemes’. British Accounting Review, 39: 347-355. Liang, P.J. and Wen, X. (2007). ‘Accounting measurement basis, market mispricing, and firm
investment efficiency’, Journal of Accounting Research, 45 (1): 155-197.Mishra, A.K., El-Osta, H.S. and Steele, C.J. (1999). ‘Factors affecting profitability of limited
resource and other small farms’. Agricultural Finance Review, 59: 77-91.Nelson, K.K. (1996). ‘Fair value accounting for commercial banks: an empirical analysis of
SFAS nº 107’. Accounting Review, 71 (2): 161-182.Penttinen, M., Latukka, A. Meriläinen, H., Salminen, O. and Uotila, E. (2004). ‘IAS fair value
and forest evaluation on farm forestry’. Proceedings of Human dimension of family, farm and community forestry international symposium, March 29-April 1.
Plantin, G. and Sapra, H. (2008). ‘Marking-to-market: panacea or Pandora’s box?’ Journal of Accounting Research, 46: 435-436.
Accounting preparation and judgement in agriculture 133
Poppe, K.J. (1991). ‘Information needs and accounting in agriculture’. Agricultural Economics Research Institute LEI, 444: 1-51.
Poppe, K.J. and Beers, G. (1996). ‘On innovation management in Farm Accountancy Data Networks’. Agricultural Economics Research Institute LEI, 535: 1-37.
Poppe, K.J. and Breembroek, J.A. (1992) ‘The assessment of a farm’s financial situation with a report writer’. Tijdschrift voor Sociaalwetenschappelijk onderzoek, 7 (1): 49-70.
PricewaterhouseCoopers (2009). ‘Forest industry: application review of IAS 41, agriculture: the fair value of standing timber’. Available at: http://www.pwc.com/es_CL/cl/publicaciones/assets/forest-industry.pdf
Rayman, R.A. (2007). ‘Fair value accounting and the present value fallacy: the need for an alternative conceptual framework’. British Accounting Review, 39: 211-225.
Ronen, J. (2008). ‘To fair value or not to fair value: a broader perspective’. Abacus, 44 (2): 181-208.
Sabaté, P. and Enciso, J.P. (1997). ‘La valoración de inmobilizados en las empresas agrarias. El caso de las plantaciones’. Técnica Contable, 579: 177-184.
Schmitt, G. (1991). ‘Why is the agriculture of advanced western economies still organized by family farms? Will this continue to be so in the future?’ European Review of Agricultural Economics, 18: 443-458.
Tomkins, C. and Groves, R. (1983). ‘The everyday accountant and researching his reality’. Accounting Organizations and Society, 8 (4): 361-374.
Watts, R.L. (2003). ‘Conservatism in accounting. Part I: explanations and implications’. Accounting Horizons, 17 (3): 207-221.
Watts, R.L. (2006). ‘What has the invisible hand achieved?’ Accounting and Business Research, 36 (special issue): 51-61.

134 J. M. Argilés, A. Sabata y J. García-Blandón
APPENDIX A. EXERCISES 1
APPENDIX A.1. BIOLOGICAL ASSETS EXERCISE 1: FAIR-VALUE VALUATION
REF: XXXXXPlease tick the designation that refers to your role:
q Student q Farmer q Advisor/Accountantq Other (specify): ___________________________________________________
Please, read the following exercise and write answers to the required questions in the attached response sheets.
Joan Armengol sets up a limited company for his farming operation on 1/1/2006, contributing machinery, biological assets (8 young sows that have not yet had litters) and cash at initial values that are indicated in the table below:
ASSETS (€) LIABILITIES (€)
Machinery
Sows
Cash
38,000
900
10,000
Capital 48,900
For accounting purposes, the financial year-end coincides with the calendar year. As a result, the accounting period runs from 1/1/2006 to 31/12/2006.
Joan has the following expenses during the period:• Social security contributions for the head of the operation: €1,400, paid in full during the period.• Depreciation of machinery: €3,800.• Other operating expenses: veterinary fees, feed, medicines, utilities, rental of farrowing house, etc.,
totalling €6,468, paid in full during the period.
During the period:ü The sows give birth to 96 piglets at the end of May, which are sold at the end of November for €8,640.
Payment for the sale is received in full during the period. The piglets weigh 9,600 kg and the sale price is 0.9€/kg.
ü At the end of October, the eight sows give birth to 120 piglets.
On 31 December 2006, the market price for the two-month-old piglets is 0.9€/kg and the total weight of the 120 piglets is 4,000 kg. The eight sows, after two litters, have a total market value of €600 at year-end. The period for fattening piglets is 6 months in length.
Taking into account that the business uses the fair-value method to value its biological assets, determine the following:
A. The unit and total value of inventories (fattening pigs) at the financial year-end. B. The total value of the sows at the financial year-end.C. Income for the operation in the accounting period.

Accounting preparation and judgement in agriculture 135
D. From a strictly economic standpoint, using the accounting data available, do you believe that it is worthwhile continuing the operation in these circumstances? To answer this question, bear in mind that:
• The farmer heading the operation does not receive a salary, so that the expenses listed in the accounts do not reflect his compensation.
• The farmer could earn €3,000 in alternative work (excluding social security contributions, which would be the responsibility of his employer).
• No fluctuations in pig prices are foreseen in the medium term, so that the future price will remain approximately the same as at year-end.
The table below shows entries in the daily accounts ledger made at the beginning of the financial year and the other transactions mentioned above. The only items that are missing are items corresponding to the value of biological assets at the year-end:
38,000
900
10,000
Machinery
Sows
Cash x Capital Stock 48,900
7,868 Operation expenses (veterinary, feed, social security, etc.)
x Cash 7,868
8,640 Cash x Revenues from sale of piglets 8,640
3,800 Depreciation of fixed assets (machinery) x Accumulated depreciation (machinery) 3,800
APPENDIX A.2. BIOLOGICAL ASSETS EXERCISE 1: HISTORICAL-COST VALUATION
REF XXXXXPlease tick the designation that refers to your role:
q Student q Farmer q Advisor/Accountantq Other (specify): ___________________________________________________
Please, read the following exercise and write answers to the required questions in the attached response sheets.
Joan Armengol sets up a limited company for his farming operation on 1/1/2006, contributing machinery, biological assets (8 young sows that have not yet had litters) and cash at initial values that are indicated in the table below:
ASSETS (€) LIABILITIES (€)
Machinery
Sows
Cash
38,000
900
10,000
Capital Stock 48,900
For accounting purposes, the financial year-end coincides with the calendar year. As a result, the accounting period runs from 1/1/2006 to 31/12/2006.

136 J. M. Argilés, A. Sabata y J. García-Blandón
Joan has the following expenses during the period:• Social security contributions for the head of the operation: €1,400, paid in full during the period.• Depreciation of machinery (€3,800) and of the sows (€300).• Other operating expenses: veterinary fees, feed, medicines, utilities, rental of farrowing house, etc.,
totalling €6,468, paid in full during the period.
During the period:ü The sows give birth to 96 piglets at the end of May, which are sold at the end of November for €8,640.
Payment for the sale is received in full during the period. The piglets weigh 9,600 kg and the sale price is 0.9€/kg.
ü At the end of October, the eight sows give birth to 120 piglets.
On 31 December 2006, the market price for the two-month-old piglets is 0.9€/kg and the total weight of the 120 piglets is 4,000 kg. The eight sows, after two litters, have a total market value of €600 at year-end. The period for fattening piglets is 6 months in length.
Taking into account that the business uses the historical-cost method to value its biological assets, determine the following:
A. The unit and total value of inventories (fattening pigs) at the financial year-end on a historical-cost basis or at market cost, if lower, according to accounting rules.
B. The total value of the sows at the financial year-end.C. Income for the operation in the accounting period.D. From a strictly economic standpoint, using the accounting data available, do you believe that it is
worthwhile continuing the operation in these circumstances? To answer this question, bear in mind that:
a. The farmer owning the operation does not receive a salary, so that the expenses listed in the accounts do not reflect his compensation.
b. The farmer could earn €3,000 in alternative work (excluding social security contributions, which would be the responsibility of his employer).
c. No fluctuations in pig prices are foreseen in the medium term, so that the future price will remain approximately the same as at year-end.
The table below shows entries in the daily accounts ledger made at the beginning of the financial year and the other transactions mentioned above. The only items that are missing are any items corresponding to the value of biological assets at the year-end:
38,000
900
10,000
Machinery
Sows
Cash
x Capital 48,900
7,868 Operating expenses (veterinary, feed, social security, etc.)
x Cash 7,868
8,640 Cash x Revenues from sale of piglets 8,640
3,800 Depreciation of machinery x Accumulated depreciation (machinery) 3,800
300 Depreciation of reproductive livestock (sows)
x Accumulated depreciation (reproductive livestock)
300

Accounting preparation and judgement in agriculture 137
APPENDIX B. RESPONSE SHEETS EXERCISES 1
APPENDIX B.1. RESPONSE SHEET BIOLOGICAL ASSETS EXERCISE 1: FAIR-VALUE VALUATION
REF. XXXXXPlease tick the designation that refers to your role:
q Student q Farmer q Advisor/Accountantq Other (specify): ___________________________________________________
Write answers to the following required questions:
PART A:Valuation applied for each piglet at the accounting year-end: ____________________
Total valuation applied for all piglets at the accounting year-end: _________________(Show calculations to justify responses.)
PART B:Total net value of eight sows to put in the operation’s year-end balance sheet (justify response):______________________________________________________________________
PART C:Income at accounting year-end: ___________________________________________(The Profit and Loss statement worksheet on the next page may be useful to you. Alternatively, you may make any calculations that you find helpful.)
PROFIT AND LOSS STATEMENT:
Item Amount (€)
Revenues from sale of piglets 8,640
Variation in biological assets caused by inventories (piglets)
Variation in biological assets caused by sows
Depreciation (machinery) 3,800
Other operating expenses (veterinary fees, feed, social security, etc.) 7,868
Income before opportunity cost
Opportunity cost of family labour in alternative work: 3,000
Net income:
(add, eliminate or change items as necessary)
138 J. M. Argilés, A. Sabata y J. García-Blandón
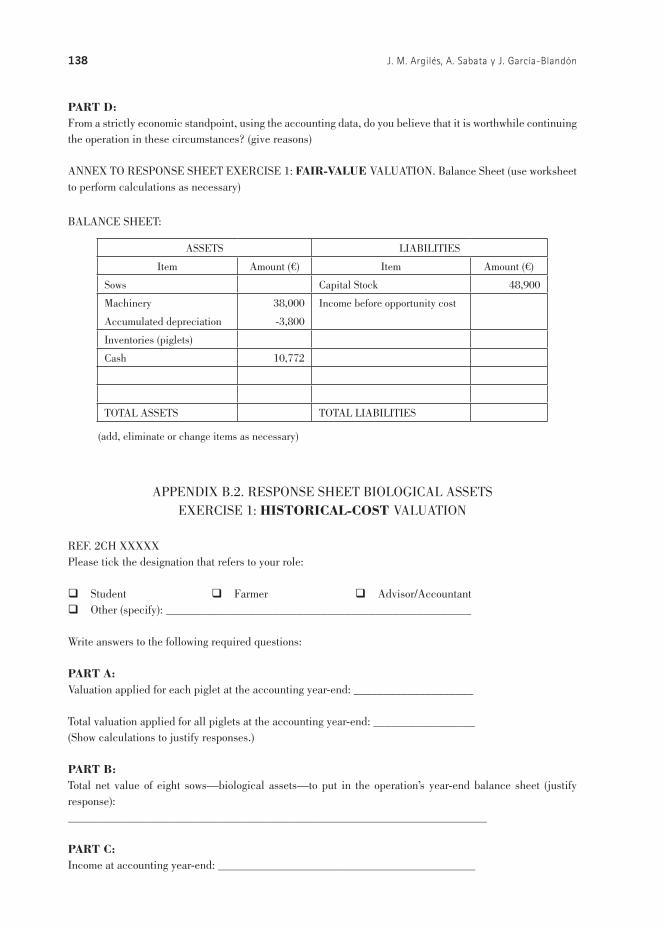
PART D:From a strictly economic standpoint, using the accounting data, do you believe that it is worthwhile continuing the operation in these circumstances? (give reasons)
ANNEX TO RESPONSE SHEET EXERCISE 1: FAIR-VALUE VALUATION. Balance Sheet (use worksheet to perform calculations as necessary)
BALANCE SHEET:
ASSETS LIABILITIES
Item Amount (€) Item Amount (€)
Sows Capital Stock 48,900
Machinery
Accumulated depreciation
38,000
-3,800
Income before opportunity cost
Inventories (piglets)
Cash 10,772
TOTAL ASSETS TOTAL LIABILITIES
(add, eliminate or change items as necessary)
APPENDIX B.2. RESPONSE SHEET BIOLOGICAL ASSETS EXERCISE 1: HISTORICAL-COST VALUATION
REF. 2CH XXXXXPlease tick the designation that refers to your role:
q Student q Farmer q Advisor/Accountantq Other (specify): ___________________________________________________
Write answers to the following required questions:
PART A:Valuation applied for each piglet at the accounting year-end: ____________________
Total valuation applied for all piglets at the accounting year-end: _________________(Show calculations to justify responses.)
PART B:Total net value of eight sows—biological assets—to put in the operation’s year-end balance sheet (justify response):______________________________________________________________________
PART C:Income at accounting year-end: ___________________________________________
Accounting preparation and judgement in agriculture 139
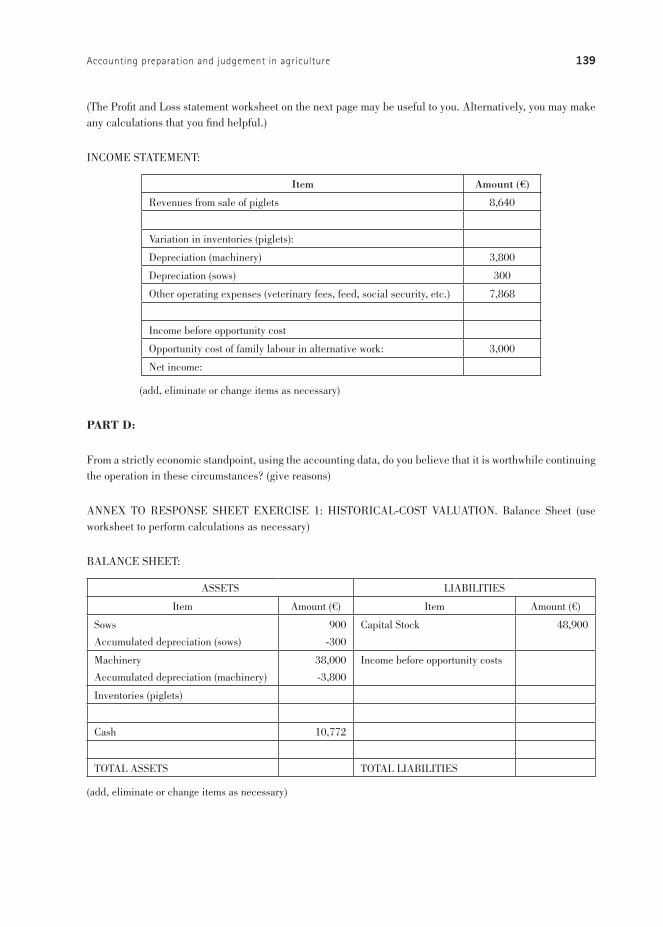
(The Profit and Loss statement worksheet on the next page may be useful to you. Alternatively, you may make any calculations that you find helpful.)
INCOME STATEMENT:
Item Amount (€)
Revenues from sale of piglets 8,640
Variation in inventories (piglets):
Depreciation (machinery) 3,800
Depreciation (sows) 300
Other operating expenses (veterinary fees, feed, social security, etc.) 7,868
Income before opportunity cost
Opportunity cost of family labour in alternative work: 3,000
Net income:
(add, eliminate or change items as necessary)
PART D:
From a strictly economic standpoint, using the accounting data, do you believe that it is worthwhile continuing the operation in these circumstances? (give reasons)
ANNEX TO RESPONSE SHEET EXERCISE 1: HISTORICAL-COST VALUATION. Balance Sheet (use worksheet to perform calculations as necessary)
BALANCE SHEET:
ASSETS LIABILITIES
Item Amount (€) Item Amount (€)
Sows
Accumulated depreciation (sows)
900
-300
Capital Stock 48,900
Machinery
Accumulated depreciation (machinery)
38,000
-3,800
Income before opportunity costs
Inventories (piglets)
Cash 10,772
TOTAL ASSETS TOTAL LIABILITIES
(add, eliminate or change items as necessary)
140 J. M. Argilés, A. Sabata y J. García-Blandón
APPENDIX C. EXERCISES 2
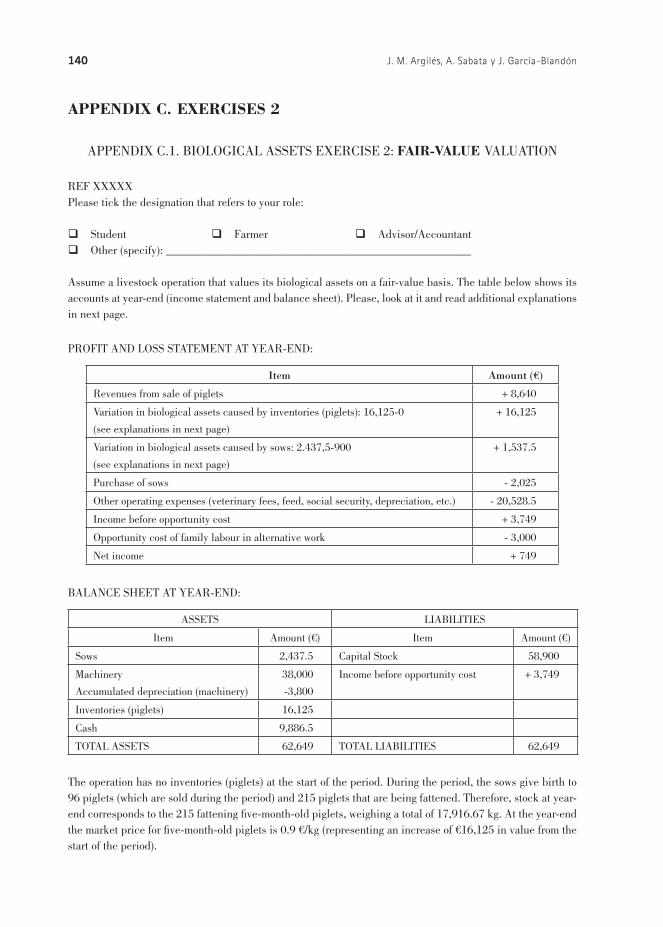
APPENDIX C.1. BIOLOGICAL ASSETS EXERCISE 2: FAIR-VALUE VALUATION
REF XXXXX Please tick the designation that refers to your role:
q Student q Farmer q Advisor/Accountantq Other (specify): ___________________________________________________
Assume a livestock operation that values its biological assets on a fair-value basis. The table below shows its accounts at year-end (income statement and balance sheet). Please, look at it and read additional explanations in next page.
PROFIT AND LOSS STATEMENT AT YEAR-END:
Item Amount (€)
Revenues from sale of piglets + 8,640
Variation in biological assets caused by inventories (piglets): 16,125-0
(see explanations in next page)
+ 16,125
Variation in biological assets caused by sows: 2.437,5-900
(see explanations in next page)
+ 1,537.5
Purchase of sows - 2,025
Other operating expenses (veterinary fees, feed, social security, depreciation, etc.) - 20,528.5
Income before opportunity cost + 3,749
Opportunity cost of family labour in alternative work - 3,000
Net income + 749
BALANCE SHEET AT YEAR-END:
ASSETS LIABILITIES
Item Amount (€) Item Amount (€)
Sows 2,437.5 Capital Stock 58,900
Machinery
Accumulated depreciation (machinery)
38,000
-3,800
Income before opportunity cost + 3,749
Inventories (piglets) 16,125
Cash 9,886.5
TOTAL ASSETS 62,649 TOTAL LIABILITIES 62,649
The operation has no inventories (piglets) at the start of the period. During the period, the sows give birth to 96 piglets (which are sold during the period) and 215 piglets that are being fattened. Therefore, stock at year-end corresponds to the 215 fattening five-month-old piglets, weighing a total of 17,916.67 kg. At the year-end the market price for five-month-old piglets is 0.9 €/kg (representing an increase of €16,125 in value from the start of the period).
Accounting preparation and judgement in agriculture 141
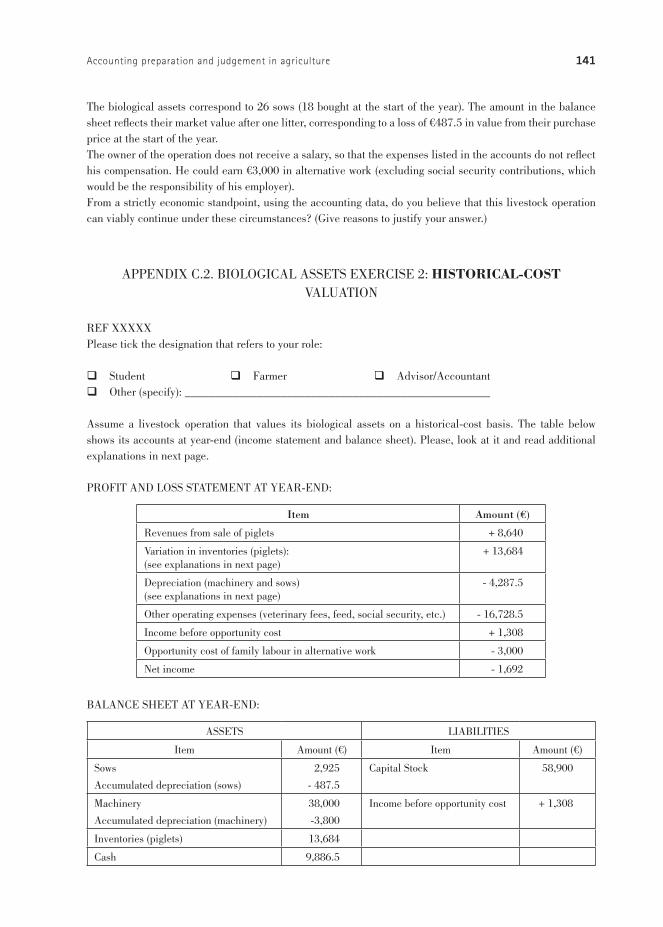
The biological assets correspond to 26 sows (18 bought at the start of the year). The amount in the balance sheet reflects their market value after one litter, corresponding to a loss of €487.5 in value from their purchase price at the start of the year.The owner of the operation does not receive a salary, so that the expenses listed in the accounts do not reflect his compensation. He could earn €3,000 in alternative work (excluding social security contributions, which would be the responsibility of his employer).From a strictly economic standpoint, using the accounting data, do you believe that this livestock operation can viably continue under these circumstances? (Give reasons to justify your answer.)
APPENDIX C.2. BIOLOGICAL ASSETS EXERCISE 2: HISTORICAL-COST VALUATION
REF XXXXX Please tick the designation that refers to your role:
q Student q Farmer q Advisor/Accountantq Other (specify): ___________________________________________________
Assume a livestock operation that values its biological assets on a historical-cost basis. The table below shows its accounts at year-end (income statement and balance sheet). Please, look at it and read additional explanations in next page.
PROFIT AND LOSS STATEMENT AT YEAR-END:
Item Amount (€)
Revenues from sale of piglets + 8,640
Variation in inventories (piglets):(see explanations in next page)
+ 13,684
Depreciation (machinery and sows)(see explanations in next page)
- 4,287.5
Other operating expenses (veterinary fees, feed, social security, etc.) - 16,728.5
Income before opportunity cost + 1,308
Opportunity cost of family labour in alternative work - 3,000
Net income - 1,692
BALANCE SHEET AT YEAR-END:
ASSETS LIABILITIES
Item Amount (€) Item Amount (€)
Sows
Accumulated depreciation (sows)
2,925
- 487.5
Capital Stock 58,900
Machinery
Accumulated depreciation (machinery)
38,000
-3,800
Income before opportunity cost + 1,308
Inventories (piglets) 13,684
Cash 9,886.5
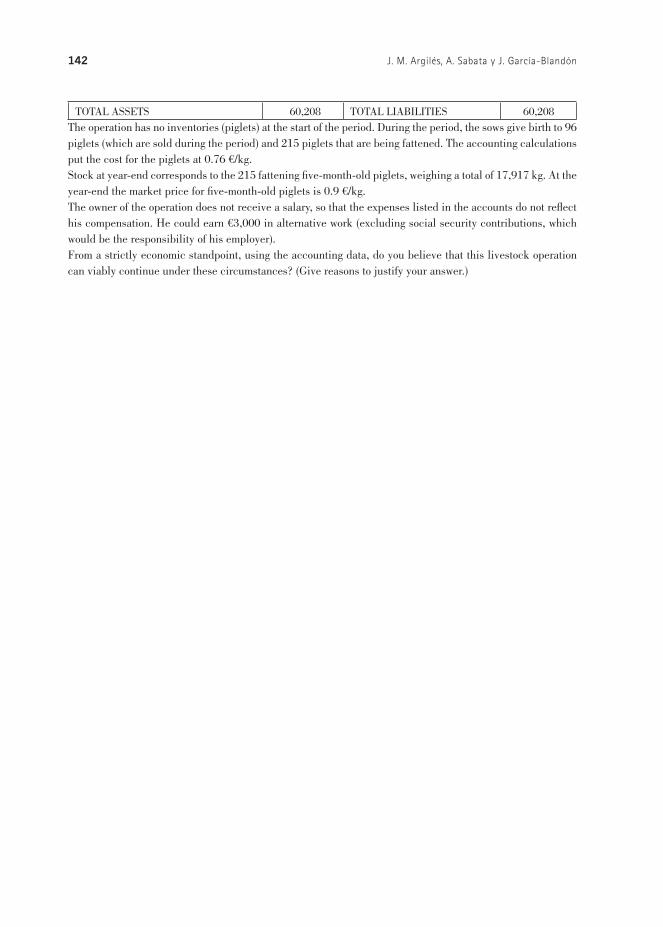
142 J. M. Argilés, A. Sabata y J. García-Blandón
TOTAL ASSETS 60,208 TOTAL LIABILITIES 60,208The operation has no inventories (piglets) at the start of the period. During the period, the sows give birth to 96 piglets (which are sold during the period) and 215 piglets that are being fattened. The accounting calculations put the cost for the piglets at 0.76 €/kg.Stock at year-end corresponds to the 215 fattening five-month-old piglets, weighing a total of 17,917 kg. At the year-end the market price for five-month-old piglets is 0.9 €/kg.The owner of the operation does not receive a salary, so that the expenses listed in the accounts do not reflect his compensation. He could earn €3,000 in alternative work (excluding social security contributions, which would be the responsibility of his employer).From a strictly economic standpoint, using the accounting data, do you believe that this livestock operation can viably continue under these circumstances? (Give reasons to justify your answer.)