Embed Size (px)
Citation preview

A comparative study of Central Eastern European Countries’ export performance using disaggregate data:
A constant market share analysis
Abel Reyna-Rivera
National Centre for Research on Europe
University of Canterbury, New Zealand

Content of the Presentation
• Introduction
• Theoretical considerations
• Summary of key results
• Conclusion
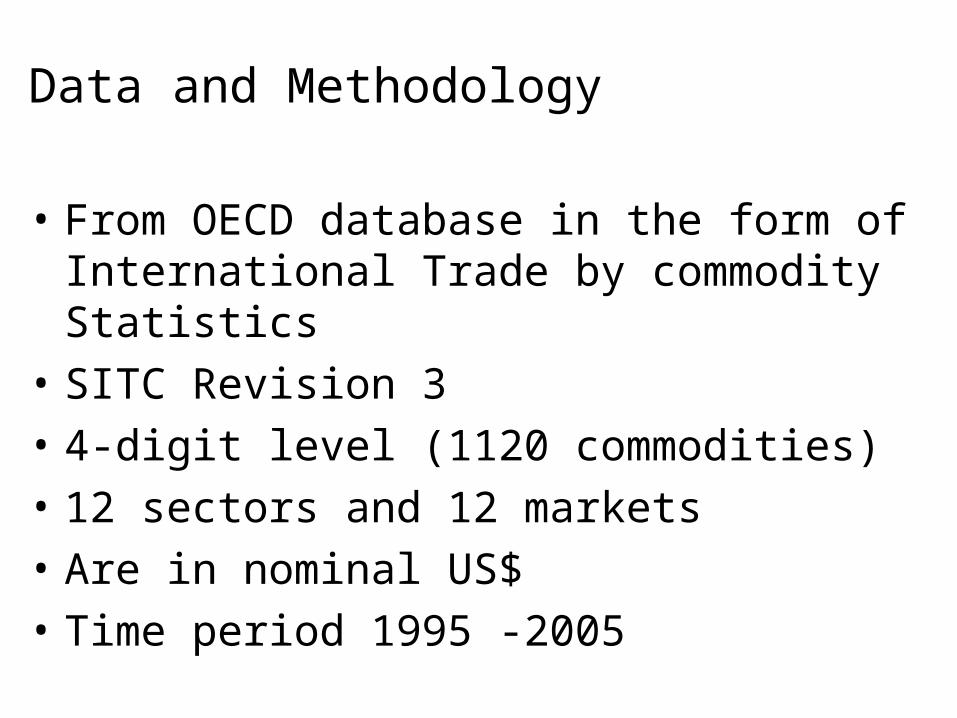
Data and Methodology
• From OECD database in the form of International Trade by commodity Statistics
• SITC Revision 3
• 4-digit level (1120 commodities)
• 12 sectors and 12 markets
• Are in nominal US$
• Time period 1995 -2005
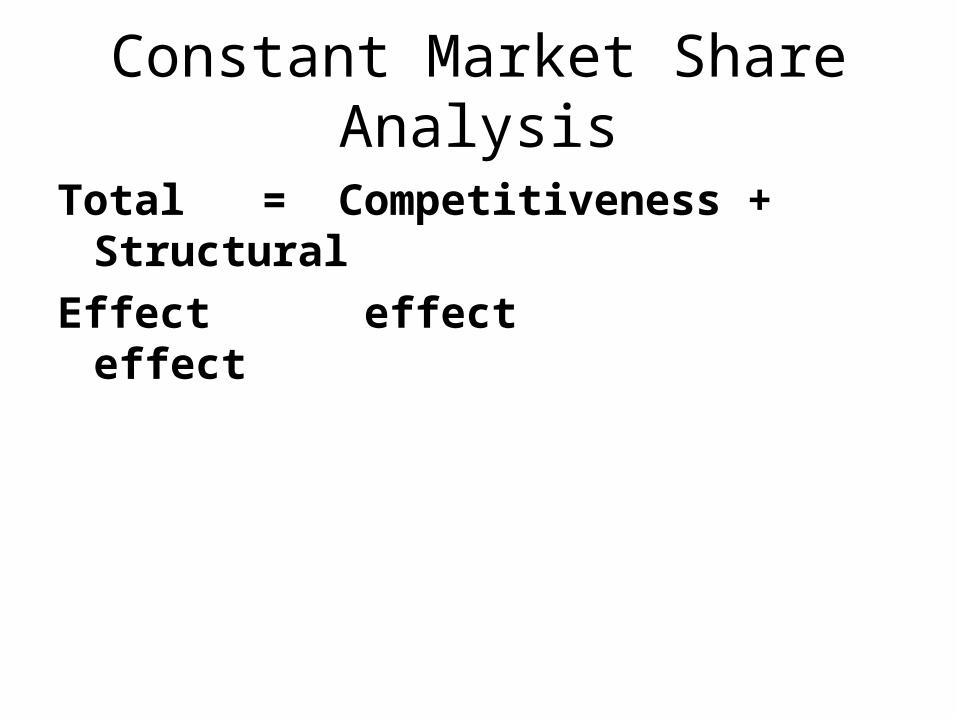
Constant Market Share Analysis
Total = Competitiveness + Structural
Effect effect effect
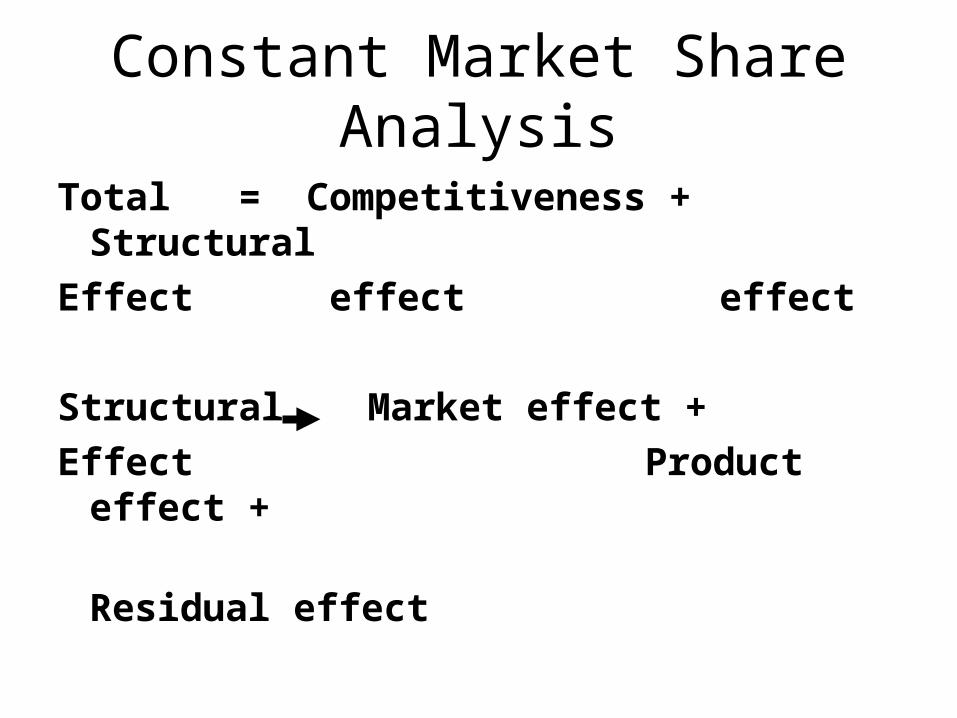
Constant Market Share Analysis
Total = Competitiveness + Structural
Effect effect effect
Structural Market effect +
Effect Product effect +
Residual effect
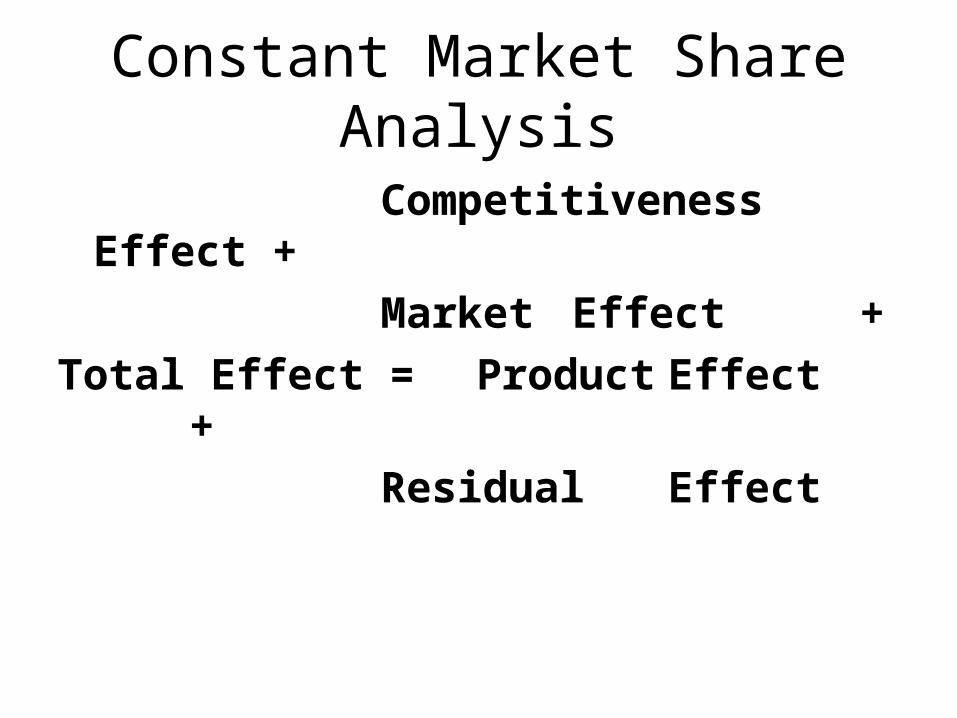
Constant Market Share Analysis
Competitiveness Effect +
Market Effect +
Total Effect = Product Effect +
Residual Effect

Constant Market Share Analysis
Total Effect
100*0,
0,
1,
1,
m p
tpm
m p
tpm
m p
tpm
m p
tpm
XW
X
XW
X

Constant Market Share Analysis
Competitiveness Effect
100***5.00,
0,
1,
1,
1,
1,
0,
0,
t
pm
tpm
tpm
tpm
m p
tpm
tpm
m p
tpm
tpm
m p XW
X
XW
X
XW
XW
XW
XW

Constant Market Share Analysis
Market composition effect
100***5.00,
0,
1,
1,
1,
1,
0,
0,
tpm
m p
tpm
p
tpm
m p
tpm
p
p
tpm
tpm
p
tpm
tpm
m p WX
WX
WX
WX
XW
X
XW
X
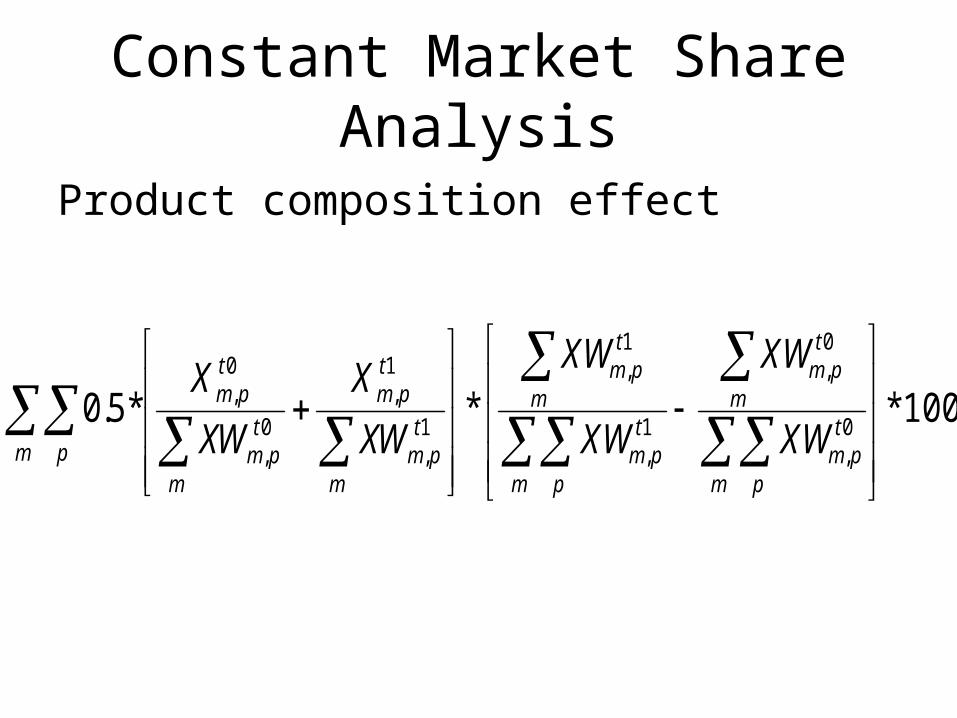
Constant Market Share Analysis
Product composition effect
100***5.00,
0,
1,
1,
1,
1,
0,
0,
tpm
m p
tpm
mtpm
m p
tpm
m
m
tpm
tpm
m
tpm
tpm
m p WX
WX
WX
WX
XW
X
XW
X
Constant Market Share Analysis
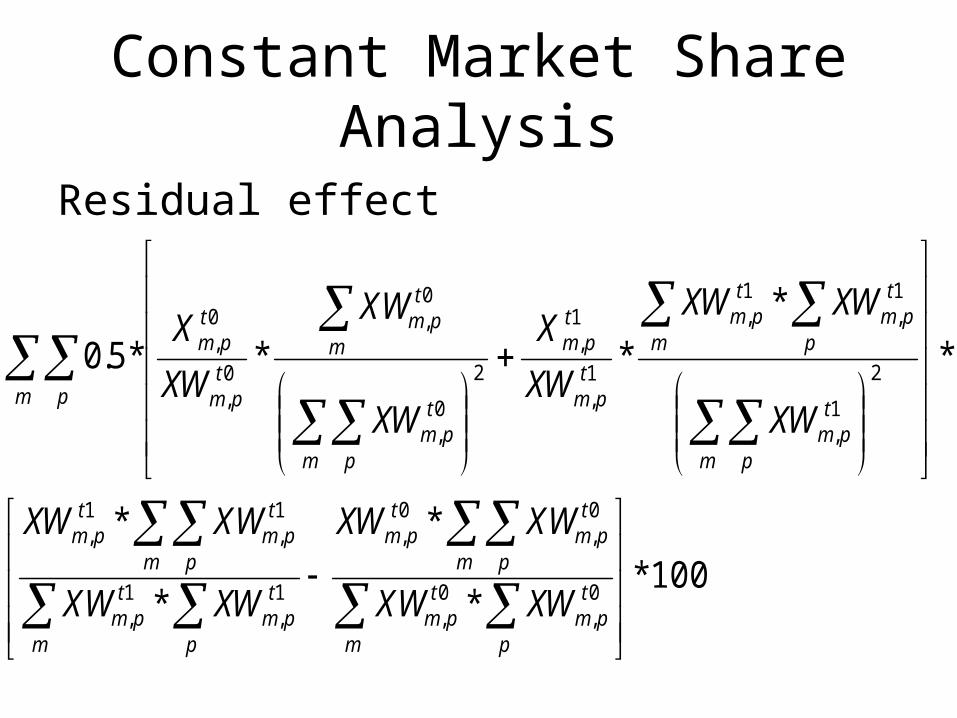
Residual effect
100**
*
*
*
*
*
***5.0
0,
0,
0,
0,
1,
1,
1,
1,
2
1,
1,
1,
1,
1,
2
0,
0,
0,
0,
p
tpm
tpm
m
tpm
m p
tpm
p
tpm
tpm
m
tpm
m p
tpm
m p
tpm
m p
tpm
tpm
tpm
tpm
m p
tpm
tpm
mtpm
tpm
m p
XWWX
WXXW
XWWX
WXXW
XW
XWXW
XW
X
XW
WX
XW
X
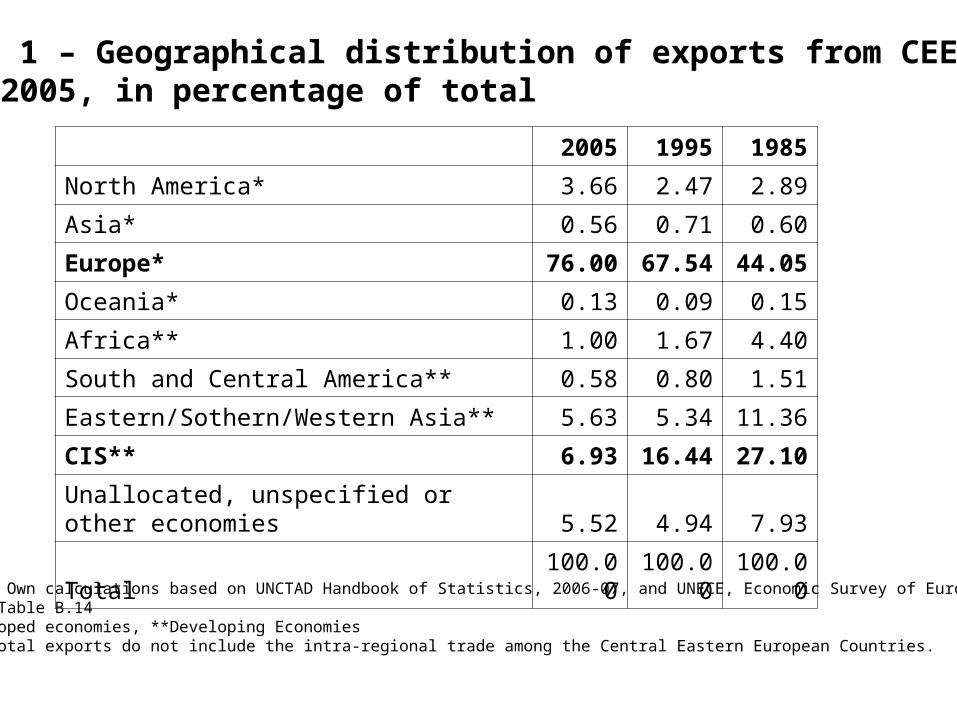
Table 1 – Geographical distribution of exports from CEECs 1995-2005, in percentage of total
2005 1995 1985
North America* 3.66 2.47 2.89
Asia* 0.56 0.71 0.60
Europe* 76.00 67.54 44.05
Oceania* 0.13 0.09 0.15
Africa** 1.00 1.67 4.40
South and Central America** 0.58 0.80 1.51
Eastern/Sothern/Western Asia** 5.63 5.34 11.36
CIS** 6.93 16.44 27.10
Unallocated, unspecified or other economies 5.52 4.94 7.93
Total 100.00 100.00 100.00
Source: Own calculations based on UNCTAD Handbook of Statistics, 2006-07, and UNECE, Economic Survey of Europe, 2004, No. 1, Table B.14* Developed economies, **Developing EconomiesNote: Total exports do not include the intra-regional trade among the Central Eastern European Countries.
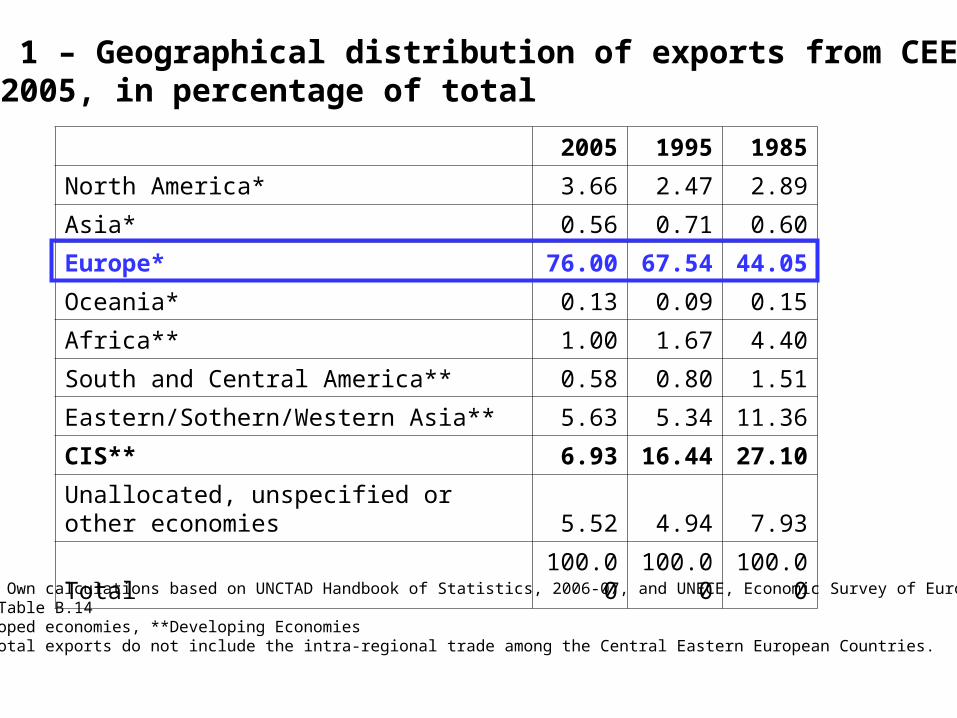
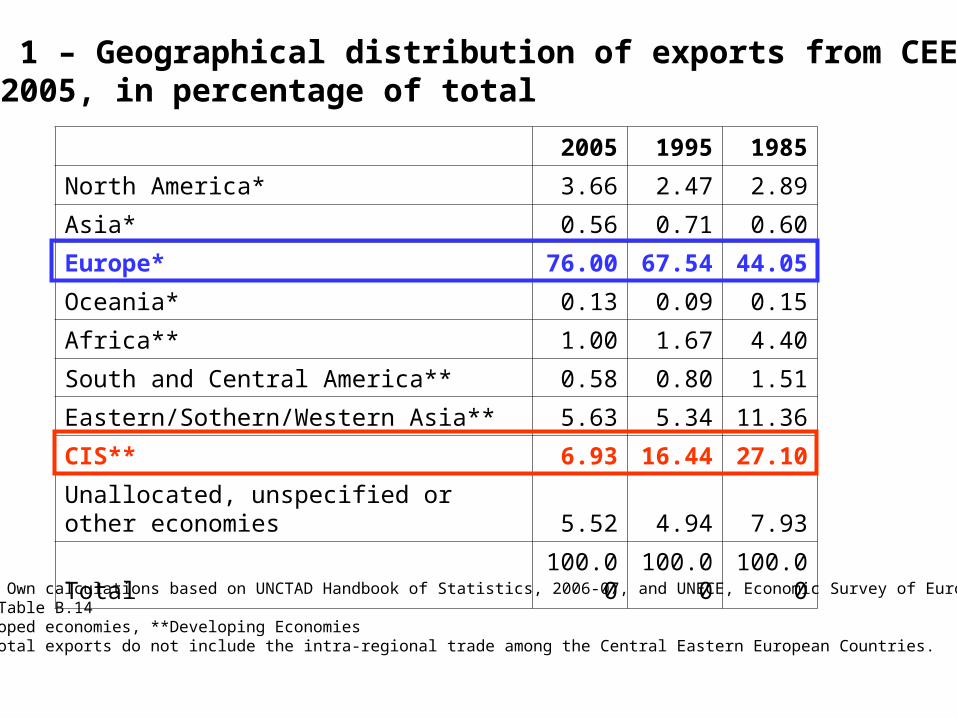
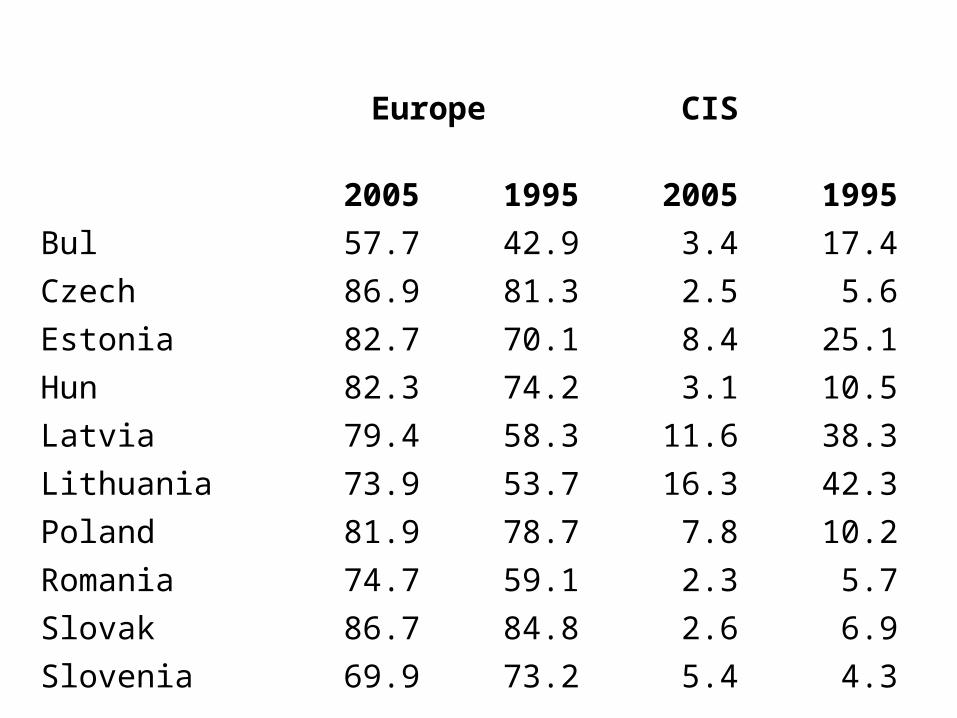
Europe CIS
2005 1995 2005 1995
Bul 57.7 42.9 3.4 17.4
Czech 86.9 81.3 2.5 5.6
Estonia 82.7 70.1 8.4 25.1
Hun 82.3 74.2 3.1 10.5
Latvia 79.4 58.3 11.6 38.3
Lithuania 73.9 53.7 16.3 42.3
Poland 81.9 78.7 7.8 10.2
Romania 74.7 59.1 2.3 5.7
Slovak 86.7 84.8 2.6 6.9
Slovenia 69.9 73.2 5.4 4.3
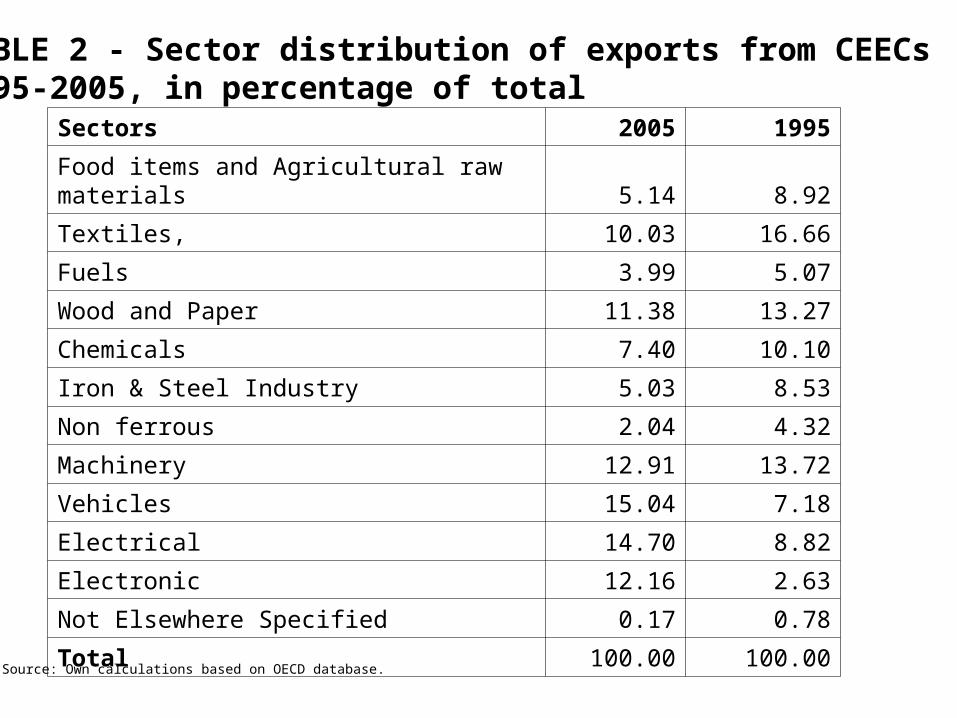
TABLE 2 - Sector distribution of exports from CEECs1995-2005, in percentage of totalSectors 2005 1995
Food items and Agricultural raw materials 5.14 8.92
Textiles, 10.03 16.66
Fuels 3.99 5.07
Wood and Paper 11.38 13.27
Chemicals 7.40 10.10
Iron & Steel Industry 5.03 8.53
Non ferrous 2.04 4.32
Machinery 12.91 13.72
Vehicles 15.04 7.18
Electrical 14.70 8.82
Electronic 12.16 2.63
Not Elsewhere Specified 0.17 0.78
Total 100.00 100.00
Source: Own calculations based on OECD database.
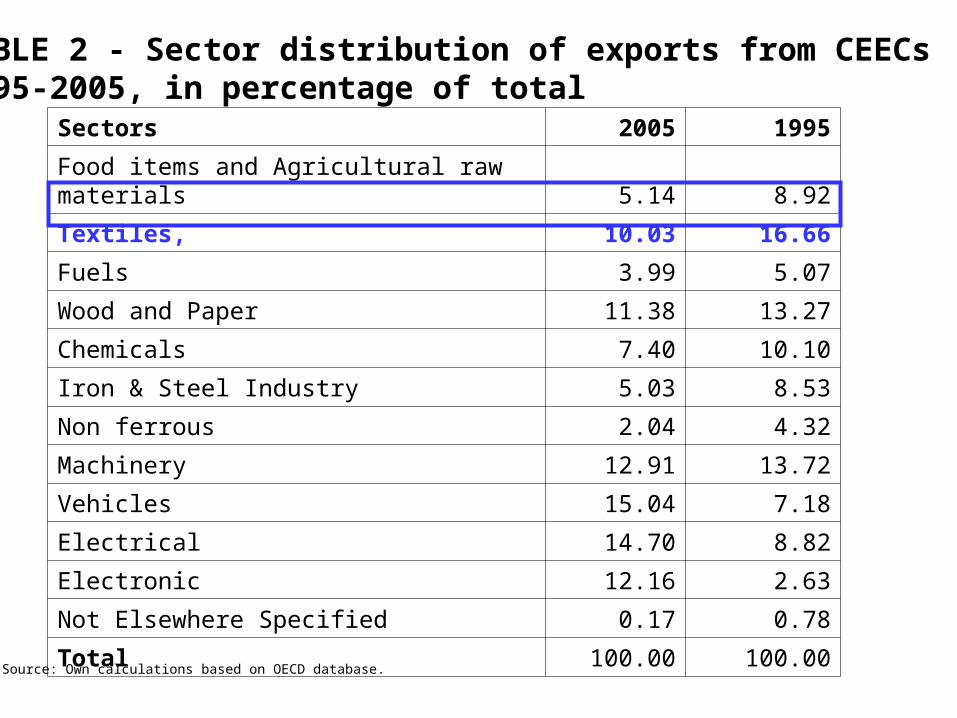
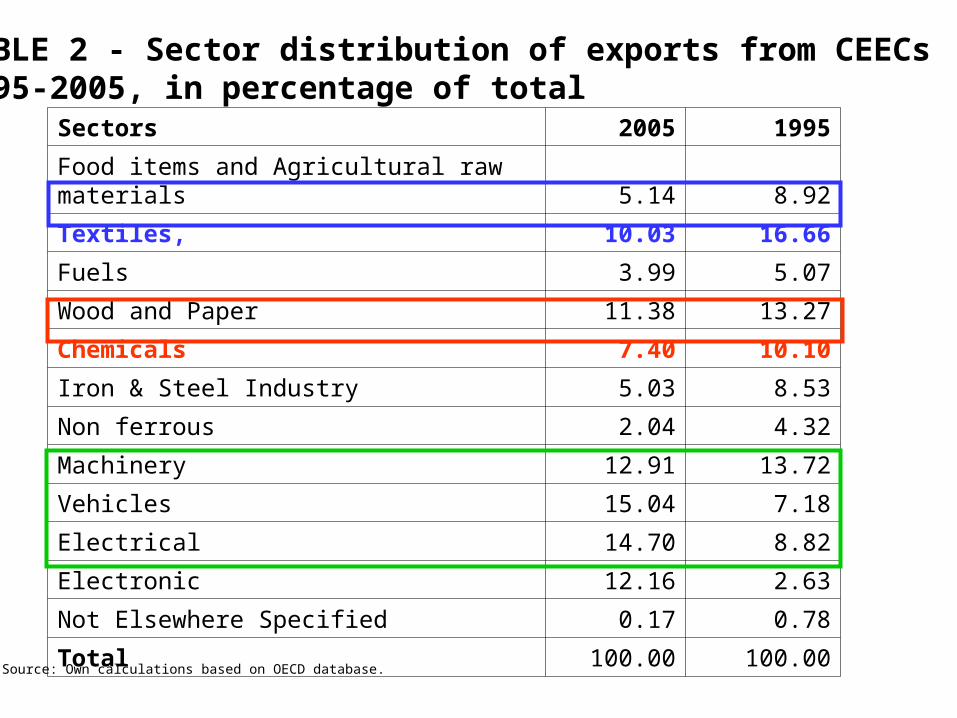
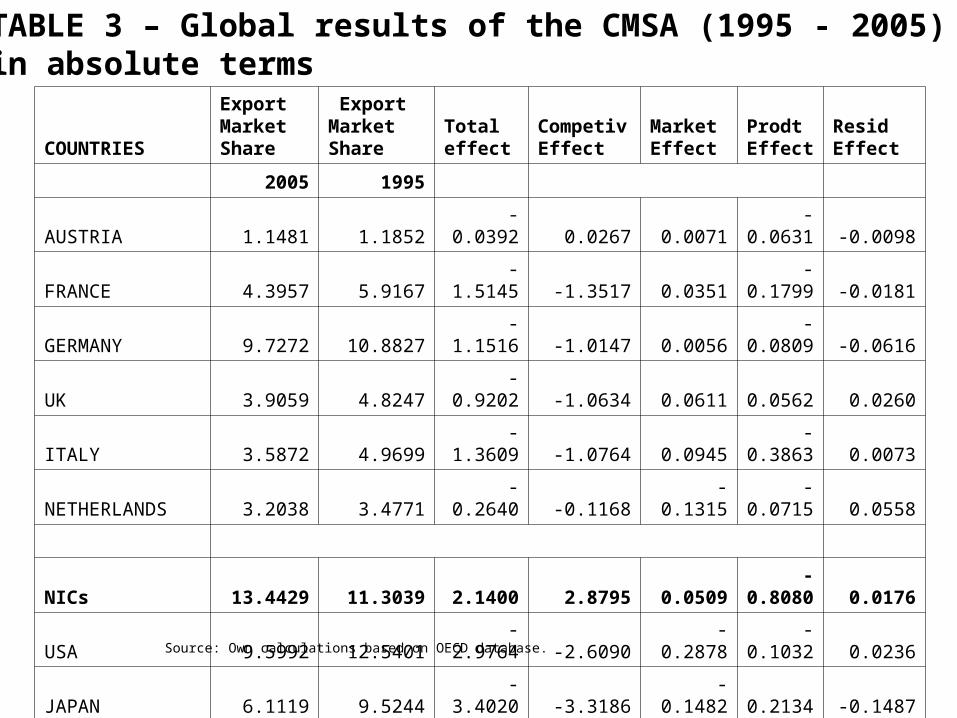
TABLE 3 – Global results of the CMSA (1995 - 2005) in absolute terms
COUNTRIES
Export Market Share
Export Market Share
Totaleffect
CompetivEffect
MarketEffect
ProdtEffect
ResidEffect
2005 1995
AUSTRIA 1.1481 1.1852 -0.0392 0.0267 0.0071 -0.0631 -0.0098
FRANCE 4.3957 5.9167 -1.5145 -1.3517 0.0351 -0.1799 -0.0181
GERMANY 9.7272 10.8827 -1.1516 -1.0147 0.0056 -0.0809 -0.0616
UK 3.9059 4.8247 -0.9202 -1.0634 0.0611 0.0562 0.0260
ITALY 3.5872 4.9699 -1.3609 -1.0764 0.0945 -0.3863 0.0073
NETHERLANDS 3.2038 3.4771 -0.2640 -0.1168 -0.1315 -0.0715 0.0558
NICs 13.4429 11.3039 2.1400 2.8795 0.0509 -0.8080 0.0176
USA 9.5992 12.5401 -2.9764 -2.6090 -0.2878 -0.1032 0.0236
JAPAN 6.1119 9.5244 -3.4020 -3.3186 -0.1482 0.2134 -0.1487
EU-10 2.6312 1.6107 1.0228 1.1323 -0.0387 -0.0705 -0.0003
CIS 2.2678 1.3702 0.8923 0.6094 -0.0673 0.3777 -0.0275
Source: Own calculations based on OECD database.
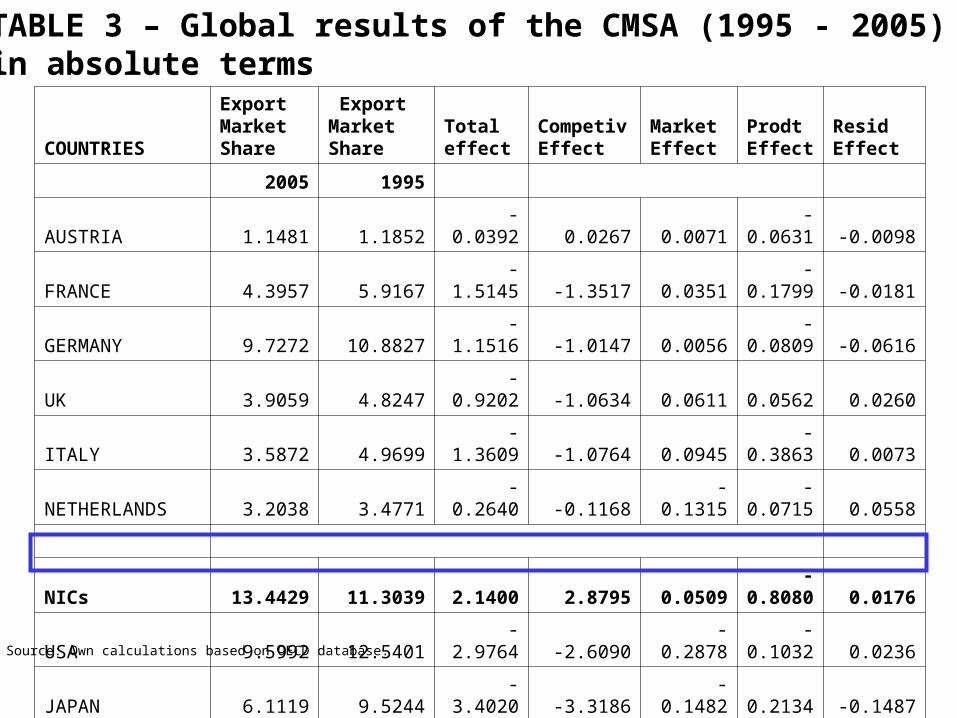
TABLE 3 – Global results of the CMSA (1995 - 2005) in absolute terms
COUNTRIES
Export Market Share
Export Market Share
Totaleffect
CompetivEffect
MarketEffect
ProdtEffect
ResidEffect
2005 1995
AUSTRIA 1.1481 1.1852 -0.0392 0.0267 0.0071 -0.0631 -0.0098
FRANCE 4.3957 5.9167 -1.5145 -1.3517 0.0351 -0.1799 -0.0181
GERMANY 9.7272 10.8827 -1.1516 -1.0147 0.0056 -0.0809 -0.0616
UK 3.9059 4.8247 -0.9202 -1.0634 0.0611 0.0562 0.0260
ITALY 3.5872 4.9699 -1.3609 -1.0764 0.0945 -0.3863 0.0073
NETHERLANDS 3.2038 3.4771 -0.2640 -0.1168 -0.1315 -0.0715 0.0558
NICs 13.4429 11.3039 2.1400 2.8795 0.0509 -0.8080 0.0176
USA 9.5992 12.5401 -2.9764 -2.6090 -0.2878 -0.1032 0.0236
JAPAN 6.1119 9.5244 -3.4020 -3.3186 -0.1482 0.2134 -0.1487
EU-10 2.6312 1.6107 1.0228 1.1323 -0.0387 -0.0705 -0.0003
CIS 2.2678 1.3702 0.8923 0.6094 -0.0673 0.3777 -0.0275
Source: Own calculations based on OECD database.
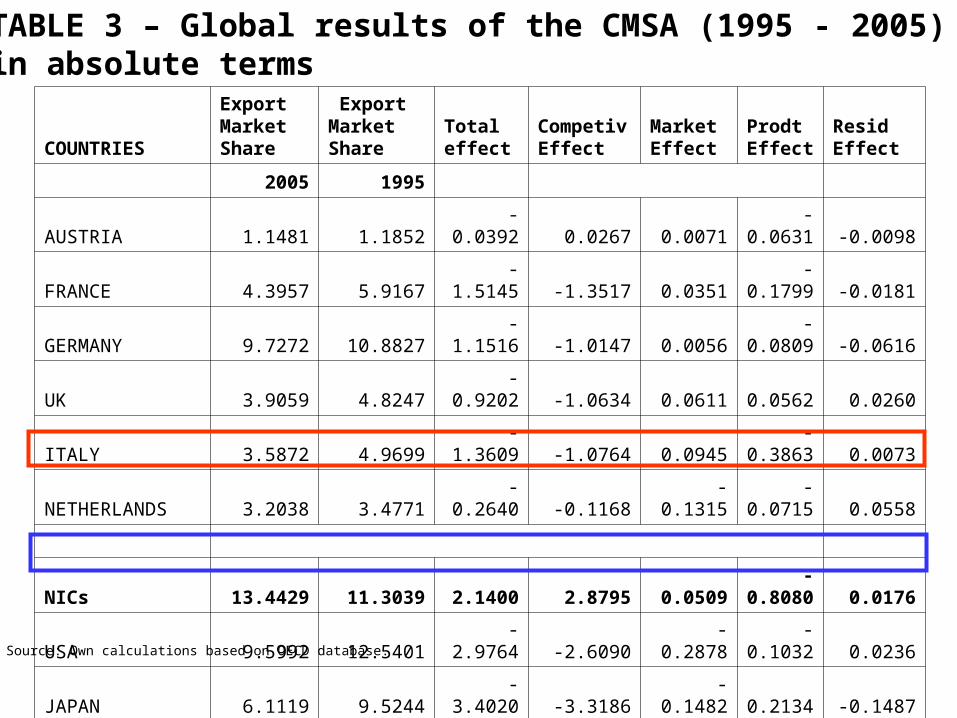
TABLE 3 – Global results of the CMSA (1995 - 2005) in absolute terms
COUNTRIES
Export Market Share
Export Market Share
Totaleffect
CompetivEffect
MarketEffect
ProdtEffect
ResidEffect
2005 1995
AUSTRIA 1.1481 1.1852 -0.0392 0.0267 0.0071 -0.0631 -0.0098
FRANCE 4.3957 5.9167 -1.5145 -1.3517 0.0351 -0.1799 -0.0181
GERMANY 9.7272 10.8827 -1.1516 -1.0147 0.0056 -0.0809 -0.0616
UK 3.9059 4.8247 -0.9202 -1.0634 0.0611 0.0562 0.0260
ITALY 3.5872 4.9699 -1.3609 -1.0764 0.0945 -0.3863 0.0073
NETHERLANDS 3.2038 3.4771 -0.2640 -0.1168 -0.1315 -0.0715 0.0558
NICs 13.4429 11.3039 2.1400 2.8795 0.0509 -0.8080 0.0176
USA 9.5992 12.5401 -2.9764 -2.6090 -0.2878 -0.1032 0.0236
JAPAN 6.1119 9.5244 -3.4020 -3.3186 -0.1482 0.2134 -0.1487
EU-10 2.6312 1.6107 1.0228 1.1323 -0.0387 -0.0705 -0.0003
CIS 2.2678 1.3702 0.8923 0.6094 -0.0673 0.3777 -0.0275
Source: Own calculations based on OECD database.
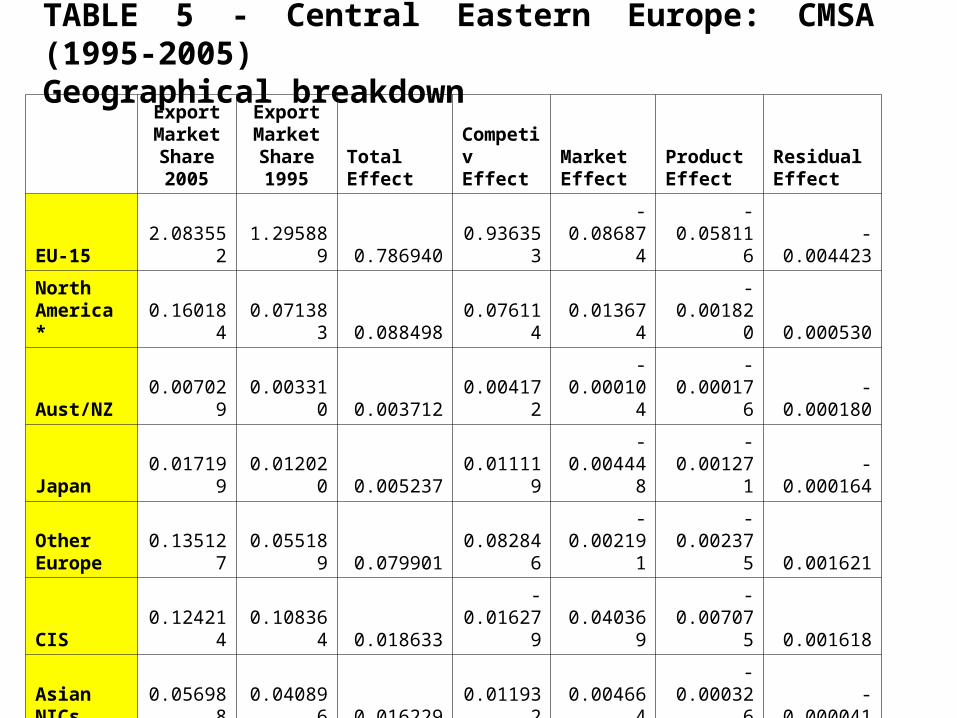
TABLE 5 - Central Eastern Europe: CMSA (1995-2005) Geographical breakdown
Export Market Share2005
Export Market Share1995
TotalEffect
CompetivEffect
MarketEffect
ProductEffect
ResidualEffect
EU-15 2.083552 1.295889 0.786940 0.936353 -0.086874 -0.058116 -0.004423
North America * 0.160184 0.071383 0.088498 0.076114 0.013674 -0.001820 0.000530
Aust/NZ 0.007029 0.003310 0.003712 0.004172 -0.000104 -0.000176 -0.000180
Japan 0.017199 0.012020 0.005237 0.011119 -0.004448 -0.001271 -0.000164
Other Europe 0.135127 0.055189 0.079901 0.082846 -0.002191 -0.002375 0.001621
CIS 0.124214 0.108364 0.018633-
0.016279 0.040369 -0.007075 0.001618
Asian NICs 0.056988 0.040896 0.016229 0.011932 0.004664 -0.000326 -0.000041
Africa/ME 0.038204 0.016735 0.021514 0.020943 -0.000259 -0.000033 0.000864
C&S A 0.008753 0.006887 0.002140 0.005131 -0.003566 0.000675 -0.000099
Total 2.631249 1.610674 1.022804 1.132332 -0.038735 -0.070517 -0.000276
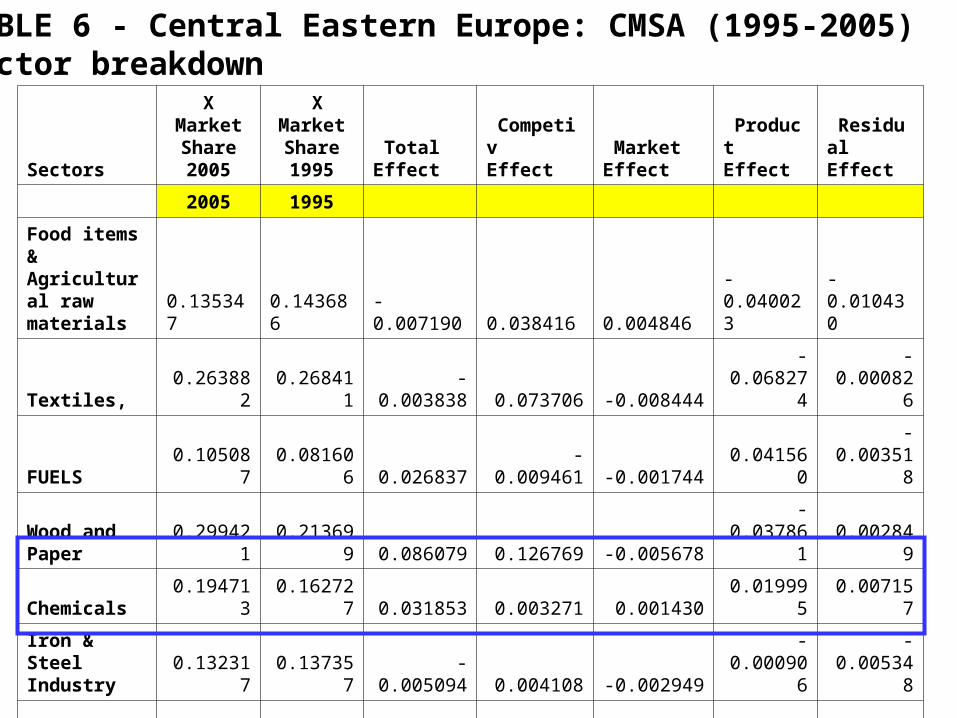
TABLE 6 - Central Eastern Europe: CMSA (1995-2005) Sector breakdown
Sectors
X MarketShare2005
X Market Share1995
TotalEffect
CompetivEffect
MarketEffect
ProductEffect
ResidualEffect
2005 1995
Food items & Agricultural raw materials 0.135347 0.143686 -0.007190 0.038416 0.004846 -0.040023 -0.010430
Textiles, 0.263882 0.268411 -0.003838 0.073706 -0.008444 -0.068274 -0.000826
FUELS 0.105087 0.081606 0.026837 -0.009461 -0.001744 0.041560 -0.003518
Wood and Paper 0.299421 0.213699 0.086079 0.126769 -0.005678 -0.037861 0.002849
Chemicals 0.194713 0.162727 0.031853 0.003271 0.001430 0.019995 0.007157
Iron & Steel Industry 0.132317 0.137357 -0.005094 0.004108 -0.002949 -0.000906 -0.005348
Non ferrous 0.053804 0.069592 -0.015825 -0.001450 -0.001898 -0.013993 0.001516
Machinery 0.339625 0.220943 0.118931 0.142053 -0.003567 -0.025448 0.005893
Vehicles 0.395870 0.115672 0.278995 0.243464 -0.007035 0.011940 0.030627
Electrical 0.386748 0.142107 0.243636 0.252075 -0.008374 0.021877 -0.021943
Electronic 0.320085 0.042325 0.276661 0.266315 -0.005244 0.022219 -0.006630
Not Elsew Specified 0.004351 0.012549 -0.008240 -0.006935 -0.000078 -0.001603 0.000377
Total 2.631249 1.610674 1.022804 1.132332 -0.038735 -0.070517 -0.000276
Conclusions
• An interesting result of the paper suggests that the overall export performance of the EU10 countries, during 1995-2004 has been mainly influenced by a favourable competitiveness effect.
• In comparison with the Asia NICs, the export performance of the EU10 countries was hindered by the unfavourable product specialisation, in particular a much lower export share in the sector of electronics.

Conclusions
• In the long run, Central Eastern Europe should remain aware of the trade growth potential associated with the Asian NICs and the other emerging economies and tend to a greater diversification of exports.