Embed Size (px)
Citation preview
Portland State University Portland State University
PDXScholar PDXScholar
Dissertations and Theses Dissertations and Theses
Fall 11-21-2013
A Comparative Study of Administrator and Special A Comparative Study of Administrator and Special
Education Teacher Perceptions of Special Education Education Teacher Perceptions of Special Education
Teacher Attrition and Retention Teacher Attrition and Retention
Danielle Angelina Sheldrake Portland State University
Follow this and additional works at: https://pdxscholar.library.pdx.edu/open_access_etds
Part of the Labor Relations Commons, Special Education Administration Commons, and the Special
Education and Teaching Commons
Let us know how access to this document benefits you.
Recommended Citation Recommended Citation Sheldrake, Danielle Angelina, "A Comparative Study of Administrator and Special Education Teacher Perceptions of Special Education Teacher Attrition and Retention" (2013). Dissertations and Theses. Paper 1499. https://doi.org/10.15760/etd.1498
This Dissertation is brought to you for free and open access. It has been accepted for inclusion in Dissertations and Theses by an authorized administrator of PDXScholar. Please contact us if we can make this document more accessible: [email protected].
A Comparative Study of Administrator and Special Education Teacher Perceptions of
Special Education Teacher Attrition and Retention
by
Danielle Angelina Sheldrake
A dissertation submitted in partial fulfillment of the requirements for the degree of
Doctor of Education in
Educational Leadership: Administration
Dissertation Committee: Amy Petti, Chair
Pat Burk Randall De Pry Yves Labissiere
Portland State University 2013

© 2013 Danielle Angelina Sheldrake
i
ABSTRACT
This mixed methods study identifies perceived causes of and solutions to the attrition of
special education teachers. Researchers have documented that special education teaching
positions encounter higher attrition rates than their general education peers (Katsiyannis,
Zhang, & Conroy in Olivarez & Arnold, 2006; Mitchell & Arnold, 2004; Otto & Arnold,
2005; Stempien & Loeb, 2002). More than 66 administrators and 200 special education
teachers/Teachers on Special Assignment (TOSAs) employed in the Portland, Oregon
metro area (Washington, Clackamas, and Multnomah counties) completed a survey on
special education teacher attrition and retention and identified what they believed are the
causes of high special education teacher attrition rates and what interventions would
increase rates of special education teacher retention. The results of the surveys from the
two sub-groups were compared and contrasted and it was determined administrators and
special education teachers share similar perceptions of the causes of high special
education teacher attrition rates and similar perceptions of interventions to increase
retention rates. The results were also analyzed to determine if administrators and special
education teachers and TOSAs identify the same causes of special education teacher
attrition and interventions to increase retention rates.
Keywords: Attrition, retention, special education teacher, administrator
ii
DEDICATION
I dedicate this dissertation to my wonderful and tremendously supportive family, Hudson
and Gregg Sheldrake.
I would like to thank my wonderful son and personal cheerleader, Hudson. He always
found ways to encourage me to keep working to achieve my goal of becoming “Dr.
Mama.” It was incredibly important to me that Hudson would witness the completion of
this project, so even when I felt like giving up I kept going so he could see me finally
attain my goal. I love you, Hudson.
I am especially grateful for my understanding and patient husband, Gregg, who has put
up with many years of coursework, research, and paper writing. He always understood
how important it was to me to complete this research and found ways to remind me of my
goals. Whenever I thought I should give up, he reminded me I was almost there. He
always knew how to appeal to my desire of completion. I would not be here without his
love and support. This dissertation was a labor of love as much for me as it was for him.
Thank you for being a wonderful husband and father. I love you.
iii
ACKNOWLEDGEMENTS
I am sincerely and heartily grateful to my advisor, Amy Petti, for the support and
guidance she has shown me throughout my dissertation writing. I am sure this would not
have been possible without her help.
I would also like to express gratitude to Stefanie Randol, GSE Scheduler and Doctoral
Program Assistant. If it were not for Stefanie and her diligence, I am sure I would not
have been able to overcome all the various administrative hurdles that come along with
completing a doctoral program.
I would like to express my sincere gratitude to Amanda Kathleen Connor Sanford for
taking the time to provide clear guidance and support regarding the methodology section
of my dissertation. Her feedback greatly assisted me with the data analysis portion of my
paper.
I would like to thank Moti Hara for his efforts with helping me design this research study
and explaining all there is to know about choosing to complete a quantitative study that
addresses the intended research questions.
I would like to thank Eva Liao-Holbrook for the effort and support she gave with the
quantitative analysis section of my paper. SPSS was so daunting to me, yet she managed
to lessen my fear and actually managed to teach me how to complete my data analysis.
iv
I would like to express my gratitude to Jolina Kwong Caputo, Kara McFall, and Amanda
Harris for their continuous support through this journey. When I thought I could not go
any further their own perseverance and support moved me along the way.
I would like to think my good friend Ashlee Marston for listening to hours of my
complaining about Data for Life “DFL” and giving up so much of her own time to coding
and recoding my qualitative data.
I would like to express thanks to my dissertation committee members, Pat Burk, Randy
De Pry, and Yves Labissiere for supporting me throughout this long journey and
reminding me that it was possible to complete this step in my journey.
Lastly, I would like to thank my family. I would like to thank my brother for his kind
words when I was doubtful I would complete my research. I would especially like to
thank my Mom and Dad for believing in me and for encouraging me to continue to reach
for another goal once one was completed.
v
TABLE OF CONTENTS Page
Abstract…………………………………………………………………………..……......i
Dedication……………………………………………………………………..………......ii
Acknowledgements………………………………………………………………...…….iii
List of Tables…………………………………………………………………..…………xi
List of Figures…………………………………………………………..………..……..xiv
CHAPTER
I. Introduction……………………………………………………………………...1
Study Rationale……………………………………………………………1
Significance………………………………………………………………..3
Researcher’s Interest………………………………………………………7
Problem Statement………………………………………………………...8
Research Questions………………………………………………………..8
Assumptions………………………………………………………..……..9
Definitions………………………………………………………………..10
II. Review of Related Literature…………………………………………………..13
Structure of the Literature Review……………………………………….13
Causes of and Interventions for Special Education Teacher Attrition…...13
Low Salaries……………………………………………………...13
Job Design and Role Dissonance………………………………...14
Workload…………………………………………………16 Paperwork………………………………………………..17
School Culture…………………………………………………...18
vi
Administrative Support…………………………………..18 Collegial Support………………………………………...20
Professional Growth…………………………………..………….21
Teacher Preparation Programs…………………………...21 New Special Education Teacher Mentor Programs……...22
Professional Development………………….……………23
Current Economic Conditions……………………………………………...……25
Limitations of Research Recommendations……………………………………..26
Salary Incentives…………………………………………………26
Job Design……………………………………...…………….......27
Collegial Support…………………………………………….......28
Professional Growth……………………………………………...29
Teacher Preparation Programs……………………….......29 New Special Education Teacher Mentor Programs……...29 Professional Development……………………………….30
Researcher’s Position…………………………………………………………….31
III. Methodology…………………………………………………………………...33
Study Overview………………………………………………………….33
Research Methodology…………………………………………………..33
Study Design……………………………………………………………..35
Research Questions Restated…………………………………………….36
Researcher’s Role………………………………………………………..36
Participants……………………………………………………………….36
Recruitment and Selection……………………………………………….37
Survey Design and Review………………………………………………38
Data Analysis…………………………………………………………….41
vii
Research Question One ………………..………………………...41
Variables…………………………………………...….…42 Statistical Analysis of Administrator Responses.………..45 Statistical Analysis of Special Education Teacher/TOSA. Responses...………………………………………………46
Research Question Two ……………….………………………...48
Variables…………………………………………………49 Qualitative Data Analysis……………………………......50 Quantitative Data Analysis……………………………....51
Research Question Three ………………………………………..54
Variables…………………………………………………55 Statistical Analysis of Administrator Responses………...57
Statistical Analysis of Special Education Teacher/ TOSA Responses……………………………………..….60
Research Question Four ………………………............................63
Variables….…………………………………………..….63 Qualitative Data Analysis……………………………......64 Quantitative Data Analysis……………………………....65
Validity……………………...…………………………………….……..68
Study Limitations………………………………………………………...70
IV. Findings……………………………………………………………………….71 Structure of Data Analysis……………………………………………….71 Research Question One……………………………………..……………71 Quantitative Analysis…………………………………………….71
Exploratory Factor Analyses (EFAs) of Perceived Causes……………………………………………………71
Results……………………………………………………75
Summary…………………………………………………………76 Research Question Two………………………………………………….79
viii
Qualitative Analysis……………………………………………...79 Coding of Qualitative Responses………………………...79 Qualitative Results……………………………………….82 Quantitative Analysis…………………………………………….83 Quantitative Results……………………………………...83 Summary…………………………………………………………86 Research Question Three………………………………………………...89 Quantitative Analysis………………………………………….....89
Exploratory Factor Analyses (EFAs) of Perceived Interventions……………………….………………….....89
Results……………………………………………………93
Summary…………………………………………………………94
Research Question Four…………………………………………...……..98 Qualitative Analysis……………………………………………...98 Coding of Qualitative Responses………………………...98 Qualitative Results……………………………………...101 Quantitative Analysis…………………………………………...102 Quantitative Results…………………………………….102 Summary………………………………..………………………105 Summary of Findings…………………………………………………...108
V. Discussion…………………………………………………………………..109
Structure of Discussion…………………………………………………109
Summary of Key Findings…………………………………………...…109
Perceived Causes of Attrition…………………………………..109 Implications……………………………………………….…….110 Perceived Interventions to Increase Retention………………….111
ix
Implications……………………………………………………..111 Discussion of Key Findings…………………………………………….111 Discussion of Additional Analysis……………………………………...114
Comparison of TOSAs and Non-TOSA Responses…………....114 Discussion………………………………………………………115
Comparison of District Administrator and Building Administrator Responses…………………………………….…115 Discussion………………………………………………………116
Years Remaining in the Profession……………………………..116 Discussion………………………………………………………117 Economic Impact……………………………………………….118 Discussion………………………………………………………118 Recommendations………………………………………………………118 Recommendations for Special Education Leaders…………..…118 Recommendations for District Leaders………………………...119 Recommendations for Teacher Preparation Programs…………120 Limitations of the Study………………………………………………...120 Limitations to Validity, Reliability, and Objectivity…………...120 Limitations to Trustworthiness of Qualitative Data…………….121 Recommendations for Further Research………………………………..121 My Action Plan…………………………………………………………122 Researcher’s Summary…………………………………………………123
References………………………………………………………………………………124
Appendices……………………………………………………………………………...132
A. Email List Correspondence…………………………………………………132
B. Administrator Survey Request Email ……………………………………...134
x
C. Special Education Teacher/Special Education Teacher on Special Assignment (TOSA) Survey Request Email ……………………………….137
D. Administrator Survey ………………………………………………………139
E. Special Education Teacher/Special Education Teacher on Special Assignment (TOSA) Survey………………………………………………..150
F. Comparison of TOSA and Non-TOSA Data Tables………………………..159
G. Comparison of District Administrator and Building Administrator Data Tables……………………………………………………………………….161
H. Comparison of Years Remaining the Profession Data Tables……………...164
I. Economic Impact Data Tables……………………………………………...167
xi
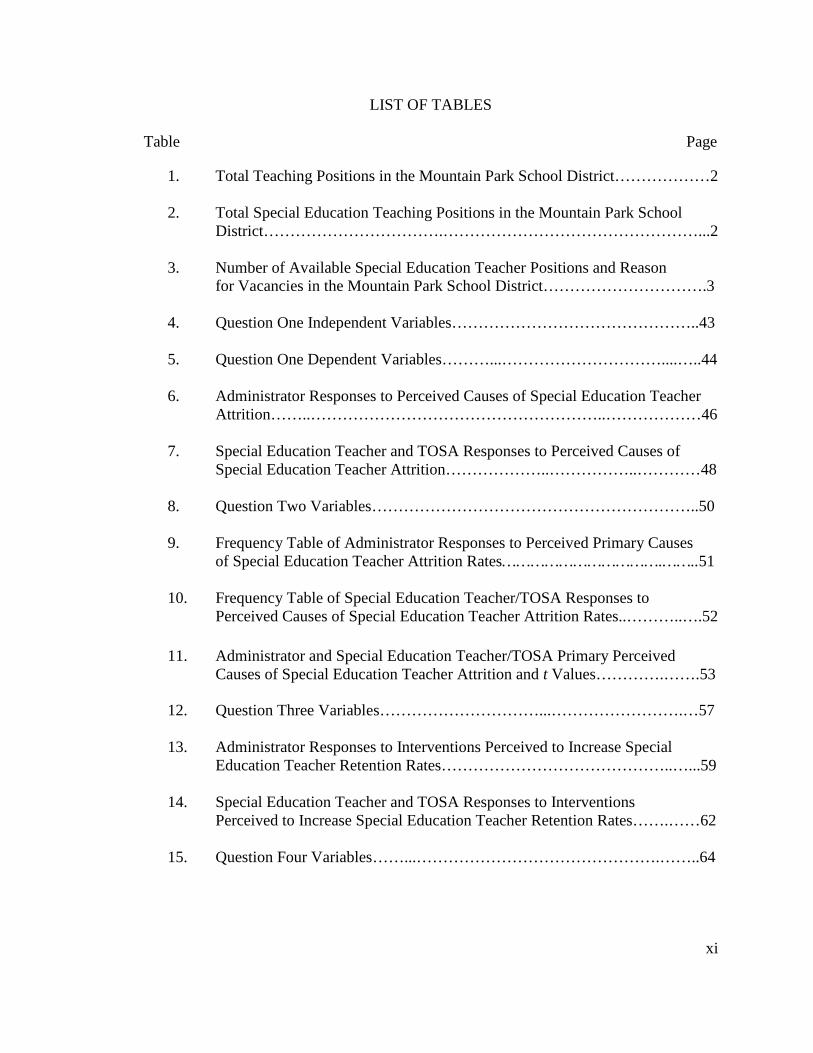
LIST OF TABLES
Table Page
1. Total Teaching Positions in the Mountain Park School District………………2
2. Total Special Education Teaching Positions in the Mountain Park School District…………………………….…………………………………………...2
3. Number of Available Special Education Teacher Positions and Reason for Vacancies in the Mountain Park School District………………………….3
4. Question One Independent Variables………………………………………..43
5. Question One Dependent Variables………...…………………………....…..44
6. Administrator Responses to Perceived Causes of Special Education Teacher Attrition……..………………………………………………..………………46
7. Special Education Teacher and TOSA Responses to Perceived Causes of Special Education Teacher Attrition………………..……………..…………48
8. Question Two Variables……………………………………………………..50
9. Frequency Table of Administrator Responses to Perceived Primary Causes of Special Education Teacher Attrition Rates…………………………….……..51
10. Frequency Table of Special Education Teacher/TOSA Responses to Perceived Causes of Special Education Teacher Attrition Rates..………..….52
11. Administrator and Special Education Teacher/TOSA Primary Perceived
Causes of Special Education Teacher Attrition and t Values………….…….53
12. Question Three Variables…………………………...…………………….…57
13. Administrator Responses to Interventions Perceived to Increase Special Education Teacher Retention Rates……………………………………..…...59
14. Special Education Teacher and TOSA Responses to Interventions Perceived to Increase Special Education Teacher Retention Rates…….……62
15. Question Four Variables……...……………………………………….……..64
xii
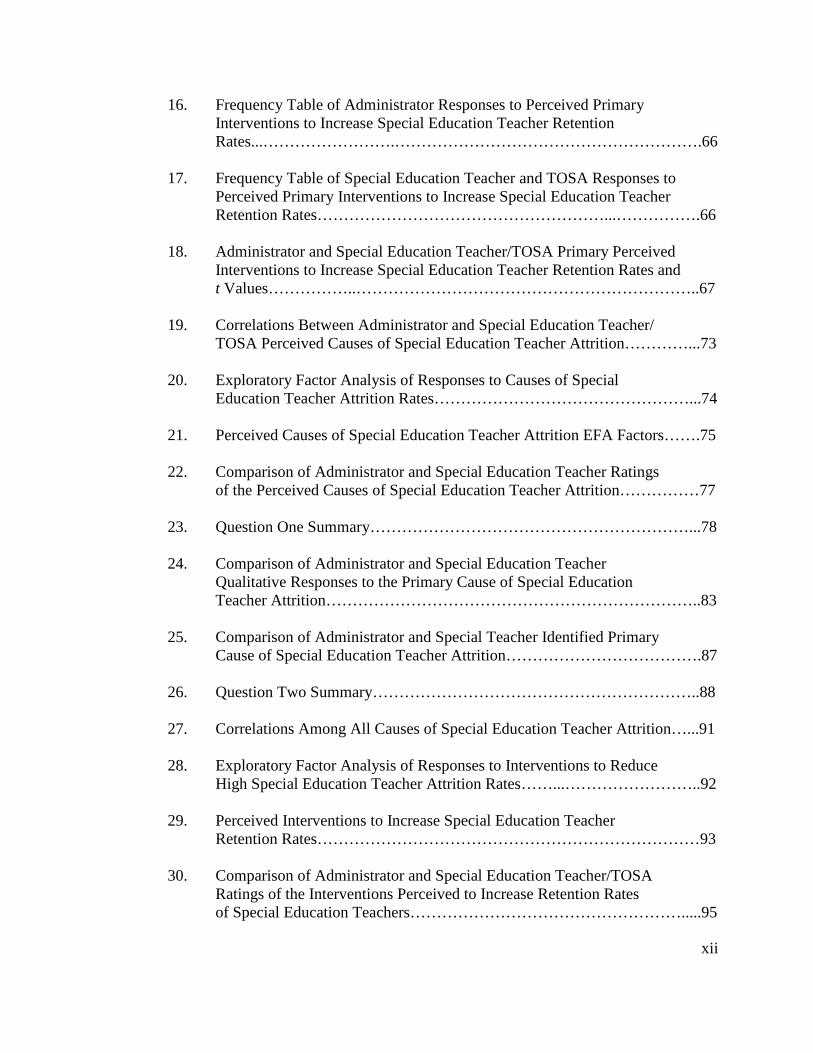
16. Frequency Table of Administrator Responses to Perceived Primary Interventions to Increase Special Education Teacher Retention Rates...…………………….………………………………………………….66
17. Frequency Table of Special Education Teacher and TOSA Responses to Perceived Primary Interventions to Increase Special Education Teacher Retention Rates………………………………………………...…………….66
18. Administrator and Special Education Teacher/TOSA Primary Perceived Interventions to Increase Special Education Teacher Retention Rates and t Values……………..………………………………………………………..67
19. Correlations Between Administrator and Special Education Teacher/ TOSA Perceived Causes of Special Education Teacher Attrition…………...73
20. Exploratory Factor Analysis of Responses to Causes of Special Education Teacher Attrition Rates…………………………………………...74
21. Perceived Causes of Special Education Teacher Attrition EFA Factors…….75
22. Comparison of Administrator and Special Education Teacher Ratings of the Perceived Causes of Special Education Teacher Attrition……………77
23. Question One Summary……………………………………………………...78
24. Comparison of Administrator and Special Education Teacher Qualitative Responses to the Primary Cause of Special Education Teacher Attrition……………………………………………………………..83
25. Comparison of Administrator and Special Teacher Identified Primary Cause of Special Education Teacher Attrition……………………………….87
26. Question Two Summary……………………………………………………..88
27. Correlations Among All Causes of Special Education Teacher Attrition…...91
28. Exploratory Factor Analysis of Responses to Interventions to Reduce High Special Education Teacher Attrition Rates……...……………………..92
29. Perceived Interventions to Increase Special Education Teacher Retention Rates………………………………………………………………93
30. Comparison of Administrator and Special Education Teacher/TOSA Ratings of the Interventions Perceived to Increase Retention Rates of Special Education Teachers…………………………………………….....95
xiii
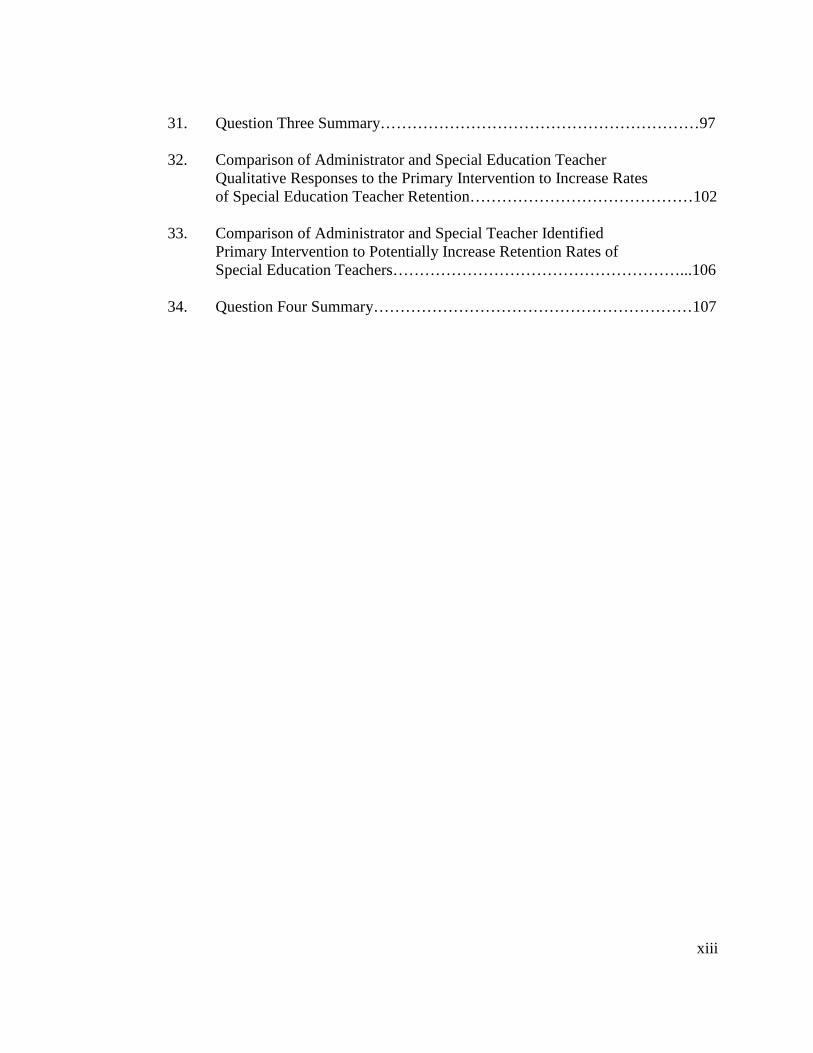
31. Question Three Summary……………………………………………………97
32. Comparison of Administrator and Special Education Teacher
Qualitative Responses to the Primary Intervention to Increase Rates of Special Education Teacher Retention……………………………………102
33. Comparison of Administrator and Special Teacher Identified Primary Intervention to Potentially Increase Retention Rates of Special Education Teachers………………………………………………...106
34. Question Four Summary……………………………………………………107

xiv
LIST OF FIGURES
Figure Page
1. Impact of High Caseload on Attrition……………………………………....113
2. Impact of Lower Caseload on Retention…………………………………...113
1
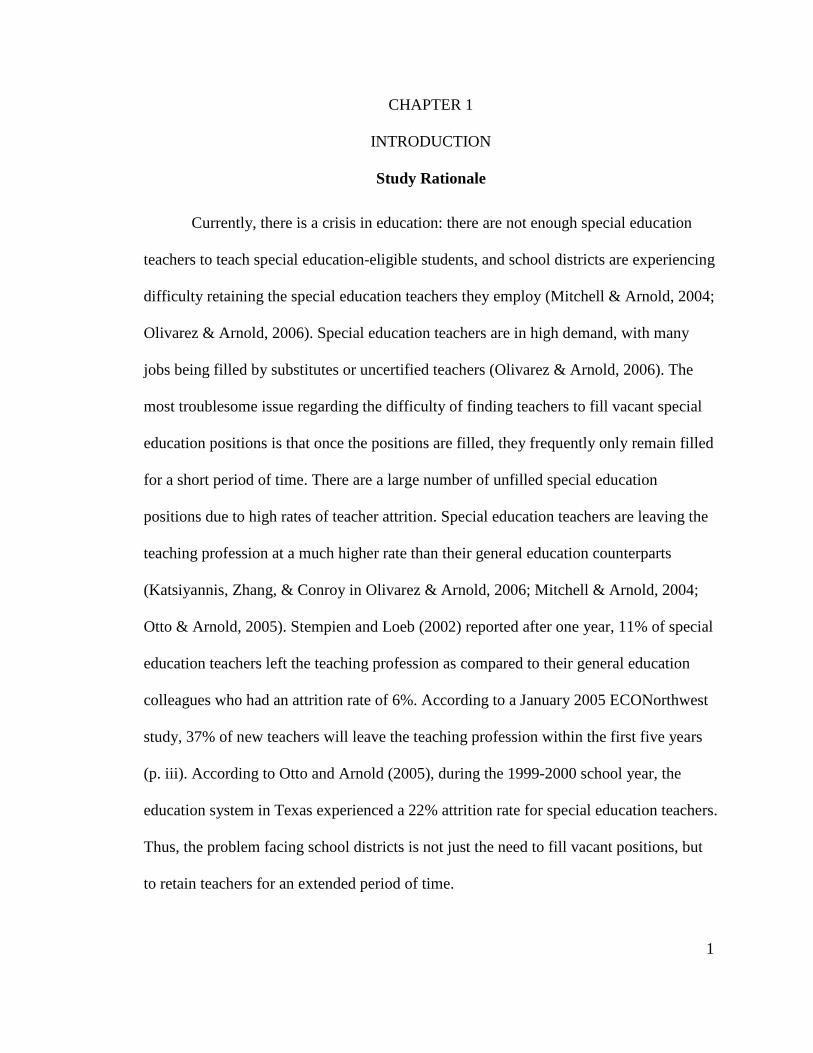
CHAPTER 1
INTRODUCTION
Study Rationale
Currently, there is a crisis in education: there are not enough special education
teachers to teach special education-eligible students, and school districts are experiencing
difficulty retaining the special education teachers they employ (Mitchell & Arnold, 2004;
Olivarez & Arnold, 2006). Special education teachers are in high demand, with many
jobs being filled by substitutes or uncertified teachers (Olivarez & Arnold, 2006). The
most troublesome issue regarding the difficulty of finding teachers to fill vacant special
education positions is that once the positions are filled, they frequently only remain filled
for a short period of time. There are a large number of unfilled special education
positions due to high rates of teacher attrition. Special education teachers are leaving the
teaching profession at a much higher rate than their general education counterparts
(Katsiyannis, Zhang, & Conroy in Olivarez & Arnold, 2006; Mitchell & Arnold, 2004;
Otto & Arnold, 2005). Stempien and Loeb (2002) reported after one year, 11% of special
education teachers left the teaching profession as compared to their general education
colleagues who had an attrition rate of 6%. According to a January 2005 ECONorthwest
study, 37% of new teachers will leave the teaching profession within the first five years
(p. iii). According to Otto and Arnold (2005), during the 1999-2000 school year, the
education system in Texas experienced a 22% attrition rate for special education teachers.
Thus, the problem facing school districts is not just the need to fill vacant positions, but
to retain teachers for an extended period of time.

2
In the Mountain Park School District, a rural mid-size Northwest United States
school district, there has been a steady decline in overall teaching positions; however,
there has been an increase each year in the number of special education teacher positions.
Special education teaching openings in the district have not only been the result of new
positions, but the need to fill vacant positions from staff members who chose to resign for
the following reasons: employment in a more central district, avoid being non-renewed
based on poor performance, pursuit of higher education opportunities, transfer to a non-
teaching position, or retirement. Even with a decline in economic resources, school
districts still need to fill special education teacher positions.
Table 1 Total Teaching Positions in the Mountain Park School District School Year Total Teaching Positions 2008-2009 156.1 2009-2010 145.3 2010-2011 139.7 2011-2012 134.2
Table 2 Total Special Education Teaching Positions in the Mountain Park School District School Year Total Special Education Teaching Positions 2008-2009 13 2009-2010 13.5 2010-2011 14.5 2011-2012 15.0
3
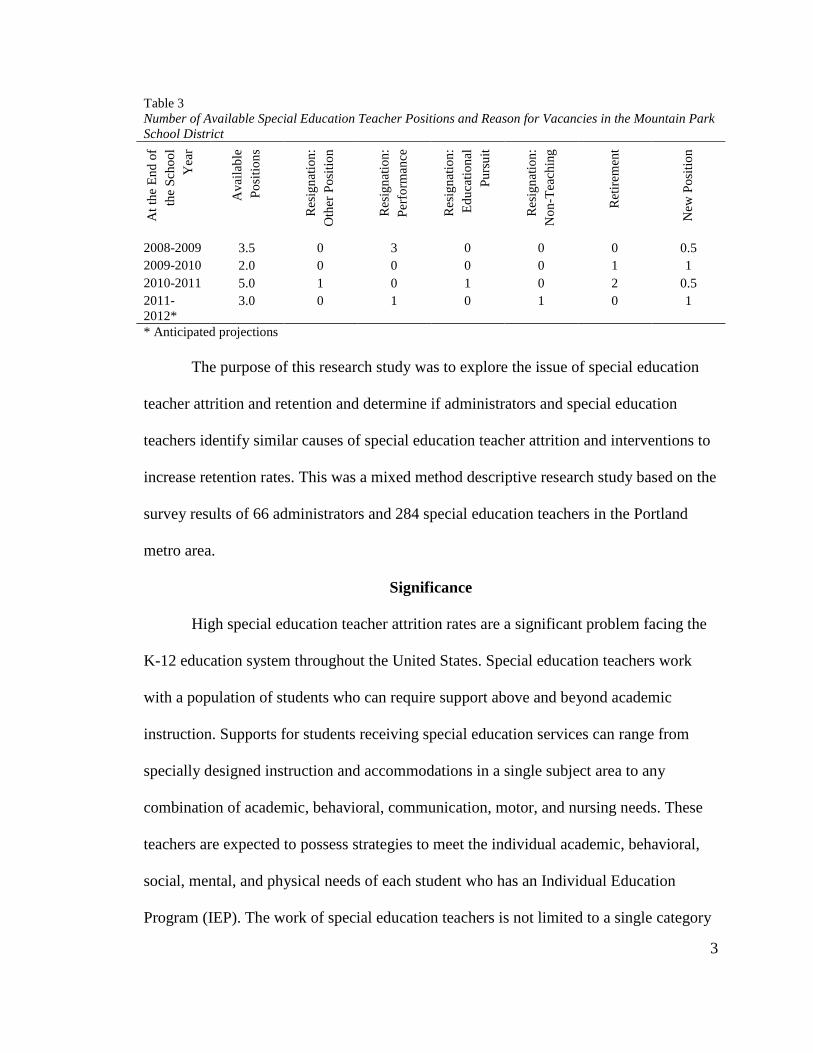
Table 3 Number of Available Special Education Teacher Positions and Reason for Vacancies in the Mountain Park School District
At t
he
En
d o
f th
e S
cho
ol
Yea
r
Ava
ilab
le
Po
sitio
ns
Res
ign
atio
n:
Oth
er P
osi
tion
Res
ign
atio
n:
Per
form
ance
Res
ign
atio
n:
Ed
uca
tion
al
Pu
rsu
it
Res
ign
atio
n:
No
n-T
each
ing
Ret
irem
ent
New
Po
sitio
n
2008-2009 3.5 0 3 0 0 0 0.5 2009-2010 2.0 0 0 0 0 1 1 2010-2011 5.0 1 0 1 0 2 0.5 2011-2012*
3.0 0 1 0 1 0 1
* Anticipated projections The purpose of this research study was to explore the issue of special education
teacher attrition and retention and determine if administrators and special education
teachers identify similar causes of special education teacher attrition and interventions to
increase retention rates. This was a mixed method descriptive research study based on the
survey results of 66 administrators and 284 special education teachers in the Portland
metro area.
Significance
High special education teacher attrition rates are a significant problem facing the
K-12 education system throughout the United States. Special education teachers work
with a population of students who can require support above and beyond academic
instruction. Supports for students receiving special education services can range from
specially designed instruction and accommodations in a single subject area to any
combination of academic, behavioral, communication, motor, and nursing needs. These
teachers are expected to possess strategies to meet the individual academic, behavioral,
social, mental, and physical needs of each student who has an Individual Education
Program (IEP). The work of special education teachers is not limited to a single category
4
of learner; rather they work with a wide range of students with a variety of special needs
and who are identified under the following special education eligibility categories:
intellectual disability, hearing impairment, visual impairment, deaf blindness,
communication disorder, emotional disturbance, orthopedic impairment, traumatic brain
injury, other health impairment, autism spectrum disorder, and specific learning
disability. Individuals with disabilities are a marginalized population in society who
frequently do not have access to the same resources as their typically developing peers
(Kliewer, Biklen, & Kasa-Hendrickson, 2006).
Although students with disabilities are often struggling with a multitude of
barriers that the special education teacher is attempting to address through an individual
IEP, the student is still expected to make growth towards grade level standards. It is the
expectation that the special education teacher will get students to where they need to be
regardless of how large the hurdle. The Elementary and Secondary Education Act
(ESEA) details that all students, typically developing or students with disabilities, are
required to be assessed annually to determine their level of progress towards meeting
grade level standards. Schools that do not demonstrate adequate yearly progress (AYP)
for all students including disaggregated sub-group populations (such as student with
disabilities) will be labeled as a “Challenge school” as defined in the 2010 Blueprint for
Reform and will be subject to defined sanctions (p. 10). Defined sanctions for “Challenge
schools” become increasingly prescriptive over time. Identified “Challenge schools” will
be required to implement “one of four turnaround models,” then develop and implement
an intervention plan for improvement that includes research-based practices, then
potentially required to make staffing changes, and last be limited in the use of ESEA
5
funds (Blueprint for Reform, 2010, p. 10). A key component to maintaining adequate
yearly progress is a skilled and stable base of educators. As Connelly and Graham (2009)
declared, “High levels of teacher attrition reduce teacher quality and interfere with efforts
for school and program improvement” (p. 259). Special education teachers often face a
disproportionate responsibility and challenge with regard to meeting the individual needs
of students, while also preventing the school from becoming a “Challenged School” due
to their students’ assessment scores. It is the role of the special educator to provide
students with the tools of empowerment to advocate for their wants and needs in order to
become contributing members of society; it is also their role to ensure students are
making adequate yearly progress towards meeting grade level standards to prevent the
school from failing to meet federal improvement standards. The need for a skilled and
stable base of special education teachers is underscored by this challenging set of
expectations.
With the knowledge that students with disabilities who are eligible for special
education need additional instruction, resources, and accommodations to make academic
and/or behavioral progress, it is clear that they are also the students who require the most
consistency in their school environment. On a daily basis, students with disabilities have
to cope with their disability and the potential accompanying limitations. Complex support
systems are often needed in order to provide students with disabilities access to the
school curriculum and to build independence. The special education teacher is the
advocate that ensures students with disabilities have the same access to resources as their
typical peers.
6
The problem that arises when school districts cannot retain their special education
teachers is that the students lose their school building advocate who bridges the support
system that is created through the IEP process and the school. Each time a new special
education teacher is hired, there is an acclimation period when the new teacher must
become familiar with the protocols for the student and develop relationships with the
general education community to ensure that the needs of the students are being met
outside of the special education classroom. The process of becoming acquainted with a
new student and the school community equates to a loss in learning time for the student
(Watlington, Shockley, Guglielmino, & Felsher, 2010). Patricia Alexander (2003) wrote,
“Students [the new teacher] in acclimation have characteristically limited and fragmented
knowledge. This piecemeal knowledge comes with little personal investment in the
domain and strong reliance on surface-level strategies” (p. 12). During the new teacher’s
acclimation period, the student with a disability is experiencing limited access to
resources since their advocate is not knowledgeable of all of their individual needs and is
only utilizing their established skill set. As the previous Director of Supported Education
for a mid-size rural Northwest United States school district and as the current
Administrator of Student Services for a large metro Northwest United States school
district, I have frequently witnessed that months go by until a general or special education
teacher realizes a student is supposed to be receiving some form of accommodation,
because the special education teacher was new to the position and unaware of the
accommodation; at best, the accommodation was improperly implemented. Students with
disabilities need continual support, not gaps in service which further challenge them. In
Watlington et al.’s (2010) view, “All too often teacher attrition can accentuate the
7
injurious effects of poverty and discrimination on educational attainment” (p. 34). If
school districts want to ensure the success of students with disabilities, it is their duty to
create systems that support the retention of teachers who have the expertise to empower
students to be successful and to fight the oppression of students with disabilities.
Researcher’s Interest
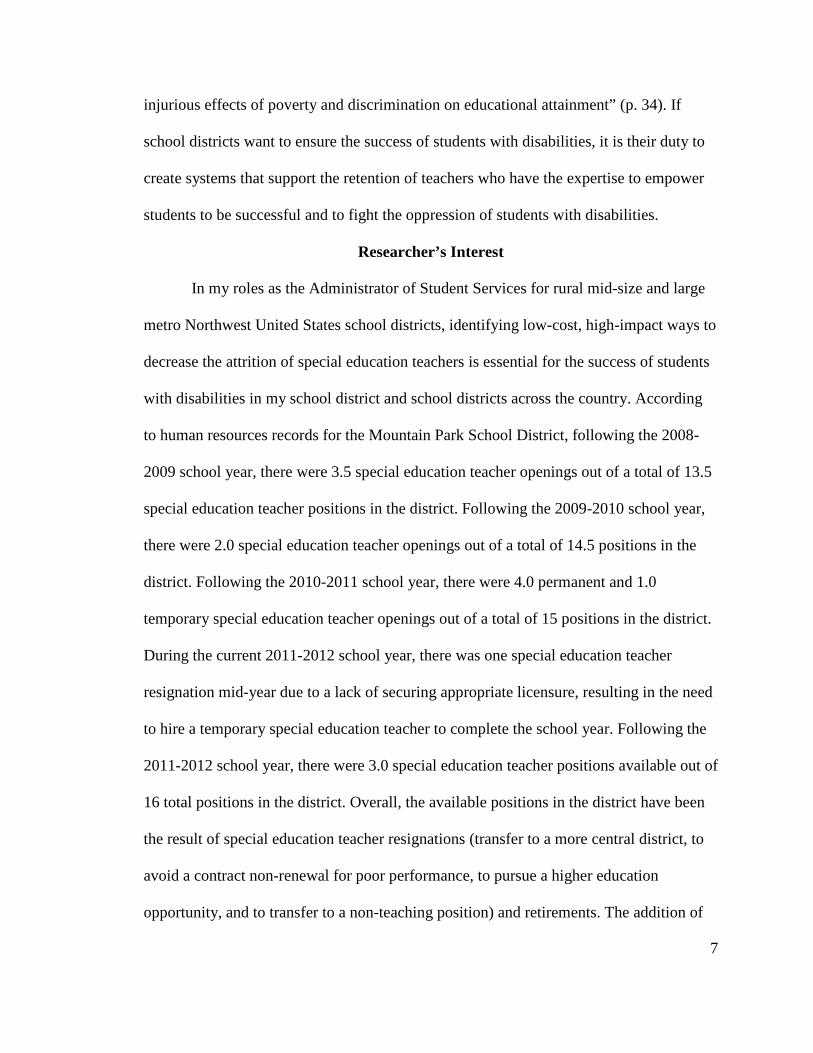
In my roles as the Administrator of Student Services for rural mid-size and large
metro Northwest United States school districts, identifying low-cost, high-impact ways to
decrease the attrition of special education teachers is essential for the success of students
with disabilities in my school district and school districts across the country. According
to human resources records for the Mountain Park School District, following the 2008-
2009 school year, there were 3.5 special education teacher openings out of a total of 13.5
special education teacher positions in the district. Following the 2009-2010 school year,
there were 2.0 special education teacher openings out of a total of 14.5 positions in the
district. Following the 2010-2011 school year, there were 4.0 permanent and 1.0
temporary special education teacher openings out of a total of 15 positions in the district.
During the current 2011-2012 school year, there was one special education teacher
resignation mid-year due to a lack of securing appropriate licensure, resulting in the need
to hire a temporary special education teacher to complete the school year. Following the
2011-2012 school year, there were 3.0 special education teacher positions available out of
16 total positions in the district. Overall, the available positions in the district have been
the result of special education teacher resignations (transfer to a more central district, to
avoid a contract non-renewal for poor performance, to pursue a higher education
opportunity, and to transfer to a non-teaching position) and retirements. The addition of
8
three special education teaching positions over the four-year period has been in response
to the increase in the number of students identified for special education services in the
district. Given the impact of special education teacher attrition on the progress of students
with disabilities, the requirement to meet the regulations of the 2004 Individuals with
Disabilities Education Improvement Act (IDEA), the federal and state mandate that
students meet academic benchmarks, and limited funding for educational programs, it is
imperative to identify supports for special education teachers that will increase the
likelihood that they will remain in the field of special education.
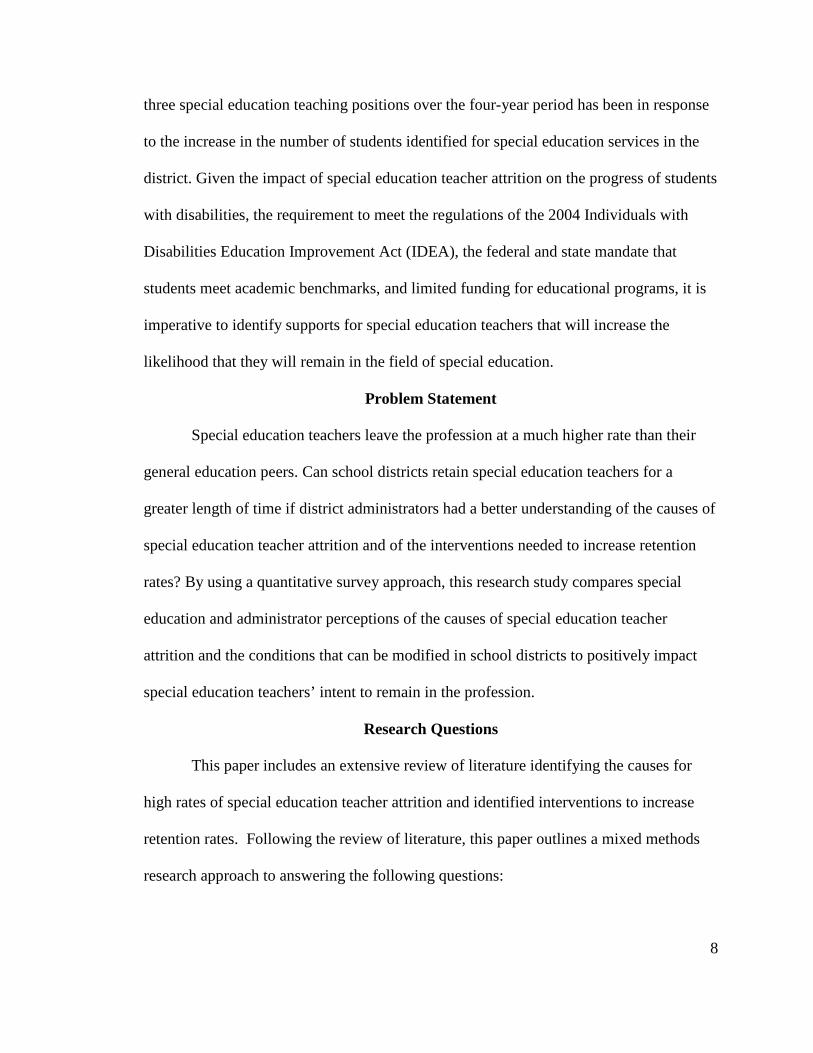
Problem Statement
Special education teachers leave the profession at a much higher rate than their
general education peers. Can school districts retain special education teachers for a
greater length of time if district administrators had a better understanding of the causes of
special education teacher attrition and of the interventions needed to increase retention
rates? By using a quantitative survey approach, this research study compares special
education and administrator perceptions of the causes of special education teacher
attrition and the conditions that can be modified in school districts to positively impact
special education teachers’ intent to remain in the profession.
Research Questions
This paper includes an extensive review of literature identifying the causes for
high rates of special education teacher attrition and identified interventions to increase
retention rates. Following the review of literature, this paper outlines a mixed methods
research approach to answering the following questions:
9
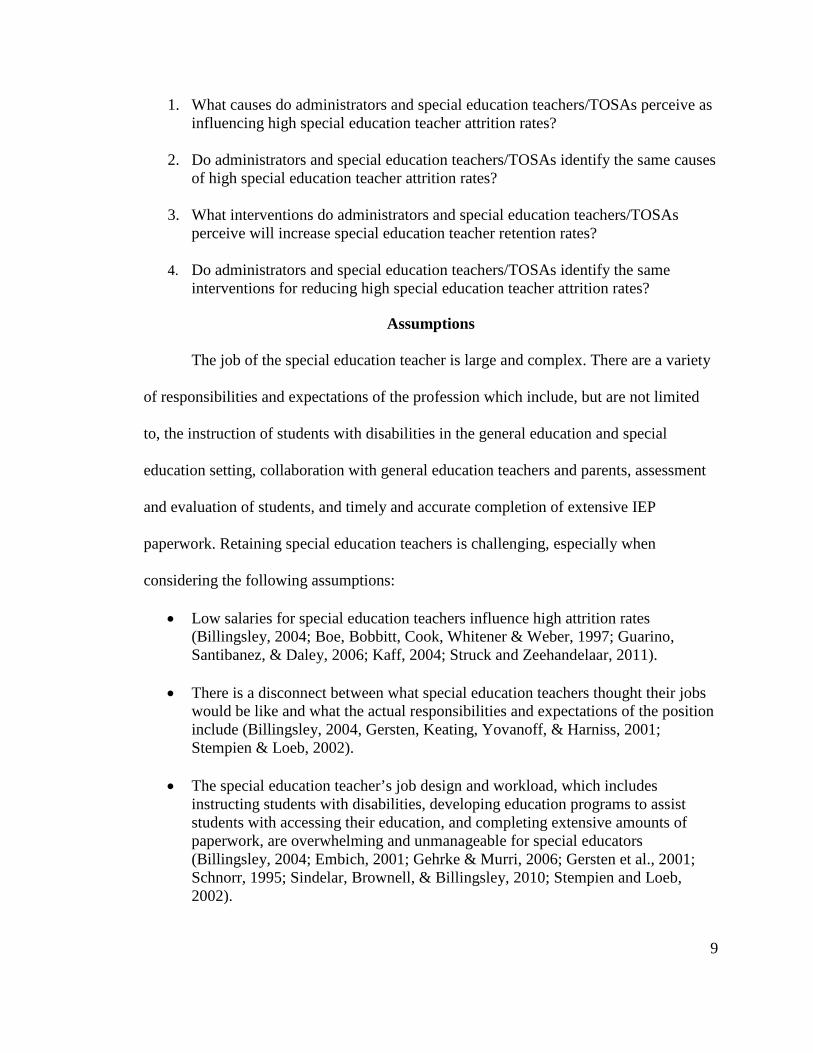
1. What causes do administrators and special education teachers/TOSAs perceive as influencing high special education teacher attrition rates?
2. Do administrators and special education teachers/TOSAs identify the same causes of high special education teacher attrition rates?
3. What interventions do administrators and special education teachers/TOSAs perceive will increase special education teacher retention rates?
4. Do administrators and special education teachers/TOSAs identify the same interventions for reducing high special education teacher attrition rates?
Assumptions
The job of the special education teacher is large and complex. There are a variety
of responsibilities and expectations of the profession which include, but are not limited
to, the instruction of students with disabilities in the general education and special
education setting, collaboration with general education teachers and parents, assessment
and evaluation of students, and timely and accurate completion of extensive IEP
paperwork. Retaining special education teachers is challenging, especially when
considering the following assumptions:
• Low salaries for special education teachers influence high attrition rates (Billingsley, 2004; Boe, Bobbitt, Cook, Whitener & Weber, 1997; Guarino, Santibanez, & Daley, 2006; Kaff, 2004; Struck and Zeehandelaar, 2011).
• There is a disconnect between what special education teachers thought their jobs would be like and what the actual responsibilities and expectations of the position include (Billingsley, 2004, Gersten, Keating, Yovanoff, & Harniss, 2001; Stempien & Loeb, 2002).
• The special education teacher’s job design and workload, which includes instructing students with disabilities, developing education programs to assist students with accessing their education, and completing extensive amounts of paperwork, are overwhelming and unmanageable for special educators (Billingsley, 2004; Embich, 2001; Gehrke & Murri, 2006; Gersten et al., 2001; Schnorr, 1995; Sindelar, Brownell, & Billingsley, 2010; Stempien and Loeb, 2002).
10
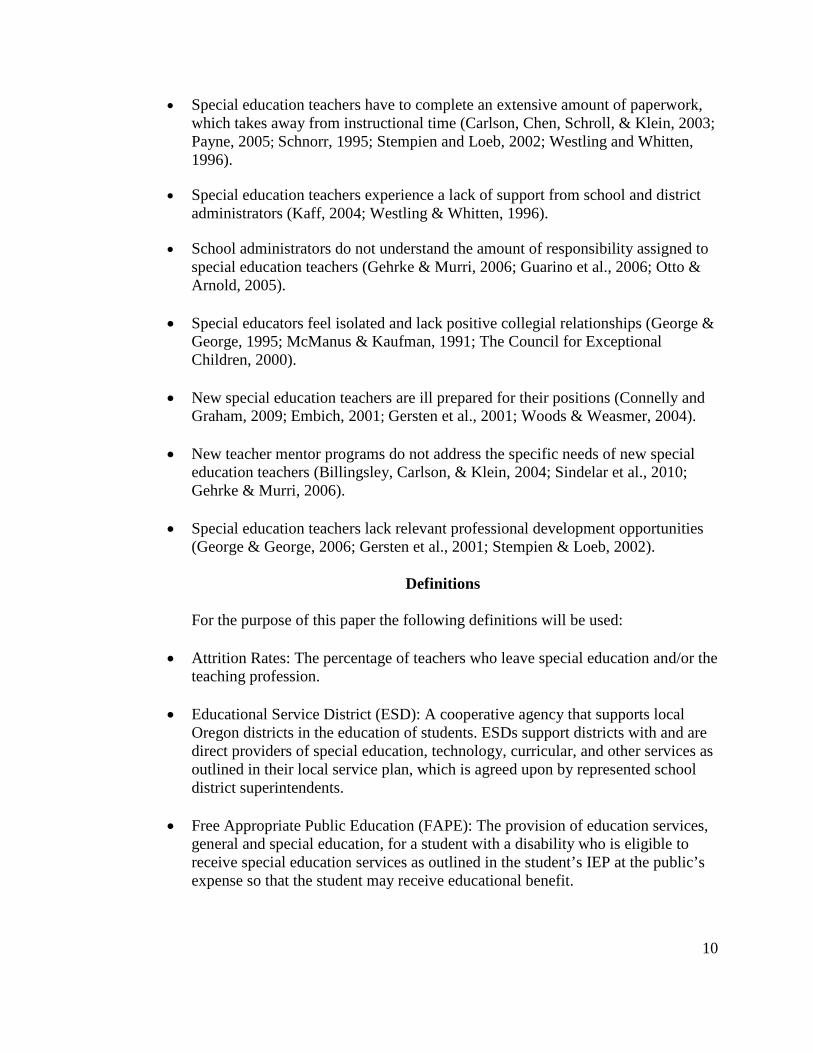
• Special education teachers have to complete an extensive amount of paperwork, which takes away from instructional time (Carlson, Chen, Schroll, & Klein, 2003; Payne, 2005; Schnorr, 1995; Stempien and Loeb, 2002; Westling and Whitten, 1996).
• Special education teachers experience a lack of support from school and district administrators (Kaff, 2004; Westling & Whitten, 1996).
• School administrators do not understand the amount of responsibility assigned to special education teachers (Gehrke & Murri, 2006; Guarino et al., 2006; Otto & Arnold, 2005).
• Special educators feel isolated and lack positive collegial relationships (George & George, 1995; McManus & Kaufman, 1991; The Council for Exceptional Children, 2000).
• New special education teachers are ill prepared for their positions (Connelly and Graham, 2009; Embich, 2001; Gersten et al., 2001; Woods & Weasmer, 2004).
• New teacher mentor programs do not address the specific needs of new special education teachers (Billingsley, Carlson, & Klein, 2004; Sindelar et al., 2010; Gehrke & Murri, 2006).
• Special education teachers lack relevant professional development opportunities (George & George, 2006; Gersten et al., 2001; Stempien & Loeb, 2002).
Definitions
For the purpose of this paper the following definitions will be used:
• Attrition Rates: The percentage of teachers who leave special education and/or the teaching profession.
• Educational Service District (ESD): A cooperative agency that supports local Oregon districts in the education of students. ESDs support districts with and are direct providers of special education, technology, curricular, and other services as outlined in their local service plan, which is agreed upon by represented school district superintendents.
• Free Appropriate Public Education (FAPE): The provision of education services, general and special education, for a student with a disability who is eligible to receive special education services as outlined in the student’s IEP at the public’s expense so that the student may receive educational benefit.

11
• General Education Setting: School setting inclusive of both typically developing students and students with disabilities. The focus of this educational setting is for students to access the educational curriculum designed for typically developing students.
• Individual Education Program (IEP): An individual program developed by a team of professionals, including the parents, specifying instructional needs, services, accommodations, modifications, and/or supports for personnel in order for the student to make academic, social, behavioral, physical, and/or emotional progress toward their individual annual goals.
• Mentor Program: A program developed to support new teachers by providing an experienced teacher to support and guide novice teachers in all areas of the education profession.
• Mentor Teacher: An experienced teacher who works with and supports new teachers with their transition to the education profession.
• Portland Metro Area: Composed of the Oregon counties of Clackamas, Multnomah, and Washington.
• Special Education Teacher: A teacher who designs and delivers specially designed instruction and services to students who are eligible for special education services and have an Individual Education Program (IEP); the case manager responsible for completing special education paperwork for a student eligible for special education services; and/or a teacher who possesses a specialized teaching license for instructing students with disabilities.
• Student with a Disability: A student who has been found eligible for special education services under one or more of Oregon’s twelve1 disability categories: Developmental Delay, Intellectual Disability, Hearing Impairment, Visual Impairment, Deaf Blindness, Communication Disorder, Emotional Disturbance, Orthopedic Impairment, Traumatic Brain Injury, Other Health Impairment, Autism Spectrum Disorder, and Specific Learning Disability.
• Teacher on Special Assignment (TOSA): A special education teacher with teacher
status who coaches special education teachers and/or completes administrative tasks related to special education.
1 There are twelve disability categories recognized in Oregon for Early Intervention and Early Childhood Special Education (birth-5 years old). This includes the eligibility category of Development Disability. There are only eleven disability categories recognized for school-age special education eligibility (5-21 years old). School-age eligibility does not include the category of Developmental Delay.

12
• Teacher Retention: The process of keeping teachers in the special education teaching profession.
• Typical Peer: A student who is not eligible for special education services.
13
CHAPTER 2
A REVIEW OF RELATED LITERATURE
Structure of the Literature Review
This chapter contains a review of literature related to the causes of high special
education teacher attrition and recommendations for increasing the retention of special
education teachers. The literature review is divided into three sections: literature related
to the causes of attrition and interventions to increase the retention of special education
teacher attrition, current economic conditions in Oregon, and the limitations of research
recommendations. Each section is divided into subsections that identify key themes in
current research and the impact on special education teacher attrition.
Causes of and Interventions for Special Education Teacher Attrition
Low Salaries
Low salaries for special education teachers have been cited as a contributing
factor of high special education teacher attrition rates. There are multiple factors that
researchers suggest as influencing special education teachers to leave the profession;
however, the link between those factors and poor pay increase the probability that new
special education teachers will leave the profession. A study completed by Kaff (2004)
reported “Thirty-four percent (n=55) [of special educators surveyed] expressed concerns
over compensation including routinely performing many extra duties that extended
beyond the school day without additional pay” (p. 13).
Research suggests that an increase in teacher salary will increase the number of
special education teaching applicants and will also encourage teachers to remain in the
special education teaching profession. Through the completion of an extensive review of
14
literature related to teacher attrition, Guarino et al. (2006) concluded, “The recent
empirical literature found that higher salaries were associated with lower teacher attrition
and that teachers were responsive to salaries outside their districts and their profession”
(p. 194). According to Struck and Zeehandelaar (2011), “Research shows that higher
salaries are associated with the increased recruitment and retention of higher quality
teachers and influence where a teacher decides to work or whether a qualified graduate
enters industry rather than teaching” (p. 272). According to Miller et al. (1999) and
Singer (1992), as cited in Billingsley (2004), “Special educators with higher paying jobs
[are] more likely to stay than those with lower paying jobs” (p. 45). A study completed
by Boe et al. (1997) found that “Both school transfer and attrition declined systematically
and substantially with increasing salary levels” (p. 6). Henke et al., as cited in Billingsley
(2004), concluded, “Districts and schools that cannot offer competitive salaries are likely
to be at a serious disadvantage when it comes to hiring and retaining teachers” (p. 45). In
sum, then, when looking at ways to decrease the attrition of special education teachers,
school districts should seriously take into consideration the positive impact an increase in
salary can have on the retention of special education teachers.
Job Design and Role Dissonance
A number of educational researchers studying special education teacher attrition
have suggested that the dissonance between the special education teacher’s job design
and their expectation of the job has a direct impact on their decision to leave the
profession. According to Evans (1997) as cited in Stempien and Loeb (2002), “Educators
of students with special needs may begin their careers with high expectations that they
will be able to overcome the unique challenges faced by their students” (p. 264). Gersten
15
et al. (2001) wrote, “In special education, stress due to poor job design is found in the
discrepancy between what teachers believe about their jobs (i.e., that they are there to
teach children with disabilities) and the realities of their jobs (i.e., burdensome paperwork
loads, extensive time spent in meetings, limited opportunities for individualization, and
huge ranges in student performance levels)” (pp. 562-563). Stempien and Loeb (2002)
acknowledged, “These educators’ need to cope with seemingly insoluble realities
probably provokes a sense of not measuring up to their own professional goals. This
results in stress, job frustration, and dissatisfaction” (p. 264).
Special education teachers are consistently faced with the day-to-day
responsibilities of a general education teacher in addition to the urgency of instructing
special education eligible students to meet their IEP goals and state standards, to
collaborate with general education teachers on how to modify curriculum, and to
complete the IEP paperwork responsibilities that ensure a student is able to receive a Free
and Appropriate Public Education (FAPE) (Gehrke & Murri, 2006). Weiskopf (1980) as
cited in Stempien and Loeb (2002) noted special education teachers experience a higher
level of job dissatisfaction as a result of “the pressure to complete tasks in a timely
manner” (p. 259). Morvant et al., (1995) as cited in Billingsley (2004) discovered that,
“Almost one third found conflicting goals, expectations, and directives to be a frequent
source of stress” (p. 47). Gersten et al., (2001) found, “Stress due to job design plays a
pivotal mediating role in determining the extent to which different aspects of teachers’
working conditions influence the decision to remain in or leave special education” (p.
563). Incidentally, special education teachers enter the teaching profession to educate and
advocate for students with disabilities, but in the end feel as though they spend most of
16
their time completing paperwork and responding to crises instead of educating children.
George and George (1995) concluded, “These [special education] teachers…felt that they
had little time to complete one of the most important aspects of their jobs, developing
appropriate curricula for their students” (pp. 12-13).
Workload. A number of researchers have suggested that the workload of special
education teachers has a direct impact on attrition rates. In a study completed by Morvant
et al., as cited in Billingsley (2004), “only half of the special educators in their study felt
that their workload was manageable. Sixty-eight percent felt they had too little time to do
their work” (p. 47). Weiskopf (1980), as cited in Stempien and Loeb (2002), listed
“several stressors specifically among teachers of exceptional children. These included the
heavy workload and the pressure to complete tasks in a timely manner” (p. 258). In a
study of special education teachers completed by Schnorr (1995), deterrents to remaining
in the special education profession were identified as follows: “There were four
frequently mentioned deterrents, including too much paperwork (71%), too many
students on caseload (64%), too many meetings (50%), and too much job stress (48%)”
(p. 30). Special education teachers are expected to do the work of a teacher and a case
manager and in many cases within the typical school day. In order to manage the
workload, many special education teachers work well beyond their contracted day.
A review of research reveals that the combination of job responsibilities, ranging
from instruction to paperwork, is a source of stress and frustration for many special
educators (Plash & Piotrowski, 2006). Gehrke and Murri (2006) reported, “Multiple roles
and responsibilities…were cited often as primary sources of frustration and stress for
special educators” (p. 180). Embich (2001) also found that, “Workload [has a] significant
17
contribution to feelings of emotional exhaustion in all [special education] positions” (p.
65). Sindelar et al., (2010) reported, “New SETs [Special Education Teachers] also
struggle to coordinate complex responsibilities, citing problems with organizing their
work and managing time, scheduling, caseloads, legal requirements, paperwork, and
meetings” (p. 17). In short, the workload expectations of special educators have a
significant impact on attrition rates.
Paperwork. Not only do special educators need to address their teaching
responsibilities but they also need to comply with federal and state IEP paperwork
requirements and timelines. According to a study completed by Carlson et al. (2003) for
the U.S. Department of Education, “Special education teachers typically spend over 10%
of their time completing forms and doing administrative paperwork” (p.1). According to
the results of Schnorr’s (1995) study, too much paperwork was identified as the number
one deterrent for special education teachers (p. 30). Westling and Whitten (1996) found
that “Teachers who were not planning to be in the same or similar position in 5
years…reported having…an inadequate amount of time for paperwork” (pp. 327 & 330).
Carlson et al. (2003) reported, “88% of special education teachers indicated that
administrative duties and paperwork interfered with their job of teaching to a moderate
extent (32%) or great extent (46%)” (p. 17). If special educators fail to meet paperwork
timelines, they run the risk of being legally out of compliance, which can result in
negative job performance reviews and/or legal and potentially costly implications for the
school district. Weiskopf (1980) as cited in Stempien and Loeb (2002) noted special
education teachers experience a higher level of job dissatisfaction as a result of “the
pressure to complete tasks in a timely manner (p. 259).” As Payne (2005) emphasizes,
18
“Many teachers that leave the field of education have become disgusted with the amount
of paperwork that is required to do the job” (p. 89).
School Culture
The issues special education teachers face are individual and complex; having a
support system to connect with others who have dealt with similar situations provides
support and guidance. Each special education teacher’s successes and failures impact the
direction of the special education department, so it is crucial for special education
teachers and administrators to work together. Educational researchers of special
education teacher retention and attrition agree developing collegial relationships and a
culture where special education teachers are valued will increase retention rates for
special education teachers (Gehrke & Murri, 2006; Gersten et al., 2001; Kaff, 2004; &
Stempien & Loeb, 2002).
Administrative support. When it comes to the topic of special education teacher
attrition, most researchers readily agree that a lack of support from school and district
administrators has a direct impact on the inability to retain special educators. Kaff (2004)
reported, “Lack of administrative support for special education was the most frequently
reported concern” (p. 12). A study of special educators completed by Westling and
Whitten (1996) found, “Teachers who were not planning to be in the same or similar
position in 5 years presented a picture of people who were frustrated with the system and
frustrated with those in the system who are perceived to affect their professional lives,
primarily administrators” (pp. 327 & 330). Cross and Billingsley (1994) determined that
special education teachers who had a positive perception of administrative support had an
overall higher job satisfaction; consequently, the teacher was more committed to
19
remaining in the teaching profession (p. 415). Boe, Barkanic, and Lowe (1999)
concluded, “In comparison with voluntary leavers, stayers were almost four times more
likely to perceive strongly school administrators’ behavior as supportive and encouraging
than to have the opposite view of administrative behavior” (pp. 20-21). A study
completed by George and George (1995) found, “Teachers intending to leave perceived
far less support and assistance than desired coming from their official supervisor” (p. 12).
These findings have important consequences for the boarder domain of teacher attrition,
because administrator support is an inexpensive intervention that can result in great
dividends for increasing special education teacher retention.
Research related to the retention and attrition of special education teachers
highlights the impact of administrative support, but the research offers few definitions of
administrative support. Instead, when asking special education teachers about factors that
influence their decision to leave the profession or remain in the profession, they are asked
if administrative support affects their decision to remain or leave the profession. Schnorr
(1995) wrote, “Administrator support is a nebulous concept” (p. 32). Westling and
Whitten (1996) identified characteristics of administrative support for special education
teachers as including, “Administrator-teacher conferences, setting aside time for
paperwork completion, and informing general educators about the role of special
educators and encouraging cooperative activities, particularly related to inclusion” (p.
333). It is clear that researchers have found that administrator support influences the
decision of special education teachers to leave or remain in the special education field,
but there does not exist a clear definition in the research regarding the exact qualities of
administrator support.
20
Collegial support. Special educators often feel isolated and excluded from their
colleagues and this lack of a collegial network lessens their overall connection to the
school environment, likewise decreasing their likelihood of remaining in the profession.
According to a report compiled by The Council for Exceptional Children (2000), “In
many situations, special education teachers are still considered “outside” the mainstream.
In addition, they are given few opportunities to collaborate with general or other special
educators. The result is a sense of isolation and powerlessness to effect change” (p. 3).
McManus and Kauffman (1991) highlighted, “most special education teachers look for
support from other special education teachers rather than from other professional
personnel, but even this contact is infrequent for many teachers” (p. 257). A study
completed by George and George (1995) found, “Opportunities for collaboration with
other teachers were infrequent” (p. 12). Billingsley, Carlson, and Klein (2004) identified
“feelings of not being included in their schools” as an area of concern for special
education teachers (p. 344). Special education teachers do not feel as though they are part
of the school community and have infrequent interactions with their special education
colleagues; these circumstances lead to a sense of isolation and feeling that they work in
an unsupportive environment.
When focusing on strategies to combat high special education teacher attrition
rates, administrators need to understand learning results from relationships (Bateson,
1994; Cole & Wertsch, 1996). A project completed by Scholastic and the Bill and
Melinda Gates Foundation (2010) found, “When asked about the things that are most
important in retaining good teachers, supportive leadership, time for collaboration and a
high-quality curriculum top the list, with supportive leadership by far the most important
21
factor in teacher retention” (p.39). Administrators need to provide meaningful
opportunities for teachers to interact with their colleagues in order for them to construct
an understanding of the educational process and best practices for teaching. George and
George (1995) emphasized, “Without opportunities to meet with other teachers to
articulate problems, brainstorm solutions, and otherwise share concerns about particular
students, teachers easily lost sight of the fact that other special educators often face
similar problems” (p.12).
Professional Growth
As regards the retention of special education teachers, school districts need to be
mindful that special education teachers are learners. Tennant and Pogson (1995)
emphasized, “Experience—and the ability to reflect upon and learn from that
experience—emerges as a key factor in the formation of adult personality and social
roles” (p. 67). If school administrators accept the notion that special education teachers
are students as well as instructors and guide professional development and support
around this notion, then through the implementation of targeted interventions and
learning opportunities, beginning special education teachers will be able to develop the
knowledge and skills needed to instruct students, develop strategies to bring about
successful learning for students with disabilities, and maintain paperwork compliance.
Teacher preparation programs. When it comes to the topic of special education
teacher attrition, researchers readily agree that new special education teachers are ill
prepared for their positions, resulting in high attrition rates. Current research on special
education teacher attrition highlights the concept that beginning special education
teachers are learners (Gersten et al., 2001; Woods & Weasmer, 2004). Special education
22
teachers do not come into the school setting on the first day with all the skills and
knowledge of veteran educators, which leads to increased feelings of frustration (Embich,
2001).
Connelly and Graham (2009) believe federal laws such as No Child Left Behind
(2002) have forced states, colleges, and school districts to find shorter, alternative routes
of special education teacher certification. According to Berry (2001) and Darling-
Hammond (1999) as cited in Connelly and Graham (2009), “Graduates of short-term, or
“short cut,” alternative routes (e.g., routes that provide summer training and/or minimal
to no pre-service teaching experience) were found to be at high risk for subsequent
attrition from the field” (p. 259). Embich’s (2001) study discovered that a “lack of
training can lead to elevated feelings of burnout” (p. 66). In sum, insufficient teacher
prepartion has an impact on special education teacher attrition rates.
New special education teacher mentor programs. Researchers have identified
strategies to decrease the high rate of special education teacher attrition, including
increasing salaries, offering administrative support, and improving student discipline
procedures; however, the strategy that some researchers suggest has a significant impact
on the attrition rates of beginning special education teachers is the development of
mentor programs (Guarino et al., 2006; Scherer, 1999; Strong, 2005). Billingsley (2003)
concluded, “Perceived effectiveness of mentoring is significantly correlated with
teachers’ plans to remain in special education and with special educators’ job
satisfaction” (p. 21). Sindelar et al., (2010) reported, “Mentoring seems to have a positive
impact on new SETs’ perceived effectiveness (Billingsley et al., 2004; Boe et al., 2008)
and intent to remain in their jobs (Whitaker, 2000)” (p. 10). Through mentor programs,
23
new special education teachers are provided with the opportunity to collaborate with
colleagues and observe lessons in other classrooms within a structured setting for
reflection. Mentor programs connect observation, collaboration, reflection, and theory;
this leads to successful teaching and learning experiences (Scherer, 1999). Schlichte,
Yssel, and Merbler (2005) insisted, “Mentoring has been identified as a critical factor in
eliminating feelings of isolation experienced by first-year special education teachers” (p.
36).
Research indicates that mentor programs can result in increased special education
teacher retention rates, but when developing programs it is important that they meet the
individual needs of the participants. According to Billingsley et al. (2004), “Regardless of
the form, induction support must be flexible and responsive to the needs of teachers and
the particular contexts in which they work” (p. 334). A study completed by Whitaker
(2000) revealed “a statistically significant relationship between the perceived overall
effectiveness of the mentoring and the first-year special education teacher’s plans to
remain in special education” (p. 563). Relevant and targeted mentor programs for special
education teachers, even though small, can result in an increased likelihood that the
teacher will remain in the special education profession.
Professional development. Research related to special education teacher
retention suggests that relevant professional development opportunities for special
education teachers are important for the retention of special educators (George & George,
2006; Gersten et al., 2001). Gersten et al. (2001) reported, “It is important that special
education teachers feel that—regardless of their years in education—they continue to
learn on the job” (p. 560). In a study completed by Schnorr (1995) an identified incentive
24
for remaining in the special education profession included “release time for professional
development” (p. 32). Bos, Nahmias, and Urban (1997), as cited in Stempien and Loeb
(2002), reported “positive responses to interactive professional development workshops,
particularly when the teachers’ attitudes and experiences were incorporated into planning
such courses” (p. 265). Special education teachers who have access to high quality and
relevant professional development opportunities are able to grow professionally and as a
result may feel more satisfied in their positions. Billingsley (2004) declared, “Teachers
who perceived greater professional development opportunities also experienced less role
dissonance” (p. 47). Special education teachers who have access to professional
development opportunities experience less disconnect between what they believe their
role and responsibilities include and what is actually expected from their position.
Teacher training programs and in-service opportunities need to create a
participative model of learning where the teachers connect the practice to the appropriate
context so they can apply and adapt it in a variety of situations (Sfard, 1998). Scholastic
and the Bill and Melinda Gates Foundation (2010) discovered, “Teachers at all levels of
experience value opportunities that promote professional learning and development.
More than 4 in 10 teachers—regardless of the length of time they have been teaching—
say it is ‘absolutely essential’ to provide opportunities for relevant professional
development in order to retain good teachers” (p.40). The role of quality professional
development and collegial collaboration has a long-term positive impact on teacher
retention, but the professional development opportunities need to be relevant. Gehrke and
Murri (2006) found, “The usefulness and appropriateness of the participants’ professional
development and induction year opportunities were an area of concern for most novice
25
teachers” (p. 185). Stempien and Loeb (2002) emphasized the need for professional
development while also highlighting the importance of “involving teachers in planning
strategies and decision making…[as] a way to maintain enthusiasm about the job” (p.
265). When offering professional development opportunities for special educators, it is
important that those opportunities relate directly to the identified needs of the
participants.
Current Economic Conditions in Oregon
From 2008 through the time of this writing (2013), Oregon and the United States
as a whole have been experiencing an economic downturn that has resulted in decreased
funding for K-12 education. The Editorial Projects in Education Research Center (2012a)
reported, “Effects of the economic downturn linger in American education, a year and a
half after the official end of the recession” (Key Findings section, para 3). According to a
report from the Confederation of School Administrators of Oregon (n.d.), “Over the past
three biennia, the share of the State Budget invested in Education has declined from
58.7% to 50.8%” (p.4). The decreased funding has resulted in increased class sizes,
reduced programs, and fewer resources for teachers (Oregon Education Association,
2011). According to information collected by the Editorial Projects in Education
Research Center (2012b) in Oregon, “No focal programs [programs intended to develop
and allocate teaching talent were] funded in 2010” (p. 5). These programs are still not
funded in the state of Oregon. When reviewing data from the Mountain Park School
District, over the past four school years there has been a decrease in teaching positions
correlating with decreased funding and increased staff salary costs; however, the
economic decline has had little impact on the district’s need to recruit and retain quality
26
special education teachers. While general education teachers are experiencing lay-offs
and districts are cutting positions that are open due to retirements or resignations, special
education positions are still available.
Limitations of Research Recommendations
The following section identifies limitations of current research with regard to how
interventions will impact special education teacher attrition rates. When reviewing
current literature, perceived administrator support was the one area that was consistently
identified as having a direct impact on a special educator’s intent to remain in the
profession. As a result, administrator support has not been identified as an area that has
any limitations for decreasing special education teacher attrition rates.
Salary Incentives
Research shows that an increase in salary can positively impact the attrition rates
of special education teachers. Although I agree with the use of salary incentives/increases
to decrease attrition rates for special education teachers, my overall experience with this
intervention is mixed. The use of salary incentives/increases cannot always be guaranteed
and are heavily reliant on positive economic conditions. Struck and Zeehandelaar (2011)
remind us:
Given the high costs related to increasing all teachers’ salaries across the board—and the associated increase in retirement spending—universal raises may not be a feasible or efficient solution to targeted staffing challenges. Especially as districts are faced with cuts in state-level education spending and layoffs to alleviate budget shortfalls. (p. 272).
Greenlee and Brown (2009) found that in order for salary increases to make an impact on
teacher retention, “Some estimates indicate that effective compensation inducements
need to be large (20-50% increase in salary) to retain teachers in schools that serve large
27
concentrations of low-income, low-performing and/or minority students” (p. 99). Even if
districts were able to increase salaries in an effort to retain special education teachers, the
extent of the increase required to make a change could have a significant impact on the
district’s overall budget and other academic programs.
The research indicates that salary increases alone cannot improve the retention
rates of special education teachers. Boe et al. (1997) suggested, “Demographic factors not
under district control, such as teacher aging, change in marital status, and the initial
acquisition of dependent children” will continue to impact the attrition rate of teachers
regardless of salary (Improving the Retention of Teachers at the School Level, para. 5).
Greenlee and Brown (2009) agreed, “Enhanced salaries and bonus programs are
important, but alone are not enough” (p. 105). Through the completion of trend analysis
Boe et al. (1999) found, “Contrary to what might have been thought, only 18.5% of
leavers did so for other work or better salary” (p. 13). Billingsley et al. (2004) reported,
“Salary was not related to intent to remain in teaching for beginning special educators”
(p. 341). Although financial incentives have a positive impact on special education
teacher retention rates, it is an unstable and costly intervention that would not produce an
overwhelming decrease in special education teacher attrition rates.
Job Design
A number of educational researchers have suggested that redesigning the special
education teacher’s job by lowering teacher caseloads, increasing instructional time, and
lowering student-to-teacher ratios will decrease special education teacher attrition rates;
however, all of these recommendations require an adequate and consistent level of
educational funding to implement (Gehrke & Murri, 2006; Gersten et al., 2001, Kaff,
28
2004; Stempien & Loeb, 2002). Currently, many states are facing fiscal cuts to education
(Christie, 2008; Davis, 2008; Hoffman, 2009). These funding cuts have a direct
relationship to a school district’s ability to maintain programs that meet the unique needs
of special education teachers and maintain the overall health of special education
departments. As an example of the impact of decreased funding and fiscal cuts, following
the 2010-2011 school year my department laid off 9.094 full-time special education
instructional assistants and vocational drivers. Additionally, over a two-year period
caseloads for special education teachers have increased from approximately 25 students
to 30 students. At the same time, the number of students requiring special education
services has not decreased, so special education teachers are expected to complete the
same level of work with less support. I agree with the research indicating a need to
revamp the special education teacher’s job design. However, given the current decline in
educational funding—and if the decline continues—special education teachers will
continue to experience an increase in the number of students they will be required to
serve.
Collegial Support
The Council for Exceptional Children (2000) and McManus and Kauffman (1991)
both reported that a lack of collegial support resulting in a sense of isolation was a cause
for special education teacher attrition. Although special education teachers have reported
a lack of collegial support as a reason for leaving the profession, George and George
(1995) found that a lack of support did not have a significant impact on a special
educator’s intent to leave the profession (p. 10). In a study completed by Billingsley
(2003), it was also found that collegial support did not have a significant impact on a
29
special education teacher’s intent to stay (p. 19). Collegial support has been shown to
increase special education teachers’ feelings of isolation, but ultimately it is the building
administrator(s) who can foster those collegial relationships (Gersten et al., 2001; Singh
& Billingsley, 1998). Collegial relationships absent of administrative support will not
produce a noticeable decline in special education teacher attrition rates.
Professional Growth
Teacher preparation programs. Connelly and Graham (2009) and Embich
(2001) provide ample evidence that a lack of teacher preparation has an impact on special
education teacher attrition; yet, various researchers have determined that higher levels of
education actually increase the likelihood special education teachers will leave (Cross &
Billingsley, 1994; Westling & Whitten, 1996). Cross and Billingsley (1994) discovered
that special education teachers with more education and less teaching experience are
more likely to leave the special education field because they believe they will be
employable elsewhere. Westling and Whitten (1996) in their study of rural special
education teachers found, “More and better preparation increased the likelihood of the
teacher leaving” (p. 330). Billingsley (2004) reported that Miller et al. (1999) determined,
“Neither perceived preparedness nor self-rankings [ranking of self-efficacy] have been
related to attrition and retention” (p. 44). Although I agree with the research supporting
better teacher preparation programs in order to decrease attrition rates for special
educators, I cannot accept the overall conclusion that increased education will decrease
attrition rates given the research to the contrary.
New special education teacher mentor programs. New teacher induction
programs have been a focus of research when considering interventions to decrease
30
special education teacher attrition rates. Research suggests that induction programs may
have a positive impact on attrition rates of general education teachers; however, the same
results are not as evident for special education teachers. According to Billingsley et al.
(2004), “Unfortunately, one third of early career teachers did not find formal mentoring
helpful” (p. 344). Sindelar et al. (2010) suggested, “SETs [Special Education Teachers]
may have participated in programs that were not responsive to their needs” (p. 17).
Gehrke and Murri (2006) concluded, “Even with all these first year professional
development offerings made available, none of the participants rated this area as a
significant source of support either in the interviews or on the questionnaire” (p. 185).
Whereas researchers provide ample evidence that new teacher induction programs reduce
attrition rates of new general education teachers, Billingsley et al., (2004), Gehrke and
Murri (2006), and Sindelar et al.’s (2010) research on special education teacher attrition
and involvement in induction programs convinces me that induction programs alone
cannot decrease high attrition rates of special education teachers.
Professional development. Many researchers have indicated that high quality
professional development and opportunities for professional growth will result in lower
attrition rates for special education teachers. Yet a sober analysis of the responses
obtained through a study conducted by Brownell, Miller, and Smith (1999) revealed,
“Satisfaction with professional growth opportunities…[exposed] no significant
differences between leavers, stayers, and transfers” (p. 214). As districts continue to be
faced with reduced funding, professional development opportunities become less
available to teachers. According to the Editorial Projects in Education Research Center
(2012a) report, “States are financing fewer programs for educators in 2012 than they did
31
in 2010. Reductions in efforts to develop and allocate teaching talent were made in 23
states. Officials often cited budget cuts prompted by the recession as a reason for
eliminating programs” (Key Findings section, para 3). When there are more funds
available, districts may want to consider increasing professional development
opportunities for special education teachers; however, in the current economic climate
and given the mixed success of professional development opportunities for special
education teachers, districts should consider alternative interventions for reducing special
education teacher attrition rates.
Researcher’s Position
As an Administrator of Student Services, an advocate for students with disabilities,
and a special educator, it was my belief that in order to reduce the attrition rates of special
education teachers, school districts need to increase administrative support of special
education teachers. School district administrators have the ability to improve all the areas
that research has revealed to affect teacher attrition rates: salary, workload, professional
development, and job design. It was my belief that a survey of special education teachers
and school administrators in the Portland Metro area would reveal that administrative
support has the largest impact on whether or not special educators will remain in the
profession and that special education teachers who have been in the profession three or
more years perceive a higher level of administrative support. This study identifies what
administrators and special education teachers/TOSAs perceive to be the cause of attrition
and interventions to reduce high special education teacher attrition rates while
determining if there is a difference between the perceptions of administrators and special
education teachers/TOSAs regarding special education teacher attrition. It was believed
32
this study would replicate the results of researchers regarding special education
teachers/TOSAs’ beliefs of the causes of attrition and interventions to increase special
education teacher retention. Further, this study was expected to extend current research
by including the perceptions of administrators and comparing administrator and special
education teacher/TOSA perceptions. There is no research available that addresses
administrator perceptions of special education teacher attrition nor is there any research
available that compares the two groups.
33
CHAPTER 3
METHODOLOGY
Study Overview
This research was a mixed methods descriptive study involving the surveying of
three discipline groups: administrators, special education teachers and teachers on special
assignment (TOSAs) employed in twenty-five school districts and three Educational
Service Districts (ESDs) in the Portland metro area. The twenty-five school districts and
three ESDs are located in Clackamas, Multnomah, and Washington counties in the state
of Oregon. The purpose of this study was to identify what administrators and special
education teachers perceive as causes of high special education teacher attrition and to
identify interventions that would increase the likelihood a special education teacher
would remain in the special education teaching profession. The discipline group results
were compared and contrasted to determine if administrators, special education teachers,
and TOSAs identify similar causes of special education teacher attrition and interventions
to increase a special education teacher’s intent to remain in the profession.
Research Methodology
This was a descriptive study including a single point in time survey targeting
administrators’, special education teachers’, and TOSAs’ perceptions regarding the
reasons for special education teacher attrition and ways to increase special educator
teacher rates of retention. Participants in the survey were anonymous. There was no way
to connect survey responses with the respondents. Convenience sampling was used to
gather survey responses. According to Fraenkel & Wallen (1996), “A convenience
sample is a group of individuals who (conveniently) are available for this study” (p. 99).
34
Administrators, special education teachers and TOSAs from twenty-five school districts
and three ESDs located in Clackamas, Washington, and Multnomah counties were
recruited to participate in the survey. All survey responses were used and analyzed. There
were two identified discipline groups for this study: group one included school district
administrators and group 2 included special education teachers/ and TOSAs. One survey
was developed for administrators and another survey for special education teachers and
TOSAs. Each survey included an informed consent response, a series of quantitative
demographic responses, Likert scale questions, dichotomous questions and two
qualitative open-ended questions (see Appendices D and E).
A mixed methods research approach was utilized for this study. The rationale for
using a mixed methods research approach was to develop a deeper understanding as to
why administrators and special education teachers perceive a specific cause and
intervention as having a greater influence on special education teacher attrition rates.
Creswell (2005) writes, “You conduct a mixed methods study when you have both
quantitative and qualitative data and both types of data, together, provide a better
understanding of your research problem than either type by itself” (p. 510). By
conducting only a quantitative research study I could only make assumptions as to why
the participants responded in the manner they did. By asking why the participants
selected a specific response provided further insight into the impact of the cause or
intervention they identified. Driscoll, Appiah-Yeboah, Salib, & Rupert (2007) suggest,
“The collection and analysis of embedded qualitative responses can augment and explain
complex or contradictory survey responses" (p. 24).
35
Study Design
Two Zoomerang© online surveys, one for administrators, and another survey for
special education teachers and TOSAs , were developed with specific questions related to
the perceived causes of special education teacher attrition and interventions to potentially
reduce high special education teacher attrition rates (see Appendices D and E). An email
was created to introduce myself, the purpose of the study, how to access the survey, and
Informed Consent (see Appendices B and C). Special education teachers and
administrators in twenty-five school districts and three ESDs in the Portland metro area
were contacted by email requesting them to complete their discipline group survey and
asked to forward the survey to any other administrators or special education teachers that
work in Clackamas, Multnomah, and/or Washington counties who would be able to
complete the survey.
A triangulation mixed methods study design was used. Quantitative and
qualitative data were collected simultaneously. According to Creswell (2005), “The
purpose of a triangulation mixed methods design is to simultaneously collect both
quantitative and qualitative data, merge the data, and use the results to understand a
research problem” (p. 514). Participants rated the perceived level of impact of various
causes and interventions on special education teacher attrition and retention rates, they
identified a primary perceived cause of attrition and a primary perceived intervention to
increase retention rates, and then they explained why they chose a specific primary cause
and intervention. Both the quantitative and qualitative data were analyzed to identify
commonalities and differences between administrator and special education
teacher/TOSA perceptions of the causes of high special education teacher attrition rates
36
and possible interventions to increase retention rates. For this study both quantitative and
qualitative data were considered equally when developing conclusions regarding
administrator and special education teacher/TOSA perceptions of causes of and
interventions to reduce special education teacher attrition.
Research Questions Restated
This mixed methods study answered the following questions:
1. What causes do administrators and special education teachers/TOSAs perceive as influencing high special education teacher attrition rates?
2. Do administrators and special education teachers/TOSAs identify the causes of high special education teacher attrition rates?
3. What interventions do administrators and special education teachers/TOSAs
perceive will increase special education teacher retention rates?
4. Do administrators and special education teachers/TOSAs identify the same interventions for reducing high special education teacher attrition rates?
Researcher’s Role
As the researcher for this study, I took an active role in the design of the survey
and the distribution of the survey. I utilized my collegial connections and relationships
with school district and ESD staff to elicit participation in the pilot of the two surveys. I
also relied on my relationships with school district and ESD staff to increase the
distribution of surveys in the twenty-five school districts.
Participants
There are two participant groups in this study. The first participant group was
composed of district and building level administrators. The second participant group
included special education teachers and TOSAs. All study participants were anonymous
with no way to connect responses with the respondents. Informed consent for the survey
37
was provided twice for the participants, once in the email requesting their participation in
the survey and then again on page one of each survey (see Appendices B-E). A statement
on page two of the survey required the participant to mark if they agreed to participate in
the study, which indicated they had read and understood the informed consent. Every
participant marked that that they agree to participate. Prior to distributing the surveys, I
received approval from Portland State University’s Instructional Review Board (IRB) to
proceed with this study.
Recruitment and Selection
Participants were recruited from twenty-five school districts and three Education
Service Districts (ESDs) in the Portland metro area. An email was sent to all the special
education and human resources directors in the twenty-five school districts and three
ESDs in the Portland metro area requesting the email addresses for special education
teachers and administrators in their districts (see Appendix A). A follow-up request was
sent a week following the initial email requesting the email address list. In the event I did
not receive a response from a school district and/or ESD representative, email addresses
for special education teachers and administrators were generated from the school district
and/or ESD website.
Two email lists are generated and emails were sent to the special education
teachers and administrators in all twenty-five schools districts and three ESDs in the
Portland metro area in June of 2012. The surveys were deployed in June since this was
the time in the school year that special education teachers decide whether or not they will
return to their positions the following year and they are able to reflect on the events of the
most recent school year. The email included the purpose of the survey, an informed
38
consent statement, and a link to the survey website (see Appendices B and C). Once
participants selected the survey link, they were able to complete the survey online.
Reminder emails were sent on a weekly basis for three weeks requesting staff to complete
their corresponding survey.
Survey Design and Review
Two separate surveys were developed and disseminated: one for administrators
and one for special education teachers/TOSAs (see Appendices D and E). These surveys
were developed based on reviewed research related to special education teacher attrition.
Both surveys were mixed method in format and gathered demographic information,
perceptions of why special education teachers leave the profession, and perceptions of
interventions to retain special education teachers.
The administrator survey included an informed consent response, eight
quantitative demographic responses, two quantitative four-level Likert-scale questions,
three qualitative dichotomous questions, and two qualitative open-ended response
questions (see Appendix D). The demographic questions included:
1. What type of educational organization do you work for? 2. What is your administrative role? 3. What level administrator are you? 4. Select the county where your school district/ESD is located: 5. How many years working as an administrator? 6. Have you ever worked as a special education teacher? 7. Did you complete your administrator preparation program in Oregon? 8. How many courses have you taken on the policies, practices, and education of
students with disabilities? The first Likert question asked the administrator to rate whether they perceived
the identified causes as influencing special education teacher attrition rates to great
extent, somewhat, very little, or not at all. The second Likert question asked the
39
administrator to rate whether the identified intervention would possibly reduce special
education teacher attrition rates to a great extent, somewhat, very little, or not at all. The
two dichotomous questions included in the survey asked the administrator to identify
their perceived primary cause of high special education teacher attrition rates and their
perceived primary intervention to reduce high special education teacher attrition rates.
The third dichotomous question asked the administrator if they had experienced a
reduction in special education teacher attrition in their school/district since the start of the
current economic downturn in Oregon. The two open-ended response questions asked
why they thought the cause they chose would have significant impact on special
education teacher attrition rates and why they thought the intervention they chose would
reduce high special education teacher attrition rates.
The special education teacher and TOSA survey included an informed consent
response, ten quantitative demographic responses, two quantitative four-level Likert-scale
questions, two quantitative dichotomous questions, and two qualitative open-ended
response questions (see Appendix E). The informed consent response required the
participant to mark if they agreed to participate in the study indicating they had read and
understood the informed consent. The demographic responses included:
1. What type of educational organization do you work for? 2. What education level do you case manage/teacher/support? 3. In your role you: 4. Select the county where your school district/ESD is located: 5. Do you currently possess a teaching license with a special education
endorsement? 6. How many years have you been a special education teacher? 7. What was the length of your special education teacher preparation program? 8. Did you complete your special education teacher preparation program in Oregon? 9. How many more years do you see yourself remaining as a special education
teacher?
40
10. Has the current economic downturn facing Oregon school districts impacted your decision to remain in the special education field? The first Likert question asked the special education teacher or TOSA to rate
whether they perceived the identified causes as influencing special education teacher
attrition rates to great extent, somewhat, very little, or not at all. The second Likert
question asked the special education teacher or TOSA to rate whether the identified
intervention would possibly reduce special education teacher attrition rates to a great
extent, somewhat, very little, or not at all.
The two dichotomous questions included in the survey asked the special
education teacher or TOSA to identify their perceived primary cause of high special
education teacher attrition rates and their perceived primary intervention to reduce high
special education teacher attrition rates. The two open-ended response questions asked
why they thought the cause they chose would have significant impact on special
education teacher attrition rates and why they thought the intervention they chose would
reduce high special education teacher attrition rates.
Both surveys were piloted on two special education teachers, one TOSA, and
three administrator colleagues. The pilot participants were chosen based on their current
employment as administrators, special education teachers, and TOSA. They were asked
to provide feedback on the format and the user friendliness of the survey. Their feedback
was reviewed and then the surveys were revised as needed. The pilot participants
reviewed the revised surveys and once again provided feedback for needed revisions. The
survey was revised a second time and then deployed to special education teachers,
TOSAs, and administrators.
41
Data Analysis
This study addressed four research questions and a total of six hypotheses were
tested. A triangulation design analysis was used to analyze the data obtained by the
surveys. Quantitative and qualitative responses were combined to determine what themes
arose related to perceived causes of special education teacher attrition and possible
interventions to reduce high special education teacher attrition rates.
Research question one. What causes do administrators and special education
teachers/TOSAs perceive as influencing high special education teacher attrition rates? A
variety of educational researchers have found that special education paperwork has an
impact on the attrition rates of special education teachers (Billingsley, 2004; Embich,
2001; Gehrke & Murri, 2006; Gersten et al., 2001; Schnorr, 1995; Sindelar, Brownell, &
Billingsley, 2010; Stempien & Loeb, 2002). Educational researchers have also concluded
that a lack of administrative support and a lack of administrator understanding of the
special education teacher’s job influence high special education teacher attrition rates
(Gehrke & Murri, 2006; Guarino et al., 2006; Kaff, 2004; Otto & Arnold, 2005; Westling
& Whitten, 1996). There was no current research that identified what administrators and
special education teachers perceived to be the primary cause of high special education
teacher attrition rates, so, based on my experience as a special education teacher and an
administrator and a review of literature I hypothesized:
1. Administrators perceive too much paperwork as the greatest cause of high special education teacher attrition rates.
42
2. Special education teachers and TOSAs perceive a lack of administrator support2 as the greatest cause of high special education teacher attrition rates. The proposed study tested these hypotheses and determined if administrators
perceived too much paperwork as having a greater influence on special education teacher
attrition rates than another identified cause and if special education teachers perceived a
lack of administrator support as having a greater influence on special education teacher
attrition rates than another cause.
Variables. The statistical analysis to determine whether or not administrators
perceived paperwork as the greatest cause of special education teacher attrition rates than
another cause and whether or not special education teachers perceived a lack of
administrator support as having as the greatest cause of special education teacher attrition
rates than another cause involved two independent categorical variables and one
continuous dependent variable. The first independent variable was the role of the
respondent, which had two factors: factor one administrator and factor two special
education teacher and TOSA. The second independent variable was the perceived cause
of high special education teacher attrition rates which had eleven factors: high caseload,
lack of administrative support, lack of positive collegial relationships, lack of
professional development opportunities that relate to the special education teacher
position, lack of teacher mentor support, lack of university teacher preparation, need for a
2 For the purpose of this study, administrator support is defined as assisting special education teachers with the inclusion of students with disabilities in the general education setting, improving the special education program/service delivery, and problem solving (Billingsley, 2003; Westling & Whitten, 1996).
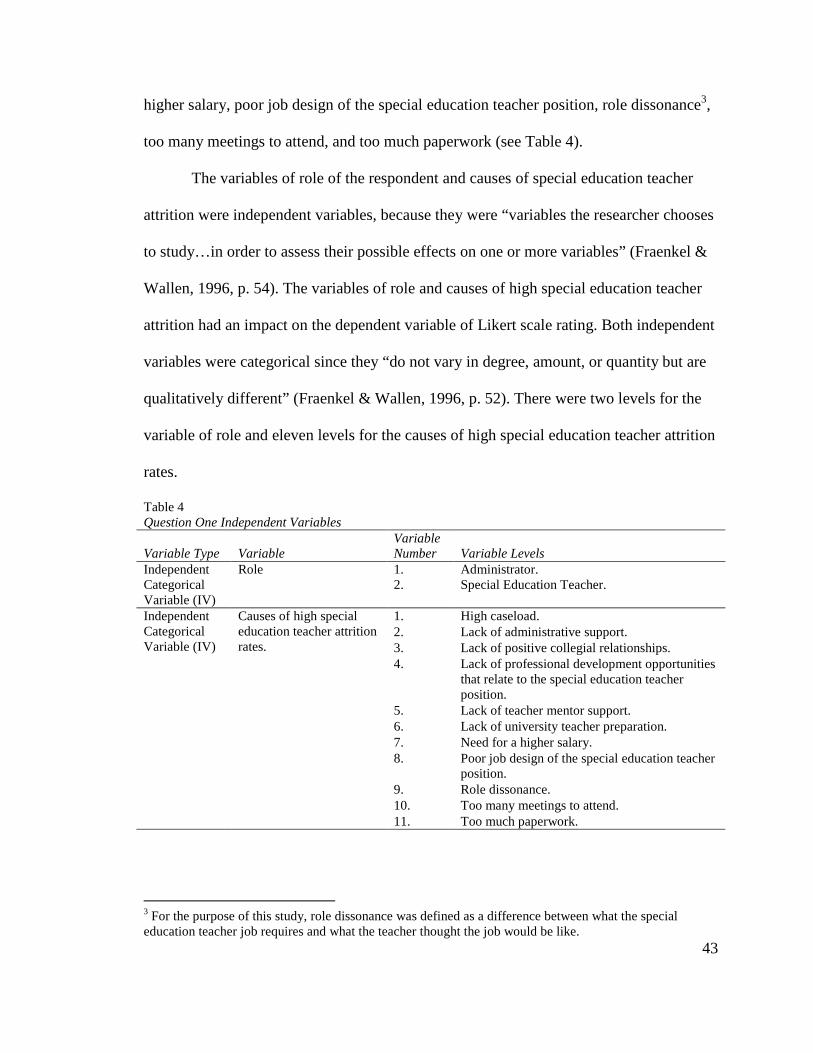
43
higher salary, poor job design of the special education teacher position, role dissonance3,
too many meetings to attend, and too much paperwork (see Table 4).
The variables of role of the respondent and causes of special education teacher
attrition were independent variables, because they were “variables the researcher chooses
to study…in order to assess their possible effects on one or more variables” (Fraenkel &
Wallen, 1996, p. 54). The variables of role and causes of high special education teacher
attrition had an impact on the dependent variable of Likert scale rating. Both independent
variables were categorical since they “do not vary in degree, amount, or quantity but are
qualitatively different” (Fraenkel & Wallen, 1996, p. 52). There were two levels for the
variable of role and eleven levels for the causes of high special education teacher attrition
rates.
Table 4 Question One Independent Variables
Variable Type Variable Variable Number Variable Levels
Independent Categorical Variable (IV)
Role 1. Administrator. 2. Special Education Teacher.
Independent Categorical Variable (IV)
Causes of high special education teacher attrition rates.
1. High caseload. 2. Lack of administrative support. 3. Lack of positive collegial relationships. 4. Lack of professional development opportunities
that relate to the special education teacher position.
5. Lack of teacher mentor support. 6. Lack of university teacher preparation. 7. Need for a higher salary. 8. Poor job design of the special education teacher
position. 9. Role dissonance. 10. Too many meetings to attend. 11. Too much paperwork.
3 For the purpose of this study, role dissonance was defined as a difference between what the special education teacher job requires and what the teacher thought the job would be like.
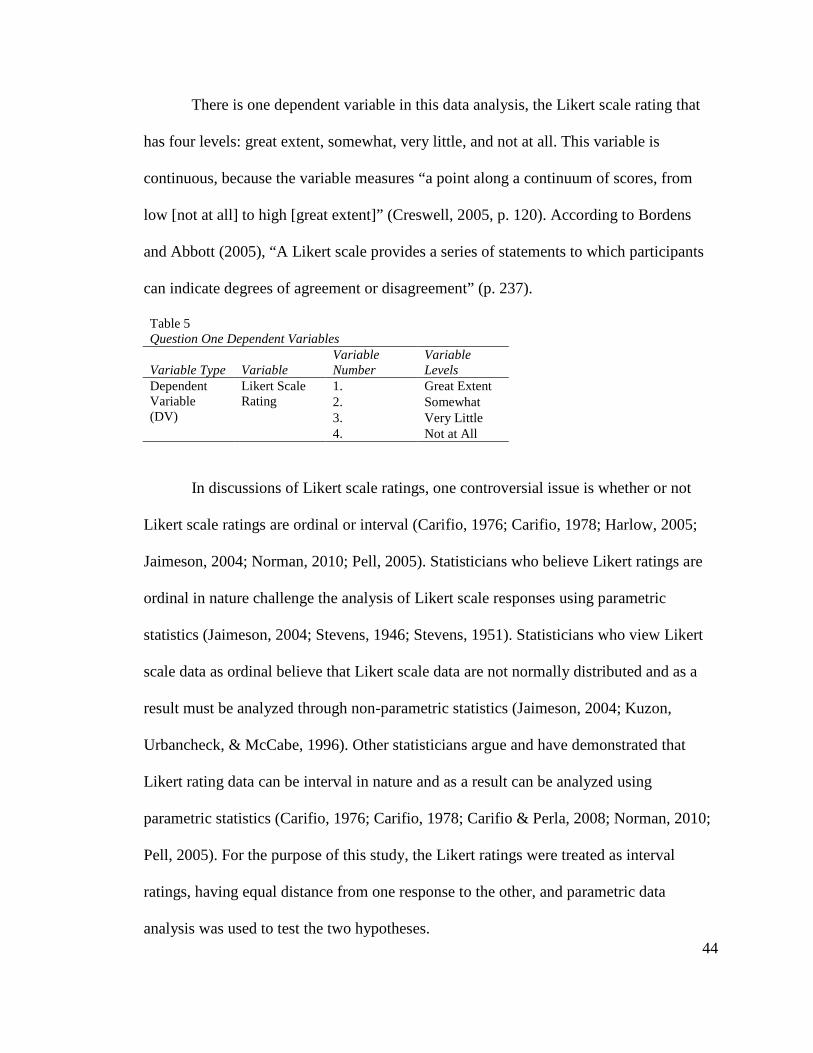
44
There is one dependent variable in this data analysis, the Likert scale rating that
has four levels: great extent, somewhat, very little, and not at all. This variable is
continuous, because the variable measures “a point along a continuum of scores, from
low [not at all] to high [great extent]” (Creswell, 2005, p. 120). According to Bordens
and Abbott (2005), “A Likert scale provides a series of statements to which participants
can indicate degrees of agreement or disagreement” (p. 237).
Table 5 Question One Dependent Variables
Variable Type Variable Variable Number
Variable Levels
Dependent Variable (DV)
Likert Scale Rating
1. Great Extent 2. Somewhat 3. Very Little 4. Not at All
In discussions of Likert scale ratings, one controversial issue is whether or not
Likert scale ratings are ordinal or interval (Carifio, 1976; Carifio, 1978; Harlow, 2005;
Jaimeson, 2004; Norman, 2010; Pell, 2005). Statisticians who believe Likert ratings are
ordinal in nature challenge the analysis of Likert scale responses using parametric
statistics (Jaimeson, 2004; Stevens, 1946; Stevens, 1951). Statisticians who view Likert
scale data as ordinal believe that Likert scale data are not normally distributed and as a
result must be analyzed through non-parametric statistics (Jaimeson, 2004; Kuzon,
Urbancheck, & McCabe, 1996). Other statisticians argue and have demonstrated that
Likert rating data can be interval in nature and as a result can be analyzed using
parametric statistics (Carifio, 1976; Carifio, 1978; Carifio & Perla, 2008; Norman, 2010;
Pell, 2005). For the purpose of this study, the Likert ratings were treated as interval
ratings, having equal distance from one response to the other, and parametric data
analysis was used to test the two hypotheses.
45
Statistical analysis of administrator responses. To address the research question,
“What cause do administrators and special education teachers/TOSAs perceive as
influencing high special education teacher attrition rates?” and to test the hypothesis,
“administrators perceive too much paperwork as the greatest cause of high special
education teacher attrition rates,” the mean and standard deviation from administrator
responses for each cause were calculated. A two-way analysis of variance (ANOVA) was
conducted. The first analysis tested whether or not there is a significant difference
between administrator perceptions of the causes of high special education teacher
attrition. The second analysis compared the mean of administrator responses to the cause
of too much paperwork to the mean of each of the other ten factors. An F statistic and the
degrees of freedom were calculated and the p-value determined for both analysis. When
analyzing the data, a 0.05 significance level was applied. For the first analysis if the p-
value was less than a 0.05 significance level, I concluded that there was a statistical
difference between administrator perceptions of the causes of high special education
teacher attrition. For the second analysis, if the p-value was less than a 0.05 significance
level, I concluded that administrators perceive too much paperwork as the greatest cause
of high special education teacher attrition rates. If the p-value was less than a 0.05
significance level, I was 95% confident that there was a statistical difference between
administrator perceptions of the causes of high special education teacher attrition and/or
administrators perceived that too much paperwork as the greatest cause of high special
education teacher attrition rates.
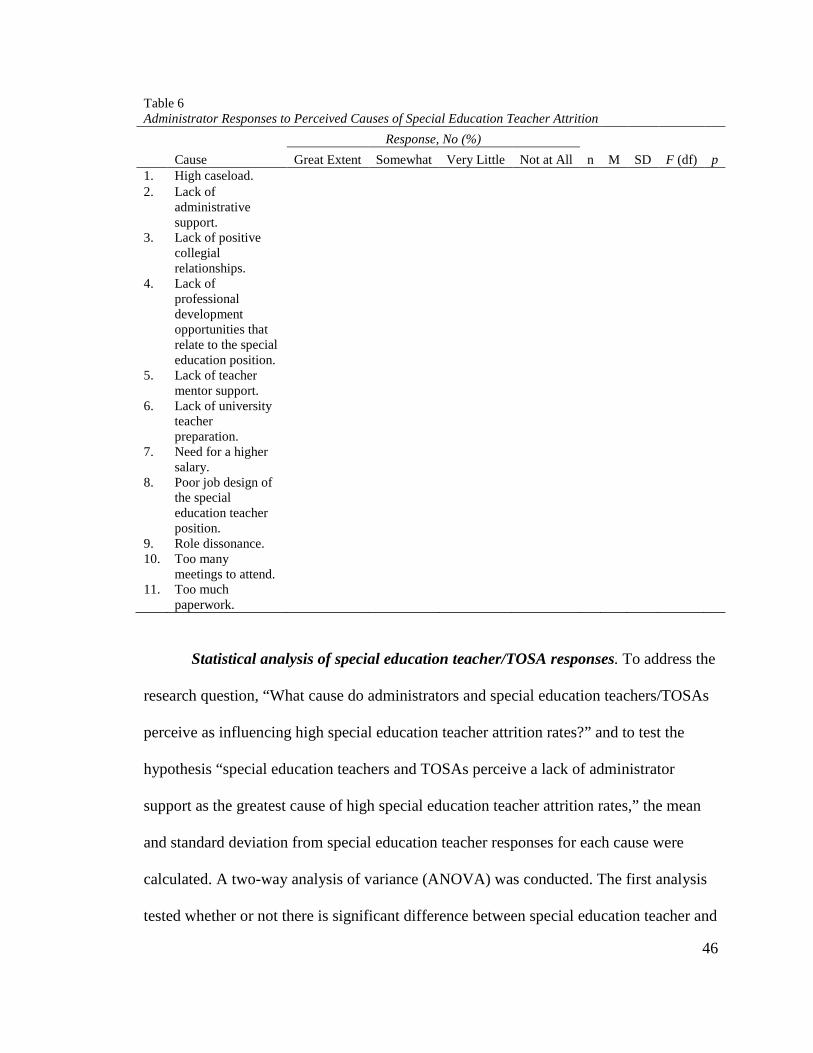
46
Table 6 Administrator Responses to Perceived Causes of Special Education Teacher Attrition
Cause
Response, No (%)
n M SD F (df) p Great Extent Somewhat Very Little Not at All 1. High caseload. 2. Lack of
administrative support.
3. Lack of positive collegial relationships.
4. Lack of professional development opportunities that relate to the special education position.
5. Lack of teacher mentor support.
6. Lack of university teacher preparation.
7. Need for a higher salary.
8. Poor job design of the special education teacher position.
9. Role dissonance. 10. Too many
meetings to attend. 11. Too much
paperwork.
Statistical analysis of special education teacher/TOSA responses. To address the
research question, “What cause do administrators and special education teachers/TOSAs
perceive as influencing high special education teacher attrition rates?” and to test the
hypothesis “special education teachers and TOSAs perceive a lack of administrator
support as the greatest cause of high special education teacher attrition rates,” the mean
and standard deviation from special education teacher responses for each cause were
calculated. A two-way analysis of variance (ANOVA) was conducted. The first analysis
tested whether or not there is significant difference between special education teacher and
47
TOSA perceptions of the causes of high special education teacher attrition. The second
analysis compared the mean of special education teacher and TOSA responses to the
cause of lack of administrator support to each mean of each of the other ten factors. An F
statistic and the degrees of freedom were calculated and the p-value determined for both
analyses. When analyzing the data from this study, a 0.05 significance level was applied.
For the first analysis if the p-value was less than a 0.05 significance level, I concluded
that there was a statistical difference between special education teacher and TOSA
perceptions of the causes of high special education teacher attrition. For the second
analysis, if the p-value was less than a 0.05 significance level, I concluded that special
education teachers and TOSAs perceived a lack of administrator support as the greatest
cause of high special education teacher attrition rates. If the p-value was less than a 0.05
significance level, I was 95% confident that there is a statistical difference between
special education teacher perceptions of the causes of high special education teacher
attrition and/or special education teachers perceive a lack of administrator support is the
greatest cause of high special education teacher attrition rates.
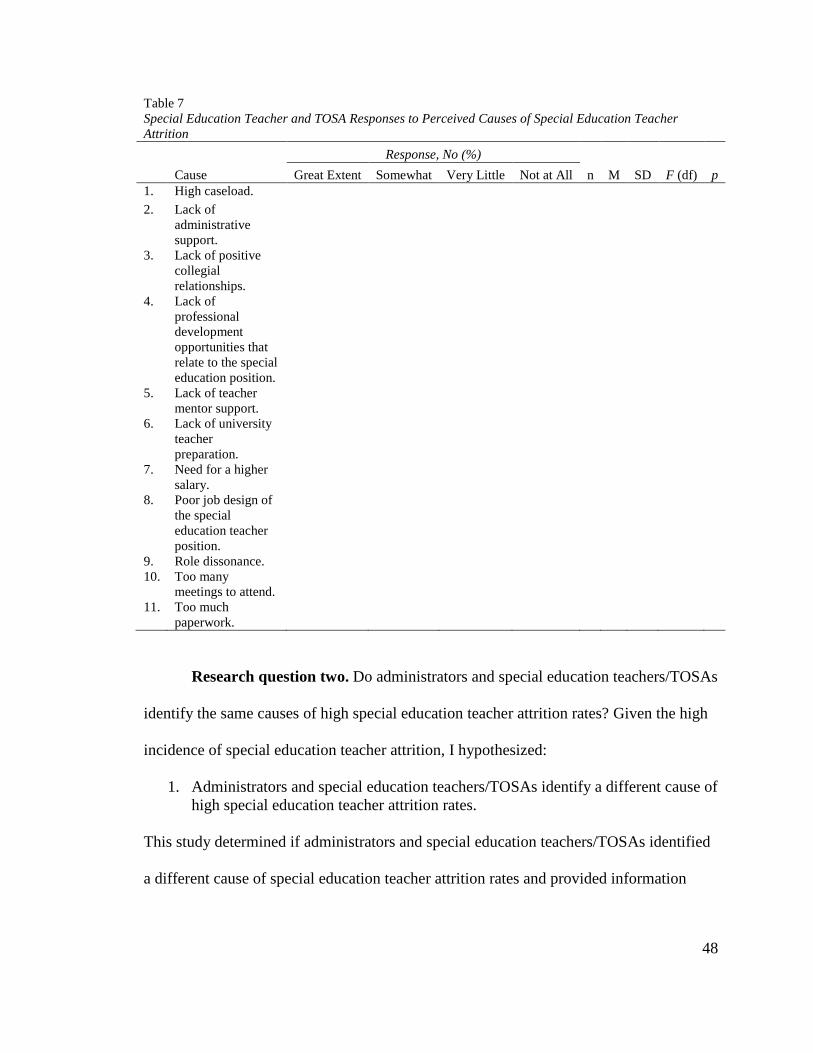
48
Table 7 Special Education Teacher and TOSA Responses to Perceived Causes of Special Education Teacher Attrition
Cause
Response, No (%)
n M SD F (df) p Great Extent Somewhat Very Little Not at All 1. High caseload.
2. Lack of administrative support.
3. Lack of positive collegial relationships.
4. Lack of professional development opportunities that relate to the special education position.
5. Lack of teacher mentor support.
6. Lack of university teacher preparation.
7. Need for a higher salary.
8. Poor job design of the special education teacher position.
9. Role dissonance. 10. Too many
meetings to attend. 11. Too much
paperwork.
Research question two. Do administrators and special education teachers/TOSAs
identify the same causes of high special education teacher attrition rates? Given the high
incidence of special education teacher attrition, I hypothesized:
1. Administrators and special education teachers/TOSAs identify a different cause of high special education teacher attrition rates.
This study determined if administrators and special education teachers/TOSAs identified
a different cause of special education teacher attrition rates and provided information
49
about why administrators, special education teachers, and TOSAs believed a specific
cause had a significant impact on special education teacher attrition.
Variables. The quantitative and qualitative analysis to determine whether or not
administrators and special education teachers identified a different perceived cause of
high special education teacher rates involved one independent categorical variable and
one dependent categorical variable. The independent variable was the role of the
respondent, which had two factors: factor one was administrators and factor two was
special education teachers and TOSAs. The dependent variable was the cause of high
special education teacher attrition rates: high caseload, lack of administrative support,
lack of positive collegial relationships, lack of professional development opportunities
that relate to the special education teacher position, lack of teacher mentor support, lack
of university teacher preparation, need for a higher salary, poor job design of the special
education teacher position, role dissonance4, too many meetings to attend, and too much
paperwork. The identification of one cause as having the greatest impact on special
education teacher attrition was dependent on the role of the respondent (see Table 8).
4 Difference between what the special education teacher job requires and what the teacher thought the job would be like.
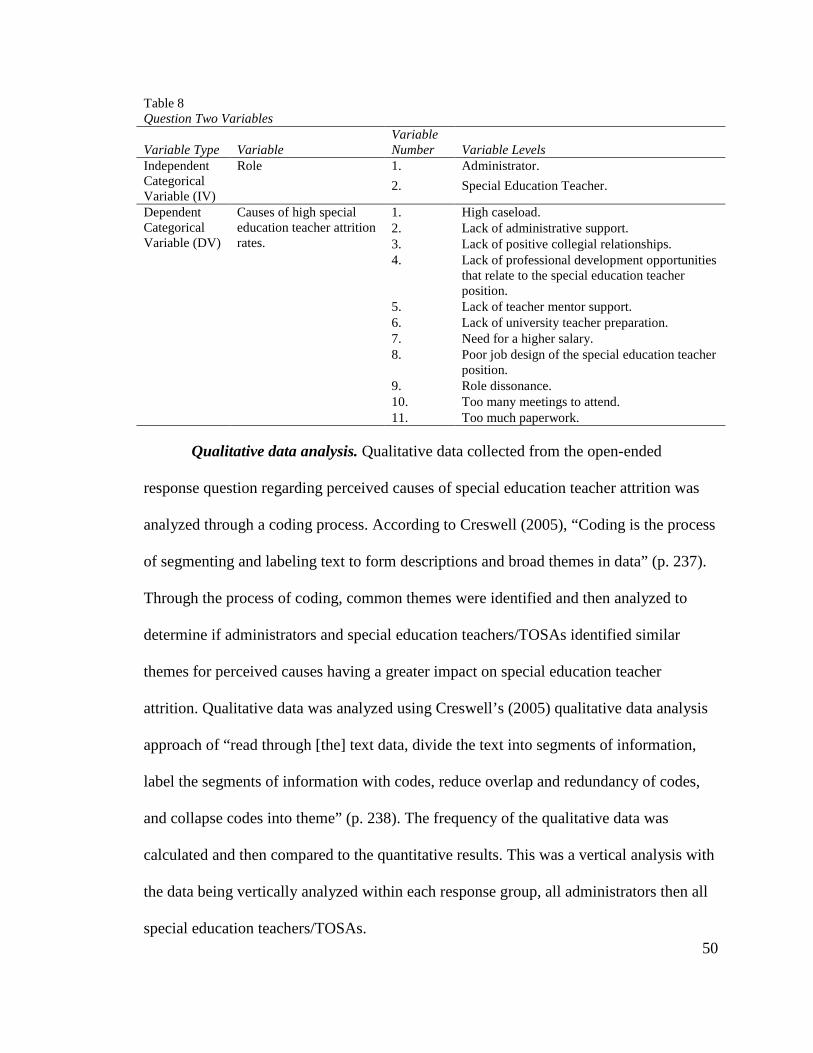
50
Table 8 Question Two Variables
Variable Type Variable Variable Number Variable Levels
Independent Categorical Variable (IV)
Role 1. Administrator.
2. Special Education Teacher.
Dependent Categorical Variable (DV)
Causes of high special education teacher attrition rates.
1. High caseload. 2. Lack of administrative support. 3. Lack of positive collegial relationships. 4. Lack of professional development opportunities
that relate to the special education teacher position.
5. Lack of teacher mentor support. 6. Lack of university teacher preparation. 7. Need for a higher salary. 8. Poor job design of the special education teacher
position. 9. Role dissonance. 10. Too many meetings to attend. 11. Too much paperwork.
Qualitative data analysis. Qualitative data collected from the open-ended
response question regarding perceived causes of special education teacher attrition was
analyzed through a coding process. According to Creswell (2005), “Coding is the process
of segmenting and labeling text to form descriptions and broad themes in data” (p. 237).
Through the process of coding, common themes were identified and then analyzed to
determine if administrators and special education teachers/TOSAs identified similar
themes for perceived causes having a greater impact on special education teacher
attrition. Qualitative data was analyzed using Creswell’s (2005) qualitative data analysis
approach of “read through [the] text data, divide the text into segments of information,
label the segments of information with codes, reduce overlap and redundancy of codes,
and collapse codes into theme” (p. 238). The frequency of the qualitative data was
calculated and then compared to the quantitative results. This was a vertical analysis with
the data being vertically analyzed within each response group, all administrators then all
special education teachers/TOSAs.
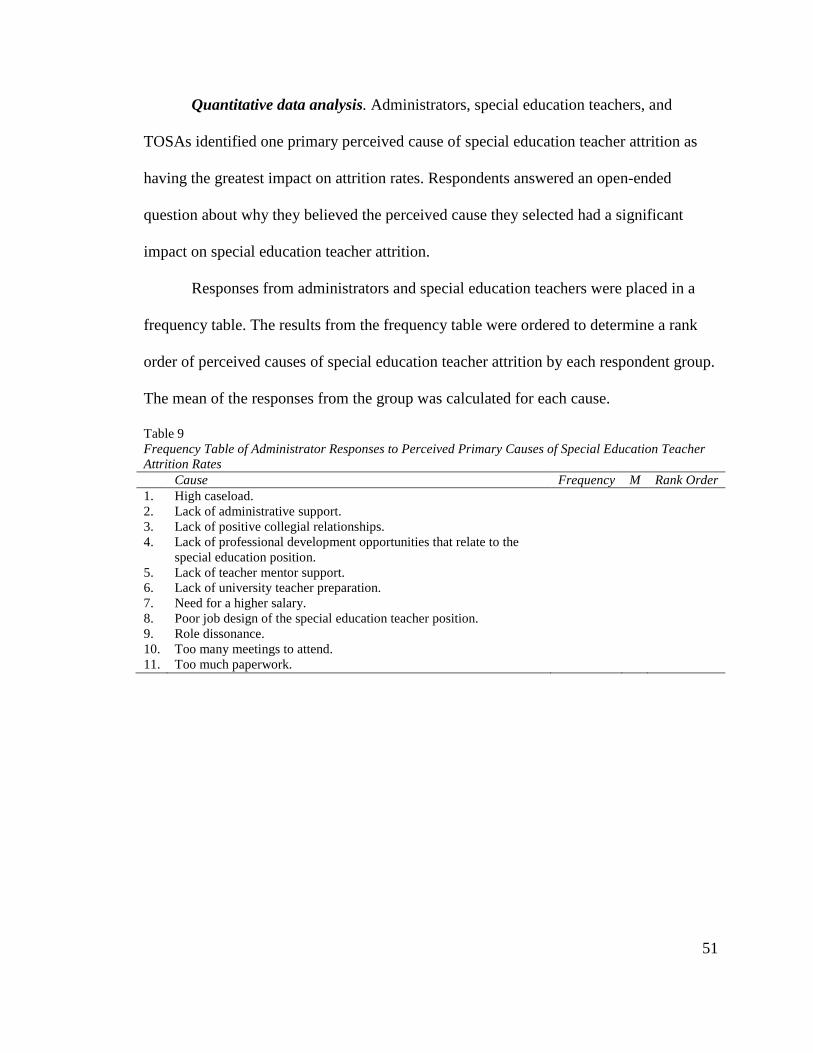
51
Quantitative data analysis. Administrators, special education teachers, and
TOSAs identified one primary perceived cause of special education teacher attrition as
having the greatest impact on attrition rates. Respondents answered an open-ended
question about why they believed the perceived cause they selected had a significant
impact on special education teacher attrition.
Responses from administrators and special education teachers were placed in a
frequency table. The results from the frequency table were ordered to determine a rank
order of perceived causes of special education teacher attrition by each respondent group.
The mean of the responses from the group was calculated for each cause.
Table 9 Frequency Table of Administrator Responses to Perceived Primary Causes of Special Education Teacher Attrition Rates Cause Frequency M Rank Order 1. High caseload.
2. Lack of administrative support.
3. Lack of positive collegial relationships.
4. Lack of professional development opportunities that relate to the
special education position. 5. Lack of teacher mentor support.
6. Lack of university teacher preparation.
7. Need for a higher salary.
8. Poor job design of the special education teacher position.
9. Role dissonance.
10. Too many meetings to attend.
11. Too much paperwork.
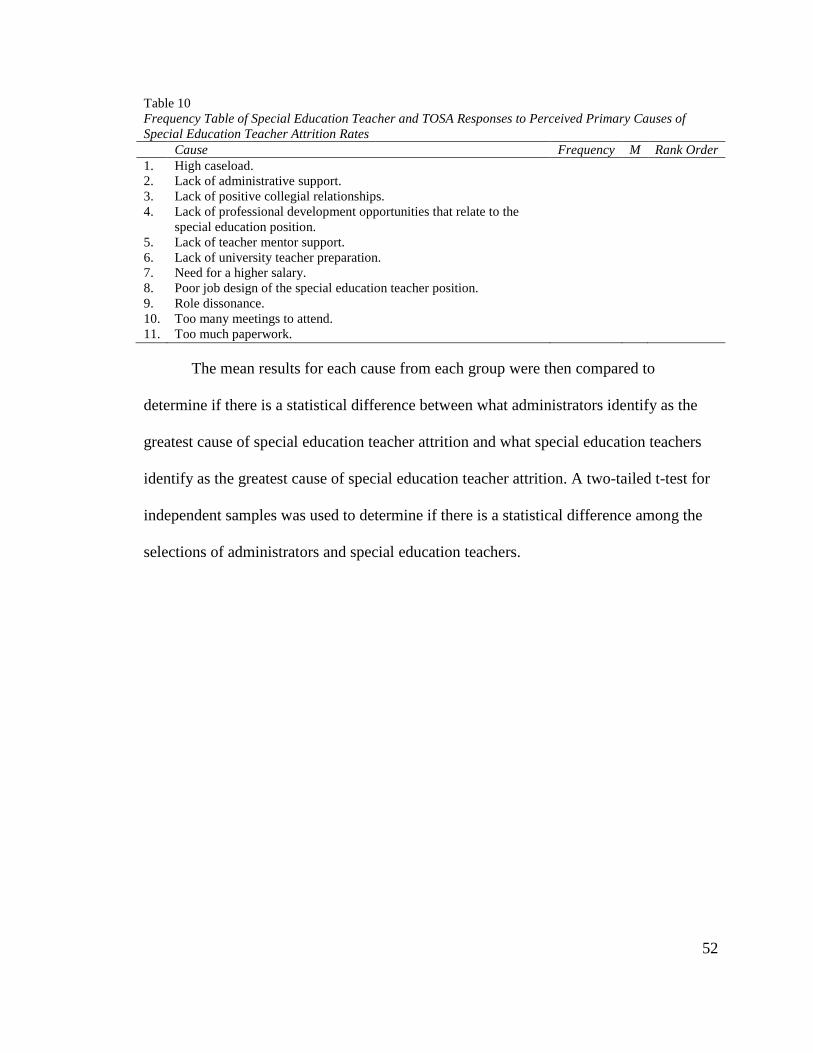
52
Table 10 Frequency Table of Special Education Teacher and TOSA Responses to Perceived Primary Causes of Special Education Teacher Attrition Rates Cause Frequency M Rank Order 1. High caseload.
2. Lack of administrative support.
3. Lack of positive collegial relationships.
4. Lack of professional development opportunities that relate to the
special education position. 5. Lack of teacher mentor support.
6. Lack of university teacher preparation.
7. Need for a higher salary.
8. Poor job design of the special education teacher position.
9. Role dissonance.
10. Too many meetings to attend.
11. Too much paperwork.
The mean results for each cause from each group were then compared to
determine if there is a statistical difference between what administrators identify as the
greatest cause of special education teacher attrition and what special education teachers
identify as the greatest cause of special education teacher attrition. A two-tailed t-test for
independent samples was used to determine if there is a statistical difference among the
selections of administrators and special education teachers.
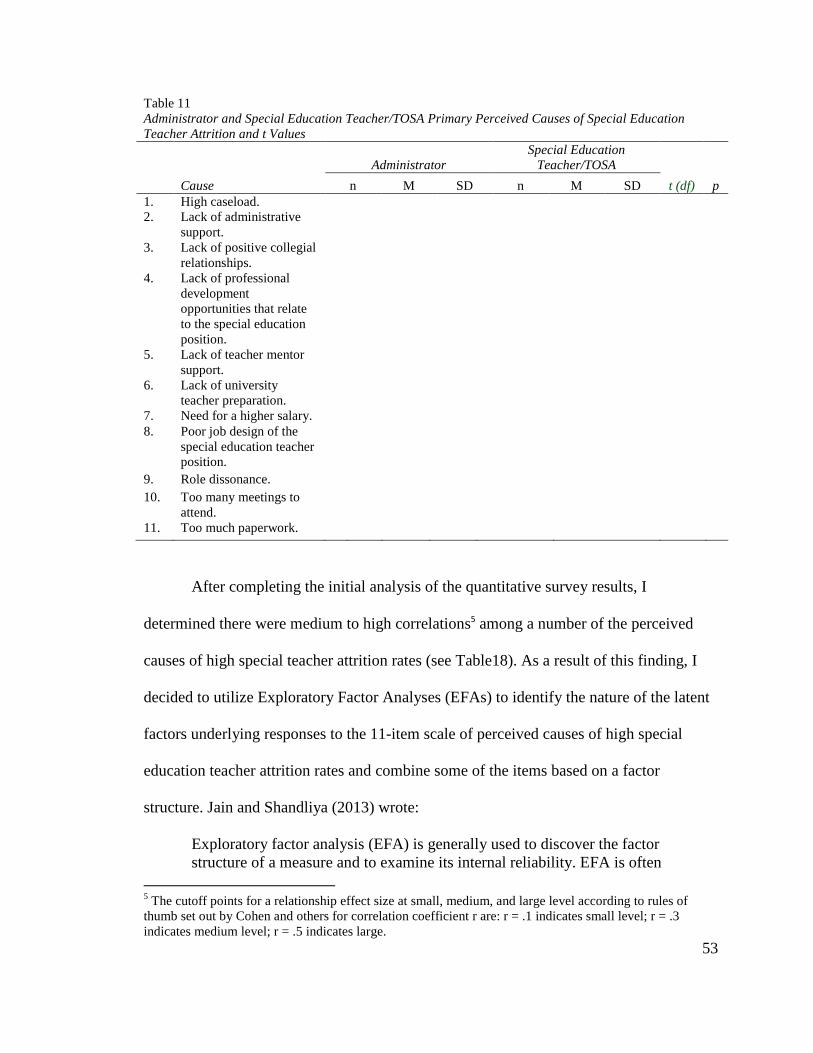
53
Table 11 Administrator and Special Education Teacher/TOSA Primary Perceived Causes of Special Education Teacher Attrition and t Values
Cause
Administrator Special Education
Teacher/TOSA
t (df) p n M SD n M SD 1. High caseload. 2. Lack of administrative
support. 3. Lack of positive collegial
relationships. 4. Lack of professional
development opportunities that relate to the special education position.
5. Lack of teacher mentor support.
6. Lack of university teacher preparation.
7. Need for a higher salary. 8. Poor job design of the
special education teacher position.
9. Role dissonance. 10. Too many meetings to
attend. 11. Too much paperwork.
After completing the initial analysis of the quantitative survey results, I
determined there were medium to high correlations5 among a number of the perceived
causes of high special teacher attrition rates (see Table18). As a result of this finding, I
decided to utilize Exploratory Factor Analyses (EFAs) to identify the nature of the latent
factors underlying responses to the 11-item scale of perceived causes of high special
education teacher attrition rates and combine some of the items based on a factor
structure. Jain and Shandliya (2013) wrote:
Exploratory factor analysis (EFA) is generally used to discover the factor structure of a measure and to examine its internal reliability. EFA is often
5 The cutoff points for a relationship effect size at small, medium, and large level according to rules of thumb set out by Cohen and others for correlation coefficient r are: r = .1 indicates small level; r = .3 indicates medium level; r = .5 indicates large.
54
recommended when researchers have no hypotheses about the nature of the underlying factor structure of their measure. (p.374)
There were no hypothesis regarding the factor structure, so an EFA was conducted to
determine if the data resulted in some form of factor structure. Jain and Shandliya (2013)
explained, “It [EFA] traditionally has been used to explore the possible underlying factor
structure of a set of measured variables without imposing any preconceived structure on
the outcome” (p. 374). The EFA was conducted using a principal axis factoring
extraction and varimax rotation to determine if the factor structure was a good fit to the
data.
Research question three. What interventions do administrators and special
education teachers/TOSAs perceive will increase special education teacher retention
rates? Researchers of special education teacher attrition and retention agree that the
amount of paperwork required to be completed by special education teachers influences
their decision to stay or leave the special education teacher profession (Billingsley, 2004;
Embich, 2001; Gehrke & Murri, 2006; Gersten et al, 2001; Schnorr, 1995; Sindelar,
Brownell, & Billingsley, 2010; Stempien & Loeb, 2002). Educational researchers have
also concluded that the level of perceived administrator support has an impact on a
special education teacher’s decision to stay or leave his or her job (Gehrke & Murri,
2006; Guarino et al., 2006; Kaff, 2004; Otto & Arnold, 2005; Westling & Whitten, 1996).
There was no current research that identified what administrators and special education
teachers/TOSAs perceived to be the primary intervention that would have the greatest
impact on increasing special education teacher retention rates; however, based on my
55
experience as a special education teacher and as an administrator and a review of
literature, I hypothesized:
1. Administrators perceive a reduction in paperwork as the intervention that will increase special education teacher retention rates.
2. Special education teachers perceive increased administrator support6 as the intervention that will increase special education teacher retention rates.
This study tested these hypotheses to determine if: administrators perceived a
reduction in paperwork as having a greater impact on increased special education teacher
retention rates than another intervention and if special education teachers and TOSAs
perceived increased administrator support as having a greater impact on increased special
teacher attrition rates than another intervention.
Variables. The statistical analysis to determine whether or not administrators
perceived a reduction in paperwork as the intervention that would have the greatest
impact on increasing special education teacher retention rates than another intervention
and whether or not special education teachers perceived an increase in administrator
support as the intervention that would have the greatest impact on increasing special
education teacher retention rates involved two independent categorical variables and one
continuous dependent variable. The first independent variable was the role of the
respondent, which had two factors: factor one was administrator and factor two was
special education teacher and TOSA. The second independent variable was the
intervention perceived to increase the retention of special education teachers, which had
twelve factors: increase administrator support; increase administrative understanding of
6 Assisting special education teachers with the inclusion of students with disabilities in the general education setting, improving the special education program/service delivery, and problem solving (Billingsley, 2003; Westling & Whitten, 1996).
56
special education policies, procedures, and instructional practices; increase general
education understanding of special education policies, procedures, and instructional
practices; increase the length of time spent in teacher preparation programs; increase
professional development opportunities directly related to special education teachers;
increase opportunities to collaborate with general education colleagues; increase
opportunities to collaborate with special education colleagues; increase special education
teacher salaries; lower special education teacher caseloads; redesign the special education
teacher position; reduce paperwork requirements; and reduce the number of meetings
special education teachers must attend.
The variables of role of the respondent and interventions perceived to increase the
retention of special education teachers were independent variables. The variables of role
and interventions to increase the retention of special education teachers had an impact on
the dependent variable of Likert rating. Both independent variables were categorical.
There were two factors for the variable of role and ten factors for interventions to
increase special education teacher attrition rates and they did not fluctuate. There was one
dependent variable in this data analysis, the Likert scale rating that had four factors: great
extent, somewhat, very little, and not at all. This variable of Likert scale was continuous.
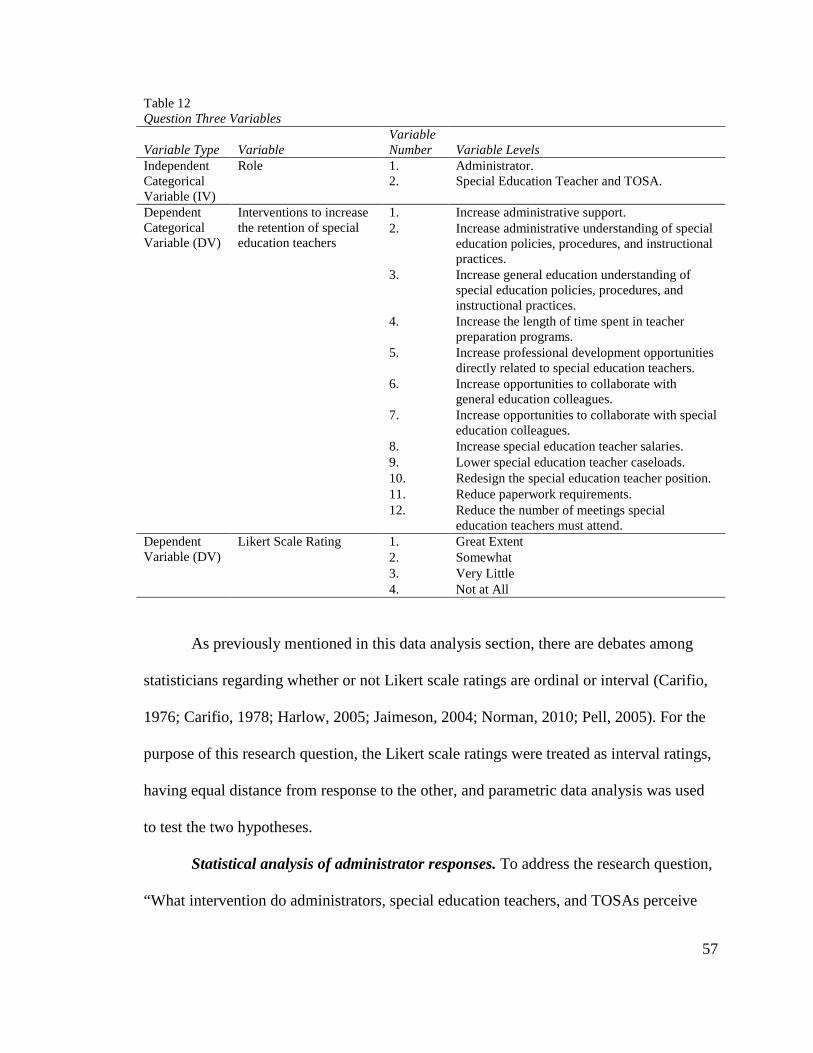
57
As previously mentioned in this data analysis section, there are debates among
statisticians regarding whether or not Likert scale ratings are ordinal or interval (Carifio,
1976; Carifio, 1978; Harlow, 2005; Jaimeson, 2004; Norman, 2010; Pell, 2005). For the
purpose of this research question, the Likert scale ratings were treated as interval ratings,
having equal distance from response to the other, and parametric data analysis was used
to test the two hypotheses.
Statistical analysis of administrator responses. To address the research question,
“What intervention do administrators, special education teachers, and TOSAs perceive
Table 12 Question Three Variables
Variable Type Variable Variable Number Variable Levels
Independent Categorical Variable (IV)
Role 1. Administrator. 2. Special Education Teacher and TOSA.
Dependent Categorical Variable (DV)
Interventions to increase the retention of special education teachers
1. Increase administrative support. 2. Increase administrative understanding of special
education policies, procedures, and instructional practices.
3. Increase general education understanding of special education policies, procedures, and instructional practices.
4. Increase the length of time spent in teacher preparation programs.
5. Increase professional development opportunities directly related to special education teachers.
6. Increase opportunities to collaborate with general education colleagues.
7. Increase opportunities to collaborate with special education colleagues.
8. Increase special education teacher salaries. 9. Lower special education teacher caseloads. 10. Redesign the special education teacher position. 11. Reduce paperwork requirements. 12. Reduce the number of meetings special
education teachers must attend. Dependent Variable (DV)
Likert Scale Rating 1. Great Extent 2. Somewhat 3. Very Little 4. Not at All
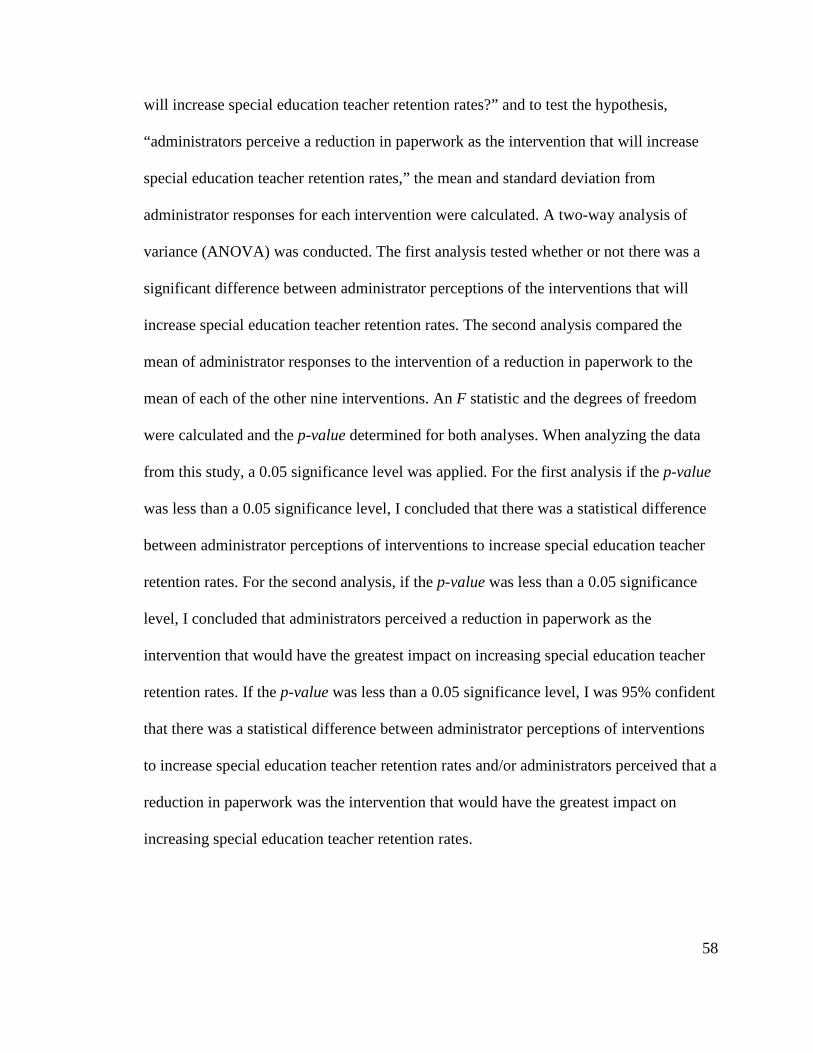
58
will increase special education teacher retention rates?” and to test the hypothesis,
“administrators perceive a reduction in paperwork as the intervention that will increase
special education teacher retention rates,” the mean and standard deviation from
administrator responses for each intervention were calculated. A two-way analysis of
variance (ANOVA) was conducted. The first analysis tested whether or not there was a
significant difference between administrator perceptions of the interventions that will
increase special education teacher retention rates. The second analysis compared the
mean of administrator responses to the intervention of a reduction in paperwork to the
mean of each of the other nine interventions. An F statistic and the degrees of freedom
were calculated and the p-value determined for both analyses. When analyzing the data
from this study, a 0.05 significance level was applied. For the first analysis if the p-value
was less than a 0.05 significance level, I concluded that there was a statistical difference
between administrator perceptions of interventions to increase special education teacher
retention rates. For the second analysis, if the p-value was less than a 0.05 significance
level, I concluded that administrators perceived a reduction in paperwork as the
intervention that would have the greatest impact on increasing special education teacher
retention rates. If the p-value was less than a 0.05 significance level, I was 95% confident
that there was a statistical difference between administrator perceptions of interventions
to increase special education teacher retention rates and/or administrators perceived that a
reduction in paperwork was the intervention that would have the greatest impact on
increasing special education teacher retention rates.
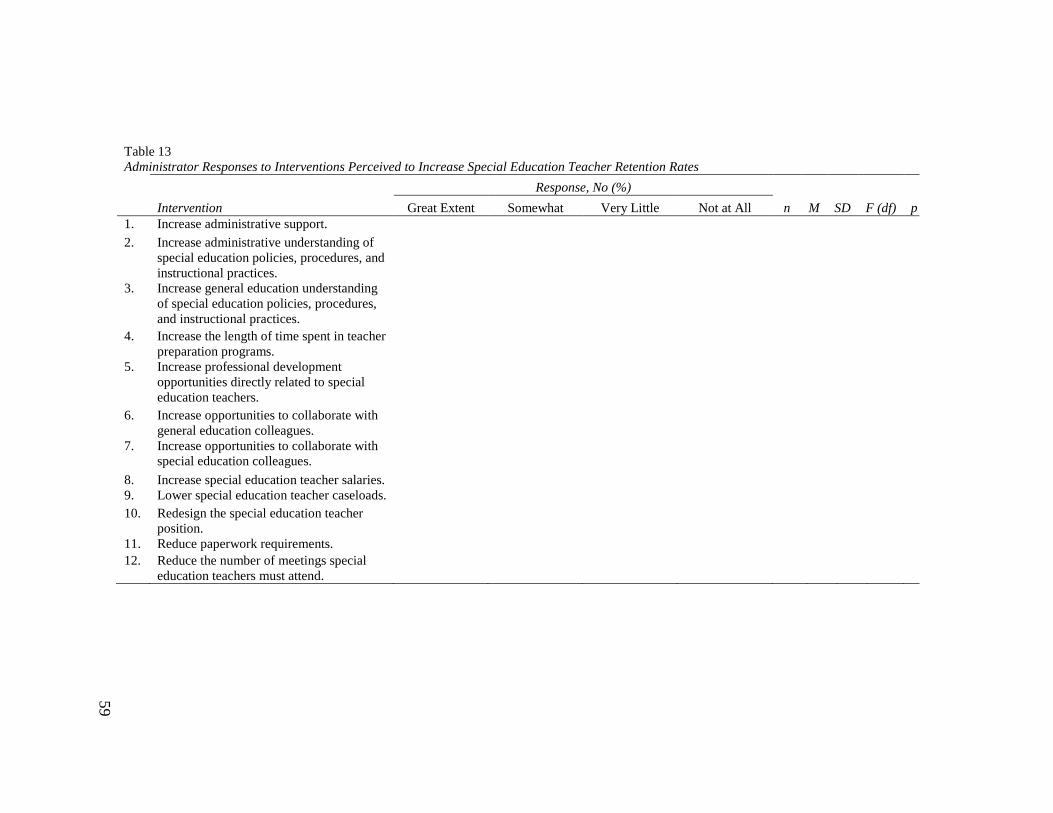
59
Table 13 Administrator Responses to Interventions Perceived to Increase Special Education Teacher Retention Rates
Intervention
Response, No (%)
n M SD F (df) p Great Extent Somewhat Very Little Not at All 1. Increase administrative support.
2. Increase administrative understanding of special education policies, procedures, and instructional practices.
3. Increase general education understanding of special education policies, procedures, and instructional practices.
4. Increase the length of time spent in teacher preparation programs.
5. Increase professional development opportunities directly related to special education teachers.
6. Increase opportunities to collaborate with general education colleagues.
7. Increase opportunities to collaborate with special education colleagues.
8. Increase special education teacher salaries. 9. Lower special education teacher caseloads. 10. Redesign the special education teacher
position. 11. Reduce paperwork requirements. 12. Reduce the number of meetings special
education teachers must attend.
60
Statistical analysis of special education teacher/TOSA responses. To address the
research question, “ What intervention do administrators, special education teachers, and
TOSAs perceive will increase special education teacher retention rates?” and test the
hypothesis “special education teachers perceive increased administrator support as the
intervention that will increase special education teacher retention rates,” the mean and
standard deviation from special education teacher responses for each intervention were
calculated. A two-way analysis of variance (ANOVA) was conducted. The first analysis
tested whether or not there was a significant difference between special education teacher
perceptions of the interventions that would increase special education teacher retention
rates. The second analysis compared the mean of special education teacher responses to
the intervention of increased administrator support to the mean of each of the other nine
interventions. An F statistic and the degrees of freedom were calculated and the p-value
determined for both analyses. When analyzing the data from this study a 0.05
significance level was applied. For the first analysis if the p-value was less than a 0.05
significance level, I concluded that there was a statistical difference between special
education teacher perceptions of interventions to increase special education teacher
retention rates. For the second analysis, if the p-value was less than a 0.05 significance
level, I concluded that special education teachers perceived increased administrator
support as the intervention that would have the greatest impact on increasing special
education teacher retention rates. If the p-value was less than a 0.05 significance level, I
was 95% confident that there was a statistical difference between special education
teacher perceptions of interventions to increase special education teacher retention rates
and/or administrators perceived that increased administrator support was the intervention

61
that would have the greatest impact on increasing special education teacher retention
rates.
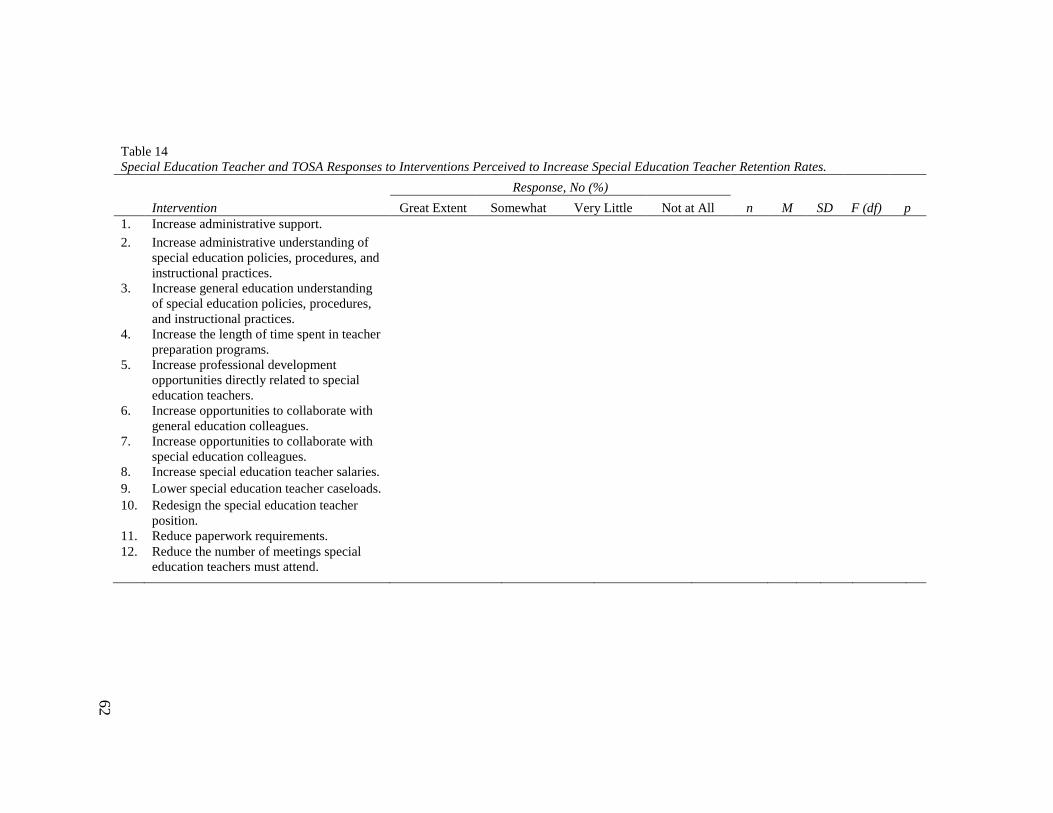
62
Table 14 Special Education Teacher and TOSA Responses to Interventions Perceived to Increase Special Education Teacher Retention Rates.
Intervention
Response, No (%)
n M SD F (df) p Great Extent Somewhat Very Little Not at All 1. Increase administrative support.
2. Increase administrative understanding of special education policies, procedures, and instructional practices.
3. Increase general education understanding of special education policies, procedures, and instructional practices.
4. Increase the length of time spent in teacher preparation programs.
5. Increase professional development opportunities directly related to special education teachers.
6. Increase opportunities to collaborate with general education colleagues.
7. Increase opportunities to collaborate with special education colleagues.
8. Increase special education teacher salaries. 9. Lower special education teacher caseloads. 10. Redesign the special education teacher
position.
11. Reduce paperwork requirements. 12. Reduce the number of meetings special
education teachers must attend.
63
Research question four. Do administrators and special education teachers
identify the same interventions for reducing high special education teacher attrition rates?
Given the high incidence of special education teacher attrition, I hypothesized:
1. Administrators and special education teachers identify a different intervention for
reducing high special education teacher attrition rates.
This study determined if administrators and special education teachers identify a different
perceived intervention for increasing special education teacher retention rates and
provided information about why administrators, special education teachers, and TOSAs
believe a specific intervention would have an impact on the increasing retention rates.
Variables. A quantitative and qualitative analysis approach was used to determine
whether or not administrators and special education teachers identified a different
perceived intervention for increasing special education teacher retention rates. The data
included one independent categorical variable and one dependent categorical variable.
The independent variable was the role of the respondent, which had two factors: factor
one was administrator and factor two was special education teacher and TOSA. The
dependent variable was the intervention to increase special education retention rates,
which had twelve factors; increase administrator support; increase administrative
understanding of special education policies, procedures, and instructional practices;
increase general education understanding of special education policies, procedures, and
instructional practices; increase the length of time spent in teacher preparation programs;
increase professional development opportunities directly related to special education
teachers; increase opportunities to collaborate with general education colleagues; increase
opportunities to collaborate with special education colleagues; increase special education
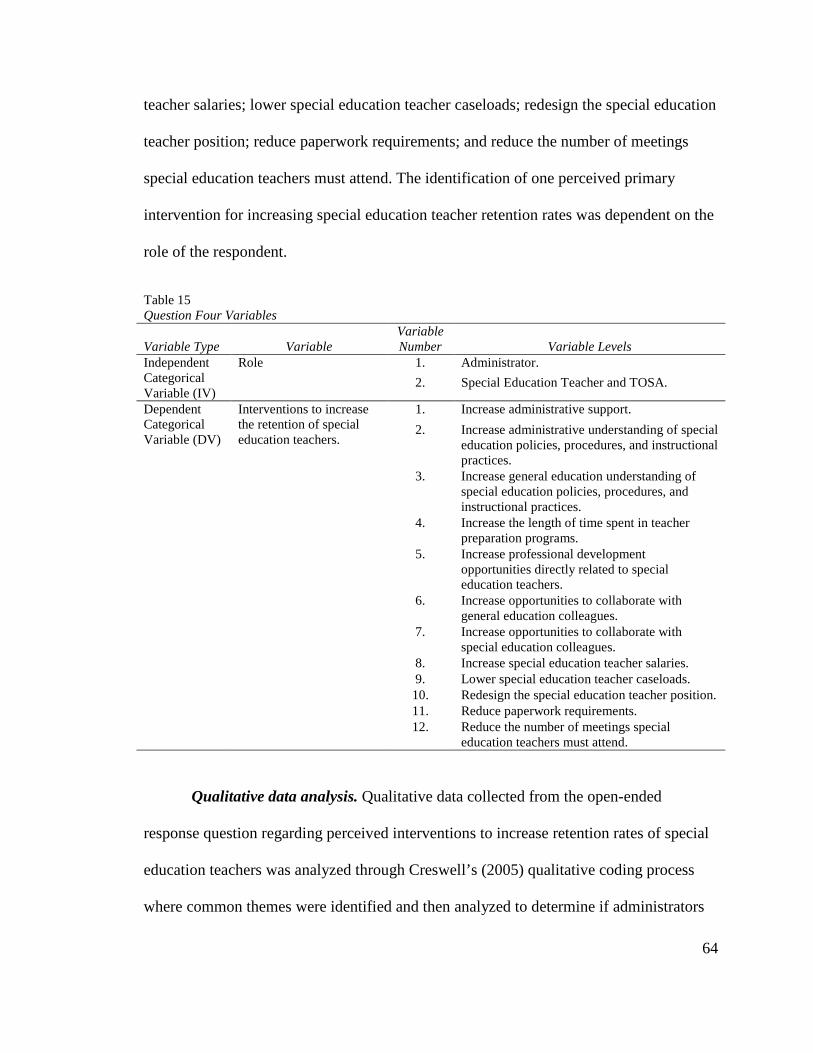
64
teacher salaries; lower special education teacher caseloads; redesign the special education
teacher position; reduce paperwork requirements; and reduce the number of meetings
special education teachers must attend. The identification of one perceived primary
intervention for increasing special education teacher retention rates was dependent on the
role of the respondent.
Table 15 Question Four Variables
Variable Type Variable Variable Number Variable Levels
Independent Categorical Variable (IV)
Role 1. Administrator.
2. Special Education Teacher and TOSA.
Dependent Categorical Variable (DV)
Interventions to increase the retention of special education teachers.
1. Increase administrative support.
2. Increase administrative understanding of special education policies, procedures, and instructional practices.
3. Increase general education understanding of special education policies, procedures, and instructional practices.
4. Increase the length of time spent in teacher preparation programs.
5. Increase professional development opportunities directly related to special education teachers.
6. Increase opportunities to collaborate with general education colleagues.
7. Increase opportunities to collaborate with special education colleagues.
8. Increase special education teacher salaries. 9. Lower special education teacher caseloads. 10. Redesign the special education teacher position. 11. Reduce paperwork requirements. 12. Reduce the number of meetings special
education teachers must attend.
Qualitative data analysis. Qualitative data collected from the open-ended
response question regarding perceived interventions to increase retention rates of special
education teachers was analyzed through Creswell’s (2005) qualitative coding process
where common themes were identified and then analyzed to determine if administrators
65
and special education teachers/TOSAs identified similar themes regarding interventions
to increase rates of retention. The frequency of the qualitative data was calculated and
then compared to the quantitative results. This was a vertical analysis with the data being
vertically analyzed within each response group, all administrators then all special
education teachers/TOSAs.
Quantitative data analysis. Administrators, special education teachers, and
TOSAs identified one primary perceived intervention that would increase special
education teacher retention rates. Respondents were asked to answer why they selected
the perceived primary intervention to increase special education teacher retention rates.
Responses from administrators and special education teachers/TOSAs were
placed in a frequency table. The results from the frequency table were ordered to
determine the rank order of interventions to increase special education teacher retention
rates of each respondent group. The mean of the responses from the group was calculated
for each cause.
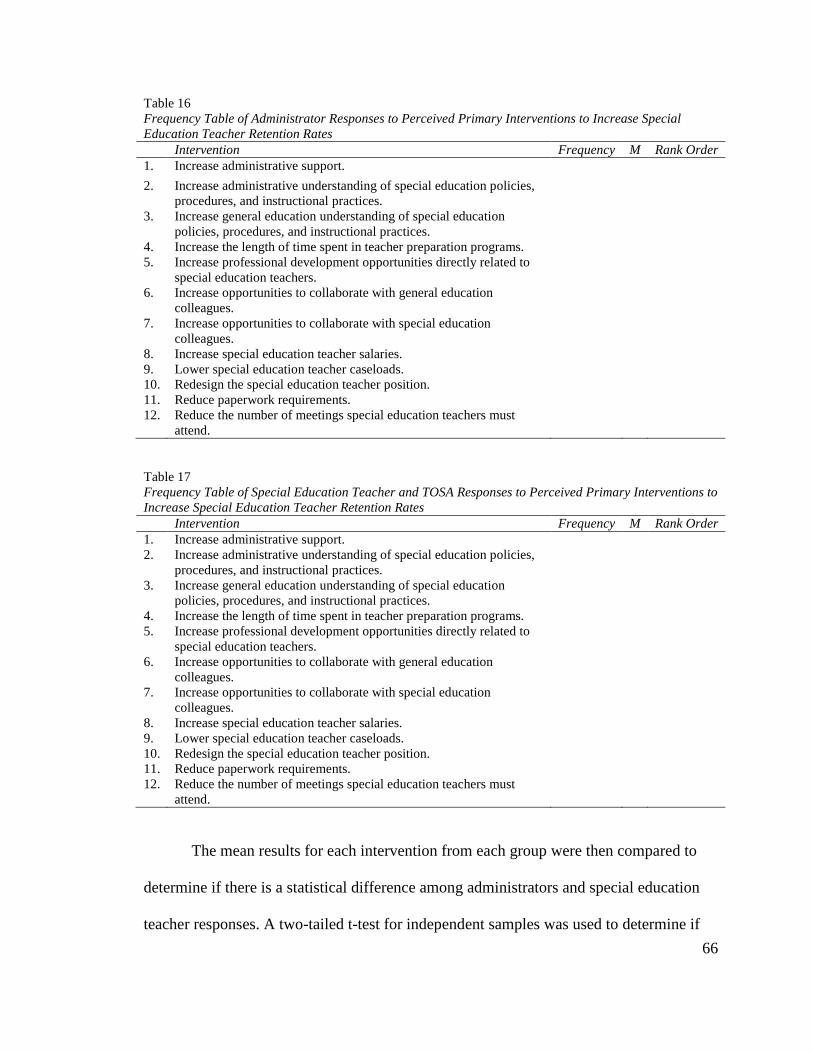
66
Table 16 Frequency Table of Administrator Responses to Perceived Primary Interventions to Increase Special Education Teacher Retention Rates Intervention Frequency M Rank Order 1. Increase administrative support.
2. Increase administrative understanding of special education policies,
procedures, and instructional practices. 3. Increase general education understanding of special education
policies, procedures, and instructional practices. 4. Increase the length of time spent in teacher preparation programs.
5. Increase professional development opportunities directly related to
special education teachers. 6. Increase opportunities to collaborate with general education
colleagues. 7. Increase opportunities to collaborate with special education
colleagues. 8. Increase special education teacher salaries.
9. Lower special education teacher caseloads.
10. Redesign the special education teacher position.
11. Reduce paperwork requirements.
12. Reduce the number of meetings special education teachers must
attend.
Table 17 Frequency Table of Special Education Teacher and TOSA Responses to Perceived Primary Interventions to Increase Special Education Teacher Retention Rates Intervention Frequency M Rank Order 1. Increase administrative support.
2. Increase administrative understanding of special education policies,
procedures, and instructional practices. 3. Increase general education understanding of special education
policies, procedures, and instructional practices. 4. Increase the length of time spent in teacher preparation programs.
5. Increase professional development opportunities directly related to
special education teachers. 6. Increase opportunities to collaborate with general education
colleagues. 7. Increase opportunities to collaborate with special education
colleagues. 8. Increase special education teacher salaries.
9. Lower special education teacher caseloads.
10. Redesign the special education teacher position.
11. Reduce paperwork requirements.
12. Reduce the number of meetings special education teachers must
attend.
The mean results for each intervention from each group were then compared to
determine if there is a statistical difference among administrators and special education
teacher responses. A two-tailed t-test for independent samples was used to determine if
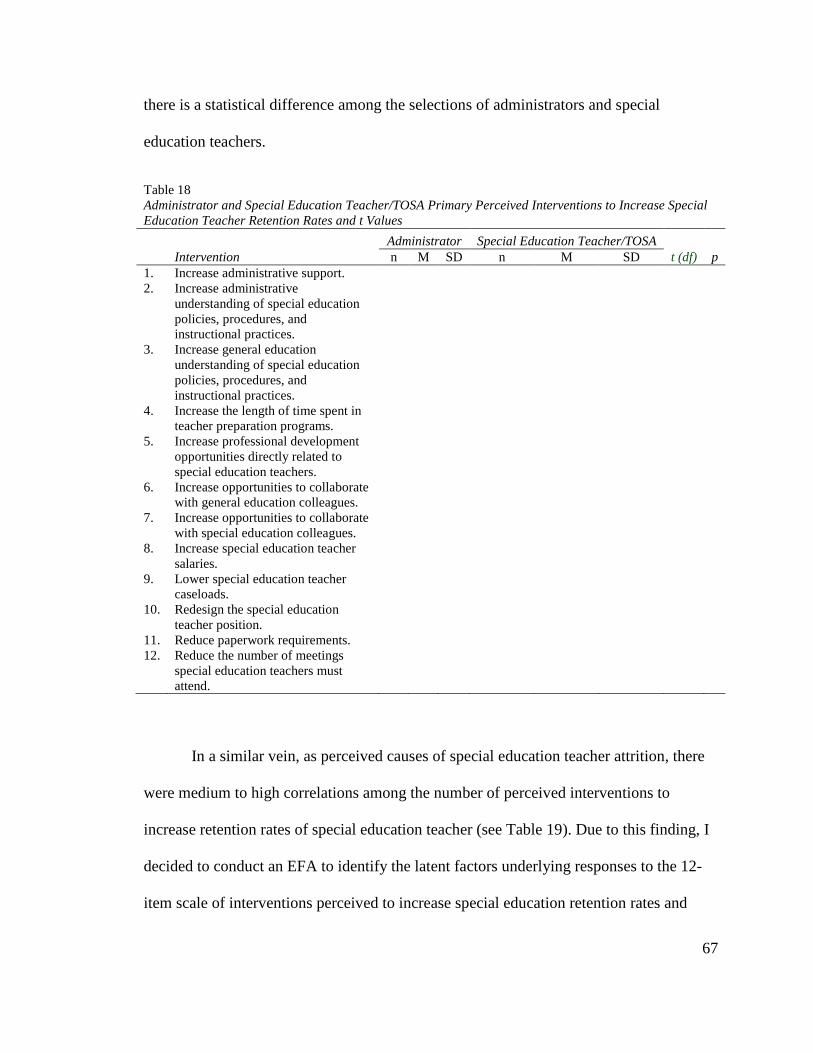
67
there is a statistical difference among the selections of administrators and special
education teachers.
Table 18 Administrator and Special Education Teacher/TOSA Primary Perceived Interventions to Increase Special Education Teacher Retention Rates and t Values
Intervention
Administrator Special Education Teacher/TOSA t (df) p n M SD n M SD
1. Increase administrative support. 2. Increase administrative
understanding of special education policies, procedures, and instructional practices.
3. Increase general education understanding of special education policies, procedures, and instructional practices.
4. Increase the length of time spent in teacher preparation programs.
5. Increase professional development opportunities directly related to special education teachers.
6. Increase opportunities to collaborate with general education colleagues.
7. Increase opportunities to collaborate with special education colleagues.
8. Increase special education teacher salaries.
9. Lower special education teacher caseloads.
10. Redesign the special education teacher position.
11. Reduce paperwork requirements. 12. Reduce the number of meetings
special education teachers must attend.
In a similar vein, as perceived causes of special education teacher attrition, there
were medium to high correlations among the number of perceived interventions to
increase retention rates of special education teacher (see Table 19). Due to this finding, I
decided to conduct an EFA to identify the latent factors underlying responses to the 12-
item scale of interventions perceived to increase special education retention rates and
68
combine some of the items into a factor structure. The EFA was conducted using a
principal axis factoring extraction and varimax rotation to determine if the factor
structure was a good fit to the data.
Validity
Shadish, Cook, and Campbell (2002) explained that validity is the “truth of, or
correctness of, or degree of support for an inference” (p. 513). To increase the validity of
the surveys, I had three administrators, two special education teachers, and one TOSA
review the survey twice and I completed revisions based on their feedback. There was an
initial review and test of the survey and then an opportunity to provide feedback. The
survey was revised based on their suggestions and then they piloted the surveys again.
They provided feedback again and any needed revisions were made prior to distributing
the survey to the large sample population.
According to Fraenkel and Wallen (1996), “Content-related evidence validity:
Refers to the content and format of the instrument” (p. 154). To address issues of content
validity the reviewers were asked to answer the following question, “How well do the
questions represent all of the possibilities of questions available” (Creswell, 2005, p.
165). They were also asked whether or not the questions were easy to understand and
answer. Lastly, they were asked whether or not the survey “format is appropriate”
(Fraenkel & Wallen, 1996, p. 154).
Criterion-related validity according to Fraenkel and Wallen (1996) “refers to the
relationship between scores obtained using the instrument and scores obtained using one-
or more other instruments or measures” (p. 154). In order to address potential issues of
criterion-related validity the three administrators, two special education teachers, and one
69
TOSA, each completed a survey from their group. I reviewed their responses to see if
there were any responses that were divergent from current research. If there was a
response that was divergent from the results of other researchers, the pilot respondent was
contacted to determine why they responded in the manner they did and determine
whether or not the divergent response was due to a misunderstanding of the survey. There
were no divergent responses that required follow up with the pilot respondent.
In order increase the validity of identified qualitative themes, an impartial
evaluator and myself reviewed all administrator and special education teacher/TOSA
qualitative responses to the primary perceived causes of special education teacher
attrition and responses to the primary perceived interventions to increase special
education teacher retention rates. The impartial evaluator and I identified themes and then
conferred to determine a final set of qualitative codes for both perceived causes and
interventions. The impartial evaluator and I then independently coded all the perceived
causes and interventions. We then conferred on our coding and recoded the responses,
finally coming to similar coding results for all the responses.
As stated earlier, this study was a mixed methods study that included both
quantitative and qualitative responses. Through the combination of responses, the data
was triangulated to determine if the same themes came forward. According to Creswell
(2005), “Validating findings means that the researcher determines the accuracy or
credibility of the findings through strategies such as member checking or triangulation”
(p. 252). Through the pilot study, respondents were available to ask follow-up questions
about their responses and “check the accuracy of the account” (Creswell, 2005, p. 252).
Conclusions about the results were developed and then reviewed with the pilot
70
respondents to determine the accuracy of the conclusions. Triangulation between the
quantitative data and qualitative data was completed to support themes that arose. Once
the surveys were deployed to a larger population member checking was not used to check
for the validity of the survey results, but the process of comparing the quantitative and
qualitative responses to identify similar themes was implemented.
Study Limitations
A limitation of the study was the inability to follow up with participants about
their responses and complete a member checking process to clarify responses. The survey
was anonymous in an effort to increase participation in the study while getting accurate
responses from the participants. Given that the study surveyed staff in three counties in
the Portland metro area, some participants may have been hesitant to respond to the
survey if there was the potential that their supervisor may find out how they had
responded. Through the use of anonymous responses, participants could be honest about
their experiences without fear of retribution.
71
CHAPTER 4
FINDINGS
Structure of Data Analysis
This chapter details the qualitative and quantitative findings of administrator and
special education teacher/TOSA perceptions of the causes of special education teacher
attrition and interventions to increase the retention of special education teachers. The
findings are divided into five sections: Research Question One, Research Question Two,
Research Question Three, Research Question Four, and Summary of Findings.
Research Question One
The first research question this study addressed was: What causes do
administrators and special education teachers and TOSAs perceive as influencing high
special education teacher attrition rates? Hypothesis one was: Administrators perceive too
much paperwork as the cause that impacts high special education teacher attrition rates to
the greatest extent. Hypothesis two was: Special education teachers perceive a lack of
administrator support7 as the cause that impacts high special education teacher attrition
rates to the greatest extent.
Quantitative analysis.
Exploratory Factor Analyses (EFAs) of perceived causes. Since there were
medium to high correlations between a number of perceived causes of special education
teacher attrition, (see Table 19) an EFA was utilized to identify the nature of the latent
factors underlying responses to the 11-item scale of perceived causes of attrition. An
7 For the purpose of this study, administrator support is defined as assisting special education teachers with the inclusion of students with disabilities in the general education setting, improving the special education program/service delivery, and problem solving (Billingsley, 2003; Westling & Whitten, 1996).
72
initial EFA was conducted using a principal axis factoring extraction and varimax
rotation by including all 11 causes of special education teacher attrition. The need for a
higher salary was found to have low factor loadings on all factors (factor loadings < .30)
due to its low communality score (communality = .11), which indicates that it has
significant measurement error. In order to achieve a simple factor structure solution, this
item was excluded from further EFAs. In other words, the final EFA was conducted
based on responses8 to 10 items of the perceived causes of special education teacher
attrition identified in this study.
As shown in Table 20, a three-factor structure was identified that shows evidence
of a good fit of a three-factor solution to the data in this study. The three-factor structure
is relatively clean with only one complex item, i.e., high caseload has similar factor
loadings on factor 1 and factor 2, and all items have salient loadings on their respective
factors (factor loadings are in the range of .29 to .85).
8 Similar factor structures were achieved by conducting two EFAs based on responses of special education teachers only and those combining administrators and special education teachers. Results from EFA based on responses from both administrators and special education teachers are reported.
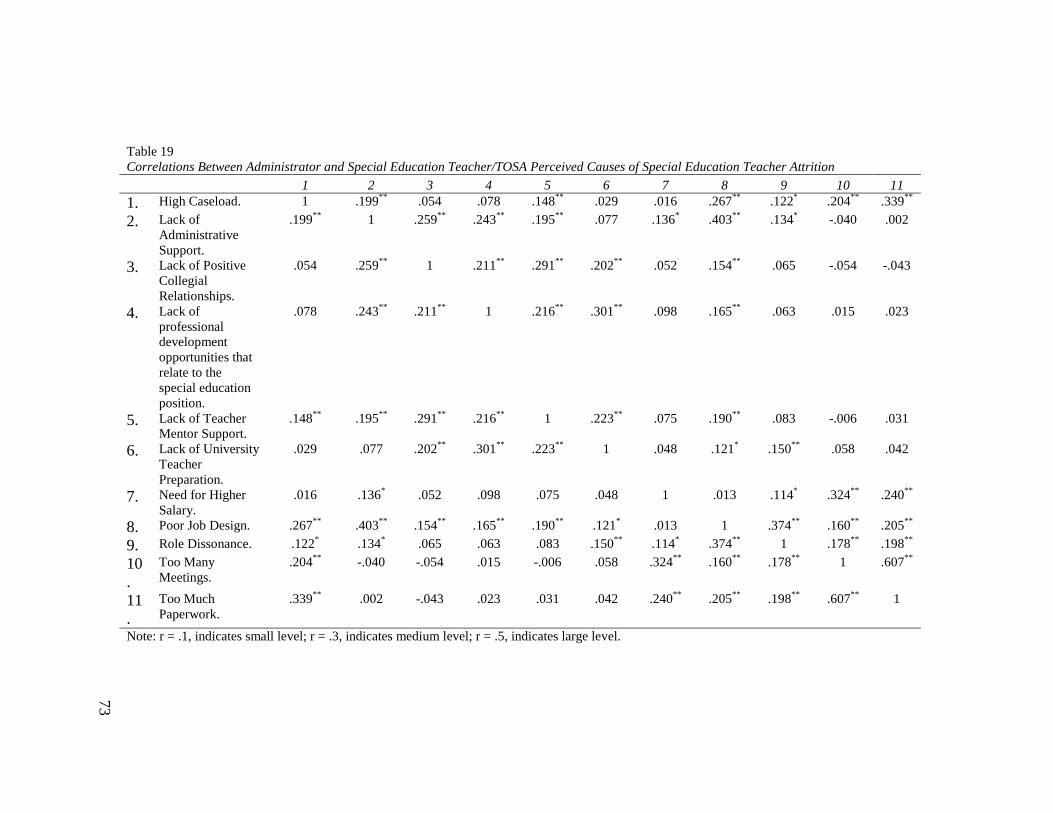
73
Table 19 Correlations Between Administrator and Special Education Teacher/TOSA Perceived Causes of Special Education Teacher Attrition 1 2 3 4 5 6 7 8 9 10 11
1. High Caseload. 1 .199** .054 .078 .148** .029 .016 .267** .122* .204** .339**
2. Lack of Administrative Support.
.199** 1 .259** .243** .195** .077 .136* .403** .134* -.040 .002
3. Lack of Positive Collegial Relationships.
.054 .259** 1 .211** .291** .202** .052 .154** .065 -.054 -.043
4. Lack of professional development opportunities that relate to the special education position.
.078 .243** .211** 1 .216** .301** .098 .165** .063 .015 .023
5. Lack of Teacher Mentor Support.
.148** .195** .291** .216** 1 .223** .075 .190** .083 -.006 .031
6. Lack of University Teacher Preparation.
.029 .077 .202** .301** .223** 1 .048 .121* .150** .058 .042
7. Need for Higher Salary.
.016 .136* .052 .098 .075 .048 1 .013 .114* .324** .240**
8. Poor Job Design. .267** .403** .154** .165** .190** .121* .013 1 .374** .160** .205**
9. Role Dissonance. .122* .134* .065 .063 .083 .150** .114* .374** 1 .178** .198**
10.
Too Many Meetings.
.204** -.040 -.054 .015 -.006 .058 .324** .160** .178** 1 .607**
11.
Too Much Paperwork.
.339** .002 -.043 .023 .031 .042 .240** .205** .198** .607** 1
Note: r = .1, indicates small level; r = .3, indicates medium level; r = .5, indicates large level.
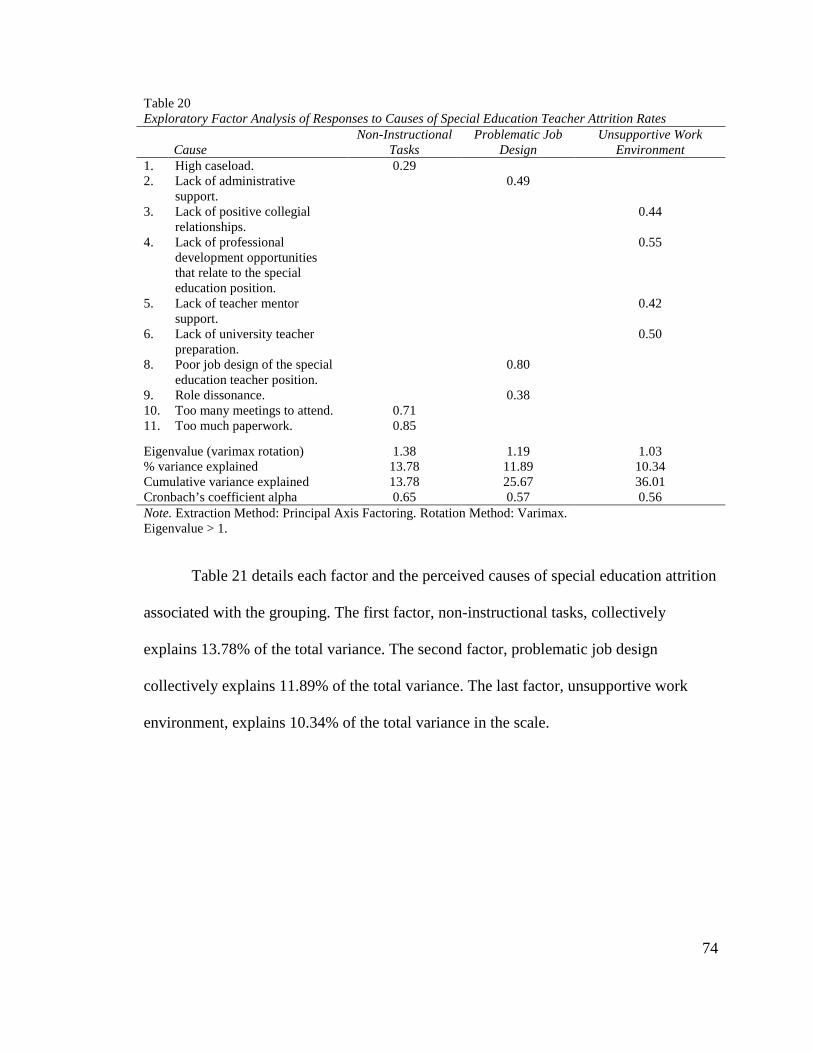
74
Table 20 Exploratory Factor Analysis of Responses to Causes of Special Education Teacher Attrition Rates
Cause Non-Instructional
Tasks Problematic Job
Design Unsupportive Work
Environment 1. High caseload. 0.29 2. Lack of administrative
support. 0.49
3. Lack of positive collegial relationships.
0.44
4. Lack of professional development opportunities that relate to the special education position.
0.55
5. Lack of teacher mentor support.
0.42
6. Lack of university teacher preparation.
0.50
8. Poor job design of the special education teacher position.
0.80
9. Role dissonance. 0.38 10. Too many meetings to attend. 0.71 11. Too much paperwork. 0.85
Eigenvalue (varimax rotation) 1.38 1.19 1.03 % variance explained 13.78 11.89 10.34 Cumulative variance explained 13.78 25.67 36.01 Cronbach’s coefficient alpha 0.65 0.57 0.56 Note. Extraction Method: Principal Axis Factoring. Rotation Method: Varimax. Eigenvalue > 1. Table 21 details each factor and the perceived causes of special education attrition
associated with the grouping. The first factor, non-instructional tasks, collectively
explains 13.78% of the total variance. The second factor, problematic job design
collectively explains 11.89% of the total variance. The last factor, unsupportive work
environment, explains 10.34% of the total variance in the scale.
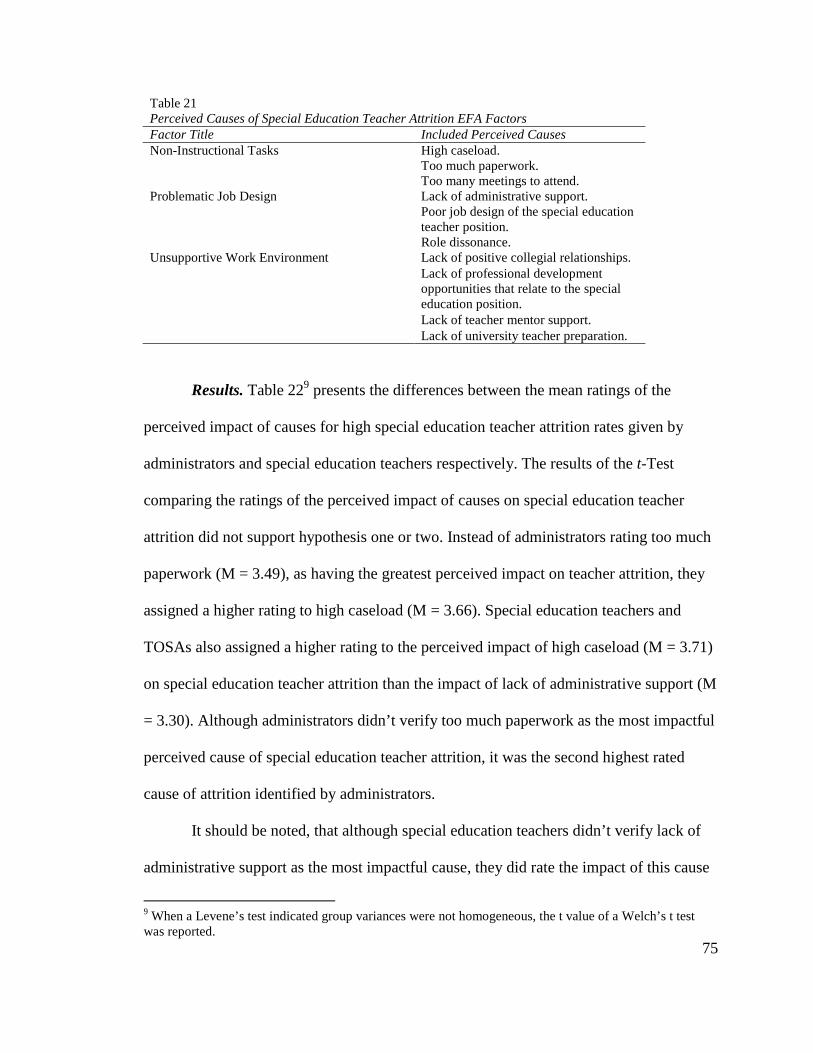
75
Table 21 Perceived Causes of Special Education Teacher Attrition EFA Factors Factor Title Included Perceived Causes Non-Instructional Tasks High caseload.
Too much paperwork. Too many meetings to attend.
Problematic Job Design Lack of administrative support. Poor job design of the special education teacher position. Role dissonance.
Unsupportive Work Environment Lack of positive collegial relationships. Lack of professional development opportunities that relate to the special education position. Lack of teacher mentor support. Lack of university teacher preparation.
Results. Table 229 presents the differences between the mean ratings of the
perceived impact of causes for high special education teacher attrition rates given by
administrators and special education teachers respectively. The results of the t-Test
comparing the ratings of the perceived impact of causes on special education teacher
attrition did not support hypothesis one or two. Instead of administrators rating too much
paperwork (M = 3.49), as having the greatest perceived impact on teacher attrition, they
assigned a higher rating to high caseload (M = 3.66). Special education teachers and
TOSAs also assigned a higher rating to the perceived impact of high caseload (M = 3.71)
on special education teacher attrition than the impact of lack of administrative support (M
= 3.30). Although administrators didn’t verify too much paperwork as the most impactful
perceived cause of special education teacher attrition, it was the second highest rated
cause of attrition identified by administrators.
It should be noted, that although special education teachers didn’t verify lack of
administrative support as the most impactful cause, they did rate the impact of this cause
9 When a Levene’s test indicated group variances were not homogeneous, the t value of a Welch’s t test was reported.
76
much higher than administrators did (M = 2.86, SD = 0.64 and M = 3.30, SD = 0.83, for
administrators and special education teachers, respectively; t = -4.65, p < .01.).
Interestingly, when comparing the percentage of each perceived cause of special
education attrition that was selected as the perceived primary cause of attrition as seen in
Table F, administrators most frequently selected too much paperwork (M = 30.30) as the
primary perceived cause of special education teacher attrition. On the other hand, special
education teachers and TOSAs continued to endorse high caseload (M = 25.62), as well
as similarly selecting too much paperwork (24.20%) as the primary perceived cause of
attrition. When considering primary selection of the perceived cause of attrition,
hypothesis one is supported, whereas hypothesis two continues to be rejected.
Summary. In summary, administrators perceived high caseload as having the
greatest impact on special education teachers, but selected too much paperwork as the
primary perceived cause of attrition. Special education teachers and TOSAs also
perceived high caseload as having the greatest impact on special education teacher
attrition, while selecting both high caseload and too much paperwork as the primary
causes of attrition. Table 23 provides a simplified summary of the findings for question
one and the associated hypotheses based on ratings of perceived causes of special
education teacher attrition and primary selection of perceived causes.
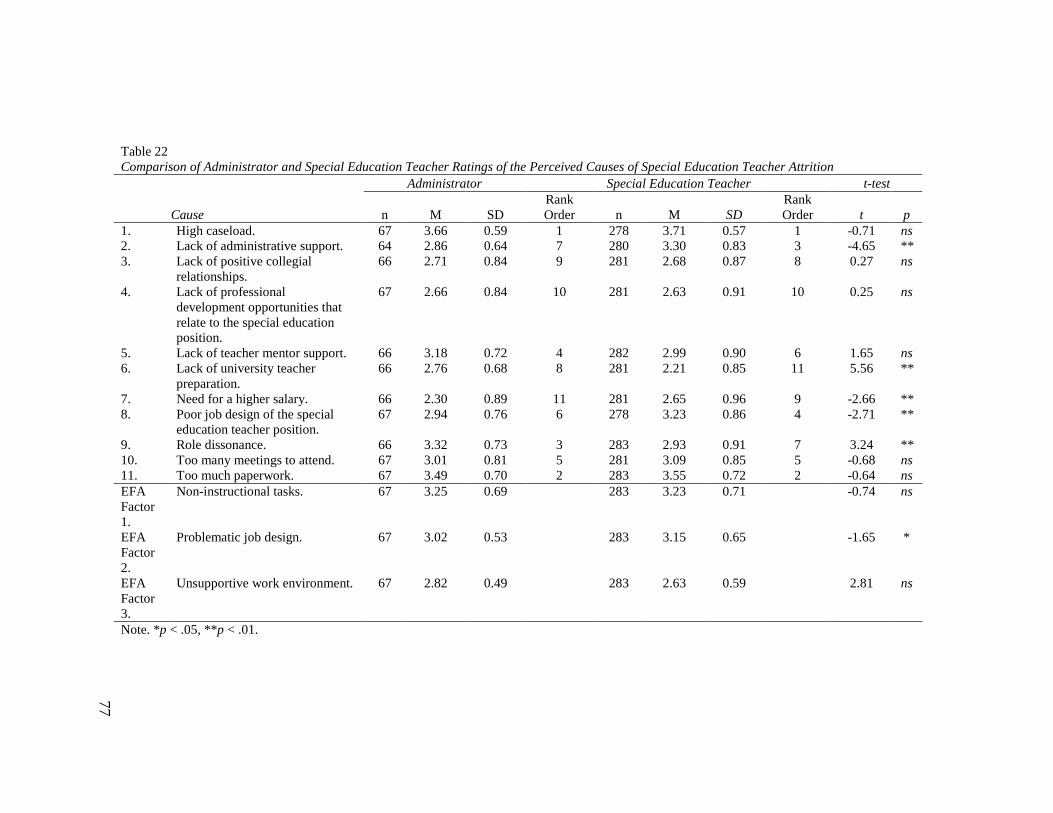
77
Table 22 Comparison of Administrator and Special Education Teacher Ratings of the Perceived Causes of Special Education Teacher Attrition
Administrator Special Education Teacher t-test
Cause n M SD Rank Order n M SD
Rank Order t p
1. High caseload. 67 3.66 0.59 1 278 3.71 0.57 1 -0.71 ns 2. Lack of administrative support. 64 2.86 0.64 7 280 3.30 0.83 3 -4.65 ** 3. Lack of positive collegial
relationships. 66 2.71 0.84 9 281 2.68 0.87 8 0.27 ns
4. Lack of professional development opportunities that relate to the special education position.
67 2.66 0.84 10 281 2.63 0.91 10 0.25 ns
5. Lack of teacher mentor support. 66 3.18 0.72 4 282 2.99 0.90 6 1.65 ns 6. Lack of university teacher
preparation. 66 2.76 0.68 8 281 2.21 0.85 11 5.56 **
7. Need for a higher salary. 66 2.30 0.89 11 281 2.65 0.96 9 -2.66 ** 8. Poor job design of the special
education teacher position. 67 2.94 0.76 6 278 3.23 0.86 4 -2.71 **
9. Role dissonance. 66 3.32 0.73 3 283 2.93 0.91 7 3.24 ** 10. Too many meetings to attend. 67 3.01 0.81 5 281 3.09 0.85 5 -0.68 ns 11. Too much paperwork. 67 3.49 0.70 2 283 3.55 0.72 2 -0.64 ns EFA Factor 1.
Non-instructional tasks. 67 3.25 0.69 283 3.23 0.71 -0.74 ns
EFA Factor 2.
Problematic job design. 67 3.02 0.53 283 3.15 0.65 -1.65 *
EFA Factor 3.
Unsupportive work environment. 67 2.82 0.49 283 2.63 0.59 2.81 ns
Note. *p < .05, **p < .01.
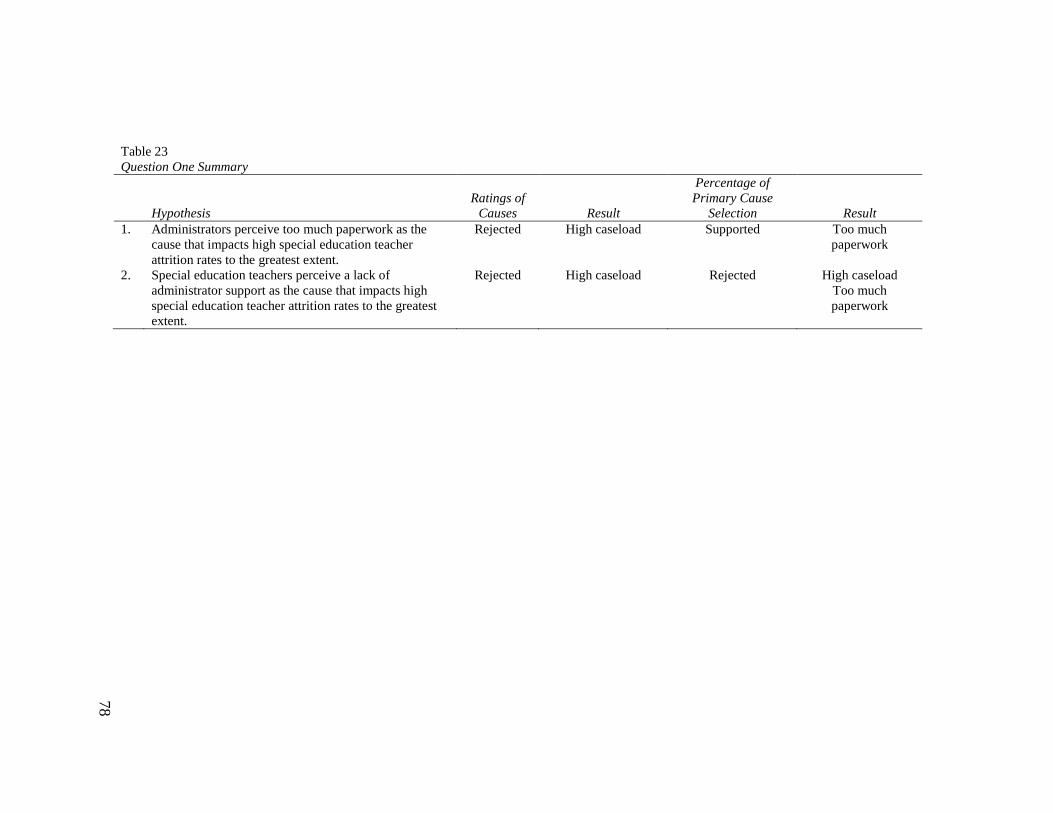
78
Table 23 Question One Summary
Hypothesis Ratings of
Causes Result
Percentage of Primary Cause
Selection Result 1. Administrators perceive too much paperwork as the
cause that impacts high special education teacher attrition rates to the greatest extent.
Rejected High caseload Supported Too much paperwork
2. Special education teachers perceive a lack of administrator support as the cause that impacts high special education teacher attrition rates to the greatest extent.
Rejected High caseload Rejected High caseload Too much paperwork
79
Research Question Two
The second research question that was addressed in this study was: Do
administrators and special education teachers identify the same causes of high special
education teacher attrition rates? Hypothesis three was: Administrators and special
education teachers identify a different primary cause of high special education teacher
attrition rates.
Qualitative Analysis.
Coding of qualitative responses. The qualitative codes that were assigned to
perceived primary cause qualitative responses included the following:
1. Overwhelming Job Responsibilities 2. Lack of Personal Success/Fear of Failure 3. Lack of Understanding of Special Education 4. Lack of Compensation 5. Training Does Not Prepare for the Job 6. Role Dissonance 7. Lack of Resources.
Some qualitative responses received multiple codes, whereas other responses
were assigned a singular code.
The code of “overwhelming job responsibilities” included comments related to
the impact of the amount of tasks assigned to the special education teacher including
instruction of students (teaching and lesson planning), paperwork, meetings, assessment,
collaboration, behavior management, supervision of instructional assistants, and building
level supervision duties on special education teacher attrition. An example of an
administrator response assigned a code of overwhelming job responsibilities code was, “I
believe teachers find themselves in meetings and doing paperwork more than they
anticipated. They love kids and want to spend time with kids teaching.”
80
The code of “lack of personal success and a fear of failure was assigned to
responses indicating that teachers leave the special education profession as a result of a
lack of success in their work and/or because they are worried there will be a consequence
of not doing something correctly. An example of a special education teacher/TOSA
response with this code was, “Due to the many responsibilities of a special teacher this
sometimes causes teachers to overreach/overstep their roles leading to a feeling of failure
and dissatisfaction.”
The code of “lack of understanding of special education” included comments
about the impact of a lack of knowledge of administrators and general education
colleagues regarding special education services. A special education teacher/TOSA open-
ended response assigned this coding was:
Administration does not understand the job, so they do not understand how to support special education teachers. Do not accept feedback. Ultimately, I don’t think school districts want to retain teachers anymore. They want to hire the cheapest teachers possible, especially for special ed. Responses received the code of “lack of compensation” if the response indicated
special education teachers leave the profession as a result of low salaries. An example of
an open-ended qualitative response from an administrator that received this code was,
“Too much responsibility and not enough pay.”
The code of “training does not prepare for the job” was used to describe survey
responses that indicated that teacher preparation programs did not adequately prepare the
teacher for their position. An administrator open-ended qualitative response that received
this coding stated the following, “University training SPED & general ed does not reflect
81
the pressures & constantly changing demands and expectations in the world of students
with ever increasing needs.”
“Role dissonance” was a code used to code responses that indicated that special
education teachers leave the profession because there was a difference between what the
special education teacher job required and what the teacher thought the job would be like.
An example of an administrator open-ended qualitative response that was assigned the
code of role dissonance was, “People learn the job is not the one they wanted. Often
related to paperwork, meeting facilitation, conflicting administrator expectations, need
for provision of behavioral support.”
The code of “lack of resources” was used to describe responses that indicated that
special education teachers leave the profession as a result of limited resources to
complete their job. A special education teacher/TOSA open-ended qualitative response
assigned this code was, “Students need specially designed instruction in areas of deficit
plus support in gened content classes—very challenging to schedule given time and FTE.
No identified curriculum, no district support whatsoever, and I have done this 40 years.”
All open-ended qualitative responses were coded by whether or not they exhibited
an angry tone (all caps, curse words) and if there was a mention of caseload, meetings,
and/or paperwork. An example of a qualitative response that was identified as having an
angry tone and mentioned meeting requirements and paperwork was:
We spend way SOO much time in meetings and doing required paperwork, that it leaves little time or energy to actually support and teach students. I find I have NO planning time for what I actually teach and NO time to review data appropriately to make data based teaching decisions. I work in a self-contained classroom which got the brunt of the cuts this year. Assistant time was cut to have ZERO planning time, number of assistants was cut and there was NO administrative support based on student need. This was my worst experience teaching special education in the 8 years
82
I have been teaching. Sad...what it is coming to. (Special Education Teacher, open ended response)
Qualitative results. Based on the percentage of each qualitative code that was
assigned to the qualitative responses regarding the primary cause of special education
teacher attrition by administrators and special education teachers/TOSA in the survey,
two sets of rank order of the seven qualitative codes were generated for administrators
and special teachers respectively, as shown in Table 24. The impact of overwhelming job
responsibilities was most frequently mentioned in the qualitative responses of both
administrators (78.43%) and special education teachers and TOSAs (81.78%), with
comments related to the impact of role dissonance on special education teacher attrition
occurring the second most frequently. Administrator and special education teacher/TOSA
comments converged on overwhelming job responsibilities and role dissonance, but with
a slightly different percentage distribution between the two groups of participants. The
qualitative responses by administrators and special education teachers and TOSAs did not
support hypothesis three.
Interestingly, 22.27% of special education teacher/TOSA qualitative responses
regarding the primary cause of special education teacher attrition were coded as having
an angry tone. Additionally, both administrators (43.14%) and special education teachers
and TOSAs (44.53%) frequently mentioned the impact of paperwork on the attrition of
special education teachers.
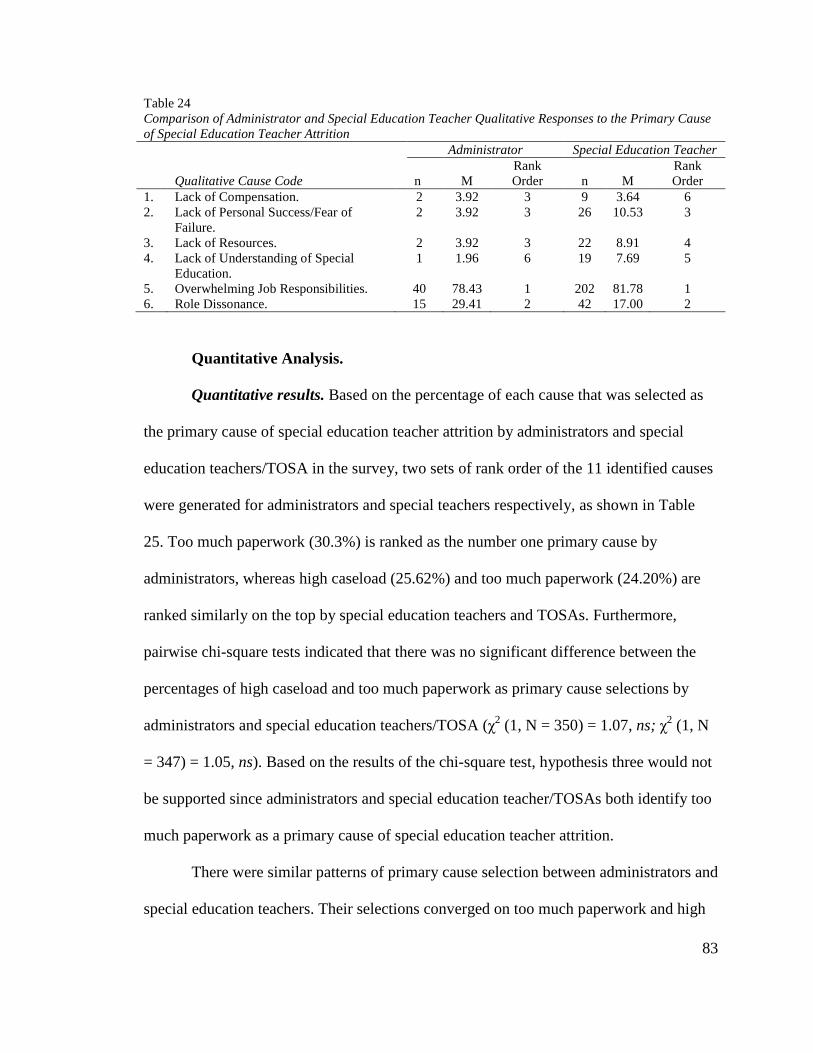
83
Table 24 Comparison of Administrator and Special Education Teacher Qualitative Responses to the Primary Cause of Special Education Teacher Attrition
Administrator Special Education Teacher
Qualitative Cause Code n M Rank Order n M
Rank Order
1. Lack of Compensation. 2 3.92 3 9 3.64 6 2. Lack of Personal Success/Fear of
Failure. 2 3.92 3 26 10.53 3
3. Lack of Resources. 2 3.92 3 22 8.91 4 4. Lack of Understanding of Special
Education. 1 1.96 6 19 7.69 5
5. Overwhelming Job Responsibilities. 40 78.43 1 202 81.78 1 6. Role Dissonance. 15 29.41 2 42 17.00 2
Quantitative Analysis.
Quantitative results. Based on the percentage of each cause that was selected as
the primary cause of special education teacher attrition by administrators and special
education teachers/TOSA in the survey, two sets of rank order of the 11 identified causes
were generated for administrators and special teachers respectively, as shown in Table
25. Too much paperwork (30.3%) is ranked as the number one primary cause by
administrators, whereas high caseload (25.62%) and too much paperwork (24.20%) are
ranked similarly on the top by special education teachers and TOSAs. Furthermore,
pairwise chi-square tests indicated that there was no significant difference between the
percentages of high caseload and too much paperwork as primary cause selections by
administrators and special education teachers/TOSA (χ2 (1, N = 350) = 1.07, ns; χ2 (1, N
= 347) = 1.05, ns). Based on the results of the chi-square test, hypothesis three would not
be supported since administrators and special education teacher/TOSAs both identify too
much paperwork as a primary cause of special education teacher attrition.
There were similar patterns of primary cause selection between administrators and
special education teachers. Their selections converged on too much paperwork and high
84
caseload but with a slightly different percentage distribution between the two groups of
participants. It seems that too much paperwork and high caseload were equally
competitive primary causes for special education teachers in terms of primacy. But that is
not the case for administrators, whose selections were more dominated by too much
paperwork.
Among the top three choices, there were significant percentage differences
between administrators and special education teachers’ selections of role dissonance
(21.21% and 11.03% for administrators and teachers respectively; χ2 (1, N = 350) = 4.78,
p < .05) and lack of administrative support (3.03% and 14.95% for administrators and
special education teachers; χ2 (1, N = 350) = 6.93, p < .01). The primacy of role
dissonance is recognized more by administrators than special education teachers, whereas
the primacy of lack of administrative support is recognized more by special education
teachers than administrators.
The differences between the mean ratings of the impacts of the causes for high
special education teacher attrition rates given by administrators and special education
teachers respectively, shown in Table 22, also do not support hypothesis three: instead of
endorsing difference, both administrators and special education teachers perceived high
caseload as the most impactful cause to attrition rates (M = 3.66, SD = 0.59 and M =
3.37, SD = 0.57, for administrators and special education teachers, respectively; t = -0.71,
p = ns). Furthermore, administrators and special education teachers mutually agreed on
the top two causes in terms of their impacts on high special education attrition rates,
when reviewing the rank order of the causes based on the mean ratings; high caseload
and too much paperwork are equally ranked as the top two causes by the two groups of
85
participants with mean ratings equal to or greater than 3.50 on a 4-point Likert scale,
which conventionally indicate positive endorsement instead of neural attitude (too much
paperwork, M = 3.49, SD = 0.70 and M = 3.55, SD = 0.72, for administrators and special
education teachers, respectively; t = -0.64, p = ns.). Simply put, both groups rated high
caseload as having the perceived greatest impact on special education teacher attrition.
On another note, administrators and special education teachers similarly perceived
lack of professional development opportunities that relate to the special education
position as a relatively less impactful cause to high special education teacher attrition
rates (M = 2.66, SD = 0.84 and M = 2.63, SD = 0.91, for administrators and special
education teachers, respectively; t = 0.25, p = ns.).
Interestingly, there were a few significant differences noteworthy between how
administrators and special education teachers and TOSAs rated causes of special
education teacher attrition. Special education teachers and TOSAs rated the impact of
lack of administrative support much higher than administrators did (M = 2.86, SD = 0.64
and M = 3.30, SD = 0.83, for administrators and special education teachers, respectively;
t = -4.65, p < .01). By contrast, administrators rated role dissonance10 as a cause with
much higher impact than special education teachers did (M = 3.32, SD = 0.73 and M =
2.93, SD = 0.91, for administrators and special education teachers, respectively; t = 3.24,
p < .01). There were also significant differences between how administrators and special
education teachers and TOSAs rated the causes of poor job design and a lack teacher
mentor support. Administrators identified a lack of teacher mentor support as relatively
more impactful and special education teachers/TOSAs identified poor job design as
10 Role dissonance was defined in the survey as, “Difference between what the job requires and what the teacher thought the job would be like.”
86
relatively more impactful (see Table 21 for details). There were significant differences
for the two low impact causes of higher salary and lack of university teacher preparation,
which were ranked as two of the bottom three causes by both administrators and special
education teachers. Administrators perceived the need for a higher salary as the least
important cause, while special education perceived a lack of university teacher
preparation as the least important cause (see Table 22).
When comparing the results from the three-factor perspective that were
discovered through EFA, administrators and special education teachers and TOSAs
similarly rated the impact perceived causes related to non-instructional tasks and
unsupportive work environment. On the other hand, there were significant differences
with how administrators and special education teachers and TOSAs rated problematic job
design. As a result, the EFA partially supports hypothesis three.
Summary. In summary, in their qualitative responses, both administrators and
special education teachers most often mentioned their perception of the impact of
overwhelming job responsibilities on special education teacher attrition. With respect to
rating perceived causes of attrition, both administrators and special education teachers
and TOSAs rated high caseload as having the greatest impact on attrition and selected too
much paperwork as the perceive primary cause of attrition. Table 26 provides a
simplified summary of the findings for question two and the associated hypothesis based
on qualitative responses, ratings of perceived causes of special education teacher attrition,
and primary selection of perceived causes.
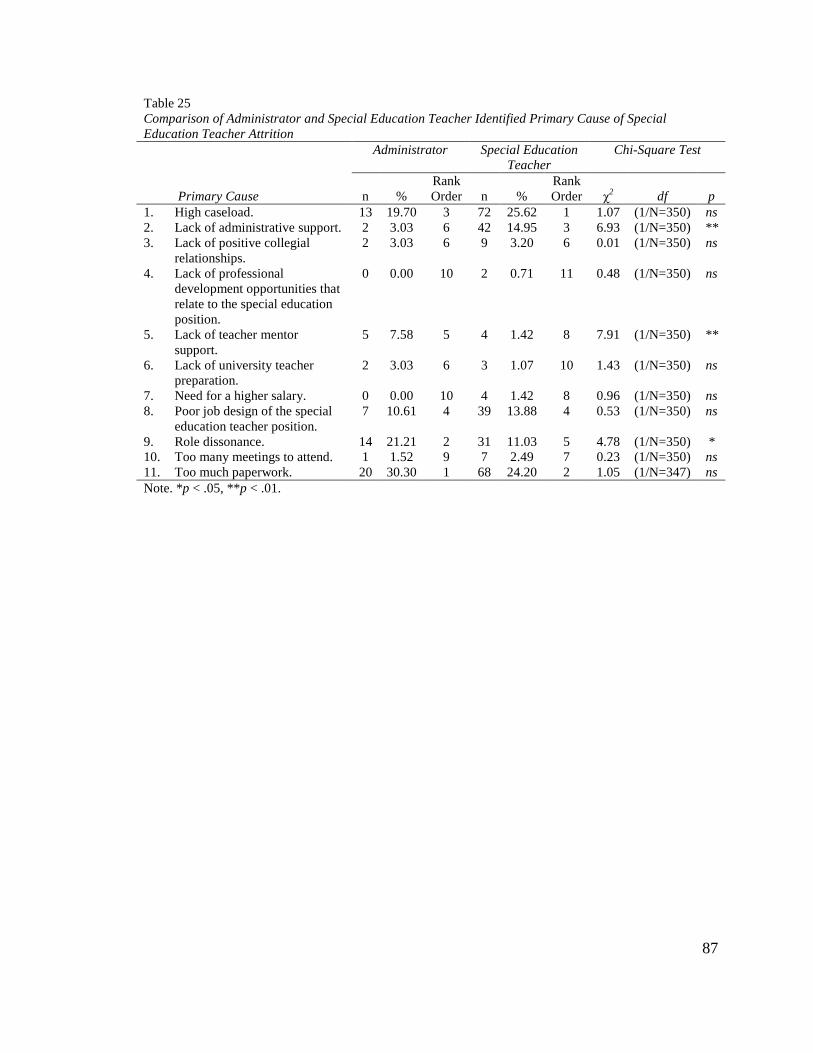
87
Table 25 Comparison of Administrator and Special Education Teacher Identified Primary Cause of Special Education Teacher Attrition
Administrator Special Education Teacher
Chi-Square Test
Primary Cause n % Rank Order n %
Rank Order χ
2 df p 1. High caseload. 13 19.70 3 72 25.62 1 1.07 (1/N=350) ns 2. Lack of administrative support. 2 3.03 6 42 14.95 3 6.93 (1/N=350) ** 3. Lack of positive collegial
relationships. 2 3.03 6 9 3.20 6 0.01 (1/N=350) ns
4. Lack of professional development opportunities that relate to the special education position.
0 0.00 10 2 0.71 11 0.48 (1/N=350) ns
5. Lack of teacher mentor support.
5 7.58 5 4 1.42 8 7.91 (1/N=350) **
6. Lack of university teacher preparation.
2 3.03 6 3 1.07 10 1.43 (1/N=350) ns
7. Need for a higher salary. 0 0.00 10 4 1.42 8 0.96 (1/N=350) ns 8. Poor job design of the special
education teacher position. 7 10.61 4 39 13.88 4 0.53 (1/N=350) ns
9. Role dissonance. 14 21.21 2 31 11.03 5 4.78 (1/N=350) * 10. Too many meetings to attend. 1 1.52 9 7 2.49 7 0.23 (1/N=350) ns 11. Too much paperwork. 20 30.30 1 68 24.20 2 1.05 (1/N=347) ns Note. *p < .05, **p < .01.
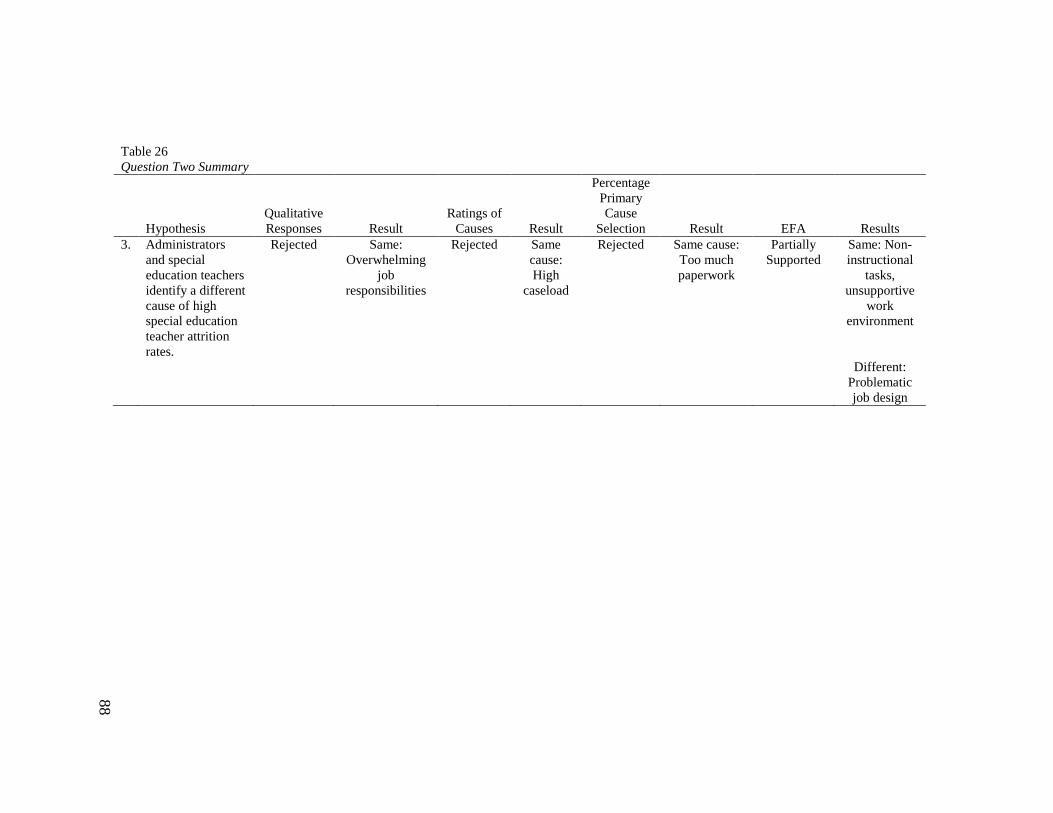
88
Table 26 Question Two Summary
Hypothesis Qualitative Responses Result
Ratings of Causes Result
Percentage Primary Cause
Selection Result EFA Results 3. Administrators
and special education teachers identify a different cause of high special education teacher attrition rates.
Rejected Same: Overwhelming
job responsibilities
Rejected Same cause: High
caseload
Rejected Same cause: Too much paperwork
Partially Supported
Same: Non-instructional
tasks, unsupportive
work environment
Different: Problematic job design
89
Research Question Three
The third research question this study addressed was: What interventions do
administrators and special education teachers perceive will increase special education
teacher retention rates? Hypothesis four was: Administrators perceive a reduction in
paperwork as the intervention that will increase special education teacher retention rates
the greatest extent. Hypothesis five was: Special education teachers perceive increased
administrator support11 as the intervention that will increase special education teacher
retention rates to the greatest extent.
Quantitative Analysis.
Exploratory Factor Analyses (EFAs) of perceived interventions. In a similar
vein, as the causes of special education teacher attrition there were medium to high
correlations between the number of interventions to increase retention rates of special
education teachers (see Table 27). An EFA was conducted to identify the nature of the
latent factors underlying responses to the 12-item scale of interventions to increase
special education teacher retention rates and combine some of the items based on the
factor structure discovered to simplify the analysis.
As shown in Table 28, a three-factor structure was identified based on the
responses12 on the 12-item intervention scale. The item of “increase special education
teacher salaries” was excluded for the sake of consistency between causes and
interventions of the study interest. The three-factor solution is perfectly clean. All items
11 Assisting special education teachers with the inclusion of students with disabilities in the general education setting, improving the special education program/service delivery, and problem solving (Billingsley, 2003; Westling & Whitten, 1996). 12 Similar factor structures were achieved by conducting two EFAs based on responses of special education teachers only and those combining administrators and special education teachers. Results from EFA based on responses from both administrators and special education teachers are reported.
90
have factor loadings bigger than .41. The first factor includes “increase administrative
support;” “increase administrative understanding of special education policies,
procedures, and instructional practices;” and “increase general education understanding
of special education policies, procedures, and instructional practices.” These items
represent interventions focused on “knowledge.” The second factor includes four items:
“increase the length of time spent in teacher preparation programs,” “increase
professional development opportunities directly related to special education teachers,”
“increase opportunities to collaborate with general education colleagues,” and “increase
opportunities to collaborate with special education colleagues.” These items represent
interventions based on “preparation and support.” The third factor includes “lower special
education teacher caseloads,” “redesign the special education teacher position,” “reduce
paperwork requirements,” and “reduce the number of meetings special education teachers
must attend.” These items represent interventions based on “job redesign.” The difference
between factor 2 and factor 3 is meaningful. Factor 3 is about changes normally driven by
top-down processes, or a vertical influence in an organizational hierarchy, while factor 2
is about environmental supports and resources normally driven by lateral influences. The
three factors explain 16.23%, 13.41%, and 12.85% of the total variance respectively.
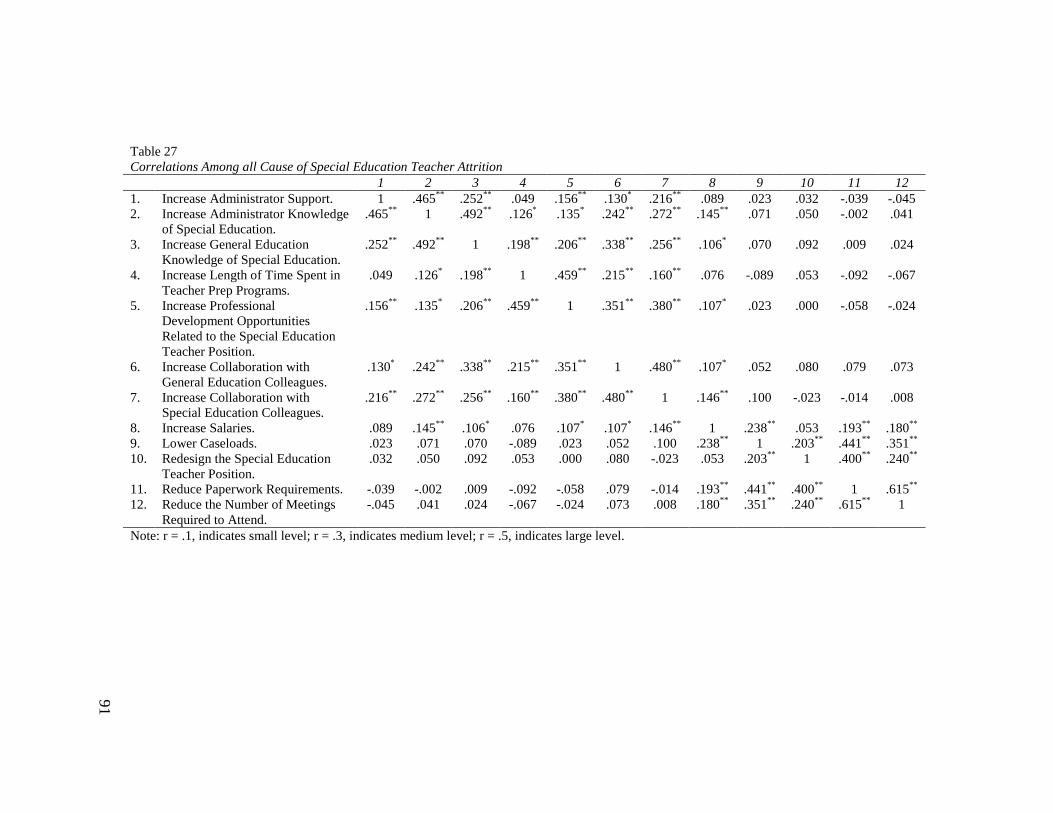
91
Table 27 Correlations Among all Cause of Special Education Teacher Attrition 1 2 3 4 5 6 7 8 9 10 11 12 1. Increase Administrator Support. 1 .465** .252** .049 .156** .130* .216** .089 .023 .032 -.039 -.045 2. Increase Administrator Knowledge
of Special Education. .465** 1 .492** .126* .135* .242** .272** .145** .071 .050 -.002 .041
3. Increase General Education Knowledge of Special Education.
.252** .492** 1 .198** .206** .338** .256** .106* .070 .092 .009 .024
4. Increase Length of Time Spent in Teacher Prep Programs.
.049 .126* .198** 1 .459** .215** .160** .076 -.089 .053 -.092 -.067
5. Increase Professional Development Opportunities Related to the Special Education Teacher Position.
.156** .135* .206** .459** 1 .351** .380** .107* .023 .000 -.058 -.024
6. Increase Collaboration with General Education Colleagues.
.130* .242** .338** .215** .351** 1 .480** .107* .052 .080 .079 .073
7. Increase Collaboration with Special Education Colleagues.
.216** .272** .256** .160** .380** .480** 1 .146** .100 -.023 -.014 .008
8. Increase Salaries. .089 .145** .106* .076 .107* .107* .146** 1 .238** .053 .193** .180** 9. Lower Caseloads. .023 .071 .070 -.089 .023 .052 .100 .238** 1 .203** .441** .351** 10. Redesign the Special Education
Teacher Position. .032 .050 .092 .053 .000 .080 -.023 .053 .203** 1 .400** .240**
11. Reduce Paperwork Requirements. -.039 -.002 .009 -.092 -.058 .079 -.014 .193** .441** .400** 1 .615** 12. Reduce the Number of Meetings
Required to Attend. -.045 .041 .024 -.067 -.024 .073 .008 .180** .351** .240** .615** 1
Note: r = .1, indicates small level; r = .3, indicates medium level; r = .5, indicates large level.
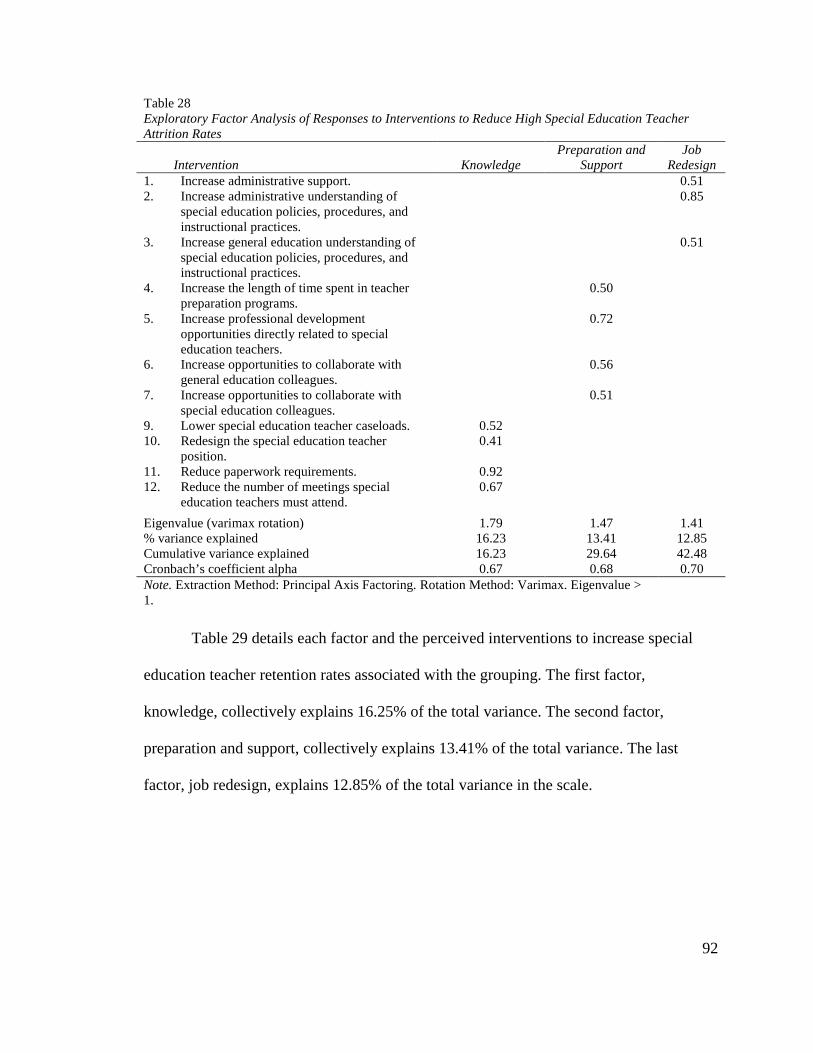
92
Table 28 Exploratory Factor Analysis of Responses to Interventions to Reduce High Special Education Teacher Attrition Rates
Intervention Knowledge Preparation and
Support Job
Redesign 1. Increase administrative support. 0.51 2. Increase administrative understanding of
special education policies, procedures, and instructional practices.
0.85
3. Increase general education understanding of special education policies, procedures, and instructional practices.
0.51
4. Increase the length of time spent in teacher preparation programs.
0.50
5. Increase professional development opportunities directly related to special education teachers.
0.72
6. Increase opportunities to collaborate with general education colleagues.
0.56
7. Increase opportunities to collaborate with special education colleagues.
0.51
9. Lower special education teacher caseloads. 0.52 10. Redesign the special education teacher
position. 0.41
11. Reduce paperwork requirements. 0.92 12. Reduce the number of meetings special
education teachers must attend. 0.67
Eigenvalue (varimax rotation) 1.79 1.47 1.41 % variance explained 16.23 13.41 12.85 Cumulative variance explained 16.23 29.64 42.48 Cronbach’s coefficient alpha 0.67 0.68 0.70 Note. Extraction Method: Principal Axis Factoring. Rotation Method: Varimax. Eigenvalue > 1.
Table 29 details each factor and the perceived interventions to increase special
education teacher retention rates associated with the grouping. The first factor,
knowledge, collectively explains 16.25% of the total variance. The second factor,
preparation and support, collectively explains 13.41% of the total variance. The last
factor, job redesign, explains 12.85% of the total variance in the scale.
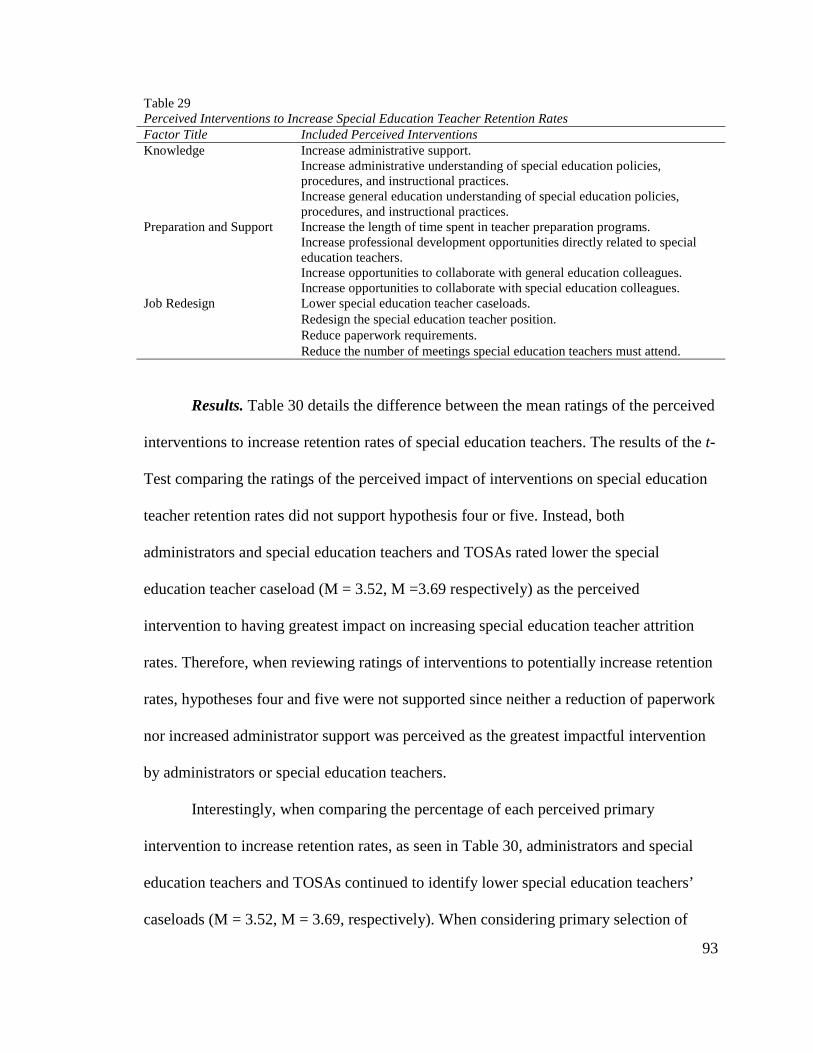
93
Table 29 Perceived Interventions to Increase Special Education Teacher Retention Rates Factor Title Included Perceived Interventions Knowledge Increase administrative support.
Increase administrative understanding of special education policies, procedures, and instructional practices. Increase general education understanding of special education policies, procedures, and instructional practices.
Preparation and Support Increase the length of time spent in teacher preparation programs. Increase professional development opportunities directly related to special education teachers. Increase opportunities to collaborate with general education colleagues.
Increase opportunities to collaborate with special education colleagues.
Job Redesign Lower special education teacher caseloads. Redesign the special education teacher position. Reduce paperwork requirements. Reduce the number of meetings special education teachers must attend.
Results. Table 30 details the difference between the mean ratings of the perceived
interventions to increase retention rates of special education teachers. The results of the t-
Test comparing the ratings of the perceived impact of interventions on special education
teacher retention rates did not support hypothesis four or five. Instead, both
administrators and special education teachers and TOSAs rated lower the special
education teacher caseload (M = 3.52, M =3.69 respectively) as the perceived
intervention to having greatest impact on increasing special education teacher attrition
rates. Therefore, when reviewing ratings of interventions to potentially increase retention
rates, hypotheses four and five were not supported since neither a reduction of paperwork
nor increased administrator support was perceived as the greatest impactful intervention
by administrators or special education teachers.
Interestingly, when comparing the percentage of each perceived primary
intervention to increase retention rates, as seen in Table 30, administrators and special
education teachers and TOSAs continued to identify lower special education teachers’
caseloads (M = 3.52, M = 3.69, respectively). When considering primary selection of
94
interventions perceived to potentially increase special education teacher retention rates,
hypotheses four and five continue to be rejected.
Summary. In summary, both administrators and special education teachers and
TOSAs rated the intervention of lower special education caseloads as having the
perceived greatest impact on increasing special education teacher retention rates and they
both selected lower special education caseloads as the primary intervention. Table 30
provides a simplified summary of the findings for question three and the associated
hypotheses based on ratings of interventions perceived to increase special education
teacher retention rates and primary selection of interventions.
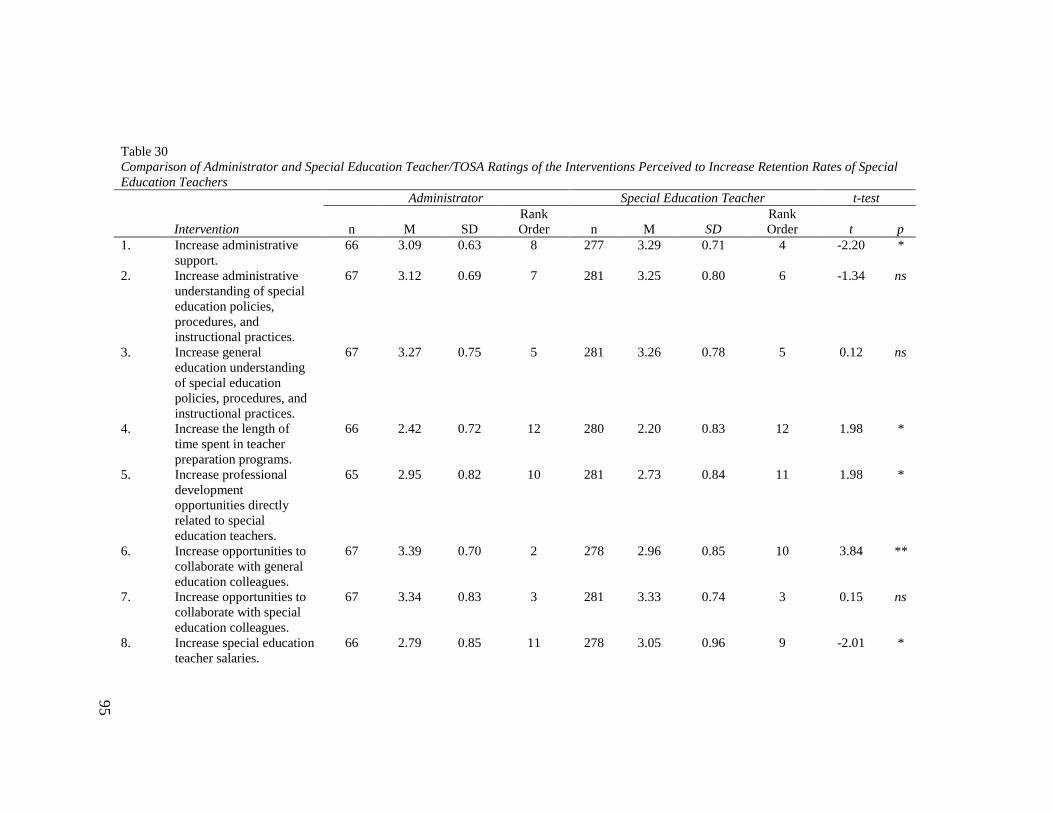
95
Table 30 Comparison of Administrator and Special Education Teacher/TOSA Ratings of the Interventions Perceived to Increase Retention Rates of Special Education Teachers
Administrator Special Education Teacher t-test
Intervention n M SD Rank Order n M SD
Rank Order t p
1. Increase administrative support.
66 3.09 0.63 8 277 3.29 0.71 4 -2.20 *
2. Increase administrative understanding of special education policies, procedures, and instructional practices.
67 3.12 0.69 7 281 3.25 0.80 6 -1.34 ns
3. Increase general education understanding of special education policies, procedures, and instructional practices.
67 3.27 0.75 5 281 3.26 0.78 5 0.12 ns
4. Increase the length of time spent in teacher preparation programs.
66 2.42 0.72 12 280 2.20 0.83 12 1.98 *
5. Increase professional development opportunities directly related to special education teachers.
65 2.95 0.82 10 281 2.73 0.84 11 1.98 *
6. Increase opportunities to collaborate with general education colleagues.
67 3.39 0.70 2 278 2.96 0.85 10 3.84 **
7. Increase opportunities to collaborate with special education colleagues.
67 3.34 0.83 3 281 3.33 0.74 3 0.15 ns
8. Increase special education teacher salaries.
66 2.79 0.85 11 278 3.05 0.96 9 -2.01 *
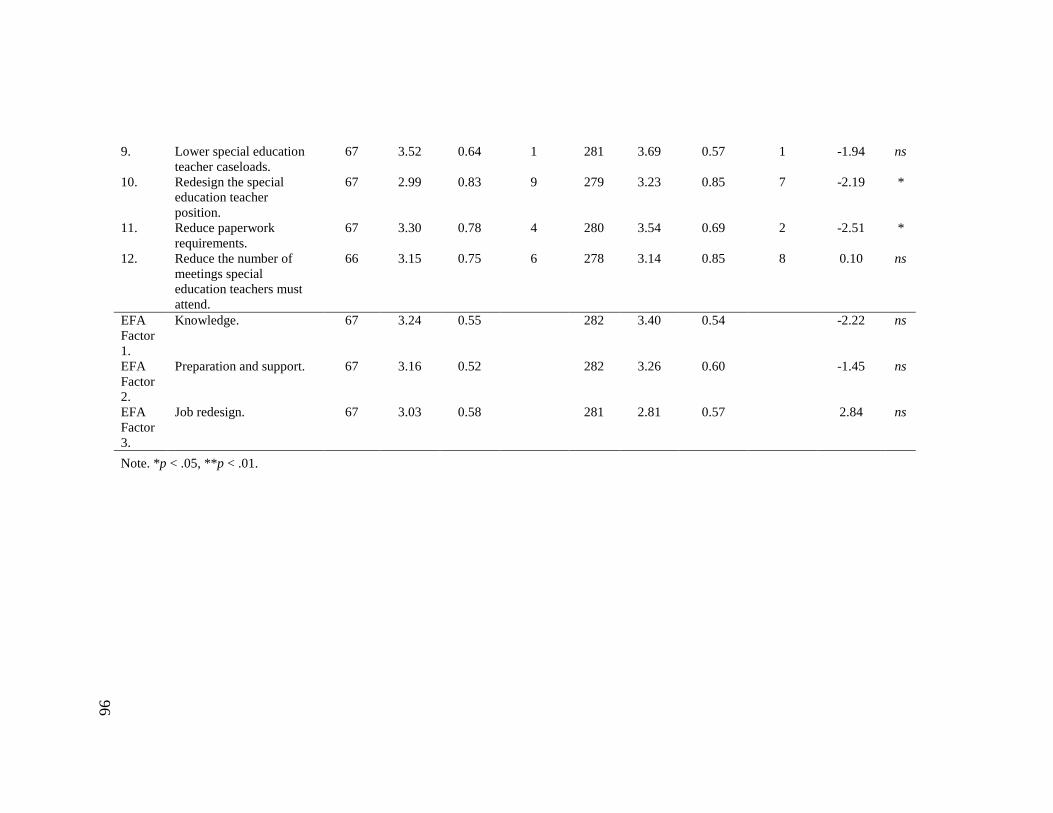
96
9. Lower special education teacher caseloads.
67 3.52 0.64 1 281 3.69 0.57 1 -1.94 ns
10. Redesign the special education teacher position.
67 2.99 0.83 9 279 3.23 0.85 7 -2.19 *
11. Reduce paperwork requirements.
67 3.30 0.78 4 280 3.54 0.69 2 -2.51 *
12. Reduce the number of meetings special education teachers must attend.
66 3.15 0.75 6 278 3.14 0.85 8 0.10 ns
EFA Factor 1.
Knowledge. 67 3.24 0.55 282 3.40 0.54 -2.22 ns
EFA Factor 2.
Preparation and support. 67 3.16 0.52 282 3.26 0.60 -1.45 ns
EFA Factor 3.
Job redesign. 67 3.03 0.58
281 2.81 0.57
2.84 ns
Note. *p < .05, **p < .01.
97
Table 31 Question Three Summary
Hypothesis
Ratings of the Perceived Impact of Interventions
on Retention Rates Result
Percentage of Selected Perceived Primary
Intervention to Increase Retention Rates Result
4. Administrators perceive a reduction in paperwork as the intervention that will increase special education teacher retention rates the greatest extent.
Rejected Lower special education teacher
caseload.
Rejected Lower special education teacher
caseload.
5. Special education teachers perceive increased administrator support as the intervention that will increase special education teacher retention rates to the greatest extent.
Rejected Lower special education teacher
caseload.
Rejected Lower special education teacher
caseload.
98
Research Question Four
The fourth research question that was addressed in this study was: Do
administrators and special education teachers identify the same interventions for reducing
high special education teacher attrition rates? Hypothesis six was: Administrators and
special education teachers identify a different primary intervention for increasing high
special education teacher retention rates.
Qualitative Analysis.
Coding of qualitative responses. The qualitative codes that were assigned to the
qualitative responses regarding the perceived primary intervention to increase retention
rates of special education teachers included the following:
1. Increase Collaboration 2. Increase Instruction 3. Increase Salary 4. Increase Support 5. Increase Understanding of Special Education 6. Lower Caseloads 7. Redesign the Position 8. Reduce Non-Instructional Tasks
Some qualitative responses received multiple codes, whereas other responses
were assigned a singular code.
The code of “increase collaboration” was assigned to qualitative responses that
indicated that additional collaboration with general education colleagues, special
education colleagues, administrators, and/or mentors would increase the retention of
special education teachers. An example of an administrator response with this code was,
“Learning specialists desire to teach students and collaborate with their general education
99
peers. When the ability to do this is restricted, learning specialists lose hope and don’t
believe they are having a positive impact on student learning.”
“Increase instruction” was a code used to identify responses that indicated
increased time for lesson planning and instruction of students would result in increased
retention rates of special education teachers. A special education teacher/TOSA open-
ended qualitative response assigned this code was:
Allowing special education teachers to focus on the instructional aspects of their job, rather than on the redundant paperwork, would provide them with the rewards of teaching (time with children, celebrating successes, helping students grow and learn, sharing their passion, etc.) that influenced their desire to become teachers in the first place. Responses were assigned the code of “increase salary” if the response indicated
that special education teachers would remain in the profession if they received a higher
salary. An example of a special education teacher/TOSA open-ended qualitative response
with this code was, “To case manage and teach is impossible! They would need to pay
me like the manager that I am, if I were to stay in this field.”
The code of “increase support” referred to qualitative responses that mentioned an
increase in support by administrators, general education colleagues, mentors, teacher
preparation programs, and through professional development would increase the retention
rates of special education teachers. An administrator open-ended qualitative response
with this code was: “Principals and central office administrators who demonstrate their
understanding and/or appreciation of the complexities of special education are better able
to find ways to support teachers in ways that are meaningful.”
The code of “increase understanding of special education” included comments
about how an increase in the understanding of the special education teachers’ role and
100
instructional practices for working with students with disabilities by administrators and
general education colleagues would increase the retention of special education teachers.
One special education teacher/TOSA open-ended qualitative response assigned this code
was:
Administrators at the building level do not understand the complexity of special education laws and the effects on special Ed classrooms. Learning Specialists would be more inclined to stay in their positions if administrators would genuinely show more knowledge on special education laws to navigate difficult cases alongside specialists in their roles. Moreover, it is quite interesting how Specialists report to numerous administrators, yet they are reviewed by building administrators who are not trained in special education laws. “Lower caseloads” was the code assigned to qualitative responses that indicated
that smaller caseloads increase rates of retention. An example of an administrator open-
ended qualitative response with this code was, “Fewer students to case manage would
lead to higher quality service, more time for collaboration and having a higher quality
family life. SpEd staff families pay a real price for their service.”
Responses were assigned the code of “redesign the position” if the response
indicated a need to revamp the special education teacher position to retain special
education teachers. An example of a special education teacher/TOSA open-ended
qualitative response with this code was:
I believe trying to case manage and actually provide the instruction should be two different positions. I could teach a higher number of students, provide progress monitoring and data and write detailed progress notes if I was not trying to do all the case management. I went to school on the east coast and taught there for a while and it was done like this in my school district. Lastly, the code of “reduce non-instructional tasks” included comments related to
a reduction in tasks such as paperwork, meetings, assessment, behavior management,
supervision of instructional assistants, and building level supervision. One administrative
101
open-ended qualitative response assigned this code was, “Less paperwork, fewer
meetings, more in-depth teaching.”
All open-ended qualitative responses were coded by whether or not they exhibited
an angry tone (all caps, curse words) and if there was a mention of caseload, meetings,
and/or paperwork.
Qualitative results. Based on the percentage of each qualitative code that was
assigned to the qualitative responses regarding the primary intervention to increase of
special education teacher retention rates by administrators and special education
teachers/TOSAs in the survey, two sets of rank order of the 8 qualitative codes were
generated for administrators and special teachers respectively. As shown in Table 32, the
need to increase instruction (41.03%) was most frequently mentioned by administrators
with respect to interventions to increase retention, whereas lower caseloads (28.38%),
reduce non-instructional tasks (27.48%), and increase instruction (27.03%) were most
frequently identified by special education teachers and TOSAs as interventions to
increase special education teacher retention rates. Given the difference between
administrator and special education teacher and TOSA responses, hypothesis six is
supported.
Interestingly, 19.37% of special education teacher/TOSA responses were
identified as having an angry tone to their response. Additionally administrators (23.08%)
and special education teachers/TOSAs (30.63%) continued to mention paperwork within
their responses related to interventions to increase the retention rates of special education
teachers.
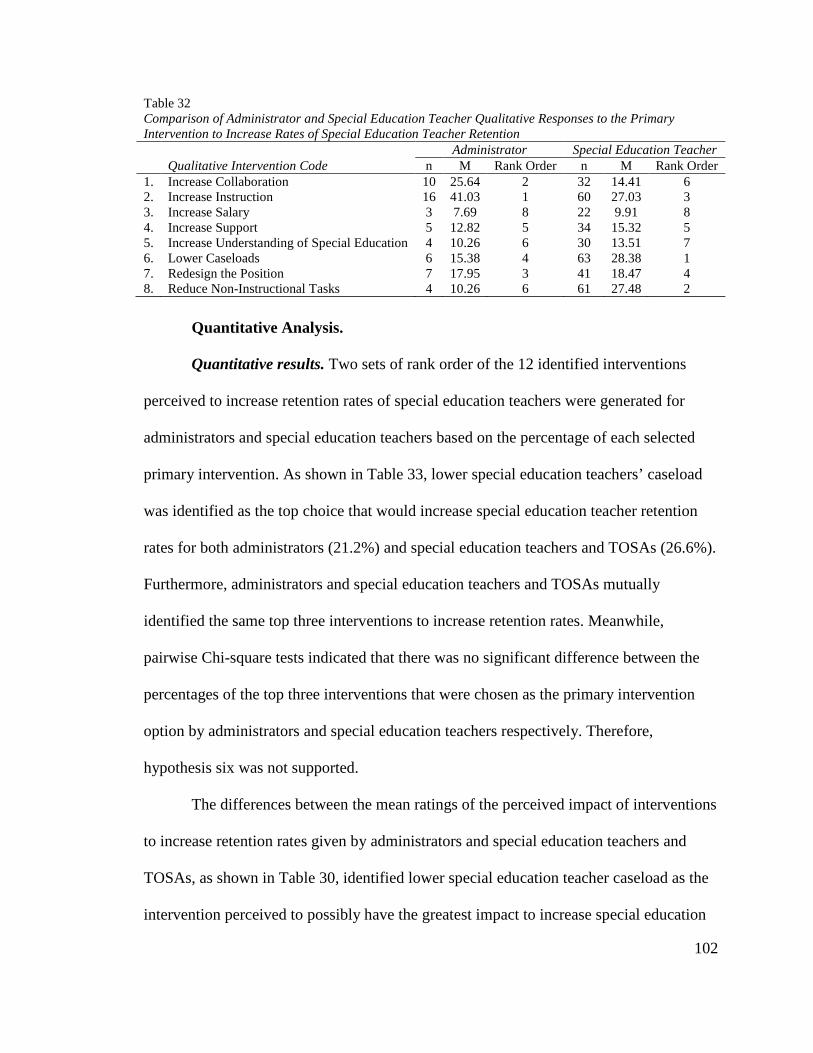
102
Table 32 Comparison of Administrator and Special Education Teacher Qualitative Responses to the Primary Intervention to Increase Rates of Special Education Teacher Retention
Administrator Special Education Teacher Qualitative Intervention Code n M Rank Order n M Rank Order 1. Increase Collaboration 10 25.64 2 32 14.41 6 2. Increase Instruction 16 41.03 1 60 27.03 3 3. Increase Salary 3 7.69 8 22 9.91 8 4. Increase Support 5 12.82 5 34 15.32 5 5. Increase Understanding of Special Education 4 10.26 6 30 13.51 7 6. Lower Caseloads 6 15.38 4 63 28.38 1 7. Redesign the Position 7 17.95 3 41 18.47 4 8. Reduce Non-Instructional Tasks 4 10.26 6 61 27.48 2
Quantitative Analysis.
Quantitative results. Two sets of rank order of the 12 identified interventions
perceived to increase retention rates of special education teachers were generated for
administrators and special education teachers based on the percentage of each selected
primary intervention. As shown in Table 33, lower special education teachers’ caseload
was identified as the top choice that would increase special education teacher retention
rates for both administrators (21.2%) and special education teachers and TOSAs (26.6%).
Furthermore, administrators and special education teachers and TOSAs mutually
identified the same top three interventions to increase retention rates. Meanwhile,
pairwise Chi-square tests indicated that there was no significant difference between the
percentages of the top three interventions that were chosen as the primary intervention
option by administrators and special education teachers respectively. Therefore,
hypothesis six was not supported.
The differences between the mean ratings of the perceived impact of interventions
to increase retention rates given by administrators and special education teachers and
TOSAs, as shown in Table 30, identified lower special education teacher caseload as the
intervention perceived to possibly have the greatest impact to increase special education
103
teacher attrition rates for both groups. Nevertheless, there was no significant mean
difference between administrators’ and special education teachers’ and TOSAs’ ratings of
this intervention’s impact to increasing special education teacher retention rates (M =
3.52, SD = 0.64 and M = 3.69, SD = 0.57, for administrators and special education
teachers, respectively; t = -1.94, p = ns.).
There were a few significant differences noteworthy between how administrators
and special education teachers and TOSAs rated interventions to possibly increase special
education teacher attrition rates. There was no significant statistical difference between
how administrators and special education teachers and TOSAs rated the interventions of
increasing administrative and general education understanding of special education
policies, procedures, and instructional practices; increasing opportunities to collaborate
with special education colleagues; and reducing the number of meetings special
education teachers must attend. There was, however, a statistically significant difference
in how administrators and special education teachers and TOSAs rated the interventions
of increased administrative support, increased length of time spent in teacher preparation
programs, increased professional development opportunities directly related to special
education teachers, increased opportunities to collaborate with general education
colleagues, increased special education teacher salaries, and reduced paperwork
requirements (see Table 30 for details).
Interestingly, for special education teachers, both reduce paperwork requirement
and increase administrator support, as well as redesign the special education teacher
position were perceived as more important than by administrators. (For reduce paperwork
requirement, M = 3.30, SD = 0.78 and M = 3.54, SD = 0.69, for administrators and
104
special education teachers, respectively; t = -2.51, p < .05. For increased administrator
support, M = 3.09, SD = 0.63 and M = 3.29, SD = 0.71, for administrators and special
education teachers, respectively; t = -2.20, p < .05. For redesign special education teacher
position, M = 2.99, SD = 0.83 and M = 3.23, SD = 0.85, for administrators and special
education teachers, respectively; t = -2.19, p < .05.) In summary, when it comes to
interventions, special teachers and TOSAs placed higher importance on options related to
job redesign than administrators did.
By contrast, for administrators, options related to environmental supports, such as
increase opportunities to collaborate with general education colleagues, increase
professional development opportunities directly related to special education teachers, and
increase the length of time spent in teacher preparation programs, were perceived as more
important than by special education teachers and TOSAs. (For increase opportunities to
collaborate with general education colleagues, M = 3.39, SD = 0.70 and M = 2.96, SD =
0.85, for administrators and special education teachers, respectively; t = 3.84, p < .01. For
increase professional development opportunities directly related to special education
teachers, M = 2.95, SD = 0.82 and M = 2.73, SD = 0.84, for administrators and special
education teachers, respectively; t = 1.98, p < .05. For increase the length of time spent in
teacher preparation programs, M = 2.42, SD = 0.72 and M = 2.20, SD = 0.83, for
administrators and special education teachers, respectively; t = 1.98, p < .05). Special
education teachers tended to value interventions targeting at job redesign, while
administrators tended to value interventions targeting at improving environmental
supports.
105
When comparing the results from the three-factor perspective that were
discovered through EFA, administrators and special education teachers and TOSAs
similarly rated the impact of interventions perceived to increase retention rates related to
knowledge, preparation and support, and job redesign.
Summary. In summary, in their qualitative responses, administrators most often
mentioned the impact of increased instruction for possibly increasing special education
teacher retention rates, whereas special education teachers and TOSAs frequently
mentioned the impact of lower caseloads. With respect to ratings of interventions and
primary selection of interventions to potentially increase retention rates, both
administrators and special education teachers and TOSAs rated lower special education
caseloads as having the greatest potential impact and most frequently selected it as the
primary intervention. Lastly, administrators and special education teachers and TOSAs
rated all three EFA factors similarly. Table 34 provides a simplified summary of the
findings for question four and the associated hypothesis based on qualitative responses,
ratings of perceived causes of special education teacher attrition, and primary selection of
perceived causes.
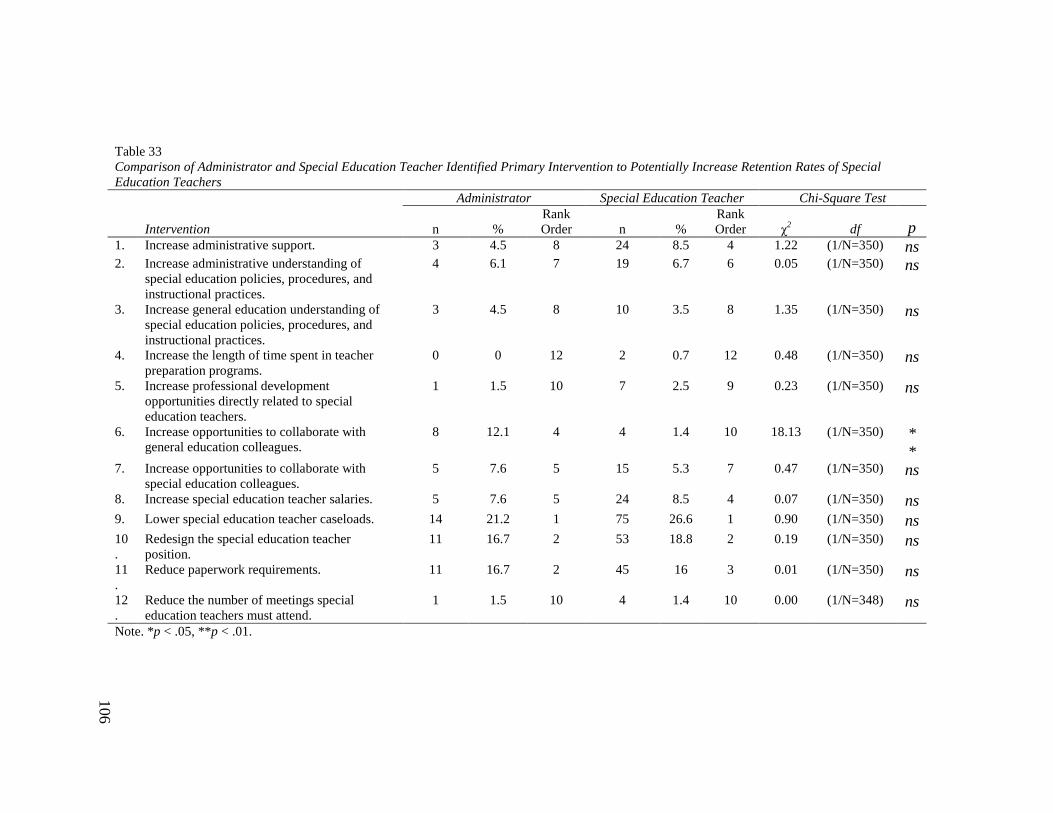
106
Table 33 Comparison of Administrator and Special Education Teacher Identified Primary Intervention to Potentially Increase Retention Rates of Special
Education Teachers Administrator Special Education Teacher Chi-Square Test
Intervention n % Rank Order n %
Rank Order χ
2 df p 1. Increase administrative support. 3 4.5 8 24 8.5 4 1.22 (1/N=350) ns 2. Increase administrative understanding of
special education policies, procedures, and instructional practices.
4 6.1 7 19 6.7 6 0.05 (1/N=350) ns
3. Increase general education understanding of special education policies, procedures, and instructional practices.
3 4.5 8 10 3.5 8 1.35 (1/N=350) ns
4. Increase the length of time spent in teacher preparation programs.
0 0 12 2 0.7 12 0.48 (1/N=350) ns
5. Increase professional development opportunities directly related to special education teachers.
1 1.5 10 7 2.5 9 0.23 (1/N=350) ns
6. Increase opportunities to collaborate with general education colleagues.
8 12.1 4 4 1.4 10 18.13 (1/N=350) **
7. Increase opportunities to collaborate with special education colleagues.
5 7.6 5 15 5.3 7 0.47 (1/N=350) ns
8. Increase special education teacher salaries. 5 7.6 5 24 8.5 4 0.07 (1/N=350) ns 9. Lower special education teacher caseloads. 14 21.2 1 75 26.6 1 0.90 (1/N=350) ns 10.
Redesign the special education teacher position.
11 16.7 2 53 18.8 2 0.19 (1/N=350) ns
11.
Reduce paperwork requirements. 11 16.7 2 45 16 3 0.01 (1/N=350) ns
12.
Reduce the number of meetings special education teachers must attend.
1 1.5 10 4 1.4 10 0.00 (1/N=348) ns
Note. *p < .05, **p < .01.
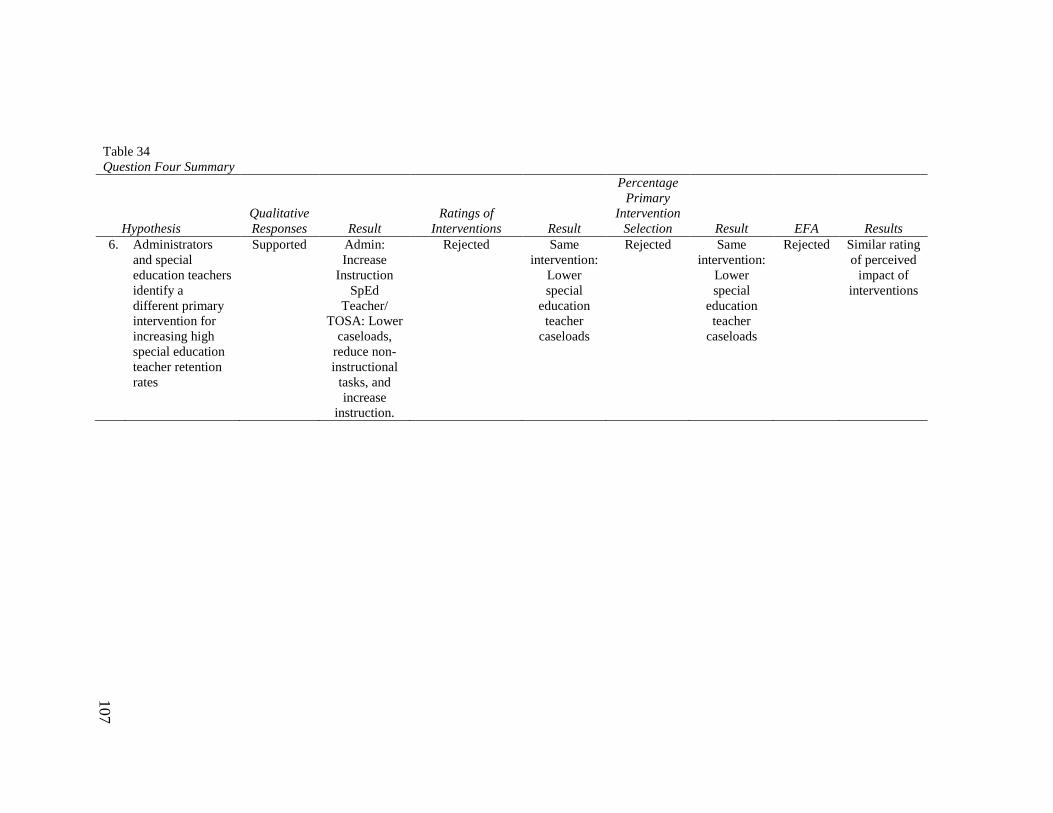
107
Table 34 Question Four Summary
Hypothesis Qualitative Responses Result
Ratings of Interventions Result
Percentage Primary
Intervention Selection Result EFA Results
6. Administrators and special education teachers identify a different primary intervention for increasing high special education teacher retention rates
Supported Admin: Increase
Instruction SpEd
Teacher/ TOSA: Lower
caseloads, reduce non-instructional tasks, and increase
instruction.
Rejected Same intervention:
Lower special
education teacher
caseloads
Rejected Same intervention:
Lower special
education teacher
caseloads
Rejected Similar rating of perceived
impact of interventions
108
Summary of Findings
Based on the analysis of qualitative and quantitative responses, the factors of
caseload and paperwork were commonly identified by both administrators and special
education teachers and TOSAs as being perceived to influence both attrition and retention
rates of special education teachers. Administrators did identify the need for increased
instructional time for special education teachers; however, the impacts of caseload and
paperwork requirements were overwhelmingly endorsed throughout the data.
109
CHAPTER FIVE
DISCUSSION
Structure of Discussion
This chapter reviews key findings of this study; discusses further analyses that
were conducted; details recommendations for special education leaders, school district
leaders, and special education teacher preparation programs; describes limitations of the
study; and makes recommendations for future research. This chapter also includes an
action plan for myself. The discussion is divided into six sections: Summary of Key
Findings, Discussion of Additional Analysis, Recommendations, Limitations of the
Study, My Action Plan, and Researcher’s Summary.
Summary of Key Findings
This study focused on identifying administrators’, special education teachers’, and
TOSAs’ perceptions of the causes of special education teacher attrition and interventions
to increase the retention of special education teachers. This study was also designed to
determine if there was a difference between administrators’, special education teachers’,
and TOSAs’ perceptions of the causes of high attrition rates of special education teachers
and interventions to increase rates of retention. What I discovered was administrators,
special education teachers, and TOSAs, for the most part, perceive the same causes of
attrition and identify the same interventions to increase retention rates: high caseload and
too much paperwork.
Perceived causes of attrition. When rating the impact of perceived causes of
special education teacher attrition, administrators rated high caseloads as the cause that
they perceived as having the greatest impact on attrition rates; whereas, they selected too
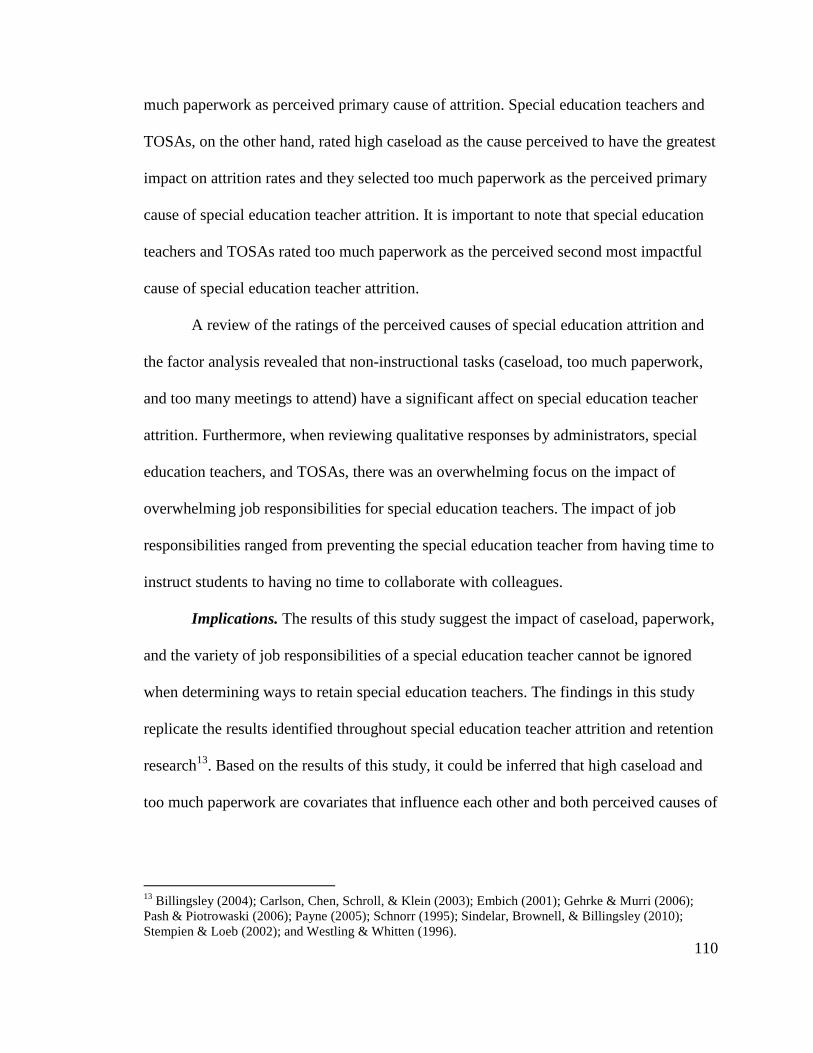
110
much paperwork as perceived primary cause of attrition. Special education teachers and
TOSAs, on the other hand, rated high caseload as the cause perceived to have the greatest
impact on attrition rates and they selected too much paperwork as the perceived primary
cause of special education teacher attrition. It is important to note that special education
teachers and TOSAs rated too much paperwork as the perceived second most impactful
cause of special education teacher attrition.
A review of the ratings of the perceived causes of special education attrition and
the factor analysis revealed that non-instructional tasks (caseload, too much paperwork,
and too many meetings to attend) have a significant affect on special education teacher
attrition. Furthermore, when reviewing qualitative responses by administrators, special
education teachers, and TOSAs, there was an overwhelming focus on the impact of
overwhelming job responsibilities for special education teachers. The impact of job
responsibilities ranged from preventing the special education teacher from having time to
instruct students to having no time to collaborate with colleagues.
Implications. The results of this study suggest the impact of caseload, paperwork,
and the variety of job responsibilities of a special education teacher cannot be ignored
when determining ways to retain special education teachers. The findings in this study
replicate the results identified throughout special education teacher attrition and retention
research13. Based on the results of this study, it could be inferred that high caseload and
too much paperwork are covariates that influence each other and both perceived causes of
13 Billingsley (2004); Carlson, Chen, Schroll, & Klein (2003); Embich (2001); Gehrke & Murri (2006); Pash & Piotrowaski (2006); Payne (2005); Schnorr (1995); Sindelar, Brownell, & Billingsley (2010); Stempien & Loeb (2002); and Westling & Whitten (1996).
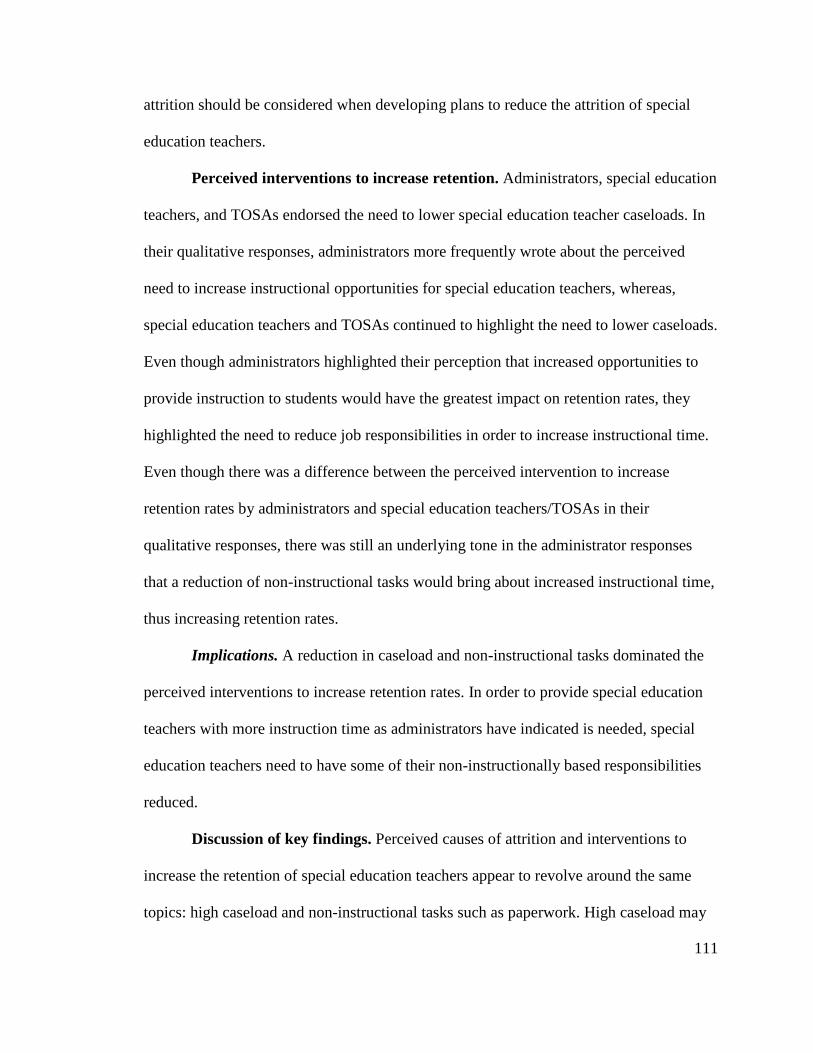
111
attrition should be considered when developing plans to reduce the attrition of special
education teachers.
Perceived interventions to increase retention. Administrators, special education
teachers, and TOSAs endorsed the need to lower special education teacher caseloads. In
their qualitative responses, administrators more frequently wrote about the perceived
need to increase instructional opportunities for special education teachers, whereas,
special education teachers and TOSAs continued to highlight the need to lower caseloads.
Even though administrators highlighted their perception that increased opportunities to
provide instruction to students would have the greatest impact on retention rates, they
highlighted the need to reduce job responsibilities in order to increase instructional time.
Even though there was a difference between the perceived intervention to increase
retention rates by administrators and special education teachers/TOSAs in their
qualitative responses, there was still an underlying tone in the administrator responses
that a reduction of non-instructional tasks would bring about increased instructional time,
thus increasing retention rates.
Implications. A reduction in caseload and non-instructional tasks dominated the
perceived interventions to increase retention rates. In order to provide special education
teachers with more instruction time as administrators have indicated is needed, special
education teachers need to have some of their non-instructionally based responsibilities
reduced.
Discussion of key findings. Perceived causes of attrition and interventions to
increase the retention of special education teachers appear to revolve around the same
topics: high caseload and non-instructional tasks such as paperwork. High caseload may
112
cause higher levels of non-instructional tasks, resulting in less time for instruction and
other desirable education activities, leading to high rates of attrition by special education
teachers. Based on the results of this study, it can be inferred that administrators, special
education teachers, and TOSAs believe that if caseloads are reduced (resulting in fewer
non-instructional tasks and more professional activities), special education teachers will
be more likely to remain in the teaching profession.
When considering the caseload and paperwork responsibilities of special
education teachers, school districts often place an emphasis on paperwork completion and
compliance. This study highlighted the desire of special education teachers to spend more
time instructing students; however, looking deeper into the professional development
opportunities for special education teachers may reveal a single focus of IEP compliance.
In my experience as a Administrator of Student Services, the majority of professional
development opportunities for special education teachers involve calendar activities for
meetings and training on how to write compliant IEPs that meet state standards. This
emphasis on paperwork compliance may be sending the message that paperwork is more
important then implementing high leverage instructional strategies for students with
disabilities. This may only increase special education teacher frustration with non-
instructional responsibilities.
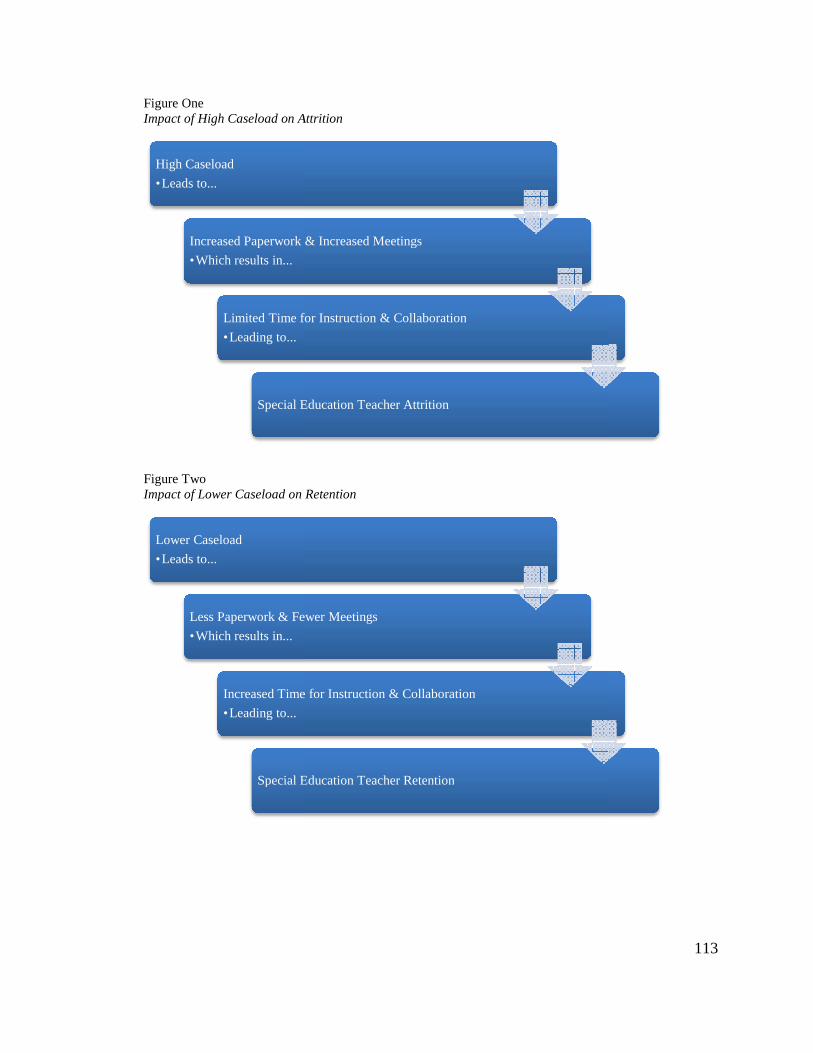
Figure One Impact of High Caseload on Attrition
Figure Two Impact of Lower Caseload on Retention
Lower Caseload
•Leads to...
Less Paperwork & Fewer Meetings
•Which results in...
Increased Time for Instruction & Collaboration
•Leading to...
Special Education Teacher Retention
High Caseload
•Leads to...
Increased Paperwork & Increased Meetings
•Which results in...
Limited Time for Instruction & Collaboration
•Leading to...
Special Education Teacher Attrition
Impact of High Caseload on Attrition
Impact of Lower Caseload on Retention
Less Paperwork & Fewer Meetings
Increased Time for Instruction & Collaboration
Special Education Teacher Retention
Increased Paperwork & Increased Meetings
Limited Time for Instruction & Collaboration
Special Education Teacher Attrition
113
114
Discussion of Additional Analysis
The surveys involved in this study collected a variety of demographic information
about the respondents. I decided to complete some additional analyses based on
demographic characteristics to determine if there were any trends related to position
types.
Comparison of TOSA and Non-TOSA responses. As a result of sample size
limitation I was unable to compare responses of specific roles of special education
teachers (see Appendix F), so I grouped Teachers on Special Assignment (TOSAs)
versus all Special Education Teachers to determine if there was a significant difference in
how each group:
• rated the impact of identified causes of special education teacher attrition, • identified the primary cause of special education teacher attrition, • rated the impact of identified interventions to increase the retention of special
education teacher attrition, and • identified the primary intervention to increase special education teacher retention.
There was only one statistically significant difference between the ratings
assigned by TOSAs and Non-TOSAs for the perceived cause of high special education
teacher attrition (see Appendix F for details). TOSAs assigned a higher rating to the
impact of a lack of university preparation (M = 2.63) than their non-TOSA colleagues (M
= 2.17). There was only one statistically significant difference between the ratings
assigned by TOSAs and Non-TOSAs for interventions to increase retention rates. TOSAs
assigned a higher rating to increased time in university preparation programs (M = 2.58)
than their non-TOSA colleagues (M = 2.17).
115
Two sets of rankings for TOSAs and non-TOSAs respectively were generated on
the frequency of each cause chosen as the perceived primary cause and each intervention
chosen as the perceived primary intervention. Since the sample size of TOSAs was too
small (n = 24), I was unable to complete a statistically significant analysis of identified
primary causes of special education teacher attrition and primary interventions to increase
special education teacher retention with respect to TOSAs versus non-TOSAs.
Discussion. The difference in rating the lack of university preparation could have
resulted from the role of the TOSA, who may work as a coach for special teachers, and as
a result be more aware of the limitations of their staff. As a result of this knowledge of
teacher limitation, the TOSAs may blame the university preparation program for not
better preparing the teacher in the specific area of concern because the TOSA has not
identified another cause of the teacher’s lack of performance.
In my experience, TOSAs often assist new special education teachers with
understanding and completing required paperwork. When considering the identified
impact of high caseload and paperwork responsibilities on special education teacher
attrition, further research should be conducted on how much time special education
teachers spend in university preparation programs learning paperwork requirements, use
of forms, and organization skills.
Comparison of district administrator and building administrator responses.
As a result of sample size limitation of administrators (see Appendix G), I combined the
number of role groups specified in the original questionnaire into two administrator
groups—district administrators versus building administrators—to determine if there was
a significant difference in how each group:
116
• rated the impact of identified causes of special education teacher attrition, • identified the primary cause of special education teacher attrition, • rated the impact of identified interventions to increase the retention of special
education teacher attrition, and identified the primary intervention to increase special education teacher retention.
It was determined that there was no significant statistical difference between how
district administrators and building administrators rated perceived causes of attrition and
interventions to increase special education teacher retention rates (see Appendix G for
details).
Discussion. Although the sample size was limited in scope, it was concluded that
district and building level administrators similarly rate the impact of perceived causes of
attrition and perceived interventions to increase retention rates. This data would suggest
that district level and building level administrators have an equal perception of the impact
of various causes and interventions on attrition and retention rates of special education
teachers.
Years remaining in the profession. As a result of small sample size (see
Appendix H), I grouped special education teachers and TOSAs who identified themselves
as remaining in the profession for three or fewer years versus teachers who identified
themselves as remaining in the profession for four or more years to determine if there
was a significant difference in how each group:
• rated the impact of identified causes of special education teacher attrition, • identified the primary cause of special education teacher attrition, • rated the impact of identified interventions to increase the retention of special
education teacher attrition, and • identified the primary intervention to increase special education teacher retention.
Ratings of the perceived impact of causes of teacher attrition resulted in three
statistically significant differences between teachers who identified themselves as
117
remaining in the profession for three or fewer years versus teachers who identified
themselves as remaining in the profession for four or more years (see Appendix H for
details). Teachers who identified themselves as remaining in the profession for three or
fewer years rated too many meetings (M = 3.34) as having a perceived higher impact on
teacher attrition than teachers who identify themselves as remaining in the profession for
four or more years (M = 3.04). Teachers who identified themselves as remaining in the
profession for four or more years rated high caseload (M = 3.76) and role dissonance (M
= 3.00) as having a perceived higher impact on special education teacher attrition than
teachers who identified themselves as remaining the profession for three years or fewer
(M = 3.53 and M = 2.69).
Ratings of the perceived potential impact of interventions on retention rates
resulted in two statistically significant differences between teachers who identified
themselves as remaining in the profession for three or fewer years versus teachers who
identified themselves as remaining in the profession for four or more years (see Appendix
H). Teachers who identified themselves as remaining in the profession for three or fewer
years rated redesigning the special education teacher position (M = 3.54) and reducing
the number of meetings the special education teacher has to attend (M = 3.41) as having a
perceived higher impact on increasing retention rates than teachers who identified
themselves as remaining the profession for four or more years (M = 3.14 and M = 3.07).
Discussion. It can be concluded that the amount of meetings required for new
special education teachers has an impact on their decision to remain in the position. On
the other hand, for more experienced special education teachers, high caseload and role
dissonance have a greater impact on attrition. This difference could be attributed to the
118
fact that experienced special education teachers have come to the understanding that the
number of meetings they are required to attend is the direct result of a high caseload and
the only way to reduce meetings is to reduce the caseload.
Economic impact. A crosstab analysis was completed to determine if
administrators have experienced a reduction in special education teacher attrition in their
school/district and if the economic downturn has affected special education teachers’
decisions to remain in the profession. The analysis revealed that 53.7% of administrators
reported that the economic downturn has not resulted in a reduction in teacher attrition
rates and 53.8% of special education teachers responded that the economic downturn has
not influenced their decision to remain in the special education profession (see Appendix
I for more details).
Discussion. Based on the review on the results of this study, it could be concluded
that the economic downturn has had little overall impact on teacher attrition and a special
education teacher’s decision to remain in the profession. While difficult economic
conditions may result in improved retention rates, it appears that the economic downturn
has little impact on attrition and retention rates for special education teachers.
Recommendations
Recommendations for special education leaders. Special education leaders
need to review the caseloads of their special education teachers and all the
responsibilities assigned to them by the district and the school. Based on the results of
this review, special education leaders should identify ways to reduce caseload and/or
minimize non-instructional tasks, such as paperwork. Special education leaders need to
compare the general education teacher staffing formula with their special education
119
staffing formula to determine if there is equitable staffing. As school budgets get tighter,
special education teacher caseloads grow because they are not classroom teachers. Based
on this study, this additional workload is having a negative affect on special education
teachers’ desire to remain in the profession, which in the long run will end up costing the
district more in the lack of student progress and funds required to train new staff.
In the event that there are not additional financial resources to lower caseloads
and reduce non-instructional tasks, special education leaders should review training
opportunities to better assist special education teachers with the organization of their
responsibilities. Special education leaders should work in conjunction with other district
administrators, such as school principals, to determine if there are redundancies in work
expectations or if some duties could be reassigned to other staff members. Special
education leaders should also consider providing targeted professional development
opportunities to special education teachers that directly relate to caseload and
organizational difficulties; however, they may also want to make sure that there are equal
numbers of IEP compliance trainings and trainings related to instructional practice.
Recommendations for district leaders. District leaders need to make an effort to
better understand the work of the special education teachers. Observing and interviewing
special education teachers regarding their workload may provide some greater insight
into the daily responsibilities of the special education teacher. District leaders should
complete a comparative analysis of the workload expectations of general education
teachers and special education teachers. In my experience as a special education teacher
and administrator, I have witnessed that district administrators often focus on the number
of students served by the teacher, not the responsibilities assigned to the position. An in-
120
depth analysis of job responsibilities might reveal that although special education
teachers are not teaching in a classroom for a full day, they do have myriad
responsibilities that far exceed the instructional day.
Recommendations for teacher preparation programs. Teacher preparation
programs need to identify ways to support new teachers with managing the various
responsibilities of the special education teacher. Program instructors should consider
shadowing a variety of special education teachers to identify the range of responsibilities
assigned to them. Based on this field study, the teacher preparation program could be
designed to specifically address the complexities of the special education position
including time management, meeting facilitation, and paperwork management.
Limitations of the Study
Limitations to validity, reliability, and objectiv ity. This study included a small
sample size, which could impact the reliability of the study; however, the results of the
study were similar to those found by other educational researchers. Another limitation of
this study was my limited ability to elicit survey respondents. The respondents in the
study were all anonymous and in some cases I had to rely on a district administrator to
disseminate the survey because I was unable to obtain a mailing list from school district
staff or from the district website. I am not certain that all administrators, special
education teachers, and TOSAs in the Portland metro area received the survey. The
inability to follow up with participants about their responses and complete a member
checking process to clarify responses was another limitation of this study. The survey
was anonymous in an effort to increase participation in the study while getting accurate
121
responses from the participants; however, I was unable to speak with respondents to
determine if my conclusions accurately described their responses.
Limitations to trustworthiness of qualitative data. Two individuals, an
impartial evaluator and myself, conducted the coding of the qualitative data. If additional
raters had been included, an increased number of themes may have been identified and/or
the responses may have been coded in a different manner. However, the impartial
evaluator and I coded and recoded the responses, finally developing a common coding for
the responses.
Recommendations for Future Research
Further research needs to be completed on what the ideal caseload is, the
development of a caseload impact rating scale, and what is a reasonable amount of
paperwork for a special education teacher. In the qualitative responses there was mention
of the need to measure caseloads differently for resource room teachers than for self-
contained special education classroom teachers, so further research should be conducted
on the impact of caseload on special education teachers who provide small group
instruction versus special education teachers who teach a self-contained special education
class. In the responses there was also an understanding of the need for paperwork, so
research about the amount of paperwork that is reasonable and manageable given the
other responsibilities of the special education teacher could help guide district staffing
decisions.
More in depth research should be conducted on the impact of a combination of
perceived causes of attrition and the implementation of perceived interventions to
increase retention rates. The EFAs that were conducted in this study revealed correlations
122
between factors. Researchers will want to explore whether or not it requires a
combination of interventions or the implementation of a single intervention to increase
retention rates.
My Action Plan
The financial reality of schools and special education in particular is not positive.
With the recent sequestration of IDEA funds and increased cost of salaries and benefits,
there is even less money available to increase staffing in an effort to reduce high
caseloads. Even with the current financial state of my department, I am looking for
additional opportunities to better support special education teachers. Each summer our
department plans to host a summer institute for new and veteran special education
teachers who require professional development around classroom management and
organizational skills. I am going to continue my commitment to funding a special
education mentor to support new and veteran teachers with managing the multitude of
responsibilities assigned to them.
I am striving to extend invitations to union leaders, district level leaders, and
school board members to provide more insight into the work of the special education
teachers in the district. If there is ever going to be an increase in the financial support
allocated for special education at the district level, there needs to be a stronger awareness
of the needs of the students receiving special education services and the responsibilities
of the staff in the department. Finally, it is my plan to work collaboratively with local
universities to develop a special education leadership cohort to assist special education
teachers and future and current administrators with having a better understanding of
123
special education policies and procedures at a district level versus just the singular
building level.
Researcher’s Summary
In summary, this study revealed to me that administrators, special education
teachers, and TOSAs all recognize the impact of high caseload and the resulting
paperwork and meeting responsibilities on the attrition of special education teachers. This
study has shown that if school districts do not focus on the impact of high caseload and
high amounts of non-instructional tasks, districts will continue to experience the cycle of
special education teacher turnover.
124
REFERENCES Alexander, P. (2003). The development of expertise: The journey from acclimation to
proficiency. Educational Researcher, 32(8), 10-14.
Bateson, M.C. (1994). Learning as coming home. In Peripheral visions: Learning
along the way (pp. 195-213). New York, NY: HarperCollins Publishers, Inc.
Billingsley, B. (2003, April). Special education teacher retention and attrition: A
critical analysis of the research literature. Retrieved from
http://www.google.com/url?sa=t&rct=j&q=&esrc=s&frm=1&source=web&cd=1
&ved=0CCkQFjAA&url=http%3A%2F%2Fwww.tr.wou.edu%2Frrp%2Fadmin%
2FRS-2.pdf&ei=1AFET-H2JqTKiALs7aHdDg&usg=AFQiCNT
wRaxafG0qYyBk1 trAzJgrsk_KVg&sig2=47uxwKEBJWFI_UJO7sn1iQ
Billingsley, B. (2004). Special education teacher retention and attrition: A critical
analysis of the research literature. The Journal of Special Education, 38(1), 39-55.
Billingsley, B., Carlson, E., & Klein, S. (2004). The working conditions and induction
support of early career special educators. Exceptional Children, 70(3), 333-347.
Boe, E.E., Barkanic, G., Lowe, C.S. (1999). Retention and attrition of teachers at the
school level: National trends and predictors. Retrieved from
http://www.eric.ed.gov/ERICWebPortal/contentdelivery/servlet/ERICServlet?acc
no=ED436485
Boe, E.E.; Bobbitt, S.A.; Cook, L.H.; Whitener, S.D.; Weber, L. (1997). Why didst thou
go? Predictors of retention, transfer, and attrition of special and general education
teachers from a national perspective. The Journal of Special Education, 30, 390-
125
411. Retrieved from
http://vnweb.hwwilsonweb.com.proxy.lib.edu/hww/results_single_ftPES.jhtml
Bordens, K.S. & Abbott, B.B. (2005). Research design and methods: A process
approach (6th ed.). New York, NY: McGraw-Hill Companies, Inc.
Brownell, M.T, Miller, D.M. & Smith, S.W. (1999). Factors that predict teachers
staying in, leaving, or transferring from the special education classroom.
Exceptional Children, 65(2), 201-281.
Carifio J. (1976). Assigning students to career education programs by preference:
scaling preference data for program assignments. Career Education Quarterly,
1(1), 7–26.
Carifio J. (1978). Measuring vocational preferences: ranking versus categorical rating
procedures. Career Education Quarterly, 3(1), 34–66.
Carifio, J. & Perla, R. (2008). Resolving the 50-year debate around using and
misusing Likert scales. Medical Education, 42, 1150-1152.
Carlson, E., Chen, L., Schroll, K., & Klein, S. (2003, March 24). SPeNSE: Study of
personnel needs in special Education: Final report of the paperwork substudy.
Retrieved from http://spense.education.ufl.edu/Results.html
Christie, K. (2008). Budgeting on shifting sand. Phi Delta Kappa, 89(10), 709-710.
Confederation of School Administrators. (n.d.). Education funding graphs and
information available. Retrieved from
http://www.cosa.k12.or.us/news/educationfundinggraphsandinformationavailable-
2.html
Cole, M. & Wertsch, J.V. (1996). Beyond the individual-social antimony in discussions
126
of Piaget and Vygotsky. Human Development, 39, 250-256.
Connelly, V. & Graham, S. (2009). Student teaching and teacher attrition in special
education. Teacher Education and Special Education, 32(2), 257-269.
Creswell, J. W. (2005). Educational research: Planning, conducting, and evaluating
quantitative and qualitative research (2nd ed.). Upper Saddle River, NJ: Pearson
Education, Inc.
Cross, L.H. & Billingsley, B.S. (1994). Testing a model of special educators’ intent to
stay in teaching. Exceptional Children, 60( 5), 411-421.
Davis, M. (2008). Financial crisis now striking home for districts. Education Weekly,
28(8), 1 & 20.
Driscoll, D.L., Appiah-Yeboah, A., Salib, P. & Rupert, D.J. (2007). Merging qualitative
and quantitative data in mixed methods research: How to and why not. Ecological
and Environmental Anthropology, 3 (1), 19-28.
ECONorthwest Center for Educational Policy Research. (2005, January). The condition
of K-12 education in Oregon. Eugene, OR: ECONorthwest. Retrieved May 1,
2007 from http://www.econw.com/consulting/subtopics?topic=government
&subtopic=education.
Editorial Projects in Education Research Center. (2012a, January 12). Education in a
competitive world. Education Week. Retrieved from
http://www.edweek.org.go.gc12
Editorial Projects in Education Research Center. (2012b). Oregon: The global challenge.
Education in a competitive world. Education Week. Retrieved from
http://www.edweek.org.go.gc12shr.
127
Embich, J.L. (2001). The relationship of secondary special education teachers’ roles and
factors that lead to professional burnout. Teacher education and special
education: The journal of the teacher education division of the council for
exceptional children, 24(1), 58-69.
Fraenkel, J.R. & Wallen, N.E. (1996). How to design and evaluate research in
education (3rd ed.). New York: McGraw-Hill, Inc.
Gehrke, R.S. & Murri, N. (2006). Beginning special educator’s intent to stay in special
education: Why they like it here. Teacher Education and Special Education,
29(3), 179-190.
George, N.L. & George, M.P. (1995). To leave or to stay? An exploratory study of
teachers of students with emotional and behavioral disorders. Remedial &
Special Education, 16(4), 227-236. Retrieved from
http://stats.lib.ppdx.edu/proxy.php?
Gersten, R, Keating, T., Yovanoff, P., & Harniss, M.K. (2001). Working in special
education: Factors that enhance special educator’s intent to stay. Council for
Exceptional Children, 67 (4), 549-567.
Greenlee, B. & Brown, J.J. (2009). Retaining teachers in challenging schools. Education,
130 (1), 96-109.
Guarino, C.M., Santibanez, L., & Daley, G.A. (2006). Teacher recruitment and
retention: A review of the recent empirical literature. Review of Educational
Research, 76 (2), 173-208.
Harlow, L.L. (2005). The essence of multivariate thinking: Basic themes and methods.
Mahwah, NJ: Lawrence Erlbaum Associates, Inc.
128
Hoffman, K.B. (2009). Cutbacks stir debate over funding system for Michigan
schools. Education Weekly, 9 (11), 16.
Individuals with Disabilities Education Improvement Act of 2004, Pub. L. no. 108-446,
118 Stat 2647 (2004).
Jain, P.M. & Shandliya, V.K. (2013). A survey paper on comparative study between
Principal Component Analysis (PCA) and Exploratory Factor Analysis (EFA).
International Journal of Computer Science and Applications, 6 (2), 373-375.
Jamieson S. (2004). Likert scales: how to (ab)use them. Medical Education, 38 (volume),
1212–1218.
Kaff, M.S. (2004). Multitasking is multitaxing: Why special educators are leaving the
field. Preventing School Failure, 48(2), 10-17.
Kliewer, C., Biklen, D., & Kasa-Hendrickson, C. (2006). Who may be literate? Disability
and resistance to the cultural denial of competence. American Educational
Research Journal, 43(2), 163-192.
Kuzon, W. M., Urbancheck, M. G., & McCabe, S. (1996). The seven deadly sins of
statistical analysis. Annals of Plastic Surgery, 37, 265–272.
McManus, M. E. & Kauffman, J.M. (1991). Working conditions of teachers of students
with behavioral disorders. Behavioral Disorders, 16(4), 247-259.
Mitchell, A. & Arnold, M. (2004). Behavior management skills as predictors of
retention among south Texas special educators. Journal of Instructional
Psychology. 31(3), 214-219.
No Child Left Behind Act of 2001, Pub. L. no. 107-110, 115 Stat 1425 (2001).
Norman, G. (2010). Likert scales, levels of measurement and the ‘‘laws’’
129
of statistics. Advances in Health Science Education, 15, 625–632.
Olivarez, M. M., & Arnold, M. (2006). Personal and demographic characteristics of
retained teachers of special education. Education, 126(4), 702-710.
Otto, S. J. & Arnold, M., (2005). A study of experiences special education teachers’
perceptions of administrative support. College Student Journal, 39(2), 253-259.
Payne, R. (2005). Special education teacher shortages: Barriers of lack of preparation.
The International Journal of Special Education, 20(1), 88-91.
Pell G. (2005). Uses and misuses of Likert scales. Medical Education, 39, 97.
Plash, S. & Piotrowski, C. (2006). Retention issues: A study of Alabama special
education. Education, 127(1), 125-128.
Scherer, M. (1999). A better beginning: Supporting and mentoring new teachers.
Alexandria, VA: Association for Supervision and Curriculum Development.
Schlichte, J., Yssel, N. & Merbler, J. (2005). Pathways to burnout: Case studies in teacher
isolation and alienation. Preventing School Failure, 50(1), 35-40.
Schnorr, J.M. (1995). Teacher retention: A CSPD analysis and planning model. Teacher
Education and Special Education: The Journal of the Teacher Education Division
of the Council for Exceptional Children, 18(1), 22-38.
Scholastic and the Bill and Melinda Gates Foundation. (2010). Primary sources:
America’s teachers on America’s schools: A project of Scholastic and the Bill and
Melinda Gates Foundation. Retrieved from
http://www.scholastic.com/primarysources/download.asp
Sfard, A. (1998). On two metaphors for learning and the dangers of choosing just one.
Educational Researcher, 27(2), 4-13.
130
Shadish, W. R., Cook, T. D., & Campbell, D. T. (2002). Experimental and quasi-
experimental design for generalized causal inference. Boston: Houghton-Mifflin,
(pp. 505-513).
Sindelar, P.T., Brownell, M.T., & Billingsley, B. (2010). Special education teacher
education research: Current status and future directions. Teacher Education and
Special Education, 33(1), 8-24.
Smith, T., Polloway, E.A, Patton, J.R., & Beyer, J.F. (2008). Individuals with intellectual
and developmental disabilities in the criminal justice system and implications for
transition planning. Education and Training in Developmental Disabilities, 43(4),
421-430.
Strong, M. (2005). Mentoring new teachers to increase retention, Issue no. 05-01.
Retrieved from http://www.newteachercenter.org/pdfs/NTCResearchBrief.05-
01.pdf
Strough, L.M. & Palmer, D.J. (2003). Special thinking in special settings: A qualitative
study of expert special educators. Journal of Special Education, 23(5), 206-222.
Struck, K.O. & Zeehandelaar, D. (2011). Differentiated compensation: How California
school districts use economic incentives to target teachers. Journal of School
Finance, 36(3), 268-293.
Stempien, L. & Loeb, R. (2002). Differences in job satisfaction between general
education and special education teachers: Implications for retention. Remedial
and Special Education, 23(5), 259-267.
Stevens S. (1946). On the theory of scales of measurement. Science. 103(67), 668–90.
Stevens S. (1951). Handbook of experimental psychology. New York: John Wiley &
131
Sons
Tennant, M. & Pogson, P. (1995). Learning and change in the adult years: A
developmental perspective. San Francisco: Jossey-Bass, (pp. 67-98).
The Council for Exceptional Children. (2000). Report addresses problems in special
education. The Exceptional Parent, 30(9), 67-70. Retrieved from
http://stats.lib.pdx.edu/proxy.php?
U.S. Department of Education, Office of Planning, Evaluation and Policy Development,
ESEA Blueprint for Reform, Washington, D.C., 2010.
Watlington, E., Shockley, R., Guglielmino, P., & Felsher, R. (2010). The high cost of
leaving: An analysis of the cost of teacher turnover. Journal of Education
Finance, 36(1), 22-37.
Westling, D.L. & Whitten, T.M. (1996). Rural special education teachers’ plans to
continue or leave their teaching positions. Exceptional Children, 62(4), 319-335.
Whitaker, S.D. (2000). Mentoring beginning special education teachers and the
relationship to attrition. Exceptional Children, 66(4), 546-566.
Woods A.M. & Weasmer, J. (2004). Maintaining job satisfaction: Engaging
professionals as active participants. The Clearing House, 77(3), 118-121.
.

132
APPENDIX A
EMAIL LIST CORRESPONDENCE
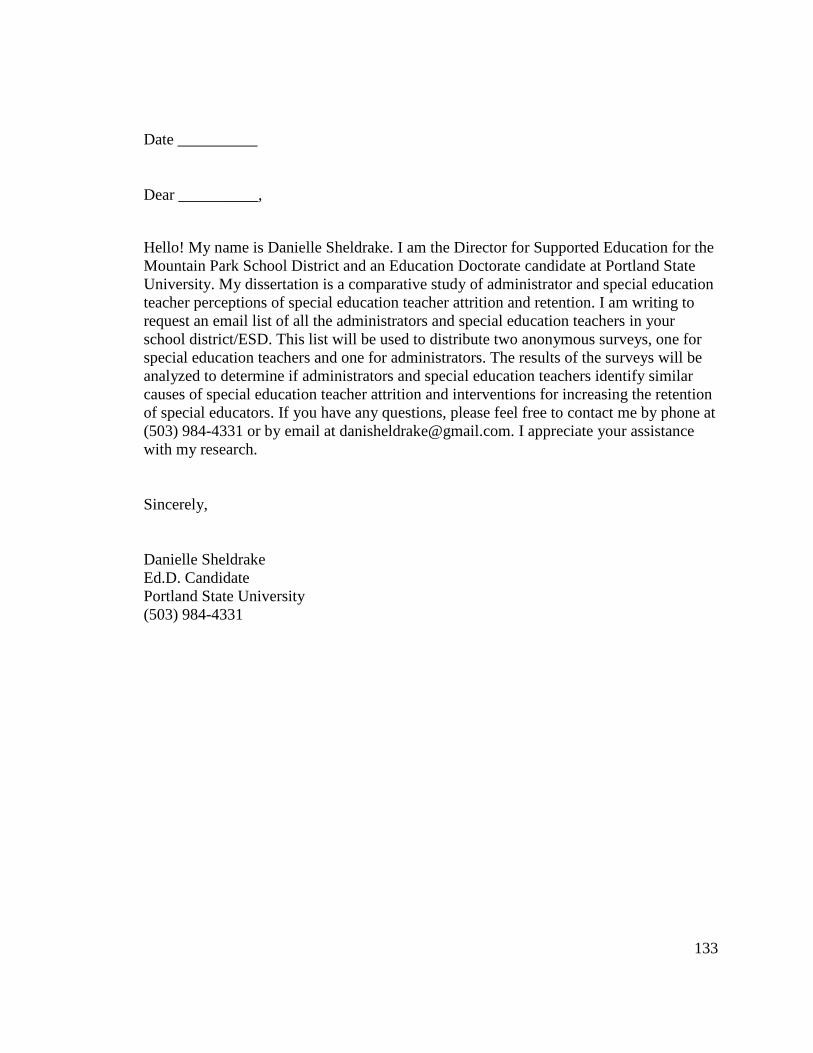
133
Date __________
Dear __________,
Hello! My name is Danielle Sheldrake. I am the Director for Supported Education for the Mountain Park School District and an Education Doctorate candidate at Portland State University. My dissertation is a comparative study of administrator and special education teacher perceptions of special education teacher attrition and retention. I am writing to request an email list of all the administrators and special education teachers in your school district/ESD. This list will be used to distribute two anonymous surveys, one for special education teachers and one for administrators. The results of the surveys will be analyzed to determine if administrators and special education teachers identify similar causes of special education teacher attrition and interventions for increasing the retention of special educators. If you have any questions, please feel free to contact me by phone at (503) 984-4331 or by email at [email protected]. I appreciate your assistance with my research. Sincerely, Danielle Sheldrake Ed.D. Candidate Portland State University (503) 984-4331

134
APPENDIX B
ADMINISTRATOR SURVEY REQUEST EMAIL
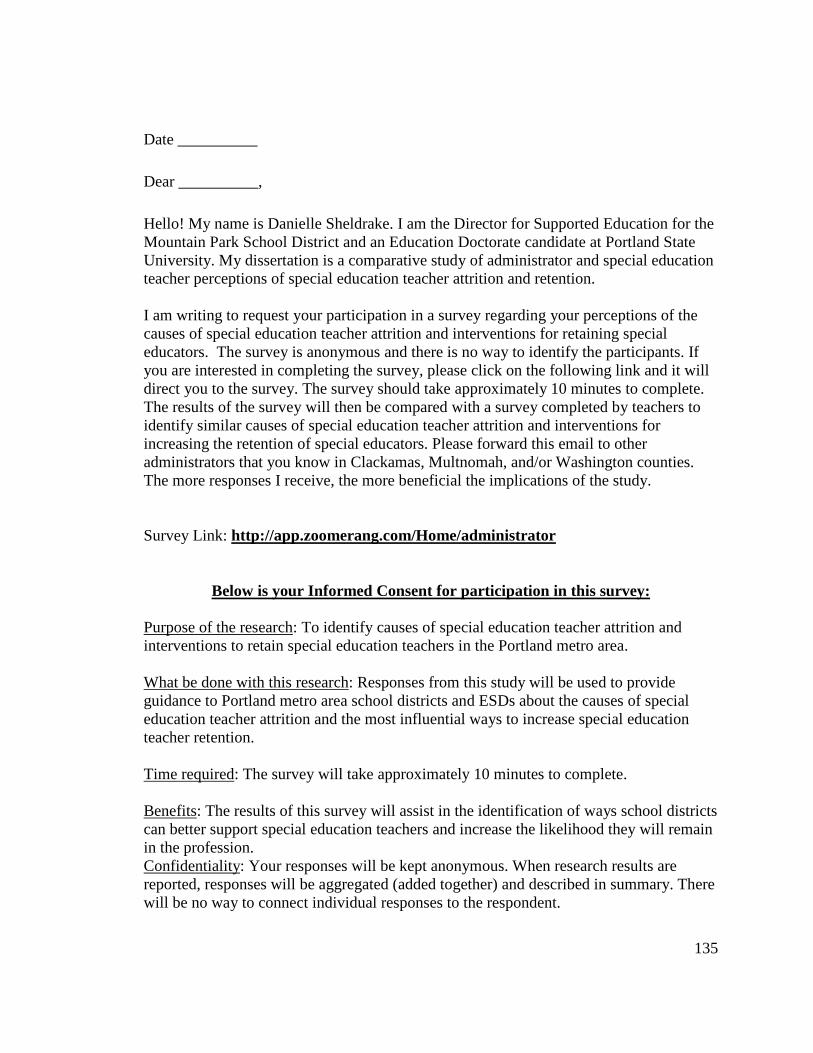
135
Date __________ Dear __________, Hello! My name is Danielle Sheldrake. I am the Director for Supported Education for the Mountain Park School District and an Education Doctorate candidate at Portland State University. My dissertation is a comparative study of administrator and special education teacher perceptions of special education teacher attrition and retention. I am writing to request your participation in a survey regarding your perceptions of the causes of special education teacher attrition and interventions for retaining special educators. The survey is anonymous and there is no way to identify the participants. If you are interested in completing the survey, please click on the following link and it will direct you to the survey. The survey should take approximately 10 minutes to complete. The results of the survey will then be compared with a survey completed by teachers to identify similar causes of special education teacher attrition and interventions for increasing the retention of special educators. Please forward this email to other administrators that you know in Clackamas, Multnomah, and/or Washington counties. The more responses I receive, the more beneficial the implications of the study. Survey Link: http://app.zoomerang.com/Home/administrator
Below is your Informed Consent for participation in this survey: Purpose of the research: To identify causes of special education teacher attrition and interventions to retain special education teachers in the Portland metro area. What be done with this research: Responses from this study will be used to provide guidance to Portland metro area school districts and ESDs about the causes of special education teacher attrition and the most influential ways to increase special education teacher retention. Time required: The survey will take approximately 10 minutes to complete. Benefits: The results of this survey will assist in the identification of ways school districts can better support special education teachers and increase the likelihood they will remain in the profession. Confidentiality: Your responses will be kept anonymous. When research results are reported, responses will be aggregated (added together) and described in summary. There will be no way to connect individual responses to the respondent.
136
Participation and Withdrawal: Your participation is completely voluntary, and you may quit at any time without penalty. To Contact the Researcher: If you have questions or concerns about this research, please contact: Danielle Sheldrake; Phone: (503) 984-4331; Email: [email protected]. You may also contact the faculty member supervising this work: Amy Petti, Instructor Graduate School of Education; Portland State University; Phone: (503) 725-3200; Email: [email protected]. Whom to contact about your rights in this research, for questions, concerns, suggestions, or complaints that are not being addressed by the researcher, or research-related harm: HRRSC, Research and Strategic Partnerships (RSP), Portland State University, PO Box 751, Portland, OR 97207-0751, (503) 725-4288, [email protected]. If you have any questions, please feel free to contact me by phone at (503) 984-4331 or by email at [email protected]. I appreciate your assistance with my research. Sincerely, Danielle Sheldrake Ed.D. Candidate Portland State University (503) 984-4331

137
APPENDIX C
SPECIAL EDUCATION TEACHER/TEACHER ON SPECIAL ASSIGNMENT (TOSA) SURVEY REQUEST EMAIL
138
Date __________ Dear __________, Hello! My name is Danielle Sheldrake. I am the Director for Supported Education for the Mountain Park School District and an Education Doctorate candidate at Portland State University. My dissertation is a comparative study of administrator and special education teacher perceptions of special education teacher attrition and retention. I am writing to request your participation in a survey regarding your perceptions of the causes of special education teacher attrition and interventions for retaining special educators. The survey is anonymous and there is no way to identify the participants. If you are interested in completing the survey, please click on the following link and it will direct you to the survey. The survey should take approximately 10 minutes to complete. The results of the survey will then be compared with a survey completed by administrators to identify similar causes of special education teacher attrition and interventions for increasing the retention of special educators. Please forward this email to other special education teachers that you know in Clackamas, Multnomah, and/or Washington counties. The more responses I receive, the more beneficial the implications of the study. Survey Link: http://app.zoomerang.com/Home/specialeducationteacher
Below is your Informed Consent for participation in this survey: Purpose of the research: To identify causes of special education teacher attrition and interventions to retain special education teachers in the Portland metro area. What be done with this research: Responses from this study will be used to provide guidance to Portland metro area school districts and ESDs about the causes of special education teacher attrition and the most influential ways to increase special education teacher retention. Time required: The survey will take approximately 10 minutes to complete. Benefits: The results of this survey will assist in the identification of ways school districts can better support special education teachers and increase the likelihood they will remain in the profession. Confidentiality: Your responses will be kept anonymous. When research results are reported, responses will be aggregated (added together) and described in summary. There will be no way to connect individual responses to the respondent.
139
Participation and Withdrawal: Your participation is completely voluntary, and you may quit at any time without penalty. To Contact the Researcher: If you have questions or concerns about this research, please contact: Danielle Sheldrake; Phone: (503) 984-4331; Email: [email protected]. You may also contact the faculty member supervising this work: Amy Petti, Instructor Graduate School of Education; Portland State University; Phone: (503) 725-3200; Email: [email protected]. Whom to contact about your rights in this research, for questions, concerns, suggestions, or complaints that are not being addressed by the researcher, or research-related harm: HRRSC, Research and Strategic Partnerships (RSP), Portland State University, PO Box 751, Portland, OR 97207-0751, (503) 725-4288, [email protected]. If you have any questions please feel free to contact me by phone at (503) 984-4331 or by email at [email protected]. I appreciate your assistance with my research. Sincerely, Danielle Sheldrake Ed.D. Candidate Portland State University (503) 984-4331

140
APPENDIX D
ADMINISTRATOR SURVEY
Page 1 - Heading
Introduction: Informed Consent
Welcome to My Survey! Please read the below Informed Consent for this survey. Purpose of the research: To identify causes of special education teacher attrition and interventions to retain special education teachers in the Portland metro What will be done with this research: Responses from this study will be used to provide guidance to Portland metro area school districts and ESDs about the causes of special education teacher attrition and the most influential ways to increase teacher retention. Time required: The survey will take approximately 10 minutes to complete. Benefits: The results of this survey will assist in the identification of ways school districts can better support special education teachers ain the profession. Confidentiality: Your responses will be kept anonymous. When research results are reported, responses will be aggregated (added together) and described in summary. There will be no way to connect individual responses to the respondent. Participation and Withdrawal: Your participation is completely voluntary, and you may quit at any time without penalty. To Contact the Researcher: If you have questions or concerns about this research, please contact: Danielle Sheldrake; Phone: (503) 984 You may also contact the faculty member supervising this work: Amy Petti, Instructor Graduate School of Education; Portland State University; Phone: (503) [email protected]. Whom to contact about your rights in this research, for questions, concerns, suggestions, or complaints that are not being addressed by the researcher, or researchHRRSC, Research and Strategic Partnerships (RSP), Portland S751, Portland, OR 97207-If you have any questions, please feel free to contact me by phone at (503) 984by email at [email protected]
14 Appendix D survey created by Danielle Sheldrake.
Administrator Survey 14
Informed Consent
Welcome to My Survey! Please read the below Informed Consent for this survey.
Purpose of the research: To identify causes of special education teacher attrition and interventions to retain special education teachers in the Portland metro area.
What will be done with this research: Responses from this study will be used to provide guidance to Portland metro area school districts and ESDs about the causes of special education teacher attrition and the most influential ways to increase special education
Time required: The survey will take approximately 10 minutes to complete.
Benefits: The results of this survey will assist in the identification of ways school districts can better support special education teachers and increase the likelihood they will remain
Confidentiality: Your responses will be kept anonymous. When research results are reported, responses will be aggregated (added together) and described in summary. There
ect individual responses to the respondent.
Participation and Withdrawal: Your participation is completely voluntary, and you may quit at any time without penalty.
To Contact the Researcher: If you have questions or concerns about this research, please contact: Danielle Sheldrake; Phone: (503) 984-4331; Email: [email protected].
You may also contact the faculty member supervising this work: Amy Petti, Instructor Graduate School of Education; Portland State University; Phone: (503) 725
Whom to contact about your rights in this research, for questions, concerns, suggestions, or complaints that are not being addressed by the researcher, or research-HRRSC, Research and Strategic Partnerships (RSP), Portland State University, PO Box
-0751, (503) 725-4288, [email protected]. If you have any questions, please feel free to contact me by phone at (503) 984
[email protected]. I appreciate your assistance with my research.
Appendix D survey created by Danielle Sheldrake. 141
Welcome to My Survey! Please read the below Informed Consent for this survey.
Purpose of the research: To identify causes of special education teacher attrition and area.
What will be done with this research: Responses from this study will be used to provide guidance to Portland metro area school districts and ESDs about the causes of special
special education
Time required: The survey will take approximately 10 minutes to complete.
Benefits: The results of this survey will assist in the identification of ways school districts nd increase the likelihood they will remain
Confidentiality: Your responses will be kept anonymous. When research results are reported, responses will be aggregated (added together) and described in summary. There
Participation and Withdrawal: Your participation is completely voluntary, and you may
To Contact the Researcher: If you have questions or concerns about this research, please 4331; Email: [email protected].
You may also contact the faculty member supervising this work: Amy Petti, Instructor Graduate School of Education; Portland State University; Phone: (503) 725-3200; Email:
Whom to contact about your rights in this research, for questions, concerns, suggestions, -related harm:
tate University, PO Box
If you have any questions, please feel free to contact me by phone at (503) 984-4331 or I appreciate your assistance with my research.
142
Sincerely, Danielle Sheldrake Ed.D. Candidate Portland State University (503) 984-4331 Please print or save a copy of this page for your records.
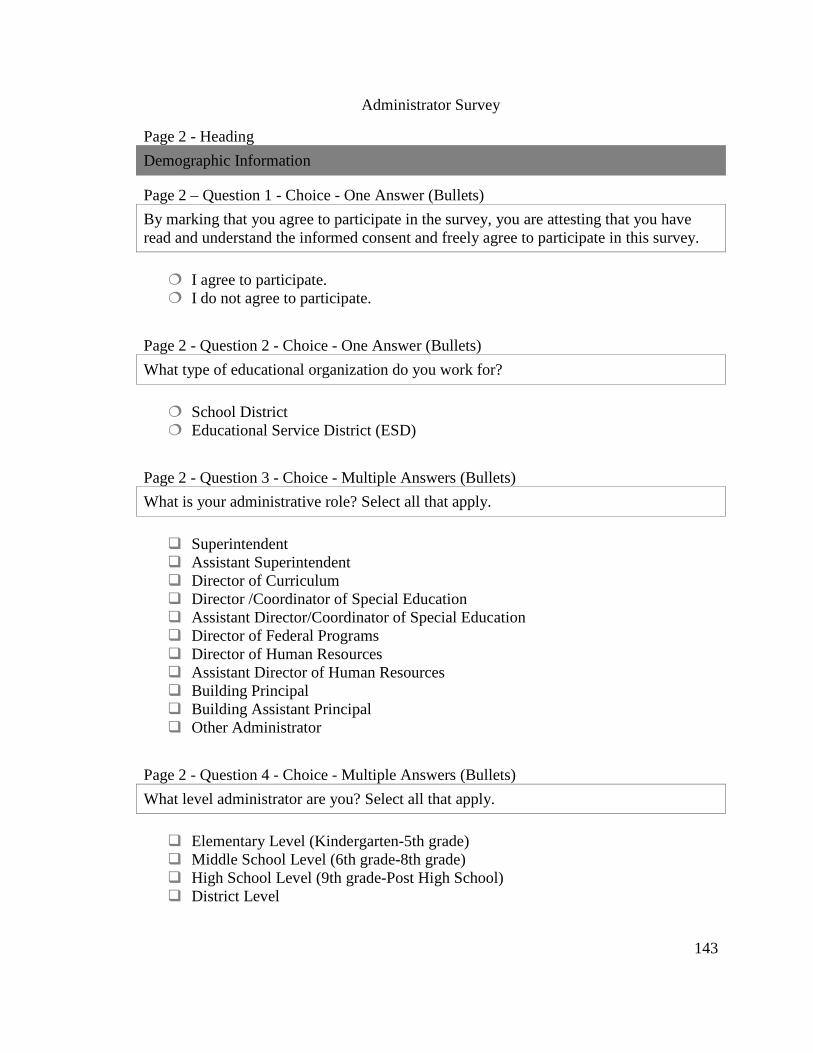
143
Administrator Survey
Page 2 - Heading
Demographic Information
Page 2 – Question 1 - Choice - One Answer (Bullets)
By marking that you agree to participate in the survey, you are attesting that you have read and understand the informed consent and freely agree to participate in this survey.
� I agree to participate. � I do not agree to participate.
Page 2 - Question 2 - Choice - One Answer (Bullets)
What type of educational organization do you work for?
� School District � Educational Service District (ESD)
Page 2 - Question 3 - Choice - Multiple Answers (Bullets)
What is your administrative role? Select all that apply.
� Superintendent � Assistant Superintendent � Director of Curriculum � Director /Coordinator of Special Education � Assistant Director/Coordinator of Special Education � Director of Federal Programs � Director of Human Resources � Assistant Director of Human Resources � Building Principal � Building Assistant Principal � Other Administrator
Page 2 - Question 4 - Choice - Multiple Answers (Bullets)
What level administrator are you? Select all that apply.
� Elementary Level (Kindergarten-5th grade) � Middle School Level (6th grade-8th grade) � High School Level (9th grade-Post High School) � District Level
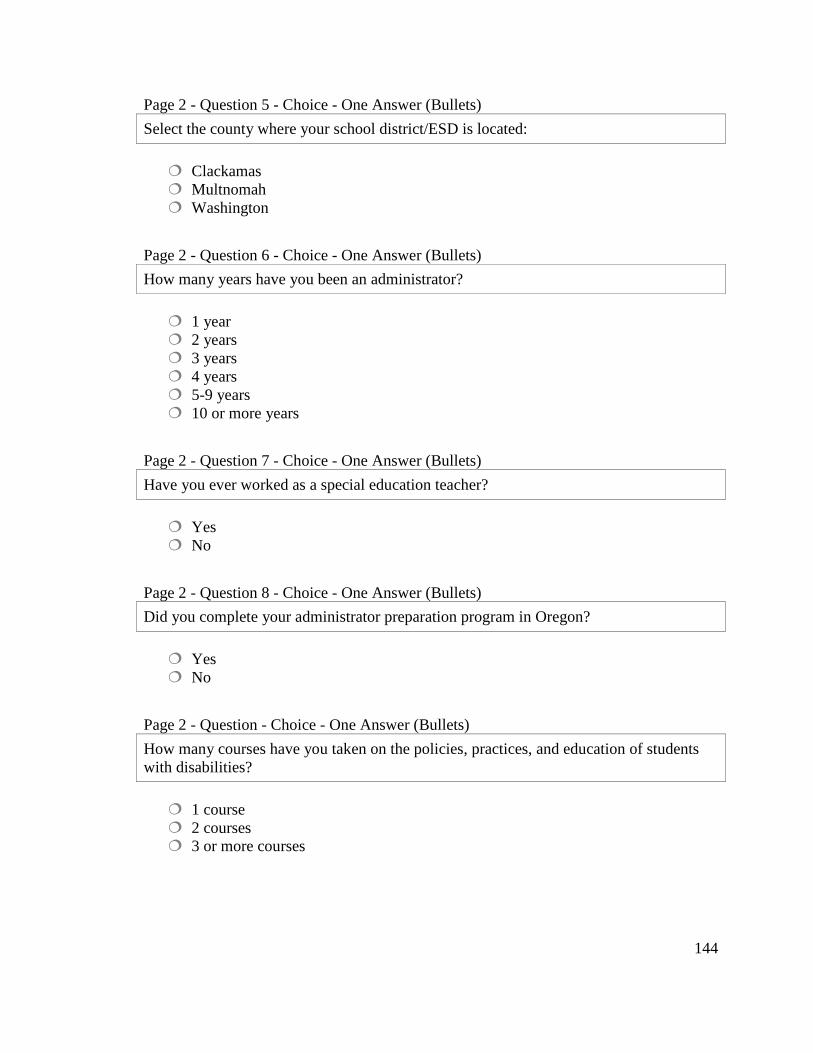
144
Page 2 - Question 5 - Choice - One Answer (Bullets)
Select the county where your school district/ESD is located:
� Clackamas � Multnomah � Washington
Page 2 - Question 6 - Choice - One Answer (Bullets)
How many years have you been an administrator?
� 1 year � 2 years � 3 years � 4 years � 5-9 years � 10 or more years
Page 2 - Question 7 - Choice - One Answer (Bullets)
Have you ever worked as a special education teacher?
� Yes � No
Page 2 - Question 8 - Choice - One Answer (Bullets)
Did you complete your administrator preparation program in Oregon?
� Yes � No
Page 2 - Question - Choice - One Answer (Bullets)
How many courses have you taken on the policies, practices, and education of students with disabilities?
� 1 course � 2 courses � 3 or more courses
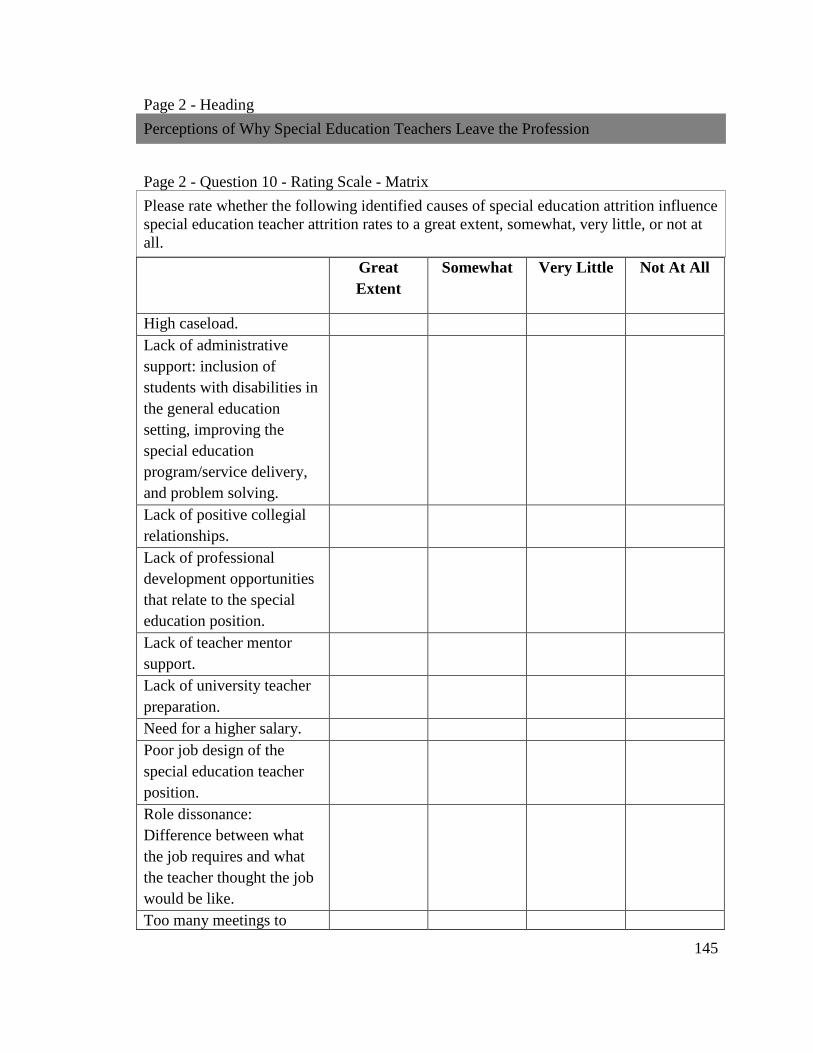
145
Page 2 - Heading
Perceptions of Why Special Education Teachers Leave the Profession
Page 2 - Question 10 - Rating Scale - Matrix
Please rate whether the following identified causes of special education attrition influence special education teacher attrition rates to a great extent, somewhat, very little, or not at all.
Great Extent
Somewhat Very Little Not At All
High caseload. Lack of administrative support: inclusion of students with disabilities in the general education setting, improving the special education program/service delivery, and problem solving.
Lack of positive collegial relationships.
Lack of professional development opportunities that relate to the special education position.
Lack of teacher mentor support.
Lack of university teacher preparation.
Need for a higher salary. Poor job design of the special education teacher position.
Role dissonance: Difference between what the job requires and what the teacher thought the job would be like.
Too many meetings to
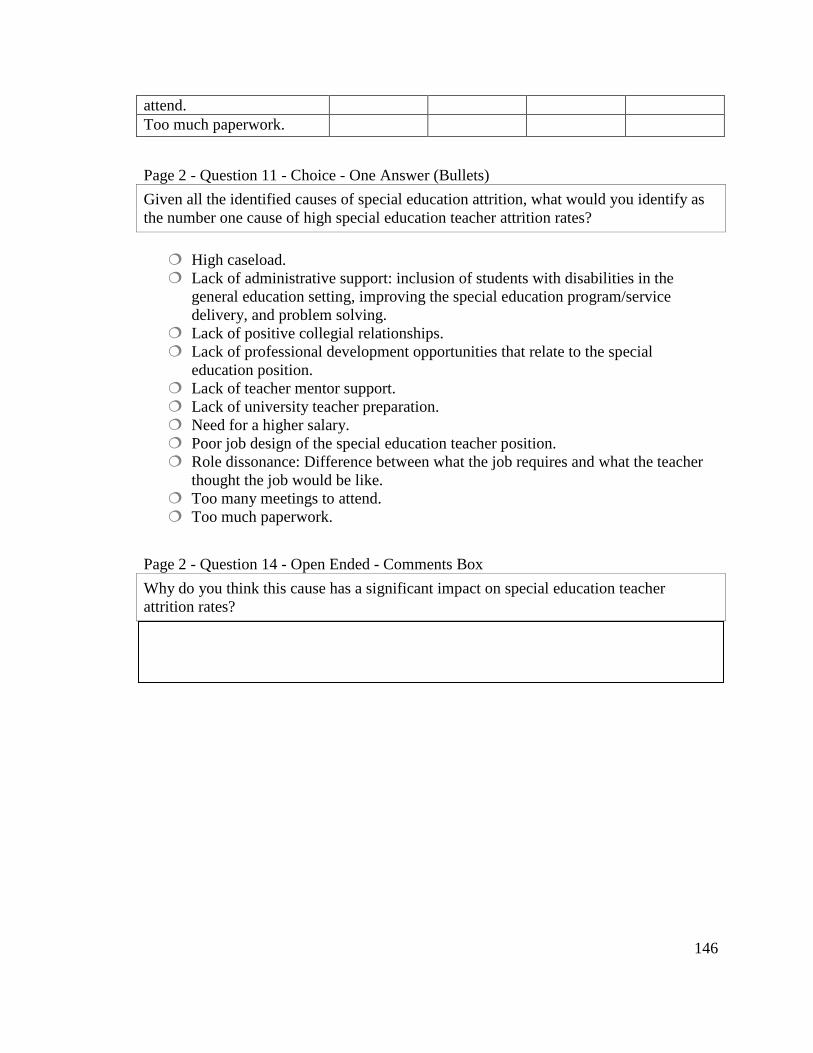
146
attend. Too much paperwork.
Page 2 - Question 11 - Choice - One Answer (Bullets)
Given all the identified causes of special education attrition, what would you identify as the number one cause of high special education teacher attrition rates?
� High caseload. � Lack of administrative support: inclusion of students with disabilities in the
general education setting, improving the special education program/service delivery, and problem solving.
� Lack of positive collegial relationships. � Lack of professional development opportunities that relate to the special
education position. � Lack of teacher mentor support. � Lack of university teacher preparation. � Need for a higher salary. � Poor job design of the special education teacher position. � Role dissonance: Difference between what the job requires and what the teacher
thought the job would be like. � Too many meetings to attend. � Too much paperwork.
Page 2 - Question 14 - Open Ended - Comments Box
Why do you think this cause has a significant impact on special education teacher attrition rates?
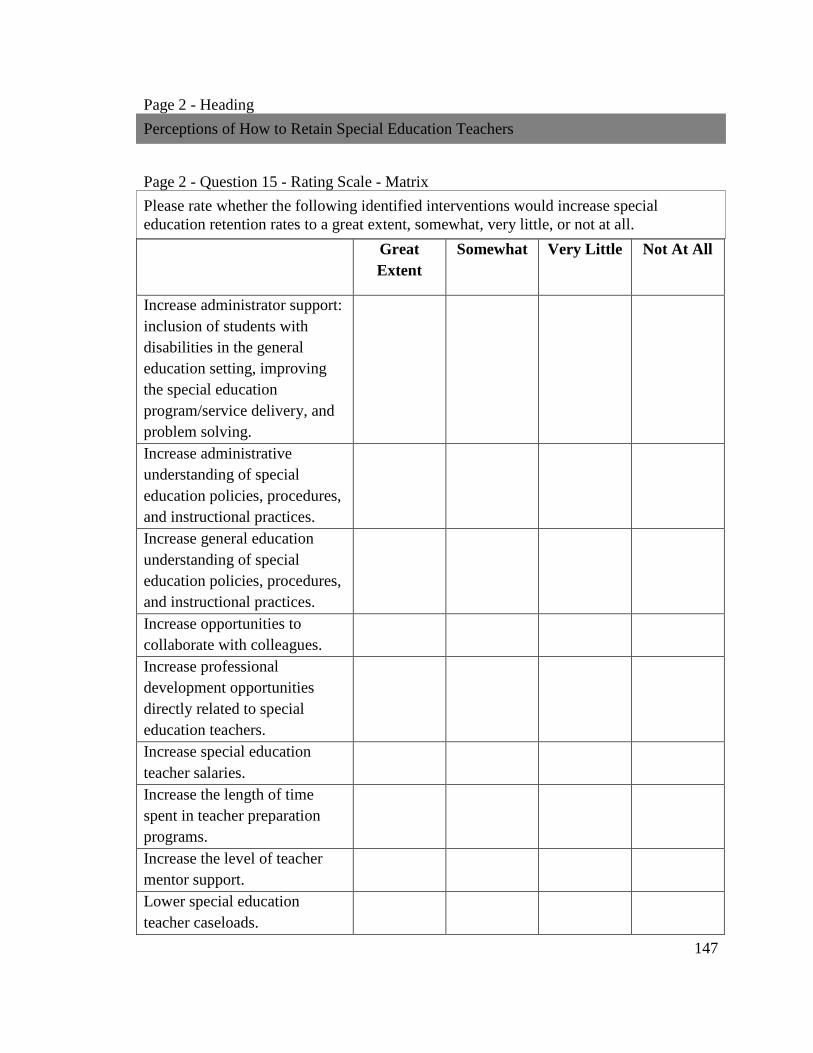
147
Page 2 - Heading
Perceptions of How to Retain Special Education Teachers
Page 2 - Question 15 - Rating Scale - Matrix
Please rate whether the following identified interventions would increase special education retention rates to a great extent, somewhat, very little, or not at all.
Great Extent
Somewhat Very Little Not At All
Increase administrator support: inclusion of students with disabilities in the general education setting, improving the special education program/service delivery, and problem solving.
Increase administrative understanding of special education policies, procedures, and instructional practices.
Increase general education understanding of special education policies, procedures, and instructional practices.
Increase opportunities to collaborate with colleagues.
Increase professional development opportunities directly related to special education teachers.
Increase special education teacher salaries.
Increase the length of time spent in teacher preparation programs.
Increase the level of teacher mentor support.
Lower special education teacher caseloads.
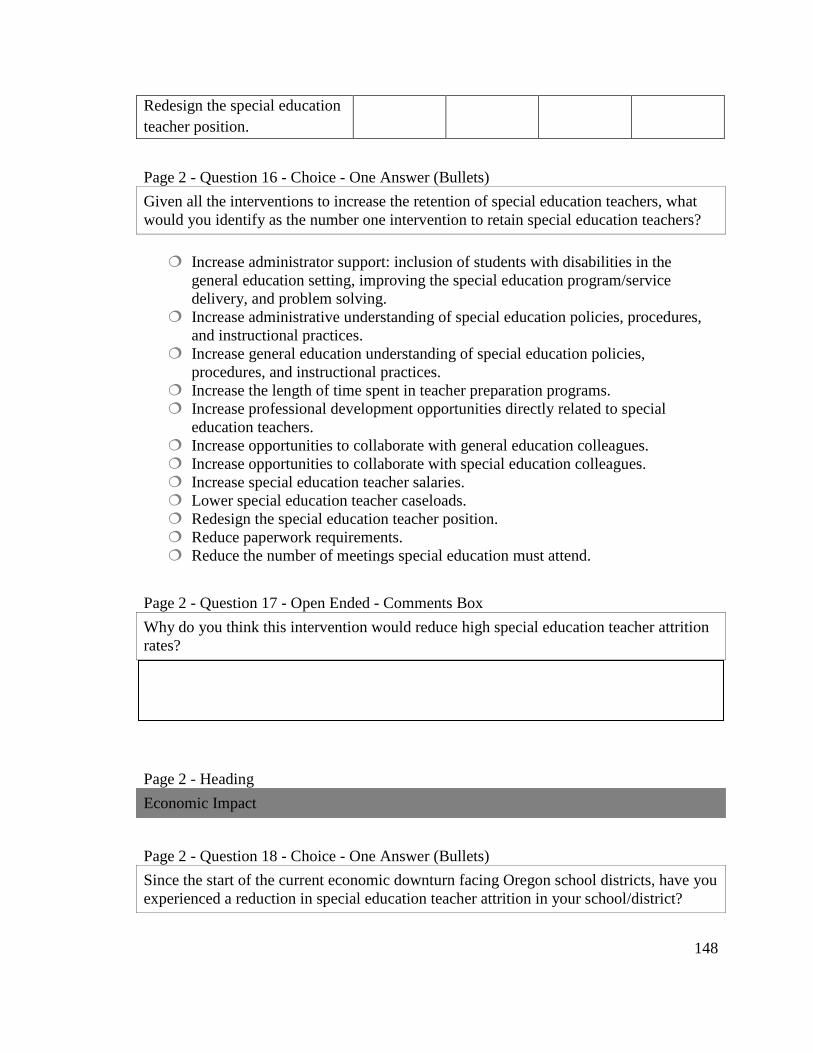
148
Redesign the special education teacher position.
Page 2 - Question 16 - Choice - One Answer (Bullets)
Given all the interventions to increase the retention of special education teachers, what would you identify as the number one intervention to retain special education teachers?
� Increase administrator support: inclusion of students with disabilities in the
general education setting, improving the special education program/service delivery, and problem solving.
� Increase administrative understanding of special education policies, procedures, and instructional practices.
� Increase general education understanding of special education policies, procedures, and instructional practices.
� Increase the length of time spent in teacher preparation programs. � Increase professional development opportunities directly related to special
education teachers. � Increase opportunities to collaborate with general education colleagues. � Increase opportunities to collaborate with special education colleagues. � Increase special education teacher salaries. � Lower special education teacher caseloads. � Redesign the special education teacher position. � Reduce paperwork requirements. � Reduce the number of meetings special education must attend.
Page 2 - Question 17 - Open Ended - Comments Box
Why do you think this intervention would reduce high special education teacher attrition rates?
Page 2 - Heading
Economic Impact
Page 2 - Question 18 - Choice - One Answer (Bullets)
Since the start of the current economic downturn facing Oregon school districts, have you experienced a reduction in special education teacher attrition in your school/district?
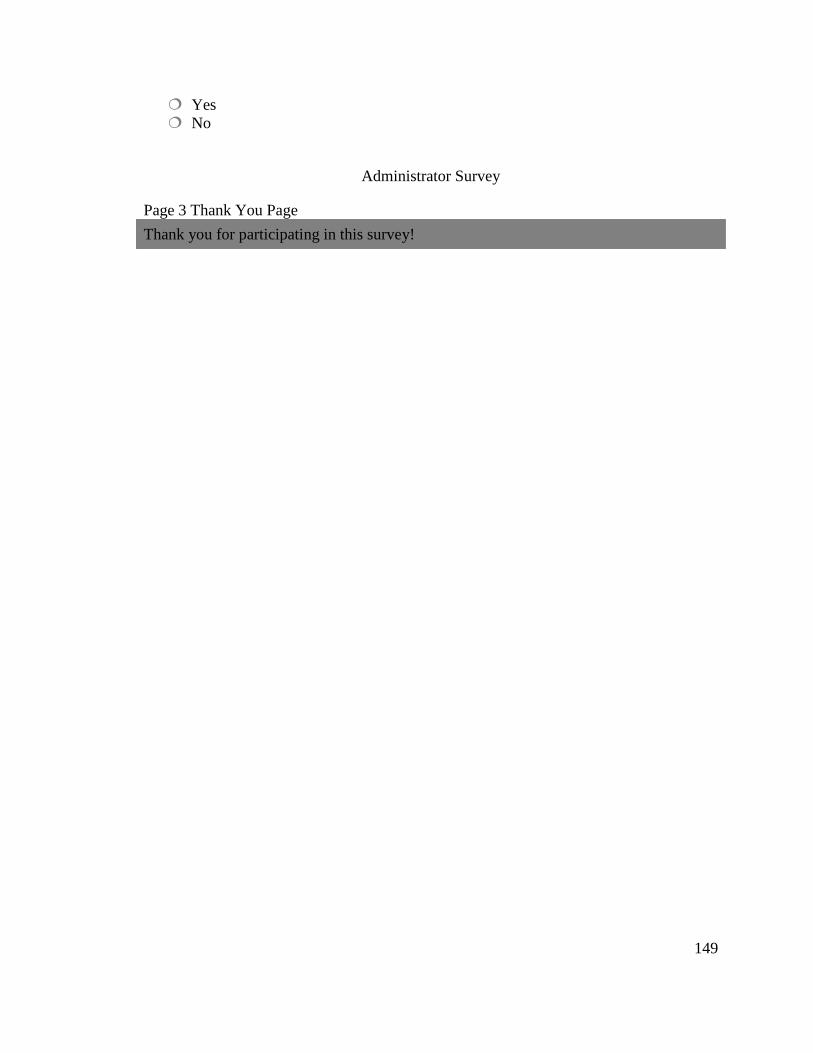
149
� Yes � No
Administrator Survey
Page 3 Thank You Page
Thank you for participating in this survey!

150
APPENDIX E
SPECIAL EDUCATION TEACHER/SPECIAL EDUCATION TEACHER ON SPECIAL ASSIGNMENT (TOSA) SURVEY

Special Education Teacher/Special Education Teacher on Special Assignment
Page 1 - Heading
Introduction: Informed Consent
Welcome to My Survey! Please read the below Informed Consent for this survey. Purpose of the research: To identify causes of special education teacher attrition and interventions to retain special educat What will be done with this research: Responses from this study will be used to provide guidance to Portland metro area school districts and ESDs about the causes of special education teacher attrition and the mostteacher retention. Time required: The survey will take approximately 10 minutes to complete. Benefits: The results of this survey will assist in the identification of ways school districts can better support special education teachers and increase the likelihood they will remain in the profession. Confidentiality: Your responses will be kept anonymous. When research results are reported, responses will be aggregated (added together) and described in summarywill be no way to connect individual responses to the respondent. Participation and Withdrawal: Your participation is completely voluntary, and you may quit at any time without penalty. To Contact the Researcher: If you have questions or concerns about this research, please contact: Danielle Sheldrake; Phone: (503) 984 You may also contact the faculty member supervising this work: Amy Petti, InstrucGraduate School of Education; Portland State University; Phone: (503) [email protected]. Whom to contact about your rights in this research, for questions, concerns, suggestions, or complaints that are not being addressed by the researcheHRRSC, Research and Strategic Partnerships (RSP), Portland State University, PO Box 751, Portland, OR 97207-
15 Appendix E survey created by Danielle Sheldrake.
Special Education Teacher/Special Education Teacher on Special Assignment (TOSA) Survey15
Introduction: Informed Consent
Welcome to My Survey! Please read the below Informed Consent for this survey.
Purpose of the research: To identify causes of special education teacher attrition and interventions to retain special education teachers in the Portland metro area.
What will be done with this research: Responses from this study will be used to provide guidance to Portland metro area school districts and ESDs about the causes of special education teacher attrition and the most influential ways to increase special education
Time required: The survey will take approximately 10 minutes to complete.
Benefits: The results of this survey will assist in the identification of ways school districts t special education teachers and increase the likelihood they will remain
Confidentiality: Your responses will be kept anonymous. When research results are reported, responses will be aggregated (added together) and described in summarywill be no way to connect individual responses to the respondent.
Participation and Withdrawal: Your participation is completely voluntary, and you may quit at any time without penalty.
To Contact the Researcher: If you have questions or concerns about this research, please contact: Danielle Sheldrake; Phone: (503) 984-4331; Email: [email protected].
You may also contact the faculty member supervising this work: Amy Petti, InstrucGraduate School of Education; Portland State University; Phone: (503) 725
Whom to contact about your rights in this research, for questions, concerns, suggestions, or complaints that are not being addressed by the researcher, or research-HRRSC, Research and Strategic Partnerships (RSP), Portland State University, PO Box
-0751, (503) 725-4288, [email protected].
endix E survey created by Danielle Sheldrake. 151
Special Education Teacher/Special Education Teacher on Special Assignment
Welcome to My Survey! Please read the below Informed Consent for this survey.
Purpose of the research: To identify causes of special education teacher attrition and ion teachers in the Portland metro area.
What will be done with this research: Responses from this study will be used to provide guidance to Portland metro area school districts and ESDs about the causes of special
influential ways to increase special education
Time required: The survey will take approximately 10 minutes to complete.
Benefits: The results of this survey will assist in the identification of ways school districts t special education teachers and increase the likelihood they will remain
Confidentiality: Your responses will be kept anonymous. When research results are reported, responses will be aggregated (added together) and described in summary. There
Participation and Withdrawal: Your participation is completely voluntary, and you may
To Contact the Researcher: If you have questions or concerns about this research, please 4331; Email: [email protected].
You may also contact the faculty member supervising this work: Amy Petti, Instructor Graduate School of Education; Portland State University; Phone: (503) 725-3200; Email:
Whom to contact about your rights in this research, for questions, concerns, suggestions, -related harm:
HRRSC, Research and Strategic Partnerships (RSP), Portland State University, PO Box

152
If you have any questions, please feel free to contact me by phone at (503) 984-4331 or by email at [email protected]. I appreciate your assistance with my research. Sincerely, Danielle Sheldrake Ed.D. Candidate Portland State University (503) 984-4331
Please print or save a copy of this page for your records.
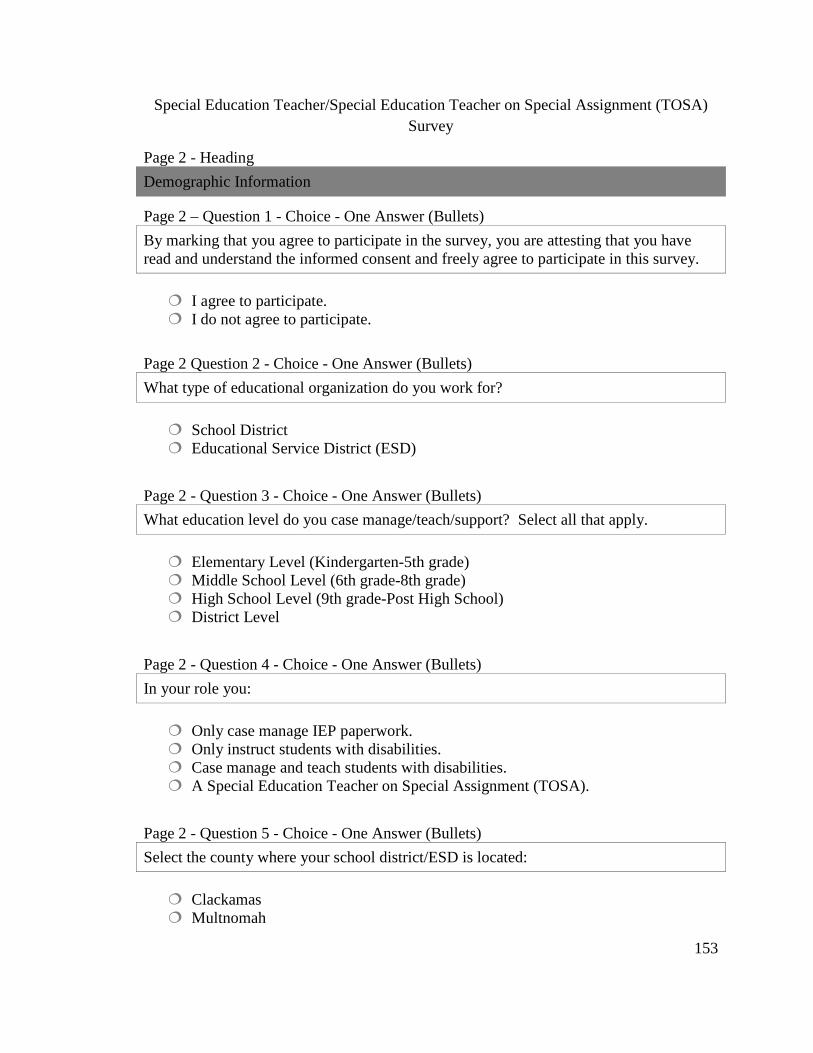
153
Special Education Teacher/Special Education Teacher on Special Assignment (TOSA) Survey
Page 2 - Heading
Demographic Information
Page 2 – Question 1 - Choice - One Answer (Bullets)
By marking that you agree to participate in the survey, you are attesting that you have read and understand the informed consent and freely agree to participate in this survey.
� I agree to participate. � I do not agree to participate.
Page 2 Question 2 - Choice - One Answer (Bullets)
What type of educational organization do you work for?
� School District � Educational Service District (ESD)
Page 2 - Question 3 - Choice - One Answer (Bullets)
What education level do you case manage/teach/support? Select all that apply.
� Elementary Level (Kindergarten-5th grade) � Middle School Level (6th grade-8th grade) � High School Level (9th grade-Post High School) � District Level
Page 2 - Question 4 - Choice - One Answer (Bullets)
In your role you:
� Only case manage IEP paperwork. � Only instruct students with disabilities. � Case manage and teach students with disabilities. � A Special Education Teacher on Special Assignment (TOSA).
Page 2 - Question 5 - Choice - One Answer (Bullets)
Select the county where your school district/ESD is located:
� Clackamas � Multnomah
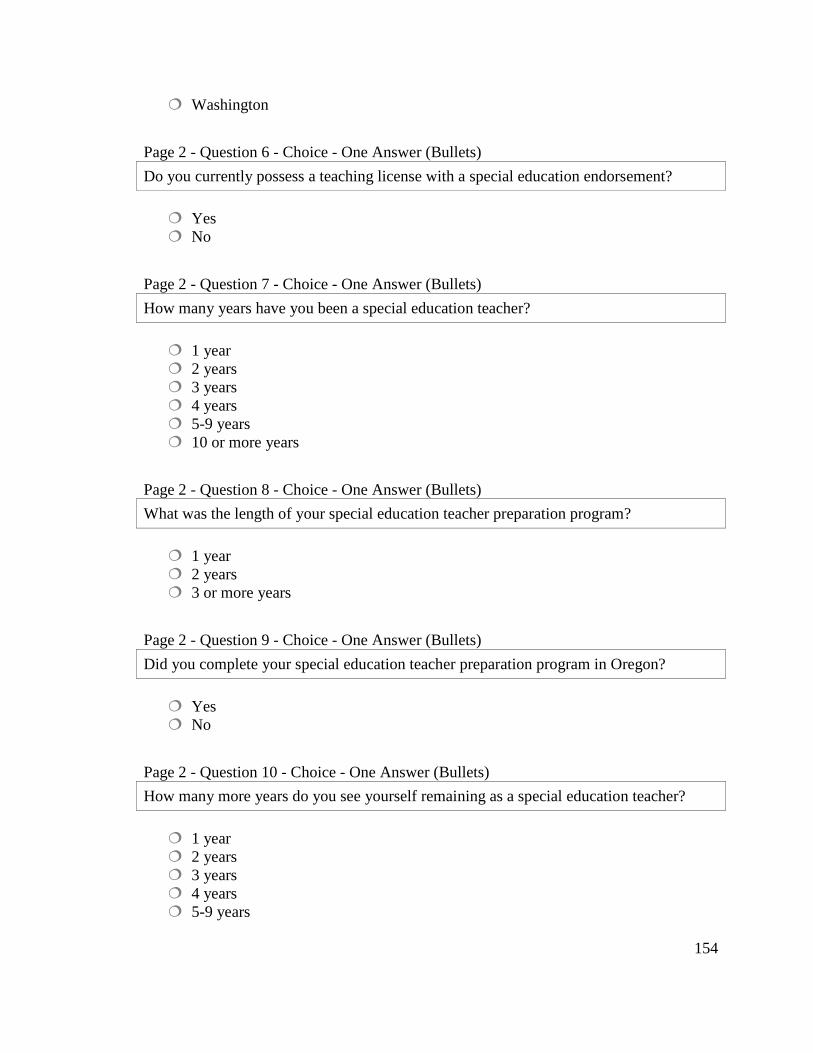
154
� Washington
Page 2 - Question 6 - Choice - One Answer (Bullets)
Do you currently possess a teaching license with a special education endorsement?
� Yes � No
Page 2 - Question 7 - Choice - One Answer (Bullets)
How many years have you been a special education teacher?
� 1 year � 2 years � 3 years � 4 years � 5-9 years � 10 or more years
Page 2 - Question 8 - Choice - One Answer (Bullets)
What was the length of your special education teacher preparation program?
� 1 year � 2 years � 3 or more years
Page 2 - Question 9 - Choice - One Answer (Bullets)
Did you complete your special education teacher preparation program in Oregon?
� Yes � No
Page 2 - Question 10 - Choice - One Answer (Bullets)
How many more years do you see yourself remaining as a special education teacher?
� 1 year � 2 years � 3 years � 4 years � 5-9 years
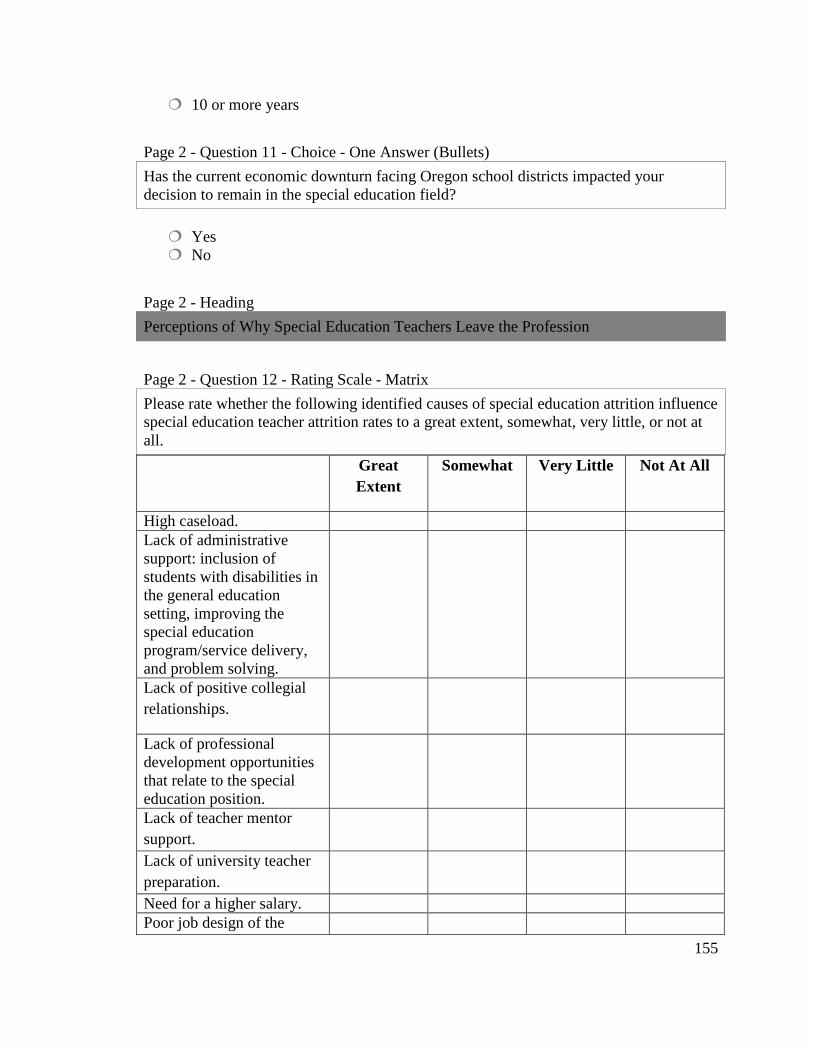
155
� 10 or more years
Page 2 - Question 11 - Choice - One Answer (Bullets)
Has the current economic downturn facing Oregon school districts impacted your decision to remain in the special education field?
� Yes � No
Page 2 - Heading
Perceptions of Why Special Education Teachers Leave the Profession
Page 2 - Question 12 - Rating Scale - Matrix
Please rate whether the following identified causes of special education attrition influence special education teacher attrition rates to a great extent, somewhat, very little, or not at all.
Great Extent
Somewhat Very Little Not At All
High caseload. Lack of administrative support: inclusion of students with disabilities in the general education setting, improving the special education program/service delivery, and problem solving.
Lack of positive collegial relationships.
Lack of professional development opportunities that relate to the special education position.
Lack of teacher mentor support.
Lack of university teacher preparation.
Need for a higher salary. Poor job design of the
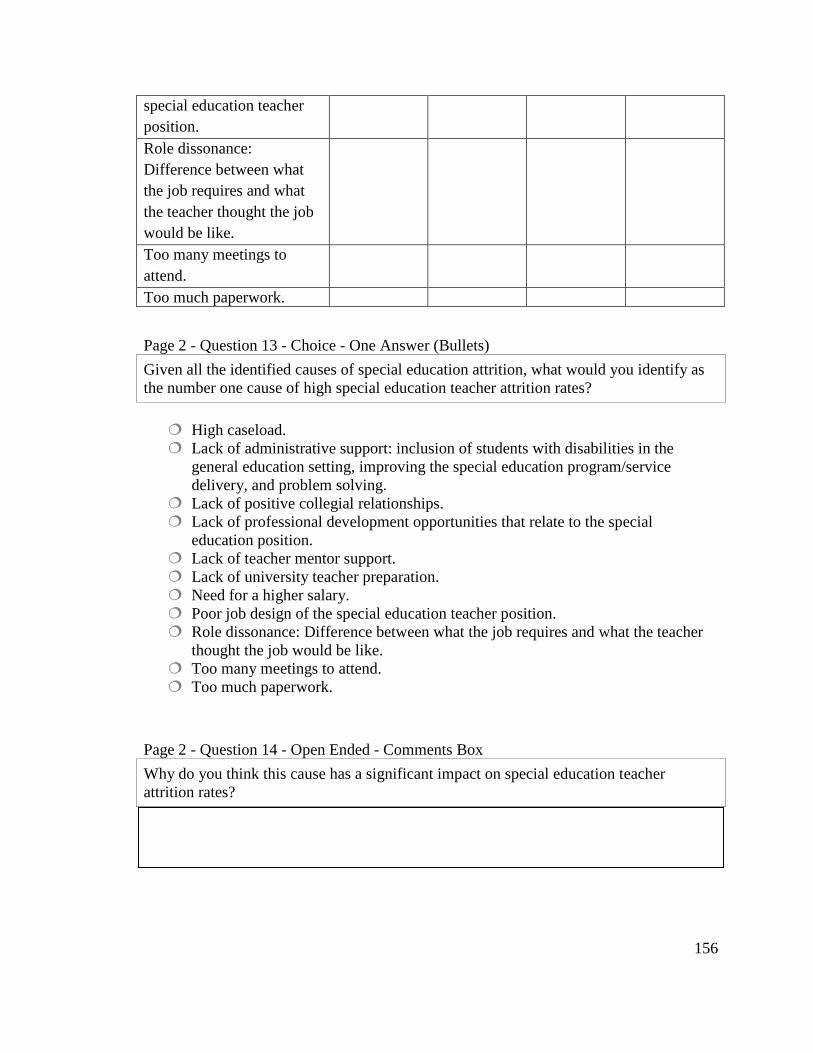
156
special education teacher position. Role dissonance: Difference between what the job requires and what the teacher thought the job would be like.
Too many meetings to attend.
Too much paperwork.
Page 2 - Question 13 - Choice - One Answer (Bullets)
Given all the identified causes of special education attrition, what would you identify as the number one cause of high special education teacher attrition rates?
� High caseload. � Lack of administrative support: inclusion of students with disabilities in the
general education setting, improving the special education program/service delivery, and problem solving.
� Lack of positive collegial relationships. � Lack of professional development opportunities that relate to the special
education position. � Lack of teacher mentor support. � Lack of university teacher preparation. � Need for a higher salary. � Poor job design of the special education teacher position. � Role dissonance: Difference between what the job requires and what the teacher
thought the job would be like. � Too many meetings to attend. � Too much paperwork.
Page 2 - Question 14 - Open Ended - Comments Box
Why do you think this cause has a significant impact on special education teacher attrition rates?
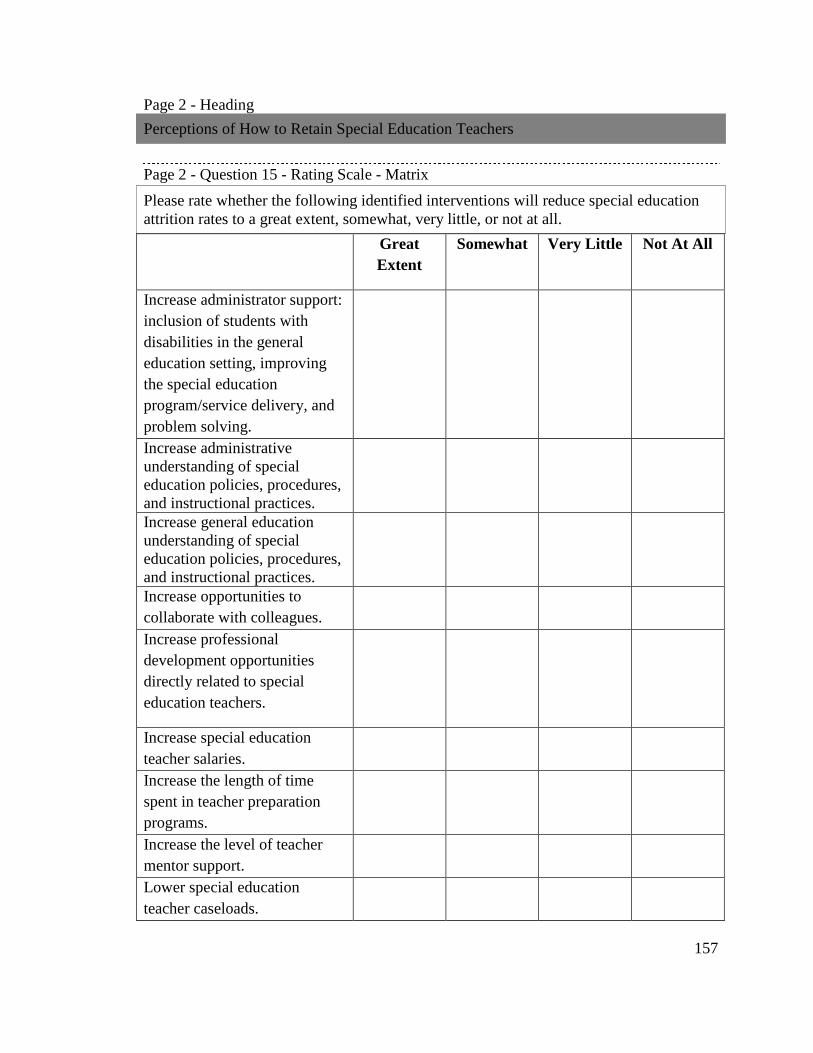
157
Page 2 - Heading
Perceptions of How to Retain Special Education Teachers
Page 2 - Question 15 - Rating Scale - Matrix
Please rate whether the following identified interventions will reduce special education attrition rates to a great extent, somewhat, very little, or not at all.
Great Extent
Somewhat Very Little Not At All
Increase administrator support: inclusion of students with disabilities in the general education setting, improving the special education program/service delivery, and problem solving.
Increase administrative understanding of special education policies, procedures, and instructional practices.
Increase general education understanding of special education policies, procedures, and instructional practices.
Increase opportunities to collaborate with colleagues.
Increase professional development opportunities directly related to special education teachers.
Increase special education teacher salaries.
Increase the length of time spent in teacher preparation programs.
Increase the level of teacher mentor support.
Lower special education teacher caseloads.
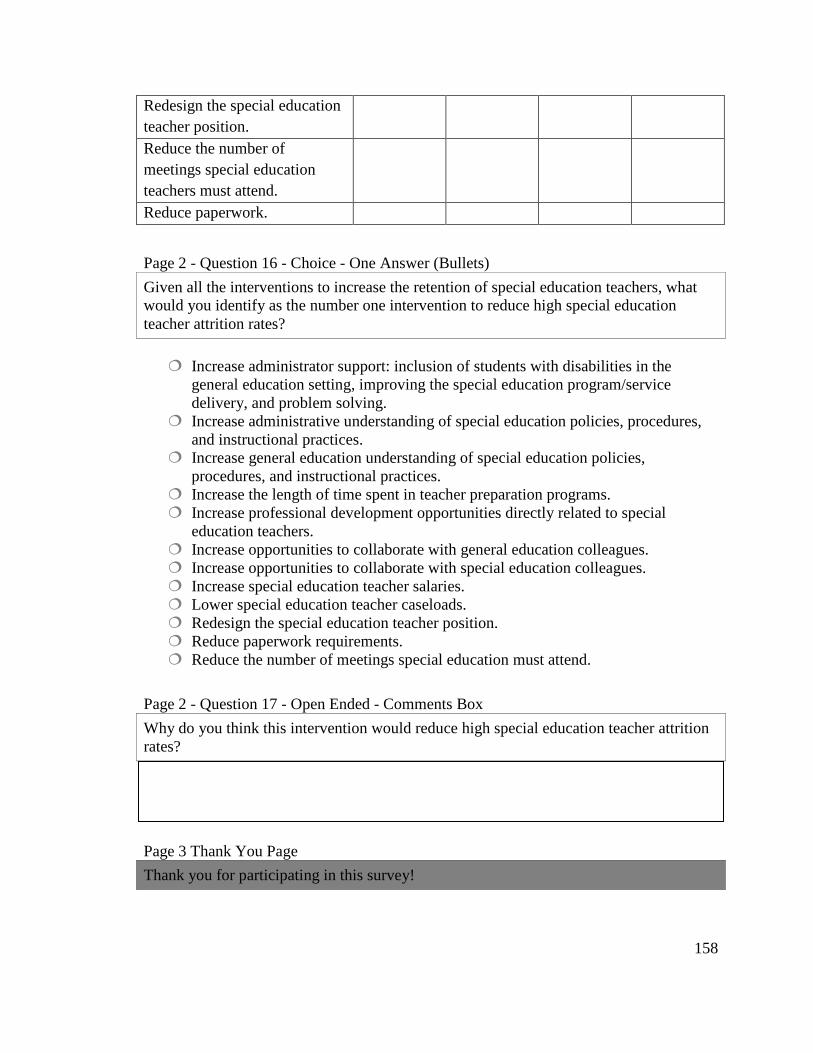
158
Redesign the special education teacher position.
Reduce the number of meetings special education teachers must attend.
Reduce paperwork.
Page 2 - Question 16 - Choice - One Answer (Bullets)
Given all the interventions to increase the retention of special education teachers, what would you identify as the number one intervention to reduce high special education teacher attrition rates?
� Increase administrator support: inclusion of students with disabilities in the
general education setting, improving the special education program/service delivery, and problem solving.
� Increase administrative understanding of special education policies, procedures, and instructional practices.
� Increase general education understanding of special education policies, procedures, and instructional practices.
� Increase the length of time spent in teacher preparation programs. � Increase professional development opportunities directly related to special
education teachers. � Increase opportunities to collaborate with general education colleagues. � Increase opportunities to collaborate with special education colleagues. � Increase special education teacher salaries. � Lower special education teacher caseloads. � Redesign the special education teacher position. � Reduce paperwork requirements. � Reduce the number of meetings special education must attend.
Page 2 - Question 17 - Open Ended - Comments Box
Why do you think this intervention would reduce high special education teacher attrition rates?
Survey
Page 3 Thank You Page
Thank you for participating in this survey!

159
APPENDIX F
COMPARISON OF TOSA AND NON-TOSA DATA TABLES
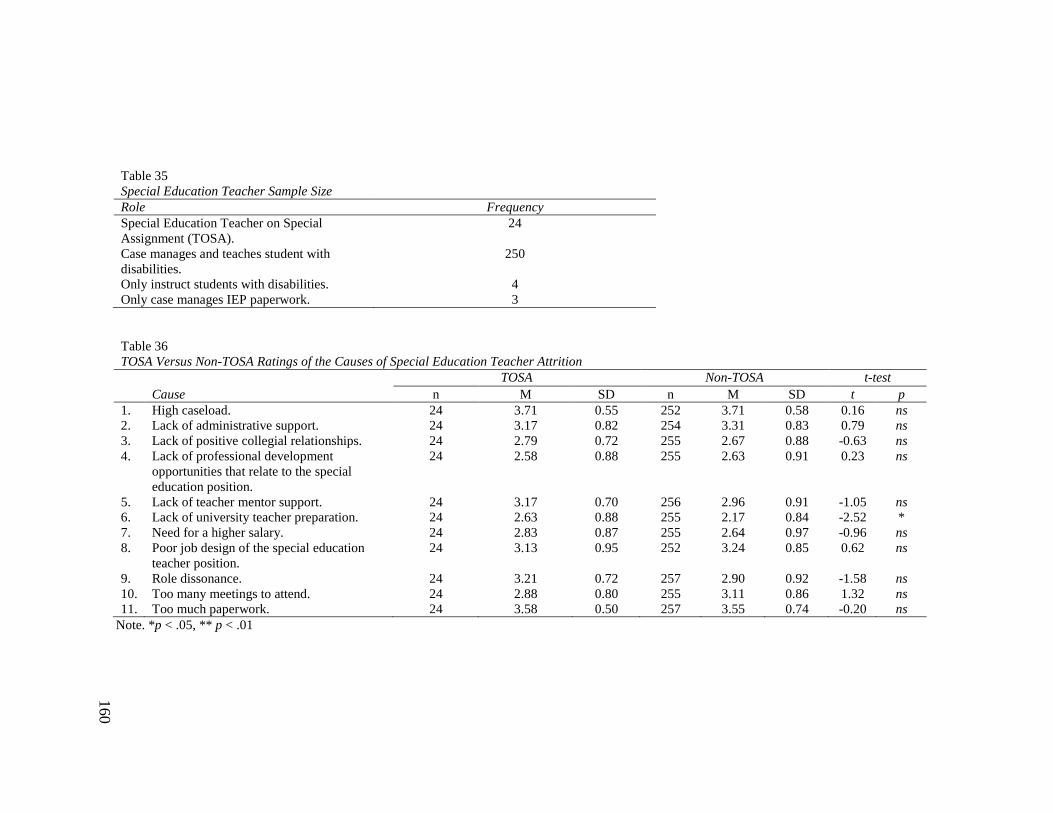
160
Table 35 Special Education Teacher Sample Size Role Frequency Special Education Teacher on Special Assignment (TOSA).
24
Case manages and teaches student with disabilities.
250
Only instruct students with disabilities. 4 Only case manages IEP paperwork. 3
Table 36 TOSA Versus Non-TOSA Ratings of the Causes of Special Education Teacher Attrition TOSA Non-TOSA t-test Cause n M SD n M SD t p 1. High caseload. 24 3.71 0.55 252 3.71 0.58 0.16 ns 2. Lack of administrative support. 24 3.17 0.82 254 3.31 0.83 0.79 ns 3. Lack of positive collegial relationships. 24 2.79 0.72 255 2.67 0.88 -0.63 ns 4. Lack of professional development
opportunities that relate to the special education position.
24 2.58 0.88 255 2.63 0.91 0.23 ns
5. Lack of teacher mentor support. 24 3.17 0.70 256 2.96 0.91 -1.05 ns 6. Lack of university teacher preparation. 24 2.63 0.88 255 2.17 0.84 -2.52 * 7. Need for a higher salary. 24 2.83 0.87 255 2.64 0.97 -0.96 ns 8. Poor job design of the special education
teacher position. 24 3.13 0.95 252 3.24 0.85 0.62 ns
9. Role dissonance. 24 3.21 0.72 257 2.90 0.92 -1.58 ns 10. Too many meetings to attend. 24 2.88 0.80 255 3.11 0.86 1.32 ns 11. Too much paperwork. 24 3.58 0.50 257 3.55 0.74 -0.20 ns
Note. *p < .05, ** p < .01

161
APPENDIX G
COMPARISON OF DISTRICT ADMINISTRATOR AND BUILDING ADMINISTRATOR DATA TABLES
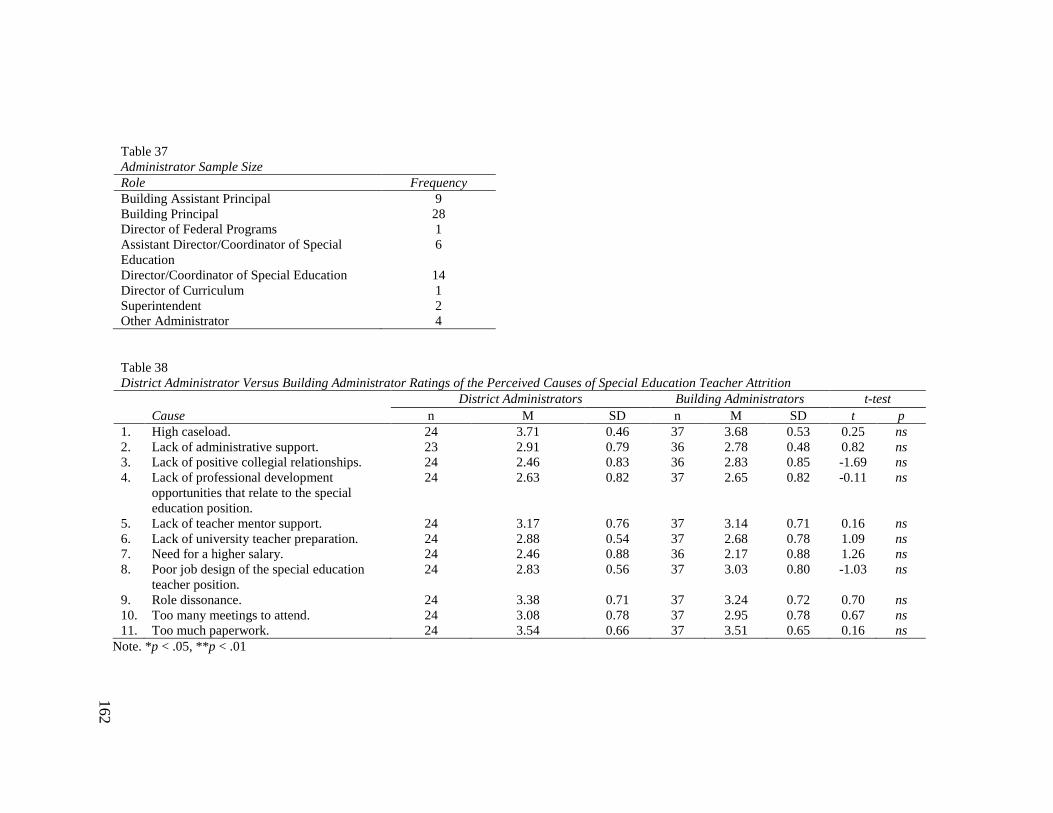
162
Table 37 Administrator Sample Size Role Frequency Building Assistant Principal 9 Building Principal 28 Director of Federal Programs 1 Assistant Director/Coordinator of Special Education
6
Director/Coordinator of Special Education 14 Director of Curriculum 1 Superintendent 2 Other Administrator 4
Table 38 District Administrator Versus Building Administrator Ratings of the Perceived Causes of Special Education Teacher Attrition District Administrators Building Administrators t-test Cause n M SD n M SD t p 1. High caseload. 24 3.71 0.46 37 3.68 0.53 0.25 ns 2. Lack of administrative support. 23 2.91 0.79 36 2.78 0.48 0.82 ns 3. Lack of positive collegial relationships. 24 2.46 0.83 36 2.83 0.85 -1.69 ns 4. Lack of professional development
opportunities that relate to the special education position.
24 2.63 0.82 37 2.65 0.82 -0.11 ns
5. Lack of teacher mentor support. 24 3.17 0.76 37 3.14 0.71 0.16 ns 6. Lack of university teacher preparation. 24 2.88 0.54 37 2.68 0.78 1.09 ns 7. Need for a higher salary. 24 2.46 0.88 36 2.17 0.88 1.26 ns 8. Poor job design of the special education
teacher position. 24 2.83 0.56 37 3.03 0.80 -1.03 ns
9. Role dissonance. 24 3.38 0.71 37 3.24 0.72 0.70 ns 10. Too many meetings to attend. 24 3.08 0.78 37 2.95 0.78 0.67 ns 11. Too much paperwork. 24 3.54 0.66 37 3.51 0.65 0.16 ns
Note. *p < .05, **p < .01
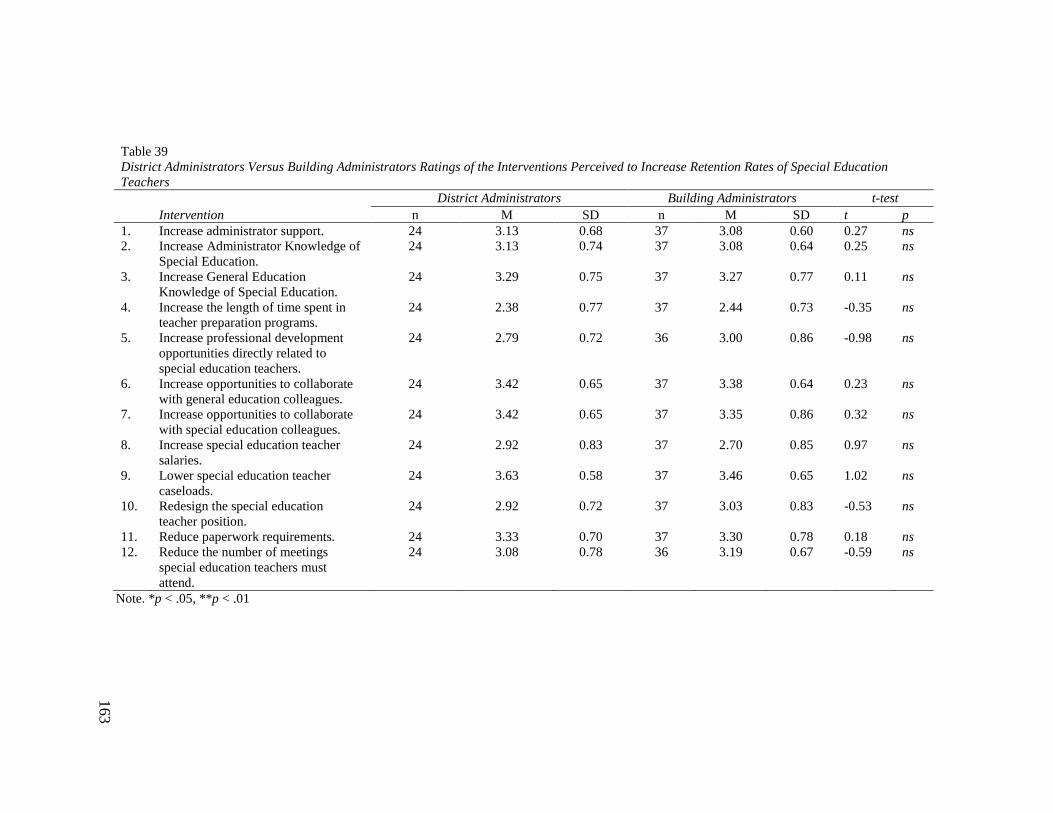
163
Table 39 District Administrators Versus Building Administrators Ratings of the Interventions Perceived to Increase Retention Rates of Special Education Teachers District Administrators Building Administrators t-test Intervention n M SD n M SD t p 1. Increase administrator support. 24 3.13 0.68 37 3.08 0.60 0.27 ns 2. Increase Administrator Knowledge of
Special Education. 24 3.13 0.74 37 3.08 0.64 0.25 ns
3. Increase General Education Knowledge of Special Education.
24 3.29 0.75 37 3.27 0.77 0.11 ns
4. Increase the length of time spent in teacher preparation programs.
24 2.38 0.77 37 2.44 0.73 -0.35 ns
5. Increase professional development opportunities directly related to special education teachers.
24 2.79 0.72 36 3.00 0.86 -0.98 ns
6. Increase opportunities to collaborate with general education colleagues.
24 3.42 0.65 37 3.38 0.64 0.23 ns
7. Increase opportunities to collaborate with special education colleagues.
24 3.42 0.65 37 3.35 0.86 0.32 ns
8. Increase special education teacher salaries.
24 2.92 0.83 37 2.70 0.85 0.97 ns
9. Lower special education teacher caseloads.
24 3.63 0.58 37 3.46 0.65 1.02 ns
10. Redesign the special education teacher position.
24 2.92 0.72 37 3.03 0.83 -0.53 ns
11. Reduce paperwork requirements. 24 3.33 0.70 37 3.30 0.78 0.18 ns 12. Reduce the number of meetings
special education teachers must attend.
24 3.08 0.78 36 3.19 0.67 -0.59 ns
Note. *p < .05, **p < .01

164
APPENDIX H
COMPARISON OF YEARS REMAINING IN THE PROFESSION DATA TABLE
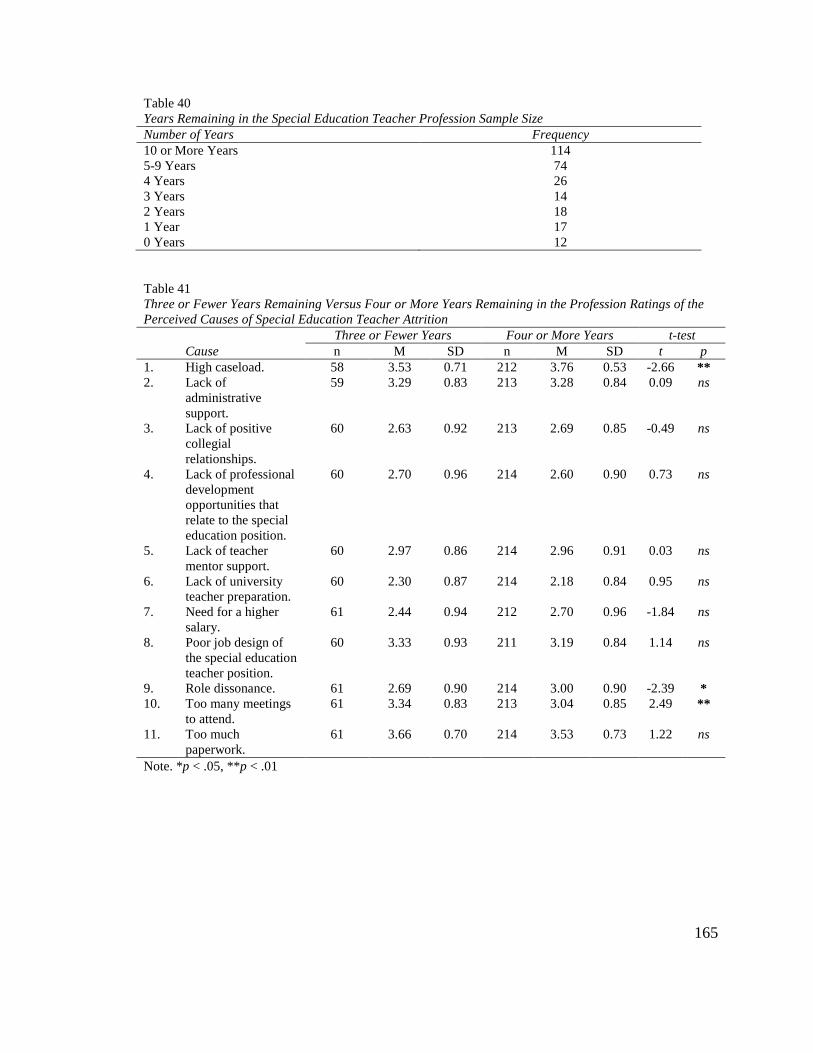
165
Table 40 Years Remaining in the Special Education Teacher Profession Sample Size Number of Years Frequency 10 or More Years 114 5-9 Years 74 4 Years 26 3 Years 14 2 Years 18 1 Year 17 0 Years 12
Table 41 Three or Fewer Years Remaining Versus Four or More Years Remaining in the Profession Ratings of the Perceived Causes of Special Education Teacher Attrition
Three or Fewer Years Four or More Years t-test Cause n M SD n M SD t p 1. High caseload. 58 3.53 0.71 212 3.76 0.53 -2.66 ** 2. Lack of
administrative support.
59 3.29 0.83 213 3.28 0.84 0.09 ns
3. Lack of positive collegial relationships.
60 2.63 0.92 213 2.69 0.85 -0.49 ns
4. Lack of professional development opportunities that relate to the special education position.
60 2.70 0.96 214 2.60 0.90 0.73 ns
5. Lack of teacher mentor support.
60 2.97 0.86 214 2.96 0.91 0.03 ns
6. Lack of university teacher preparation.
60 2.30 0.87 214 2.18 0.84 0.95 ns
7. Need for a higher salary.
61 2.44 0.94 212 2.70 0.96 -1.84 ns
8. Poor job design of the special education teacher position.
60 3.33 0.93 211 3.19 0.84 1.14 ns
9. Role dissonance. 61 2.69 0.90 214 3.00 0.90 -2.39 * 10. Too many meetings
to attend. 61 3.34 0.83 213 3.04 0.85 2.49 **
11. Too much paperwork.
61 3.66 0.70 214 3.53 0.73 1.22 ns
Note. *p < .05, **p < .01
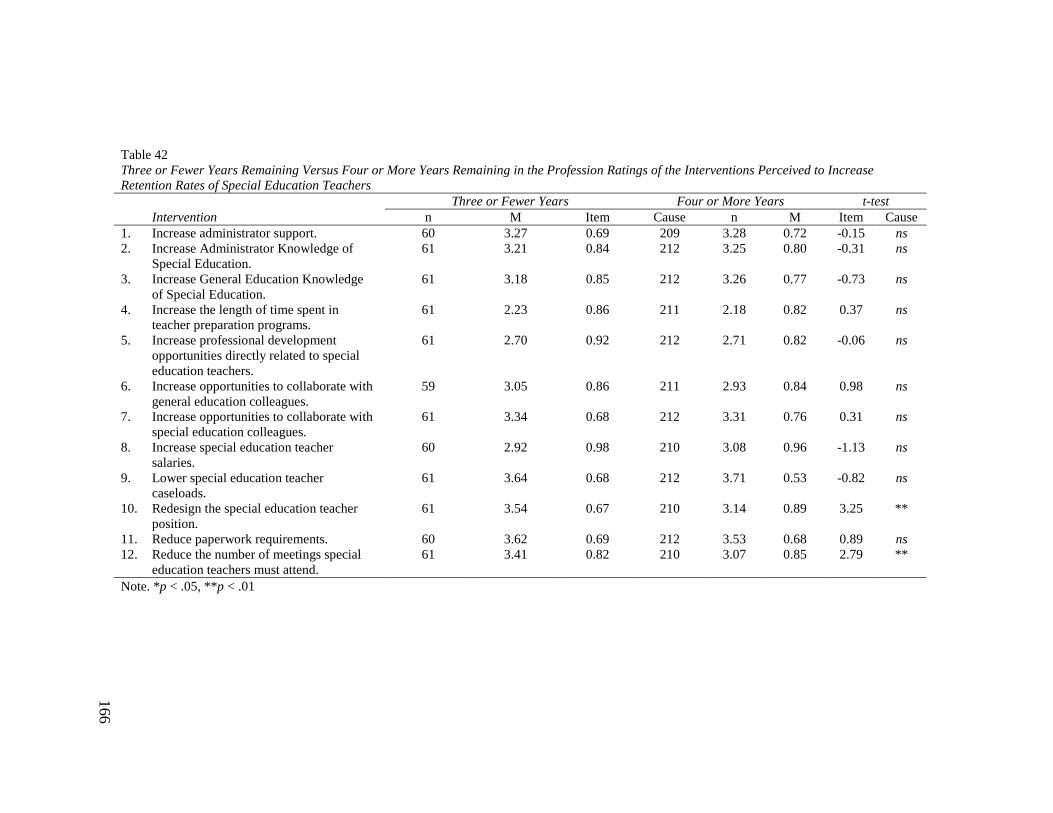
166
Table 42 Three or Fewer Years Remaining Versus Four or More Years Remaining in the Profession Ratings of the Interventions Perceived to Increase Retention Rates of Special Education Teachers
Three or Fewer Years Four or More Years t-test Intervention n M Item Cause n M Item Cause 1. Increase administrator support. 60 3.27 0.69 209 3.28 0.72 -0.15 ns 2. Increase Administrator Knowledge of
Special Education. 61 3.21 0.84 212 3.25 0.80 -0.31 ns
3. Increase General Education Knowledge of Special Education.
61 3.18 0.85 212 3.26 0.77 -0.73 ns
4. Increase the length of time spent in teacher preparation programs.
61 2.23 0.86 211 2.18 0.82 0.37 ns
5. Increase professional development opportunities directly related to special education teachers.
61 2.70 0.92 212 2.71 0.82 -0.06 ns
6. Increase opportunities to collaborate with general education colleagues.
59 3.05 0.86 211 2.93 0.84 0.98 ns
7. Increase opportunities to collaborate with special education colleagues.
61 3.34 0.68 212 3.31 0.76 0.31 ns
8. Increase special education teacher salaries.
60 2.92 0.98 210 3.08 0.96 -1.13 ns
9. Lower special education teacher caseloads.
61 3.64 0.68 212 3.71 0.53 -0.82 ns
10. Redesign the special education teacher position.
61 3.54 0.67 210 3.14 0.89 3.25 **
11. Reduce paperwork requirements. 60 3.62 0.69 212 3.53 0.68 0.89 ns 12. Reduce the number of meetings special
education teachers must attend. 61 3.41 0.82 210 3.07 0.85 2.79 **
Note. *p < .05, **p < .01

167
APPENDIX I
ECONOMIC IMPACT DATA TABLES
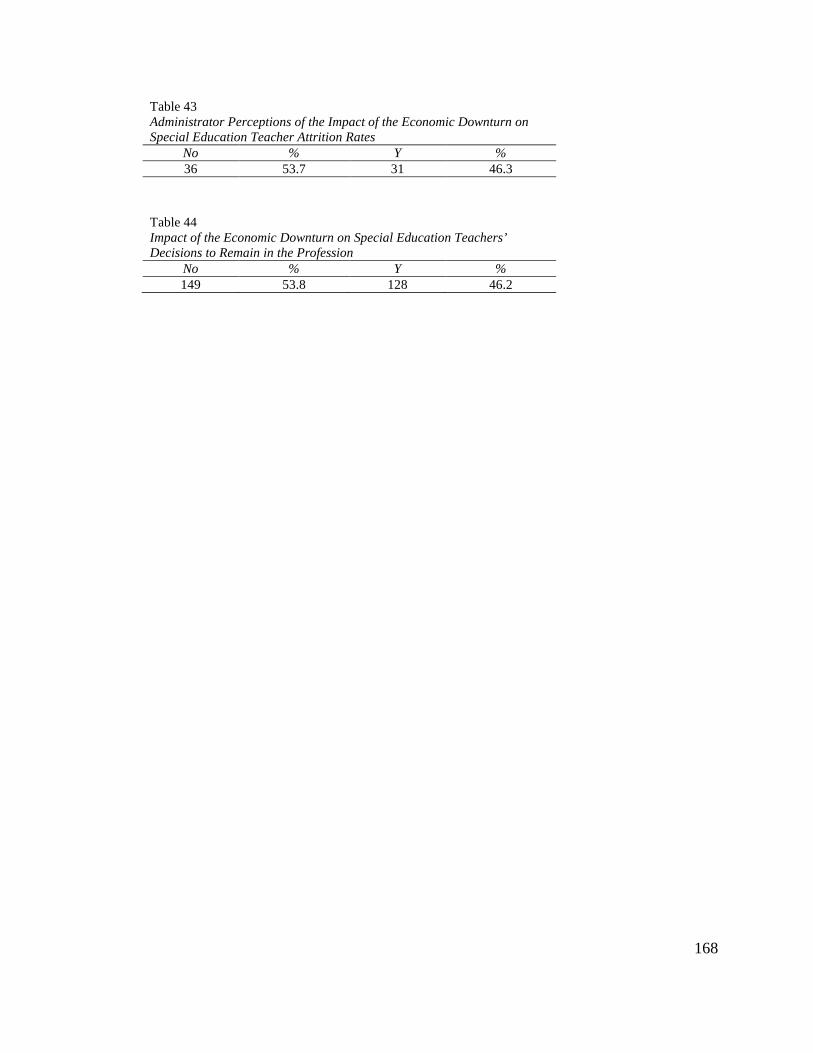
168
Table 43 Administrator Perceptions of the Impact of the Economic Downturn on Special Education Teacher Attrition Rates
No % Y % 36 53.7 31 46.3
Table 44 Impact of the Economic Downturn on Special Education Teachers’ Decisions to Remain in the Profession
No % Y % 149 53.8 128 46.2