Embed Size (px)
Citation preview
A RepoRtto the
MontAnALegisLAtuRe
LegisLAtive Auditdivision
18P-08
peRfoRMAnce Audit
June 2020
A Comparative Evaluation of State-Operated and
Contracted Men’s PrisonsDepartment of Corrections
Legislative AuditCommittee
RepresentativesKim Abbott
[email protected] Bartel
[email protected] Burnett
[email protected] Hayman, Vice Chair
[email protected] Kerr-Carpenter
[email protected] Regier
SenatorsDee Brown, [email protected] Ellsworth
[email protected] Flowers
[email protected] Jacobson
[email protected] McNally
Members serve until a member’s legislative term of office ends or until a successor is appointed,
whichever occurs first.
§5-13-202(2), MCA
Fraud Hotline(Statewide)
1-800-222-4446(in Helena)
www.montanafraud.gov
Audit StaffAmber Robbins James Sutcliffe
Reports can be found in electronic format at:https://leg.mt.gov/lad/audit-reports
Performance AuditsPerformance audits conducted by the Legislative Audit Division are designed to assess state government operations. From the audit work, a determination is made as to whether agencies and programs are accomplishing their purposes, and whether they can do so with greater efficiency and economy.
We conducted this performance audit in accordance with generally accepted government auditing standards. Those standards require that we plan and perform the audit to obtain sufficient, appropriate evidence to provide a reasonable basis for our findings and conclusions based on our audit objectives. We believe that the evidence obtained provides a reasonable basis for our findings and conclusions based on our audit objectives. Members of the performance audit staff hold degrees in disciplines appropriate to the audit process.
Performance audits are conducted at the request of the Legislative Audit Committee, which is a bicameral and bipartisan standing committee of the Montana Legislature. The committee consists of six members of the Senate and six members of the House of Representatives.
LEGISLATIVE AUDIT DIVISION Angus Maciver, Legislative Auditor Deputy Legislative Auditors:Deborah F. Butler, Legal Counsel Cindy Jorgenson Joe Murray
Room 160 • State Capitol Building • PO Box 201705 • Helena, MT • 59620-1705Phone (406) 444-3122 • FAX (406) 444-9784 • E-Mail [email protected]
June 2020
The Legislative Audit Committeeof the Montana State Legislature:
This is our performance audit comparing the Montana State Prison and contract prisons, managed by the Secure Custody Facilities Division of the Department of Corrections.
This report provides the Legislature information about the operations and outcomes of the state’s prison system for male offenders. Our comparative evaluation of recidivism shows no significant differences in outcomes based on how much time offenders spent in state-operated versus contracted prisons. This report includes recommendations for enhancing the comparison of prison data and implementing improved offender placement functionality in the department’s information management system. It also discusses improvements in transferring inmates between prisons and discusses future considerations for the prison system. A written response from the Department of Corrections is included at the end of the report.
We wish to express our appreciation to Department of Corrections personnel for their cooperation and assistance during the audit.
Respectfully submitted,
/s/ Angus Maciver
Angus MaciverLegislative Auditor

Table of ContentsFigures and Tables ....................................................................................................................iiiAppointed and Administrative Officials .................................................................................. ivReport Summary ...................................................................................................................S-1
CHAPTER I – INTRODUCTION ��������������������������������������������������������������������������������������������������������������1Introduction ..............................................................................................................................1Contract Prisons Authorized by the 1995 and 1997 Legislatures ..............................................2
Private Prisons Are Common and Controversial Nationwide ...........................................2Benefits and Drawbacks of Montana’s Use of Contract Prisons ........................................3Audit Objectives ...............................................................................................................5
Audit Scope ...............................................................................................................................5Audit Methodologies .................................................................................................................6Issue for Further Study ..............................................................................................................7Report Contents ........................................................................................................................7
CHAPTER II – COMPARING INDICATORS OF PRISON PERFORMANCE ������������������������������������9Introduction ..............................................................................................................................9Rates of Grievances and Their Resolution Differed Across Prisons...........................................9
The Grievance Process Has Appeals Opportunities ..........................................................9Per Inmate Grievances and Their Outcomes .................................................................10Appeal Outcomes Also Differ Among Prisons ................................................................13
Rates and Types of Disciplinary Actions Differed Across Prisons ...........................................14Rates of Minor to Major Disciplinary Actions and Detention Days Vary ......................16
Access to High School Equivalent Education and Work Assignments Vary ...........................17Work Assignment Opportunity Comparisons ................................................................18
Visitation Rates Were Similar Across Prisons ..........................................................................19We Surveyed Former Inmates Regarding Prison Quality .......................................................20
Offenders’ Responses Indicated Clear Differences in Quality ........................................21Respondents’ Comments Underscored Ratings .............................................................23
More Rigorous Comparison of Prisons by the Department Is Warranted ..............................23Some Inequality Cannot Easily Be Remedied .................................................................23Department Uses Compliance-Oriented Approach ........................................................24
CHAPTER III – COMPARING RECIDIVISM RATES �������������������������������������������������������������������������27Introduction ............................................................................................................................27Comparing Daily Costs of Men’s Prisons ...............................................................................27
Medical Costs Drive MSP’s Costs ...................................................................................28Other Factors Do Not Significantly Affect Relative Costs of Prisons .....................................30
Comparing Costs Is Complicated by Variable Services and Economies of Scale ............31Recidivism Rate and Time-to-Parole Analysis ........................................................................31
The Department Does Not Compare Recidivism Rates Across Prisons .........................32We Identified Similar Groups of Offenders From Different Prisons ...............................33We Did Not Detect a Significant Difference in Recidivism Rates Across Prisons ..........34Analysis Did Not Provide Evidence Contract Prisons Delay Parole ................................35
CHAPTER IV – THE INMATE TRANSFER PROCESS ������������������������������������������������������������������������39Introduction ............................................................................................................................39Inmates Are Frequently Transferred Between Prisons .............................................................39
i
18P-08
Frequent Transfers Did Not Appear to Affect Recidivism ......................................................40The Future of the Men’s Prison System ...................................................................................42
The Costs of Transferring Offenders ..............................................................................42The Male Prison Population Has Continued to Increase ................................................42The State Does Not Have a Long-Term Plan for the Men’s Prison System .....................43Other States Struggle With Similar Issues ......................................................................44
The Offender Transfer Process Can Be Improved ..................................................................45The Transfer Process Can Result in Inappropriate Inmate Transfers ..............................45Inmates Are Transferred to Other Prisons for Many Reasons .........................................46The Reasons Inmates Are Transferred Are Not in OMIS ..............................................47Reasons for Transfer Are Not Always Recorded ..............................................................47OMIS Placement Module Would Reduce Risk of Inappropriate Inmate Placement ......48
DEPARTMENT RESPONSEDepartment of Corrections ................................................................................................... A-1
Montana Legislative Audit Divisionii
Figures and TablesFigures
Figure 1 Percentage of Grievance Outcomes at Men’s Prisons ...........................................................12
Figure 2 Annual Rates of Major and Minor Infractions Per Inmate .................................................. 16
Figure 3 Former Inmates’ Average Ratings for Prison Quality ........................................................... 21
Figure 4 MSP Cost Per Inmate Per Day, Adjusting for Healthcare Costs ..........................................29
Figure 5 MSP Population vs. Cost Per Inmate Per Day .....................................................................30
Figure 6 Rates of Recidivism for MSP vs. Contract Prisons ...............................................................34
Figure 7 Time to Release After Parole Eligibility ...............................................................................36
Figure 8 Annual Inmate Transfers Relative to Total Inmate Population ............................................40
Figure 9 Offenders Not Transferred vs. Transferred Offenders Recidivism Rates .............................. 41
Figure 10 Male Inmate Population Trends ...........................................................................................43
Tables
Table 1 Programs Offered and Populations Housed at Each Institution ............................................4
Table 2 Average Annual Grievances by Category Per Hundred Inmates ...........................................11
Table 3 Rates of Disciplinary Infractions by Prison .......................................................................... 15
Table 4 Educational Attainment by Facility ..................................................................................... 18
Table 5 Offenders With Work Assignments as of December 2019 ................................................... 19
Table 6 Former Inmate’s Ratings of Prisons by Measure of Quality .................................................22
Table 7 Cost Per Inmate Per Day ...................................................................................................... 27
Table 8 Fiscal Year 2019 Prison Cost Per Day Analysis ....................................................................28
iii
18P-08
Appointed and Administrative Officials
Department of Corrections
Director’s Office
Reginald Michael, DirectorCynthia Wolken, Deputy DirectorKurt Aughney, Quality Assurance Office DirectorColleen Ambrose, Legal Services Bureau Chief
Montana State Prison, Secure Custody Facilities Division
Lynn Guyer, WardenPatrick Smith, Deputy WardenHeidi Crowe, Contract Placement Bureau Chief (Acting)
Administrative Services Division
John Daugherty, AdministratorJonathan Straughn, Computer Information Systems Manager
iv Montana Legislative Audit Division
(continued on back)
Montana LegisLative audit division
A Comparative Evaluation of State- Operated and Contracted Men’s Prisons
Montana DepartMent of CorreCtions
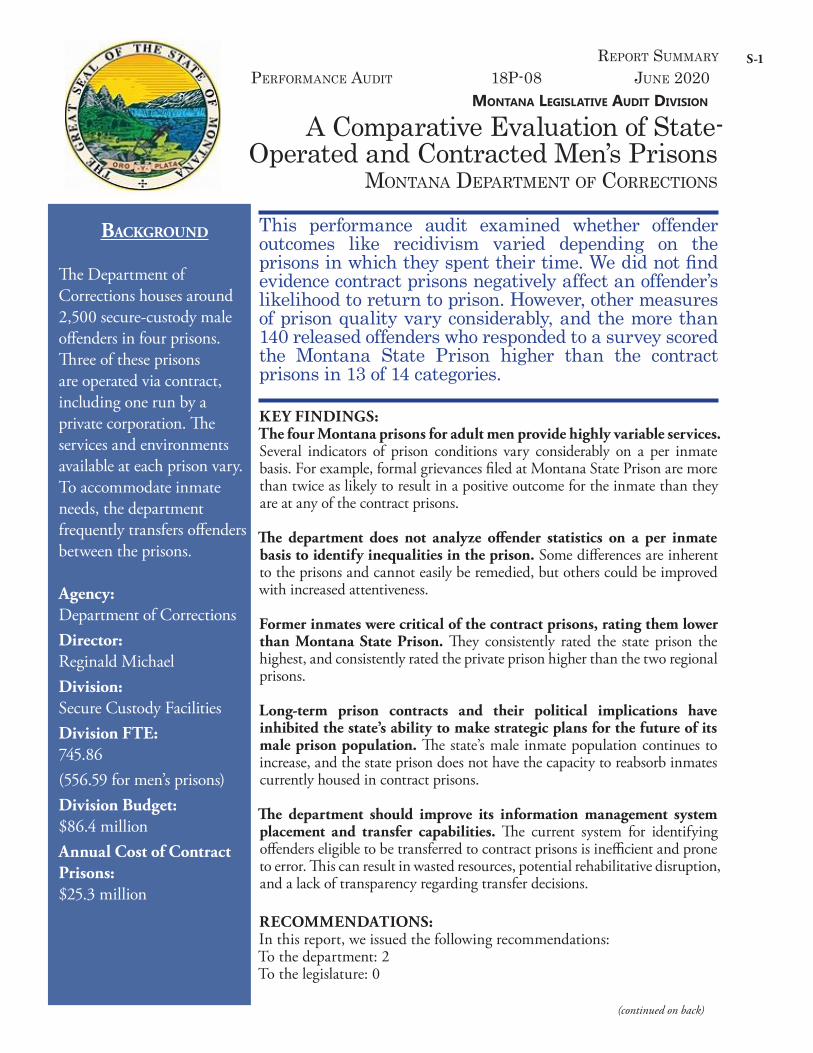
report suMMary
KEY FINDINGS: The four Montana prisons for adult men provide highly variable services� Several indicators of prison conditions vary considerably on a per inmate basis. For example, formal grievances filed at Montana State Prison are more than twice as likely to result in a positive outcome for the inmate than they are at any of the contract prisons.
The department does not analyze offender statistics on a per inmate basis to identify inequalities in the prison� Some differences are inherent to the prisons and cannot easily be remedied, but others could be improved with increased attentiveness.
Former inmates were critical of the contract prisons, rating them lower than Montana State Prison� They consistently rated the state prison the highest, and consistently rated the private prison higher than the two regional prisons.
Long-term prison contracts and their political implications have inhibited the state’s ability to make strategic plans for the future of its male prison population� The state’s male inmate population continues to increase, and the state prison does not have the capacity to reabsorb inmates currently housed in contract prisons.
The department should improve its information management system placement and transfer capabilities� The current system for identifying offenders eligible to be transferred to contract prisons is inefficient and prone to error. This can result in wasted resources, potential rehabilitative disruption, and a lack of transparency regarding transfer decisions.
RECOMMENDATIONS:In this report, we issued the following recommendations:To the department: 2To the legislature: 0
perforManCe auDit 18p-08 June 2020
Background
The Department of Corrections houses around 2,500 secure-custody male offenders in four prisons. Three of these prisons are operated via contract, including one run by a private corporation. The services and environments available at each prison vary. To accommodate inmate needs, the department frequently transfers offenders between the prisons.
Agency: Department of CorrectionsDirector:Reginald MichaelDivision: Secure Custody Facilities Division FTE: 745.86 (556.59 for men’s prisons)Division Budget: $86.4 millionAnnual Cost of Contract Prisons: $25.3 million
This performance audit examined whether offender outcomes like recidivism varied depending on the prisons in which they spent their time. We did not find evidence contract prisons negatively affect an offender’s likelihood to return to prison. However, other measures of prison quality vary considerably, and the more than 140 released offenders who responded to a survey scored the Montana State Prison higher than the contract prisons in 13 of 14 categories.
S-1
For the full report or more information, contact the Legislative Audit Division.
leg.mt.gov/lad
Room 160, State CapitolPO Box 201705Helena, Montana 59620(406) 444-3122
The mission of the Legislative Audit Division is to increase public trust in state government by reporting timely and accurate information about agency operations, technology, and finances to the Legislature and the citizens of Montana.
To report fraud, waste, or abuse:
Onlinewww.Montanafraud.gov
Call (Statewide)(800)-222-4446 or(Helena)(406)-444-4446
Text (704) 430-3930
recommendation #1 (page 25):Comparing measures of prison qualityThe department should regularly compare the contract prisons to Montana State Prison and to each other using several measures of prison condition and performance on a per-inmate basis. Department response: Concur
recommendation #2 (page 48):Managing inmate prison-to-prison transfersThe department should implement a population placement module in its offender management information system to better enable appropriate placement of male offenders and to improve operational efficiency and transparency.Department response: Concur
S-2
Chapter I – Introduction
IntroductionThe Montana Department of Corrections (department) is responsible for the secure custody of adult offenders. Historically, it has housed male inmates at the Montana State Prison (MSP) in Deer Lodge. However, the department began housing some male inmates in contract prisons in the 1990s due to prison overcrowding at MSP. The Secure Custody Facilities Division (division) is responsible for all adult male inmates, including those in contract facilities. Contract prisons include a privately owned and operated prison and two regional prisons run through contracts with local governments, Cascade and Dawson counties. The warden of MSP administers the state prison, the staff who manage the prison contracts, and the entire adult male prison population. All male inmates go through an intake process at MSP, where they are classified for risk and custody level and are then placed at one of the four prisons.
In 2015, the Legislative Audit Division conducted a performance audit of the private prison, entitled Oversight of Crossroads Correctional Center (15P-03). That audit focused on conditions at the private prison and department processes for monitoring contract compliance. It did not compare the private prison to MSP. The private prison’s contract has been a contentious topic over the past several years, drawing significant legislative interest. A legislator formally requested the Legislative Audit Committee to prioritize a performance audit comparing the private prison to MSP. The Legislative Audit Committee subsequently voted to undertake the evaluation.
During our audit planning work, we determined a comparison would not be complete without including the two county-run regional prisons. For our audit, we compared the four men’s prisons and evaluated how the department makes use of them. One of the department’s missions is to promote positive change in offender behavior, and one of its goals is to increase public safety by reducing recidivism. Recidivism is defined by the department as an offender’s return to prison within three years for any reason after having been released. Our comparative evaluation considered the effectiveness of the prisons toward these ends. We found considerable variation between the prisons’ measures of performance. However, our work did not find evidence that spending time in the contract prisons affects offender outcomes like recidivism. Because the prisons vary in size, services, and inmate populations, the department frequently transfers male inmates between the four prisons. Accordingly, we assessed the male inmate transfer process as part of this audit. This chapter briefly discusses the history of the contract prisons, the benefits and drawbacks of contracting for prison services, and how the contract prisons are used.
1
18P-08
Contract Prisons Authorized by the 1995 and 1997 LegislaturesThe use of private prisons was authorized by the legislature in 1997 to address prison overcrowding and to provide cost-effective solutions for housing inmates. In 1998, a 20-year contract was awarded to a for-profit prison contractor for the construction and operation of Crossroads Correctional Center (CCC) in Shelby. The facility was opened in August, 1999 and continues to be operated by the same contractor. The original operations contract, which has been amended 16 times, expired in 2019. The state retained the right to purchase the facility from the contractor at the conclusion of the contract. Alternatively, the contract could be extended for a maximum of two additional five-year terms before a new request for proposal would be required. In 2018, the governor’s office extended the contract to 2021, when it will be eligible for renewal again. This contract renegotiation included the return to the state of $30 million of state funds that had been paid to the contractor to be used toward the possible future purchase of the prison. These funds were eventually all deposited in the state’s fire suppression fund. The state-inmate capacity of CCC is around 600 inmates. The prison also houses federal inmates through a separate contract with the U.S. Marshals Service, in a segregated wing.
Two much smaller contracted regional correctional facilities were precursors to the private prison, having been authorized in 1995 and commencing operation in 1998. These county-run prisons were also developed as a means of providing cost-sensitive increases in inmate capacity. The two regional prisons are Dawson County Correctional Facility (DCCF) in Glendive, and Cascade County Regional Prison (CCRP, also sometimes called Great Falls Regional Prison or GFRP) in Great Falls. These contracts expire in 2029 and 2024, respectively. Combined, the two prisons house around 295 state inmates, and offer more limited facilities and services than the two larger prisons. Each regional prison shares segregated space with its respective county jail.
Private Prisons Are Common and Controversial NationwideContracting with private corporations for prison operations has become a common and controversial practice nationwide over the last three decades. Proponents of private prisons argue that the private sector can innovate effective and rehabilitative incarceration methods, while being driven to minimize costs. Opponents of private prisons argue that it is ethically problematic to have profit motives involved in the administration of the state’s criminal justice system, and that privatization can lead to perverse incentives, reducing effectiveness and distorting justice. Such an ideological debate is beyond the purview of the Legislative Audit Division, and it was not our intent to issue findings related to the merits of either prison model. Rather, we compared the
2 Montana Legislative Audit Division
performance of men’s prisons in Montana to provide practical information that can improve the prison system.
Benefits and Drawbacks of Montana’s Use of Contract PrisonsThe state’s use of contract prisons has both benefits and disadvantages. Some of the advantages of the use of contract prisons include the state’s ability to defer capital expenditures on new or expanded prison facilities, the ability to provide prison space through competitive bidding, and the flexibility to react to changing population needs.
Because private prison companies are national or international, they can more readily shoulder capital expenses and staffing demands. The contract with the private prison contractor includes minimum staffing level requirements. When the private prison has difficulty recruiting and retaining local staff in Shelby, it can transfer staff from its other prisons to Shelby for temporary employment. These temporary staffing arrangements typically range from 90 days to 6 months. This helps to keep staffing at the required level at the private prison. Additionally, because the private prison was built more recently than MSP, department staff report that its more advanced design allows it to be more efficiently staffed.
Meanwhile, MSP has experienced severe staffing shortages. According to department staff, there have been challenges in recruiting and retaining enough correctional officers to run the prison at maximum operation. As of November 2019, MSP had 38 vacant positions out of 256 correctional officer FTEs (15 percent), up from 11 vacant correctional officer positions at the start of 2018. Because of this staffing shortage, MSP reduced inmate visitation in recent years. Lack of enough correctional officers also presents serious safety risks, as the ratio of inmates to correctional officers increases. While staffing issues persist at MSP, staffing is reportedly an industry-wide problem, and has also affected the contract prisons.
One concern regarding contract prisons is less direct management of inmates by the department. While each facility has a department-employed contract monitor, the state has less direct control over the inmates placed in contract facilities. Contract prisons also do not provide the same level of services as MSP. Because the contracts were negotiated with an aim of controlling costs, contract facilities were not designed to provide the same level of medical care, programming, recreation, education, paid work assignments, and re-entry training as the state prison does. Table 1 (see page 4) illustrates the various offender populations served and examples of services offered at each facility.
3
18P-08
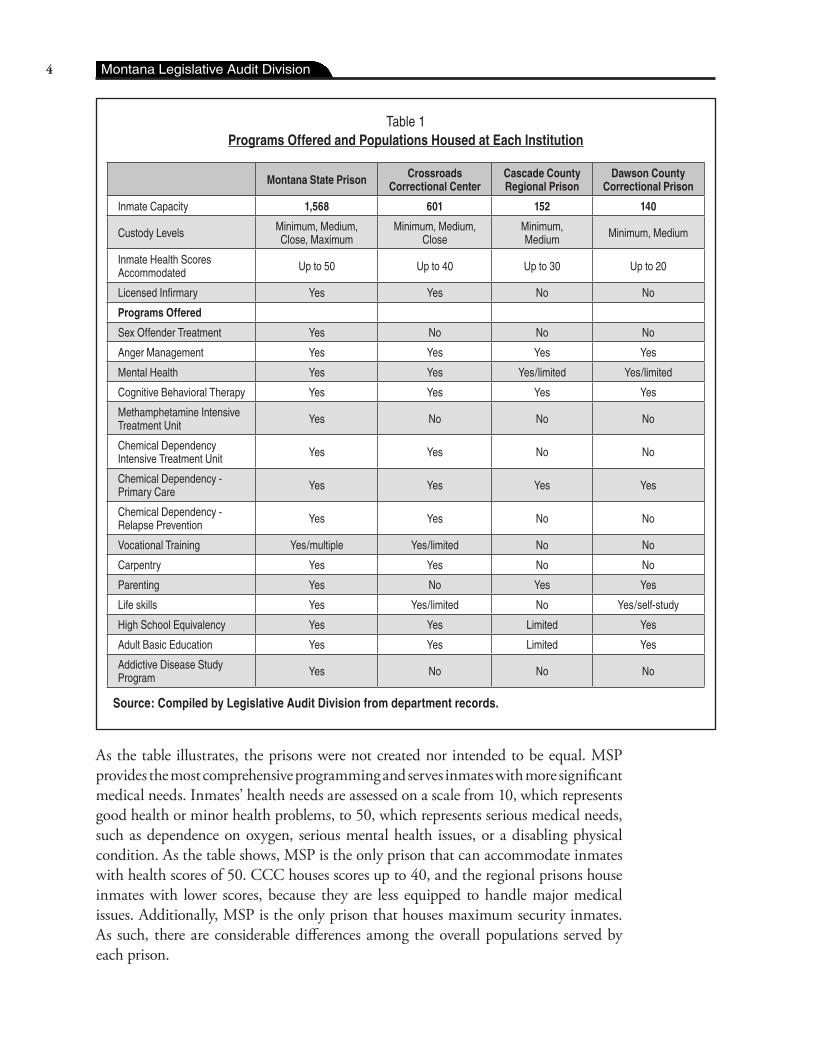
Table 1Programs Offered and Populations Housed at Each Institution
Montana State Prison Crossroads Correctional Center
Cascade County Regional Prison
Dawson County Correctional Prison
Inmate Capacity 1,568 601 152 140
Custody Levels Minimum, Medium, Close, Maximum
Minimum, Medium, Close
Minimum, Medium Minimum, Medium
Inmate Health Scores Accommodated Up to 50 Up to 40 Up to 30 Up to 20
Licensed Infirmary Yes Yes No No
Programs Offered
Sex Offender Treatment Yes No No No
Anger Management Yes Yes Yes Yes
Mental Health Yes Yes Yes/limited Yes/limited
Cognitive Behavioral Therapy Yes Yes Yes Yes
Methamphetamine Intensive Treatment Unit Yes No No No
Chemical Dependency Intensive Treatment Unit Yes Yes No No
Chemical Dependency - Primary Care Yes Yes Yes Yes
Chemical Dependency - Relapse Prevention Yes Yes No No
Vocational Training Yes/multiple Yes/limited No No
Carpentry Yes Yes No No
Parenting Yes No Yes Yes
Life skills Yes Yes/limited No Yes/self-study
High School Equivalency Yes Yes Limited Yes
Adult Basic Education Yes Yes Limited Yes
Addictive Disease Study Program Yes No No No
Source: Compiled by Legislative Audit Division from department records.
As the table illustrates, the prisons were not created nor intended to be equal. MSP provides the most comprehensive programming and serves inmates with more significant medical needs. Inmates’ health needs are assessed on a scale from 10, which represents good health or minor health problems, to 50, which represents serious medical needs, such as dependence on oxygen, serious mental health issues, or a disabling physical condition. As the table shows, MSP is the only prison that can accommodate inmates with health scores of 50. CCC houses scores up to 40, and the regional prisons house inmates with lower scores, because they are less equipped to handle major medical issues. Additionally, MSP is the only prison that houses maximum security inmates. As such, there are considerable differences among the overall populations served by each prison.
4 Montana Legislative Audit Division
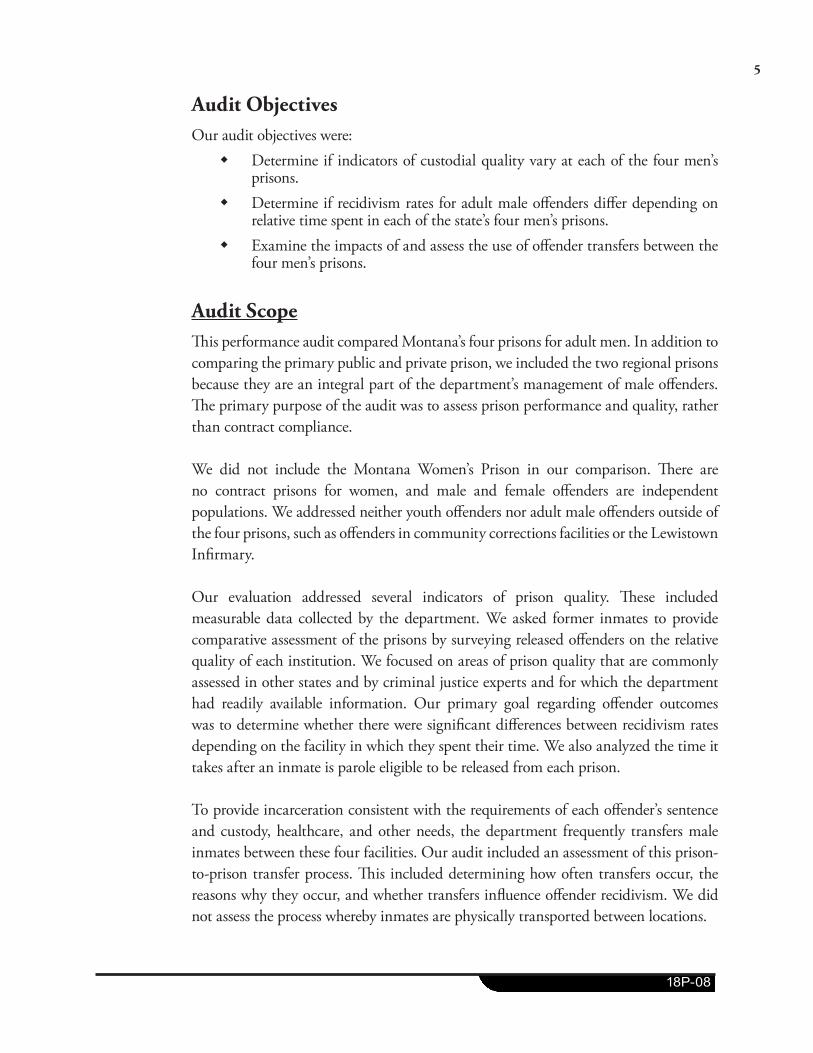
Audit Objectives Our audit objectives were:
� Determine if indicators of custodial quality vary at each of the four men’s prisons.
� Determine if recidivism rates for adult male offenders differ depending on relative time spent in each of the state’s four men’s prisons.
� Examine the impacts of and assess the use of offender transfers between the four men’s prisons.
Audit ScopeThis performance audit compared Montana’s four prisons for adult men. In addition to comparing the primary public and private prison, we included the two regional prisons because they are an integral part of the department’s management of male offenders. The primary purpose of the audit was to assess prison performance and quality, rather than contract compliance.
We did not include the Montana Women’s Prison in our comparison. There are no contract prisons for women, and male and female offenders are independent populations. We addressed neither youth offenders nor adult male offenders outside of the four prisons, such as offenders in community corrections facilities or the Lewistown Infirmary.
Our evaluation addressed several indicators of prison quality. These included measurable data collected by the department. We asked former inmates to provide comparative assessment of the prisons by surveying released offenders on the relative quality of each institution. We focused on areas of prison quality that are commonly assessed in other states and by criminal justice experts and for which the department had readily available information. Our primary goal regarding offender outcomes was to determine whether there were significant differences between recidivism rates depending on the facility in which they spent their time. We also analyzed the time it takes after an inmate is parole eligible to be released from each prison.
To provide incarceration consistent with the requirements of each offender’s sentence and custody, healthcare, and other needs, the department frequently transfers male inmates between these four facilities. Our audit included an assessment of this prison-to-prison transfer process. This included determining how often transfers occur, the reasons why they occur, and whether transfers influence offender recidivism. We did not assess the process whereby inmates are physically transported between locations.
5
18P-08
Time frames in our scope varied by methodology. For the analysis of recidivism rates and other outcomes, we used data on offenders released from prison between January 2012 and December 2015, allowing us to assess whether they returned to prison between 2012 and 2018. Most other methodologies focused on periods between 2015 and 2019.
Throughout the report, we refer to both “offenders” and “inmates.” “Inmates” are offenders who are in prison, whereas the term “offender” does not indicate the location of the individual. However, these terms are largely interchangeable.
Audit Methodologies � Reviewed laws, rules, contracts, and department policies and procedures. � Researched methods and best practices used by other states and government
entities. � Compared the grievance and grievance resolution rates of each facility. � Assessed the relative rates and severity of disciplinary actions taken against
inmates of each facility. � Compared work assignment, educational attainment, and visitation rates at
each institution. � Conducted a mail survey of over 1,000 former inmates of multiple Montana
prisons to obtain their opinions on relative prison quality. � Analyzed recidivism rates based on the prisons where offenders spent their
time. � Analyzed time-to-release based on the prisons where offenders spent their
time and had their first parole hearing. � Analyzed the effects of being transferred between prisons on parole. � Assessed the department’s process for placing and transferring inmates and
reviewed a sample of department records related to inmate transfers. � Interviewed department staff on the conditions of each prison and the
department’s use of the prisons. � Compiled data on the department’s male population trends, number of
transfers, and reasons for transfer. � Analyzed the costs of each facility. � Interviewed stakeholders, including contract facility administrators, to learn
about transfer practices, relations with the state, and variability of prison settings.
6 Montana Legislative Audit Division
Issue for Further StudyPrison grievances are a formal mechanism that inmates may use to seek redress for complaints. Federal law requires state departments of corrections to provide a grievance system to inmates, in part because inmates must exhaust the process before they can legally file a lawsuit against the state. Department staff report that the grievance process also promotes the development of pro-social skills for inmates. This audit compared the rates of grievances and grievance outcomes at each of the four men’s prisons. However, an assessment of the grievance process as a whole and whether it provides inmates with effective redress of their concerns was outside of this audit’s scope. In our survey of former inmates, discussed in Chapter II, respondents who had experience with both MSP and CCC rated the grievance process the lowest of the 14 measures of quality we asked about for those prisons. Many respondents also commented that they did not have faith in the grievance system. A performance audit of the department’s grievance system could assess the timeliness and consistency of responses across all state prisons. It could also determine if legitimate inmate complaints are appropriately redressed.
Report ContentsThe remainder of this report includes additional background and details on our findings, conclusions, and recommendations. It is organized into three additional chapters:
� Chapter II presents information on comparative measures of prison quality at each of the four men’s prisons. These measures include grievances and their resolution, visitation, disciplinary actions, and educational attainment. We also exhibit the results of the survey we mailed to former inmates to obtain their positions on relative prison quality. It contains a recommendation to more systematically compare the four institutions on a per capita basis to ensure consistency.
� Chapter III discusses our comparison of recidivism rates and time-to-parole for male offenders depending on the prisons where they were incarcerated. It also includes analysis of comparative cost information.
� Chapter IV describes our work assessing the department’s use of offender transfers between correctional facilities. It discusses the frequency of and reasons for transfer between the four prisons. The chapter concludes with our recommendation to implement inmate placement functionality in the department’s offender management information system.
7
18P-08

8
Chapter II – Comparing Indicators of Prison Performance
IntroductionSome criminal justice experts claim prisons are best measured by their internal conditions, rather than their outcomes like recidivism, which occur outside of the prisons’ walls. These internal conditions include measures of prison safety and security, inmate well-being, and factors that contribute to rehabilitation. In addition to assessing prison outcomes, we analyzed several measures of these internal measures. In this chapter, we discuss our audit objective related to comparing measures of quality and performance of the four men’s prisons. There are differences between the prisons’ designs, scales, capabilities, and served offender populations. We compared several measures of prison quality, including rates of visitation, grievances, disciplinary actions, and educational attainment. We found that indicators of custodial quality vary between the institutions. This work was reinforced by the opinions of offenders we surveyed who spent time in multiple facilities. We begin with a discussion of inmate grievances.
Rates of Grievances and Their Resolution Differed Across PrisonsOne measure of prison quality we examined was the rate of grievances. The grievance process is a federally-mandated right of inmates to redress wrongs they have endured. For example, inmates can file a grievance if they believe they have been mistreated by staff or if they feel their religious rights have been violated. The Department of Corrections (department) tracks all grievances at each facility. Each prison has grievance coordinators who administer the process and resolve grievances by responding to them. Grievance coordinators at Montana State Prison (MSP) are department staff. At contract prisons, they are contractor staff. Contract monitors review grievances and outcomes at the contract prisons. Some subjects cannot be grieved. Examples include actions taken by external entities such as the Sentence Review Board and Board of Pardons and Parole. Additionally, classification and disciplinary decisions may not be grieved, as they each have their own appeals process.
The Grievance Process Has Appeals OpportunitiesThere is a chain of appeals with specific timelines for standard grievances defined in department policy. A facility’s grievance coordinator collects and reviews all grievances at least weekly and responds to the offender. If the grievance is denied, the inmate can appeal to the facility’s warden. If denied again, he can appeal to the department director. The possible outcomes for grievances are:
9
18P-08
� Not processed, because the grievance should not have been filed per department policy,
� Denied, for being unfounded, � Partially granted, when some but not all the inmate’s request is granted, and � Fully granted.
The department collects and publicly publishes descriptive statistics on grievances at all its facilities annually. This analysis is used to detect and describe trends in offender concerns and has been presented to the legislature. Department staff report that they use monthly grievance data to try to identify trends in inmate frustrations and morale, especially regarding new prison policies or practices.
Per Inmate Grievances and Their Outcomes The department’s analysis of grievances does not include a per inmate comparison of grievance rates, subjects grieved, or grievance outcomes at each facility. As part of audit work, we analyzed grievance data for fiscal years 2016, 2017, and 2018. We found there were differences between the rates of grievances and grievance outcomes across prisons. Table 2 (see page 11) shows the rates of each type of grievance per hundred inmates at each facility. The information at the right of the table shows the frequencies of reasons why some grievances were not processed. Lower rates are greener, higher rates are redder, and rates in the middle are yellow.
10 Montana Legislative Audit Division
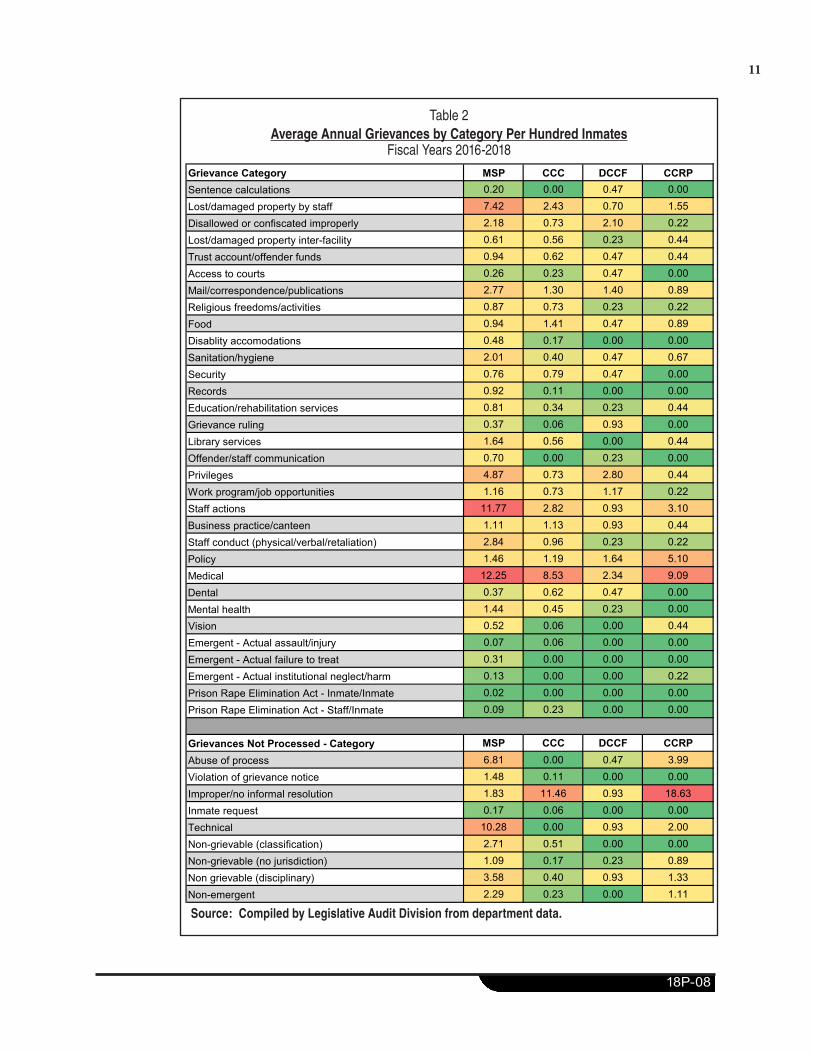
Table 2Average Annual Grievances by Category Per Hundred Inmates
Fiscal Years 2016-2018
Grievance Category MSP CCC DCCF CCRPSentence calculations 0.20 0.00 0.47 0.00Lost/damaged property by staff 7.42 2.43 0.70 1.55Disallowed or confiscated improperly 2.18 0.73 2.10 0.22Lost/damaged property inter-facility 0.61 0.56 0.23 0.44Trust account/offender funds 0.94 0.62 0.47 0.44Access to courts 0.26 0.23 0.47 0.00Mail/correspondence/publications 2.77 1.30 1.40 0.89Religious freedoms/activities 0.87 0.73 0.23 0.22Food 0.94 1.41 0.47 0.89Disablity accomodations 0.48 0.17 0.00 0.00Sanitation/hygiene 2.01 0.40 0.47 0.67Security 0.76 0.79 0.47 0.00Records 0.92 0.11 0.00 0.00Education/rehabilitation services 0.81 0.34 0.23 0.44Grievance ruling 0.37 0.06 0.93 0.00Library services 1.64 0.56 0.00 0.44Offender/staff communication 0.70 0.00 0.23 0.00Privileges 4.87 0.73 2.80 0.44Work program/job opportunities 1.16 0.73 1.17 0.22Staff actions 11.77 2.82 0.93 3.10Business practice/canteen 1.11 1.13 0.93 0.44Staff conduct (physical/verbal/retaliation) 2.84 0.96 0.23 0.22Policy 1.46 1.19 1.64 5.10Medical 12.25 8.53 2.34 9.09Dental 0.37 0.62 0.47 0.00Mental health 1.44 0.45 0.23 0.00Vision 0.52 0.06 0.00 0.44Emergent - Actual assault/injury 0.07 0.06 0.00 0.00Emergent - Actual failure to treat 0.31 0.00 0.00 0.00Emergent - Actual institutional neglect/harm 0.13 0.00 0.00 0.22Prison Rape Elimination Act - Inmate/Inmate 0.02 0.00 0.00 0.00Prison Rape Elimination Act - Staff/Inmate 0.09 0.23 0.00 0.00
Grievances Not Processed - Category MSP CCC DCCF CCRPAbuse of process 6.81 0.00 0.47 3.99Violation of grievance notice 1.48 0.11 0.00 0.00Improper/no informal resolution 1.83 11.46 0.93 18.63Inmate request 0.17 0.06 0.00 0.00Technical 10.28 0.00 0.93 2.00Non-grievable (classification) 2.71 0.51 0.00 0.00Non-grievable (no jurisdiction) 1.09 0.17 0.23 0.89Non grievable (disciplinary) 3.58 0.40 0.93 1.33Non-emergent 2.29 0.23 0.00 1.11
Average Annual Grievances By Category Per Hundred Inmates, Fiscal Years 2016-2018
Source: Compiled by Legislative Audit Division from department data.
11
18P-08
As Table 2 (see page 11) illustrates, most categories were more frequently grieved at MSP than at the contract prisons. However, some of these categories should be considered in context. For example, there were more medical grievances per inmate at MSP than at contract prisons. Since most inmates with chronic health issues are housed at MSP, this was expected. These data should not be interpreted to mean that the contract prisons provide better healthcare services. The bottom of Table 2 (see page 11) shows that rates for unprocessed grievances, and the reasons for being processed, also vary from prison to prison.
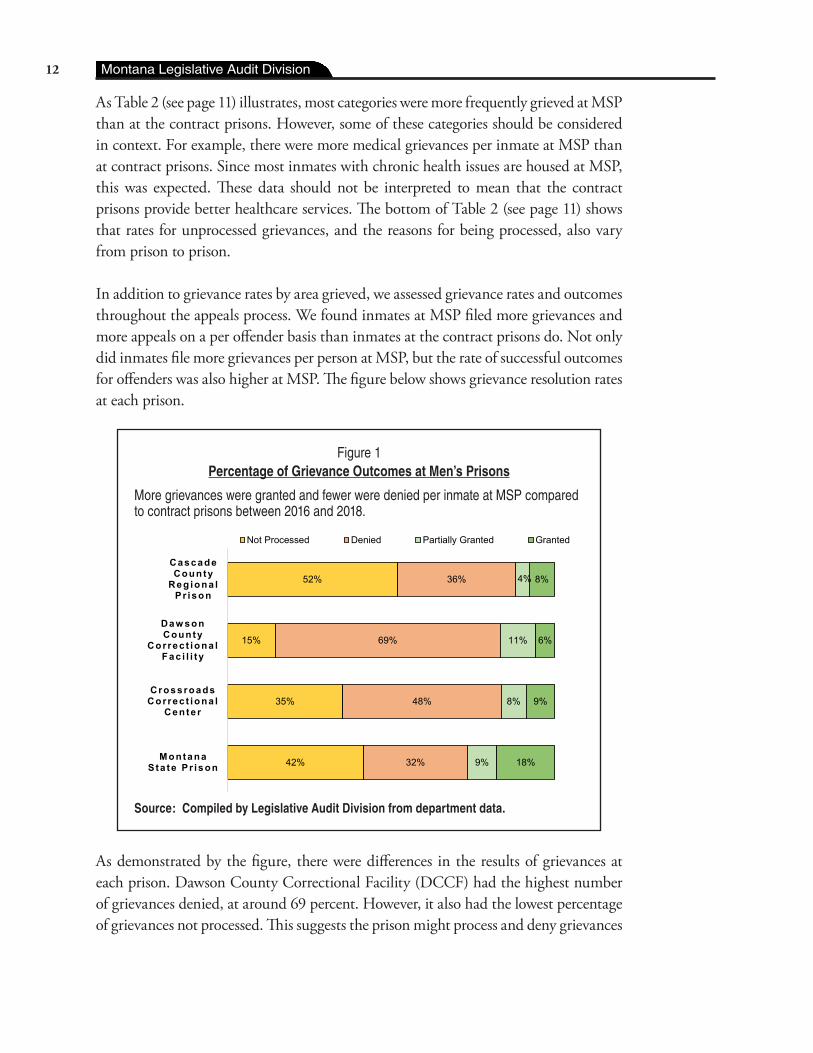
In addition to grievance rates by area grieved, we assessed grievance rates and outcomes throughout the appeals process. We found inmates at MSP filed more grievances and more appeals on a per offender basis than inmates at the contract prisons do. Not only did inmates file more grievances per person at MSP, but the rate of successful outcomes for offenders was also higher at MSP. The figure below shows grievance resolution rates at each prison.
Figure 1Percentage of Grievance Outcomes at Men’s Prisons
More grievances were granted and fewer were denied per inmate at MSP compared to contract prisons between 2016 and 2018.
Source: Compiled by Legislative Audit Division from department data.
42%
35%
15%
52%
32%
48%
69%
36%
9%
8%
11%
4%
18%
9%
6%
8%
M ontana S ta te Pr ison
Crossroads Correc t iona l
Cente r
Daw son County
Correc t iona l Fac i l i t y
Cascade County
Reg iona l Pr ison
Not Processed Denied Partially Granted Granted
Source: Compiled by Legislative Audit Division from department data.
As demonstrated by the figure, there were differences in the results of grievances at each prison. Dawson County Correctional Facility (DCCF) had the highest number of grievances denied, at around 69 percent. However, it also had the lowest percentage of grievances not processed. This suggests the prison might process and deny grievances
12 Montana Legislative Audit Division
other facilities refuse to process, or that the facility does a better job educating inmates about ineligible grievance subjects. Most importantly, MSP had the highest rate of grievances granted or partially granted, at nearly 27 percent. Meanwhile, the highest rate amongst the contract prisons was 17 percent at DCCF, ten percentage points lower than MSP’s rate. CCRP granted or partially granted only 12 percent of grievances.
Appeal Outcomes Also Differ Among PrisonsWe also analyzed the outcomes of grievance appeals to the warden and department director. We found that MSP grievances were both more frequently appealed to the warden and department director and were more frequently granted or partially granted at those levels. Grievance appeals to the warden were 76 percent more likely to result in a successful outcome for the offender at MSP than they were at CCC. Appeals to the department director originating at MSP were 40 percent more likely to be successful than those coming from CCC. Because the department does not analyze grievances on a per-inmate or per-grievance basis, department staff were unaware these discrepancies existed and could not readily explain them.
Across prisons, there were differences in overall grievance rates, as well as in the percentage of grievances that resulted in a positive outcome for the offender. The results of our survey of former inmates, discussed later in this chapter, indicate that former inmates of all four prisons do not rate the grievance process highly. It is unclear whether higher grievance rates at a prison indicate more problems at that prison or more faith in the grievance process on behalf of that prison’s inmates. Because the department does not compare grievances and their outcomes at each facility on a per-offender basis, they are not able to address such questions.
ConClusion
There are differences in the rates of grievances, the subjects grieved, the processing of grievances, and positive resolution rates at the four prisons. Despite collecting monthly and annual information on grievances, the department does not compare rates or outcomes on a per-offender basis to identify issues with grievance handling or to ensure similar treatment across all facilities. Therefore, the department cannot ensure that every inmate has access to the same grievance system.
13
18P-08
Rates and Types of Disciplinary Actions Differed Across PrisonsIn addition to reports on grievances, department staff review monthly reports on disciplinary actions and commissary purchases. Disciplinary actions are taken when inmates break rules, such as issuing threatening remarks or fighting. The sanctions given for infractions can range from warnings to 30 days of segregated detention, depending on the severity of the offense and the inmate’s disciplinary history. When looking at disciplinary data, staff use their experience to try to diagnose emerging problems or predict future unrest. For example, staff reported that if the total number of disciplinary actions decrease significantly, while commissary purchases increase, it could indicate that inmates are stocking up in anticipation of future prison unrest.
The department reviews total disciplinary actions across prisons, but it does not systematically analyze disciplinary actions across prisons on a per-inmate basis. As part of our audit work, we analyzed monthly department disciplinary reports for 2016 through 2018. To better compare the disciplinary rates, we compared disciplinary rates using MSP’s rates as a baseline, in addition to controlling for prison population. This enables us to compare the contract prisons to the state-run prison. Table 3 (see page 15) illustrates both the overall men’s prison disciplinary rates and the rates of contract prisons compared to those of MSP. The first three columns on the right side show disciplinary rates at contract prisons relative to MSP. The last column shows MSP’s rates relative to the contract prisons’ rates. Red indicates a higher rate, and green indicates a lower rate.
14 Montana Legislative Audit Division
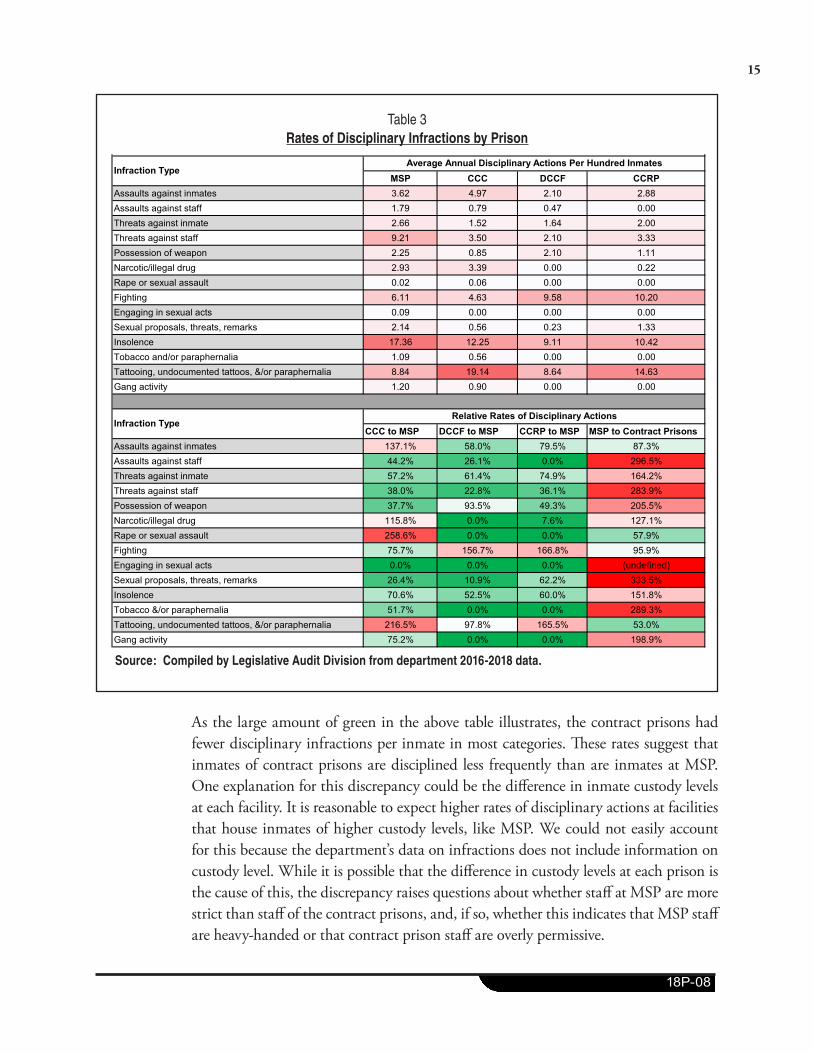
Table 3Rates of Disciplinary Infractions by Prison
MSP CCC DCCF CCRPAssaults against inmates 3.62 4.97 2.10 2.88Assaults against staff 1.79 0.79 0.47 0.00Threats against inmate 2.66 1.52 1.64 2.00Threats against staff 9.21 3.50 2.10 3.33Possession of weapon 2.25 0.85 2.10 1.11Narcotic/illegal drug 2.93 3.39 0.00 0.22Rape or sexual assault 0.02 0.06 0.00 0.00Fighting 6.11 4.63 9.58 10.20Engaging in sexual acts 0.09 0.00 0.00 0.00Sexual proposals, threats, remarks 2.14 0.56 0.23 1.33Insolence 17.36 12.25 9.11 10.42Tobacco and/or paraphernalia 1.09 0.56 0.00 0.00Tattooing, undocumented tattoos, &/or paraphernalia 8.84 19.14 8.64 14.63Gang activity 1.20 0.90 0.00 0.00
CCC to MSP DCCF to MSP CCRP to MSP MSP to Contract PrisonsAssaults against inmates 137.1% 58.0% 79.5% 87.3%Assaults against staff 44.2% 26.1% 0.0% 296.5%Threats against inmate 57.2% 61.4% 74.9% 164.2%Threats against staff 38.0% 22.8% 36.1% 283.9%Possession of weapon 37.7% 93.5% 49.3% 205.5%Narcotic/illegal drug 115.8% 0.0% 7.6% 127.1%Rape or sexual assault 258.6% 0.0% 0.0% 57.9%Fighting 75.7% 156.7% 166.8% 95.9%Engaging in sexual acts 0.0% 0.0% 0.0% (undefined)Sexual proposals, threats, remarks 26.4% 10.9% 62.2% 333.5%Insolence 70.6% 52.5% 60.0% 151.8%Tobacco &/or paraphernalia 51.7% 0.0% 0.0% 289.3%Tattooing, undocumented tattoos, &/or paraphernalia 216.5% 97.8% 165.5% 53.0%Gang activity 75.2% 0.0% 0.0% 198.9%Source: LAD Analysis of Department of Corrections 2016-2018 data
Rates of Disciplinary Infractions Vary By Prison
Infraction TypeAverage Annual Disciplinary Actions Per Hundred Inmates
Infraction TypeRelative Rates of Disciplinary Actions
Source: Compiled by Legislative Audit Division from department 2016-2018 data.
As the large amount of green in the above table illustrates, the contract prisons had fewer disciplinary infractions per inmate in most categories. These rates suggest that inmates of contract prisons are disciplined less frequently than are inmates at MSP. One explanation for this discrepancy could be the difference in inmate custody levels at each facility. It is reasonable to expect higher rates of disciplinary actions at facilities that house inmates of higher custody levels, like MSP. We could not easily account for this because the department’s data on infractions does not include information on custody level. While it is possible that the difference in custody levels at each prison is the cause of this, the discrepancy raises questions about whether staff at MSP are more strict than staff of the contract prisons, and, if so, whether this indicates that MSP staff are heavy-handed or that contract prison staff are overly permissive.
15
18P-08
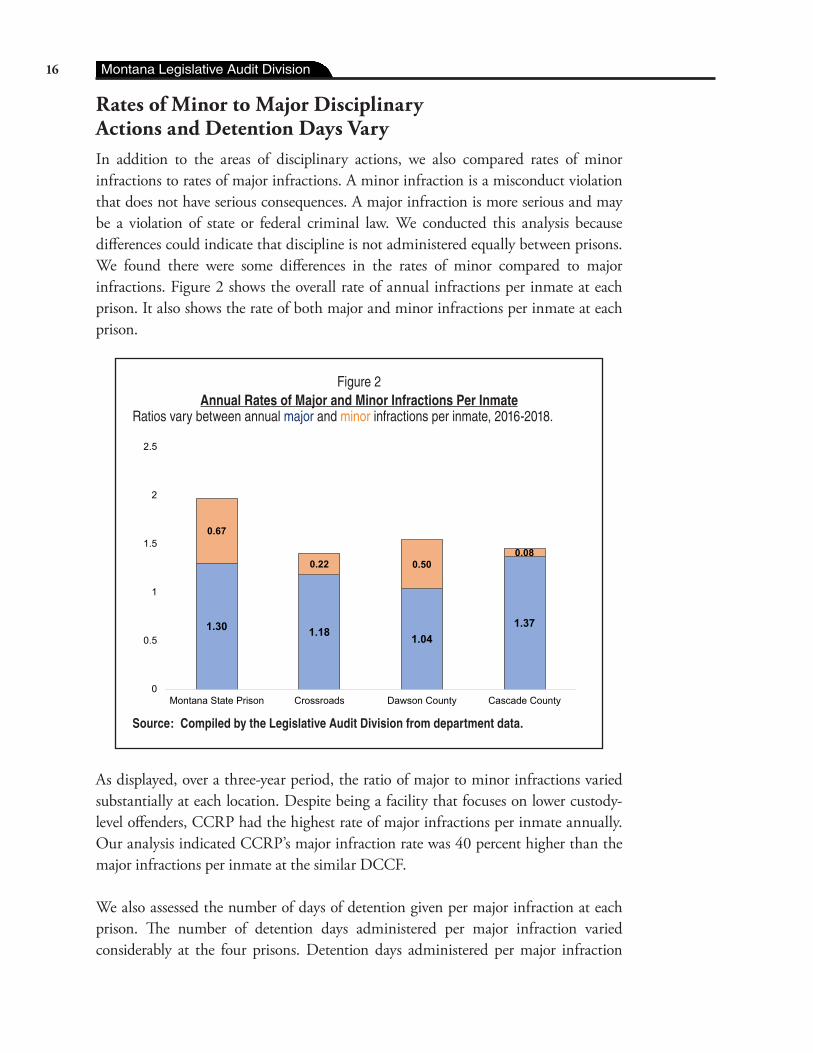
Rates of Minor to Major Disciplinary Actions and Detention Days VaryIn addition to the areas of disciplinary actions, we also compared rates of minor infractions to rates of major infractions. A minor infraction is a misconduct violation that does not have serious consequences. A major infraction is more serious and may be a violation of state or federal criminal law. We conducted this analysis because differences could indicate that discipline is not administered equally between prisons. We found there were some differences in the rates of minor compared to major infractions. Figure 2 shows the overall rate of annual infractions per inmate at each prison. It also shows the rate of both major and minor infractions per inmate at each prison.
Figure 2Annual Rates of Major and Minor Infractions Per Inmate
Ratios vary between annual major and minor infractions per inmate, 2016-2018.
Source: LAD analysis of department data.
1.30 1.18 1.041.37
0.67
0.22 0.500.08
0
0.5
1
1.5
2
2.5
Montana State Prison CrossroadsCorrectional Center
Dawson CountyCorrectional Facility
Cascade CountyRegional Prison
Source: Compiled by the Legislative Audit Division from department data.
As displayed, over a three-year period, the ratio of major to minor infractions varied substantially at each location. Despite being a facility that focuses on lower custody-level offenders, CCRP had the highest rate of major infractions per inmate annually. Our analysis indicated CCRP’s major infraction rate was 40 percent higher than the major infractions per inmate at the similar DCCF.
We also assessed the number of days of detention given per major infraction at each prison. The number of detention days administered per major infraction varied considerably at the four prisons. Detention days administered per major infraction
16 Montana Legislative Audit Division
ranged from 4 days at DCCF to 6.3 days at CCRP. This represents over 50 percent more detention days per major infraction at a prison that houses the same inmate custody levels as DCCF does. An inmate’s disciplinary history influences the number of days given, and department policy prescribes ranges of sanction options for each offense. Department staff did not have an explanation for why the two regional prisons differed on this measure.
ConClusion
There are disparities in the rates of disciplinary actions taken per inmate and the ratio of major to minor infraction rates between prisons. Additionally, variance in detention days given per major infraction could indicate prisons do not administer discipline equally. Since the department does not review disciplinary data on a per-inmate basis, it does not know if inmates are disciplined based on equal criteria and cannot take necessary steps to address possible issues.
Access to High School Equivalent Education and Work Assignments VaryOne of the goals of the men’s prison system is to rehabilitate offenders, through programming, education, and vocational training. The programming available at each prison is highly variable, as displayed in Table 1 in Chapter I. We analyzed information regarding educational attainment and work assignments to determine whether each prison provides equal opportunities for these rehabilitative practices.
One measurement of a prison’s rehabilitative success is the number of inmates who obtain their high school equivalency certificate in prison. Research has shown offenders are less likely to recidivate when they obtain education in prison. The department uses the HiSET (High School Equivalency Test) program, which consists of five subject matter tests, to measure educational attainment. The following table shows the number of offenders receiving a high school diploma or its equivalent through passing all five exams, and the percent of the population at each prison this represents.
17
18P-08
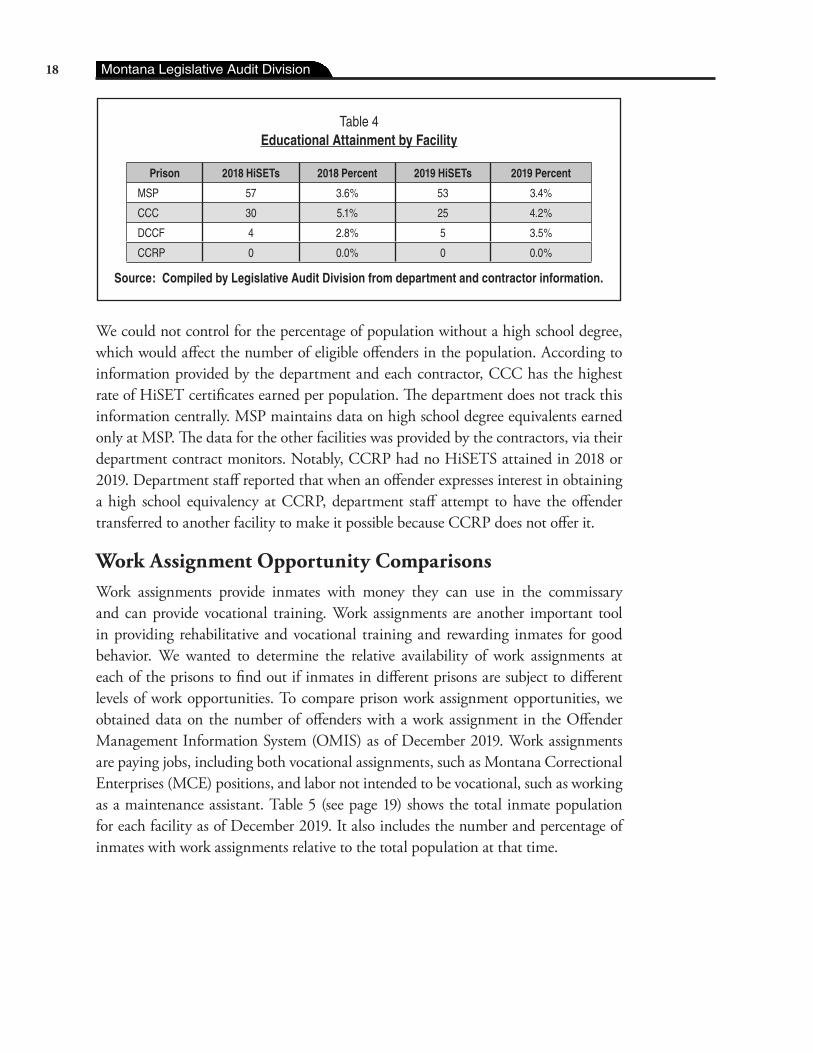
Table 4Educational Attainment by Facility
Prison 2018 HiSETs 2018 Percent 2019 HiSETs 2019 Percent
MSP 57 3.6% 53 3.4%
CCC 30 5.1% 25 4.2%
DCCF 4 2.8% 5 3.5%
CCRP 0 0.0% 0 0.0%
Source: Compiled by Legislative Audit Division from department and contractor information.
We could not control for the percentage of population without a high school degree, which would affect the number of eligible offenders in the population. According to information provided by the department and each contractor, CCC has the highest rate of HiSET certificates earned per population. The department does not track this information centrally. MSP maintains data on high school degree equivalents earned only at MSP. The data for the other facilities was provided by the contractors, via their department contract monitors. Notably, CCRP had no HiSETS attained in 2018 or 2019. Department staff reported that when an offender expresses interest in obtaining a high school equivalency at CCRP, department staff attempt to have the offender transferred to another facility to make it possible because CCRP does not offer it.
Work Assignment Opportunity ComparisonsWork assignments provide inmates with money they can use in the commissary and can provide vocational training. Work assignments are another important tool in providing rehabilitative and vocational training and rewarding inmates for good behavior. We wanted to determine the relative availability of work assignments at each of the prisons to find out if inmates in different prisons are subject to different levels of work opportunities. To compare prison work assignment opportunities, we obtained data on the number of offenders with a work assignment in the Offender Management Information System (OMIS) as of December 2019. Work assignments are paying jobs, including both vocational assignments, such as Montana Correctional Enterprises (MCE) positions, and labor not intended to be vocational, such as working as a maintenance assistant. Table 5 (see page 19) shows the total inmate population for each facility as of December 2019. It also includes the number and percentage of inmates with work assignments relative to the total population at that time.
18 Montana Legislative Audit Division
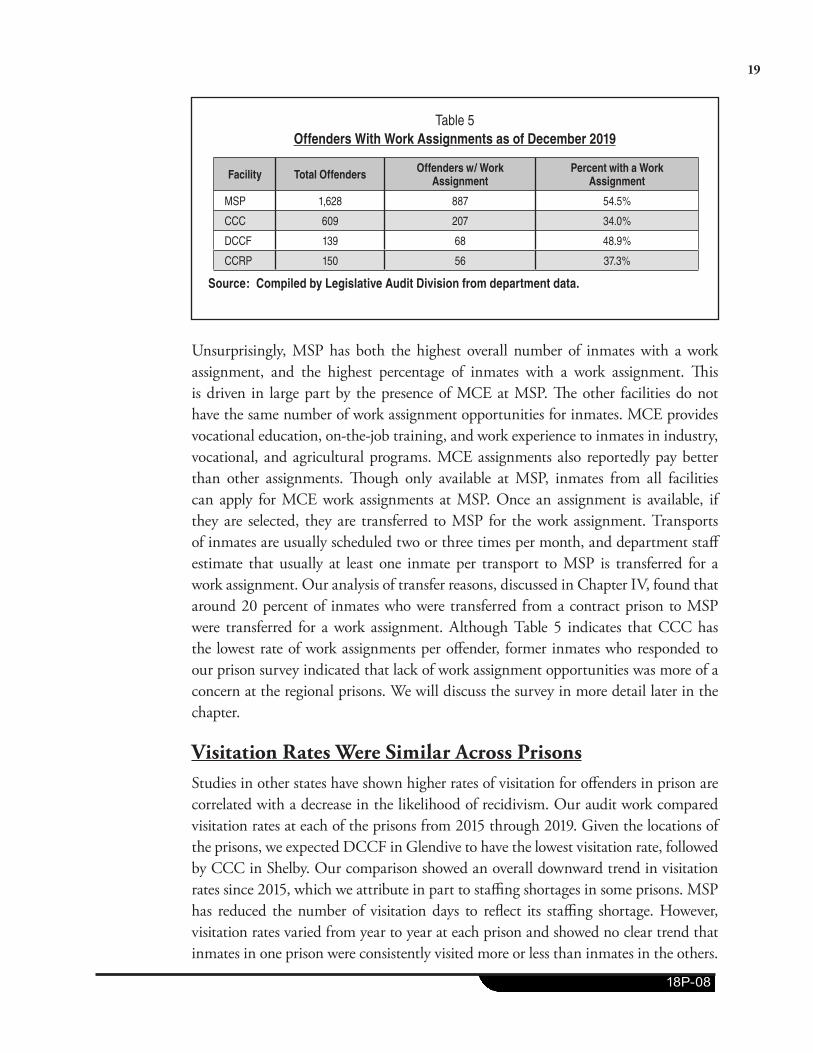
Table 5Offenders With Work Assignments as of December 2019
Facility Total Offenders Offenders w/ Work Assignment
Percent with a Work Assignment
MSP 1,628 887 54.5%
CCC 609 207 34.0%
DCCF 139 68 48.9%
CCRP 150 56 37.3%
Source: Compiled by Legislative Audit Division from department data.
Unsurprisingly, MSP has both the highest overall number of inmates with a work assignment, and the highest percentage of inmates with a work assignment. This is driven in large part by the presence of MCE at MSP. The other facilities do not have the same number of work assignment opportunities for inmates. MCE provides vocational education, on-the-job training, and work experience to inmates in industry, vocational, and agricultural programs. MCE assignments also reportedly pay better than other assignments. Though only available at MSP, inmates from all facilities can apply for MCE work assignments at MSP. Once an assignment is available, if they are selected, they are transferred to MSP for the work assignment. Transports of inmates are usually scheduled two or three times per month, and department staff estimate that usually at least one inmate per transport to MSP is transferred for a work assignment. Our analysis of transfer reasons, discussed in Chapter IV, found that around 20 percent of inmates who were transferred from a contract prison to MSP were transferred for a work assignment. Although Table 5 indicates that CCC has the lowest rate of work assignments per offender, former inmates who responded to our prison survey indicated that lack of work assignment opportunities was more of a concern at the regional prisons. We will discuss the survey in more detail later in the chapter.
Visitation Rates Were Similar Across PrisonsStudies in other states have shown higher rates of visitation for offenders in prison are correlated with a decrease in the likelihood of recidivism. Our audit work compared visitation rates at each of the prisons from 2015 through 2019. Given the locations of the prisons, we expected DCCF in Glendive to have the lowest visitation rate, followed by CCC in Shelby. Our comparison showed an overall downward trend in visitation rates since 2015, which we attribute in part to staffing shortages in some prisons. MSP has reduced the number of visitation days to reflect its staffing shortage. However, visitation rates varied from year to year at each prison and showed no clear trend that inmates in one prison were consistently visited more or less than inmates in the others.
19
18P-08
We Surveyed Former Inmates Regarding Prison QualityWe believe the perspective of inmates is an integral part of any discussion of prison quality. Firsthand accounts of offender experiences are important individually, but provide a clearer picture in large numbers. We mailed a survey to 1,053 former inmates who spent time in at least one of the contract prisons and MSP and who were still under department supervision. These survey recipients were released from prison between January 2018 and January 2020.
The survey contained questions on 14 measures of prison quality for each of the four facilities. We chose these measures because they are topics of concern frequently brought by former and current inmates both to legislative committees and to the Legislative Audit Division’s fraud, waste, and abuse hotline. They are also commonly assessed in other jurisdictions and some of these measures, like education and visitation, have been shown to decrease an offender’s likelihood to recidivate. The measures we asked about were:
� Healthcare, dental, and vision care
� Mental healthcare � Safety from other inmates � Treatment by correctional
officers and staff � Training, education, and
skill-building � Paid work assignment
availability
� Grievance process and results � Access to legal information � Civil rights (e.g. freedom of
religion) � Meals � Visitation � Exercise and recreation � Comfort and quality of life � Overall prison experience
Offenders rated each facility in which they spent time on each area of prison quality. Of the 1,053 surveys we mailed to offenders, 303 (over 28 percent) were returned as undeliverable. Of the remaining 750 surveys, respondents completed and returned 139, for a response rate of 19 percent. This response rate is in line with our expectations for a survey sent to an offender population via paper mail. There were some differences between the demographics of the respondents and those of the survey population, such as in race composition and known gang associations. However, as these differences were minor, we determined they did not have a significant effect on the interpretation of the results.
20 Montana Legislative Audit Division
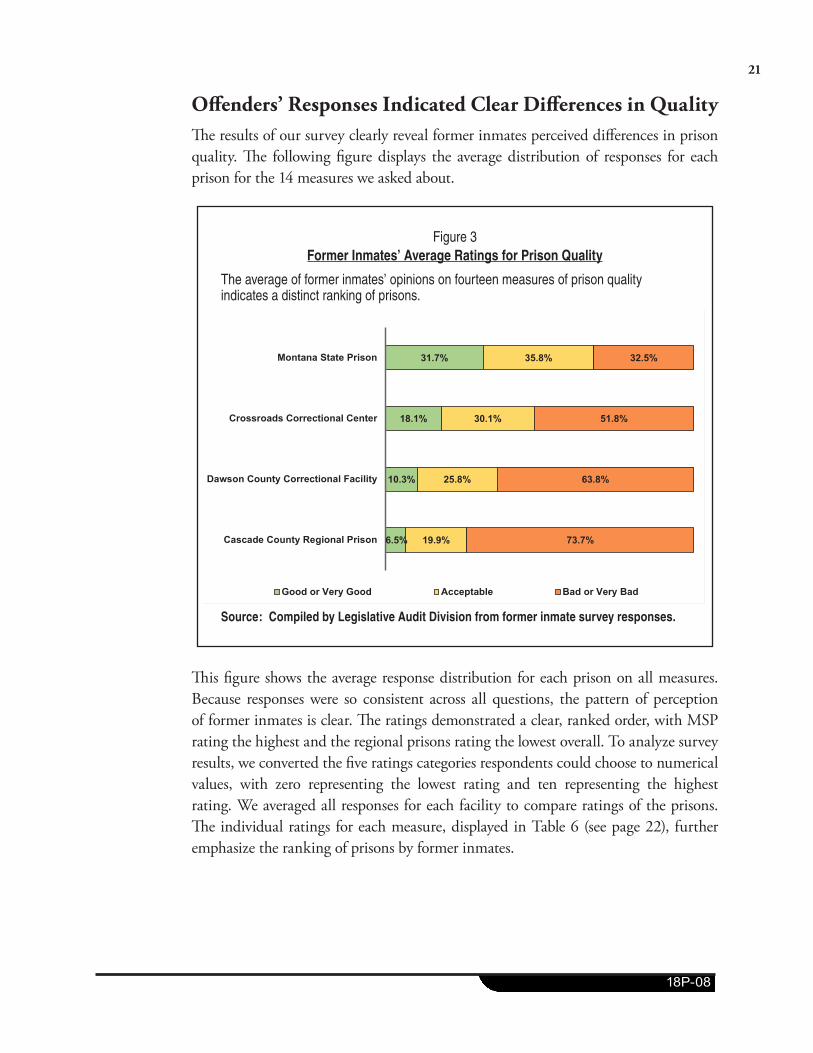
Offenders’ Responses Indicated Clear Differences in QualityThe results of our survey clearly reveal former inmates perceived differences in prison quality. The following figure displays the average distribution of responses for each prison for the 14 measures we asked about.
Figure 3Former Inmates’ Average Ratings for Prison Quality
The average of former inmates’ opinions on fourteen measures of prison quality indicates a distinct ranking of prisons.
Ti
6.5%
10.3%
18.1%
31.7%
19.9%
25.8%
30.1%
35.8%
73.7%
63.8%
51.8%
32.5%
Cascade County Regional Prison
Dawson County Correctional Facility
Crossroads Correctional Center
Montana State Prison
The average of former inmates' opinions on fourteen measures of prison quality indicates a distinct ranking of prisons.
Good or Very Good Acceptable Bad or Very Bad
Source: Compiled by Legislative Audit Division from former inmate survey responses.
This figure shows the average response distribution for each prison on all measures. Because responses were so consistent across all questions, the pattern of perception of former inmates is clear. The ratings demonstrated a clear, ranked order, with MSP rating the highest and the regional prisons rating the lowest overall. To analyze survey results, we converted the five ratings categories respondents could choose to numerical values, with zero representing the lowest rating and ten representing the highest rating. We averaged all responses for each facility to compare ratings of the prisons. The individual ratings for each measure, displayed in Table 6 (see page 22), further emphasize the ranking of prisons by former inmates.
21
18P-08
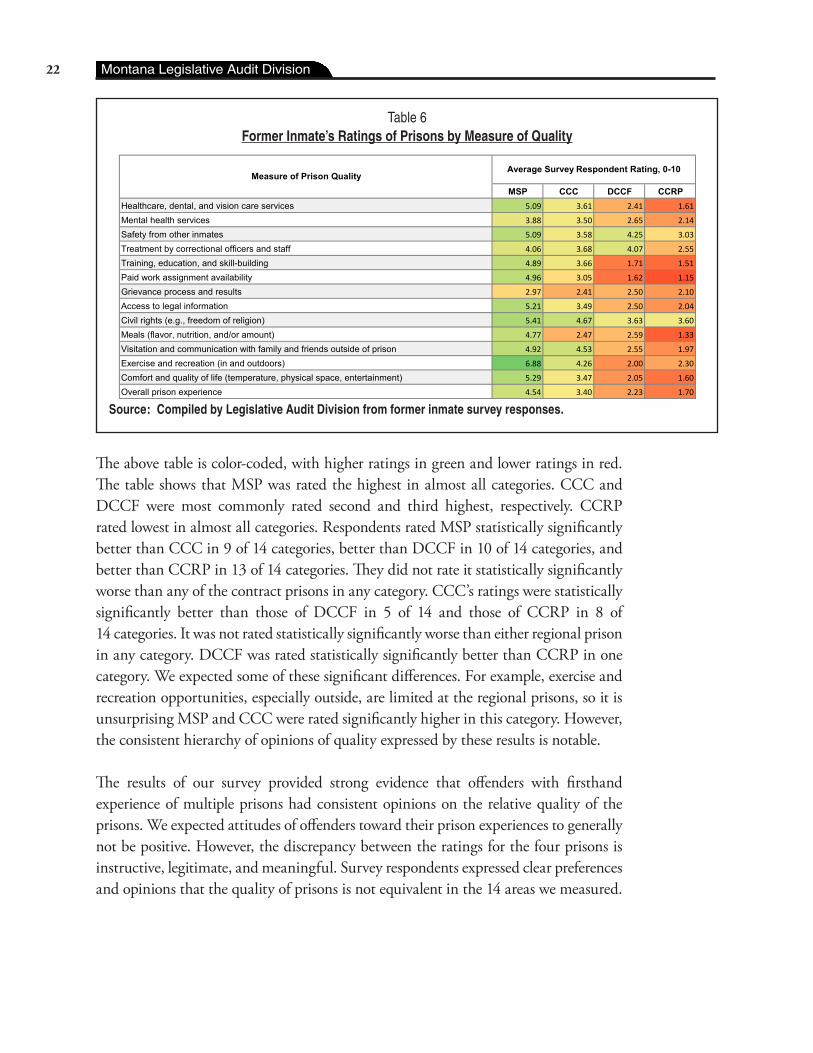
Table 6Former Inmate’s Ratings of Prisons by Measure of Quality
MSP CCC DCCF CCRPHealthcare, dental, and vision care services 5.09 3.61 2.41 1.61
Mental health services 3.88 3.50 2.65 2.14
Safety from other inmates 5.09 3.58 4.25 3.03
Treatment by correctional officers and staff 4.06 3.68 4.07 2.55
Training, education, and skill-building 4.89 3.66 1.71 1.51
Paid work assignment availability 4.96 3.05 1.62 1.15
Grievance process and results 2.97 2.41 2.50 2.10
Access to legal information 5.21 3.49 2.50 2.04
Civil rights (e.g., freedom of religion) 5.41 4.67 3.63 3.60
Meals (flavor, nutrition, and/or amount) 4.77 2.47 2.59 1.33
Visitation and communication with family and friends outside of prison 4.92 4.53 2.55 1.97
Exercise and recreation (in and outdoors) 6.88 4.26 2.00 2.30
Comfort and quality of life (temperature, physical space, entertainment) 5.29 3.47 2.05 1.60
Overall prison experience 4.54 3.40 2.23 1.70
Source: Compiled by Legislative Audit Division from former inmate survey responses.
Measure of Prison QualityAverage Survey Respondent Rating, 0-10
Source: Compiled by Legislative Audit Division from former inmate survey responses.
The above table is color-coded, with higher ratings in green and lower ratings in red. The table shows that MSP was rated the highest in almost all categories. CCC and DCCF were most commonly rated second and third highest, respectively. CCRP rated lowest in almost all categories. Respondents rated MSP statistically significantly better than CCC in 9 of 14 categories, better than DCCF in 10 of 14 categories, and better than CCRP in 13 of 14 categories. They did not rate it statistically significantly worse than any of the contract prisons in any category. CCC’s ratings were statistically significantly better than those of DCCF in 5 of 14 and those of CCRP in 8 of 14 categories. It was not rated statistically significantly worse than either regional prison in any category. DCCF was rated statistically significantly better than CCRP in one category. We expected some of these significant differences. For example, exercise and recreation opportunities, especially outside, are limited at the regional prisons, so it is unsurprising MSP and CCC were rated significantly higher in this category. However, the consistent hierarchy of opinions of quality expressed by these results is notable.
The results of our survey provided strong evidence that offenders with firsthand experience of multiple prisons had consistent opinions on the relative quality of the prisons. We expected attitudes of offenders toward their prison experiences to generally not be positive. However, the discrepancy between the ratings for the four prisons is instructive, legitimate, and meaningful. Survey respondents expressed clear preferences and opinions that the quality of prisons is not equivalent in the 14 areas we measured.
22 Montana Legislative Audit Division
Respondents’ Comments Underscored Ratings The survey also provided space for open-ended commentary on the prisons. Many offenders wrote explanations of their ratings or additional information. Comments regarding MSP were frequently positive, except for numerous complaints about staff. Comments regarding all three contract prisons were more negative. One recurring theme of respondents’ comments regarding CCC was a greater presence of drugs and other contraband. The regional prisons’ lack of access to outdoor space, legal resources, quality healthcare, and jobs were particularly notable issues of concern among respondents. Many respondents questioned the rehabilitative effectiveness of the contract prisons.
ConClusion
One of the department’s missions is to promote positive change in offender behavior. Our survey of released offenders provided evidence former inmates believe contract prisons provide lesser experiences. These results raise questions about the department’s ability to provide equitable rehabilitation via the use of highly variable prison settings.
More Rigorous Comparison of Prisons by the Department Is WarrantedThe previous sections discussed our work reviewing indicators of prison quality including grievance resolution rates, disciplinary actions, and educational attainment. We found prison quality varies between the four men’s prisons in each of these areas. In the following section, we discuss the reasons the department does not assess these differences on a per-inmate basis. We also present a recommendation to the department to improve this process.
Some Inequality Cannot Easily Be RemediedWe did not evaluate the degree to which prison operators comply with their contracts, and it is possible contract noncompliance contributes to lower prison quality. In 2016, we issued a performance audit that assessed some conditions at the private prison and found that some aspects of the department’s contract monitoring could be improved. The department monitors the contracts with on-site staff and via regular audits by its Quality Assurance Division. Monitoring and reviews are driven by assessment of compliance with law, rule, contract, and policy. The prison contracts specify contractors must follow numerous MSP policies and procedures. The contracts are written to create similar policy environments at each prison, but the primary purpose
23
18P-08
of the contract prisons is to manage and provide for a growing prison population while containing costs, rather than to provide fully comparable services at each prison. Our work suggests even full compliance with contracts written to minimize costs can still create differences in quality in the prison system. The department will not be able to address all current prison inequalities. For example, the regional prisons’ lack of outdoor space cannot be easily improved. According to department staff, providing completely equitable services at each prison is not attainable within the department’s current budget. However, some differences could potentially be improved if the department made more comprehensive efforts to diagnose and correct inequalities.
Department Uses Compliance-Oriented ApproachMore than one-third of male inmates in the state reside in contract prisons and are subject to conditions that differ from those at MSP. The department does not have complete information on, and was not able to easily interpret, measures of prison quality that varied at each of the four men’s prisons. While the department regularly reviews descriptive statistics on each of the prisons, it does not compare and analyze this information on a per capita basis. It uses grievance and disciplinary data to manage its inmate population. The department does not analyze the data comparatively over long terms to promote equitable incarceration at each prison. The department recognizes the limitations of the contract prisons and does not perceive them as independent entities. Instead, it considers them extensions of MSP. Offenders are frequently transferred between the prisons to meet their needs (e.g. healthcare requirements), which we will discuss in Chapter IV. Resultingly, the department’s approach to assessing its prisons is predicated on the prisons being inherently unequal and assessing contract prisons for compliance, but not necessarily for performance.
The policy statement in the private prison contract states that the goals of privatization include: “providing inmates with proper care, treatment, rehabilitation, and reformation;” and “providing the state of Montana with the opportunity to compare the costs and benefits of privatized corrections with the costs and benefits of public corrections.” Without regularly comparing prison performance, neither of these goals can be achieved. Other states’ departments of corrections assess the relative quality of their prisons. For example, Minnesota’s Department of Corrections compared one of its public prisons to one of its private prisons and found inmates of the private prison were more likely to recidivate. The department reports that it does not currently have the resources to do this kind of statistical analysis of offender outcomes. Over the long term, the department should aim to develop the human and operational resources to compare offender outcomes like recidivism and other measures of rehabilitation for each prison. In the near term, comparing available measures of prison quality should enable better contract management and improve prison equality. Additionally,
24 Montana Legislative Audit Division
regularly weighing comparative information on the performance of each prison could assist department management, the governor’s office, and the legislature in making informed decisions about the future of the men’s prison system.
ReCommendation #1
We recommend the Department of Corrections develop a formal, data-driven approach to regularly compare the contract prisons to Montana State Prison and to each other on a per-inmate basis using the following measures:
A. Grievance rates and the rates of their resolution types.
B. Rates of disciplinary actions, including the sanctions administered.
C. Inmate educational attainment.
D. Visitation.
E. Any other measures the department deems useful for comparative purposes.
25
18P-08

26
Chapter III – Comparing Recidivism Rates
IntroductionOne of the primary goals of the Department of Corrections (department) is to reduce recidivism. Recidivism is defined by the department as return to prison within three years after release from prison. In this chapter, we describe our work to determine whether recidivism rates and other outcomes for adult male offenders differ depending on the prison in which they were incarcerated. Because it was our aim to determine if varying recidivism or parole rates influence the relative costs of each prison, we also assessed both the direct and indirect costs of the prisons. Our analysis of recidivism rates and time-to-parole did not provide statistically significant evidence that time spent in contract prisons is linked to an increased likelihood of recidivism or delayed parole. We also found that comparing the daily costs of each prison is of limited value due to the department’s design and use of each facility. To put any cost effects attributable to recidivism in context, we begin with a discussion of our work related to cost trends and cost comparisons between prisons.
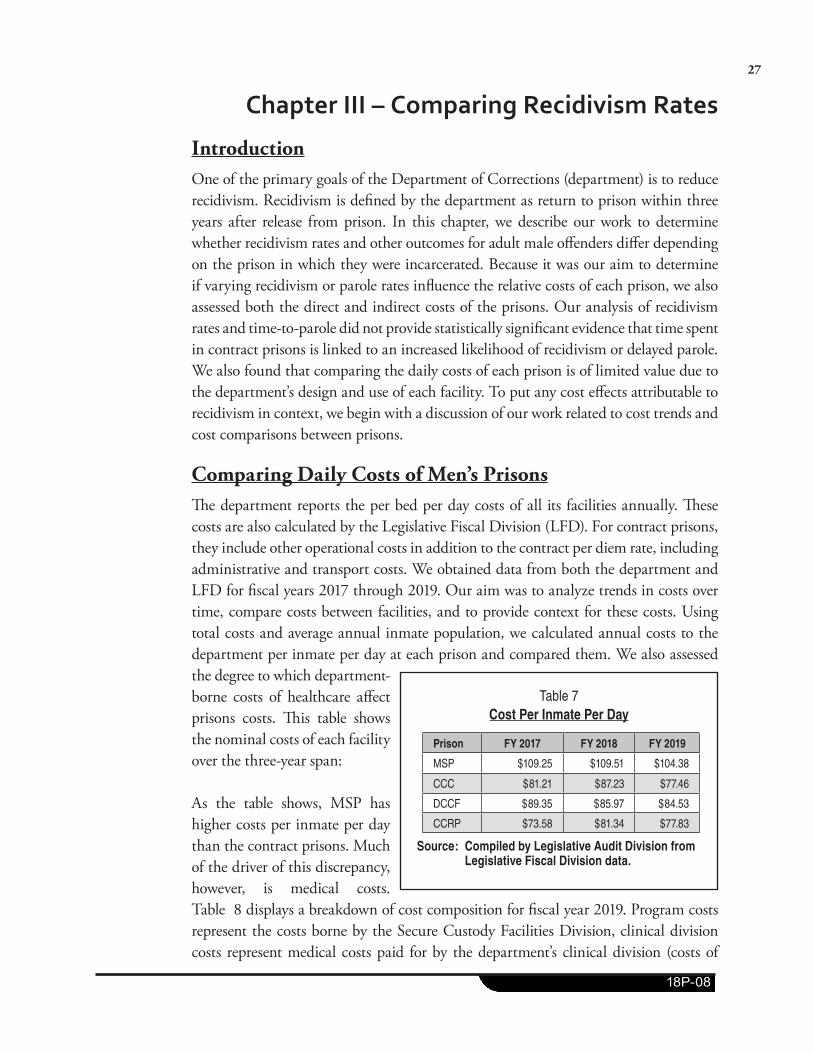
Comparing Daily Costs of Men’s PrisonsThe department reports the per bed per day costs of all its facilities annually. These costs are also calculated by the Legislative Fiscal Division (LFD). For contract prisons, they include other operational costs in addition to the contract per diem rate, including administrative and transport costs. We obtained data from both the department and LFD for fiscal years 2017 through 2019. Our aim was to analyze trends in costs over time, compare costs between facilities, and to provide context for these costs. Using total costs and average annual inmate population, we calculated annual costs to the department per inmate per day at each prison and compared them. We also assessed the degree to which department-borne costs of healthcare affect prisons costs. This table shows the nominal costs of each facility over the three-year span:
As the table shows, MSP has higher costs per inmate per day than the contract prisons. Much of the driver of this discrepancy, however, is medical costs. Table 8 displays a breakdown of cost composition for fiscal year 2019. Program costs represent the costs borne by the Secure Custody Facilities Division, clinical division costs represent medical costs paid for by the department’s clinical division (costs of
Table 7Cost Per Inmate Per Day
Prison FY 2017 FY 2018 FY 2019
MSP $109.25 $109.51 $104.38
CCC $81.21 $87.23 $77.46
DCCF $89.35 $85.97 $84.53
CCRP $73.58 $81.34 $77.83
Source: Compiled by Legislative Audit Division from Legislative Fiscal Division data.
27
18P-08
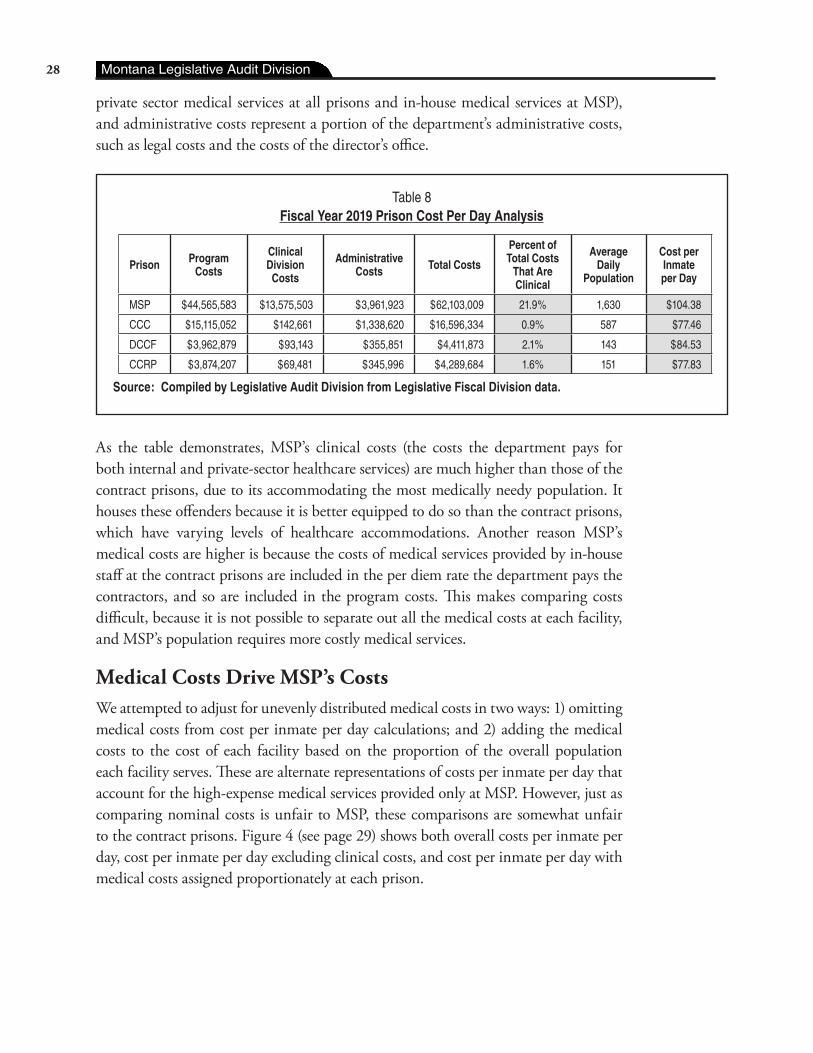
private sector medical services at all prisons and in-house medical services at MSP), and administrative costs represent a portion of the department’s administrative costs, such as legal costs and the costs of the director’s office.
Table 8Fiscal Year 2019 Prison Cost Per Day Analysis
Prison Program Costs
Clinical Division Costs
Administrative Costs Total Costs
Percent of Total Costs
That Are Clinical
Average Daily
Population
Cost per Inmate per Day
MSP $44,565,583 $13,575,503 $3,961,923 $62,103,009 21.9% 1,630 $104.38
CCC $15,115,052 $142,661 $1,338,620 $16,596,334 0.9% 587 $77.46
DCCF $3,962,879 $93,143 $355,851 $4,411,873 2.1% 143 $84.53
CCRP $3,874,207 $69,481 $345,996 $4,289,684 1.6% 151 $77.83
Source: Compiled by Legislative Audit Division from Legislative Fiscal Division data.
As the table demonstrates, MSP’s clinical costs (the costs the department pays for both internal and private-sector healthcare services) are much higher than those of the contract prisons, due to its accommodating the most medically needy population. It houses these offenders because it is better equipped to do so than the contract prisons, which have varying levels of healthcare accommodations. Another reason MSP’s medical costs are higher is because the costs of medical services provided by in-house staff at the contract prisons are included in the per diem rate the department pays the contractors, and so are included in the program costs. This makes comparing costs difficult, because it is not possible to separate out all the medical costs at each facility, and MSP’s population requires more costly medical services.
Medical Costs Drive MSP’s CostsWe attempted to adjust for unevenly distributed medical costs in two ways: 1) omitting medical costs from cost per inmate per day calculations; and 2) adding the medical costs to the cost of each facility based on the proportion of the overall population each facility serves. These are alternate representations of costs per inmate per day that account for the high-expense medical services provided only at MSP. However, just as comparing nominal costs is unfair to MSP, these comparisons are somewhat unfair to the contract prisons. Figure 4 (see page 29) shows both overall costs per inmate per day, cost per inmate per day excluding clinical costs, and cost per inmate per day with medical costs assigned proportionately at each prison.
28 Montana Legislative Audit Division
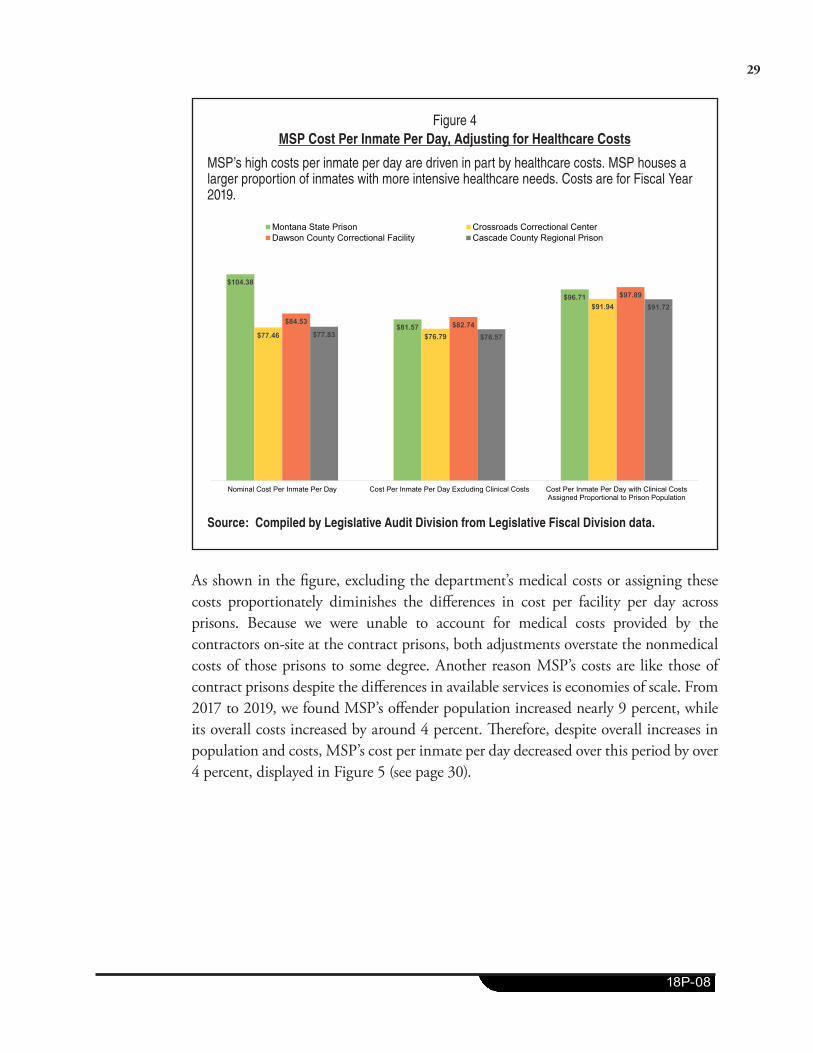
Figure 4MSP Cost Per Inmate Per Day, Adjusting for Healthcare Costs
MSP’s high costs per inmate per day are driven in part by healthcare costs. MSP houses a larger proportion of inmates with more intensive healthcare needs. Costs are for Fiscal Year 2019.
$104.38
$81.57
$96.71
$77.46 $76.79
$91.94
$84.53 $82.74
$97.89
$77.83 $76.57
$91.72
Nominal Cost Per Inmate Per Day Cost Per Inmate Per Day Excluding Clinical Costs Cost Per Inmate Per Day with Clinical CostsAssigned Proportional to Prison Population
Montana State Prison Crossroads Correctional CenterDawson County Correctional Facility Cascade County Regional Prison
Source: Compiled by Legislative Audit Division from Legislative Fiscal Division data.
As shown in the figure, excluding the department’s medical costs or assigning these costs proportionately diminishes the differences in cost per facility per day across prisons. Because we were unable to account for medical costs provided by the contractors on-site at the contract prisons, both adjustments overstate the nonmedical costs of those prisons to some degree. Another reason MSP’s costs are like those of contract prisons despite the differences in available services is economies of scale. From 2017 to 2019, we found MSP’s offender population increased nearly 9 percent, while its overall costs increased by around 4 percent. Therefore, despite overall increases in population and costs, MSP’s cost per inmate per day decreased over this period by over 4 percent, displayed in Figure 5 (see page 30).
29
18P-08
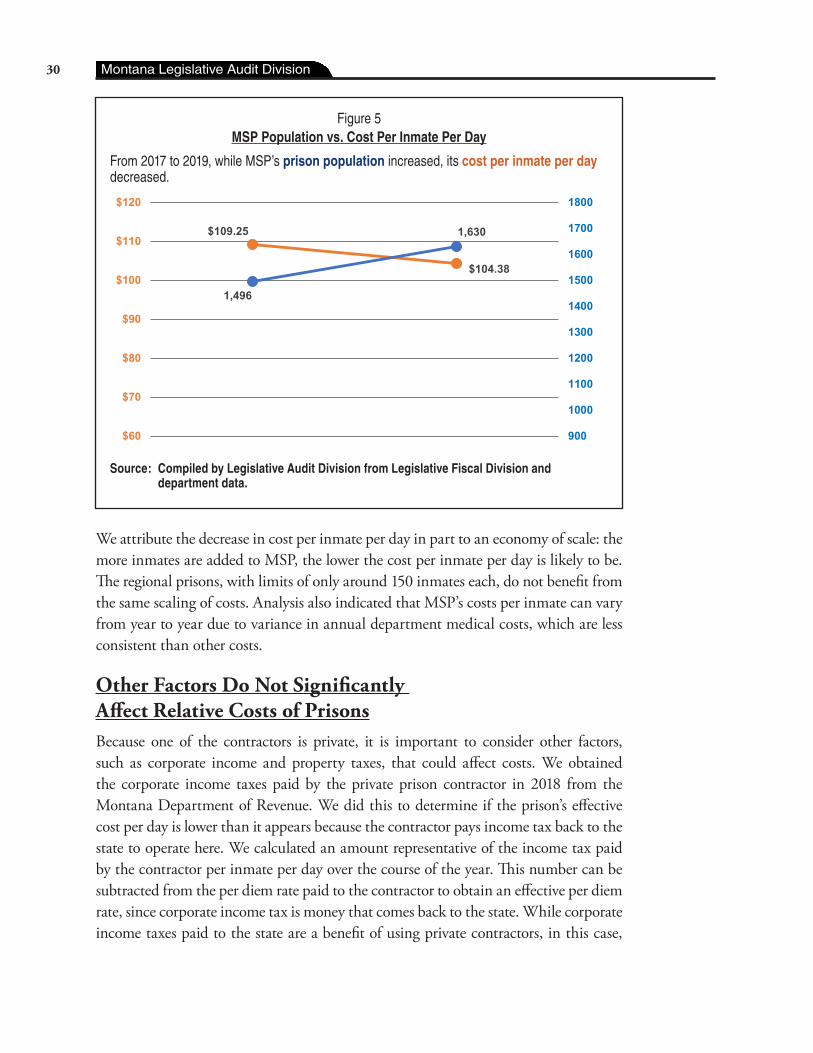
Figure 5MSP Population vs. Cost Per Inmate Per Day
From 2017 to 2019, while MSP’s prison population increased, its cost per inmate per day decreased.
Source: Compiled by Legislative Audit Division from Legislative Fiscal Division data
$109.25
$104.38
1,496
1,630
900
1000
1100
1200
1300
1400
1500
1600
1700
1800
$60
$70
$80
$90
$100
$110
$120
From 2017 to 2019, while MSP's prison population increased, its cost per inmate per day decreased.
Source: Compiled by Legislative Audit Division from Legislative Fiscal Division and department data.
We attribute the decrease in cost per inmate per day in part to an economy of scale: the more inmates are added to MSP, the lower the cost per inmate per day is likely to be. The regional prisons, with limits of only around 150 inmates each, do not benefit from the same scaling of costs. Analysis also indicated that MSP’s costs per inmate can vary from year to year due to variance in annual department medical costs, which are less consistent than other costs.
Other Factors Do Not Significantly Affect Relative Costs of PrisonsBecause one of the contractors is private, it is important to consider other factors, such as corporate income and property taxes, that could affect costs. We obtained the corporate income taxes paid by the private prison contractor in 2018 from the Montana Department of Revenue. We did this to determine if the prison’s effective cost per day is lower than it appears because the contractor pays income tax back to the state to operate here. We calculated an amount representative of the income tax paid by the contractor per inmate per day over the course of the year. This number can be subtracted from the per diem rate paid to the contractor to obtain an effective per diem rate, since corporate income tax is money that comes back to the state. While corporate income taxes paid to the state are a benefit of using private contractors, in this case,
30 Montana Legislative Audit Division
subtracting corporate income taxes from cost calculations does not significantly change the daily costs of the private prison per inmate relative to those of the other three prisons. Another cost-influencing factor are the property taxes paid by the contractor to Toole County. In the 12-year period from 2008 through 2019, the contractor paid an average of over $450,000 in property taxes annually. Close to 90 percent of these taxes generate local rather than state revenue, and therefore represent a significant but indirect benefit of private ownership of the prison. The remaining 10 percent funds state school equalizations and the university system. Subtracting this property tax revenue from cost calculations reduces the private prison’s cost per inmate per day by around 25 cents.
Comparing Costs Is Complicated by Variable Services and Economies of ScaleUltimately, comparing the costs of these prisons as if they were competitive entities can be misleading. This is because the department uses the four prisons as four components of a single system of incarceration. The contract prisons are cheaper than MSP per inmate per day, but do not offer the same volume of services. Work assignments, healthcare services, and programming are in greater abundance at CCC than at the county regional prisons, and in far greater abundance at MSP than at any of the contracted facilities. Offenders are transferred between these institutions frequently to meet their classification, healthcare, programming, and work assignment needs. This will be discussed in more detail in Chapter IV.
ConClusion
Per inmate cost differences between MSP and the contract prisons are driven in part by costs of healthcare services, which are disproportionate at MSP because it accommodates many inmates with more treatment-intensive medical conditions. When healthcare service costs are removed, differences in per inmate costs between MSP and the contract prisons are diminished. However, direct comparison of prison costs is complicated by how different the prisons are from one another, their sizes, and their payment models. Any cost outcomes stemming from potential differences in recidivism rates should be considered in this context.
Recidivism Rate and Time-to-Parole AnalysisOne of our primary goals was to determine how successful the four prisons were at rehabilitating their inmates, relative to one another. We used recidivism rate as the primary measure of rehabilitation. While many factors can influence an offender’s return to prison, including many factors over which the prison has no control,
31
18P-08
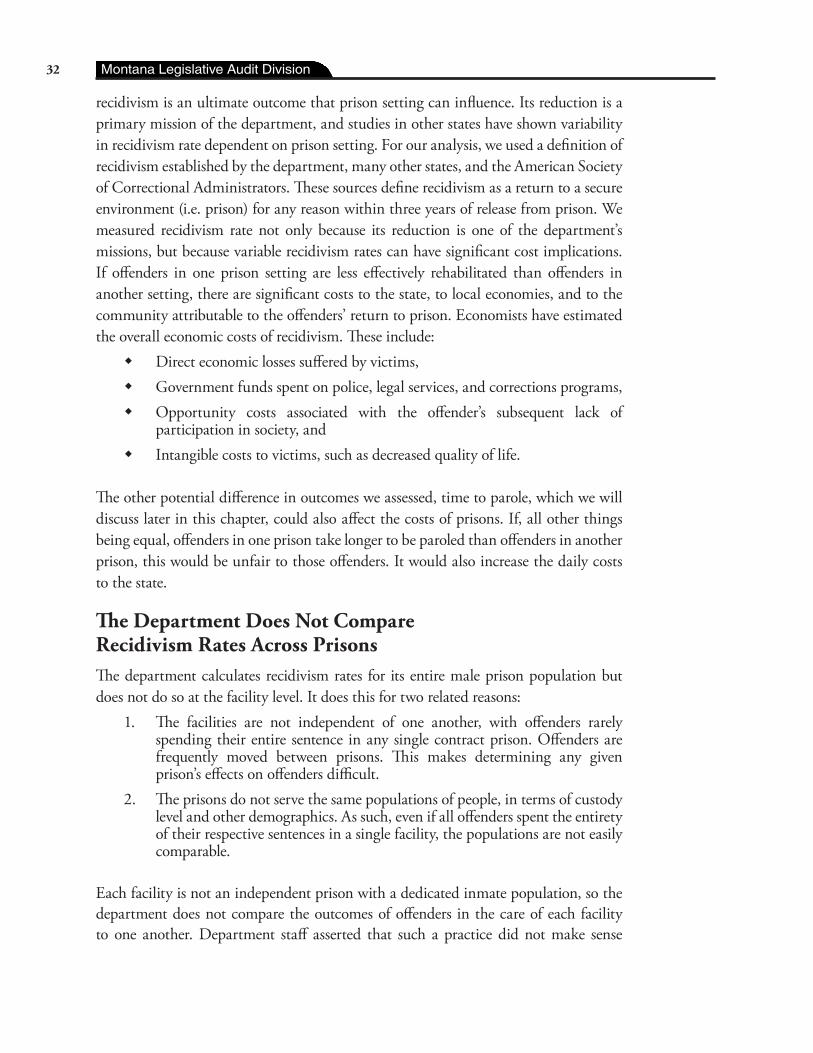
recidivism is an ultimate outcome that prison setting can influence. Its reduction is a primary mission of the department, and studies in other states have shown variability in recidivism rate dependent on prison setting. For our analysis, we used a definition of recidivism established by the department, many other states, and the American Society of Correctional Administrators. These sources define recidivism as a return to a secure environment (i.e. prison) for any reason within three years of release from prison. We measured recidivism rate not only because its reduction is one of the department’s missions, but because variable recidivism rates can have significant cost implications. If offenders in one prison setting are less effectively rehabilitated than offenders in another setting, there are significant costs to the state, to local economies, and to the community attributable to the offenders’ return to prison. Economists have estimated the overall economic costs of recidivism. These include:
� Direct economic losses suffered by victims, � Government funds spent on police, legal services, and corrections programs, � Opportunity costs associated with the offender’s subsequent lack of
participation in society, and � Intangible costs to victims, such as decreased quality of life.
The other potential difference in outcomes we assessed, time to parole, which we will discuss later in this chapter, could also affect the costs of prisons. If, all other things being equal, offenders in one prison take longer to be paroled than offenders in another prison, this would be unfair to those offenders. It would also increase the daily costs to the state.
The Department Does Not Compare Recidivism Rates Across PrisonsThe department calculates recidivism rates for its entire male prison population but does not do so at the facility level. It does this for two related reasons:
1. The facilities are not independent of one another, with offenders rarely spending their entire sentence in any single contract prison. Offenders are frequently moved between prisons. This makes determining any given prison’s effects on offenders difficult.
2. The prisons do not serve the same populations of people, in terms of custody level and other demographics. As such, even if all offenders spent the entirety of their respective sentences in a single facility, the populations are not easily comparable.
Each facility is not an independent prison with a dedicated inmate population, so the department does not compare the outcomes of offenders in the care of each facility to one another. Department staff asserted that such a practice did not make sense
32 Montana Legislative Audit Division
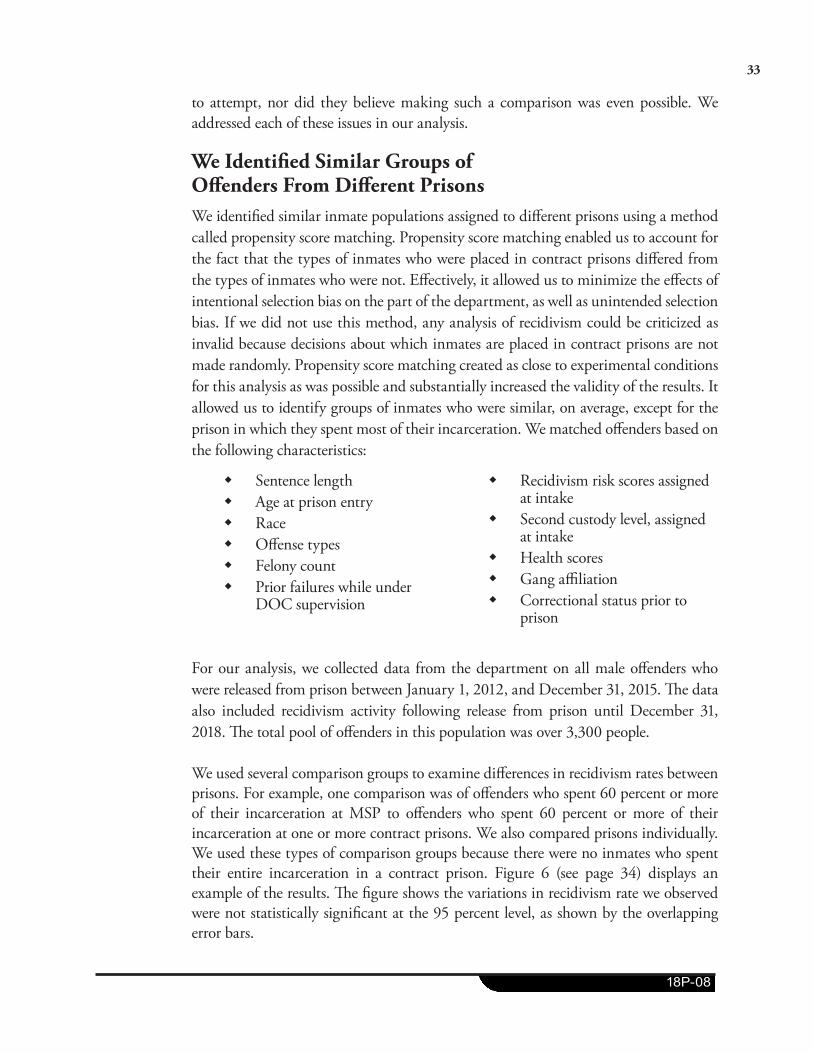
to attempt, nor did they believe making such a comparison was even possible. We addressed each of these issues in our analysis.
We Identified Similar Groups of Offenders From Different PrisonsWe identified similar inmate populations assigned to different prisons using a method called propensity score matching. Propensity score matching enabled us to account for the fact that the types of inmates who were placed in contract prisons differed from the types of inmates who were not. Effectively, it allowed us to minimize the effects of intentional selection bias on the part of the department, as well as unintended selection bias. If we did not use this method, any analysis of recidivism could be criticized as invalid because decisions about which inmates are placed in contract prisons are not made randomly. Propensity score matching created as close to experimental conditions for this analysis as was possible and substantially increased the validity of the results. It allowed us to identify groups of inmates who were similar, on average, except for the prison in which they spent most of their incarceration. We matched offenders based on the following characteristics:
� Sentence length � Age at prison entry � Race � Offense types � Felony count � Prior failures while under
DOC supervision
� Recidivism risk scores assigned at intake
� Second custody level, assigned at intake
� Health scores � Gang affiliation � Correctional status prior to
prison
For our analysis, we collected data from the department on all male offenders who were released from prison between January 1, 2012, and December 31, 2015. The data also included recidivism activity following release from prison until December 31, 2018. The total pool of offenders in this population was over 3,300 people.
We used several comparison groups to examine differences in recidivism rates between prisons. For example, one comparison was of offenders who spent 60 percent or more of their incarceration at MSP to offenders who spent 60 percent or more of their incarceration at one or more contract prisons. We also compared prisons individually. We used these types of comparison groups because there were no inmates who spent their entire incarceration in a contract prison. Figure 6 (see page 34) displays an example of the results. The figure shows the variations in recidivism rate we observed were not statistically significant at the 95 percent level, as shown by the overlapping error bars.
33
18P-08
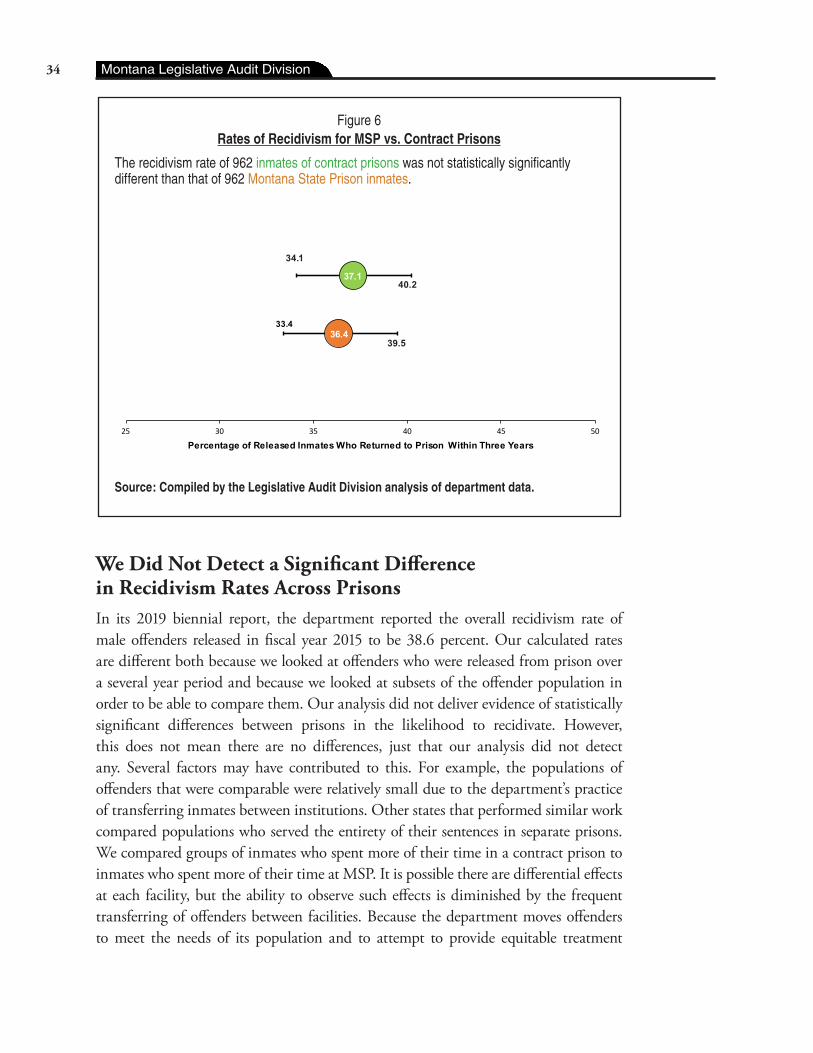
Figure 6Rates of Recidivism for MSP vs. Contract Prisons
The recidivism rate of 962 inmates of contract prisons was not statistically significantly different than that of 962 Montana State Prison inmates.
37.1
36.4
25 30 35 40 45 50
Percentage of Released Inmates Who Returned to Prison Within Three Years
The recidivism rate of 962 inmates of Contract Prisons was not statistically significantly different than that of 962 Montana State Prison inmates.
33.4
Source: Compiled by the Legislative Audit Division analysis of department data.
We Did Not Detect a Significant Difference in Recidivism Rates Across PrisonsIn its 2019 biennial report, the department reported the overall recidivism rate of male offenders released in fiscal year 2015 to be 38.6 percent. Our calculated rates are different both because we looked at offenders who were released from prison over a several year period and because we looked at subsets of the offender population in order to be able to compare them. Our analysis did not deliver evidence of statistically significant differences between prisons in the likelihood to recidivate. However, this does not mean there are no differences, just that our analysis did not detect any. Several factors may have contributed to this. For example, the populations of offenders that were comparable were relatively small due to the department’s practice of transferring inmates between institutions. Other states that performed similar work compared populations who served the entirety of their sentences in separate prisons. We compared groups of inmates who spent more of their time in a contract prison to inmates who spent more of their time at MSP. It is possible there are differential effects at each facility, but the ability to observe such effects is diminished by the frequent transferring of offenders between facilities. Because the department moves offenders to meet the needs of its population and to attempt to provide equitable treatment
40.2
39.5
34.1
34 Montana Legislative Audit Division
throughout the system, it is difficult to discern any effect a given prison has on recidivism. Additionally, the data from OMIS were not complete or reliable going back in time, limiting our ability to use data from additional years.
Analysis Did Not Provide Evidence Contract Prisons Delay ParoleWe conducted a similar assessment of time from inmates’ parole eligibility to their release from prison. Critics of private prisons assert for-profit prisons have financial incentives to delay the parole of offenders, as every day an offender remains in the facility represents a per diem profit. Studies in some other states have produced evidence that inmates of private prisons take a statistically significant longer amount of time to be paroled than inmates of similar public institutions. Because contract prison staff can provide input during the parole process, there is a mechanism for such influence to occur. Accordingly, we compared time-to-parole for groups of matched offenders depending on which facilities they spent most of their sentences in and on in which facilities their first parole hearing was held. We again used propensity score matching to identify groups of similar inmates who had spent differing amounts of time in each prison setting and who had initial parole hearings in different prisons. We then compared the average number of days offenders were released from prison after they became parole eligible. We did this for four different comparison groups. For example, in one case, we compared a group of 220 inmates whose first parole hearing was held at MSP to a similar group of 220 inmates whose first parole hearing was held at a contract prison.
Based on these comparisons, we found no evidence time spent at any of the contract prisons resulted in a longer period to release after becoming eligible for parole. We also found no evidence parole hearings taking place at the contract prisons resulted in a longer period to release. In fact, our results demonstrated the opposite. In three of our four models, inmates who spent more time at MSP or had their first parole hearing at MSP spent significantly more days in prison after becoming parole eligible than their contract prison counterparts did. Figure 7 (see page 36) shows the results of comparing time-to-parole for inmates whose first parole hearing occurred at MSP to inmates whose first parole hearing was held at a contract prison.
35
18P-08
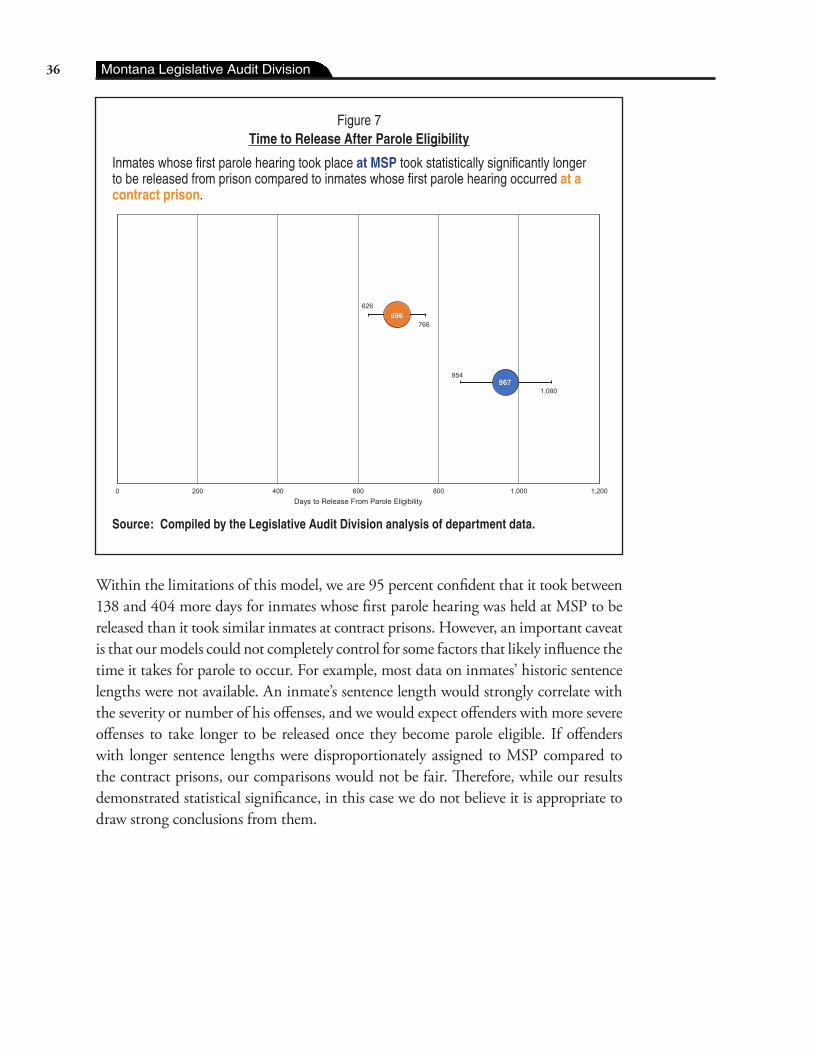
Figure 7Time to Release After Parole Eligibility
Inmates whose first parole hearing took place at MSP took statistically significantly longer to be released from prison compared to inmates whose first parole hearing occurred at a contract prison.
967
696
0 200 400 600 800 1,000 1,200Days to Release From Parole Eligibility
Figure 7 Time to Release After Parole EligibilityInmates whose first parole hearing took place at MSP took statistically significantly longer to be released from prison compared to inmates whose first parole hearing occurred at a contract prison.
766
626
854
1,080
Source: Compiled by the Legislative Audit Division analysis of department data.
Within the limitations of this model, we are 95 percent confident that it took between 138 and 404 more days for inmates whose first parole hearing was held at MSP to be released than it took similar inmates at contract prisons. However, an important caveat is that our models could not completely control for some factors that likely influence the time it takes for parole to occur. For example, most data on inmates’ historic sentence lengths were not available. An inmate’s sentence length would strongly correlate with the severity or number of his offenses, and we would expect offenders with more severe offenses to take longer to be released once they become parole eligible. If offenders with longer sentence lengths were disproportionately assigned to MSP compared to the contract prisons, our comparisons would not be fair. Therefore, while our results demonstrated statistical significance, in this case we do not believe it is appropriate to draw strong conclusions from them.
36 Montana Legislative Audit Division
ConClusion
Analysis did not provide statistically significant evidence that the type of prison a Montana offender spends time in affects the likelihood that he will recidivate, nor did it provide evidence that contract prisons increase the time it takes for inmates to be paroled from prison. As such, there is no need to adjust contract prison costs to account for variable rehabilitative effectiveness.
37
18P-08

38
Chapter IV – The Inmate Transfer Process
IntroductionIn this chapter, we discuss how the Department of Corrections (department) moves offenders between the four facilities to manage the population’s various needs. These needs include healthcare, custody level, programming, safety, and work assignment requirements. Offenders are transferred between prisons with high frequency to address their needs. We reviewed documentation related to inmate transfers that occurred between calendar years 2015 and 2018. Our work found the process of placing and transferring offenders in contract prisons to be reliant on inefficient systems that increase the risk of inappropriate placement. The department’s Offender Management Information System (OMIS) does not facilitate the transfer process. This makes staff’s jobs more difficult, puts offenders at risk of improper placement, and limits the compilation and assessment of transfer-related data.
Inmates Are Frequently Transferred Between PrisonsBecause the prison system is reliant upon transferring offenders between prisons to meet their needs, we determined how many times male offenders are transferred between prisons annually. We calculated the total numbers of transfers in and out of each contract prison over a 4-year period, from 2015 through 2018. Each year, more than 1,000 offender transfers between prisons occur. This number represents the total number of inmates moved from one prison to another, not the number of transport trips taken. It could include the same offender being transferred multiple times. A graphical summary of the data for the 2015 through 2019 period is shown in Figure 8 (see page 40).
39
18P-08
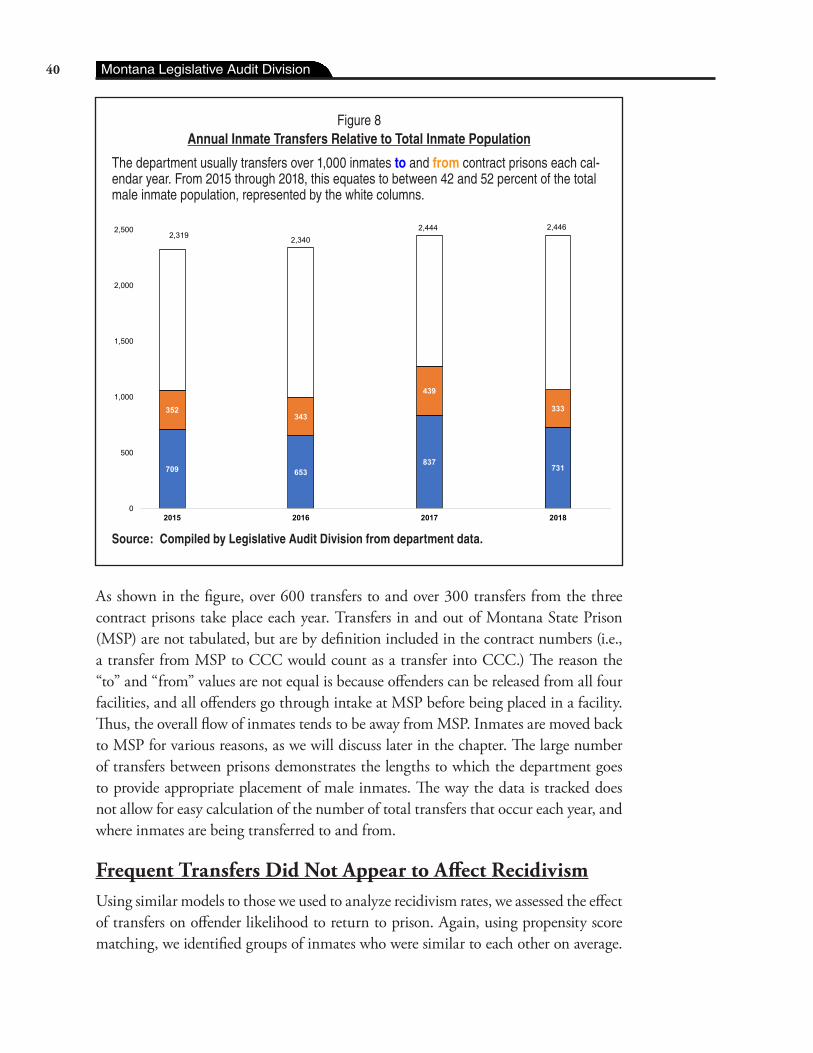
Figure 8Annual Inmate Transfers Relative to Total Inmate Population
The department usually transfers over 1,000 inmates to and from contract prisons each cal-endar year. From 2015 through 2018, this equates to between 42 and 52 percent of the total male inmate population, represented by the white columns.
Source: Compiled by Legislative Audit Division from department data.
709 653837
731
352343
439
333
0
500
1,000
1,500
2,000
2,500
3,000
2015 2016 2017 2018
The department usually transfers over 1,000 inmates to and from contract prisons each calendar year. From 2015 through 2018, this equates to between 42 and 52 percent of the total male inmate population.
2,3402,444 2,446
2,319
Source: Compiled by Legislative Audit Division from department data.
As shown in the figure, over 600 transfers to and over 300 transfers from the three contract prisons take place each year. Transfers in and out of Montana State Prison (MSP) are not tabulated, but are by definition included in the contract numbers (i.e., a transfer from MSP to CCC would count as a transfer into CCC.) The reason the “to” and “from” values are not equal is because offenders can be released from all four facilities, and all offenders go through intake at MSP before being placed in a facility. Thus, the overall flow of inmates tends to be away from MSP. Inmates are moved back to MSP for various reasons, as we will discuss later in the chapter. The large number of transfers between prisons demonstrates the lengths to which the department goes to provide appropriate placement of male inmates. The way the data is tracked does not allow for easy calculation of the number of total transfers that occur each year, and where inmates are being transferred to and from.
Frequent Transfers Did Not Appear to Affect RecidivismUsing similar models to those we used to analyze recidivism rates, we assessed the effect of transfers on offender likelihood to return to prison. Again, using propensity score matching, we identified groups of inmates who were similar to each other on average.
40 Montana Legislative Audit Division
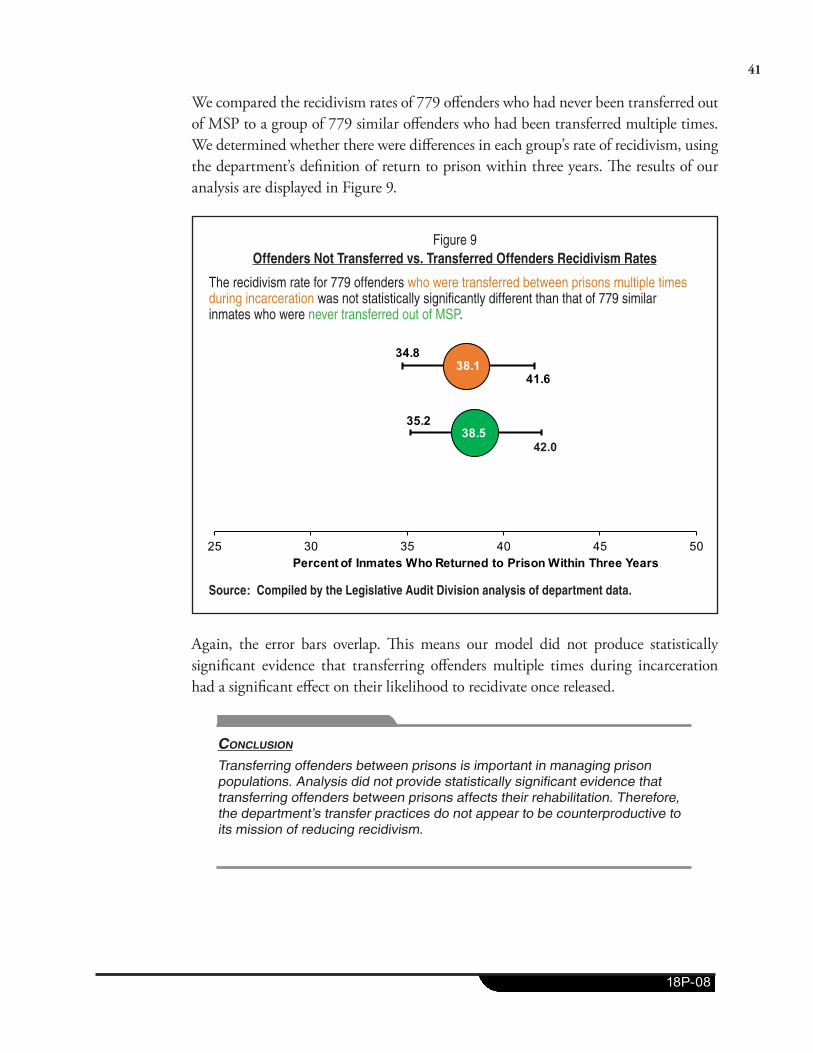
We compared the recidivism rates of 779 offenders who had never been transferred out of MSP to a group of 779 similar offenders who had been transferred multiple times. We determined whether there were differences in each group’s rate of recidivism, using the department’s definition of return to prison within three years. The results of our analysis are displayed in Figure 9.
Figure 9Offenders Not Transferred vs. Transferred Offenders Recidivism Rates
The recidivism rate for 779 offenders who were transferred between prisons multiple times during incarceration was not statistically significantly different than that of 779 similar inmates who were never transferred out of MSP.
38.5
38.1
25 30 35 40 45 50Percent of Inmates Who Returned to Prison Within Three Years
35.2
34.8
41.6
42.0
Source: Compiled by the Legislative Audit Division analysis of department data.
Again, the error bars overlap. This means our model did not produce statistically significant evidence that transferring offenders multiple times during incarceration had a significant effect on their likelihood to recidivate once released.
ConClusion
Transferring offenders between prisons is important in managing prison populations. Analysis did not provide statistically significant evidence that transferring offenders between prisons affects their rehabilitation. Therefore, the department’s transfer practices do not appear to be counterproductive to its mission of reducing recidivism.
41
18P-08
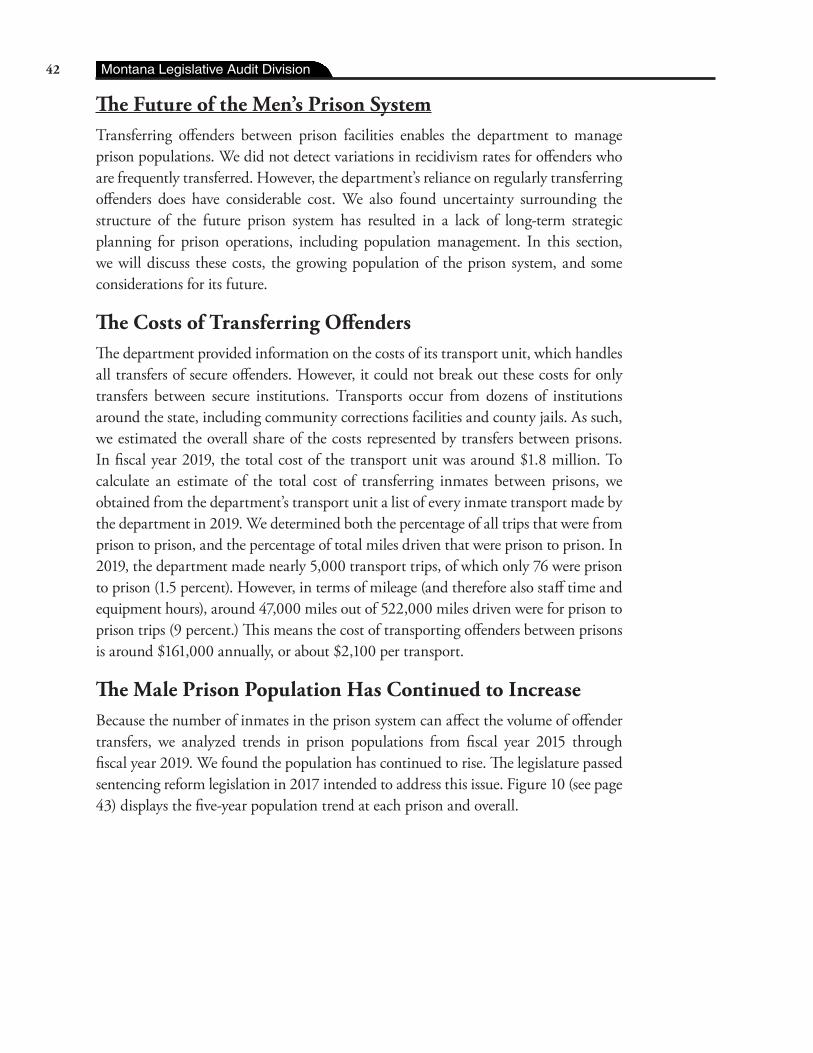
The Future of the Men’s Prison SystemTransferring offenders between prison facilities enables the department to manage prison populations. We did not detect variations in recidivism rates for offenders who are frequently transferred. However, the department’s reliance on regularly transferring offenders does have considerable cost. We also found uncertainty surrounding the structure of the future prison system has resulted in a lack of long-term strategic planning for prison operations, including population management. In this section, we will discuss these costs, the growing population of the prison system, and some considerations for its future.
The Costs of Transferring OffendersThe department provided information on the costs of its transport unit, which handles all transfers of secure offenders. However, it could not break out these costs for only transfers between secure institutions. Transports occur from dozens of institutions around the state, including community corrections facilities and county jails. As such, we estimated the overall share of the costs represented by transfers between prisons. In fiscal year 2019, the total cost of the transport unit was around $1.8 million. To calculate an estimate of the total cost of transferring inmates between prisons, we obtained from the department’s transport unit a list of every inmate transport made by the department in 2019. We determined both the percentage of all trips that were from prison to prison, and the percentage of total miles driven that were prison to prison. In 2019, the department made nearly 5,000 transport trips, of which only 76 were prison to prison (1.5 percent). However, in terms of mileage (and therefore also staff time and equipment hours), around 47,000 miles out of 522,000 miles driven were for prison to prison trips (9 percent.) This means the cost of transporting offenders between prisons is around $161,000 annually, or about $2,100 per transport.
The Male Prison Population Has Continued to IncreaseBecause the number of inmates in the prison system can affect the volume of offender transfers, we analyzed trends in prison populations from fiscal year 2015 through fiscal year 2019. We found the population has continued to rise. The legislature passed sentencing reform legislation in 2017 intended to address this issue. Figure 10 (see page 43) displays the five-year population trend at each prison and overall.
42 Montana Legislative Audit Division
Figure 10Male Inmate Population Trends
The prison population continues to grow at MSP, while regional prisons’ inmate populations remain steady. Data represents fiscal years 2015-2019.
Source: Compiled by Legislative Audit Division from department data.
0
500
1,000
1,500
2,000
2,500
3,000
Jul-1
5Au
g-15
Sep-
15O
ct-1
5N
ov-1
5D
ec-1
5Ja
n-15
Feb-
15M
ar-1
5Ap
r-15
May
-15
Jun-
15Ju
l-16
Aug-
16Se
p-16
Oct
-16
Nov
-16
Dec
-16
Jan-
16Fe
b-16
Mar
-16
Apr-1
6M
ay-1
6Ju
n-16
Jul-1
7Au
g-17
Sep-
17O
ct-1
7N
ov-1
7D
ec-1
7Ja
n-17
Feb-
17M
ar-1
7Ap
r-17
May
-17
Jun-
17Ju
l-18
Aug-
18Se
p-18
Oct
-18
Nov
-18
Dec
-18
Jan-
18Fe
b-18
Mar
-18
Apr-1
8M
ay-1
8Ju
n-18
Jul-1
9Au
g-19
Sep-
19O
ct-1
9N
ov-1
9D
ec-1
9Ja
n-19
Feb-
19M
ar-1
9Ap
r-19
May
-19
Jun-
19
The prison population continues to grow at MSP, while regional prisons' inmate populations remain steady. Data represents fiscal years 2015-2019.
Montana State Prison
Crossroads Correctional Center
Dawson County Correctional Facility
Cascade County Regional Prison
Source: Compiled by Legislative Audit Division from department data.
As shown in the figure above, the overall inmate population has risen since 2015. However, we found there were differences between the various prisons. The regional prisons’ populations have remained stable, while MSP’s has steadily grown. CCC’s population has exhibited some variability, particularly in 2018, when it dropped by around 9 percent. According to both department and contractor staff, the state withheld offenders from CCC during contract negotiations. Eventually, an agreement was reached between the parties, and CCC’s population returned to normal. The current contract for CCC expires in 2021. The regional prisons’ contracts expire in 2024 and 2029.
The State Does Not Have a Long-Term Plan for the Men’s Prison SystemAs part of our work, we spoke to representatives of the contract prisons. Some administrators of contract prisons expressed dissatisfaction with the contract agreements with the state. This was in part due to the freezing of their per diem rates
43
18P-08
by the legislature and in part due to differences of opinion with past and current department management. While contract ending dates are staggered, one or more of the contractors could decline to renew their contracts. If that were to occur, the department does not currently have the capacity to reabsorb these offenders. The state does not have a contingency plan for these scenarios.
The current prison system for male offenders in Montana was not an original design intention. It was developed as a response by the legislature, the governor, and the department as a cost-sensitive solution to a rising adult male offender population. The contracts for all three prisons were long-term to allow for the capital investments made by the contractors. However, the state has deferred planning for changes to its men’s prison system and growing male population. Changes are not up to the department, but instead an issue to be addressed by the legislature and the governor. This uncertainty has impeded the development of a long-term vision for the state’s male incarceration system.
Other States Struggle With Similar IssuesHighlighting the risks inherent in contracting for prison operations, Colorado recently closed a private prison. Its Department of Corrections was not prepared to deal with effects of that decision. It had to relocate 650 offenders for whom it did not have space. Colorado had to overcrowd other facilities and use facilities ill-suited to the displaced offenders. Montana’s current system relies on prison contractors, of which there are few. In fact, Montana has one of the highest proportions of total offenders housed in contract prisons of any state. If contract prison administrators decide not to renew their contracts with the state, MSP does not have the capacity to house these offenders. There are approximately 900 offenders currently housed in contract prisons. Even if contracts are renewed or new requests for proposal are issued, current population trends imply that the state’s inmate population is likely to increase. Given that the department does not have enough prison space for its current population, the future of the men’s prison system remains an area of concern. Lack of capacity for inmates could result in serious safety and financial consequences.
ConClusion
Long-term prison contracts and policy disagreement have inhibited development of strategic population management planning, requiring the use of frequent inmate transfers.
44 Montana Legislative Audit Division
The Offender Transfer Process Can Be ImprovedThe department’s Contract Placement Bureau (CPB) coordinates placement and transfers between prisons with various other department entities, including the Clinical Division, the Board of Pardons and Parole, and specific prison housing units.
When CPB staff are notified by other MSP staff of offenders who need to be placed at or moved back to MSP, they must determine how to make space for the incoming offenders. To make space, they frequently must transfer an offender out of MSP to a contract prison. To identify offenders eligible to be moved, they consult multiple databases. First, they use a database that generates a list of offenders who are eligible to be moved. This database contains records for every offender in the prison system. The database contains offender records that can be flagged to indicate they cannot be moved to a contract facility. For example, one flag indicates if an offender is currently in sex offender treatment, which is available only at MSP. Another flag designates an inmate must remain at MSP for medical reasons. CPB staff generate an initial list of offenders who do not have these flags, which is usually hundreds of offenders long. However, they cannot select an offender based on this list alone and must cross-reference each inmate’s record in OMIS. The OMIS record could contain other information about inmates precluding them from being eligible for transfer. This could be something added by an MSP staff member in the narrative field of the record, a recent change in health status of the offender, or the offender’s place on a waiting list for programs or jobs only available at MSP.
The Transfer Process Can Result in Inappropriate Inmate TransfersCPB staff reported this process to be burdensome and inefficient. Because not all the information is centralized in OMIS, it is time-consuming to determine which offenders can be moved. The system is also prone to mistakes. For example, offenders with specific medical needs have been placed in facilities that cannot accommodate those needs, and they must be sent back to MSP immediately. In other cases, there is not enough information in OMIS to determine appropriate placement. For example, an offender may be eligible for MSP, CCC, or CCRP according to his documented medical needs. However, the specific medical requirements of their condition might not be conducive with some of the contract facilities. If no one notifies CPB staff of this, they will be unaware of these medical requirements and will initiate the transfer anyway. Department staff report that such errors have occurred. However, the department does not have data on how often improper placement of inmates occurs because its database does not track transfers effectively.
45
18P-08
Gang status is another factor influencing offender placement. The CPB manages gang conflict in part by keeping rival gangs separated between prisons. This is a benefit of using multiple prison facilities, as gangs and other high-risk individuals can be separated. There are significant risks as well, as the CPB must ensure gang members are not placed in a cell block occupied by rival gang members at another facility. If this were to happen, department staff indicated it could put the well-being of the transferred offender at risk.
This is a simplified description of the factors that department staff must consider when making placement decisions. The current process makes it difficult and inefficient for department staff to consider dozens of competing demographic issues related to prison placement. This is because a centralized offender placement information system does not currently exist. With the current system requiring staff to access multiple sources of information, the department cannot guarantee offenders are optimally placed according to their needs or to help reduce the need for future transfers.
Inmates Are Transferred to Other Prisons for Many ReasonsDepartment policy and procedure dictates all inmates entering MSP be considered for potential placement in contract facilities to ensure the overall population is managed in a safe, secure, and effective manner. Inmates may be placed in any facility based on department and offender needs. In addition to available bed space at each facility, placements may be made based on the following demographic criteria:
� Criminal history, � Detainers (requests from other
criminal justice entities to hold the offender),
� Classification/custody, � Medical/mental health needs, � Victim needs, � Separation needs, � Institutional needs, � Parole eligibility/sentence
review, � Discharge date,
� Length of sentence, � Disciplinary record, � Rehabilitative programming
needs, � Escape history, � Mitigating or aggravating
circumstances, � Special management, � Any other area as determined
by CPB staff, and � Department fiscal
responsibilities.
The department has considerable flexibility to place offenders in contract facilities as it deems necessary. Contractor staff reported the department to be accommodating of contractor requests to move offenders to other facilities when contractor staff believe placement of an inmate in the contract prison is no longer appropriate. In addition
46 Montana Legislative Audit Division
to the many reasons offenders need to be moved, MSP staff report they attempt to avoid housing offenders at the two regional prisons for several consecutive years. This is because these facilities have limited services and space compared to the other prisons. However, there is no automated process identifying how long offenders are incarcerated in regional prisons. Analysis of our sample of 1,053 surveyed offenders found 657 offenders who spent time at CCRP or DCCF. We determined 18 offenders (3 percent) spent more than four years in those locations. One offender spent over 7.5 years at DCCF, according to our analysis of department data.
The Reasons Inmates Are Transferred Are Not in OMIS To determine the reasons offenders are transferred, we assessed the department’s documented transfer reasons. OMIS cannot easily provide data on the number of times an offender has been transferred, nor can it provide information on the reasons for transfers. An individual’s record in OMIS contains all dates the inmate exited or entered a secure facility. This information can be tallied, but it includes movements other than transfers. For example, OMIS shows when offenders leave a prison for a hospital stay. In the event of a transfer to another institution, the record does not indicate why the transfer occurred. There is no database containing information on reasons why offenders are transferred between institutions.
Reasons for Transfer Are Not Always RecordedAs part of our audit work, we reviewed a sample of “Move Authorization Slips” from the CPB. These documents authorize the transfer of specific offenders and notify various department entities when they will occur. Each authorization slip represents a specific transport trip. While the reason an offender is moved from a contract prison to MSP is documented, the reason for transfers from MSP to a contract prison is typically population management. Population management means that there are not enough beds at MSP to accommodate offenders entering prison or being transferred back, so inmates must be moved out to make space. Occasionally, offenders will be moved from MSP to contract prisons for other reasons, such as at the request of the offender or for the offender’s safety, but these reasons are not usually documented on the move authorization slips.
We reviewed 83 move authorization slips, which included most of the transfers to and from CCC and CCRP in 2018. These documents represented the movement of 435 offenders between these two facilities and MSP. Move authorization slips are retained in digital form to record transfer authorizations, but are not centrally collected or tabulated by the department. Two-thirds of authorized transfers we reviewed did not indicate a reason why the offender was moved. According to department staff, a large majority of these were for population management.
47
18P-08
OMIS Placement Module Would Reduce Risk of Inappropriate Inmate PlacementThe department attempts to ensure appropriate and approximately equal treatment of the offenders despite the inequalities of the prisons. The department frequently transfers offenders between prisons, and the reasons for these transfers are numerous. However, the process by which inmates are selected for placement is complicated and lacks transparency. The transfer process relies on human judgment, manual verification, and communication between various units within the department. Because of this, both the offender and the state are subject to the risks of inappropriate prison placement.
The department does not have a module in OMIS specifically for managing offender placement at secure facilities. Some department staff indicated such a module would be beneficial. However, the department has not prioritized the implementation of an offender placement module in OMIS for several reasons. OMIS has been upgraded multiple times since its initial 2008 implementation, with each upgrade adding more functionality. Demands for changes in OMIS are often dictated by new legal requirements, and most existing modules within OMIS have “wish lists” of desired improvements. Examples include sentence calculation, supervisory authority, medical review, and incident reporting modules. Meanwhile, the department’s IT staff recently suffered significant turnover and attrition, which has delayed nonessential improvements to OMIS. The department could absorb the costs of implementing a placement module in its existing budget, but it could delay the timelines for other planned improvements. We cannot assert that a population management module is more pressing than the other items on the department’s OMIS agenda. However, the implementation of an offender placement module would better facilitate prison population management. It would improve contracted bed placement efficiency, ensure placement is conducive to offender needs, and make MSP’s population management practices more transparent.
ReCommendation #2
We recommend the Department of Corrections implement within the Offender Management Information System a population placement module that tracks offender placement requirements, transfer history and reasons, and time spent in specific prisons.
48 Montana Legislative Audit Division
Department of CorreCtions
Department response

A-1

A-2