Embed Size (px)
Citation preview

Journal of Informetrics, vol. 4 (4), 2010, 512-523 Proof read version (20/06/2010)
1
Publication Point Indicators: A Comparative Case Study of two Publication Point Systems and Citation Impact in an Interdisciplinary Context Anita Elleby, The National Museum, Department of Conservation, I. C. Modewegs Vej, Brede,
DK 2800 Kongens Lyngby, Denmark. [email protected]
Peter Ingwersen, Royal School of Library and Information Science, Birketinget 6, DK 2300
Copenhagen S, Denmark. [email protected] – corresponding author.
Abstract: The paper presents comparative analyses of two publication point systems, The Norwegian
and the in-house system from the interdisciplinary Danish Institute of International Studies (DIIS), used
as case in the study for publications published 2006, and compares central citation-based indicators
with novel publication point indicators (PPIs) that are formalized and exemplified. Two diachronic
citation windows are applied: 2006-07 and 2006-08. Web of Science (WoS) as well as Google Scholar
(GS) are applied to observe the cite delay and citedness for the different document types published by
DIIS, journal articles, book chapters/conference papers and monographs. Journal Crown Indicator (JCI)
calculations was based on WoS. Three PPIs are proposed: the Publication Point Ratio (PPR), which
measures the sum of obtained publication points over the sum of the ideal points for the same set of
documents; the Cumulated Publication Point Indicator (CPPI), which graphically illustrates the
cumulated gain of obtained vs. ideal points, both seen as vectors; and the normalized Cumulated
Publication Point Index (nCPPI) that represents the cumulated gain of publication success as index
values, either graphically or as one overall score for the institution under evaluation.
The case study indicates that for smaller interdisciplinary research institutions the cite delay is
substantial (2-3 years to obtain a citedness of 50 %) when applying WoS for articles. Applying GS
implies a shorter delay and much higher citedness for all document types. Statistical significant
correlations were only found between WoS and GS and the two publication point systems in between,
respectively. The study demonstrates how the nCPPI can be applied to institutions as evaluation tools
supplementary to JCI in various combinations, in particular when institutions include humanistic and
social science disciplines.
Keywords: Citation analysis; Citation impact; Publication point indicators; Norwegian system; Web
of Science; Google Scholar; Publication Point Ratio; Normalized Cumulated Publication Point Index
1 Introduction Scientometric analyses of countries, regions, institutions and research groups are increasingly
applied by governments in order to measure the research production and its impact via publication
and citation-based indicators. The purpose is either simply to monitor the research development and
to understand the scientific communication networks or more recently to use the indicators directly
as instruments in the allocation of public research funding. The latter application of scientometric
indicators has raised discussions in the academic world in several Scandinavian countries
(Sivertsen, 2007a+b; Sandstrom & Sandstrom, 2009), Great Britain (Harnad, 2008) and Australia
(Butler, 2003; 2008), to name a few.
First of all, research evaluation indicators based on citations and publications, e.g., common
citation impact or the H-index-like measures are influenced by a time-delay between publication
date and citation analysis point in time. For instance, when using the standard Journal Citation
Report Journal Impact Factor (JCR-JIF) available from Thomson-Reuters‘ Web of Science (WoS)
the delay is up to 2 years. Recently Ingwersen studied the influence of short diachronic citation
windows on highly aggregated units, such as countries at research field levels (2007). The study
indicated that a two year citation window correlates with results obtained from a five year window
at this aggregation level for the sciences, medicine, engineering and certain social science fields.
Journal of Informetrics, vol. 4 (4), 2010, 512-523 Proof read version (20/06/2010)
2
Secondly, for the sake of implicit quality assurance both citation and publication analyses are
based on peer-reviewed sources, like journals and conference proceedings. This implies that the
scholarly communication model known from science and medicine with its peer-review tradition is
regarded the prevailing one. As a consequence this model is often forced upon academic
communities commonly without that tradition, such as many humanistic and some social science
fields. This fact has caused debate about the application of indicators in those fields. Third, for
many countries the humanistic and social science fields are still insufficiently covered in the highly
structured and costly citation indexes, such as Scopus or WoS (Moed, 2005), but increasingly
included in open access indexes like Google Scholar (Jacso, 2008) or Google Books which, albeit,
are less structured.
According to Sivertsen (2007b) these were some of the central reasons behind the development
of the Norwegian publication point system, which attempts to cover all academic Norwegian
research publications from all fields. The system does not rely on citations but, like for citation-
based indicators, assigns points to peer-reviewed publications according to document type and
perceived prestige of the publication channel. The Norwegian system relies basically on two quality
levels according to peer judgment. The major issue was to convince the humanistic fields of the
advantage of the peer-review model, and that typical humanistic publication vehicles like
monographs got their fair share of points. Similar research monitor and fund allocation systems,
based on publication counting and assigned points, are at present under development and use in
Denmark and elsewhere.
Citation-based indicators provide, albeit delayed, a world-wide peer recognition of individual
works (or units at other levels of aggregation) that cumulates year by year. A publication point
system provides an immediate assessment of publication success, not necessarily quality, primarily
based on the perceived value of the publication channels, such as journals or monographic
publishers. One might indeed argue that the latter kinds of systems constitute supplementary
evaluation devices to citation-based and peer-review-based assessments of research quality.
The advantage over citation-based indicators lies basically in the immediacy and the fact that the
entire national research profile, including humanities, can be scored once they are published in
peer-reviewed channels. One relies not on citation indexes alone, but may include domain-
dependent databases and local national indexes as well in the capture of relevant research
publications to be assigned points. In the Norwegian case the result is an invaluable updated open
access database of all the national research, including assigned points and other relevant research
information. By assigning higher value to certain publication channels the system encourages to
publish in such channels. Points are fragmented according to institutional affiliations of the authors.
A central feature of the Norwegian publication point system is that the scholarly communities
themselves are in control of the selection of and value assignment to journals, conferences and
publishers, i.e., their levels of perceived quality.
In the current versions of national publication point systems non-peer-reviewed publications,
e.g., ‗work in progress papers‘, research reports or research mediation made as popularized
overview articles and books, do not count at all as research or academic-associated ‗publication
activity‘. Such activities do rarely receive explicit recognition but are nevertheless regarded
valuable by society. Although a kind of quality component exists by means of the two-level scoring
system, this is a rather implicit and crude quality feature, in particular in comparison to citation-
based systems for the sciences and medicine, assuming of course that citation impact somehow
corresponds to research quality. In fact, a publication point system may look even more simplistic
and unfair to the involved researchers (from the sciences and medicine, and their institutions) than a
two year ISI-JIF-based monitoring system. The latter scores signify the average global impact of all
papers in a journal aggregated over the particular contributions from an institution. The assignment

Journal of Informetrics, vol. 4 (4), 2010, 512-523 Proof read version (20/06/2010)
3
of this ‗international average‘ score to local papers and staff, even in a fragmented form, has for
long been regarded unfair and inadequate as monitoring instrument (Seglen, 1994).
Notwithstanding, and in contrast to publication point systems a larger differentiation actually exists
between the journal ‗impacts‘ given by the various JIFs, in particular if calculated in a diachronic
mode. Aside from simplistic summing-up of the assigned points per institution for funding
distribution purposes a publication point system lacks at present effective measures for comparative
analyses research groups, institutions or countries in between. Sophisticated research impact
indicators like the journal and field Crown Indicators (van Raan, 1999), similar to the field
normalized citation rate (Braun & Glänzel, 1990; Moed, 2005), cannot be applied easily to such
systems. However, ratios of papers published in upper-level channels may probably be used as a
crown-like indicator in publication point systems. Comparisons within a country of institutions is
possible but may suffer from insufficient normalization data (e.g., staff number; mean staff research
percentage; research time), and between countries may become hampered by different publication
point standards from country to country.
Further, there is a risk that any publication point system, as an unintended spin-off, may lead to
an increased application of salami-slicing publication behavior (Butler, 2003).
The motivations behind the present analysis are threefold. Primarily we wish to define, describe
and exemplify a novel range of Publication Point Indicators (PPI) that may be applied to
comparative analyses in research evaluation in general. Further, we wish to observe how an
interdisciplinary research institution containing humanities, social science and science fields
behaves with respect to citedness ratio and the cite delay from the event of publication to the
appearance of citations. Our motivation is that it does not give meaning to carry out citation
analyses over short analysis windows (2-3 years) for small-sized research units (less than 100 full-
time staff) if a large proportion of the published items, say >50 %, have not received citations
during that time frame. In particular, we assume that citation-based fund allocation systems may not
work adequately and fair towards smaller interdisciplinary units. We have selected the
interdisciplinary research institution Danish Institute for International Studies (DIIS), Copenhagen,
as case study, also because it applies a locally developed publication point system for research
monitoring and incentive.
Third, we are interested in observing the degree of correspondence between standard citation
counting and publication points assigned a typical interdisciplinary research institution according to
the Norwegian and local systems. A publication point system like the Norwegian one (Schneider,
2009) is in particular intended to be beneficial for interdisciplinary research institutions1. The
Norwegian two-level system has an inbuilt field normalization element since the high level
publication channels cannot include more than 20 percent of the field's publications. Fields with low
JCR-JIFs, like nursing, can now compete on more equal terms with fields in which JCR-JIFs are
substantially higher, like microbiology.
The range of novel PPIs described in the present study consists of two absolute indicators, the
Publication Point Ratio (PPR) and the Cumulated Publication Point Indicator (CPPI), and a
normalized version of the latter (nCPPI) to form an index. PPR signifies the raw ratio of publication
success. CPPI and nCPPI demonstrate the cumulated gain of publication success, either graphically
or as a single index value. They are based on the formalisms of the Cumulated Gain measures of
relevance applied in information retrieval performance evaluation (Kekäläinen & Järvelin, 2002).
Recently Järvelin & Persson (2008) proposed some of the Cumulated Gain measures to be
1 We apply the two Norwegian quality levels and lists of journals and proceedings with their corresponding points. The
Danish equivalent system has not yet established a consistent point structure, in particular not for monographs and parts
of books.

Journal of Informetrics, vol. 4 (4), 2010, 512-523 Proof read version (20/06/2010)
4
transformed into research evaluation indicators, but based on citation impact, e.g. the Discounted
Cumulated Impact index. Ahlgren & Järvelin (2010) have tested this index with positive results.
We believe that in particular the normalized Cumulated Publication Point Index (nCPPI) may
provide an attractive standardized indicator in comparative analyses when applying publication
point systems and may supplement citation-driven indicators at various aggregation levels and kinds
of research fields.
The contribution is organized as follows. The characteristics of DIIS and its local publication
point system as well as the Norwegian one are outlined, leading up to a description of the data
collection and analysis methods applied in the study. This is followed by the result section
consisting of analysis of the citation delay and citedness and comparisons of the two publication
point systems in between and with citation analyses of the same documents published by DIIS. The
description of the PPIs follows and the paper ends with a discussion section and conclusions.
1.1 The Danish Institute for International Studies - DIIS
The Danish Institute for International Studies (DIIS) was founded January 1, 2003 as a fusion of
four research institutions, thus creating a highly interdisciplinary independent research unit. In 2006
the full time staff number was 55 researchers. Table 1 displays the most productive disciplines of
DIIS (2007). Humanistic and social science fields are predominant, but also Agricultural,
Environmental and Geo-fields are represented.
Exactly because of its interdisciplinary nature DIIS found it difficult to apply citations as an
indicator for research quality and monitoring – see Table 3 for the total distribution of publication
and information types from DIIS 2006. As a consequence a local publication point system was
established that monitors peer-reviewed publications with DIIS researchers as (co)-authors: the
DIIS System (DIIS, 2007).
Table 1.
Disciplines. Danish Institute for International Studies (2007).
________________________________________ Agriculture, Water & Natural resources
Anthropology
Area Studies
Economics
Environmental Studies
Ethics, Philosophy & History
Geography
International Relations
Planning & Development
Political Science
Sociology
____________________________________
The DIIS System (DIIS, 2009) is designed according to the following principles. For each of the
11 research fields, Table 1, the DIIS research staff, through discussions and consensus, has selected
15 peer-reviewed journals that are regarded central publication vehicles. Many but not all these
journals are indexed in the Thomson-Reuters citation databases. A published article in those
journals will receive 3 DIIS points. Table 2 demonstrates the assignments of all the publication
points in the DIIS system as well as the Norwegian system, distributed across document types. In
both systems fragmentation of points is done according to author affiliation.

Journal of Informetrics, vol. 4 (4), 2010, 512-523 Proof read version (20/06/2010)
5
Each researcher is intended to produce 6 DIIS publication points over three years. Surplus points
may release extra salary portions calculated annually. The DIIS system is thus an incentive for
increasing the research publishing activity into high quality publications.
We observe, Table 2, that the DIIS system differentiates more with respect to authoring of
journal articles and monographs as well as editing journal issues. In case of the latter activity the
points (4; 3; 2) are assigned depending on if the work affiliates to the categories of the prestigious
Top-15 journals, SSCI journals or other journals. Editing of conference proceedings is likewise
adjusted to the kind of monographic category and obtains 4; 3; and 2 points. Monographic point
assignments depend on whether the publisher is of international high academic standard (XXX) or
of high standard (XX). On average the Norwegian system assigns more points to top-quality
monographs than does the local DIIS system, probably owing to the more rigorous differentiation of
the latter.
Table 2. The DIIS and the Norwegian publication point systems.
Peer reviewed DIIS Norwegian Points
Doc. Types Points Low level High level
Articles: Top-15 3 1 3
Articles in SSCI 2 1 3
Other journal art. 1 1 3
Book Chapter 1 0.7 1
Jn. Issue editor 4 / 3 / 2 --- ---
Monograph XXX 6 5 8
Monograph XX 4.5 5 8
Monograph 3 5 8
Book chapters and conference proceeding papers are treated rather alike in both systems. The
Norwegian system can be viewed in more detail in (Sivertsen, 2007b) and elsewhere. Other quite
humanistic faculties in Denmark operate with even more differentiated publication point systems
(Drotner, 2007).
2 Data Collection and Analysis Methods 267 DIIS publications from 2006 constitute the case study, out of which 71 publications are
included in the detailed analyses. They correspond to all peer-reviewed publications published that
year by DIIS, see Table 3. They, as well as their corresponding journals derive from the annual
report (DIIS, 2007) and are searched one-by-one in the Thomson-Reuters Web of Science (WoS)
data system and the Thomson-Reuters-Dialog citation databases diachronically online (Hjortgaard
Christensen et al., 1997) in order to establish the number of received citations during two time
periods: 2006-07 and 2006-08. The citation data collection for articles as well as corresponding
journals, chapters and monographs was done in May-July 2009. Similarly, Google Scholar (GS)
was searched first in January 2008 and again during the first months of 2009 to include open access
citations given to the same 71 publications covering the same two analysis windows. Checking of
citation years and self citations was performed manually for each DIIS document in GS. Journal
impact was not calculated in GS. Often Google Books was useful for monographic materials. A lot
of noise filtering was necessary in GS, in particular when filtering out duplicates, internal and self-
citations, as also described in other analyses (Jacso, 2008).
The following analyses and corresponding citation indicators are applied. The distribution of all
the 2006 DIIS publications is calculated to demonstrate the information and publication types that
Journal of Informetrics, vol. 4 (4), 2010, 512-523 Proof read version (20/06/2010)
6
actually are published by a modern publicly funded interdisciplinary research institution. In order to
demonstrate the citedness ratio and cite delay we calculated the number of publications that did
receive citations at least once during the two time periods, and during which periods they received
citations through WoS as well as GS. Then we calculated the citation impacts for DIIS (DIIS IF)
over the two time slots as well as the corresponding Journal Crown Indicators (JCI) for DIIS
(Braun & Glänzel, 1990; van Raan, 1999). JCI for an institution signifies the absolute diachronic
citation impact of its peer-reviewed publications divided by the absolute diachronic citation impact
of the corresponding journals for the same citation window. Thus, in the present analysis JCI
implies the observed citations over the expected ones for a given journal, including self-citations.
The Pearson correlation coefficient is used for testing the correlation between assigned publication
points and received citations for the same DIIS documents. We introduce and demonstrate the
calculations of the novel Publication Point Indicators using the Norwegian system applied to DIIS
as case.
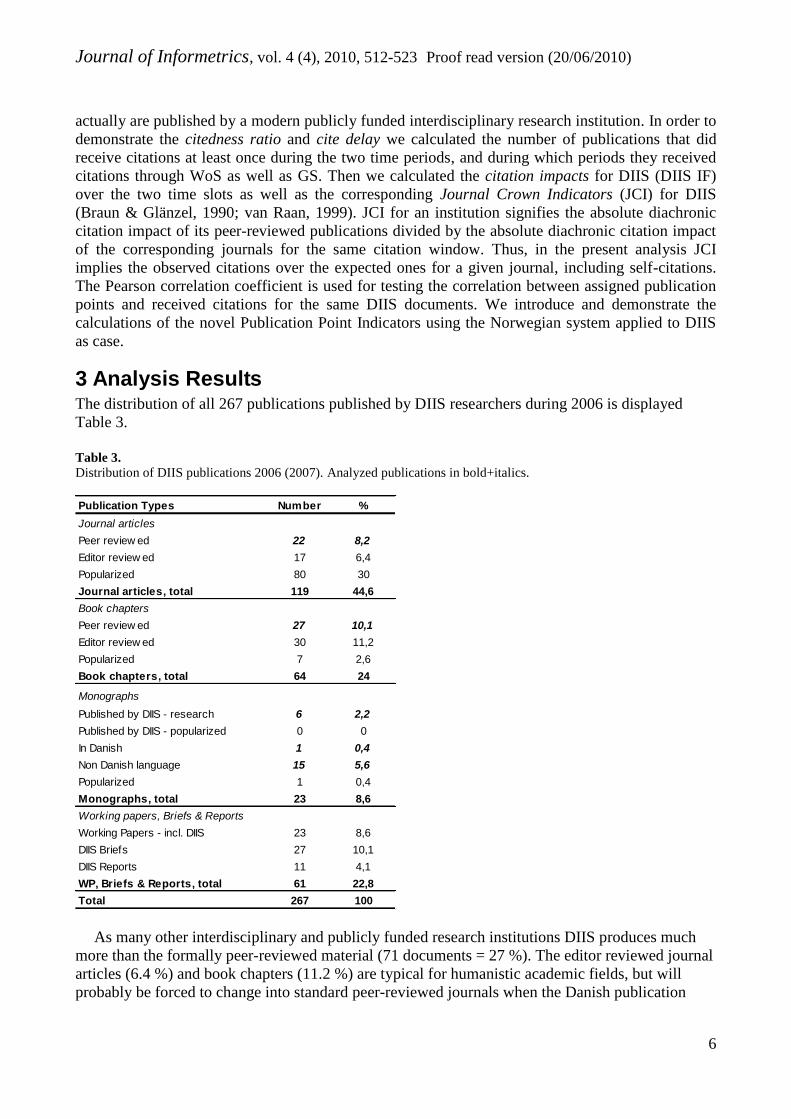
3 Analysis Results The distribution of all 267 publications published by DIIS researchers during 2006 is displayed
Table 3.
Table 3. Distribution of DIIS publications 2006 (2007). Analyzed publications in bold+italics.
Number %
22 8,2
17 6,4
80 30
119 44,6
27 10,1
30 11,2
7 2,6
64 24
Monographs
6 2,2
0 0
1 0,4
15 5,6
1 0,4
23 8,6
23 8,6
27 10,1
11 4,1
61 22,8
Total 267 100
Publication Types
Journal articles
Peer review ed
Editor review ed
Popularized
Journal articles, total
Book chapters
Peer review ed
Editor review ed
Popularized
Book chapters, total
Published by DIIS - research
Published by DIIS - popularized
In Danish
Non Danish language
Popularized
DIIS Reports
WP, Briefs & Reports, total
Monographs, total
Working papers, Briefs & Reports
Working Papers - incl. DIIS
DIIS Briefs
As many other interdisciplinary and publicly funded research institutions DIIS produces much
more than the formally peer-reviewed material (71 documents = 27 %). The editor reviewed journal
articles (6.4 %) and book chapters (11.2 %) are typical for humanistic academic fields, but will
probably be forced to change into standard peer-reviewed journals when the Danish publication

Journal of Informetrics, vol. 4 (4), 2010, 512-523 Proof read version (20/06/2010)
7
point system is implemented, in order to attract funding. However, it is regarded important for such
institutions also to publish various forms of popularized articles, book chapters and monographs (in
total 33 %) mainly adhering to the article category (30 %). So, basically only 1/3 of the production
in this institution belongs to the peer-reviewed category, and will consequently count in citation
analyses and in publication point systems; 1/3 is popularized items in various magazines and non-
peer-reviewed sources, but necessary for the distribution to the Danish society of DIIS research
results. Finally, 1/3 of the research production associates to quasi-peer-reviewed materials (editor
review) and to the categories of Working papers (internal peer-review), research briefs and DIIS
reports.
On average the 55 research staff members did produce 1.3 peer-reviewed journal article or book
chapter/conference paper in 2006. In addition each researcher published 1.6 popularized magazine
paper and approximately 2 quasi reviewed papers and research briefs.
3.1 Citedness and Cite Delay
Table 4 demonstrates the citedness percentage and the delay that occurs prior to documents become
cited over the two analysis windows. Cite delay is here defined ad hoc as the number of years it
takes for a unit to reach a citedness ratio of .50 for document types that are available for the
calculation of Crown Indicators. These types concern journal articles and, to an extent, conference
papers in Web of Science (and Scopus). The equivalent calculations are extremely cumbersome to
carry out in Google Scholar and Google Books.
Table 4.
Number of cited items and citedness (%) across document types and analysis windows in Web of Science and Google
Scholar and assigned fragmented publication points from the Norwegian and DIIS systems.
Peer reviewed Cited in Web of Science Cited in Google Scholar Publication points
Doc. Types N 2006-07 2006-08 2006-07 2006-08 DIIS NO
Articles 22 5 (22.7) 11 (50.0) 10 (45.5) 16 (72.7) 40 36
Book Chp. 27 0 (00.0) 6 (22.2) 4 (14.8) 13 (48.1) 26 18.2
Books 22 5 (22.7) 7 (31.8) 7 (31.8) 12 (54.5) 51.5 75
Total: 71 10 24 21 41 117.5 129.2
Mean citedness % 14.1 33.8 29.6 57.7
In Web of Science 77.3 % of the journal articles are not cited 1-2 years after publication (2006-
07) and just 50 % after 2-3 years. Thus, there exists a substantial cite delay in the case of DIIS. In
that sense Google Scholar covers more articles faster and the cite delay is smaller, i.e. 1-2 years
(54.5 % not cited in 2006-07 and approx. 27 % not cited in 2006-08). For book chapters/conference
proceeding papers and monographs the cite delay is again more pronounced when applying WoS
vs. GS. However, even the latter citation system does only cover approx. half of such document
types after a 2-3 year citation period. The cite delay for all three central document types in WoS is
approx. 66 % of the material still not being cited 3 years after publication, in 2006-08. For Google
Scholar (Books) this percentage is somewhat smaller during the same period but nevertheless
substantial (approx. 42 %).
3.2 Citation Impact and Journal Crown Indicator
The absolute citation impact is shown in Table 5 for Web of Science as well as Google Scholar
across the two time slots and documents types. The DIIS impact through WoS over three years is
quite low (.90), mainly because many articles did not at all receive citations from WoS, see Table 4.
Although the WoS impact for DIIS more than triples in one year for articles (and across all
types), through WoS as well as GS, the latter system captures many more citations to the book

Journal of Informetrics, vol. 4 (4), 2010, 512-523 Proof read version (20/06/2010)
8
chapters, conference papers and monographs. This is not surprising. In absolute number of citations
(for the same publications) Google Scholar finds approximately four times as many citations as
Web of Science in the ultra-short time period of one additional year. This is far more than predicted
for the Information and Computer sciences, in which GS commonly capture the double citation
volume compared to WoS (Jacso, 2008).
Table 5.
DIIS absolute citation impact for two time periods and document types through Web of Science and Google Scholar.
Web og Science 2006-07 2006-08
Publication type Publ. Citations Impact Citations Impact
Articles, peer review ed 22 13 0.59 43 1.95
Book chapters, peer review ed 27 0 0 8 0.29
Research monographs 22 7 0.32 13 0.59
Total 71 20 0.28 64 0.90
Google Scholar
Publication type Publ. Citations Impact Citations Impact
Articles, peer review ed 22 55 2.5 156 7.09
Book chapters, peer review ed 27 4 0.15 43 1.59
Research monographs 22 22 1 58 2.64
Total 71 81 1.14 257 3.62
Table 6 displays the Journal Crown Indicator for DIIS across the two periods for journal articles
only. Self citations are included. We observe that the absolute impact doubles when only the WoS
indexed journals used by DIIS are taken into account (.59 to 1.29 and 1.95 to 3.9). The journal
Crown Indicator index value for DIIS increases slightly from 2006-07 into 2008 (index 1.19 to 1.4).
This implies that DIIS has succeeded in obtaining more citations for its research than anticipated in
the set of WoS-indexed journals in which the research was published.
Table 6.
Journal Crown Indicators (JCI) for DIIS across two periods. DIIS IF, WoS signifies impact in WoS indexed journals;
DIIS – JIF means impact of the journals applied by DIIS (N = 22).
2006-07 2006-08
DIIS IF DIIS IF, WoS DIIS - JIF DIIS JCI DIIS IF DIIS IF, WoS DIIS - JIF DIIS JCI
0.59 1.29 1.085 1.19 1.95 3.9 2.74 1.4
However, only 7 journals of the ones applied by DIIS were indexed in 2006 by WoS. All but one
of these journals belongs to the lower 1 point level of journals in the Norwegian system. Further,
Table 4 shows the small amount of journal articles that receive citations in WoS during the two
periods. Had the JCI been calculated over the smaller absolute ‗DIIS IF‘ value, replacing the ‗DIIS
IF, WoS‘ value, JCI would be below index value 1.0 for both periods (.54 in 2006-07 and .71 in
2006-08).
3.3 Correlations of Citations to Publication Points
From Table 7 it is clear that strong correlations (in italics and bold) only exist between 1) the Web
of Science and Google Scholar distributions of citations for a citation window of 3 years for articles
and all document types, as well as between 2) the DIIS and the Norwegian publication point
systems for all types, books and articles. The Wos/GS correlation coefficient is very weak for

Journal of Informetrics, vol. 4 (4), 2010, 512-523 Proof read version (20/06/2010)
9
monographs (.67, CV=.641, p=.01). The table includes all pairs for which documents received at
least one citation 2006-08 by one of the citation indexes (No. of pairs = CV figure, Table 7). Book
chapters/conference papers are omitted because too few items received citations to make a
meaningful correlation analysis. During the 2006-07 period the coefficients were all below the
corresponding CVs.
Table 7 Pearson correlation coefficients for various citation and publication point system combinations for the same DIIS
documents 2006-08. (CV 13 = .641; CV 17 = .574; CV 55 = .332 at p=.01); statistical significance in italics.
WoS/DIIS WoS/NO GS/DIIS GS/NO WoS/GS DIIS/NO
Articles (N=17) .42 .41 .35 .39 .91 .86
Monographs (N=13) .43 .31 .28 .24 .67 .90
All types (N=55) .38 .23 .29 .20 .87 .89
4. The Publication Point Indicators We propose three publication point indicators to be applied in comparative research evaluations as a
supplement to or replacement of standard citation analyses and indicators when only publication
points are available from a specific system. The indicators are described in order of increasing
complexity and usefulness for comparative analyses:
1. Publication Point Ratio (PPR), ratio of the sum of actual points obtained over the
ideal sum for all documents published, see Formula (1); value between zero and 1;
2. Cumulated Publication Point Indicator (CPPI), graphical representation of the
vectors defining the sum of cumulated publication points actually obtained for
each document and the sum of ideal points cumulated for the same set of
documents, see formula (2);
3. Normalized CPP Index (nCPPI), ratio of sum of cumulated values of actual points
over sum of cumulated values of ideal points for each document generating a
graphical representation or a single index score with values between zero and 1,
see formula (3).
All three indicators are founded on the formalism shown below deriving from the ideas and
concepts of Cumulated Gain, Normalized Cumulated Gain (nCG) and other CG derivations,
originally conceived and tested for information retrieval (IR) performance evaluation purposes
(Kekäläinen & Järvelin, 2002). They work particularly well with graded relevance and assess the
difference between the ideal result vector of the ranked documents and the actual one, as
determined by the search engine algorithm. In IR the ideal ranking of retrieved results would be a
list with the most relevant documents located on the top of the list followed by documents in
descending order of relevance score ending with the non-relevant documents. The scores can be
computed and demonstrated as graphs or indexes and be averaged over a given set of documents.
We regard the publication point scales within and between document types, Table 2, as logically
equivalent to graded relevance scales in IR. The basic idea behind the CG and our PPI approach is
to compare vectors of obtained and ideal values (viz. publication points) for the same set of
documents (n) according to a given publication point system. The ideal vector is seen as the
expected number of points that is theoretically obtainable for the set of documents. There exists thus
some equivalence to the principles underlying the Crown Indicators (Braun & Glänzel, 1990; van

Journal of Informetrics, vol. 4 (4), 2010, 512-523 Proof read version (20/06/2010)
10
Raan, 1999), i.e., to compare the obtained diachronic citation impact per document in a given set
and period with the diachronic impact of the journals publishing those documents in the set, for the
same period. What is required is 1) to sort the n documents according to the document types (a-t)
used in the publication point system with respect to their point values; 2) then for each type to sort
the documents by the actual values obtained through the publication point system in descending
order. 3) They form the actual publication point vector for each type, and the actual gain obtained
from the publication point system can be computed for each document type separately (na; … n
t) or
for all n. In the latter case the actual values obtained define the sorting order, starting with the
document type of the highest point value, e.g. monographs, Table 2. 4) To assign the maximum
points available from the publication point system to each document for each type in a new vector.
That generates the ideal publication point vector from document position 1 to i for each document
type and constitute the ideal gain of cumulated points. If computed for the entire set of documents
the ideal vector is constituted by all the theoretically obtainable points across the types from
document position 1 to n.
Assume that the publication points 3 and 1 in the system are used for 22 journal articles (see
Table 2; 0 denoting no score obtained through the system). Turning the 22 journal articles into
corresponding publication points actually assigned by the system, with the highest actual scores on
top of the list, gives a vector (G') of 22 components, each having the values 3, 1 or 0 in descending
order. We apply the formalism shown in (Ingwersen & Järvelin, 2005, p. 182):
G' = <3, 3, 3, 3, 3, 3, 3, 1, 1, 1, 0, 0, …> (1)
The ideal vector I would then look like this, given the Norwegian system: <3, 3, 3, 3, 3, 3, 3, 3,
3, 3 … 3>. The Publication Point Ratio (PPR) is very simplistic and absolute. For a vector from
document position 1 to i = 8 the sum of G' = 22 points and the sum of the corresponding ideal
vector I = 24 points. PPR = 22/24 = .92. Owing to the fact that documents can be assigned zero
points (if the journal does not appear on the Norwegian list) PPR signifies the raw degree of
publication success for the given set of documents in the institution. It cannot be compared to other
PPR indicators from other analysis entities. Also graphically PPR is rather simplistic. Table 8 below
demonstrates the different average values can take of two PPIs for DIIS, with the PPR value for
articles and other document types in the first row.
In order better to represent graphically the difference between the actual and ideal vectors for the
publication points in a given set of documents the Cumulated Publication Point Indicator (CPPI)
cumulates the points; hence no zero values appear in the vectors. CPPI is very similar to the
Cumulated Gain (CG) relevance measure in IR. Using Ingwersen & Järvelin‘s formalisms (2005, p.
182) illustrated by the set of 22 DIIS articles:
―[The] cumulated gain at the ranked position i is computed by summing from position 1 to i
where i ranges from 1 to 22. Formally, let us denote position i in the gain vector G by G[i]. Now the
cumulated gain vector CG is defined recursively as the vector CG where:
(2)
For example, from G' we obtain = <3, 6, 9, 12, 15, 18, 21, 22, 23, 24, 24, 24 …>. The cumulated
gain at any rank may be read directly, e.g., at rank 8 it is 22 and at rank 12 it is 24. The vectors can
directly be visualized as gain-by-graphs and compared to the theoretically best possible for the same
Journal of Informetrics, vol. 4 (4), 2010, 512-523 Proof read version (20/06/2010)
11
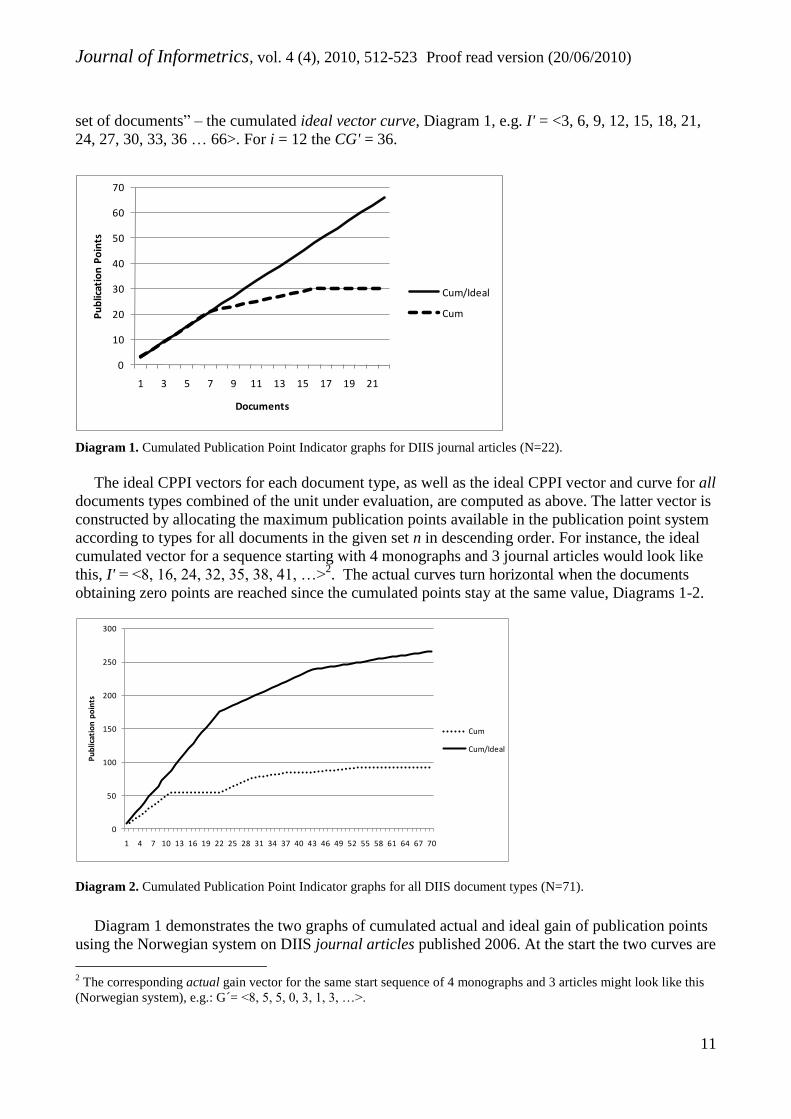
set of documents‖ – the cumulated ideal vector curve, Diagram 1, e.g. I' = <3, 6, 9, 12, 15, 18, 21,
24, 27, 30, 33, 36 … 66>. For i = 12 the CG' = 36.
0
10
20
30
40
50
60
70
1 3 5 7 9 11 13 15 17 19 21
Pu
blic
atio
n P
oin
ts
Documents
Cum/Ideal
Cum
Diagram 1. Cumulated Publication Point Indicator graphs for DIIS journal articles (N=22).
The ideal CPPI vectors for each document type, as well as the ideal CPPI vector and curve for all
documents types combined of the unit under evaluation, are computed as above. The latter vector is
constructed by allocating the maximum publication points available in the publication point system
according to types for all documents in the given set n in descending order. For instance, the ideal
cumulated vector for a sequence starting with 4 monographs and 3 journal articles would look like
this, I' = <8, 16, 24, 32, 35, 38, 41, …>2. The actual curves turn horizontal when the documents
obtaining zero points are reached since the cumulated points stay at the same value, Diagrams 1-2.
0
50
100
150
200
250
300
1 4 7 10 13 16 19 22 25 28 31 34 37 40 43 46 49 52 55 58 61 64 67 70
Pu
blic
atio
n p
oin
ts
Cum
Cum/Ideal
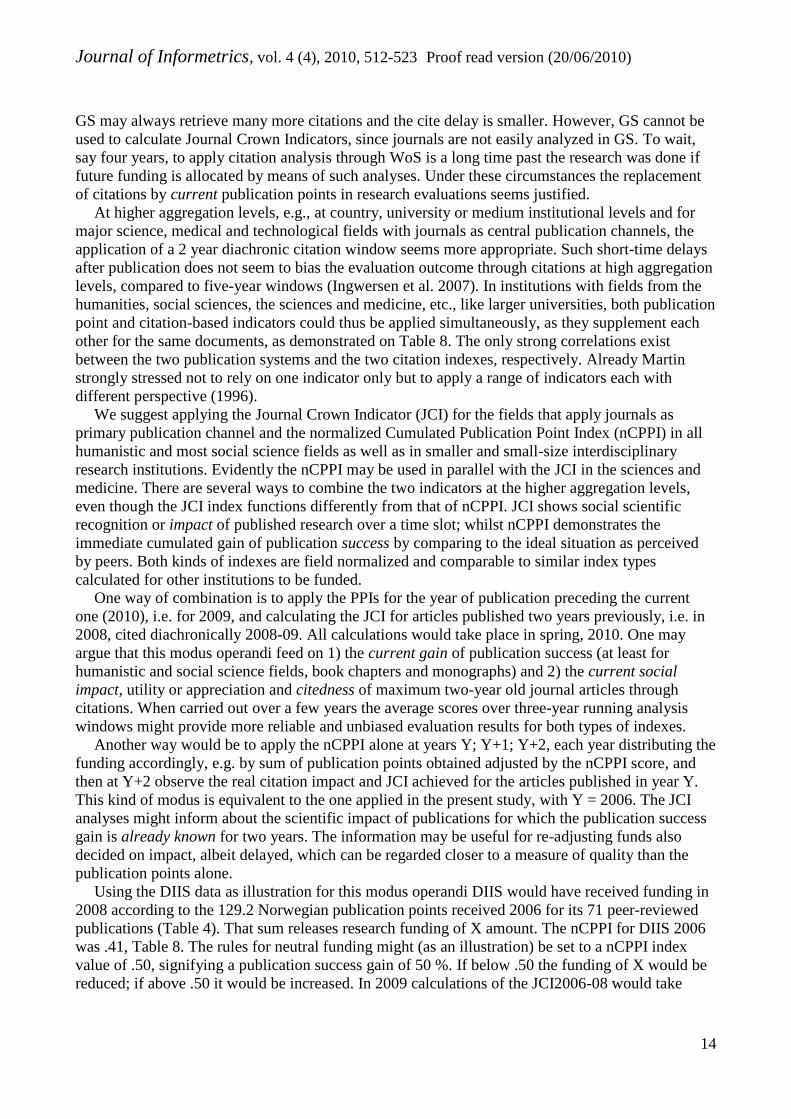
Diagram 2. Cumulated Publication Point Indicator graphs for all DIIS document types (N=71).
Diagram 1 demonstrates the two graphs of cumulated actual and ideal gain of publication points
using the Norwegian system on DIIS journal articles published 2006. At the start the two curves are
2 The corresponding actual gain vector for the same start sequence of 4 monographs and 3 articles might look like this
(Norwegian system), e.g.: G´= <8, 5, 5, 0, 3, 1, 3, …>.

Journal of Informetrics, vol. 4 (4), 2010, 512-523 Proof read version (20/06/2010)
12
similar but then separate owing to less points actually assigned compared to the theoretical best.
Diagram 2 demonstrates the same kind of CPPI graphs, but for all 71 documents published by DIIS
that potentially could obtain Norwegian publication points.
In both diagrams the size of the area differentiating the two curves signifies measures of lack of
publication success (simplistic or cumulated gained), given an ideal (expected) publication point
value. However, this area cannot be compared to similar areas in other entities under analysis since
they presumably would produce numbers and distributions of documents different from n, na to n
t.
Meanwhile, like for the principles underlying the Journal Crown Indicator mentioned above, the
Normalized Cumulated Publication Point Index (nCPPI) uses exactly the same set of journals (and
other sources) applied for publication of documents by the unit to assign the ideal (theoretical)
values to be compared to the actually obtained scores, resulting in a vector of index values. Using
the start of the G' vector displayed above (footnote 2) as example of the actually obtained
cumulated gain scores (CG' = <8, 13, 18, 18, 21, 22, 25, …>, formula (2)) and the corresponding
ideal vector (I' = <8, 16, 24, 32, 35, 38, 41, …>, we obtain the following nCPPI vector of index
values:
nCPPI´ = <8/8, 13/16, 18/24, 18/32, 21/35, 22/38, 25/41, …> (3)
Diagram 3 demonstrates the three nCPPI graphs representing the three document types from
DIIS, 2006 and Diagram 4 shows the single graph representing the entire publication profile of the
71 peer-reviewed DIIS publications. In Diagram 3 the nCPPI for articles start is flat at index value 1
owing to identical maximum scores for the first 7 DIIS articles. For book chapters the CPPI values
are lower (at .7) because none of the chapters obtained the maximum Norwegian publication scores
for that type. The nCPPI for each document type as well as for the entire set of documents can be
calculated into one overall weighted publication success score, Table 8, second row.
Table 8.
Scores of PPR and nCPPI for the same set(s) of DIIS documents 2006.
Art. (N=22) Chap. (N=27) Book (N=22) All types (N=71)
PPR .45 .26 .31 .38
nCPPI .66 .42 .46 .41
In the case of PPR the overall scores are calculated as the sum of the actual vector values over
the ideal ones at a given cut-off value. The overall nCPPI is calculated as the sum of all recursively
cumulated actual vector values over the sum of all recursively cumulated ideal ones, where the ideal
vector represents the expected gain of publication success. The nCPPI scores are in general of
higher value than the PPR scores because no zeros are present in the former and values are
cumulated recursively. In contrast to PPR the nCPPI scores are comparable with similar index
scores (or graphs, Diagram 4) from other institutions at similar document cutoff positions.

Journal of Informetrics, vol. 4 (4), 2010, 512-523 Proof read version (20/06/2010)
13
0
0,2
0,4
0,6
0,8
1
1,2
1 3 5 7 9 11 13 15 17 19 21 23 25 27
Pu
blic
atio
n P
oin
t In
de
x sc
ore
Documents
nCPPI - art
nCPPI - Books
nCPPI - Book chp
Diagram 3. Normalized Cumulated Publication Point Index (nCPPI) graphs for three separated DIIS document types.
Diagram 4 displays the overall nCPPI graph for peer-reviewed DIIS publications 2006. The
reason for the canyon-like form lies in the fact that the underlying ideal vector is sorted after the
highest obtainable points (books at 8 points in the Norwegian system, Table 2); however only 11 of
the 22 books got allocated points (5 in each case) according to the system; the remaining books
received zero publication points. The ideal articles obtaining 3 points follow the books on the graph.
Their cumulated points lead to a momentary increase of index scores at positions 23-29.
0,000
0,100
0,200
0,300
0,400
0,500
0,600
0,700
1 4 7 101316192225283134374043464952555861646770
Pu
blic
atio
n P
oin
t In
de
x sc
ore
nCPPI - ALL
Diagram 4. Normalized Cumulated Publication Point Index graph for all DIIS documents (N = 71).
5 Discussion The analyses indicate that an extensive cite delay may exist even for journal articles in Web of
Science compared to Google Scholar for smaller interdisciplinary research institutions. At that
aggregation level three years seem to be a minimum citation window to use if strong indicators like
the Journal Crown Indicator are intended to give meaning by means of WoS or Scopus. Presumably
Journal of Informetrics, vol. 4 (4), 2010, 512-523 Proof read version (20/06/2010)
14
GS may always retrieve many more citations and the cite delay is smaller. However, GS cannot be
used to calculate Journal Crown Indicators, since journals are not easily analyzed in GS. To wait,
say four years, to apply citation analysis through WoS is a long time past the research was done if
future funding is allocated by means of such analyses. Under these circumstances the replacement
of citations by current publication points in research evaluations seems justified.
At higher aggregation levels, e.g., at country, university or medium institutional levels and for
major science, medical and technological fields with journals as central publication channels, the
application of a 2 year diachronic citation window seems more appropriate. Such short-time delays
after publication does not seem to bias the evaluation outcome through citations at high aggregation
levels, compared to five-year windows (Ingwersen et al. 2007). In institutions with fields from the
humanities, social sciences, the sciences and medicine, etc., like larger universities, both publication
point and citation-based indicators could thus be applied simultaneously, as they supplement each
other for the same documents, as demonstrated on Table 8. The only strong correlations exist
between the two publication systems and the two citation indexes, respectively. Already Martin
strongly stressed not to rely on one indicator only but to apply a range of indicators each with
different perspective (1996).
We suggest applying the Journal Crown Indicator (JCI) for the fields that apply journals as
primary publication channel and the normalized Cumulated Publication Point Index (nCPPI) in all
humanistic and most social science fields as well as in smaller and small-size interdisciplinary
research institutions. Evidently the nCPPI may be used in parallel with the JCI in the sciences and
medicine. There are several ways to combine the two indicators at the higher aggregation levels,
even though the JCI index functions differently from that of nCPPI. JCI shows social scientific
recognition or impact of published research over a time slot; whilst nCPPI demonstrates the
immediate cumulated gain of publication success by comparing to the ideal situation as perceived
by peers. Both kinds of indexes are field normalized and comparable to similar index types
calculated for other institutions to be funded.
One way of combination is to apply the PPIs for the year of publication preceding the current
one (2010), i.e. for 2009, and calculating the JCI for articles published two years previously, i.e. in
2008, cited diachronically 2008-09. All calculations would take place in spring, 2010. One may
argue that this modus operandi feed on 1) the current gain of publication success (at least for
humanistic and social science fields, book chapters and monographs) and 2) the current social
impact, utility or appreciation and citedness of maximum two-year old journal articles through
citations. When carried out over a few years the average scores over three-year running analysis
windows might provide more reliable and unbiased evaluation results for both types of indexes.
Another way would be to apply the nCPPI alone at years Y; Y+1; Y+2, each year distributing the
funding accordingly, e.g. by sum of publication points obtained adjusted by the nCPPI score, and
then at Y+2 observe the real citation impact and JCI achieved for the articles published in year Y.
This kind of modus is equivalent to the one applied in the present study, with Y = 2006. The JCI
analyses might inform about the scientific impact of publications for which the publication success
gain is already known for two years. The information may be useful for re-adjusting funds also
decided on impact, albeit delayed, which can be regarded closer to a measure of quality than the
publication points alone.
Using the DIIS data as illustration for this modus operandi DIIS would have received funding in
2008 according to the 129.2 Norwegian publication points received 2006 for its 71 peer-reviewed
publications (Table 4). That sum releases research funding of X amount. The nCPPI for DIIS 2006
was .41, Table 8. The rules for neutral funding might (as an illustration) be set to a nCPPI index
value of .50, signifying a publication success gain of 50 %. If below .50 the funding of X would be
reduced; if above .50 it would be increased. In 2009 calculations of the JCI2006-08 would take

Journal of Informetrics, vol. 4 (4), 2010, 512-523 Proof read version (20/06/2010)
15
place for the DIIS articles published 2006. It shows (Table 6) an index value of 1.4, i.e. a value
above the expected world average for the same journals. One might hence re-adjust the ensuing
funding by a factor owing to this positive demonstration of social (world-wide) scientific impact of
the published research two years earlier.
By carrying out the citation exercise for the entire country, including for the monographs and
book chapters/conference papers, one obtains an average national impact value for such publication
vehicles. Although only showing the citations obtained through WoS (or Scopus) or GS, without
document type self-citations provided from books to books, etc., this expected impact for
monographs and chapters could be applied as a simplistic comparative indicator in line with the JCI
for articles. For potential values for DIIS, see Table 5. Notwithstanding that GS assign more
citations faster to the publications from various document types it is still very cumbersome to apply
owing to the necessity of performing substantial noise filtering and citation validation.
A third mode of applying the two indexes is to combine them into one formalism (γ). One
suggestion would be to multiply the two index values for corresponding documents, that is, journal
articles and to compare that integrated score with similar scores from other institutions. If DIIS is
used as an illustration the 22 articles (n) received a JCI index score for 2006-08 at 1.4. The same n
documents obtained a nCPPI score at .66.
The integrated score γn = JCI
n x nCPPIn
n for documents n – for DIIS giving: .92. (4)
The exemplified γ-score signifies that the impact of the articles has been reduced below 1.0 (the
world impact) because the cumulated publication gain for the same articles was too small. Thus,
there exists a trade-off between the nCPPI value (0 – 1.0) and the JCI (≥ 0). A low nCPPI implies
that too few journals applied by the unit belonged to the higher level of the Norwegian system. With
a low nCPPI the JCI score must be very high to compensate if the final score should stay at world
average. With a large cumulated gain of publication success points, e.g. a nCPPI score at .80
(signifying that 80 % of the ideal gain has been obtained), the JCI for DIIS could be less (e.g. 1.25)
to reach the integrated γ-score = 1.0. When nCPPI is high it means that the major portion of the
articles was published in high-level journals obtaining the maximum (ideal) amount of points
available according to the publication point system. If the γ-score in that case is below 1.0 that
implies that the institution had great difficulty in achieving the expected (high) world citation
impact. Thus, the nCPPI works similar to a Field Crown Indicator (van Raan, 1999) which, when
compared to the corresponding JCI, shows the true impact level of the journals used.
There is indeed space for additional publication point indicators. For instance, one may apply
different document cutoff positions (i) over long document lists from large institutions, e.g. i100
; i200
;
… in, in order to observe the cumulated publication success gain at the start of the accumulation,
where the index values supposedly are 1 or close to one, and later across comparable institutions.
Diagram 3 illustrates the case with three graphs, each representing a single document type.
However, they might as well illustrate three institutions each having a different cumulated
publication success gain for i=22: The ‗article‘ institution is performing the best since 7 articles
obtain maximum points, compared to the ‗book chapter‘ and ‗book‘ institutions. They did not
achieve their maximum levels of nCPPI scores for any of their publications. This should be
compared to Table 4, which shows the sums of the actually obtained points. Since there are more
points available for books in the Norwegian system they may also obtain more points: Indeed,
‗Books‘ obtain 75 points for its 22 publications, while ‗Articles‘ gets 36 for its 22 items and ‗Book
Chapters‘ obtain 18.2 for its 27 chapters. nCPPI neutralizes these differences through its index
values and is consequently a valuable, comparable and robust indicator for publication success.

Journal of Informetrics, vol. 4 (4), 2010, 512-523 Proof read version (20/06/2010)
16
6. Conclusion We have presented comparative analyses of two publication point systems, the Norwegian and the
in-house system from the interdisciplinary Danish Institute of International Studies, used as case in
the study of 71 peer-reviewed publications published in 2006. In addition the analyses compared
central citation-based indicators, like the Journal Crown Indicator, with novel publication point
indicators that are formalized and exemplified. The diachronic citation analyses covered two
windows, 2006-07 and 2006-08. We have proposed three publication point indicators: the
Publication Point Ratio (PPR), which measures the simple sum of obtained publication points over
the sum of the ideal points for the same set of documents; the Cumulated Publication Point
Indicator (CPPI), which graphically illustrates the recursive accumulation of obtained vs. ideal
points, both seen as vectors; and the normalized Cumulated Publication Point Index (nCPPI) that
divides the actually obtained cumulated gain vector by the ideal vector for the same documents, and
represents the cumulated gain of publication success as index values, either graphically or as one
overall score for the institution under evaluation.
The case study indicates that for smaller interdisciplinary research institutions the cite delay is
substantial (2-3 years to obtain a citedness of 50 %) when applying Web of Science for articles.
Applying Google Scholar implies a shorter delay and much higher citedness for all document types.
Journal Crown Indicator calculations based on WoS (not GS) may thus suffer from the cite delay at
this low level of aggregation.
No statistical significant correlations were found between citations received in Google Scholar or
Web of Science and the publication points obtained through the two PP systems, only between the
two citation indexes and the two publication point systems in between, respectively. The study
demonstrates how the JCI and nCPPI can be applied to institutions as supplementary evaluation
tools in various combinations, in particular when institutions include humanistic and social science
disciplines. We believe that both indicator types are central in research evaluation of medium and
large institutions or countries, in particular in the cases where publication point systems are used for
distribution of public research funding.
References
Ahlgren P. & Järvelin, K. (2010). Measuring impact of twelve information scientists using the DCI index.
Journal of the American Society for Information Science andTechnology, in press. DOI:
10.1002/asi.21333
Braun, T., & Glänzel, W. (1990). United Germany: The new scientific superpower? Scientometrics, 19(5–6),
513–521.
Butler, L. (2003). Explaining Australia‘s increased share of ISI publications—the effects of a funding
formula based on publication counts. Research Policy, 32(1), 143-155.
Butler, L. (2008). Using a balanced approach to bibliometrics: quantitative performance measures in the
Australian Research Quality Framework. Ethics in Science and Environmental Politics, 8 (11).
DIIS (2007). Publication supplement at DIIS, 2007. [Institutinformation på DIIS 2006. Intern publicering via
e-mail]. Copenhagen: Danish Institute for International Studies.
DIIS (2009). DIIS 2008: Annual Report. Copenhagen: Danish Institute for International Studies.
Drotner, K. (2007). Kan kvalitet og kvantitet forenes? Magasinet Humaniora, 22(2), 4-7.
Harnad, S. (2008) Validating research performance metrics against peer rankings. Ethics in Science and
Environmental Politics, 8 (11).
Hjortgaard Chistensen, F., Ingwersen, P., Wormell, I. (1997). Online determination of the journal impact
factor and its international properties. Scientometrics, 40(3), 529-540.
Ingwersen, P. & Järvelin, K. (2005). The Turn: Integration of information seeking and retrieval in context.
Dordrect, Springer.

Journal of Informetrics, vol. 4 (4), 2010, 512-523 Proof read version (20/06/2010)
17
Ingwersen, P., Schneider, J.W., Scharff, M. & Larsen, B. (2007). A National Research Profile-Based
Immediacy Index and Citation Ratio Indicator for Research Evaluation. In: Proceedings of 11th
International Conference of the International Society for Scientometrics and Informetrics (ISSI 2007),
(pp. 864-865). Madrid, CINDOC.
Jacso, P. (2008). Google Scholar revisited. Online Information Review, 32(1), 102-114. Available:
http://www.emeraldinsight.com/Insight/ViewContentServlet?Filename=Published/EmeraldFullTextArticl
e/Articles/2640320108.html
Järvelin, K. & Persson, O. (2008). The DCI index: Discounted cumulated impact-based research evaluation.
Journal of the American Society for Information Science andTechnology, 59(9), 1433–1440.
Järvelin, K. & Kekäläinen, J. (2002): Cumulated gain-based evaluation of IR techniques. ACM Transactions
on Information Systems (ACM TOIS), 20(4): 422-446.
Martin, B. (1996). The use of multiple indicators in the assessment of basic research. Scientometrics, 36,
343-362.
Moed, H.F. (2005). Citation analysis in research evaluation. Dordrecht, Springer.
Sandström, U. & Sandström, E. (2009). The field factor: towards a metric for academic institutions.
Research Evaluation, 18(3), 243-250.
Schneider, J.W. (2009) An outline of the bibliometric indicator used for performance-based funding of
research institutions in Norway. European Political Science, 8(3), p. 364-378
Sivertsen, G. (2007a). Bibliometri for (eller imod?) humaniora. Magasinet humaniora, 22( 2), 22-25.
Available on 12.09.07: http://www.fist.dk
Sivertsen, G. (2007b). Publication patterns in complete bibliographic data (all scientific journals and books)
at all Norwegian universities. Presented at the 12th Nordic Workshop on Bibliometrics and Research
Policy. Available 25.01.08: http://www.db.dk/nbw2007/files/0_Gunnar_Sivertsen.pdf
Seglen PO. (1994). Causal relationship between article citedness and journal impact. Journal of the
American Society for Information Science andTechnology, 45, 1-11.
van Raan, A.F.J. (1999). Advanced bibliometric methods for the evaluation of universities. Scientometrics,
45(3), 417-423.