Embed Size (px)
Citation preview

Final report
A comparative analysis of the garments sector of Pakistan
Hussain et al
April 2013
When citing this paper, please use the title and the followingreference number:F-37038-PAK-1
A Comparative Analysis of the Garments
Sector of Pakistan
Dr. Syed Turab Hussain, Dr. Kashif Zaheer Malik, Usman Khan, CFA, Adeel
Faheem, Dr. Ijaz Nabi and Dr. Navid Hamid
This Study has been completed with the support provided by the International
Growth Center.
5 APRIL 2013
2
1 Textile Value Chain in Pakistan ............................................................................................... 5
1.1 Textile Sector of Pakistan: Importance and Structure ............................................. 5
1.2 Historical Evolution of the Textile Value Chain in Pakistan: Skewed policy
incentives ............................................................................................................................................. 8
1.3 Policy Incentives over time ............................................................................................... 9
1.4 Objective and Structure of the Report ........................................................................ 11
2 A Comparative Analysis of the Garment Sector of Pakistan, Turkey and
Bangladesh ........................................................................................................................................... 13
2.1 Introduction ......................................................................................................................... 13
2.2 Aggregate Level Comparison: Pakistan, Turkey & Bangladesh ......................... 14
2.3 Product Level Country Comparison: Pre and Post Quota Regime ..................... 18
2.4 Comparison of Pakistan, Turkey & Bangladesh Garment Industry: A
literature review ............................................................................................................................ 25
2.5 Conclusion ............................................................................................................................ 36
3 Methodology ................................................................................................................................ 38
3.1 Introduction ......................................................................................................................... 38
3.2 Methodology ........................................................................................................................ 38
4 Analysis of Firm Competitiveness in a Global Value Chain Framework ................. 43
4.1 Introduction ......................................................................................................................... 43
4.2 Where does Pakistan stand? .......................................................................................... 43
4.3 Why does Pakistan stand here? .................................................................................... 51
4.3.1 Determinants of firm capability ..................................................................................... 51
4.4 Conclusion ............................................................................................................................ 70
Bibliography ........................................................................................................................................ 72
Appendix 1 ........................................................................................................................................... 75
Description of the survey data ...................................................................................................... 76
3
Introduction .................................................................................................................................... 76
Sampling strategy of the survey ............................................................................................... 76
Product description ...................................................................................................................... 76
Data description and analysis ................................................................................................... 77

5
1 Textile Value Chain in Pakistan
1.1 Textile Sector of Pakistan: Importance and Structure
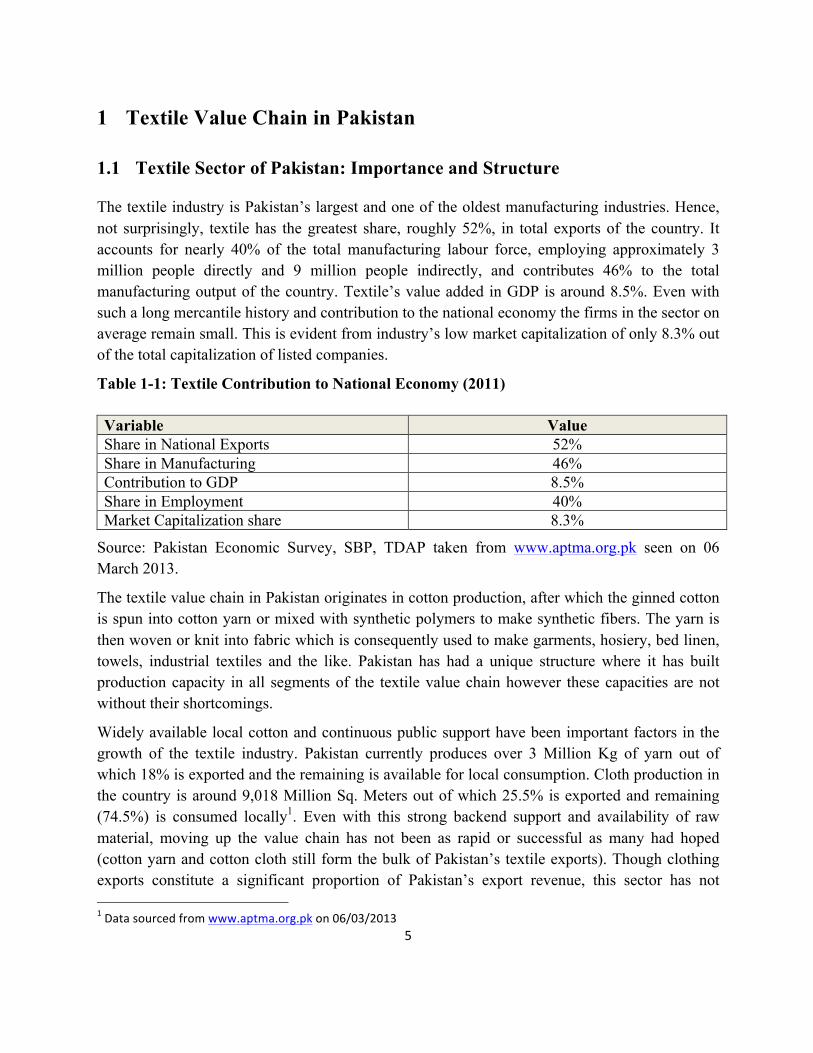
The textile industry is Pakistan’s largest and one of the oldest manufacturing industries. Hence, not surprisingly, textile has the greatest share, roughly 52%, in total exports of the country. It accounts for nearly 40% of the total manufacturing labour force, employing approximately 3 million people directly and 9 million people indirectly, and contributes 46% to the total manufacturing output of the country. Textile’s value added in GDP is around 8.5%. Even with such a long mercantile history and contribution to the national economy the firms in the sector on average remain small. This is evident from industry’s low market capitalization of only 8.3% out of the total capitalization of listed companies.
Table 1-1: Textile Contribution to National Economy (2011)
Variable Value Share in National Exports 52% Share in Manufacturing 46% Contribution to GDP 8.5% Share in Employment 40% Market Capitalization share 8.3%
Source: Pakistan Economic Survey, SBP, TDAP taken from www.aptma.org.pk seen on 06 March 2013.
The textile value chain in Pakistan originates in cotton production, after which the ginned cotton is spun into cotton yarn or mixed with synthetic polymers to make synthetic fibers. The yarn is then woven or knit into fabric which is consequently used to make garments, hosiery, bed linen, towels, industrial textiles and the like. Pakistan has had a unique structure where it has built production capacity in all segments of the textile value chain however these capacities are not without their shortcomings.
Widely available local cotton and continuous public support have been important factors in the growth of the textile industry. Pakistan currently produces over 3 Million Kg of yarn out of which 18% is exported and the remaining is available for local consumption. Cloth production in the country is around 9,018 Million Sq. Meters out of which 25.5% is exported and remaining (74.5%) is consumed locally1. Even with this strong backend support and availability of raw material, moving up the value chain has not been as rapid or successful as many had hoped (cotton yarn and cotton cloth still form the bulk of Pakistan’s textile exports). Though clothing exports constitute a significant proportion of Pakistan’s export revenue, this sector has not 1 Data sourced from www.aptma.org.pk on 06/03/2013
6
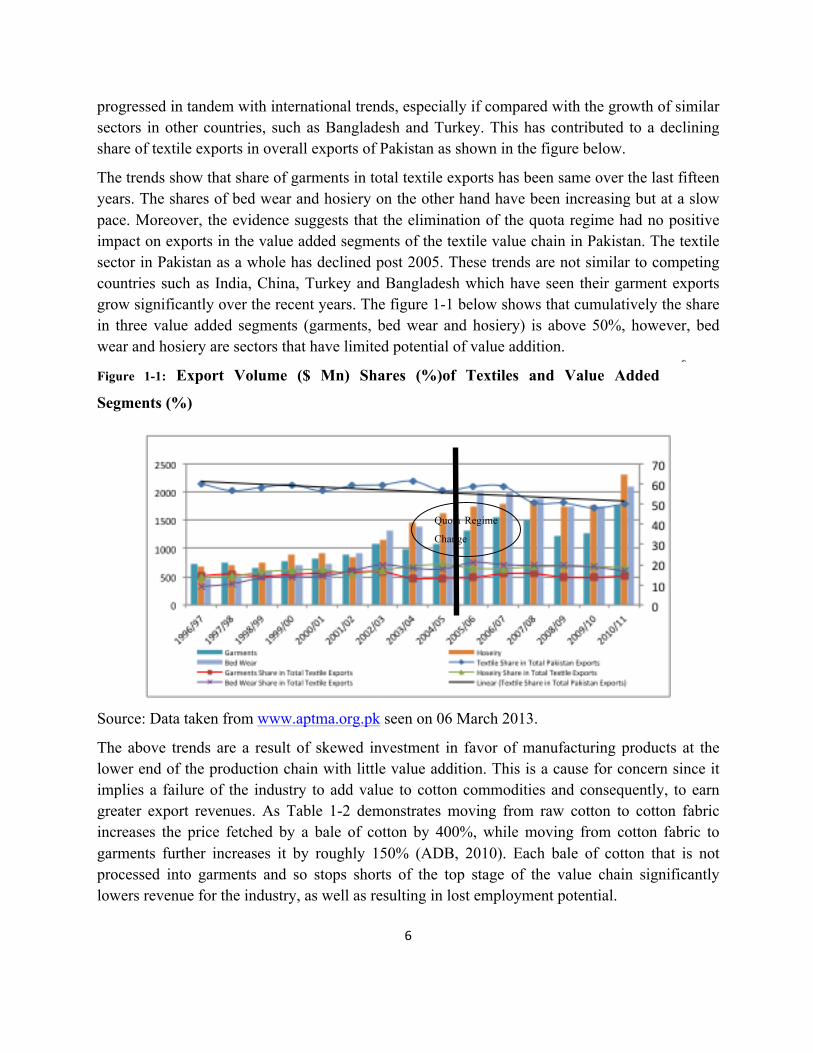
progressed in tandem with international trends, especially if compared with the growth of similar sectors in other countries, such as Bangladesh and Turkey. This has contributed to a declining share of textile exports in overall exports of Pakistan as shown in the figure below.
The trends show that share of garments in total textile exports has been same over the last fifteen years. The shares of bed wear and hosiery on the other hand have been increasing but at a slow pace. Moreover, the evidence suggests that the elimination of the quota regime had no positive impact on exports in the value added segments of the textile value chain in Pakistan. The textile sector in Pakistan as a whole has declined post 2005. These trends are not similar to competing countries such as India, China, Turkey and Bangladesh which have seen their garment exports grow significantly over the recent years. The figure 1-1 below shows that cumulatively the share in three value added segments (garments, bed wear and hosiery) is above 50%, however, bed wear and hosiery are sectors that have limited potential of value addition.
Figure 1-1: Export Volume ($ Mn) Shares (%)of Textiles and Value Added
Segments (%)
Source: Data taken from www.aptma.org.pk seen on 06 March 2013.
The above trends are a result of skewed investment in favor of manufacturing products at the lower end of the production chain with little value addition. This is a cause for concern since it implies a failure of the industry to add value to cotton commodities and consequently, to earn greater export revenues. As Table 1-2 demonstrates moving from raw cotton to cotton fabric increases the price fetched by a bale of cotton by 400%, while moving from cotton fabric to garments further increases it by roughly 150% (ADB, 2010). Each bale of cotton that is not processed into garments and so stops shorts of the top stage of the value chain significantly lowers revenue for the industry, as well as resulting in lost employment potential.
Quota Regime
Change
$
M
i
l
l
i
o
n

7
Table 1-2: Price fetched by a bale as it moves from raw cotton to woven garments
Source: ADB 2010
Figure 1-2: Percentage Composition of Pakistan’s Textile Exports along with Average $ Price (2011)
$4.11/kg
$1.12/kg
$3.0/kg
$2.52/kg
$6.79/kg$18.39/doz
$51.63/doz
$2.52/kg0.0
5.0
10.0
15.0
20.0
25.0
Source: Data taken from www.aptma.org.pk seen on 06 March 2013.
Figure 1-2 above demonstrates that Pakistani exports are concentrated at the lower value added spectrum of the textile chain as listed in table 2. Hence, it is not surprising to see low dollar price fetched on average by Pakistani exports. Pakistan is consistently adding very little value to its production of cotton.
The evidence above and that referred to in existing literature suggest that there has been significant investment and development in the value chain up to the spinning stage in Pakistan,
Product US $ Raw Cotton 119 Cotton Yarn 253 Towels 434 Cotton Fabric (Grey) 579 Finished Fabric 603 Bed wear 618 Knitwear 1401 Woven Garments 1561
8
however, the latter stages have not developed sufficiently. The section below looks at the various policy inputs and conditions in a historical context that have contributed to the skewed development in favor of lower value added products. Even though the readymade garment industry provides the highest value addition and employment generation in the textile industry it has not attracted a proportionate share of total investment.
1.2 Historical Evolution of the Textile Value Chain in Pakistan: Skewed
policy incentives
This section of the report provides a synthesis of work done by other researchers and policy documents of the Government of Pakistan. Pakistan’s share of the world exports of apparel is considerably less than its share of textile commodities. This high share of the world exports of cotton-based commodities reflects Pakistan’s failure to utilize intermediate goods to produce more value added products.
The development of the textile industry in Pakistan began soon after partition when the government following an import substitution policy started to encourage the establishment of new textile mills. Initially, these were composite, vertically integrated units, doing everything from spinning to weaving. However, in the late 1960s, several factors combined to push the industry towards more fragmentation or stand-alone (mostly spinning) units. These factors included a proclivity of industrialists to have smaller mills for the fear of labour unrest, for ease in dividing up family assets among their progeny, and to avoid tax regulations aimed at large units.
In 1971, much of the private sector in Pakistan was nationalized. Though the textile industry largely evaded the extensive nationalization policies, heavy import duties were placed on the import of textile machinery. There was a focus on importing technology as opposed to machinery, with a view to developing the textile machinery industry locally. Hence Textile Machinery Company (TMC) was set up at Korangi, Karachi, to produce manual and automatic cone winding machines. Spinning Machinery Company (SMC) was set up at Kot Lakhpat, Lahore, to produce ring-spinning frames/machines. A nationalized company, Pakistan Engineering Company Ltd (PECO), at Lahore was already manufacturing and marketing power looms. Simultaneously, the government also started issuing licenses for more value added growth (for instance if an industrialist had a spinning mill, policy encouragement was to go into weaving) but before that policy could engender growth of the garment industry, government priorities shifted once again (ADB, 2010).
By the 1980’s the government’s main focus was export led growth. This policy shift within the textile sector was specifically driven by the US allocation of quotas in certain product categories to Pakistan, and, an increasing world demand for high quality cloth in general. Pakistan abolished the high tariffs on textile machinery imports in order to make its exports competitive in
9
the world market. It was able to do that successfully and hence fully capitalized on the world quota regime to increase its exports. However, the country’s exports mostly comprised cloth and low value added knits and it was only competing on price (as opposed to product quality and innovation). Pakistan’s export of value added product categories like ladies apparel and high fashion textiles hence dropped after the elimination of the quota regime in 2005 and it has lagged behind since then (ADB, 2010).
Ad hoc policy changes and lack of investment in the value added segment of the textile value chain have thus prevented Pakistan’s textile industry from achieving its full potential. Government policies and trends in the world market for textiles have also benefited spinners and weavers over garment producers and hence stunted the growth of the latter. This is discussed in the section below.
1.3 Policy Incentives over time
In the case of Pakistan, the structural change has been tilted towards the services sector. Pakistan, from being a largely agrarian economy in terms of contribution to GDP, has become a services led economy, with services accounting for more than 50% of the GDP. Manufacturing share, on the other hand, has grown more slowly. Both agriculture and industry have a share of approximately 25 per cent in GDP, with the share of agriculture falling and the share of industry remaining fairly constant over time. This means that structural transformation in Pakistan has been from agriculture to services, circumventing to a large extent the manufacturing sector. This trend provides evidence for consumption led growth and little policy focus on manufacturing. This overall policy stance trickles down to the textile sector.
Pakistan is the world’s third largest producer of yarn, following India and China. Hence the yarn sector in Pakistan has been a historical recipient of favorable policy incentives by all governments. The spinning sector comprises around 521 textile units (50 composite units, 471 spinning units), with an installed and operational capacity of approximately 12 M and 10 M spindles respectively. The spinning sector has historically attracted the largest share of investment in the textile industry. Since 1990, it has almost doubled in capacity. Part of the reason for the disproportionate investment is that spinning does not require very skilled labour, sophisticated management or superior organizational capability and hence it is well suited to Pakistan’s business environment. Moreover, since yarn is a commodity, spinners are not dependent on powerful individual buyers (buying houses) like garment manufacturers are (PES 2011-12)2.
The growing demand for cotton and other types of yarn in the world market has also given an impetus to the spinning industry. Most producers prefer to export yarn despite local demand for
2 (Pakistan Economic Survey 2011-‐12)

10
the same by high value added product manufacturers. This is mainly due to the comfort of the industrialist given shortage of skilled manpower and inadequate business environment. Cotton yarn is the basic ingredient of the value-added sector but its shortage has made it difficult for garment and other textile made-up producers to meet their export orders. Since the spinning sector is one of the most powerful industrial lobbies in Pakistan, the government has so far done little to address this problem, apart from allowing the import of a limited amount of duty free yarn into the industry. The Federal Board of Revenue (FBR) notified the concession of duty free import of cotton yarn to ensure yarn availability for the textile chain.
Government support has also historically favored investment in the spinning sector over other sectors of the value chain. When successive crop failures after 1996 resulted in an over saturated spinning sector, many units started to shut down. This resulted in a slowing of investment into the sector (both new investment and Building Maintenance and Repair (BMR) investment). The government then intervened to provide credit to the spinning industry on easy terms via different financial institutions (particularly for BMR investment in the industry). During early part of 2003-06, textile operators have imported more than $2.90 billion worth of machinery. Besides the replacement of old spindles, about 3.21 million spindles have also been added over the course of the last ten years. With China shutting down the export of yarn from its 12 million spindles, this figure is likely to grow as Pakistani manufacturers attempt to fill the gap and import these production units from China (Pakistan Textile Journal, February 2010).
The textile industry has benefited from various kind of subsidies and tax concessions over the years, again mostly to the benefit of spinners and weavers. A number of government subsidies have simply paid out money to firms to keep them afloat or to help them maintain healthy revenues in the face of bad times. One such subsidy was the R&D rebate (2005-06) that allowed exporters to claim as R&D expense, 6% of FoB value for knitted and woven, 3% for dyed and printed fabrics; domestic producers could claim 5% for home textiles. This scheme was worth $500 million but ended when there were widespread claims of fraud. Another $15 million was provided to the spinning sector to subsidize outstanding loans (ADB 2010).
Subsidies for the spinning and weaving sector have also come in the form of reduction in taxes paid on inputs or capital equipment. The ginning industry has benefited from zero import duty on ginning presses. The government has also used different duties for different counts of yarn to protect the spinning sector (ADB, 2010).
Hence despite over capacity the spinning sector has continued to grow over the last few decades. Low barriers to entry, government policy and low skill requirements have all contributed to this trend. What is interesting and perhaps not surprising is that instead of pushing government to facilitate value addition and make resources available for that, spinners have in fact resisted any effort to move into higher value added products. The policy support to the spinning sector has resulted in them being resistant to moving up the value chain. While the government has started
11
to pay more attention to the apparel and garments sector over the last decade as evidenced in he Textile Policy 2009-14, the sector is still much below its potential. Knitwear and woven apparel, while much more profitable, require managerial, technical and organizational capabilities, as well as factor inputs that are scarce in Pakistan’s business environment. Still, due to the quota regime that dominated global textile trade for decades and Pakistan’s favourable allocation in particular categories, Pakistan’s knitwear industry developed rapidly in the 1980s. The elimination of quotas in 2005 was expected to open up hitherto closed avenues for Pakistan’s exports. Instead it ended up exposing Pakistan’s failings and weaknesses. Pakistan’s apparel industry had relied on easy access to markets though quotas and generally was unable to develop many capabilities beyond those required for men’s knitted shirts and gradually slipped behind smaller competitors such as Bangladesh. Similarly, the apparel industry had been too focused on the US market and had a miniscule share in the EU or other markets (ADB, 2010).
Post 2005, Pakistan visibly slid down the value chain, with gains in low value-added exports and setbacks in higher value-added ones. In the global market, Pakistan’s value-added sectors were unable to compete effectively. Combined with pressure from Chinese, Bangladeshi and Sri Lankan competitors, political turmoil, high interest rates and acute shortage of energy have made Pakistan’s textile industry quite vulnerable.
Although the magnitude of Pakistan’s cotton yarn and clothing exports is impressive reflecting decades of sustained growth, however, it also indicates the failure of the industry to move into higher value added products. The relative strength of our spinning and weaving sectors similarly suggests the success of our competitors to move out of cloth and yarn exports into higher value added exports. Government policy historically has contributed to this skewed growth, with various tax incentives and other investment support for the lower ends of the value chain. The latest Textile Policy (for 2009-2014) focuses more on value added sectors such as textile made-ups but there’s still a need to translate policy into practice. A greater policy focus on the apparel stage of the value chain is needed to realize its revenue and employment potential.
1.4 Objective and Structure of the Report
The objective of this report is to identify the main reasons for the relative stagnation and lack of competitiveness of Pakistan’s garments sector. This is done by analyzing both secondary and primary sources of information on the garments sector. The secondary analysis, conducted in Chapter 2, employs a macro level framework using disaggregated trade statistics to show the performance and relative positioning of Pakistan’s garment exports in comparison to Turkey and Bangladesh. This chapter also provides a survey of literature on the three countries comparing and contrasting differences in policies and their varied outcomes.
The primary analysis is done on a survey data of 234 garment firms across the major garment clusters in the country. The survey has been done exclusively for this particular study. The
12
analysis of this data is subsequently carried out using two different methodologies. The first methodology is the Structure, Conduct and Performance approach (SCP) while the second is the Global Value Chain framework (GVC). These two methodologies are discussed in Chapter 3 of this report. The data description is given using the SCP approach in chapter 4. In the final chapter the GVC approach is used to identify and explain the positioning of the Pakistan garments manufacturers. The micro-firm level analysis is thus done to corroborate and substantiate the macro level findings in the study.
13
2 A Comparative Analysis of the Garment Sector of Pakistan,
Turkey and Bangladesh
2.1 Introduction
This chapter has been divided into two main sections. The first, compares the relative global competitiveness of the garments sector in Pakistan with that of Turkey and Bangladesh, while the second provides the main reasons as identified in the existing literature for the apparent lack of competitiveness of Pakistan’s garments sector In the first section the analysis has been conducted using trade data of the three countries at both the 4 and 6-digit HS-Code level. The objective is to give a macro picture of the structure and performance of Pakistan’s garments exports over time in comparison with two competitor countries. The second section uses the extensive literature on the garments sector to summarise the main reasons behind the relative stagnation and lack of competitiveness of Pakistan’s garment industry especially post the quota regime.
Although, Pakistan has a much longer history of manufacturing and exporting garments as compared to Bangladesh and Turkey, its relative share of the world exports of garments is considerably less than its share in textile commodities. Readymade garment exports constitute about 13% of Pakistan’s $9.6 billion worth of textile exports, whereas raw cotton, cotton yarn and cotton cloth constitute roughly 35%. Pakistan’s high share of the world exports of cotton based commodities reflects its failure to utilize these intermediate goods to produce more value added products.
Turkey’s clothing and textile sector is considered to be the “Locomotive Sectors” of the economy, as it drives the GDP, employment and industrial production of the country. Combined, these sectors contribute about 6-7% of Turkey’s GDP and constitute an 18.5% share in Turkey’s total export volume (as of 2011) (MoE Turkey, 2007). Initially Turkey’s clothing industry was largely spurred by domestic demand but the focus on export orientation in the 1980’s eventually succeeded in enabling exporters to reach more markets abroad. Between these two phases, during the 1970’s the government started supporting the industry via import substitution policies, tax incentives for investors and tax rebates for exporters as well. In 1980’s the government initiated multiple economic liberalization policies that transformed the country from a statist to a market based economy. Production accelerated export orientation and the apparel industry emerged as a strong part of the economy. Turkish exporters entered markets in Iraq, Libya, and the EU, the latter especially through Germany. During the 1990s, focus shifted towards subcontracting and Turkey became the production and distribution centre of large German, Dutch and US firms. In 1996, Turkey signed a customs union agreement with EU and

14
subsequently became the second biggest supplier of apparel to EU and the fifth biggest exporter of the world (Culpan, Ekin and Kumbaraci).
Over the past two decades, growth in Turkey’s garment industry has been export led. In 2011, Turkey’s clothing industry was valued at $13.5 billion and it was exporting 65 percent of its production MoE Turkey, 2007. Turkey had a particularly good export performance in the 1990’s during which time the share of the clothing industry exceeded 20% of Turkey’s total exports.
Similarly, Bangladesh’s garment industry has also seen rapid growth in the past few decades. Though traditionally the jute industry has dominated Bangladesh’s industrial sector, the readymade garment industry started replacing it in the 1980’s. Today the garment industry is the only multi-billion dollar manufacturing and export industry in Bangladesh. Whereas the industry contributed only 0.001 per cent to the country’s total export earnings in 1976, its share increased to above 75 per cent of those earnings in 2010. The country’s Ready Made Garment (RMG) industry grew by more than 15 per cent per annum on average during the last 15 years. The foreign exchange earnings and employment generation of the RMG sector have been increasing at double-digit rates from year to year. Though the size of the Bangladesh apparel industry still lags behind the world’s leading suppliers, the industry’s rapid growth in the past few years has been quite phenomenal. In 2010 the industry earned more than 15 billion US dollars from export and has emerged as Bangladesh’s most important industrial sector, comprising 13% of its GDP.
The section below provides an aggregate level trade comparison for Pakistan, Turkey and Bangladesh. This is done by comparing the relative share of each country in the top garment exports of the world, the average price fetched by the main garment exports of each country and the relative export performance of the three countries pre and post the quota regime.
2.2 Aggregate Level Comparison: Pakistan, Turkey & Bangladesh
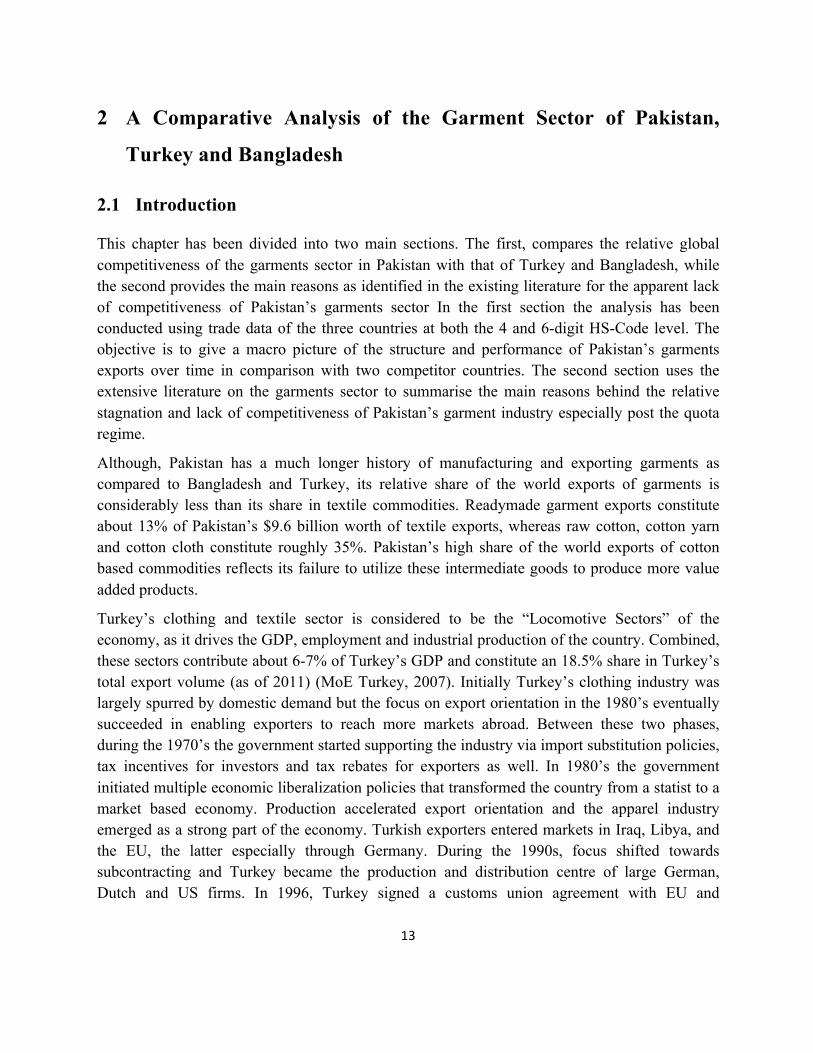
We looked at trade data for the garments industry at 4-digit HS-Code level over a three year period 2009-2011. This involved looking at 44 different product categories which cover the entire range of garment products traded globally. Based on the average trade volumes over the three year period we selected products with global export value of more than US$ 10 Billion for further analysis. The figure 2-1 below show the product categories and the average global export over the three year period mentioned above.
15
Figure 2-1: Average Export of Leading Garment Products over 2009-2011 (US$ Billions)
-‐
5.00
10.00
15.00
20.00
25.00
30.00
35.00
40.00
45.00
50.00
6204 6110 6203 6109 6104 6302 6115 6202 6205 6103 6206
Table 2-1: Description of Top Exporting Garment Products over 2009-2011 (US$ Billions)
HS-Code
Product Category Description
6204 Women's or girls' suits, ensembles, jackets, blazers, dresses, skirts, divided skirts, trousers, bib and brace overalls, breeches and shorts (other than swimwear).
6110 Jerseys, pullovers, cardigans, waist-coats and similar articles, knitted or crocheted. 6203 Men's or boys' suits, ensembles, jackets, blazers, trousers, bib and brace overalls,
breeches and shorts (other than swimwear). 6109 T-shirts, singlets and other vests, knitted or crocheted. 6104 Women's or girls' suits, ensembles, jackets, blazers, dresses, skirts, divided skirts,
trousers, bib and brace overalls, breeches and shorts (other than swimwear), 6302 Bed linen, table linen, toilet linen and kitchen linen. 6115 Panty hose, tights, stockings, socks and other hosiery, including stockings for
varicose veins and footwear without applied soles, knitted or crocheted. 6202 Women's or girls' overcoats, car-coats, capes, cloaks, anoraks (including ski-jackets),
wind-cheaters, wind-jackets and similar articles, other than those of heading 6205 Men's or boys' shirts. 6103 Men's or boys' suits, ensembles, jackets, blazers, trousers, bib and brace overalls,
breeches and shorts (other than swimwear), knitted or crocheted. 6206 Women's or girls' blouses, shirts and shirt-blouses.
Source: Data is sourced from comtrade.un.org for World, Pakistan and Turkey. For Bangladesh the data is sourced from Bangladesh Bureau of Statistics website http://www.bbs.gov.bd/home.aspx.
16
Interestingly, five of the top eleven product categories comprise garments specifically for women, two general categories, three categories for men garments and one household.
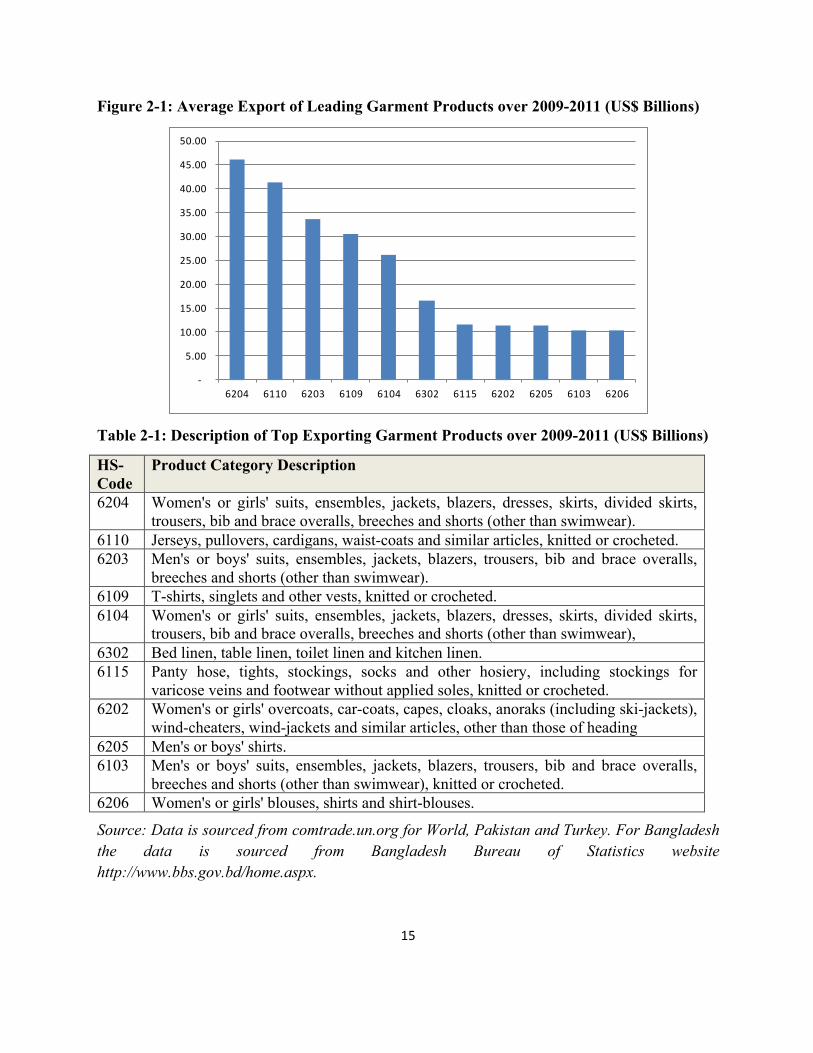
The figure 2-1 above shows that the top five products in garments have a global market of over US$200 Billion. Pakistan’s share in these products as compared to Turkey and Bangladesh is significantly smaller. The percentage shares in these products for each of the countries are provided in the figure 2-2 below.
Figure 2-2: Country’s Share in World Export of the Product Category (% - Average over 2009-2011)
-‐
2.00
4.00
6.00
8.00
10.00
12.00
14.00
16.00
18.00
6204 6110 6203 6109 6104 6302 6115 6202 6205 6103 6206
Pakistan Turkey Bangladesh Source: Data is sourced from comtrade.un.org for World, Pakistan and Turkey. For Bangladesh the data is sourced from Bangladesh Bureau of Statistics website http://www.bbs.gov.bd/home.aspx
Out of these garment categories, Pakistan has a greater world share in only one product category Bed linen, table linen, toilet linen and kitchen linen compared to Turkey and Bangladesh. In the other product categories Turkey and Bangladesh have a much higher share. Bangladesh leads in four categories, while the remaining six are captured by Turkey. It is worth noting that the differential in shares of Turkey and Bangladesh are much smaller as compared to the differentials in shares with Pakistan. Hence, data suggests that size of Pakistan’s exports in top export garment product categories is fairly small. Moreover, Bangladesh has the largest shares in three out of the four product categories that have annual exports in excess of US$30 Billion.
17
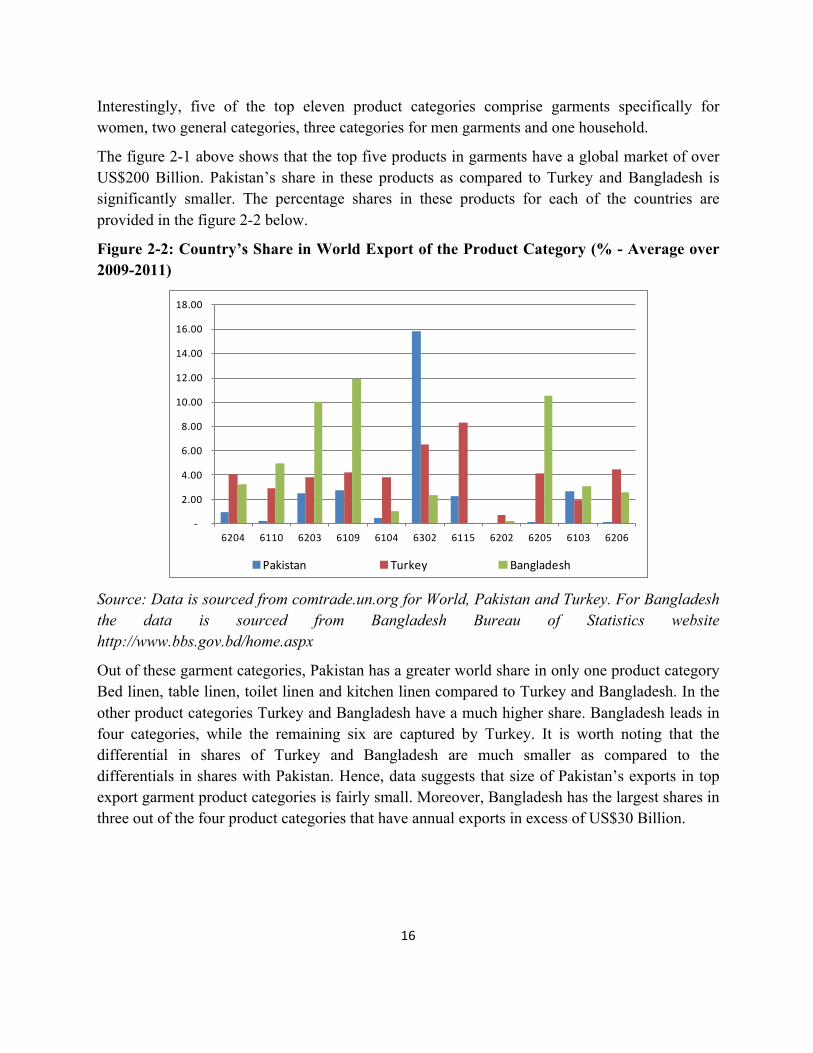
The figure 2-3 below presents another important indicator of Pakistan’s performance in the garments sectors. With the exception of one product3 average price fetched by Pakistani products in all categories is significantly less than that of Bangladesh and Turkey. The differentials between Turkey and Bangladesh on the other hand are minor with Turkey generally fetching a slightly higher price than Bangladesh. This may be a result of factors such as; (i) Turkey and Bangladesh producing more categories under their own brands and; (ii) Turkey and Bangladesh producing higher value and more sophisticated sub-products in each of the listed categories. In the section that follows we conduct competitive positioning analysis at 6-Digit HS-Code level. This analysis will help explain this price differential linked to product sophistication between Pakistan and the competitor countries.
Figure 2-3: Average Price per Unit Fetched by Products over 2009-2011 (US$/unit)
0
5
10
15
20
25
30
35
6204 6110 6203 6109 6104 6302 6115 6202 6205 6103 6206
Pakistan Turkey Bangladesh Source: Data is sourced from comtrade.un.org for World, Pakistan and Turkey. For Bangladesh the data is sourced from Bangladesh Bureau of Statistics website http://www.bbs.gov.bd/home.aspx
To conclude, the aggregate level trade data at the 4-Digit HS-Code presents some interesting findings and comparisons across the three countries. It highlights that women clothing of all sorts has much larger demand as reflected in large export volumes. It shows that although Bangladesh and Turkey started exporting much later than Pakistan, they are significantly ahead in these products with much higher average export price per unit than that of Pakistan. Finally, to end the section on a positive note, Pakistan has experienced significant growth in the two largest product
3 Panty hose, tights, stockings, socks and other hosiery, including stockings for varicose veins and footwear without applied soles, knitted or crocheted
18
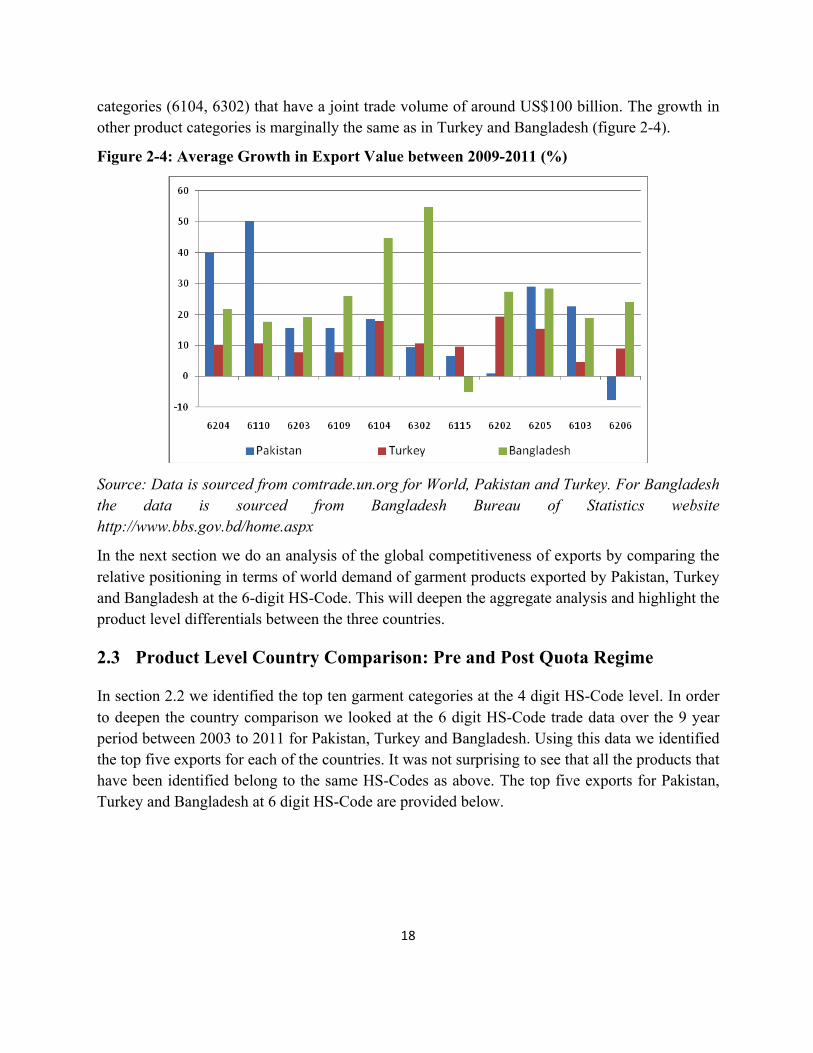
categories (6104, 6302) that have a joint trade volume of around US$100 billion. The growth in other product categories is marginally the same as in Turkey and Bangladesh (figure 2-4).
Figure 2-4: Average Growth in Export Value between 2009-2011 (%)
Source: Data is sourced from comtrade.un.org for World, Pakistan and Turkey. For Bangladesh the data is sourced from Bangladesh Bureau of Statistics website http://www.bbs.gov.bd/home.aspx
In the next section we do an analysis of the global competitiveness of exports by comparing the relative positioning in terms of world demand of garment products exported by Pakistan, Turkey and Bangladesh at the 6-digit HS-Code. This will deepen the aggregate analysis and highlight the product level differentials between the three countries.
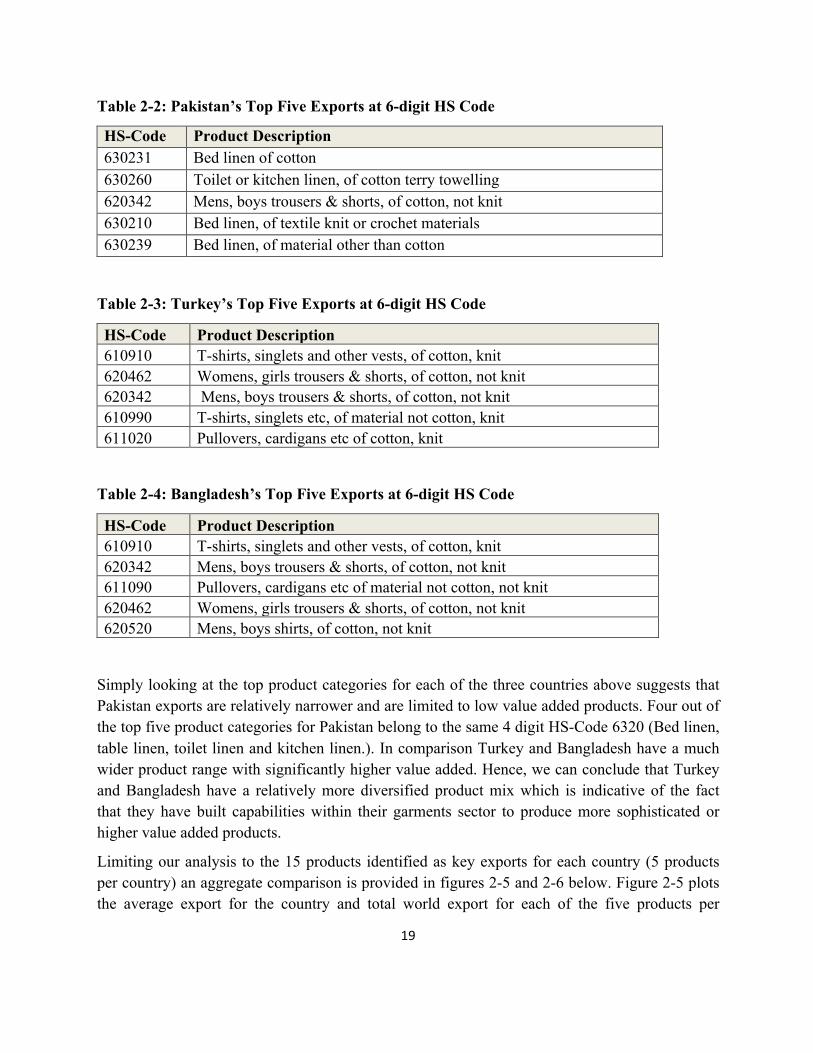
2.3 Product Level Country Comparison: Pre and Post Quota Regime
In section 2.2 we identified the top ten garment categories at the 4 digit HS-Code level. In order to deepen the country comparison we looked at the 6 digit HS-Code trade data over the 9 year period between 2003 to 2011 for Pakistan, Turkey and Bangladesh. Using this data we identified the top five exports for each of the countries. It was not surprising to see that all the products that have been identified belong to the same HS-Codes as above. The top five exports for Pakistan, Turkey and Bangladesh at 6 digit HS-Code are provided below.
19
Table 2-2: Pakistan’s Top Five Exports at 6-digit HS Code
HS-Code Product Description 630231 Bed linen of cotton 630260 Toilet or kitchen linen, of cotton terry towelling 620342 Mens, boys trousers & shorts, of cotton, not knit 630210 Bed linen, of textile knit or crochet materials 630239 Bed linen, of material other than cotton
Table 2-3: Turkey’s Top Five Exports at 6-digit HS Code
HS-Code Product Description 610910 T-shirts, singlets and other vests, of cotton, knit 620462 Womens, girls trousers & shorts, of cotton, not knit 620342 Mens, boys trousers & shorts, of cotton, not knit 610990 T-shirts, singlets etc, of material not cotton, knit 611020 Pullovers, cardigans etc of cotton, knit
Table 2-4: Bangladesh’s Top Five Exports at 6-digit HS Code
HS-Code Product Description 610910 T-shirts, singlets and other vests, of cotton, knit 620342 Mens, boys trousers & shorts, of cotton, not knit 611090 Pullovers, cardigans etc of material not cotton, not knit 620462 Womens, girls trousers & shorts, of cotton, not knit 620520 Mens, boys shirts, of cotton, not knit
Simply looking at the top product categories for each of the three countries above suggests that Pakistan exports are relatively narrower and are limited to low value added products. Four out of the top five product categories for Pakistan belong to the same 4 digit HS-Code 6320 (Bed linen, table linen, toilet linen and kitchen linen.). In comparison Turkey and Bangladesh have a much wider product range with significantly higher value added. Hence, we can conclude that Turkey and Bangladesh have a relatively more diversified product mix which is indicative of the fact that they have built capabilities within their garments sector to produce more sophisticated or higher value added products.
Limiting our analysis to the 15 products identified as key exports for each country (5 products per country) an aggregate comparison is provided in figures 2-5 and 2-6 below. Figure 2-5 plots the average export for the country and total world export for each of the five products per
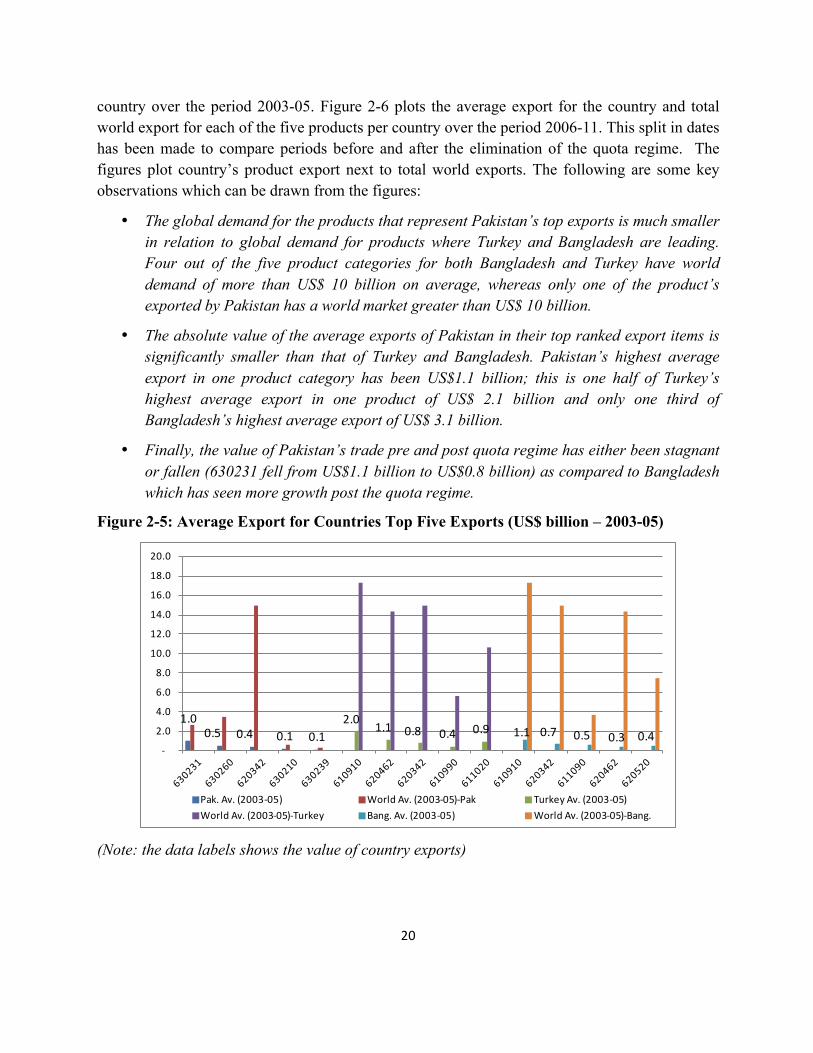
20
country over the period 2003-05. Figure 2-6 plots the average export for the country and total world export for each of the five products per country over the period 2006-11. This split in dates has been made to compare periods before and after the elimination of the quota regime. The figures plot country’s product export next to total world exports. The following are some key observations which can be drawn from the figures:
• The global demand for the products that represent Pakistan’s top exports is much smaller in relation to global demand for products where Turkey and Bangladesh are leading. Four out of the five product categories for both Bangladesh and Turkey have world demand of more than US$ 10 billion on average, whereas only one of the product’s exported by Pakistan has a world market greater than US$ 10 billion.
• The absolute value of the average exports of Pakistan in their top ranked export items is significantly smaller than that of Turkey and Bangladesh. Pakistan’s highest average export in one product category has been US$1.1 billion; this is one half of Turkey’s highest average export in one product of US$ 2.1 billion and only one third of Bangladesh’s highest average export of US$ 3.1 billion.
• Finally, the value of Pakistan’s trade pre and post quota regime has either been stagnant or fallen (630231 fell from US$1.1 billion to US$0.8 billion) as compared to Bangladesh which has seen more growth post the quota regime.
Figure 2-5: Average Export for Countries Top Five Exports (US$ billion – 2003-05)
1.0 0.5 0.4 0.1 0.1
2.0 1.1 0.8 0.4 0.9 1.1 0.7 0.5 0.3 0.4-‐
2.0
4.0
6.0
8.0
10.0
12.0
14.0
16.0
18.0
20.0
Pak. Av. (2003-‐05) World Av. (2003-‐05)-‐Pak Turkey Av. (2003-‐05)World Av. (2003-‐05)-‐Turkey Bang. Av. (2003-‐05) World Av. (2003-‐05)-‐Bang.
(Note: the data labels shows the value of country exports)

21
Figure 2-6: Average Export for Countries Top Five Exports (US$ billion – 2006-11)
0.8 0.7
0.6 0.5 0.4 2.1 1.2 1.0 0.7 0.7
3.1 2.41.1 0.9 0.7
-‐
5.0
10.0
15.0
20.0
25.0
Pak. Av. (2006-‐11) World Av. (2006-‐11)-‐Pak Turkey Av. (2006-‐11)World Av. (2006-‐11)-‐Turkey Bang. Av. (2006-‐11) World Av. (2006-‐11)-‐Bang.
(Note: the data labels shows the value of country exports)
Source: Data is sourced from comtrade.un.org for World, Pakistan and Turkey. For Bangladesh the data is sourced from Bangladesh Bureau of Statistics website http://www.bbs.gov.bd/home.aspx
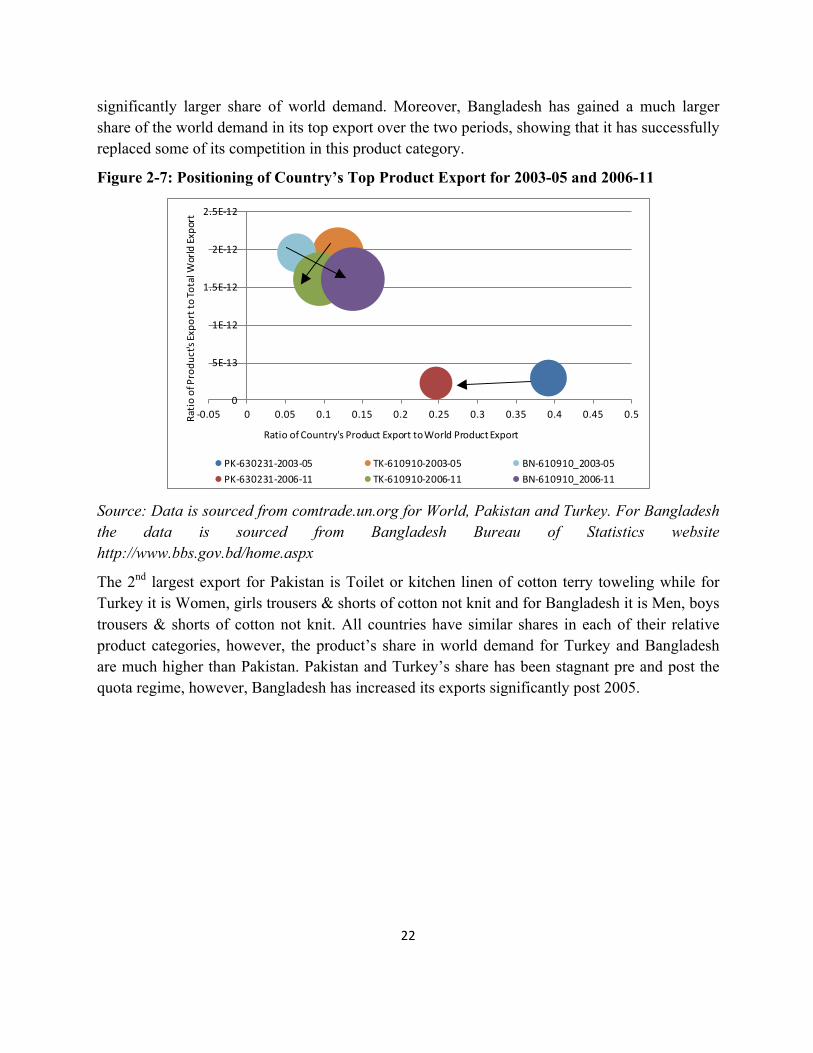
In the following sub section we look at the competitive global positioning of Pakistan relative to Turkey and Bangladesh. The analysis focuses on the top five exports of each country. The figures below capture the competitiveness of Pakistan garment exports. The x-axis plots the ratio of a country’s export in a particular product to that products total world export – capturing a country’s performance within that product category. The y-axis plots the ratio of a particular products world export to total world export – capturing that products performance or demand in overall world exports. The size of the bubble represents the absolute size of a country’s export in a particular product. A higher positive value on both axes and a higher North-East positioning represents a product that is high in world demand (sun-rise) and in which the country is also performing well – hence showing relative competitiveness.
Comparison of the Top Exports for Each Country
The figure 2-7 below provides competitiveness positioning analysis for the top export product for each of the three countries over two periods (2003-05 and 2006-11). The top export for Pakistan is bed Linen whereas for Turkey and Bangladesh is T-shirts, singlets and other vests of cotton knit. Pakistan has a relatively higher share in bed linen-a product that has a relatively small share in world demand. Over the two periods shown Pakistan has lost share in its biggest exporting product. In comparison, the top export of both Bangladesh and Turkey has a
22
significantly larger share of world demand. Moreover, Bangladesh has gained a much larger share of the world demand in its top export over the two periods, showing that it has successfully replaced some of its competition in this product category.
Figure 2-7: Positioning of Country’s Top Product Export for 2003-05 and 2006-11
0
5E-‐13
1E-‐12
1.5E-‐12
2E-‐12
2.5E-‐12
-‐0.05 0 0.05 0.1 0.15 0.2 0.25 0.3 0.35 0.4 0.45 0.5
PK-‐630231-‐2003-‐05 TK-‐610910-‐2003-‐05 BN-‐610910_2003-‐05PK-‐630231-‐2006-‐11 TK-‐610910-‐2006-‐11 BN-‐610910_2006-‐11
Ratio of Produ
ct's Expo
rt to Total W
orld Export
Ratio of Country's Product Export to World Product Export
Source: Data is sourced from comtrade.un.org for World, Pakistan and Turkey. For Bangladesh the data is sourced from Bangladesh Bureau of Statistics website http://www.bbs.gov.bd/home.aspx
The 2nd largest export for Pakistan is Toilet or kitchen linen of cotton terry toweling while for Turkey it is Women, girls trousers & shorts of cotton not knit and for Bangladesh it is Men, boys trousers & shorts of cotton not knit. All countries have similar shares in each of their relative product categories, however, the product’s share in world demand for Turkey and Bangladesh are much higher than Pakistan. Pakistan and Turkey’s share has been stagnant pre and post the quota regime, however, Bangladesh has increased its exports significantly post 2005.
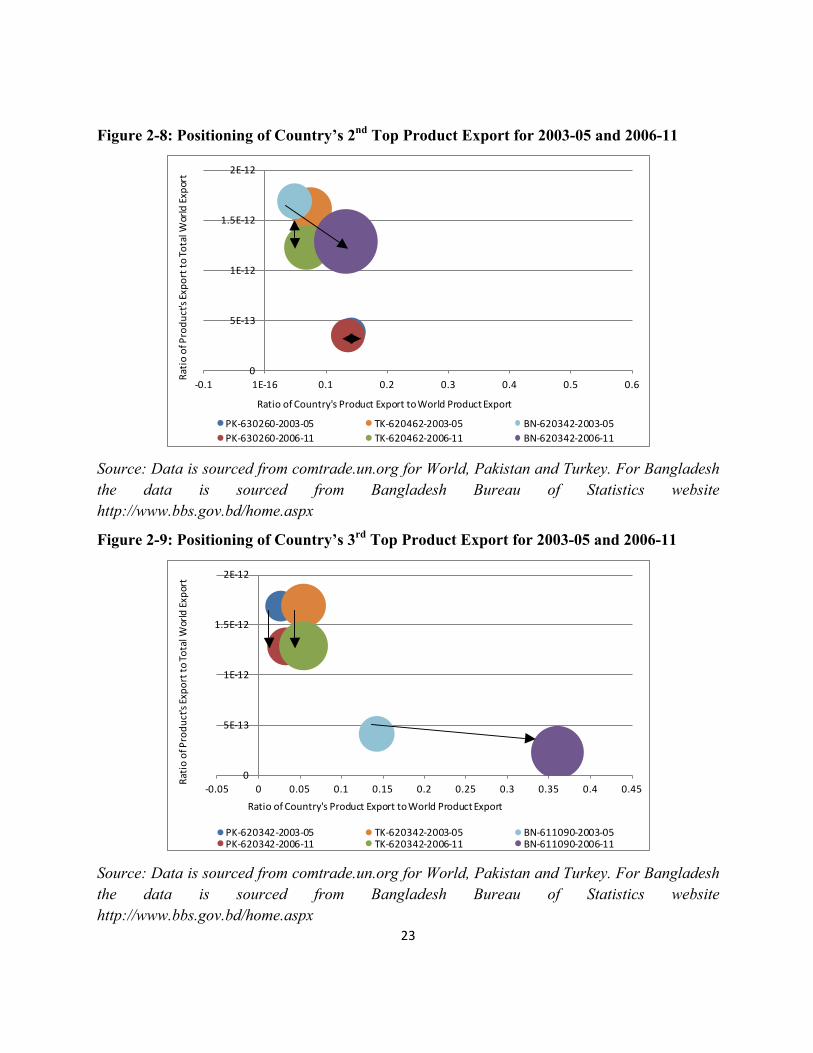
23
Figure 2-8: Positioning of Country’s 2nd Top Product Export for 2003-05 and 2006-11
0
5E-‐13
1E-‐12
1.5E-‐12
2E-‐12
-‐0.1 1E-‐16 0.1 0.2 0.3 0.4 0.5 0.6
PK-‐630260-‐2003-‐05 TK-‐620462-‐2003-‐05 BN-‐620342-‐2003-‐05PK-‐630260-‐2006-‐11 TK-‐620462-‐2006-‐11 BN-‐620342-‐2006-‐11
Ratio of Country's Product Export to World Product Export
Ratio of Produ
ct's Expo
rt to Total W
orld Export
Source: Data is sourced from comtrade.un.org for World, Pakistan and Turkey. For Bangladesh the data is sourced from Bangladesh Bureau of Statistics website http://www.bbs.gov.bd/home.aspx
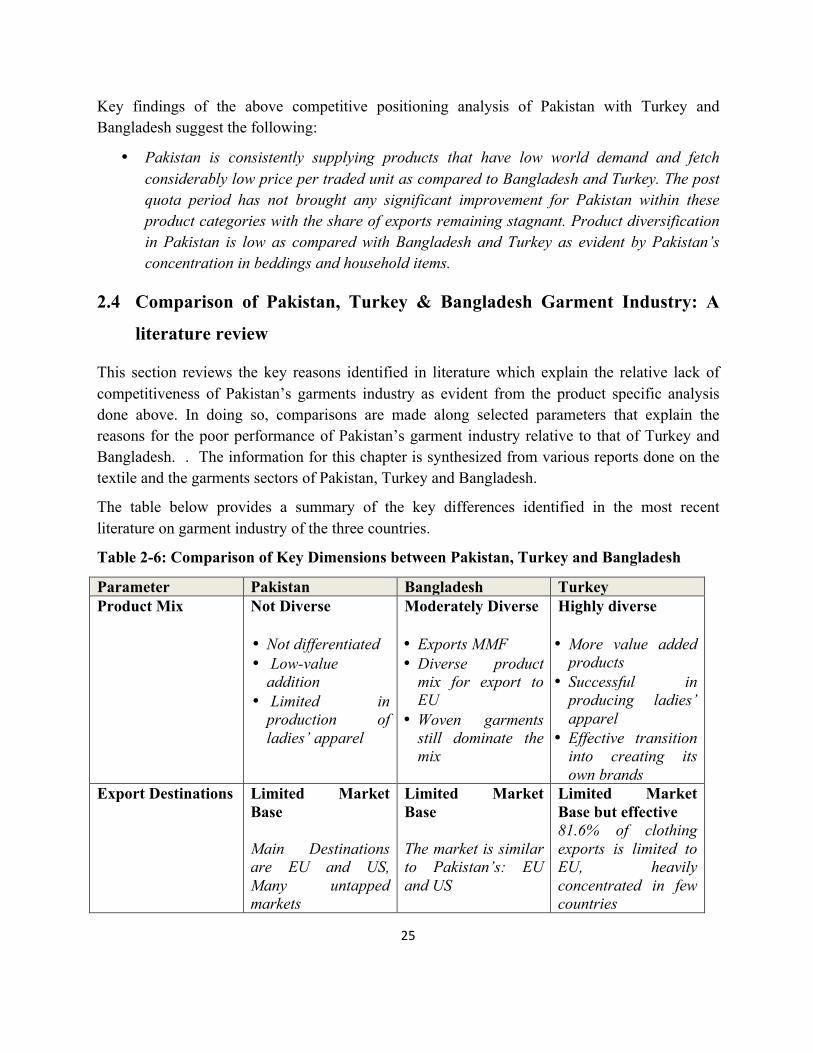
Figure 2-9: Positioning of Country’s 3rd Top Product Export for 2003-05 and 2006-11
0
5E-‐13
1E-‐12
1.5E-‐12
2E-‐12
-‐0.05 0 0.05 0.1 0.15 0.2 0.25 0.3 0.35 0.4 0.45
PK-‐620342-‐2003-‐05 TK-‐620342-‐2003-‐05 BN-‐611090-‐2003-‐05PK-‐620342-‐2006-‐11 TK-‐620342-‐2006-‐11 BN-‐611090-‐2006-‐11
Ratio of Country's Product Export to World Product Export
Ratio of Produ
ct's Expo
rt to Total W
orld Export
Source: Data is sourced from comtrade.un.org for World, Pakistan and Turkey. For Bangladesh the data is sourced from Bangladesh Bureau of Statistics website http://www.bbs.gov.bd/home.aspx

24
The 3rd largest export for Pakistan and Turkey is Mens, boys trousers & shorts of cotton not knit. For Bangladesh it is Pullovers, cardigans etc. of material not cotton and not knit. The figure below shows that Pakistan and Turkey are in products that have a relatively high share in world demand as compared to Bangladesh. However, Pakistan’s share is much smaller than Turkey and has stayed the same pre and post quota regime. Bangladesh on the other hand has seen an expansion in its third largest export product moving from pre to post quota regime.
Table 2-5: Average Export price 2009-2012 top three products
Top Exports Pakistan Turkey Bangladesh 1st US $6.8/Kg*
(630231) US $4/piece (610910)
US $10.5/piece (610910)
2nd US $4.02/Kg* (630260)
US $14.5/piece (620462)
US $11.5/piece (620342)
3rd US $5.29/piece (620342)
US $14.5/piece (620342)
US $13.3/piece (611090)
Source: Source: Data is sourced from comtrade.un.org for World, Pakistan and Turkey. For Bangladesh the data is sourced from Bangladesh Bureau of Statistics website http://www.bbs.gov.bd/home.aspx
* The commodities are exported in Kg’s hence the price is only available in this unit. This however, suggests that Pakistan is fetching low prices on its cotton.
To further explore competitiveness we have also compared the average export price for the three countries in their respective products. As shown in table 5 above, Pakistan’s average export price over the last three years for its top exported product is US$6.8/kg for 630231; average export price over the last three years for Turkey is US$4/piece for 610910; and for Bangladesh is US$10.5/piece for 610910. Hence, Bangladesh is adding most value per kg of cotton used in the product line. Turkey’s price is much lower than Bangladesh but they are adding more value per kg than Pakistan.
Pakistan’s average export price over the last three years for its second highest export is US$4.02/kg for 630260; average export price over the last three years for Turkey is US$14.5/piece for 620462; and for Bangladesh it is US$11.5/piece for 620342. Hence, Turkey is adding most value per kg of cotton used in the product line followed by Bangladesh. While Pakistan’s second top export is also in a low value added product.
Similar to the top two export products, Pakistan’s average export price for the third highest export over last three years is also considerably lower than that of Turkey and Bangladesh: US$5.29/piece compared to Turkey’s US$14.5/piece and Bangladesh’s US$13.3/piece.. Pakistan is therefore the weakest performer in value addition.
The data comparison for the fourth and the fifth highest export also show similar trends in volume and prices.
25
Key findings of the above competitive positioning analysis of Pakistan with Turkey and Bangladesh suggest the following:
• Pakistan is consistently supplying products that have low world demand and fetch considerably low price per traded unit as compared to Bangladesh and Turkey. The post quota period has not brought any significant improvement for Pakistan within these product categories with the share of exports remaining stagnant. Product diversification in Pakistan is low as compared with Bangladesh and Turkey as evident by Pakistan’s concentration in beddings and household items.
2.4 Comparison of Pakistan, Turkey & Bangladesh Garment Industry: A
literature review
This section reviews the key reasons identified in literature which explain the relative lack of competitiveness of Pakistan’s garments industry as evident from the product specific analysis done above. In doing so, comparisons are made along selected parameters that explain the reasons for the poor performance of Pakistan’s garment industry relative to that of Turkey and Bangladesh. . The information for this chapter is synthesized from various reports done on the textile and the garments sectors of Pakistan, Turkey and Bangladesh.
The table below provides a summary of the key differences identified in the most recent literature on garment industry of the three countries.
Table 2-6: Comparison of Key Dimensions between Pakistan, Turkey and Bangladesh
Parameter Pakistan Bangladesh Turkey Product Mix Not Diverse
• Not differentiated • Low-value
addition • Limited in
production of ladies’ apparel
Moderately Diverse • Exports MMF • Diverse product
mix for export to EU
• Woven garments still dominate the mix
Highly diverse • More value added
products • Successful in
producing ladies’ apparel
• Effective transition into creating its own brands
Export Destinations Limited Market Base Main Destinations are EU and US, Many untapped markets
Limited Market Base The market is similar to Pakistan’s: EU and US
Limited Market Base but effective 81.6% of clothing exports is limited to EU, heavily concentrated in few countries
26
Expertise of the Workforce
Low-skilled Lack of specialized knowledge, Inadequate and inefficient training facilities
Moderately skilled Initiatives such as Desh-Daewoo and NIFT aided in training the workforce
Highly skilled Various multi-sector and public sector initiatives such as IKTIB to train the workforce
Government Policies and Incentive Regimes
Not Effective • Ad-hoc policies • Lack of consistent
policies to develop unique capabilities
Effective • Desh-Daewoo
initiative • In 1980s set up
export oriented industries and provided bonded warehouse, Incentive scheme of providing back to back letters of credit system
Effective • In 1980s
subcontracting made Turkey export oriented
• 1996 Customs union agreement made it the second biggest supplier to EU
Regional Clusters and firm size
Moderately Effective 97% of industries are small or medium scale which means very few benefit from economies of scale, Slightly dispersed so moderate agglomeration benefits
Moderately Effective Dhaka and Chittagong are major centres having good linkages
Effective Concentrated in some regions to benefit from agglomeration ( Istanbul, Bursa, Tekirdag, Corlu, Izmir, and Gaziantep)
Production Cost Moderately low • Low labour costs
but energy cost is on the rise
• Labour cost is $114 per month, High energy cost of $0.071 kw/hr
Very low • Very low labour
costs of around $66 per month
• Low energy cost of about $0.053 kw/hr
Relatively High • High labour cost of
$2.75 per hour, Higher energy costs which form 10% of input costs
• Hidden expenses in transportation and customs, Recent increase in tariffs
27
Product Mix
The product mix in the garment industries of Pakistan, Turkey and Bangladesh can be analyzed along two dimensions: product differentiation and value addition, and product diversification. Though the industries of all three countries are far from achieving the optimal product mix, Turkey and Bangladesh export a wider variety of products with greater value addition compared to Pakistan. This was also evident in the data presented above.
Pakistan was able to capitalize on the world quota regime in the garments industry to increase its cotton yarn, fabric and knitted shirts exports many times over. Although this regime allowed Pakistan to increase its share of the world’s value added exports initially, it hindered the development of the requisite capabilities which could lead to greater product differentiation and value addition.. Products manufactured and exported by Pakistan were only competing on price, as opposed to quality, design or innovation. Expectedly, Pakistan’s exports of value added products dropped after the elimination of the quota regime in 2005. Since then it has lagged behind competitors like India and Bangladesh, which compete in the world market on the basis of their more developed and unique industrial and firm level capabilities (ADB, 2010)
Garment manufacturers in Pakistan have also been unable to keep up with changing trends in the global market for apparel. For instance, Pakistan has failed to make any substantial headway in producing and exporting Man Made Fibre (MMF) based textiles. Man-made fibres (MMF) have been gaining market share at the expense of cotton world over and now comprise 65% of the total fibre consumption of the world, making them one of the best growth opportunities in the textile/garment industry. Yet only 25% of Pakistan’s spinning machines produce blended yarn using man-made fibre. This fact, coupled with a weak chemical base and high import duties, has kept the price of MMF very high in the local industry, especially in comparison to cotton. Hence, though MMF based textiles have been proliferating the world textile industry, Pakistan has failed to capitalize on this trend. The bulk of Pakistan’s garment industry remains cotton based, with roughly 72% of the total textile related investments and 82% of the textile industrial units based in cotton spinning, weaving and processing (ADB, 2010).
Potentially even more limiting than the failure to move into MMF based garments has been the failure to move into technical textiles and high fashion garments, which bring the most value addition. The skill and technology for the different cuts, washes and materials required for the latter two are not widely available in the local industry. Much of the cloth produced is low quality grey cloth, as opposed to printed and dyed cloth. Also, quite frequently, cotton contamination in the initial stages of the value chain results in defects/poor quality fabric in the latter stages and cannot be used to produce high fashion garments. Finally, Pakistan does not produce sufficient quantities of elastic yarn (which is used in fashion garments for women and
28
children, undergarments and sportswear), contributing to a disproportionately low share in the world export of these garment categories (ADB, 2010).
The entire category of women’s apparel is underrepresented in Pakistan’s export mix. Most of our apparel exports are concentrated in men products, despite the fact that women apparel is the single largest product category in the global trade of garments. The extent of this bias toward men garments in Pakistan’s textile exports can be discerned from the figure 2-10 below.
Figure 2-10: Composition of Apparel Exports of World and Pakistan (% - 2011)
15
20
41135
22
13
7
World
25
16
104
12
28
13
1
PakistanWoven Men
Woven Women
Knit Men
Knit Women
Baby Wear
Sports Wear
T-‐Shirts
Hoisery & UndergarmentsOthers
Source: Data is sourced from comtrade.un.org for World and Pakistan
Only 15% of Pakistan’s total apparel exports in 2006 were in women’s wear as opposed to 69% in men’s wear, and this trend has continued since. The main reason for this is that ladies apparel requires greater dyeing, stitching and cutting expertise, cutting-edge finishes, finer and more varied qualities of yarn and various other add-ons (zippers, buttons, accessories etc) that are not readily available in the local market. In comparison, Turkey have managed to expand its product base and include ladies apparel in the export mix along with other export items such as cotton knit t-shirts, knitted pullovers, cardigans, vests and socks and major woven products include ladies woven outerwear (shirts and blouses) and men’s outerwear.
Unlike most emerging economies, Turkey entered the competition as a full package supplier to global brands. It did not start with Cut, Make, and Trim (CMT) assembly operations but instead leapfrogged into the industry as a full supplier, continued upgrading from full package operations to design (ODM), and from designing it has now moved on to creating its own brands (OBM) (Fernandez-Stark, Frederick, and Gereffi, 2011).
Turkey has also developed both its knitwear and woven wear production capacity. Knitted clothing and accessories, with an export value of US$ 8.4 billion, had a share of 62.1% in total clothing exports, and woven clothing had a share of 37.9% with a value of US$ 5.1 billion in 2011. Turkey has a share of 4 percent in knit clothing exports and ranks 5th among exporting countries. In woven clothing its share is 2.6 percent i and ranks 10th among world woven
29
exporters. The capacity of woven production is 1,350,000 tons while that of knitted products is around 2,250,000 tons (MoE Turkey, 2012). Moreover, Turkey exports the high value added category of woven ladies apparel, which Pakistan has not managed to penetrate into. This category also represents 25% of the world’s total export of clothing, implying that it has a lot of potential to yield high export earnings.
Bangladesh also produces and exports both knitwear and woven wear, but its products lack diversification. Shirts, T-shirts and trousers are its main woven products and undergarments, socks, stocking, t-shirts, sweaters and other casual and soft garments are its main knit products. Though woven garments still dominate the garment exports of the country, the share of knit exports has been increasing since the early 1990’s. Though Bangladesh exports products like socks, undergarments and other women’s wear that Pakistan lags behind in, only a few product categories, such as shirts, T shirts, trousers, jackets and sweaters, constitute the major production share (Haider, 2007).
In terms of product diversification Bangladesh is doing much better than Pakistan, since most of its exports are concentrated in cotton or manmade fibre products, whereas Pakistan has not developed its MMF garment industry. However, Bangladesh lags behind India and China, whose trade is diversified in all fibre groups.
Export Destinations
The exports of Pakistan, Bangladesh and Turkey are all concentrated to a few countries/regions. Most of Pakistani apparel exports are to the US and EU market. So far, it has not started exporting to other markets like Japan, Far East or the Middle East in any sizable numbers, despite the fact that these regions demand higher product quality and offer higher unit prices in return (FIAS, 2006).
Turkey’s biggest buyer of garments is the European Union. It is the biggest supplier of clothing to the European Union, catering to almost 12% of its total clothing demand. In 2011 Turkey exported clothing of US$ 11 billion to the EU, which was equivalent to 81.6% of Turkey’s total clothing exports. Germany, UK, France, Spain and Italy are its leading export destinations (MoE Turkey, 2012)).
Like Pakistan, the United States and the European Union are the main export destinations of Bangladesh garments. Together these two destinations generate more than 90 per cent of the total clothing export earnings of Bangladesh. The shares of other importers, such as Australia, Canada, China, Japan and the Russian Federation as well as countries in the Middle East, in the total clothing export earnings of Bangladesh are minimal (Haider, 2007).
Bangladesh also enjoys preferential access to the European Union market due to its status as a Least Developed Country (LDC). As an LDC Bangladesh has GSP (General System of Preferences) Plus status according to which it can export products to the European Union duty

30
free, including garments made of imported fabrics. Turkey also has this access by being part of the European Union. Pakistan has also requested for a similar GSP Plus status with the EU Parliament which is currently under consideration.
Skills & Technical Expertise of the Workforce
Pakistan, Turkey and Bangladesh have several programs that aim to train the workforce but the impact and efficacy of these programs show considerable variation across the three countries. The lack of a skilled workforce with technical expertise has been a big hurdle in the transformation of Pakistan’s textile commodity industry into a more developed garment industry. Higher-level managerial skills and technical skills required to produce various garments are not present in the work force. Consequently, most of the investment in the textile value chain has been concentrated in spinning, which requires a lower level of skill than the latter stages of the value chain. Though this translates into one of the world’s lowest labour costs, it also translates into a lower quality of garments and low labour productivity in general. According to an analysis by Technopak, an international textile consultancy based out of India, Pakistan’s productivity (at 50%) is lower than that of Bangladesh (52%) and Turkey (65%). This lack of specialized knowledge in the workforce is a major factor behind the inability of the garment industry to move into the production and export of technical textiles and high fashion garments, which could potentially bring the most value addition and highest returns. The skill and technology for the different cuts, washes and materials required for these product categories are not widely available in the local industry (ADB, 2012).
Moreover, a specific characteristic of the Pakistani knit industry is that the sewing operators are generally males who are hired at piece rates. Female salaried operators on the other hand are found to be more efficient and are generally hired in countries such as China and Bangladesh which have more efficient knitwear industries. There are certain socio-cultural barriers and household specific factors which prevent females from entering the labour market in Pakistan. In order to address this problem at the level of the industry there needs to be a substantial improvement in the knitwear industry’s human resource and supply chain management. For example, introduction of special facilities including training, transportation and female exclusive floors at factories etc. are required. Thus it is imperative to highlight the factors which prevent females from participating in the knitwear industry from a policy perspective and for future research. (Makino).
The gender split in employment of the textile sector in Pakistan can also be attributed to labor laws which impose restrictions on women employment after 7pm. Moreover, entrepreneurs avoid hiring women because of the maternity benefits which have to be provided to them such as paid leave for a fixed time period. Also, there is a very limited number of training institutes that provide stitching training to women. Instead, the apparel industry develops its human resource through the “Ustaad-Shagird” system which is largely male-dominated. (Joshi)
31
By comparison, the general skill level of the Turkish workforce is considerably higher. Turkey has instituted several organizational and public sector initiatives over the years designed to train the garment industry workforce and provide useful expertise and certifications for the overall performance of the industry. From 1980 to 2000, Turkey had global brands assisting subcontractors with management and occupational safety training programs. This was supplemented by manufacturers providing formal internal training on quality control, logistics, management, marketing and sales. Turkey has had initiatives taken by both public sector and multi-sector entities (including public universities) to offer specialized courses, certifications, in-house training, and support for improving labour standards(Fernandez-Stark, Frederick, and Gereffi, 2011).
A good example of such a multi-sector workforce initiative is that by the Istanbul Textile and Apparel Exporters Association (IKTIB) which collaborates with government and private schools to offer certification and academic programs in fashion design and technology, foundation art and design and workshops on styling, drawing etc. The IKTIB has also started 6 industry specific schools for similar technical and vocational training purposes. Such initiatives have enabled Turkey to gain a foothold in the value added ladies apparel and sportswear sector and to keep pace with changing fashion trends (Fernandez-Stark, Frederick, and Gereffi, 2011). Even though Pakistan has nine institutions set up by different textile and apparel associations that offer short courses for middle management and workers as well, they have generally been unable to address the skills deficit due to major issues such as low enrolments rates and inadequate number of qualified trainers. Even the Stitching Machine Operator Training Scheme (SMOT), which trained around 5,000 workers at selected factories, suffered from critical shortcomings, ranging from an initial absence of a syllabus to a shortage of qualified trainers.
Like Pakistan, Bangladesh has low skilled cheap labour available, but its garment industry has invested, quite successfully, in multiple programs that aim at skill development of the workforce. Bangladesh has had various technological adoptions in order to make their firms more competitive in the export market, which has increased the demand for skilled labour. Skilled labour also aids in the growth of small and medium sized firms. Bangladesh has a specialized institution, National Institute of Fashion Technology, which is mainly designed to meet the requirements of skilled labour force in the industry. This trend is not new. As early as 1979, the Daewoo Corporation of South Korea, combined with the efforts of the indigenous new enterprise called Desh Limited, trained several Bangladeshi employees, covering topics from sewing skills to factory management and international marketing. Several researchers agree that the Desh-Daewoo training scheme kick started the growth of Bangladesh’s textile industry as it formed a mass of human capital with high skills in production techniques, international procurement and international marketing. The trend set by Desh has continued and heavy investments continue to be made in skills-building initiatives (Yunus and Yamagata, 2012).

32
Government Policies
The respective governments of Pakistan, Bangladesh and Turkey have responded in different ways to changes in the international trade policy environment employing different incentive regimes for the garment industry. These differences in policy regime form one of the underlying reasons for the varied success of exports of apparel products in the international market.
As was stated in the introduction of the report, Pakistan has lagged behind in garment exports partly due to lack of consistency in policy that have not allowed the sector to develop the capabilities that it should have by now. Although the textile industry largely evaded the extensive nationalization policies of the 70s, heavy import duties were placed on the import of textile machinery. The focus was on importing technology instead, with the objective to develop an indigenous textile machinery industry. At the same time, licenses were granted by the government for more value-added ventures. By the 1980’s however, the policy focus had shifted to export led growth, following the US allocation of quotas in certain product categories to Pakistan and an increasing world demand for high quality cloth in general. Pakistan abolished the high tariffs on textile machinery imports in order to make its exports competitive in the world market. This was done successfully and Pakistan was able to fully capitalize on the world quota regime to increase its exports. However, as Pakistan’s products were only competing on price rather than quality or innovation, its exports of value added products dropped after the elimination of the quota regime in 2005. Since then the country has lagged behind its major competitors as was evident in the macro analysis of competitiveness done in the previous section (ADB, 2010).
There are other endemic policy related issues which have hindered growth of the industry. For instance, the government of Pakistan has official standards to grade cotton, along measures of fineness, fibre length and fibre strength, which are quoted in cotton trading. However, since these standards are not uniformly and impartially applied they are not accepted in the market place. For instance, the instruments that measure cotton quality are not calibrated and rechecked by an independent agent. The lack of acceptable cotton grading standards is a serious problem as it makes identifying, marketing and selling high quality lint very difficult (FIAS, 2016). Similarly, as mentioned earlier, the government has not made sufficient investments in skills training and the output of the few skills training institutes it has established leaves much to be desired.
In August 2009 Government of Pakistan released details for a new 5 year program to revitalize the textile industry. The policy allocated funds to companies to make necessary investments to compete in international apparel markets by increasing the local availability of Pakistan-made textiles, especially yarns and fabrics. The initiative focused on gas and electricity supply, full refund of past R&D claims, availability of 5% export refinancing, relief on long-term loans, tax free import of machinery and subsidized credit. However, the inability of the government to implement the policy initiatives fully compromised its impact. (Gereffi and Frederick).
33
In contrast to Pakistan, the garment industry policies of Turkey and Bangladesh have been more consistent and both countries have utilized the world quota regime to develop a competitive advantage in the export of various products. Turkey did not employ ad hoc policy changes and instead chalked out incentive regimes which encouraged the growth of the industry. Between 1962 and 1972, the Turkish government implemented import substitution policies in an effort to build domestic industries. During this first planned development period, the private sector strengthened and played a larger role in the garments cluster. Between 1980 and 1989, aggressive export policies further increased the share of Turkish textiles in foreign markets. One of the most important initiatives by the Turkish government has been its investment in the skill development of the employees in the textile industry (Culpan, Ekin, and Kumbaraci).
Various other major government initiatives have also supported the growth of the Turkish textile industry. In 2003, the government introduced Turquality, a government incentive program that facilitated the accreditation of the garments manufactured by a select group of approximately 30 Textile and Clothing brand owners. This strengthened the international image of the country and hence boosted its high-end exports. The government also unveiled the Strategic Action Plan for Textile, Ready-to-wear and Leather Sectors in 2009, for the period 2009 – 2014. This scheme provides support in the form of government finance, advice and training for export oriented clothing producers who wish to relocate their factories from Istanbul and its surrounding areas to the eastern provinces of Turkey, where wage rates are much lower (high wage rates have been a consistent cost side problem in the Turkish garments sector). The incentives include exemptions from customs tax and reductions in VAT, corporation tax and energy bills. (Gereffi and Frederick, 2010).
The government in Bangladesh has over the years adopted a set of liberal economic policies to promote the establishment of new spinning, weaving and processing units in the private sector. The existing textile mills, which were operated and managed under the public sector by the Bangladesh Textile Mills Corporation, were de-nationalized in the 1980’s.
Moreover, in Bangladesh, the government has consistently given importance to entrepreneurs’ voice which has resulted in an entrepreneur driven industry. In particular, the government followed two policies proposed by the private sector. Firstly, it introduced a back to back letter of credit system which eliminated the need for cash for capital and for foreign exchange. It meant that entrepreneurs required lower capital investment to set up industries, leading to rapid growth of the industry. Secondly, during the 1980s, the government set up a policy for 100 percent export oriented industries, where they were provided bonded warehouse facility and could import fabrics despite the general anti-export bias in Bangladesh and limitation on the import of raw materials. Along with this, there is exemption of taxation on export profits and the government has established export processing zones. Companies can import capital machinery duty-free and pay reduced interests on short and long term loans. The government has
34
maintained this forward looking and liberal approach which has allowed the sector to grow and become competitive in the international market. (Haider, 2007).
Apart from all these initiatives, the Bangladesh government has taken a number of steps to create an export driven and investment friendly textile industry. The government offers export incentives for encouraging the use of local fabrics in the export oriented garment factories. It does not institute any ceiling on investment, provides tax holidays of up to 10 years, tax exemptions on importing local machinery and 100% duty exemption on importing spare parts for export oriented companies. The Bangladesh government has also aggressively attracted foreign investment in the region by instituting measures such as residency permits for foreign nationals including citizenship, easy access to capital, profit and dividend repatriation facilities, double taxation avoidance and tax exemptions on interest payable on foreign loans (Haider, 2007).
Regional Clusters & Firm Size
The location choice of firms along with their performance is determinedly the extent of agglomeration benefits and spill over effects of an industrial cluster.. However, in Pakistan and Bangladesh, there is an overwhelming majority of small and medium scale industries which indicates that many manufacturers are not benefitting from external economies of scale effects within industrial clusters.
Pakistan’s major industries are located in Punjab and Sindh. However industries in Pakistan are more dispersed and hence are unable to enjoy cluster spill-over effects.
Turkey’s industries are located more densely in some regions which allow them to benefit from agglomeration economies such as concentration of skill and design capabilities. The growth of the industry has intensified particularly in the Marmara and Aegean regions. Istanbul, Bursa, Tekirdag, Corlu, Izmir, and Gaziantep are the major provinces in terms of physical capacity and export value (“MoE, Turkey, 2012”). The majority of the apparel companies are domestically owned, with a low percentage of foreign firms.
Bangladesh has a few major centres where its industries are concentrated. In 1982, Bangladesh’s textile industry received a strong and positive stimulus when the government provided incentives to the garment sector including duty free import of machinery, bonded warehouse facilities, and cash incentives in addition to donating land to garment producers in Narayaganj and Gazipur. Large garment clusters have emerged in Gazipur and Narayanganj on the land donated by the government. Very recently, the government has donated another 300 acres of land to develop a garment village in Munshiganj, a suburb of Dhaka, where at least 390 production units will be located. Textile companies in East Asia invested in their factories in Dhaka and Chittagong (which have a majority of manufacturers and traders), with Dhaka leading Chittagong by three times as many manufacturers. (Mottaleb and Sonobe).

35
Production Costs
Pakistan and Bangladesh have low costs of production but in recent years, Bangladesh has maintained that advantage while in Pakistan, productions costs have been on the rise. Turkey has higher production costs but its other advantages compensate for the high costs.
Production costs mainly include labour and energy costs. For Pakistan, there has been a considerable rise in the cost of energy which has increased the cost of production manifold. Moreover, this problem has been exacerbated in the past couple of years due to chronic shortages of both electricity and gas. This has led businesses in Pakistan to move to Bangladesh, where they have set up apparel industries mainly due to the relatively lower energy and labour costs, lower tax rates and subsidy provision. (Ali. 2012).
There are number of advantages that Bangladesh has over Pakistan’s industry. In Bangladesh, there is a 15% free Excise duty to facilitate production, with electricity cost of $0.053 (kw/h) and labour cost of $0.32 per hour. Bangladesh also implements friendly policies including subsidies on raw material and duty free imports. In Pakistan labor cost is $ 0.55 per hour, electricity cost is $ 0.071 (kw/h) plus VAT and sales tax of 15% each. Furthermore, gas prices are higher than Bangladesh. The price of gas per unit in Bangladesh and Pakistan is 0.30 cent and US$1 respectively (Ali, 2012).
Table 2-7: Cost Comparison in three countries
Cost Variable Pakistan Bangladesh Turkey
Labour Cost $0.55/hour $0.32/hour $2.75/hour
Electricity $1.23/ Kwh $0.053/ kwh $0.087/kwh
Source: Report text
When it comes to trade, the UN and the ILO, place certain conditions on a country’s labour market and only allow trade relations if a certain code of conduct are followed. Bangladesh was able to improve its record on child labour in the mid 1990s but there are still several improvements needed in the factory environment. Informal recruitment, low literacy levels, wage discrimination, irregular payment and short contracts of service are still prevalent practices in the RMG factories in Bangladesh. This enables the country to enjoy a comparative advantage in manufacturing garment as a consequence of low labour costs. However, this is not sustainable due to obvious reason of violation of humanitarian principles, which is already being highlighted by several labour and humanitarian organizations (Haider, 2007).
Turkey has higher labour costs relative to other Asian countries but it has other advantages over these countries which include its geographic allocation. The central location of the country allows for faster turnaround time attracting high street fashion manufacturers to opt for Turkey as
36
a preferred supplier. Fast turnaround in production leads to less stock that remains on the sale racks ensuring a good supply of ‘in fashion’ garments. This advantage is somewhat dissipated as a consequence of other costs which are higher in Turkey relative to its competitors, i.e., price of electricity and hidden expenses in transportation and customs. Electrical and heat energy are together the most important production costs for textiles (over 10% of the total input). Turkey’s labour cost per hour is around $2.75/hour which is lower than European countries but higher than Asian countries such as Pakistan, China, India and Bangladesh (Dilek).
In September 2011, the Turkish government implemented tariffs on the import of textiles (20%) and apparel (30%) primarily to protect local textile and apparel manufacturing. Along with the new tariffs, the Government has introduced subsidies to boost less developed areas which may tempt the manufacturers who had moved overseas to move back. The Turkish government provides subsidies of up to US$ 500.000 for marketing and distribution; and US$ 300,000 for design and development (Kondej).. This program gives a wide range of support facilities for the industry such as covering the costs of brand registrations for marketing, opening new stores, warehouses and showrooms, paying for rental expenses and covering the cost of quality certificates.
2.5 Conclusion
In this chapter we first carried out an analysis of the export competitiveness of Pakistan’s garment sector in comparison with that of Turkey and Bangladesh. The second section focused on the main reasons, as identified in the literature, behind the apparent lack of competitiveness and stagnation of the garments industry in Pakistan. This overview was done contrasting the structure, environment and policies adopted in Pakistan, Turkey and Bangladesh.
The main results of the first section were that Pakistan has consistently exported products that have low world demand fetching considerably low price per traded unit as compared to Bangladesh and Turkey. The post quota period has not brought any significant improvement for Pakistan within these product categories with the share of exports remaining stagnant over the years. Also, product diversification in Pakistan is limited as compared with Bangladesh and Turkey which have successfully diversified into more value added products within the garment sector.
The second section highlighted the key reasons behind the relative poor performance of Pakistan’s garment exports. These ranged from lack of product diversification, limited export destinations, small average firm size to skilled labor shortages, high production costs and an unfavorable and ad hoc policy environment.
The following chapters would take the analysis of Pakistan garments industry deeper into the micro level. The aim of this exercise is to corroborate the macro evidence of lack of competitiveness with firm level data obtained through a survey of garment manufacturers across

37
the major clusters of the country. The broader methodology of this analysis is a global value chain framework which posits the importance of firm level capabilities and transaction costs in explaining a country’s relative position in the value chain. The next chapter discusses the methodologies used in the firm level analysis.

38
3 Methodology4
3.1 Introduction
This chapter reviews the global value chain (GVC) methodology which will be used to analyze the garment sector of Pakistan in the subsequent chapter. We will employ the GVC approach in chapter 4 to identify and analyze the performance and positioning of the garments industry both domestically and internationally. The analysis will be conducted using the survey data of 234 firms from four major garment clusters of Pakistan.5
3.2 Methodology
Global value chain approach
The value chain of garments sector has given rise to many interesting questions pertinent to the division and devolution of core and non-core functions between supplying firms and lead firms. Lead firms handle core functions such as brand and product development while supplying firms, largely located in developing countries, are responsible for non-core functions like mass production and manufacturing. The GVC can also be described as a vertical relationship between international retailers (buying house agents, buying houses, MNCs, and small buyers) and manufacturers at home (Appendix 1).
With rising international trade and integration of markets, garment manufacturing has been off shored to different parts of the world. The garment manufacturing is based in labor-abundant countries like China, India, Bangladesh, Pakistan, Cambodia, and other Asian countries which export most of their products to US and European markets. The market outcomes (prices, degree of value-addition of products) from the relationship between supplying and lead firms are contingent upon the type and nature of GVC. The nature or governance structure of the global value chain, broadly in manufacturing products, and specifically within the apparel/clothing industry, can be categorized into five different types: markets, modular, relational, captive, and hierarchy (Figure 3-1).
4This chapter is drawn from the analytical framework explained by Gary Gereffi et al. (2005) “The governance of
global value chain”, Journal of Political Economy, 12(1).
5 The detailed data description of the survey of 234 firms is given in Appendix 2.
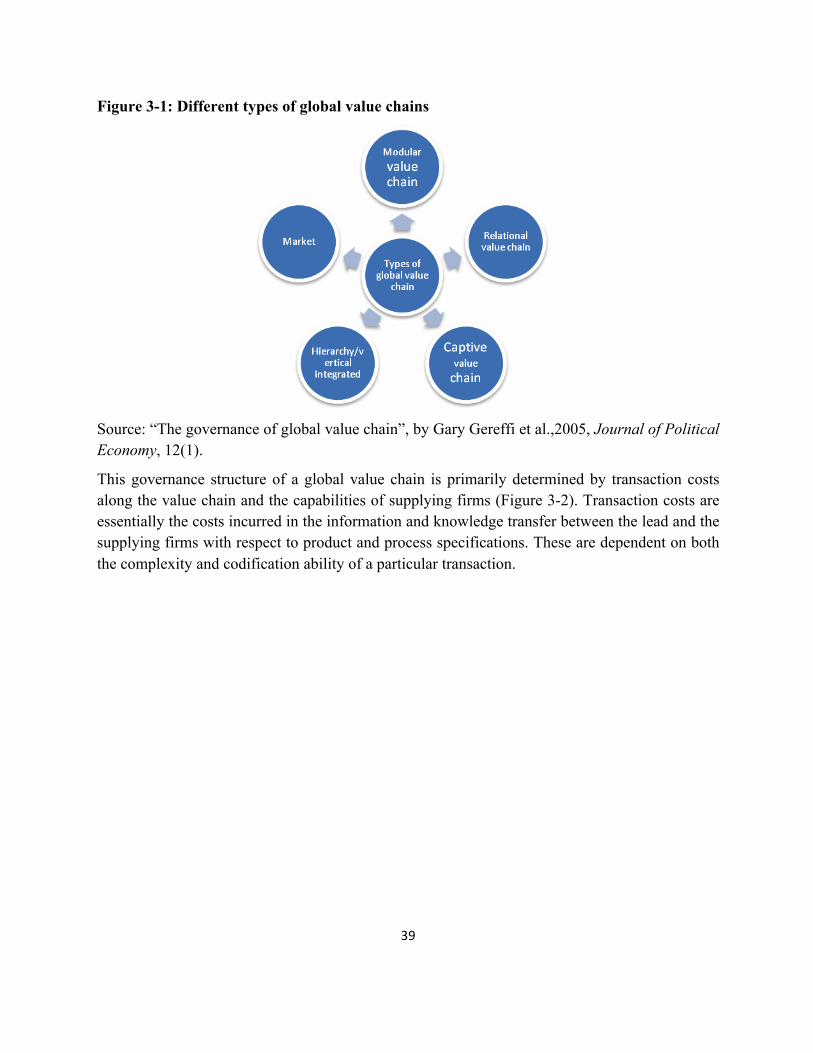
39
Figure 3-1: Different types of global value chains
Source: “The governance of global value chain”, by Gary Gereffi et al.,2005, Journal of Political Economy, 12(1).
This governance structure of a global value chain is primarily determined by transaction costs along the value chain and the capabilities of supplying firms (Figure 3-2). Transaction costs are essentially the costs incurred in the information and knowledge transfer between the lead and the supplying firms with respect to product and process specifications. These are dependent on both the complexity and codification ability of a particular transaction.

40
Figure 3-2: Key determinants of the global value chain
Source: “The governance of global value chain”, by Gary Gereffi et al., 2005, Journal of Political Economy, 12(1).
The GVC or vertical relationship of the garments/apparel industry has undergone significant changes with the increase in product standardization and development of production processes. This is due to the fact that the extent of standardization and the particular process of production require a certain degree of transaction and information costs for a given level of firm capability. Information regarding the quality, design, and other aspects of non-standard (more customized) products requires greater coordination and codification, which would lead to higher transaction costs. In contrast, a standard product can be produced with relatively less coordination and eventually with low transaction costs. The switching costs from one supplier to another for the lead firm increases manifold in production involving customized products.
The ‘market’ and ‘hierarchy’ structures are the two opposite extremes of the vertical relationship (Table 3-1). The hierarchy market structure is primarily found in a situation where the products are non-standard, capabilities of the supplying firms are low, and the transaction costs are high.6In such a situation, lead firms would choose to develop products in-house.7 On the other hand, when products are standard, transactions are easily codified, and supplying firms have the requisite capability, the vertical relationship takes the market form. 6 Higher transaction costs imply a higher complexity of transactions and difficulty in codifying transactions. 7Gary Gereffi et al., “The governance of global value chain”, Journal of Political Economy, 12(1), (2005).

41
In between these two extremes (market and hierarchy) lie the captive, relational, and modular value chains with varying combinations of transaction and information costs and firm capabilities. In captive value chains, codification and the complexity of product specification is high but the supplier capability is low, thus requiring greater intervention and monitoring by the lead firms. In such a relationship the dependence of supplier firms on lead firms is high in terms, of technology up-gradation, design, logistics etc. This greater reliance on lead firms makes switching costs for supplying firms substantially high resulting in what is called a ‘captive’ relationship.
The relational value chain is when product specification cannot be codified, transactions are complex and supplier capability is high. It is marked by frequent interactions, and a reliance on reputation, among firms. A certain level of trust makes coordination smooth and easy for the lead firms. However, the contracting firms have to incur asset-specific investment in order to meet the lead firms’ quality and design requirements. Due to the asset-specific investment, the codification of information becomes less challenging in relational value chain networks of firms. The modular value chain entails high ability to codify, greater complexity of transactions and high firm capability. The suppliers have the ability to produce according to the detailed specifications of the lead firms. In other words, various components of the products can be manufactured easily since the coordination and information about quality and design can be transmitted efficiently to various upstream firms.
The various types of value chains described above determine the bargaining power between the lead firms and the suppliers. The market structure of suppliers or local garment manufacturing industry is fairly close to a perfectly competitive market with little product diversification. The lead firms are primarily dominated by brands (product differentiation) with reputation and market power. These divergent market structures create an asymmetry in power relations between the suppliers and lead firms in the global value chain. However, the extent of market power of lead firms changes with different types of GVC. For example, the buyers bargaining power increases as we move down from market to hierarchy relation in the GVC (Table 3-1).
Table 3-1: Global value chain in clothing/apparel industry
Type of governance structure
Complexity of transaction
Ability to codify transaction
Capabilities in the supply base
Degree of explicit coordination and power asymmetry
Market Low High High Low Modular High High High Relational High Low High Captive High High Low Hierarchy High Low Low High
42
Source: The governance of global value chain”, by Gary Gereffi et al., 2005, Journal of Political Economy, 12(1).
In the next chapter we use the global value chain framework described in chapter 3 to both identify and explain the positioning of Pakistan’s garment sector in the global apparel market.
43
4 Analysis of Firm Competitiveness in a Global Value Chain
Framework
4.1 Introduction
This chapter addresses the following important question: where does Pakistan’s garment sector stand in the global value chain and why does it stand there? The first half of the question has already been answered from a macro perspective in chapter 2. This comparative trade data analysis showed that Pakistan is stuck at a lower rung of the global value chain, manufacturing and exporting a narrow range of low value added garments. In this chapter we corroborate that finding at the micro level by analyzing the survey data of 234 firms from two subsectors—knitwear and woven across the main garment clusters of Pakistan. Through the use of key parameters such as branding, contracting, nature of clientele, average export price and firm strategy we determine Pakistan’s position in the garments GVC. This is followed by a discussion which aims to ascertain the type of governance structure in the global value chain the garment sector falls in, i.e. market, modular, relational, captive or hierarchical.
The second part of the analysis will discuss the reasons why the garment sector is trapped in the production of low value-added products using the survey data. This will be done by analyzing firm level capabilities and transaction costs which are key determinants of the positioning of the garments sector in the GVC. Firm level capabilities are affected by both internal and external factors. The major internal factors influencing firm capabilities within the garments sector are technology and labour skills. On the other hand external factors range from clustering (agglomeration economies) to the business environment. Transaction costs measure both the complexity of information and knowledge transfer between lead and supply firm with respect to product and process specification, and, the extent to which information and knowledge can be codified and transmitted efficiently between lead and supplying firms. The data analysis conducted in this chapter is further substantiated by focus group discussions with relevant garments associations8.
4.2 Where does Pakistan stand?
Garment sectors position in the GVC
Pakistan’s garment sector is embedded in a buyer-driven global value chain (GVC) where the buyers—retailers, buying houses, and brand name companies—are the driving and coordinating
88 PRGMEA and PHMA
44
agents. 9 The most effective GVCs from the perspective of manufacturers (suppliers) are the ones where manufacturing firms have been able to progressively upgrade, specialize, and innovate to move up the value chain from merely an assembler to original business manufacturers (OBMs).
To understand the participation of manufacturers in a buyer-driven global network in practical terms, the clothing value chain needs to be viewed in terms of the nature of lead firms (broadly recognized as US and European brands and local and foreign buying houses) and the type of contractual relationship the lead firms have with local production networks. At the top of the global value chain is the lead firm which can be a mass or specialty retailer such as Walmart, Target, or Mango; a brand marketer like Polo Ralph Lauren or Tommy Hilfiger; or a brand manufacturer like Zara and the Benetton Group. American and European brands that Pakistani firms supply to include top brands like American Eagle, H&M, Zara, Benetton, Abercrombie & Fitch, Hollister, Nike, Quicksilver, Kohl’s, Sears, Gap, and Old Navy, among others.
These brands formulate a direct or indirect contractual relationship with the local production networks through local or international buying houses. There are two types of buying houses operating in Pakistan - local and foreign. Local buying houses act as commission agents. The main role of local buying houses is managing customer relations and supervising quality controls. In contrast, the role of foreign buying houses/importers such as Li and Fung is to assist firms in the planning, organization, and supervision of garment producers’ work performance, in addition to managing customer relations and supervising quality controls.
For the last three decades, buyer-driven value chains and production networks have been managed by lead firms in developed countries (USA, EU, and Japan) and trade in garments remained Western-centric with a North-South orientation.10 The US and Europe remain the biggest markets for exports and South Asian countries are among their top trading partners.11 Our survey findings align with these global trends—more than 70 percent of the firms in Pakistan contract with buying houses supplying orders to the United States, while more than 20 percent of total orders were processed for Europe. A number of firms also cater to both the US and European markets. South Asia will remain a potential market for sourcing from USA, EU, and Japan while middle-income countries continue to slowly expand their imports shares.12
The local manufacturing firms’ capability in performing various functions (from production to design) can be defined in terms of the following categories - full package suppliers, original 9Buyer-driven value chains are those in which large retailers, marketers, and brand manufacturers play an important role in setting up decentralized production networks in a variety of exporting countries, mostly located in developing countries. In contrast, producer-driven networks are vertical in nature and deal mostly with capital- and technology-intensive sectors. 10Shahid Yusuf, Garment Suppliers Beware: The Global Garments Value Chain is Changing (Washington DC: Growth Dialogue, Washington University). 11UNIDO, The Global Apparel Value Chain: What Prospects for Upgrading by Developing Countries (Vienna: Sectoral Studies Series, 2003). 12Shahid Yusuf, Garment Suppliers Beware: The Global Garments Value Chain is Changing (Washington DC: Growth Dialogue, Washington University).
45
design manufacturers (ODMs), or original brand manufacturers (OBMs). The highest barriers to entry in buyer-driven chains exist in design, marketing, and product innovation. Not surprisingly, the majority of Pakistani manufacturers are categorized as full package suppliers, with a few ODMs and hardly any OBMs. Unlike local manufacturers operating as assemblers in which foreign firms take the responsibility of supplying all the components to manufacturers, full package production requires developing the capability to interpret designs, make samples, source the needed inputs, monitor product quality, and guaranty on-time delivery. The full package firms also have the liberty to outsource some of the activities—cut-make-trim (CMT)—to second-tier suppliers at the lower rung of the value chain.13
One step above the full package suppliers is an own design manufacturer (ODM). An ODM firm makes its own design which adds additional value to the product. Some of the ODMs manage to move up the rung to become own brand manufacturers (OBM).14 Most of the firms in developing countries including Pakistan started out as second-tier assemblers, supplying to a handful of full package firms. However, in Pakistan a large number of firms went on to become full package suppliers but the majority of the firms did not move up the ladder to become ODMs. Several firms in Turkey, China, and Bangladesh moved up the rung to become ODMs, while some firms in Turkey and China have earned the status of OBMs. Moving up the rung to become OBMs and creating their own global value chain is very challenging for firms in countries like Pakistan, however, this seems to be the only avenue available to get out of the low value-added trap.15
The evidence that garment sector firms in Pakistan are producing for lead firms is substantiated by the survey data whereby the majority of the firms, both in the knitwear and woven sectors, are operating as contracting firms (Figure 4-1). Firms were also asked if they are exporting their own brand: a large number of firms across both sectors reported that they do not sell branded products (Figure 4-1). However, there are a small number of firms producing brands but further analysis of the data reveals that these firms only cater to local markets.
13Gary Gereffi, John Humphrey, and Timothy Sturgeon, “The Governance of Global Value Chains,” Review of International Political Economy12, no. 1 (2005): 78-104. 14Gary Gereffi, “Global Shifts, Regional Response: Can North America Meet Full-package Challenge?” Bobbin 39, no. 3(November, 1997):16-31. 15 Coates, Joseph, F. 2005.The Future of Clothing. Technological Forecasting and Social Change. 72: 101-110.
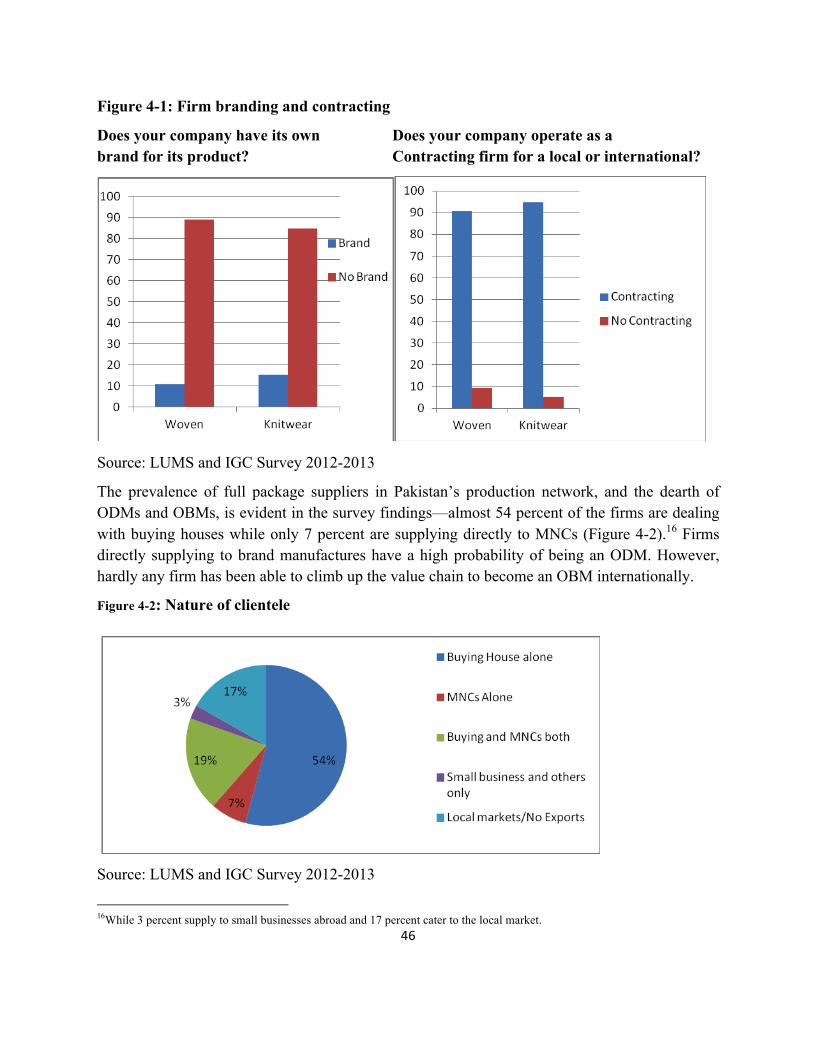
46
Figure 4-1: Firm branding and contracting
Does your company have its own Does your company operate as a brand for its product? Contracting firm for a local or international?
Source: LUMS and IGC Survey 2012-2013
The prevalence of full package suppliers in Pakistan’s production network, and the dearth of ODMs and OBMs, is evident in the survey findings—almost 54 percent of the firms are dealing with buying houses while only 7 percent are supplying directly to MNCs (Figure 4-2).16 Firms directly supplying to brand manufactures have a high probability of being an ODM. However, hardly any firm has been able to climb up the value chain to become an OBM internationally.
Figure 4-2: Nature of clientele
Source: LUMS and IGC Survey 2012-2013
16While 3 percent supply to small businesses abroad and 17 percent cater to the local market.

47
The degree of value addition in a product and its position in the global value chain can be determined by its average export price. In chapter 2, the analysis of trade data showed that on average Pakistani garment exports fetch a relatively lower price than products exported by Turkey and Bangladesh. This macro level evidence is corroborated by our firm level data of the garment sector in Pakistan. The data clearly shows that Pakistan’s garment sector fits into the global value chain at the lower rung, producing mostly low-price items in a high value-added category—the average export price of the goods exported is less than $10 (Figure 4-3). Further analyzing the average export price in the woven sector across size reveals that almost an equal percentage (40 percent) of small and medium firms’ price falls between $1 to $5 and $5 to $10. In contrast, 80 percent of the large firms’ average export price is between $5 to $10. There are very few firms which go above the $10 mark. In contrast to the woven sector, a greater number of small and medium firms (62 percent) in knitwear have an average export price between $1 to $5, which implies that the knitwear sector is mostly exporting low-price items. However for large firms, the variation in export prices is not different in woven and knitwear sectors. The average price difference between low-price, high value-added products and branded-products is $20 to $25. 17
In the woven sector, Karachi contains more than 80% firms with average export price between $5 to $10 followed by Lahore (65%) and Faisalabad (60%) (Figure 4-4). Only Sialkot holds more than 40% firms with average price of more than $10 which implies that these firms are producing semi-technical garments e.g. uniforms and sportswear (Figure 4-5). Similarly in knitwear across different clusters, the majority of firms are concentrated at a low average export price ($1 to $5) except for Sialkot ($5 to $10).
Figure 4-3: Average Export Price Across Size (%)
Source: LUMS and IGC Survey 2012-2013
17 As discussed in chapter 2, average price fetched by Pakistani products in all categories is significantly less than that of Bangladesh and Turkey.
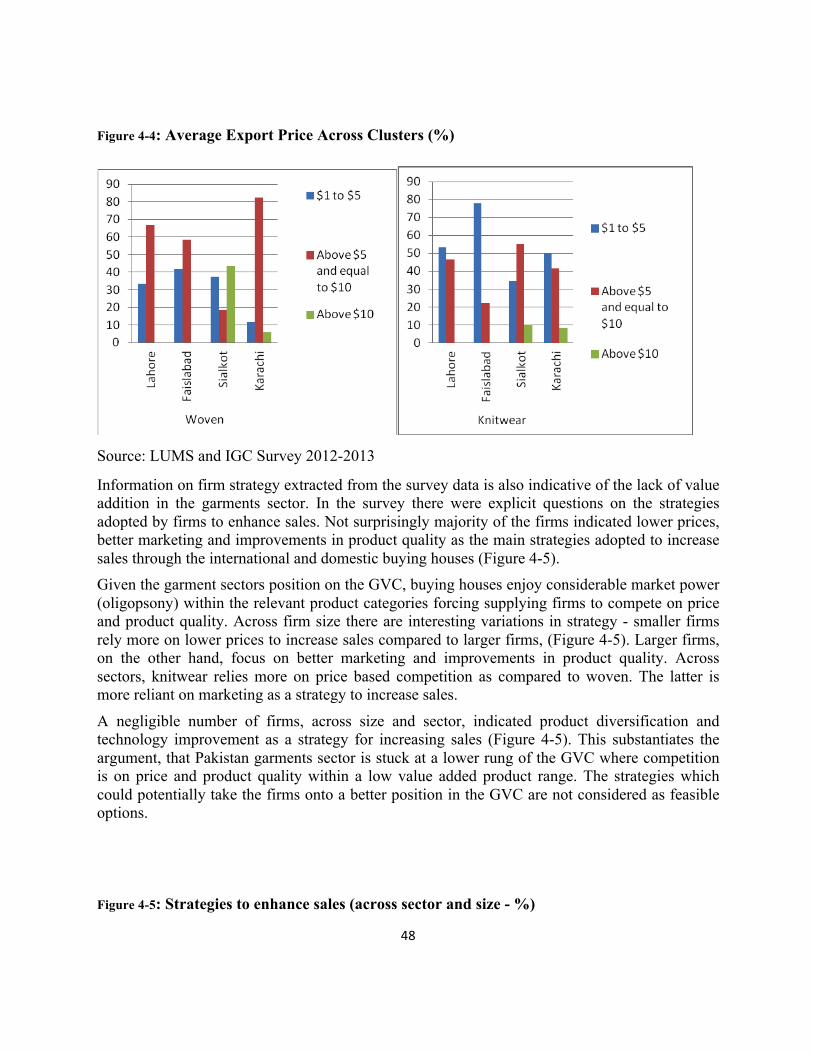
48
Figure 4-4: Average Export Price Across Clusters (%)
Source: LUMS and IGC Survey 2012-2013
Information on firm strategy extracted from the survey data is also indicative of the lack of value addition in the garments sector. In the survey there were explicit questions on the strategies adopted by firms to enhance sales. Not surprisingly majority of the firms indicated lower prices, better marketing and improvements in product quality as the main strategies adopted to increase sales through the international and domestic buying houses (Figure 4-5). Given the garment sectors position on the GVC, buying houses enjoy considerable market power (oligopsony) within the relevant product categories forcing supplying firms to compete on price and product quality. Across firm size there are interesting variations in strategy - smaller firms rely more on lower prices to increase sales compared to larger firms, (Figure 4-5). Larger firms, on the other hand, focus on better marketing and improvements in product quality. Across sectors, knitwear relies more on price based competition as compared to woven. The latter is more reliant on marketing as a strategy to increase sales.
A negligible number of firms, across size and sector, indicated product diversification and technology improvement as a strategy for increasing sales (Figure 4-5). This substantiates the argument, that Pakistan garments sector is stuck at a lower rung of the GVC where competition is on price and product quality within a low value added product range. The strategies which could potentially take the firms onto a better position in the GVC are not considered as feasible options.
Figure 4-5: Strategies to enhance sales (across sector and size - %)
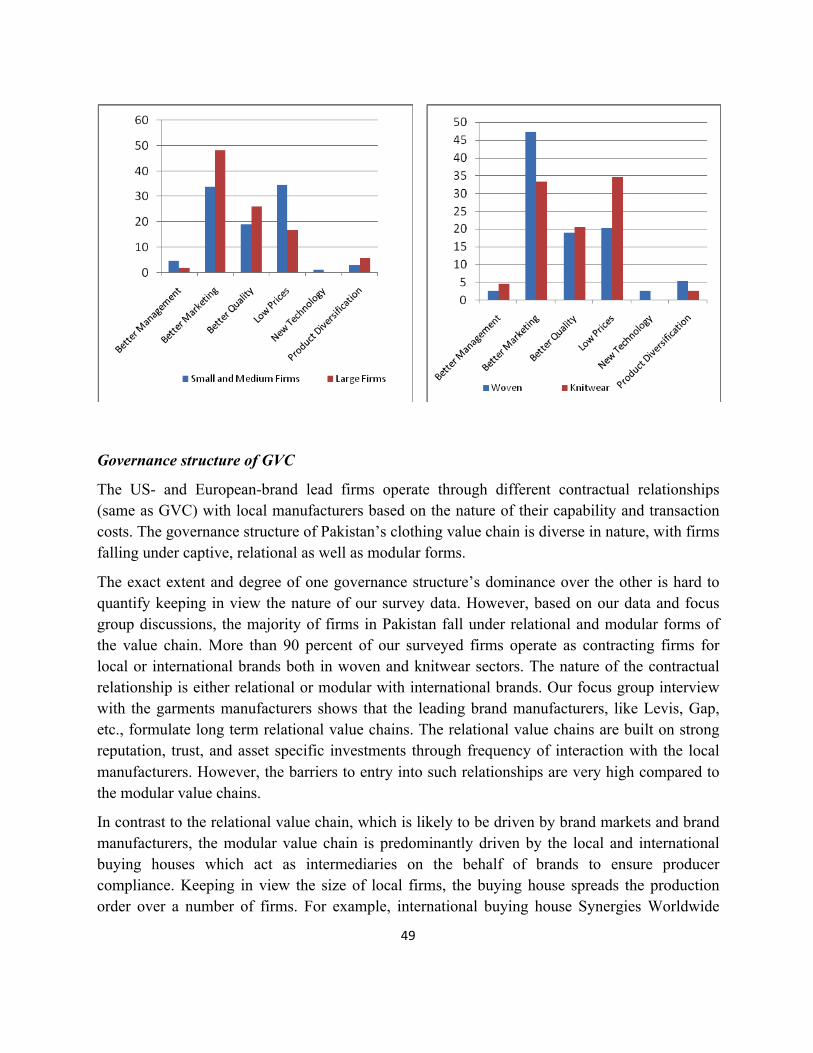
49
Governance structure of GVC
The US- and European-brand lead firms operate through different contractual relationships (same as GVC) with local manufacturers based on the nature of their capability and transaction costs. The governance structure of Pakistan’s clothing value chain is diverse in nature, with firms falling under captive, relational as well as modular forms.
The exact extent and degree of one governance structure’s dominance over the other is hard to quantify keeping in view the nature of our survey data. However, based on our data and focus group discussions, the majority of firms in Pakistan fall under relational and modular forms of the value chain. More than 90 percent of our surveyed firms operate as contracting firms for local or international brands both in woven and knitwear sectors. The nature of the contractual relationship is either relational or modular with international brands. Our focus group interview with the garments manufacturers shows that the leading brand manufacturers, like Levis, Gap, etc., formulate long term relational value chains. The relational value chains are built on strong reputation, trust, and asset specific investments through frequency of interaction with the local manufacturers. However, the barriers to entry into such relationships are very high compared to the modular value chains.
In contrast to the relational value chain, which is likely to be driven by brand markets and brand manufacturers, the modular value chain is predominantly driven by the local and international buying houses which act as intermediaries on the behalf of brands to ensure producer compliance. Keeping in view the size of local firms, the buying house spreads the production order over a number of firms. For example, international buying house Synergies Worldwide

50
represents 35 European and US brands and deals with 80 different manufacturing firms in Pakistan.
The variation in the capability of garments manufactures and in the degree of transactions, codification, and cooperation required explains the diversity in value chains. The literature18 on GVC of the apparel industry suggests that with a significant improvement in terms of the capability of firms, a sizeable majority of firms have moved up from a captive contractual relationship to a relational and modular one with leading brands marketers in developed countries. This movement has also coincided with the presence of both local and foreign buying houses in garment-exporting countries (e.g. Bangladesh, China, India and Pakistan) along with the increasing use of information technology in garment manufacturing. The establishment of foreign buying houses and frequent interactions with the international buyers has made sourcing from local firms easier by reducing transaction costs through the exchange of information on design, processing, and assembling. In addition, it has also supported a long-term relationship with the local production networks.
Therefore, according to the survey data most of the firms in the garment sector are full package suppliers in a contracting relationship with lead firms or international brands through both local and international buying houses. There is limited in house designing and an absence of branding of products for the international market. Consequently, the sector is at a lower rung of the GVC producing products which albeit high value added are exported at a low price. This is evident from the export price information of firms across clusters in both the woven and knitwear sector and also by the trade data analysis done in chapter 2. Finally, based on the firm data and focus group meetings it can be concluded that firms in Pakistan within the garments sector generally fall under both the relational and modular forms of the value chain.
As mentioned before, the garment sector in Pakistan is trapped at a low-equilibrium in a high value-added category—producing low-price items for mass retailers. To come out of this trap and move up the garments value chain, the sector requires continual investment in state of the art technology, a trained workforce, and agglomeration economies or intra-cluster spill-overs. In addition, supportive government policies that improve business environment, infrastructure and trade facilitation are also critically important for the garment sector to climb up the value chain. The following section attempts to divulge the reasons behind the weak positioning of Pakistan’s garment sector in the GVC by drawing into the firm level data collected in the survey.
18Gary Gereffi, John Humphrey, and Timothy Sturgeon, “The Governance of Global Value Chain.”
51
4.3 Why does Pakistan stand here?
A firm’s capability and transaction costs determine the type of global value chain that it is involved in.19 Firms build up capabilities through technological up-gradation, internal organization and cluster formation not only to shift up from low to high value-added products, but also to strengthen the bargaining power vis-a-vis international buyers by moving up from captive to more assertive market based global value chain. A firm’s capability can be divided into internal (technology and skilled labor) and external capabilities (clusters and business environment). For given transaction/information costs, high capability firms move up from a low to high value-added stage by entering into design and product development services, and marketing. Low capability reduces the potential bargaining power of local firms with international buyers by leaving them in a captive relationship with low export prices.
4.3.1 Determinants of firm capability
Technology and Skilled Labor
The industrial sectors that are dominated by exporting firms are exposed to both competition and technological know-how in the global market. Over time, exporting firms learn faster than non-exporting firms about how to ‘do things better’, how to ‘make better things’, and how to improve through ‘functional upgrading’, that is, by moving into a higher value-added stage.20 There is a rich literature on how firms in developing countries learn and innovate upon becoming part of a global value chain. 21
The garments sector holds immense strategic importance in Pakistan’s economic landscape, being the greatest value-generating sector in the textiles value chain in addition to being a key component of the global production chains as well. Given the indispensible role of this sector in the country’s economy, it is unfortunate that technology is largely an ignored input, with the industry lagging behind its competitors due to a shortage of scientific and technological infrastructure and thus remaining one of the most labor-intensive sectors of the country.22
A major technological change in the garment industry occurred in 1980’s with the introduction of microelectronics at all stages of garments production. The most significant innovations took place in designing, cutting, sewing etc, leading to computer-aided design (CAD), computer
19Gary Gereffi, John Humphrey, and Timothy Sturgeon, “The Governance of Global Value Chain.” 20NebahatTokatli, “Globalization and the Changing Clothing Industry in Turkey,”Environment and Planning A35, no. 10, (October 2003):1877-‐1894. 21Andrea Morrison, Carlo Pietrobelli, and Roberta Rabellotti,“Global Value Chains and Technological Capabilities: A Framework to Study Industrial Innovation in Developing Countries,” (2006), available at smartech.gatech.edu. 22 It has to be noted that technology up-‐gradation does not necessarily imply labour substitution. In fact in the garments sector improvement in technology which leads to higher value addition has the potential to generate more employment

52
numerical control (CNC) cutting and computer-aided manufacturing (CAM).23 To move up the global value chain of the garments industry it is imperative for firms to introduce these technological innovations. However, in order to move up from full package suppliers to ODMs and eventually to OBMs, firms need to acquire the ability to absorb these new technologies. This ability of absorption is integrally linked to the level of education and skill of the labour force. Thus, while technology is a necessary condition to move up the value chain, it cannot be effectively introduced in the absence of skilled labour.24
The extent of technology development in Pakistan garments sector in terms of utilizing computer-aided design (CAD), computer numerical control (CNC) cutting and computer-aided manufacturing has been limited.25 The following discussion highlights how garments manufacturers in the survey assess their technological capability.
The argument that our technology development has been limited is supported by the survey findings which show that 75% of the firms want to upgrade to a higher level of technology while 23.9% are satisfied with the existing level. The majority of firms are eager to upgrade technology in both the woven and knitwear sectors as well as across firm size and geographic location. Interestingly, in all these categories, smaller firms are the most willing to upgrade technology indicating that these firms are fully aware of the limitations they face due to low levels of mechanization as well as the advantages that they could gain with updated technology. Across cities, about 88% of the small and medium firms in Faisalabad want to upgrade their technology as compared to 47% of large firms. The least willingness for technological uptake is found in Sialkot where only 59% of the small and medium, and 17% of the large firms seem dissatisfied with their current level of technology (Figure 4-6).
23 “Changing Techno-‐economic Environment in the Textile and Clothing Industry: Implications for the Role of Women in Asian
Developing Countries',1993 - United Nations, Industrial Development Organization, 1993 - Asia 24 Baldwin et al (1994). 25 The knitwear sector is relatively more capital-intensive than the woven sector. In the knitwear sector, technology matters at five important stages—knitting, dying, cutting, stitching, embroidery, and packaging. In the woven sector, dying, cutting, stitching, and laundry units involve more mechanization.
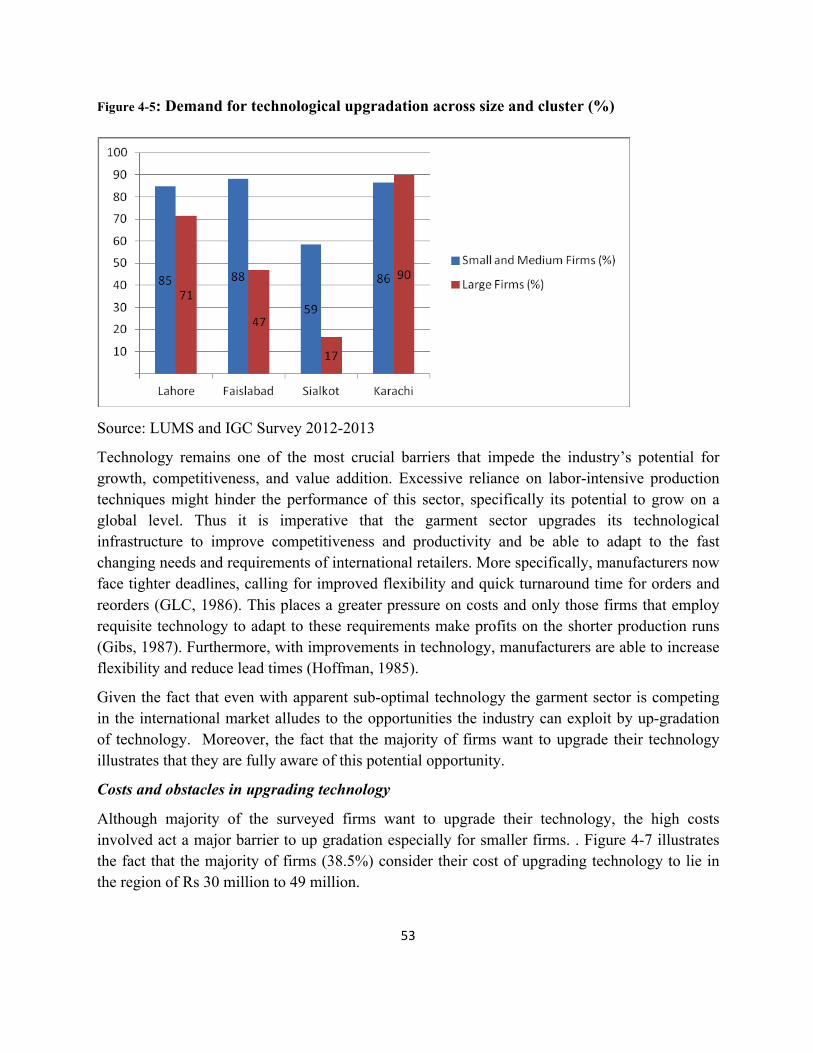
53
Figure 4-5: Demand for technological upgradation across size and cluster (%)
Source: LUMS and IGC Survey 2012-2013
Technology remains one of the most crucial barriers that impede the industry’s potential for growth, competitiveness, and value addition. Excessive reliance on labor-intensive production techniques might hinder the performance of this sector, specifically its potential to grow on a global level. Thus it is imperative that the garment sector upgrades its technological infrastructure to improve competitiveness and productivity and be able to adapt to the fast changing needs and requirements of international retailers. More specifically, manufacturers now face tighter deadlines, calling for improved flexibility and quick turnaround time for orders and reorders (GLC, 1986). This places a greater pressure on costs and only those firms that employ requisite technology to adapt to these requirements make profits on the shorter production runs (Gibs, 1987). Furthermore, with improvements in technology, manufacturers are able to increase flexibility and reduce lead times (Hoffman, 1985).
Given the fact that even with apparent sub-optimal technology the garment sector is competing in the international market alludes to the opportunities the industry can exploit by up-gradation of technology. Moreover, the fact that the majority of firms want to upgrade their technology illustrates that they are fully aware of this potential opportunity.
Costs and obstacles in upgrading technology
Although majority of the surveyed firms want to upgrade their technology, the high costs involved act a major barrier to up gradation especially for smaller firms. . Figure 4-7 illustrates the fact that the majority of firms (38.5%) consider their cost of upgrading technology to lie in the region of Rs 30 million to 49 million.
54
Disaggregating by firm size shows that smaller firms make up the majority of the firms which consider the costs of technology up-gradation to be over Rs 50million. This holds true for both sectors—in both woven (45.5%) and knitwear (44.4%) the highest percentage of firms facing costs greater than Rs 50 million are the smaller firms. This trend also continues across different clusters. The larger perceived cost of technological up-gradation by smaller firms is expected given that these firms currently operate at a relatively rudimentary or low technology level. This also emphasizes the fact that because of their small size, high costs and narrower margins smaller firms are unlikely to exploit the latest technological advances, thus inhibiting any increase in scale and productivity.
Figure 4-6: Cost of upgrading technology (US $ Millions)
Source: LUMS and IGC Survey 2012-2013
Analyzing the main obstacles across sectors reveals that more than 80% of the small and medium firms across both sectors identify finance as the biggest constraint in upgrading technology (Figure 4-8). In contrast, a smaller percentage of large firms (60%) across both sectors identified finance as the main constraint to technology up-gradation. This clearly shows that small- and medium-sized firms compared to large firms have limited access to credit markets due to both high interest rates and collateral requirements.
55
Figure 4-7: Obstacles to upgrading technology
Source: LUMS and IGC Survey 2012-2013
Access to skilled labour
The garment industry of Pakistan is one of the most labor-intensive sectors of the country. The availability of labor with requisite skills is one of the most critical inputs that affects the growth and performance of this industry. In fact, the accessibility of abundant and cheap labor is a key component that has contributed to the garments sector’s international competitiveness and has enabled the country to remain an integral component of the global textile value chain. For too long, the garments subsector has been perceived as a low-tech, unskilled labor-intensive activity, surviving on cheap labor. However, low wages will be of less importance in the future, and in its place skills and technological capabilities in clustered networks, investment in modern production facilities, development of training institutes, and quality of infrastructure facilities will decide which countries remain active partners in the global value chain and eventually increase their share in value-added products through design and brand development.
56
Table 4-1 Work-force skill Profile in the Garment Global Value Chain26
Formal Education Requirements (Range)
Training/Experience Skill-Level27 Required Skill-Set
CMT No formal Education- High School Diploma
Experience with some technical training
Low-Medium Sewing, cutting and pressing
Full Package Supplier /OEM
High School Diploma-Bachelor’s Degree
Technical training and industry experience
Medium Quality control, sourcing, purchasing and supply chain management
ODM Bachelors-Masters Degree (Clothing design)
Technical Education/ training and experience
Medium-High Designers, Fabric and Apparel Patten makers, Tailors, Dressmakers and Custom Sewers
OBM Bachelors-Masters Degree (Business and Engineering)
Marketing specialization and Experience
High General Business Skills, Branding and Marketing Skills
Source: Duke, Center on Globalization, Governance and Competitions
Pakistan is trapped in the production of low-price items in garment manufacturing. In most cases, production of such low-price items requires low-skilled workers and low technology.28 The low-skilled workers mainly need to know how to operate sewing machines, cutting and pressing equipment. At this stage formal education requirements are low. As countries upgrade to a higher value stage, the requisite labour skills also rise to more advanced levels in order to support new functions, such as logistics, finance, design and marketing. Full package suppliers require trained workers with knowledge of the industry for sourcing functions, while financial and logistics specialists are required for upstream and downstream activities. ODM and OBM have higher education requirements along with more advanced skills related to designing, marketing and consumer research. Thus as countries move up the value chain both formal and technical 26 Gereffi G, Fernandez-Stark K, Frederick S, “The Apparel Global Value Chain economic upgrading and work force development , Center on Globalization, Governance and Competitions, Duke University, 2011. 27 Skill levels are defined as low=No formal Education; experience, Low-Medium=Literacy and numeracy skills; experience, Medium = Technical Education/certification, Medium-High=Technical Education/undergraduate degree, High = University Degree and higher. 28In the garment sector, the majority of the labor force employed is contractual and a small number of workers are permanent employees i.e. they work on piece rate. This type of labor contracts suits the employer since it reduces labor cost and requires lesser labor regulation.
57
education/ training requirements increase i.e. a movement from low, medium to high skills. Hence, the skill level of the workforce significantly affects firm capability in terms of labor efficiency and productivity helping the firm climb up the global value chain. The description of skill level in the garment sector along with the value chain up gradation is given in the following Table 4-1. The workforce skill level in Pakistan garment industry falls in the low-medium to medium category of the value chain. In general workers have either middle/primary or no formal education and fewer have college degrees i.e., have some literacy and numeracy skills.29 The availability of this particular skill level is not an issue for firms since there is a large pool of such workers across the country. This fact is corroborated by the survey findings whereby over 86% of the firms across sectors and size reported access to low-medium skilled labor (Figure 4-9). Large firms in the knitwear sector in particular have no difficulty in acquiring workforce, with 100% reporting access. Analyzing across clusters shows that, across firm size, more than 80% firms had access to workforce (Figure 4-10), with the exception of small- and medium-sized firms in Karachi (70%).
Availability of worker training institute
Although firms do not face any issues in hiring workers in the low-medium to medium skill category, for greater value addition in the sector there needs to be a substantial improvement in worker skills. A major constraint identified by firms in the survey was the lack of technical and vocational training institutes for the labour force. The lack of availability of institutes is more severely felt by the small- and medium-sized firms, with less than 25% of the firms reporting the availability of a training institute, across both sectors (Figure 4-11). In contrast, a greater number of large firms claimed they have availability of training institute—55% in the woven sector and 40% in knitwear. Analyzing across cities reveals that less than 40% of the firms located in Lahore, Sialkot, and Faisalabad have the opportunity to train their workers, across firm size (Figure 4-12), with the exception of large firms in Sialkot (65%). In contrast, more than 90% of the firms located in Karachi (across size) have availability of a technical/vocational training institute.
In addition, from the focal group discussions it was evident that these institutes are not geared towards research and development for product design and innovation. Hence, the existing technical training institutes have not added value to firms in terms of climbing the value chain to become own design manufacturers or own brand manufacturers.
The lack of a skilled labor force is one of the most important factors hindering the garment sector from moving into the category of high value-added products. A skilled workforce has become a prerequisite for firms to climb up the value chain and enter the ranks of ODMs and OBMs. Pakistan needs to setup an infrastructure of both vocational and design institutes as well as supporting research facilities. Furthermore, the garment sector needs to tighten links with global retailers so as to reap the benefits of the latest technology and skills. Firms need to pay more attention to hiring, compensation, and in-house training practices to enhance productivity. In
29 This information came from focus group discussion with the garment associations.

58
addition, there need to be private and public partnerships to develop vocational training institutes that teach basic skills, building on the foundation of primary and secondary schooling.
Figure 4-8: Availability of skilled workers across sector and firm size (%)
Figure 4-9: Availability of skilled workers across size and cluster (%)
Source: LUMS and IGC Survey 2012-2013

59
Figure 4-10 Availability of training institute across sector and size (%)
Figure 4-11 Availability of worker training institute across size and cluster (%)
Source: LUMS and IGC Survey 2012-2013
Clustering
In an export-orientated industry such as garments, the role of industrial clusters needs to be viewed in the context of a global value chain since clusters are inserted into the supply chain in different ways, and that has consequences for enabling local-level upgrading efforts.30 Glocalization in the garment sector refers to the meaningful global integration of local sellers/clusters with international buyers. In other words, firms having strong backward linkages tend to formulate better forward linkages with international buyers. The case of Thailand is particularly important, where cluster formation through glocalization not only increased industrial production but also helped the industry to connect with the global supply chain. 31 The majority of the garment firms in Pakistan did not reap the benefits through glocalization, however, a few firms were successful in tying up with global buyers to improve their performance and competitiveness by incorporating advanced technologies and organizational restructuring (US Apparel is one such example which is supplying to international brands such as Levi’s, GAP, Tommy Hilfiger, etc.).
30Humphery John and Schmitz Hubert, “How does insertion in global value chain affect upgrading in the industrial clusters?” IDS working paper, Institute of Development Studies, University of Sussex, Brighton, (2000). 31 Shahid Yusuf, Garment Suppliers Beware: The Global Garments Value Chain is Changing (Washington DC: Growth Dialogue, Washington University).

60
The new economic geography literature also emphasizes the importance of local determinants of competition. Maskell and Malmberg (1999) argued that in a globalized economy, "the formation of the world market increases the importance of heterogeneous, localized capabilities for building firm-specific competences."32Agglomeration can have a high and persistent productivity pay-off in the international market if the networks share intra-cluster knowledge and have Input-Output linkages. China took the lead in creating technologically absorptive clusters by regional relocation and moved up the value chain; however, in Pakistan, owing to external and internal constraints, firms have not been able to reap the benefits from cluster formation and hence remain at the lower rung of the value chain.
There are numerous constraints on the growth of clusters in Pakistan, for instance, Karachi is identified by firms in the survey as having the best business location—43 percent (Table 4-2) of the firms based in Lahore rated Karachi as the best business cluster due to the availability and quality of infrastructure services and the availability of a pool of skilled labor, managerial talent, and industrial areas. However, due to the poor law and order situation prevailing in the city for many years, firms in all four locations identified Karachi as having the worst business environment in terms of crime and security. The poor law and order situation in Karachi has thus overshadowed other benefits of relocating to this cluster. Not only are firms reluctant to move to Karachi, but firms located in Karachi wanted to relocate to other clusters (Table 4-2). Thus a potentially vibrant and internationally competitive cluster with all the necessary spill-overs and positive agglomeration effects has stagnated due to the deteriorating security environment.
Table 4-2: Ranking of clusters in terms of the best business environment
Desired Location Lahore Faisalabad Sialkot Karachi
Actual Location of Firms
Lahore 61 9 4 26
Faisalabad 6 90 4
Sialkot
100
Karachi 33 36 15 17
In the survey, firms were specifically asked to identify the cluster which has witnessed the maximum number of garment firm closures over the last five years. Figure 4-13 above suggests that businesses perceive Karachi as a cluster which has had the maximum number of firms shutting down over the last five years. Lahore on average is perceived to have the lowest amount of bankruptcies or closures. When asked about of the reasons for closure, electricity came out to be the top reason for closure in Lahore, Sialkot and Faisalabad. Poor Management of business
32P.MaskellandA.Malmberg, “Localised Learning and Industrial Competitiveness,” Cambridge Journal of Economics 23, no. 2(1999):172.

61
has been another key reason leading to business closures in Lahore and Sialkot. However, in Karachi the dominating factors causing businesses to close down have been the poor law and order condition matched with high input and production costs.33
Figure 4-12: Perception about Firm Closures across Clusters over last 5 Years (%)
56.7
52.3 49
6.3
23.9
43 51
46.9
1.5 3.5
46.9
0
10
20
30
40
50
60
70
80
90
100
Lahore Faislabad Sialkot Karachi
Greater than 50 Between 5-‐50 firms Between 0-‐5 Firms None Source: LUMS and IGC Survey 2012-2013
Business environment constraints
The business environment externally affects the competitiveness and capabilities of the geographical clusters in the supply chain context. Though the list of external issues is long, the following need urgent attention: the energy crisis, access to finance, and macroeconomic instability (intrinsically linked with political instability).According to a World Bank report, Pakistan scored 107 on a scale of 1 to 185 of ease of doing business compared to China (91), India (132) and Bangladesh (129). The overall picture of doing business in Pakistan seems to be better than Bangladesh and India, however, certain important issues such as trading across borders—customs clearance and technical controls and ports and terminal handling create hurdles for export-oriented industries. 34
Business environment constraints affect the competitiveness of firms and significantly raise the cost of doing business. These constraints can lead to higher costs, jeopardize timely delivery, eat into narrow margins, and eventually discourage international buyers. Our survey data also captures the constraints related to the business environment. Firms were asked to identify the three major constraints in their respective cluster. The most binding constraints for firms include
33 The obvious caveat in this information is that it is completely based on firm’s perception and hence does not reflect an accurate estimate of the survival rates of firms and the size of clusters over time. However this underscores the importance of conducting a more rigorous exercise of mapping firms and clusters over time and across regions. 34 Available at http://www.doingbusiness.org/data/exploreeconomies/pakistan/

62
electricity, access to finance, political instability, macroeconomic instability, tax administration, and corruption among others.
Figure 4-13: Business environment constraints across sectors (%)
Source: LUMS and IGC Survey 2012-2013
An inadequate and erratic power supply remains the biggest problem for manufacturers in Pakistan, across sectors, firm size, and cluster (with the exception of Karachi), as identified in the survey. Almost 40 percent of the firms from both sectors declared electricity either as first, second, or third most severe constraint to growth (Figure 4-14).
Small- and medium-sized firms are particularly affected as energy alternatives are costly and deplete profit margins—over 40% listed electricity as a major constraint, compared with less than 30% of large firms (Figure 4-15). Analyzing across clusters, the incidence of electricity crisis is higher in Lahore, Faisalabad, and Sialkot. Karachi is relatively least hit by electricity shortages among the clusters. However, electricity still is the second most severe constraint listed by firms in Karachi, preceding crime, theft, and disorder by a small margin.
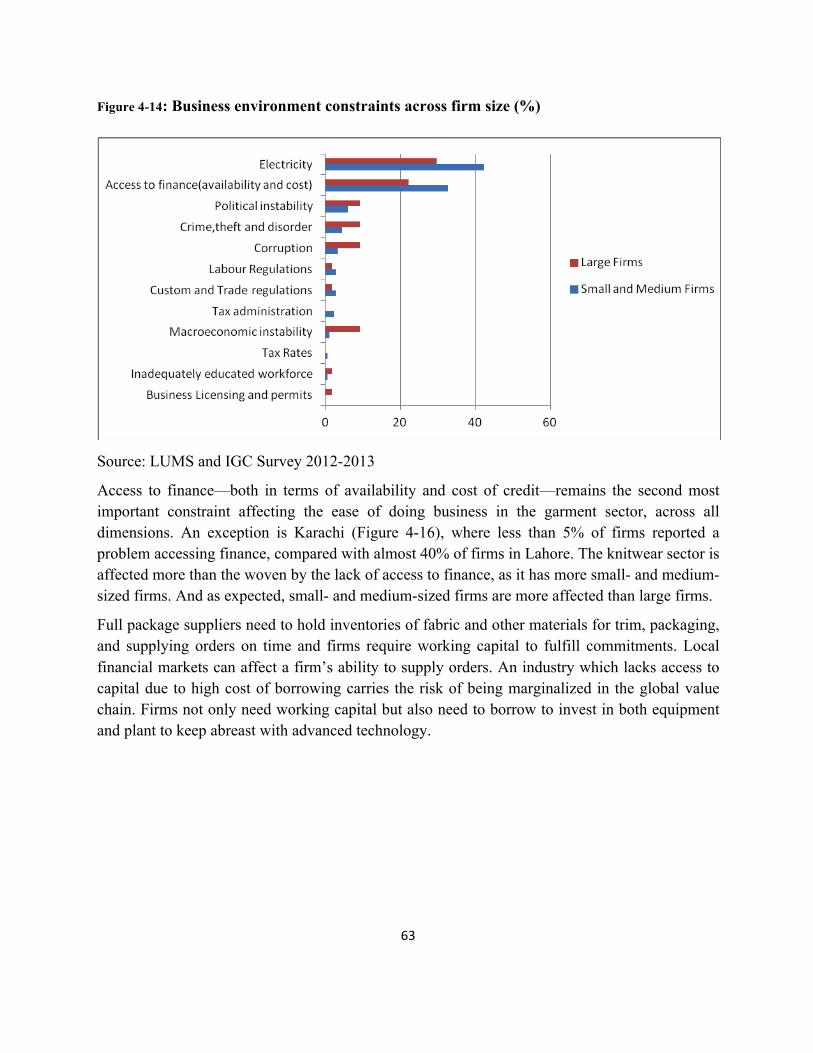
63
Figure 4-14: Business environment constraints across firm size (%)
Source: LUMS and IGC Survey 2012-2013
Access to finance—both in terms of availability and cost of credit—remains the second most important constraint affecting the ease of doing business in the garment sector, across all dimensions. An exception is Karachi (Figure 4-16), where less than 5% of firms reported a problem accessing finance, compared with almost 40% of firms in Lahore. The knitwear sector is affected more than the woven by the lack of access to finance, as it has more small- and medium-sized firms. And as expected, small- and medium-sized firms are more affected than large firms.
Full package suppliers need to hold inventories of fabric and other materials for trim, packaging, and supplying orders on time and firms require working capital to fulfill commitments. Local financial markets can affect a firm’s ability to supply orders. An industry which lacks access to capital due to high cost of borrowing carries the risk of being marginalized in the global value chain. Firms not only need working capital but also need to borrow to invest in both equipment and plant to keep abreast with advanced technology.

64
Figure 4-15: Business environment constraints across clusters (%)
Source: LUMS and IGC Survey 2012-2013
In addition, large firms identified macroeconomic instability as the third important constraint. An unstable macroeconomic environment characterized by high rates of inflation, low GDP growth rates, large fiscal deficits, increasing external debt, and volatile exchange rate is in most instances accompanied by a fall in both investments and manufacturing growth especially in export-oriented industries. The textile and apparel sectors have been hit hard by macroeconomic instability, primarily by exposing manufacturing firm to more uncertainty and risk.
4.3.2 Transaction costs
The sources of transaction cost in garments sector originate from complexity, transmission, and codification of information especially in design intensive and high value added products. Transaction cost is not only affected by technology both in terms of sophisticated production process & IT, but also the ability of firms to handle complex information.
Impact of Information technology’s on transaction cost
The fragmented production network of the apparel industry raises significant transaction and information costs in the interaction between international buyers and domestic manufacturers. However, with the introduction of Information technology (IT) the ability to codify and transmit information and knowledge about products and processes between international buyers and local manufacturers has increased substantially. For instance, the introduction of computer and
65
internet aided designs and tracking of production processes has made the codification and transmission of information of relatively complex products simpler. Empirical evidence suggests that IT improves firms’ profitability in textile and apparel sectors by performing voluminous information intensive transactions with agility and at lower costs.35
In terms of the internal operations and functioning of firms, IT significantly improves management of inventories, production, sales and product design and development. Moreover, IT affects the organizational performance of a firm by improving coordination among different division of a firm.
The use of IT in textile and garments sector has improved the responsiveness of the industry’s value chain by introducing technologies like bar coding, universal product codes, electronic data interchange, electronic packaging, and delivery systems. At the manufacturing level, IT has transformed the conventional sewing into computer-aided sewing hangers systems which helps in tracking the productivity of workers.
The role of IT in Pakistan’s garments manufacturing in designing, cutting, and sewing through automated production processes needs to be explored further along with the ability of firms in transmitting information and coordination on design with international buyers.
The scope of our survey data is limited in exploring the penetration of IT in garment sector. However, our focus group meetings with the industry associations reveal that firms in readymade and knitwear sectors have developed their own websites to disseminate information about their products. Furthermore, the trade associations of readymade and knitwear sectors play a vital role in disseminating and organizing information about international demand through periodic exhibitions.
Other factors influencing Transaction costs
The literature on transaction costs broadly classifies its determinants into human (opportunism and bounded rationality) and environmental factors. 36 The human factors can be controlled through the repetition of a transaction, trust, and reputation building. However environmental factors like interdependence and uncertainty about trade increases transactions costs. In Pakistan, the challenging security situation, unstable macroeconomic environment, poor logistics, and weak contract enforcement leads to sub-optimal arrangements.
The measurement or monetization of transaction costs is difficult since the nature and myriad sources of transaction costs could be region and product specific. For example, the degree of sophistication of products in terms of design and cutting require complex codification and 35Torben JAndersen and Albert H. Segars (The Impact of IT on decision structure and firm performance: evidence from the textile and apparel industry, information & Environment 39, (2001): 85-‐100. 36Oliver E. Williamson, “Transaction-cost economics: The governance of contractual relations,” Journal of Law and Economics 22(1979): 233-61 and Oliver E. Williamson, Markets and Hierarchies (New York: Free Press, 1975).
66
frequent coordination between lead and supply firms which raise transaction costs of sourcing from local firms. Moreover, a weak business environment further increases transaction costs through expenditures on off-balance sheets items like transport efficiency, customs and port procedures, security risks, design capabilities, product standards and development services, and corruption.
In the World Bank’s Doing Business survey 2012, Pakistan ranks 75 out of 183 economies on the “trading across borders” indicator. It outperforms the entire region in average documents preparation and export costs but slightly underperforms on export time. Although Pakistan has reduced the average time of exports from 31 days in 2006 to 21 days in 2012, it still lags behind India which had an export time of 16 days in 2012. 37
Transaction costs play a critical role in the formulation of both forward (with international buyers) and backward (ancillary support from other manufacturers) linkages of domestic firms. Firms decide to outsource activities to markets primarily on the basis of transaction costs. Low transaction costs lead to more reliance on markets enabling outsourcing of key inputs and processes at lower costs. By doing so, firms focus more on building core capabilities in certain areas of production through specialization and improvement in internal organizational structure.
In the post-MFA era, Pakistan’s garments manufacturers experienced internal restructuring/reorganization – from vertical to non-vertical.38 This restructuring came as a response to the increased international competition post the quota regime. In order to compete in terms of price, product quality and speed of delivery (lead times) the garments sector became vertically non-integrated. Firms in the garments sector thus focused on their core capabilities and outsourced key inputs and processes to increase efficiency and lower costs of production. Our survey data confirms the non-vertically integrated nature of firms across sectors and size. On average 80 percent of firms classify themselves as non-vertical units across sectors whereas more than 90 percent of SMEs and 52.8 percent of large firms are non-vertically integrated units (Figure 4.17, 4.18). It is interesting to note that relative to small and medium firms a significantly higher percentage of large firms (47.2 percent) remain vertically integrated.
This finding is further substantiated by the survey data which shows that across size and sectors firms outsource certain inputs and processes which are available in the market at a lower price and are also of requisite quality (Figure 4.17, 4.18). More than 80 percent of the firms in both the woven and knitwear sectors rely on outsourcing to acquire inputs (fabric) as well as processes (dying, finishing, knitting, washing, and stitching) (Figure 4.17, 4.18). Although internal reorganization helped manufacturers to maintain cost competitiveness in the lower value added
37 www.doingbusiness.org 38Rana, Arif and Jamshed Khan (2009) “Achieving Competitive Advantage in Pakistan's Knitware Garments Industry”, LUMS.
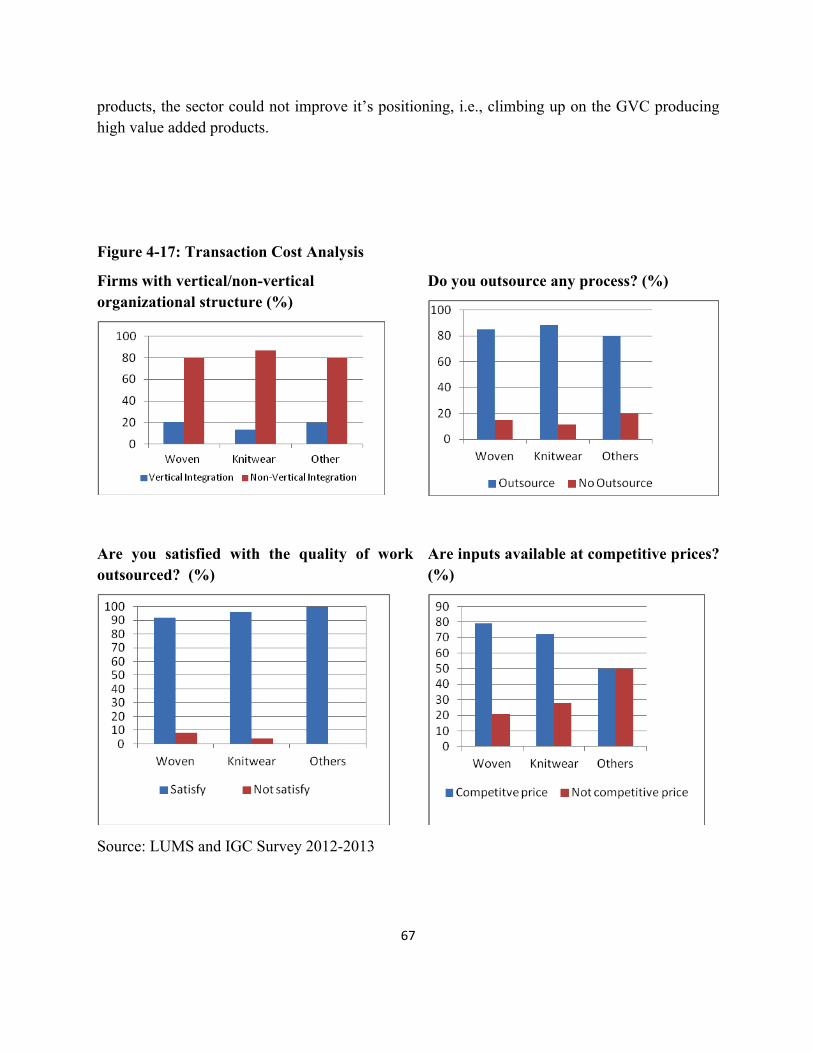
67
products, the sector could not improve it’s positioning, i.e., climbing up on the GVC producing high value added products.
Figure 4-17: Transaction Cost Analysis
Firms with vertical/non-vertical organizational structure (%)
Do you outsource any process? (%)
Are you satisfied with the quality of work outsourced? (%)
Source: LUMS and IGC Survey 2012-2013
Are inputs available at competitive prices? (%)

68

69
Figure 4-168: Transaction Cost Analysis
Firms with vertical/non-vertical organizational structure (%)
Do you outsource any process? (%)
Are you satisfied with the quality of work outsourced? (%)
Source: LUMS-IGC Survey 2012-2013
Are inputs available at competitive prices? (%)
70
4.4 Conclusion
Pakistan’s garment sector stands at a relatively lower rung of the global value chain where most of the manufacturers are full package firms supplying low-price items to retailers, brand marketers, and brand manufactures. There are a few firms which have been able to become own design manufacturer’s. The majority of the firms fall under relational and modular forms of GVC governance structure with few examples of captive value chain.
The main factors which explain Pakistan’s particular positioning in the GVC range from firm level capabilities to transaction costs. While the garment sector has shown considerable improvement in both transaction and information costs, there are still endemic problems associated with firm capability. Technology is one of the key variables impacting firm capability. The survey data indicates that most of the firms across size and cluster want to upgrade technology. However, the cost of upgrading technology precludes many firms, especially the smaller ones, from doing so. According to the survey, access to formal sources of finance remains the biggest hurdle preventing firms from upgrading technology.
Pakistan’s garment manufacturing at its current low equilibrium does not face problems in terms of the availability of semi-skilled labour. Moving from low-value added to high-value added products, however, requires a higher level of skill-set than what is currently available across the country. Access to training institutes could potentially relieve this important constraint on firm capability. However, majority of the firms in the survey identified lack of access to training institutes, which to some extent explains why the sector is trapped in low productivity and resultantly at low value addition.
Cluster formation through glocalization has not been very successful in the garments industry of Pakistan. Karachi is an appropriate example, where due to the chronically poor law and order situation, firms could not reap the full benefits of the cluster despite the availability of infrastructure facilities, access to skilled labor, and access to port facilities. Business environment constraints such as energy, access to finance, and macroeconomic instability have also contributed significantly in terms of higher costs, jeopardizing timely delivery, eating up profit margins, and discouraging international buyers.
In this report, both the macro level trade statistics and the micro level firm survey show that relative to countries like Turkey and Bangladesh, the garment industry of Pakistan is trapped in the production of a narrow range of low-price items with small profit margins. The global garment industry on the other hand is going through a major transformation. Garment manufacturers need to climb up the value chain to become ODMs, and eventually OBMs, by both acquiring the capabilities required to raise productivity, and, by producing a wider range of fashion garment and technical garments which offer much higher profit margins.
71
The market for technical garments amounted to $133 billion in 2010 and is growing by 10% to 13% per annum in Asia (with China supplying 26 percent).39 In 2010, technical garments made up to 38% of the total garment exports. The technical garment sector is more R&D-intensive than capital-intensive. The share of Pakistan in technical garments is negligible. Given the trends in global demand for garments, South Asian countries can get by, at least for some time, as manufacturers and exporters of conventional clothing. However, to maintain garments as a leading sector, these countries will have to develop technological capacity to anticipate and meet emerging shifts in demand.40 They would also need to continuously innovate, and invest in the machinery and the IT hardware/software to sustain growth, climb up the value chain, and generate technological spillovers. These spillovers could potentially promote other activities that leverage off technologies in the garment industry.
39 World Trade Organization. International Trade Statistics 2011. Geneva, Switzerland 40 Coates, Joseph, F. 2005.The Future of Clothing. Technological Forecasting and Social Change. 72: 101-‐110
72
Bibliography
Ali, Shaher Yar. Strategies For Pakistan Textiles Industry To Sustain The Business. Diss.
University of Gävle, 2012.
Andrea Morrison, Carlo Pietrobelli, and Roberta Rabellotti,“ Global Value Chains and Technological Capabilities: A Framework to Study Industrial Innovation in Developing Countries,” (2006), available at smartech.gatech.edu.
Coates, Joseph, F. 2005. The Future of Clothing. Technological Forecasting and Social Change.
72: 101-110.
Cororaton, Caeser B., Abdul Salam, Zafar Altaf, and David Orden. Cotton-Textile Apparels
Sectors of Pakistan: Situations and Challenges Faced. Rep. no. 00800. N.p.: IFPRI, 2008. Print.
Culpan, Refik, Cemal Ekin, and Mehmet Kumbaraci. A Critical Assessment of the Turkish
Apparel Industry and Firms. Rep. N.p.: n.p., n.d. Print.
Dilek, Č. "Competitive aspects of Turkish and Chinese textile and clothing industries. u: Global
Conference on business & economics (VIII)." Florence, Italy (2008).
FIAS, comp. Pakistan Value Chain Analysis. Rep. N.p.: n.p., 2006. Print.
Gary Gereffi, John Humphrey, and Timothy Sturgeon, “The Governance of Global Value Chains,” Review of International Political Economy12, no. 1 (2005): 78-104.
Gereffi G, Fernandez-Stark K, Frederick S, “The Apparel Global Value Chain economic upgrading and work force development , Center on Globalization, Governance and Competitions, Duke University, 2011.
Gary Gereffi, “Global Shifts, Regional Response: Can North America Meet Full-package Challenge?” Bobbin 39, no. 3(November, 1997):16-31.
Gereffi, Gary, and Stacey Fredrick. The Global Apparel Value Chain, Trade and Crisis:
Challenges and Opportunities for Developing Countries. Working paper no. 5281. N.p.: World
Bank, 2010. Print.
Haider, Mohammed Ziaul. "Competitiveness of the Bangladesh ready-made garment industry in
major international markets." Asia-Pacific Trade and Investment Review 3.1., 2007. Print.
73
Humphery John and Schmitz Hubert, “How does insertion in global value chain affect upgrading in the industrial clusters?” IDS working paper, Institute of Development Studies, University of Sussex, Brighton, (2000).
Joshi, Gopal, ed. Garment Industry in South Asia: Rags or Riches? Competitiveness,
Productivity and Job Quality in the Post-MFA Environment. Rep. New Delhi: SAAT, 2002.
Print.
Kondej, Magdalena. "Time of Change in Turkish Apparel." Weblog post. Euromonitor. N.p., 27
Aug. 2012. Web. 4 Mar. 2013.
Kutluksaman, Murat, Ipek Mutlu, Jason Saunders, and Esra Unluaslan. Turkey's Textiles and
Apparel Cluster: Microeconomics of Competetiveness. Rep. N.p.: HBS/HKS, 2012. Print.
Lang, James William. Islamic Republic of Pakistan: Accelerating Economic Transformation
Program. Rep. no. 42163-02. Victoria, Australia: Asian Development Bank, 2009. Print.
Makino, Momoe. "Garment Industry in Pakistan in the Post-MFA Period." Dynamics of Garment
Industry in Low-Income Countries: Experience of Asia and Africa (Interim Report). Ed.
Fukunishi. IDE-JETRO, 2012. Ch 4. Print
Mottaleb, Khondoker Abdul, and Tetsushi Sonobe. "An inquiry into the rapid growth of the
garment industry in Bangladesh." Economic Development and Cultural Change 60.1., 2011.
Print.
Munir, Kamal A., Dr., and Faheem Ul Islam, Dr. Accelerating Economic Transformation
Program: Profile of Textile & Clothing Industry of Pakistan. Rep. no. TA-7137(PAK). N.p.:
Asian Development Bank, 2010. Print.
Nebahat Tokatli, “Globalization and the Changing Clothing Industry in Turkey,” Environment and Planning A35, no. 10, (October 2003):1877-1894.
Nathan Group, comp. Cost Competitiveness of Pakistan's Textiles and Apparel Industry.
Publication. Arlington, Virginia: USAID, 2009. Print.
Oliver E. Williamson, “Transaction-cost economics: The governance of contractual relations,”
Journal of Law and Economics 22(1979): 233-61 and Oliver E. Williamson, Markets and
Hierarchies (New York: Free Press, 1975).
74
P.Maskell and A.Malmberg, “Localized Learning and Industrial Competitiveness,” Cambridge Journal of Economics 23, no. 2(1999):172.
Rahman, Shahidur. Global Shift: Bangladesh Garment Industry in Perspective. Rep. no. 1. Vol.
26. N.p.: CDRB, 2004. Print. 75-91.
Republic of Turkey Ministry of Economy. Industry Clothing. Istanbul: Republic of Turkey
Ministry of Economy, 2012. Print.
Shahid Yusuf, Garment Suppliers Beware: The Global Garments Value Chain is Changing (Washington DC: Growth Dialogue, Washington University).
Stark, Karina Fernandez-, Stacey Fredrick, and Gary Gereffi. The Apparel Global Value Chain:
Economic Upgrading and Workforce Development. Publication. N.p.: Duke, 2011. Print.
Turkish Clothing Industry. Rep. ITKiB-The General Secretariat of Istanbul Textile & Apparel
Exporters' Associations, 2009. Web. 2012.
<http://www.itkib.org.tr/english/about/sectors/ready/readygarment_info.pdf>.
Torben J Andersen and Albert H. Segars (The Impact of IT on decision structure and firm performance: evidence from the textile and apparel industry, information & Environment 39, (2001): 85-100.
UNIDO, The Global Apparel Value Chain: What Prospects for Upgrading by Developing Countries (Vienna: Sectoral Studies Series, 2003).
USAID (2009), Cost competitiveness of Pakistan’s Textiles and Apparel Industry, United States Agency for International Development (USAID).
World Trade Organization. International Trade Statistics 2011. Geneva, Switzerland
Yunus, Mohammad and Tatsufumi Yamagata. “The Garment Industry in Bangladesh.” Dynamic
of Garment Industry in Low-Income Countries: Experience of Asia and Africa (Interim Report).
Ed. Fukunishi. IDE-JETRO, 2012. Ch. 6. Print.
Zengpei, Xuan, ed. Asia-Pacific Trade and Investment Review. Rep. no. 1. 1st ed. Vol. 3. New
York: United Nations ESCAP, 2007.
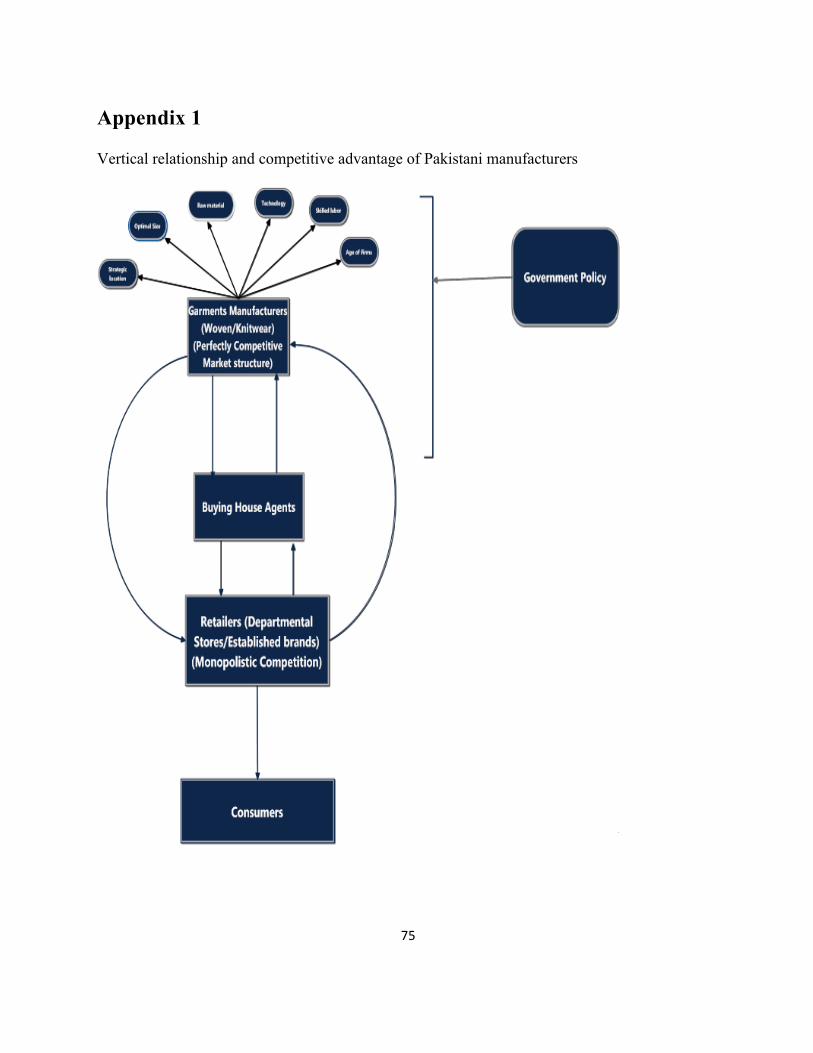
75
Appendix 1
Vertical relationship and competitive advantage of Pakistani manufacturers
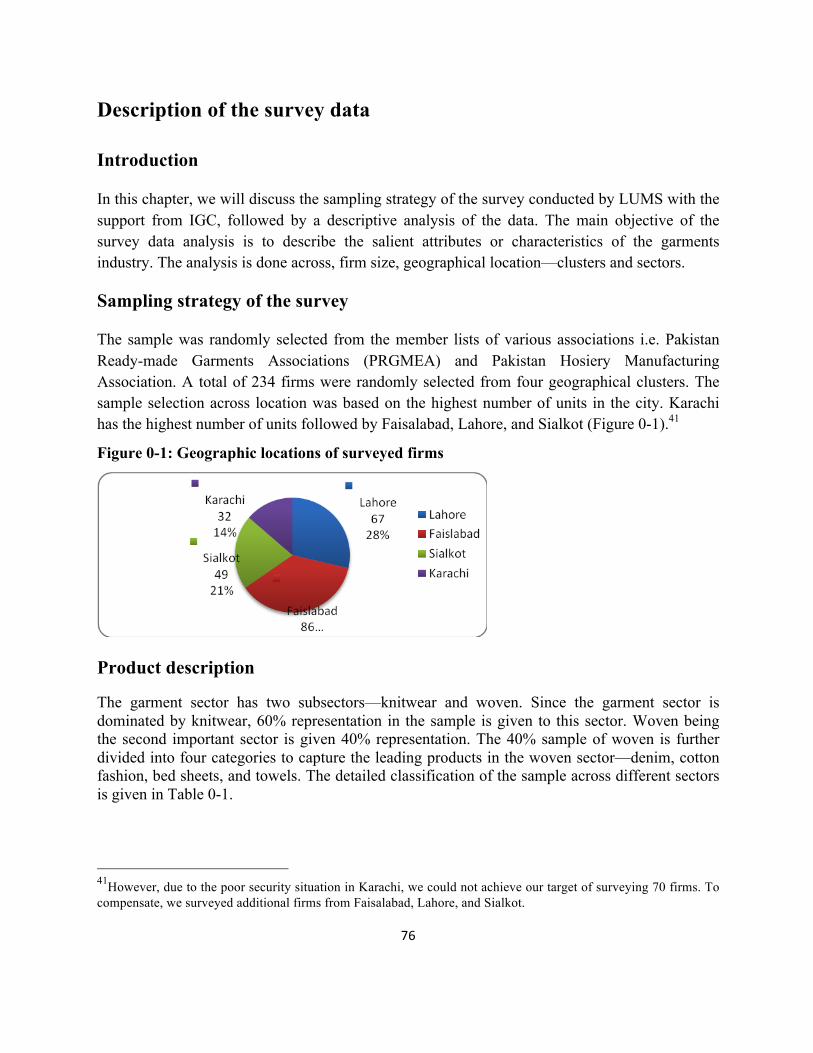
76
Description of the survey data
Introduction
In this chapter, we will discuss the sampling strategy of the survey conducted by LUMS with the support from IGC, followed by a descriptive analysis of the data. The main objective of the survey data analysis is to describe the salient attributes or characteristics of the garments industry. The analysis is done across, firm size, geographical location—clusters and sectors.
Sampling strategy of the survey
The sample was randomly selected from the member lists of various associations i.e. Pakistan Ready-made Garments Associations (PRGMEA) and Pakistan Hosiery Manufacturing Association. A total of 234 firms were randomly selected from four geographical clusters. The sample selection across location was based on the highest number of units in the city. Karachi has the highest number of units followed by Faisalabad, Lahore, and Sialkot (Figure 0-1).41
Figure 0-1: Geographic locations of surveyed firms
Product description
The garment sector has two subsectors—knitwear and woven. Since the garment sector is dominated by knitwear, 60% representation in the sample is given to this sector. Woven being the second important sector is given 40% representation. The 40% sample of woven is further divided into four categories to capture the leading products in the woven sector—denim, cotton fashion, bed sheets, and towels. The detailed classification of the sample across different sectors is given in Table 0-1. 41However, due to the poor security situation in Karachi, we could not achieve our target of surveying 70 firms. To compensate, we surveyed additional firms from Faisalabad, Lahore, and Sialkot.
77
Table 0-1: Distribution of sample across sector and cluster/location
City Knitwear Woven Others Total Lahore 43 24 0 67 Sialkot 29 16 4 49 Faisalabad 66 17 3 86 Karachi 12 17 3 32 Total 150 74 10 234
Firms are also differentiated based on size. Small and Medium firms42make up the majority of the garment industry, with very few large units operating in the industry. The detailed sample of small, medium, and large firms is given in Table 0-2.
Table 0-2: Sample distribution across firm size
Woven Knitwear Others Small and medium 49 122 9 Large 25 28 1 All 74 150 10
Product concentration and specialization varies from city to city. For example, Faisalabad predominately produces knitwear, bed sheets, and towels. Sialkot is concentrated more in sportswear and fewer readymade garment units. Lahore and Karachi have a mix of all kinds of units related to knitwear and woven sectors.
Data description and analysis
Structure and Characteristics of Garment Industry
In this section we present key findings from the survey relevant to the structure and operation of the textile industry in Pakistan. Figure 0-2 shows that there are more woven firms in Karachi, while the other three clusters—Lahore, Faisalabad, and Sialkot—house more knitwear firms.
42SMEs are defined as per the State Bank of Pakistan’s definition: An entity, ideally not being a public limited company, which does not employ more than 250 persons (manufacturing) and 50 persons (trade/services) and also fulfills one of the following criteria:
(i) A trade/services concern with total assets at cost excluding land and buildings up to Rs 50 million. (ii) A manufacturing concern with total assets at cost excluding land and building up to Rs 100 million. (iii) Any concern (trade, services, or manufacturing) with net sales not exceeding Rs 300 million as per latest
financial statements.
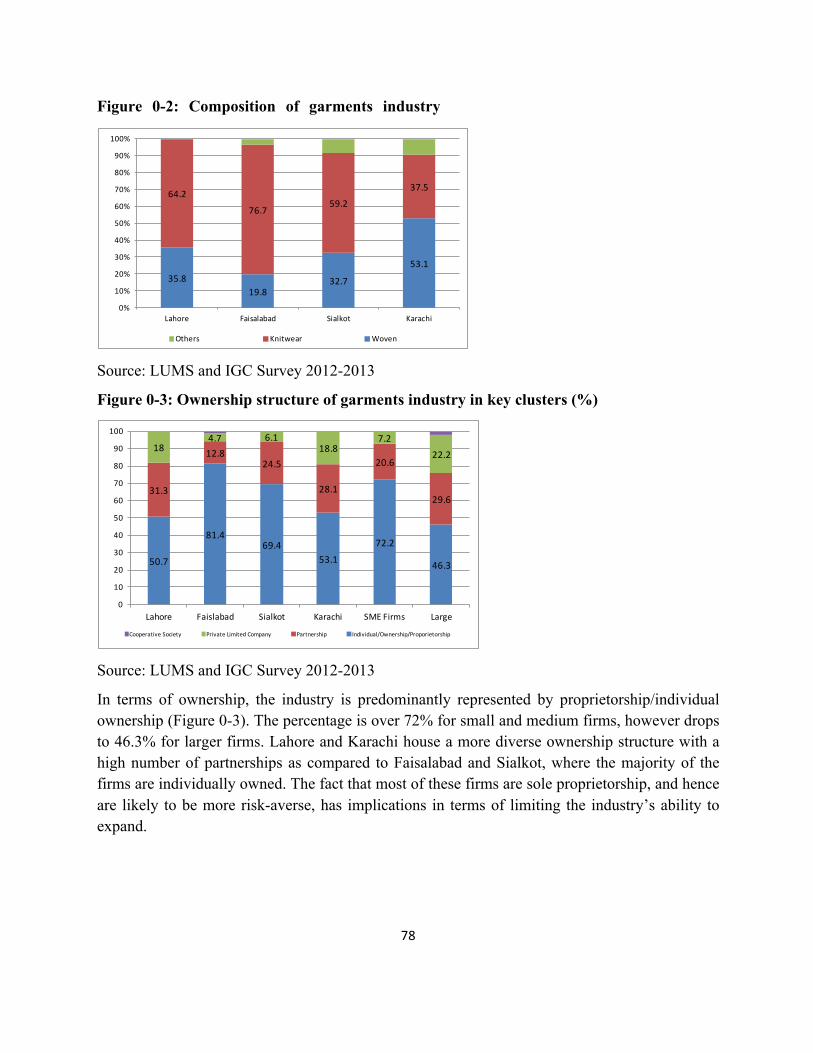
78
35.819.8
32.7
53.1
64.2
76.759.2
37.5
0%
10%
20%
30%
40%
50%
60%
70%
80%
90%
100%
Lahore Faisalabad Sialkot Karachi
Others Knitwear Woven Source: LUMS and IGC Survey 2012-2013
Figure 0-3: Ownership structure of garments industry in key clusters (%)
50.7
81.469.4
53.1
72.2
46.3
31.3
12.824.5
28.1
20.6
29.6
184.7 6.1
18.87.2
22.2
0
10
20
30
40
50
60
70
80
90
100
Lahore Faislabad Sialkot Karachi SME Firms Large
Cooperative Society Private Limited Company Partnership Individual/Ownership/Proporietorship
Source: LUMS and IGC Survey 2012-2013
In terms of ownership, the industry is predominantly represented by proprietorship/individual ownership (Figure 0-3). The percentage is over 72% for small and medium firms, however drops to 46.3% for larger firms. Lahore and Karachi house a more diverse ownership structure with a high number of partnerships as compared to Faisalabad and Sialkot, where the majority of the firms are individually owned. The fact that most of these firms are sole proprietorship, and hence are likely to be more risk-averse, has implications in terms of limiting the industry’s ability to expand.
Figure 0-2: Composition of garments industry
(%)

79
Figure 0-4: Age of firms in key clusters (%)
41.8
11.628.6
31.3
35.8
81.467.3
56.3
0
10
20
30
40
50
60
70
80
90
100
Lahore Faislabad Sialkot Karachi
> 10 Years 5 to 10 Years 3 to 5 Years 1 to 3 Years < 1 Year Source: LUMS and IGC Survey 2012-2013
Figure 0-4 reveals that Faisalabad is the oldest cluster with over 81% of the firms reporting their age to be over ten years. Lahore is the youngest of the four.
Figure 0-5: Barriers to entry (%)
0
10
20
30
40
50
60
70
80
90
100
Do Strong Barriers Exist?
High Set-‐up Costs
Technology Competition Other
Source: LUMS and IGC Survey 2012-2013
Over 90% of the firms in the survey report that entry into the industry is not free of barriers. Some of the major barriers firms face are, high set-up costs, technology acquisition, and competition (Figure 0-5).
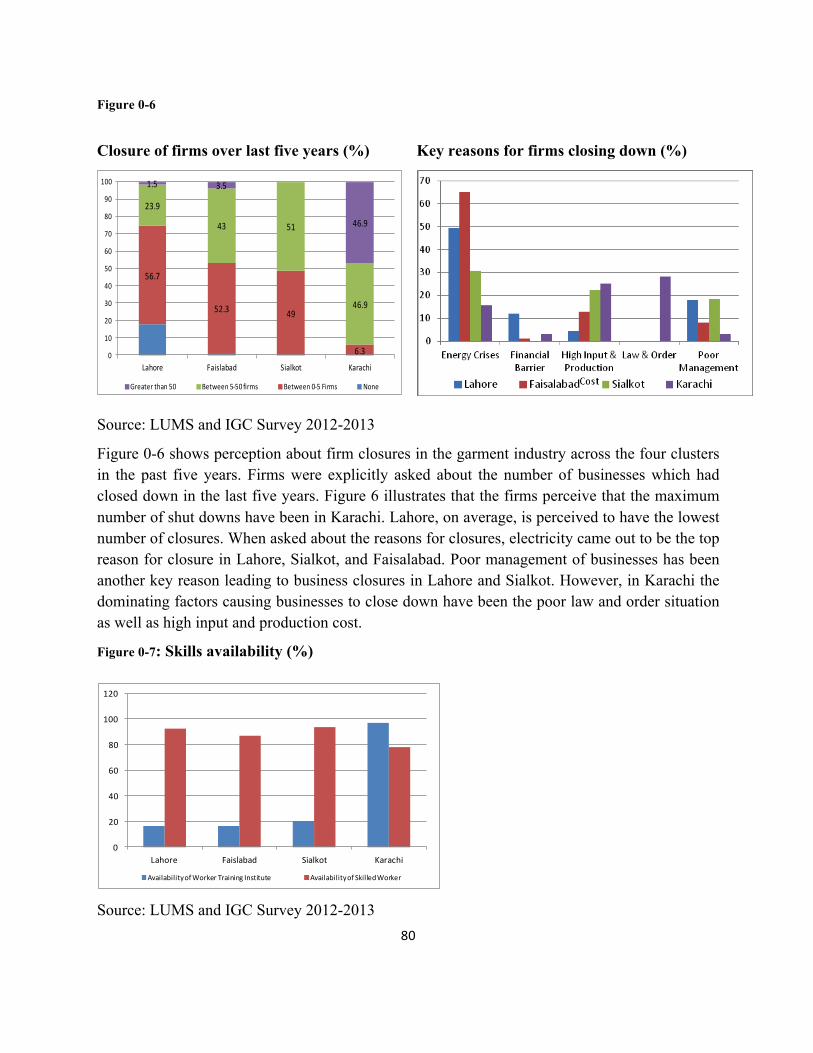
80
Figure 0-6
Closure of firms over last five years (%)
56.7
52.3 49
6.3
23.9
43 51
46.9
1.5 3.5
46.9
0
10
20
30
40
50
60
70
80
90
100
Lahore Faislabad Sialkot Karachi
Greater than 50 Between 5-‐50 firms Between 0-‐5 Firms None
Key reasons for firms closing down (%)
Source: LUMS and IGC Survey 2012-2013
Figure 0-6 shows perception about firm closures in the garment industry across the four clusters in the past five years. Firms were explicitly asked about the number of businesses which had closed down in the last five years. Figure 6 illustrates that the firms perceive that the maximum number of shut downs have been in Karachi. Lahore, on average, is perceived to have the lowest number of closures. When asked about the reasons for closures, electricity came out to be the top reason for closure in Lahore, Sialkot, and Faisalabad. Poor management of businesses has been another key reason leading to business closures in Lahore and Sialkot. However, in Karachi the dominating factors causing businesses to close down have been the poor law and order situation as well as high input and production cost.
Figure 0-7: Skills availability (%)
0
20
40
60
80
100
120
Lahore Faislabad Sialkot Karachi
Availability of Worker Training Institute Availability of Skilled Worker Source: LUMS and IGC Survey 2012-2013
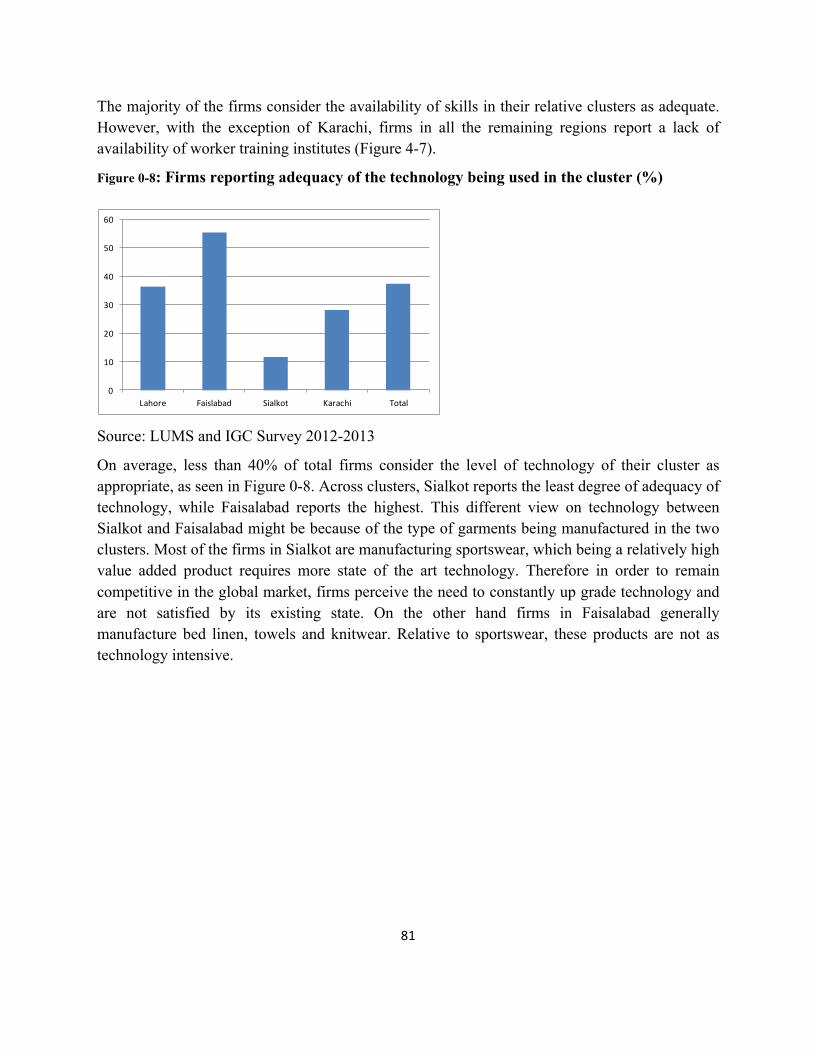
81
The majority of the firms consider the availability of skills in their relative clusters as adequate. However, with the exception of Karachi, firms in all the remaining regions report a lack of availability of worker training institutes (Figure 4-7).
Figure 0-8: Firms reporting adequacy of the technology being used in the cluster (%)
0
10
20
30
40
50
60
Lahore Faislabad Sialkot Karachi Total Source: LUMS and IGC Survey 2012-2013
On average, less than 40% of total firms consider the level of technology of their cluster as appropriate, as seen in Figure 0-8. Across clusters, Sialkot reports the least degree of adequacy of technology, while Faisalabad reports the highest. This different view on technology between Sialkot and Faisalabad might be because of the type of garments being manufactured in the two clusters. Most of the firms in Sialkot are manufacturing sportswear, which being a relatively high value added product requires more state of the art technology. Therefore in order to remain competitive in the global market, firms perceive the need to constantly up grade technology and are not satisfied by its existing state. On the other hand firms in Faisalabad generally manufacture bed linen, towels and knitwear. Relative to sportswear, these products are not as technology intensive.
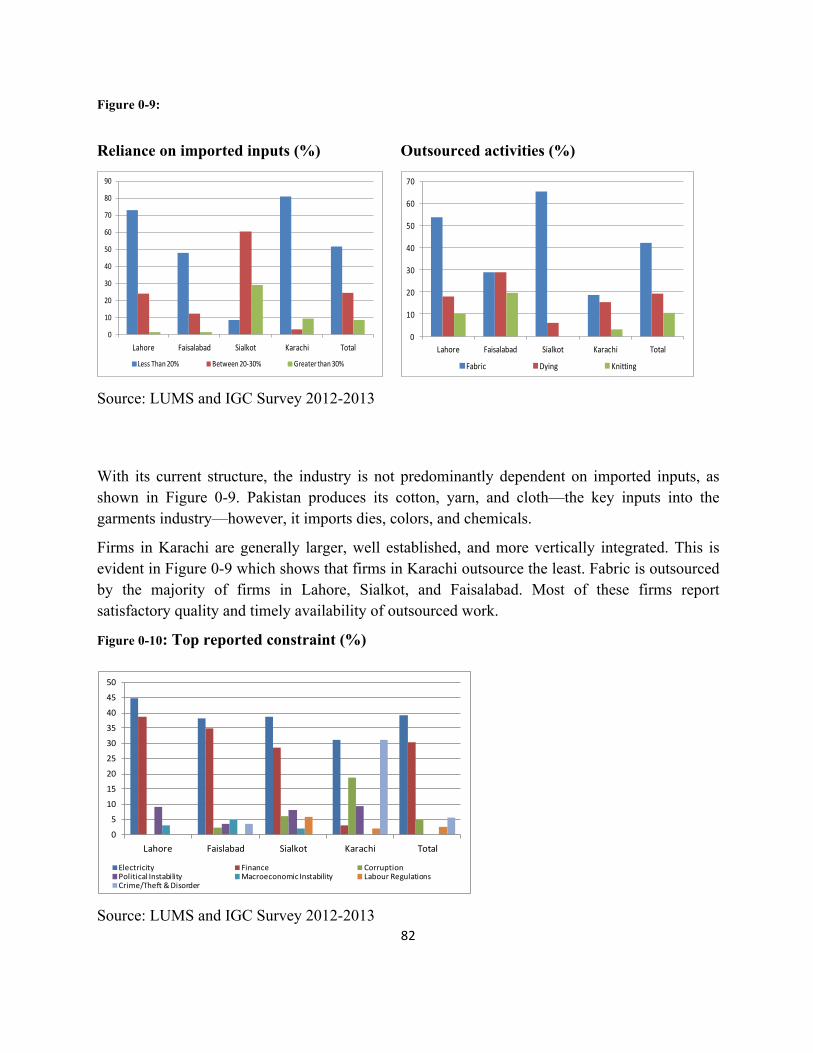
82
Figure 0-9:
Reliance on imported inputs (%)
0
10
20
30
40
50
60
70
80
90
Lahore Faisalabad Sialkot Karachi Total
Less Than 20% Between 20-‐30% Greater than 30%
Source: LUMS and IGC Survey 2012-2013
Outsourced activities (%)
0
10
20
30
40
50
60
70
Lahore Faisalabad Sialkot Karachi Total
Fabric Dying Knitting
With its current structure, the industry is not predominantly dependent on imported inputs, as shown in Figure 0-9. Pakistan produces its cotton, yarn, and cloth—the key inputs into the garments industry—however, it imports dies, colors, and chemicals.
Firms in Karachi are generally larger, well established, and more vertically integrated. This is evident in Figure 0-9 which shows that firms in Karachi outsource the least. Fabric is outsourced by the majority of firms in Lahore, Sialkot, and Faisalabad. Most of these firms report satisfactory quality and timely availability of outsourced work.
Figure 0-10: Top reported constraint (%)
0
5
10
15
20
25
30
35
40
45
50
Lahore Faislabad Sialkot Karachi Total
Electricity Finance CorruptionPolitical Instability Macroeconomic Instability Labour RegulationsCrime/Theft & Disorder
Source: LUMS and IGC Survey 2012-2013
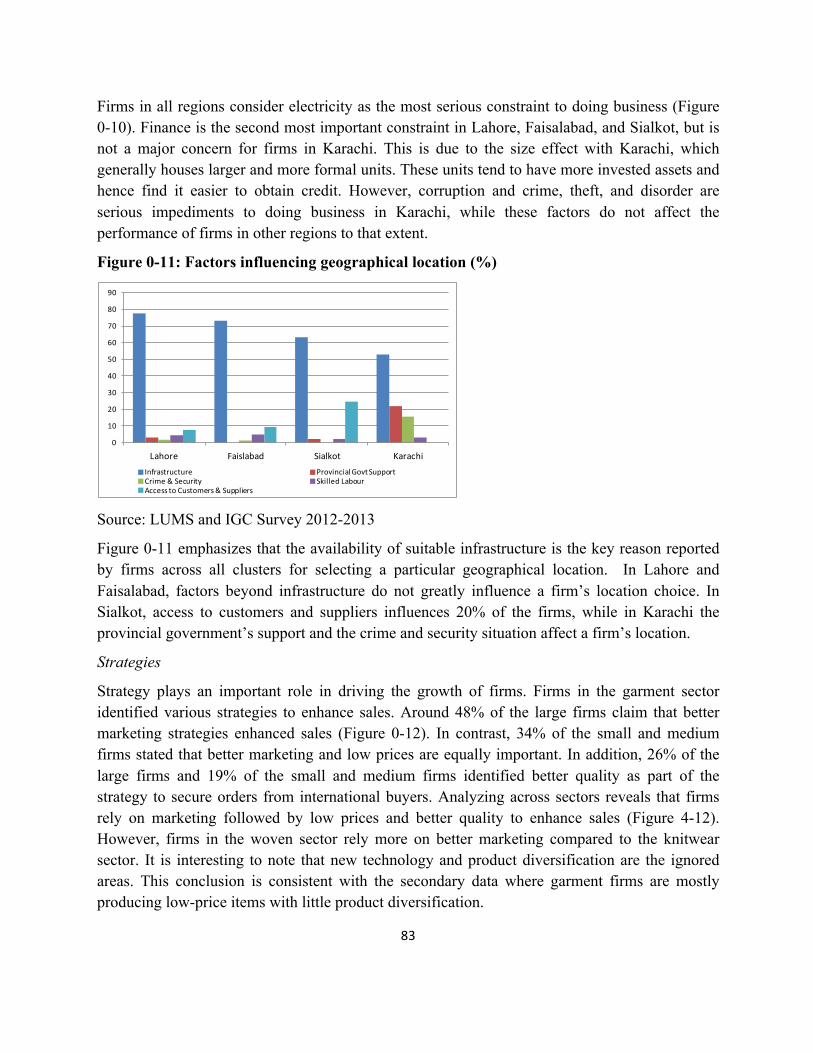
83
Firms in all regions consider electricity as the most serious constraint to doing business (Figure 0-10). Finance is the second most important constraint in Lahore, Faisalabad, and Sialkot, but is not a major concern for firms in Karachi. This is due to the size effect with Karachi, which generally houses larger and more formal units. These units tend to have more invested assets and hence find it easier to obtain credit. However, corruption and crime, theft, and disorder are serious impediments to doing business in Karachi, while these factors do not affect the performance of firms in other regions to that extent.
Figure 0-11: Factors influencing geographical location (%)
0
10
20
30
40
50
60
70
80
90
Lahore Faislabad Sialkot KarachiInfrastructure Provincial Govt SupportCrime & Security Skilled LabourAccess to Customers & Suppliers
Source: LUMS and IGC Survey 2012-2013
Figure 0-11 emphasizes that the availability of suitable infrastructure is the key reason reported by firms across all clusters for selecting a particular geographical location. In Lahore and Faisalabad, factors beyond infrastructure do not greatly influence a firm’s location choice. In Sialkot, access to customers and suppliers influences 20% of the firms, while in Karachi the provincial government’s support and the crime and security situation affect a firm’s location.
Strategies
Strategy plays an important role in driving the growth of firms. Firms in the garment sector identified various strategies to enhance sales. Around 48% of the large firms claim that better marketing strategies enhanced sales (Figure 0-12). In contrast, 34% of the small and medium firms stated that better marketing and low prices are equally important. In addition, 26% of the large firms and 19% of the small and medium firms identified better quality as part of the strategy to secure orders from international buyers. Analyzing across sectors reveals that firms rely on marketing followed by low prices and better quality to enhance sales (Figure 4-12). However, firms in the woven sector rely more on better marketing compared to the knitwear sector. It is interesting to note that new technology and product diversification are the ignored areas. This conclusion is consistent with the secondary data where garment firms are mostly producing low-price items with little product diversification.
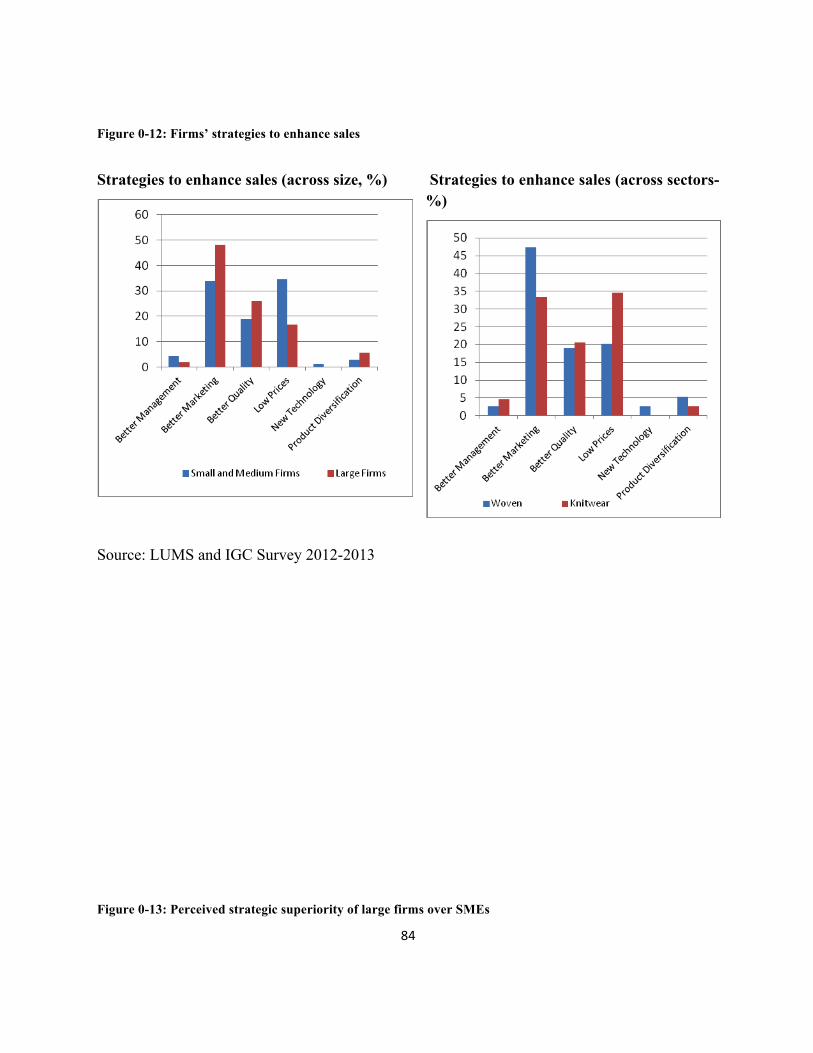
84
Figure 0-12: Firms’ strategies to enhance sales
Strategies to enhance sales (across size, %)
Strategies to enhance sales (across sectors- %)
Source: LUMS and IGC Survey 2012-2013
Figure 0-13: Perceived strategic superiority of large firms over SMEs

85
In what ways are large firms superior to small and medium firms across sectors (%)
In what ways are large firms superior to small and medium firms across clusters (%)
Source: LUMS and IGC Survey 2012-2013
To analyze differences across size in terms of management, marketing, product quality and diversification, and financial strength, firms were asked how large units are superior to small and medium units (Figure 0-13). The majority of firms—across sector and location—reported that large firms have a competitive advantage over small and medium firms in terms of better management and financial strength.
Branding and contracting
For garment manufacturers, moving from pure manufacturing to branding is crucial to climb up the value chain and access the end customers in the Western markets. However, our survey findings suggest that the garment industry in Pakistan remained concentrated in low-price and mass-production supplying to US and European markets mostly through buying houses. More than 90% of total firms across size are contracting firms for international buyers (Figure 0-14) i.e. international buying houses (Li and Fung and Synergies Worldwide), brand manufacturers (Zara and Benetton Group) and brand marketers (Polo Ralph Lauren and Tommy Hilfiger).43 This result is further substantiated with the finding that more than 85% of total firms across size do not produce branded products (Figure 4-14). It is further reported that some firms (26% of
43 Chapter 5 discusses in detail the implication of branding and contracting on the garment firms.
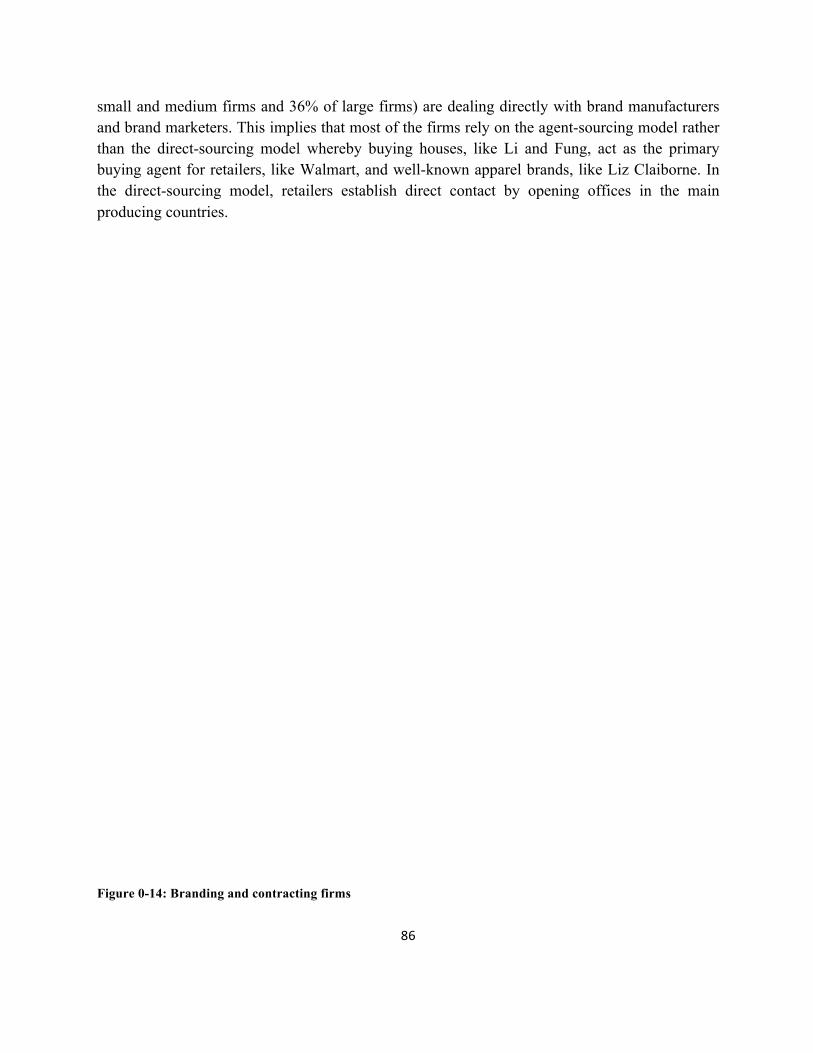
86
small and medium firms and 36% of large firms) are dealing directly with brand manufacturers and brand marketers. This implies that most of the firms rely on the agent-sourcing model rather than the direct-sourcing model whereby buying houses, like Li and Fung, act as the primary buying agent for retailers, like Walmart, and well-known apparel brands, like Liz Claiborne. In the direct-sourcing model, retailers establish direct contact by opening offices in the main producing countries.
Figure 0-14: Branding and contracting firms
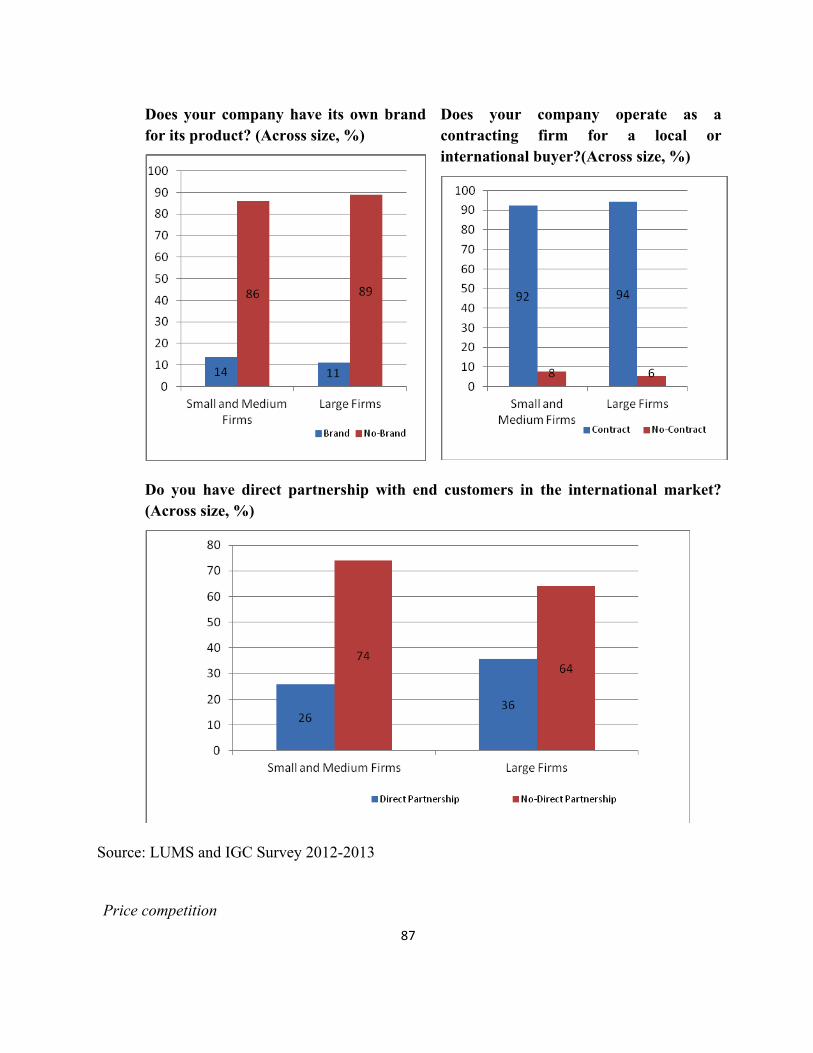
87
Does your company have its own brand for its product? (Across size, %)
Does your company operate as a contracting firm for a local or international buyer?(Across size, %)
Do you have direct partnership with end customers in the international market? (Across size, %)
Source: LUMS and IGC Survey 2012-2013
Price competition
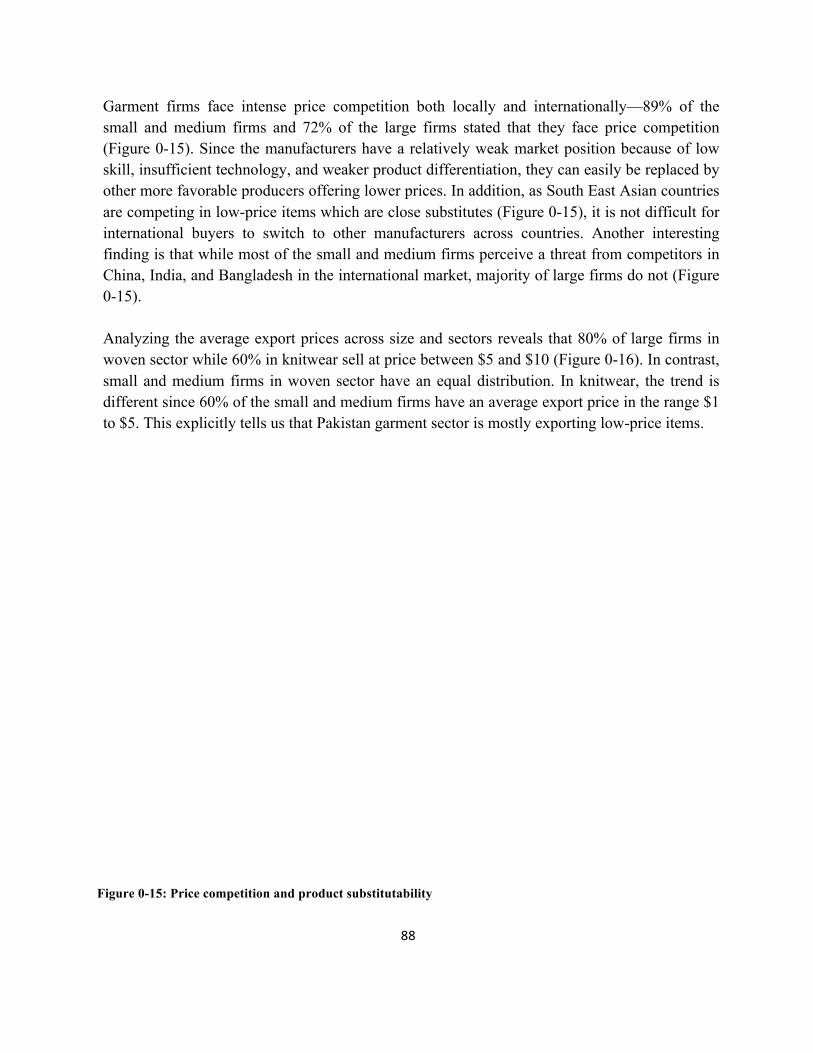
88
Garment firms face intense price competition both locally and internationally—89% of the small and medium firms and 72% of the large firms stated that they face price competition (Figure 0-15). Since the manufacturers have a relatively weak market position because of low skill, insufficient technology, and weaker product differentiation, they can easily be replaced by other more favorable producers offering lower prices. In addition, as South East Asian countries are competing in low-price items which are close substitutes (Figure 0-15), it is not difficult for international buyers to switch to other manufacturers across countries. Another interesting finding is that while most of the small and medium firms perceive a threat from competitors in China, India, and Bangladesh in the international market, majority of large firms do not (Figure 0-15). Analyzing the average export prices across size and sectors reveals that 80% of large firms in woven sector while 60% in knitwear sell at price between $5 and $10 (Figure 0-16). In contrast, small and medium firms in woven sector have an equal distribution. In knitwear, the trend is different since 60% of the small and medium firms have an average export price in the range $1 to $5. This explicitly tells us that Pakistan garment sector is mostly exporting low-price items.
Figure 0-15: Price competition and product substitutability

89
Do firms face price competition from competitors? (Across size, %)
Does your product have a close substitute in terms of the quality and price of product? (Across sectors, %)
Are cheap garments from Bangladesh, India, and China posing a real threat to Pakistani export shares in world market? (Across size, %)
Source: LUMS and IGC Survey 2012-2013
Figure 0-16: Percentage of SME and large firms with different export prices (%)

90
Source: LUMS and IGC Survey 2012-2013
Other key Characteristics of garment industry
Profit margin and sales of firms
The post-MFA era saw a re-location of production to low-cost countries which improved the global value chain of the garment sector but at the same time also exposed local production networks to global competition squeezing profit margins. With intense global competition, the profit margin increased for firms producing value-added products. As discussed in chapter 1 and 2, Pakistan’s manufacturers are concentrated in value-added product categories with relatively lower prices and profit margins. The following firm level data supports this macro level finding.
The profit margin of surveyed firms varies significantly across sector and firm size (Figure 0-17). Woven and large-sized firms earn comparatively higher profit. Only 38% of surveyed firms shared information about their profit margin on their exported products. On average, the profit margin stands at 12% of the total value of the product. The profit margin for knitwear firms is comparatively lower than the woven firms. More than 60% of knitwear firms have less than 10% profit margin. Almost half of the woven firms fall under the profit margin range of 11% to 15% while only 30% of knitwear firms fall in the same category.
The profit margin also varies across firm size since more than half of the large firms and only one third of SME firms have a profit margin of 11% to 15%. Almost 62% of SMEs have a profit margin of less than 10%.
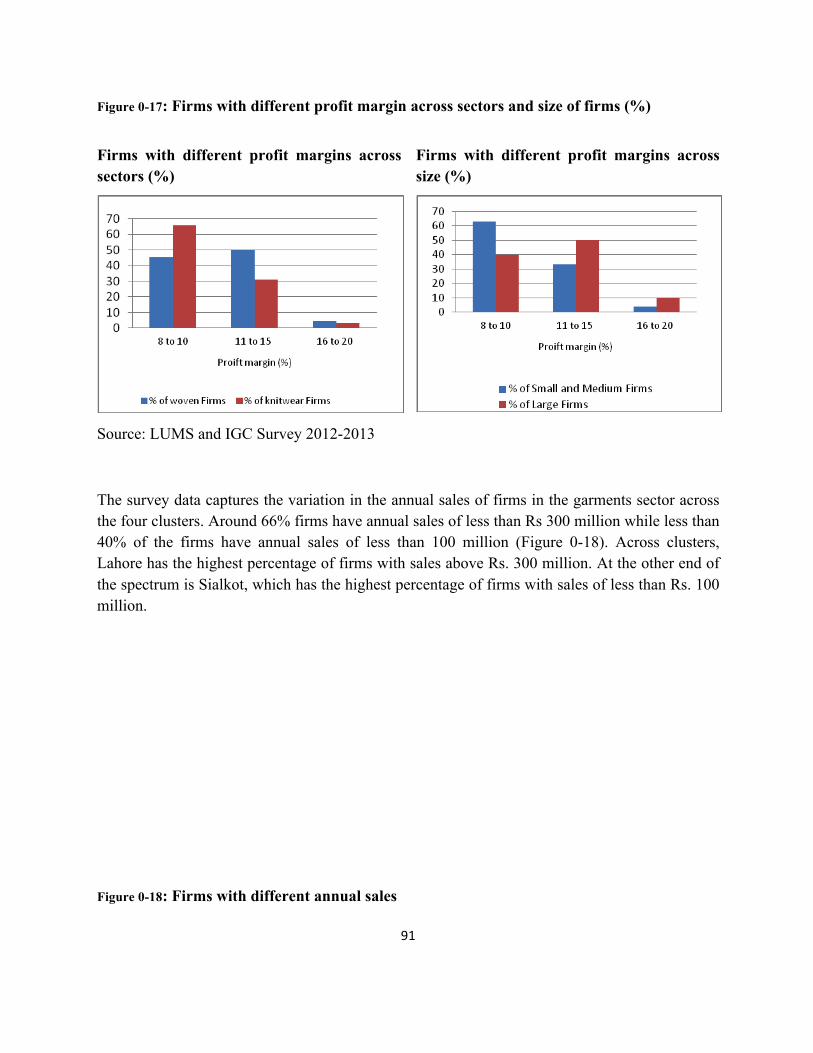
91
Figure 0-17: Firms with different profit margin across sectors and size of firms (%)
Firms with different profit margins across sectors (%)
Source: LUMS and IGC Survey 2012-2013
Firms with different profit margins across size (%)
The survey data captures the variation in the annual sales of firms in the garments sector across the four clusters. Around 66% firms have annual sales of less than Rs 300 million while less than 40% of the firms have annual sales of less than 100 million (Figure 0-18). Across clusters, Lahore has the highest percentage of firms with sales above Rs. 300 million. At the other end of the spectrum is Sialkot, which has the highest percentage of firms with sales of less than Rs. 100 million.
Figure 0-18: Firms with different annual sales
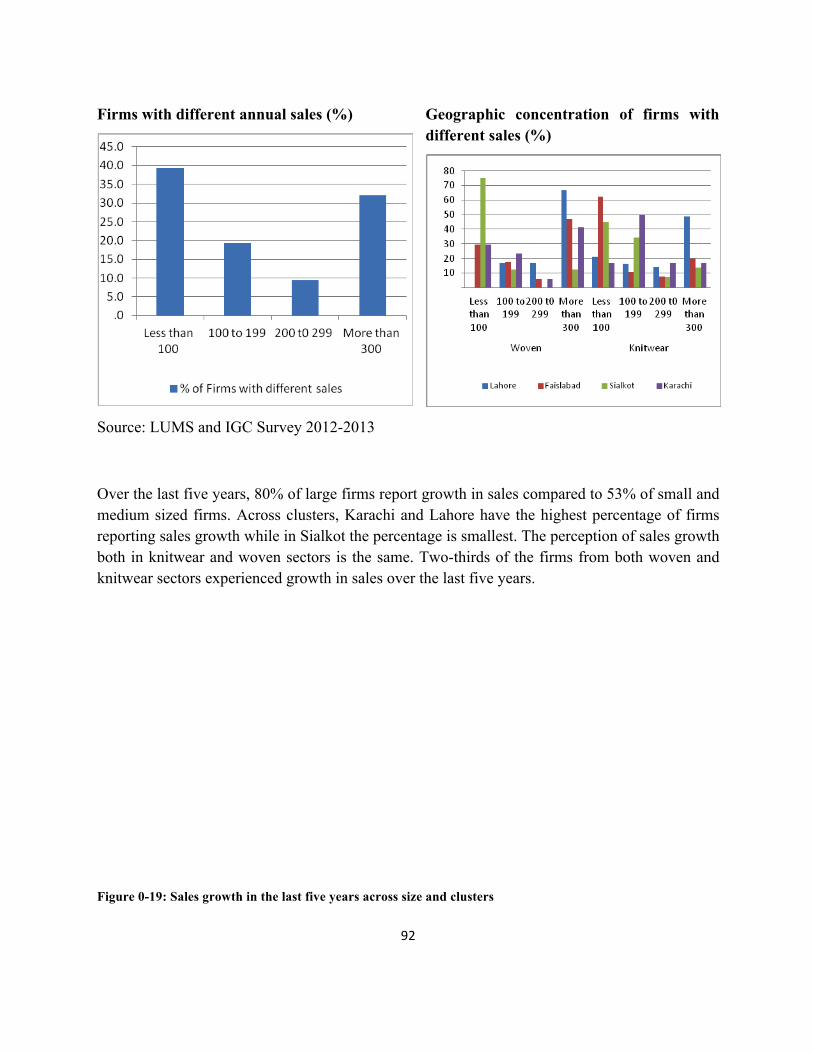
92
Firms with different annual sales (%)
Source: LUMS and IGC Survey 2012-2013
Geographic concentration of firms with different sales (%)
Over the last five years, 80% of large firms report growth in sales compared to 53% of small and medium sized firms. Across clusters, Karachi and Lahore have the highest percentage of firms reporting sales growth while in Sialkot the percentage is smallest. The perception of sales growth both in knitwear and woven sectors is the same. Two-thirds of the firms from both woven and knitwear sectors experienced growth in sales over the last five years.
Figure 0-19: Sales growth in the last five years across size and clusters
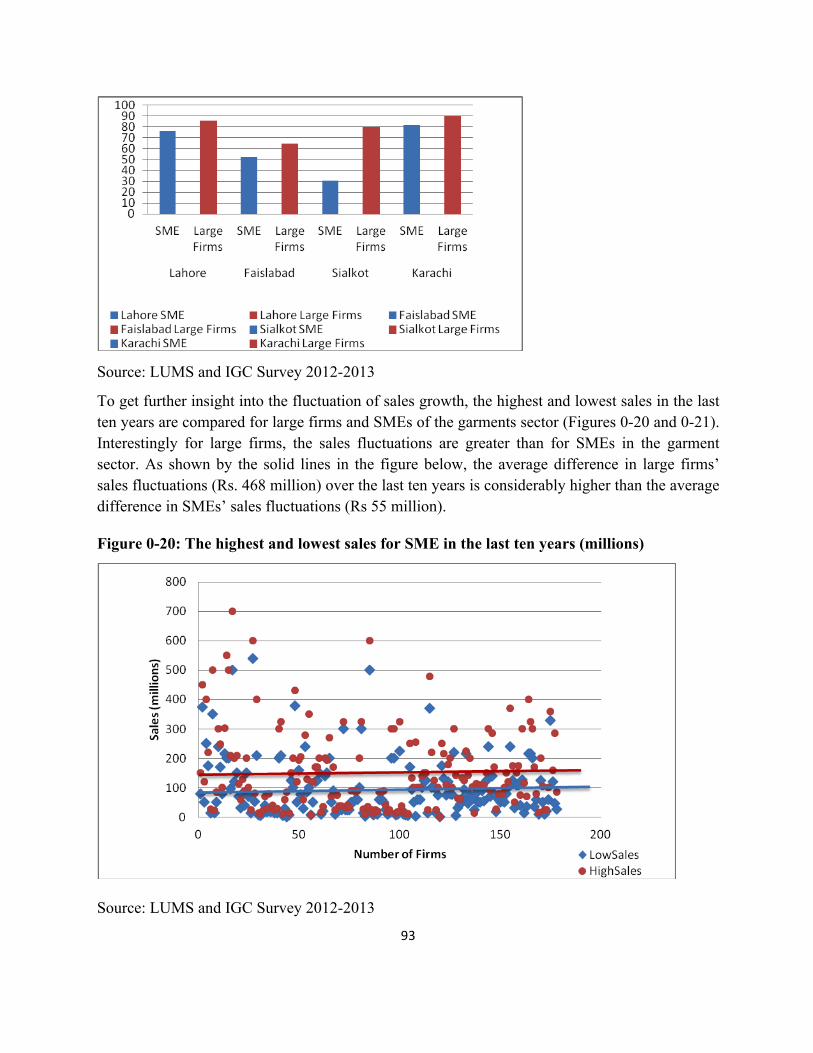
93
Source: LUMS and IGC Survey 2012-2013
To get further insight into the fluctuation of sales growth, the highest and lowest sales in the last ten years are compared for large firms and SMEs of the garments sector (Figures 0-20 and 0-21). Interestingly for large firms, the sales fluctuations are greater than for SMEs in the garment sector. As shown by the solid lines in the figure below, the average difference in large firms’ sales fluctuations (Rs. 468 million) over the last ten years is considerably higher than the average difference in SMEs’ sales fluctuations (Rs 55 million).
Figure 0-20: The highest and lowest sales for SME in the last ten years (millions)
Source: LUMS and IGC Survey 2012-2013
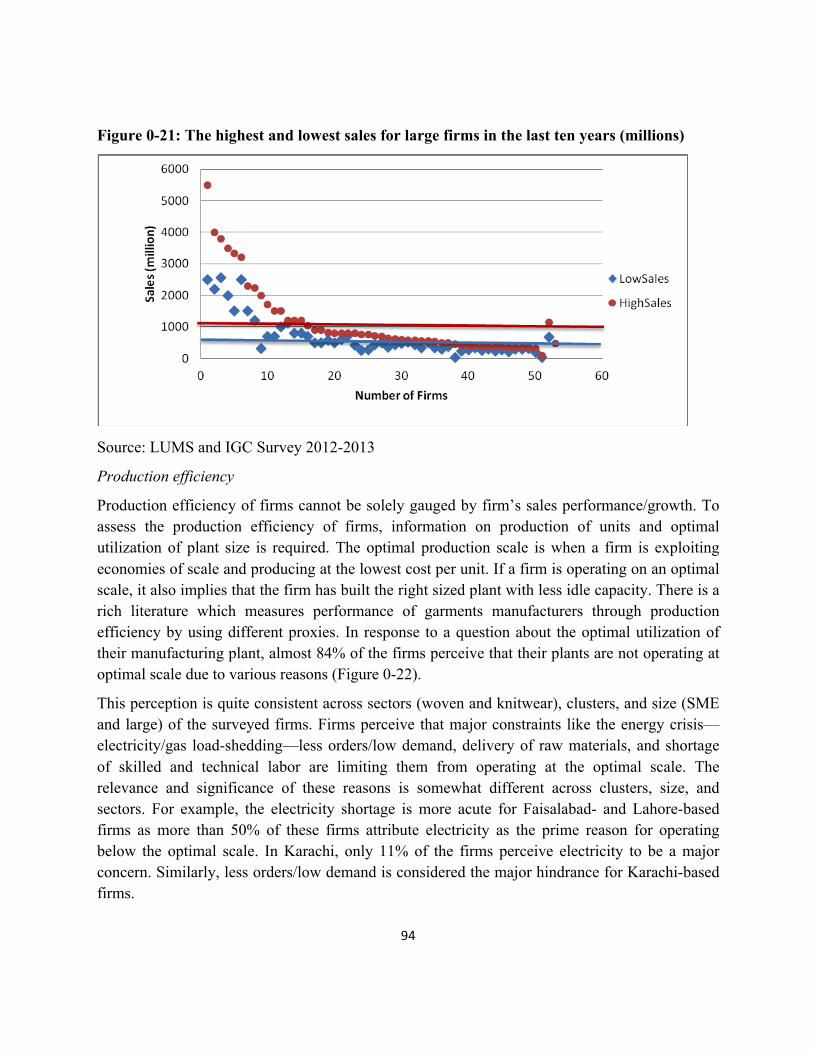
94
Figure 0-21: The highest and lowest sales for large firms in the last ten years (millions)
Source: LUMS and IGC Survey 2012-2013
Production efficiency
Production efficiency of firms cannot be solely gauged by firm’s sales performance/growth. To assess the production efficiency of firms, information on production of units and optimal utilization of plant size is required. The optimal production scale is when a firm is exploiting economies of scale and producing at the lowest cost per unit. If a firm is operating on an optimal scale, it also implies that the firm has built the right sized plant with less idle capacity. There is a rich literature which measures performance of garments manufacturers through production efficiency by using different proxies. In response to a question about the optimal utilization of their manufacturing plant, almost 84% of the firms perceive that their plants are not operating at optimal scale due to various reasons (Figure 0-22).
This perception is quite consistent across sectors (woven and knitwear), clusters, and size (SME and large) of the surveyed firms. Firms perceive that major constraints like the energy crisis—electricity/gas load-shedding—less orders/low demand, delivery of raw materials, and shortage of skilled and technical labor are limiting them from operating at the optimal scale. The relevance and significance of these reasons is somewhat different across clusters, size, and sectors. For example, the electricity shortage is more acute for Faisalabad- and Lahore-based firms as more than 50% of these firms attribute electricity as the prime reason for operating below the optimal scale. In Karachi, only 11% of the firms perceive electricity to be a major concern. Similarly, less orders/low demand is considered the major hindrance for Karachi-based firms.
95
Figure 0-22: Perception of firms about plant utilization

96
Is your plant operating at the optimal scale? (%)
Key reasons for not operating at the optimal scale (%)
Key reasons for operating below optimal scale, across clusters (%)
Source: LUMS and IGC Survey 2012-2013
Cost efficiency
Pakistan’s garment manufacturers are cost competitive44 primarily due to home-produced inputs (cotton, fabric, yarn) and cheap labor. Pakistan’s garments manufacturers are cost-efficient in certain products like cotton t-shirts and chinos due to low-priced raw material and cheap labor.45 Pakistan is ranked at number two, after Bangladesh, on cheap labor among other competitors 44 USAID (2009), Cost competitiveness of Pakistan’s Textiles and Apparel Industry, United States Agency for International Development (USAID). 45USAID (2009), Cost competitiveness of Pakistan’s Textiles and Apparel Industry, United States Agency for International Development (USAID).

97
(China, Cambodia, and India). The hourly wage rate in Pakistan ($0.55) is higher than in Bangladesh ($0.32). Pakistan also tops the list in terms of availability of home-produced cheap fabric. In response to a question in our survey on the top five input costs, both knitwear and woven manufacturers identified fabric/yarn, energy, accessories, dying, and labor as the major costs.
Designed by soapbox.co.uk
The International Growth Centre (IGC) aims to promote sustainable growth in developing countries by providing demand-led policy advice based on frontier research.
Find out more about our work on our website www.theigc.org
For media or communications enquiries, please contact [email protected]
Subscribe to our newsletter and topic updates www.theigc.org/newsletter
Follow us on Twitter @the_igc
Contact us International Growth Centre, London School of Economic and Political Science, Houghton Street, London WC2A 2AE