Embed Size (px)
Citation preview
UKAIS 2009, Oxford , UK
Proceedings of the U.K. Academy for Information Systems (UKAIS 2009), 14th Annual Conference
1
A COMPARATIVE ANALYSIS OF BUSINESS PROCESS MODELLING
TECHNIQUES Laden Aldin and Sergio de Cesare
Department of Information Systems and Computing Brunel University Uxbridge, U.K. Email: {laden.aldin|sergio.decesare}@brunel.ac.uk
Abstract Business process modelling is an increasingly popular research area for both organisations and academia due to its usefulness in facilitating human understanding and communication. Several modelling techniques have been proposed and used to capture the characteristics of business processes. However, available techniques view business processes from different perspectives and have different features and capabilities. Furthermore, to date limited guidelines exist for selecting appropriate modelling techniques based on the characteristics of the problem and its requirements. This paper presents a comparative analysis of some popular business process modelling techniques. The comparative framework is based on five criteria: flexibility, ease of use, understandability, simulation support and scope. The study highlights some of the major paradigmatic differences between the techniques. The proposed framework can serve as the basis for evaluating further modelling techniques and generating selection procedures.
Keywords: Business process modelling, modelling techniques, comparative analysis.
1. Introduction Business process modelling represents an important part of information systems (IS)
development and evolution within organisations. This is primarily due to the need of
organisations to be able to readily and flexibly adapt their processes to change
induced by both internal and external factors (Morgan, 2007).
One of the main issues in business process modelling is the enormous availability of
different techniques for the representation of organisational processes and their
requirements (Luo and Tung, 1999). Individual techniques can focus on different
facets of process modelling. For example, while Role Activity Diagrams (RAD)
emphasise on the interaction between roles in the organisation (Ould, 1995), Data
Flow Diagrams (DFD) focus on the flow of data through a system (Shen et al., 2004).
This paper presents a comparative analysis of popular business process modelling
techniques. The motivation for this study derives from the practical need of
information systems stakeholders (among these developers) to understand the
pragmatic differences of various modelling techniques and ultimately select the most
appropriate for the task at hand. The comparison is based on key criteria that are used
to examine each technique individually and subsequently contrast the techniques. The
criteria were defined on the basis of those aspects that the business process modelling
UKAIS 2009, Oxford , UK
Proceedings of the U.K. Academy for Information Systems (UKAIS 2009), 14th Annual Conference
2
literature suggests as being important (Kettinger et al. (1997); Luo and Tung (1999);
Melao and Pidd (2000); Giaglis (2001); Aguilar-Savén (2004); Carnaghan (2006);
Ortiz-Hernández et al. (2007); and Vergidis et al. (2008)). The comparative
framework adopts the following five criteria: flexibility, ease of use,
understandability, simulation and scope. These comparative criteria will be defined in
Section 3. The remainder of this paper is structured as follows. Section 2 provides the
necessary background with an overview of related literature. Section 4 presents the
comparative analysis framework, and Section 5 presents conclusions and future work.
2. Background Business process modelling (BPM) produces the conceptual artefacts underpinning
the management of organisational processes and their continuous change (Mendling,
2008). Whether such change is dramatic or subtle the effective management of a
business’ process models is fundamental to keep an organisation efficient and
competitive (Morgan, 2007). Therefore, it is necessary to update and revise business
processes periodically in order to achieve improved organisational performance
enabling the organisation to deliver quality products and services as required by its
customers (Jacobson et al., 1995).
Many definitions of business process have been proposed. For example, Hammer and
Champy (1993, p. 85) defined business process as “a collection of activities whose
final aim is the production of a specific output that is of value to the customer. A
business process has a goal and is affected by events occurring in the external world
or in other processes”. Other definitions provide similar interpretations of the term
(for example, see Davenport (1993); Earls (1994); Jacobson et al. (1995); Ould
(1995); and Havey (2005)). From an analysis of these definitions it is possible to
extract those elements that are commonly and generally accepted by the business
modelling community as characterising a business process. These elements include:
• Process: A set of activities, events, etc. that together and cohesively delivers a service
and/or a product.
• Activity: Specific behaviour carried out in an organisation.
• Service and Product: The observable outcome of value of a process. The traditional
distinction between service and product is that the former is intangible while the latter is
tangible.
• Role: The types of actors or agents that take part in processes.
UKAIS 2009, Oxford , UK
Proceedings of the U.K. Academy for Information Systems (UKAIS 2009), 14th Annual Conference
3
• Goal: The aim of a process.
• Event: An occurrence that takes place at a specific point in time and that is capable of
inducing some observable behaviour (activity or process).
• Rule: A constraint defined for any part of the organisation and its processes.
Hence, business process modelling is that activity aimed at the representation of all or
some of the above elements in order to produce a cohesive model of the behaviour
required to deliver a service and/or product to a customer or another part of the
organisation.
Business process modelling techniques can model all or some of the above elements
depending on the technique’s focus. The focus may depend on various factors such as
the paradigm with which the technique was originally conceived or the domain for
which it was developed (e.g. software development, systems engineering, etc.). Some
techniques may not explicitly model any of the above elements, but instead provide
constructs that can be used to implicitly represent them.
As previous comparative analyses demonstrate, a plethora of techniques have been
proposed over the years for BPM. Kettinger et al. (1997) analysed a total of 72
techniques and 102 tools in a survey focused on Business Process Re-engineering.
Consequently, given the renewed interest in BPM, IS decision-makers are faced with
the dilemma of how to model their processes, hence which technique(s) to adopt. The
decision can be based on the purpose (or reason) for undertaking BPM.
Business process modelling serves multiple purposes. Summarising points from Luo
and Tung (1999), Eriksson and Penker (2000), and Caetano et al. (2005), these
purposes include:
1. Facilitating a group to share their understanding of the process by using a common
process representation, which helps human understanding and communication.
2. Providing the advantage of reuse. If the same business process model can act as the basis
for several information systems, it can be reused as the basic input for defining the
requirements of each system.
3. Creating suitable information systems that support the business by providing a descriptive
model for learning.
4. Supporting process improvement and re-engineering through business process analysis
and simulation. BPM will be used for improving the current business by identifying
possible ways to make the business more efficient. Normally, the current business is
modelled and then re-engineered for enhancement or improvement opportunities.
UKAIS 2009, Oxford , UK
Proceedings of the U.K. Academy for Information Systems (UKAIS 2009), 14th Annual Conference
4
5. Enabling decision support during process execution, and control.
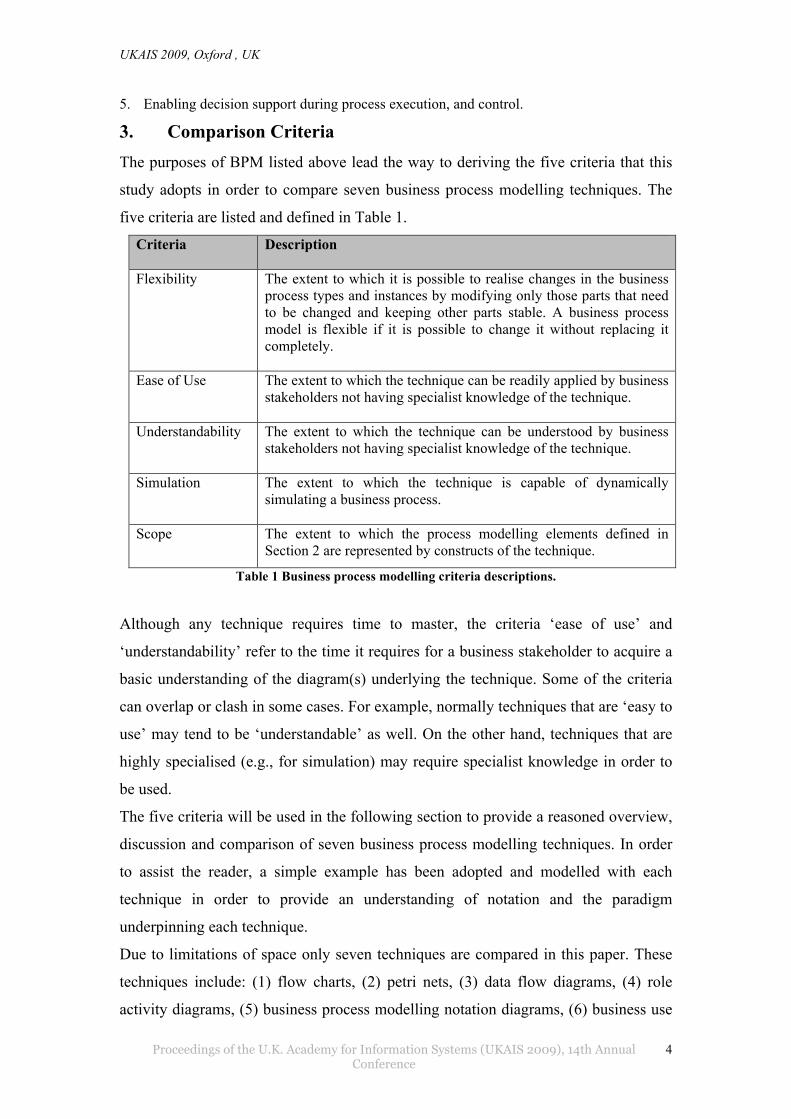
3. Comparison Criteria The purposes of BPM listed above lead the way to deriving the five criteria that this
study adopts in order to compare seven business process modelling techniques. The
five criteria are listed and defined in Table 1.
Criteria Description
Flexibility The extent to which it is possible to realise changes in the business process types and instances by modifying only those parts that need to be changed and keeping other parts stable. A business process model is flexible if it is possible to change it without replacing it completely.
Ease of Use The extent to which the technique can be readily applied by business stakeholders not having specialist knowledge of the technique.
Understandability The extent to which the technique can be understood by business stakeholders not having specialist knowledge of the technique.
Simulation The extent to which the technique is capable of dynamically simulating a business process.
Scope The extent to which the process modelling elements defined in Section 2 are represented by constructs of the technique.
Table 1 Business process modelling criteria descriptions.
Although any technique requires time to master, the criteria ‘ease of use’ and
‘understandability’ refer to the time it requires for a business stakeholder to acquire a
basic understanding of the diagram(s) underlying the technique. Some of the criteria
can overlap or clash in some cases. For example, normally techniques that are ‘easy to
use’ may tend to be ‘understandable’ as well. On the other hand, techniques that are
highly specialised (e.g., for simulation) may require specialist knowledge in order to
be used.
The five criteria will be used in the following section to provide a reasoned overview,
discussion and comparison of seven business process modelling techniques. In order
to assist the reader, a simple example has been adopted and modelled with each
technique in order to provide an understanding of notation and the paradigm
underpinning each technique.
Due to limitations of space only seven techniques are compared in this paper. These
techniques include: (1) flow charts, (2) petri nets, (3) data flow diagrams, (4) role
activity diagrams, (5) business process modelling notation diagrams, (6) business use
UKAIS 2009, Oxford , UK
Proceedings of the U.K. Academy for Information Systems (UKAIS 2009), 14th Annual Conference
5
cases and (7) business object interaction diagrams. The selection was based on: the
intention of demonstrating differences in techniques that adopt a similar modelling
paradigm (such as (1), (2) and (5)) as well as being able to contrast techniques that
adopt different paradigms (such as (5), (6) and (7)).
4. Comparative Analysis In the subsections that follow a course registration business process is used as a
scenario to exemplify the different types of notation as well as the underlying
paradigm of each technique.
The course registration scenario refers to the typical enrolment process to courses of
an academic institution. Upon request new students receive enrolment instructions and
application about the university, while continuing students receive instructions
informing them how to re-enrol. The new student sends in an application form
containing their personal details and their desired course. After receiving the student
application, the enrolment officer checks the academic requirements with academic
staff and then informs students of the results (approve or reject). For an approved
application the university confirms the enrolment by sending a confirmation letter to
the student stating that s/he is registered on the course and provides the student with
an identity card.
4.1 Flow Chart
A flow chart is a graphical representation that shows the flow of control throughout a
process by providing a step-by-step illustration of what occurs given a specific
situation. Although flow charts are renown for modelling control flow in software
systems, they also represent nonetheless the most basic type of diagram for
communicating business process flows (Aguilar-Savén, 2004). Flow charts are used
predominantly in software engineering, but their simplicity and ease of use have
enabled managers and business owners to adopt this technique for organisational
purposes as well.
• Flexibility: Flow charts are relatively simple to update; the graphical representation of a
process with a flow chart can quickly help identify bottlenecks or inefficiencies where the
process can be streamlined or improved (Aguilar-Savén, 2004). Flow charts are quite
simple diagrams – in terms of what they model – and they can be considered to be easily
modifiable since they are a few modelling elements that the modeller needs to mentally
UKAIS 2009, Oxford , UK
Proceedings of the U.K. Academy for Information Systems (UKAIS 2009), 14th Annual Conference
6
cope with. On the other hand, flow charts do not possess a sophisticated mechanism for
modularising or packaging diagrams; hence invoking other processes from flow charts can
be problematic.
• Ease of Use: Due to the limited set of symbols, flow charts, compared to other techniques,
are relatively easy to learn and the technique is relatively easy to use by inexperienced
stakeholders (Aguilar-Savén, 2004).
• Understandability: Given their simplicity, flow charts are frequently used for
communication and in discussions between analysts and stakeholders (Giaglis, 2001;
Aguilar-Savén, 2004); also the notation is easy to understand because of the clear
semantics of the constructs represented. The best way to stay agile when working with
flow charts is to keep things simple. The value often is not in the models that have been
created, but instead it is in the act of modelling because it helps to think things through.
• Simulation: There are many commercial simulation tools that adopt flow charts as the
underlying technique (for example, iGrafx). Such tools that can be used to build active
flow charts, whereby users can construct process models that provide an indication of the
appropriate action to perform in order to ultimately execute the model (Damji, 2007).
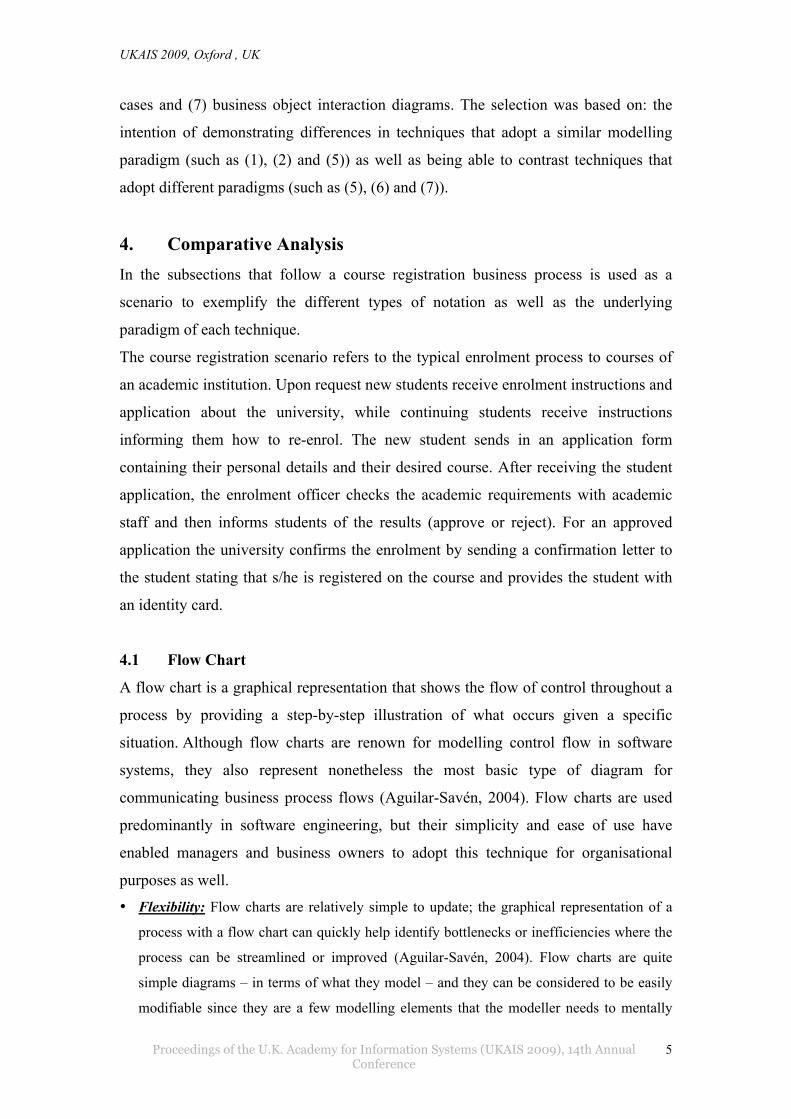
• Scope: The modelling elements of a flow chart are start and end, activity, input and
output, decision and process (see the example in Figure 1). The terminus symbol is used in
flowcharting to designate the beginning and the end. An activity is represented by a
rectangle. An arrow connects one activity to another, showing the process flow. A decision
(represented by a diamond-shaped symbol) specifies alternative paths based on some
boolean expression. Therefore, flow chart can be used as a technique to model processes,
and those process steps correspond to the activities of a particular situation, which will
support the goal for which this technique aims to represent. On the other hand the
technique does not have the means to explicitly represent services, events and rules.
UKAIS 2009, Oxford , UK
Proceedings of the U.K. Academy for Information Systems (UKAIS 2009), 14th Annual Conference
7
Figure 1. Course Registration scenario modelled in Flow chart.
4.2 Petri Net
A petri net is a mathematical/graphical representation that is appropriate for modelling
systems with concurrency. It combines “visual representation using standard notation
with an underlying mathematical representation” (Vergidis et al., 2008). Petri nets
originate from Carl Adam Petri’s doctoral thesis (1962), which introduced a new
model of information flow in systems. Nowadays, Petri nets are used for modelling
computer software, hardware, control flow and business processes. The technique was
developed originally for systems engineering (List and Korherr, 2006).
• Flexibility: As Petri Nets are both a graphical notation and a precise mathematical
notation; it is suitable for the analysis and reengineering of business process models. Petri
Nets’ mathematical representation makes the analysis and the refinement of BPM easier
(Vergidis et al., 2008). Thanks to this formal basis (graphical and mathematical) it is
possible to use them to analyse and amend the models of a given process without losing
the model identity.
• Ease of Use: Due to such a small number of modelling elements, Petri Nets have limited
explicit expressivity in relation to the elements that constitute a business process.
Numbers of extensions have been made to deal with the drawbacks of Petri Nets, but Petri
Nets are still considered a non user-oriented technique, which makes it difficult for
inexperienced stakeholders to adopt this technique for BPM.
• Understandability: Petri Nets use very few different types of elements to construct a
model which according Desel and Juhas (2001) “is a good basis for an easy
understandability of a model and for the learnability of the language”. These few
elements make it easy to guarantee a rough understanding of any Petri Net model without
additional legend. On the other hand, although the underlying logic of the technique is
quite intuitive, its application to modelling complex business processes can require a
certain level of expertise.
• Simulation: According to Desel and Juhas (2001) Petri Nets support the construction of
simulation models. Petri Nets have been used for transforming static process models into
dynamic simulation models. This enables even the inexperienced user to see directly how
the processes are executed and what might go wrong when the model is constructed
incorrectly. (Gottschalk et al., 2007) There are many simulation applications based on
Petri Nets. PNS is an example of such a tool (Shukla and Robbi, 1991).
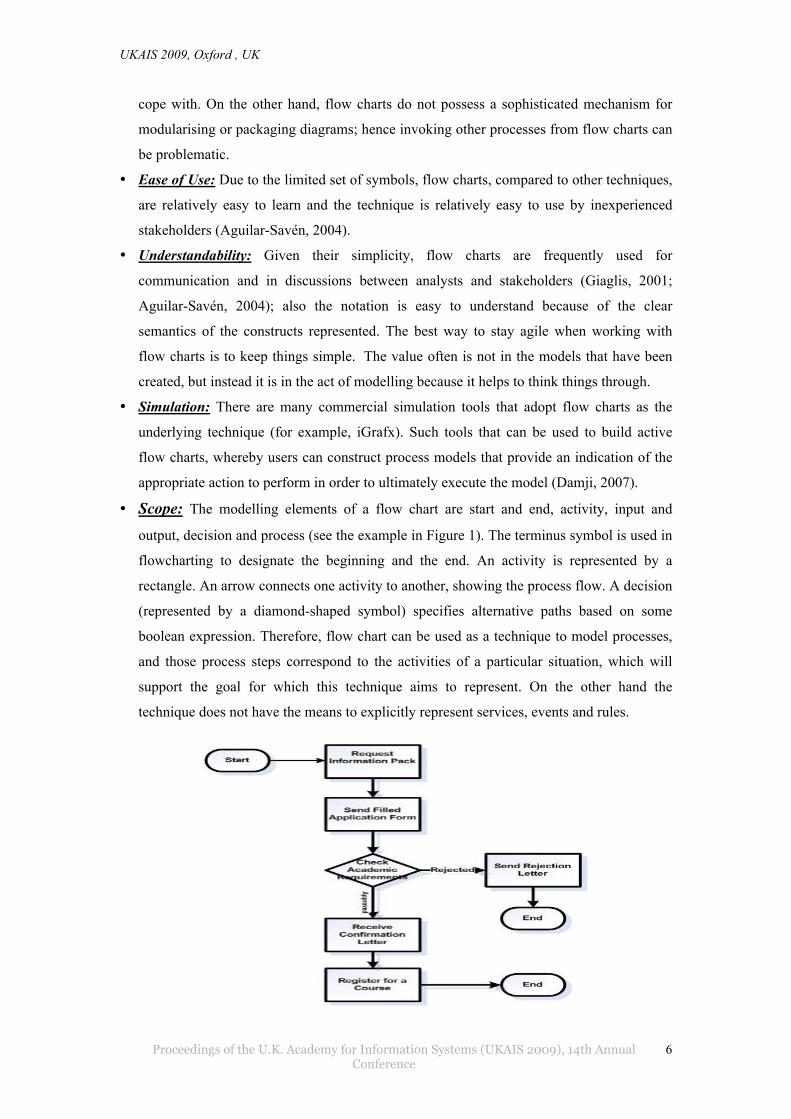
• Scope: The graphical and mathematical representation of Petri Nets allows the
representation of a process. The flow of activities can be represented with place nodes,
transition nodes and arcs connecting places with transitions (see Figure 2 as an example).
UKAIS 2009, Oxford , UK
Proceedings of the U.K. Academy for Information Systems (UKAIS 2009), 14th Annual Conference
8
The concepts of service, goal and role are not explicitly supported, while events are
represented by the transitions and rules can be modelled via guard conditions on the
transitions themselves.
Figure 2. Basic notation of a Petri Net.
4.3 Data flow diagram (DFD)
A DFD is a graphical representation that is appropriate to show system functionality,
with its underlying processes and flow of data (as the name suggests) (Lee and
Wyner, 2003). It is a well-accepted structured technique to be used for modelling
system analysis and design specifications ((Kendall and Kendall, 1995), (Luo and
Tung, 1999)). The functional decomposition of DFDs enables multiple levels of
representation by creating child diagrams for each activity (Luo and Tung, 1999).
DFDs were first used in this field as an approach for studying systems analysis and
design in software engineering (List and Korherr, 2006).
• Flexibility: DFDs can be a powerful technique to be used in the redesign of business
processes. The multiple levels of representation (functional decomposition) achieved by
creating child diagrams for each activity can facilitate changes and system improvement
(Luo and Tung, 1999). Functional decomposition enables each process to be subdivided
into subprocesses, which can be further subdivided. Thanks to functional decomposition,
child diagrams can modularise the representation of the process hence increasing the level
of flexibility of the technique.
• Easy of Use: DFD is an easy to use technique (Shen et al., 2004), due to the small number
of elements required in order to construct a model (Carnaghan, 2007). Also, the
expressivity of the modelling elements facilitates the construction of a DFD model for
inexperienced users. In that respect, DFDs are comparable to Petri Nets, both consist of
small number of notations to construct the BPM, but DFDs differing from Petri Nets in
their level of semantic richness.
• Understandability: DFD is easy to understand both conceptually and in presentation.
There are two reasons for this. First, due to the functional decomposition of DFDs, the
diagrams can present both more abstract and more detailed representations of the same
process, and allowing these representations to relate to one another (Carnaghan, 2007).
Second, DFDs are intended to be used for communication and in discussions between
UKAIS 2009, Oxford , UK
Proceedings of the U.K. Academy for Information Systems (UKAIS 2009), 14th Annual Conference
9
analysts or modellers and users, as they are simple, can be easily understood and
comprehend, and are easy to draw, improve and amend ((Aguilar-Savén, 2004), (Damij,
2007)).
• Simulation: DFD is not a technique that can easily support simulation, but instead a
technique for the static modelling of business processes.
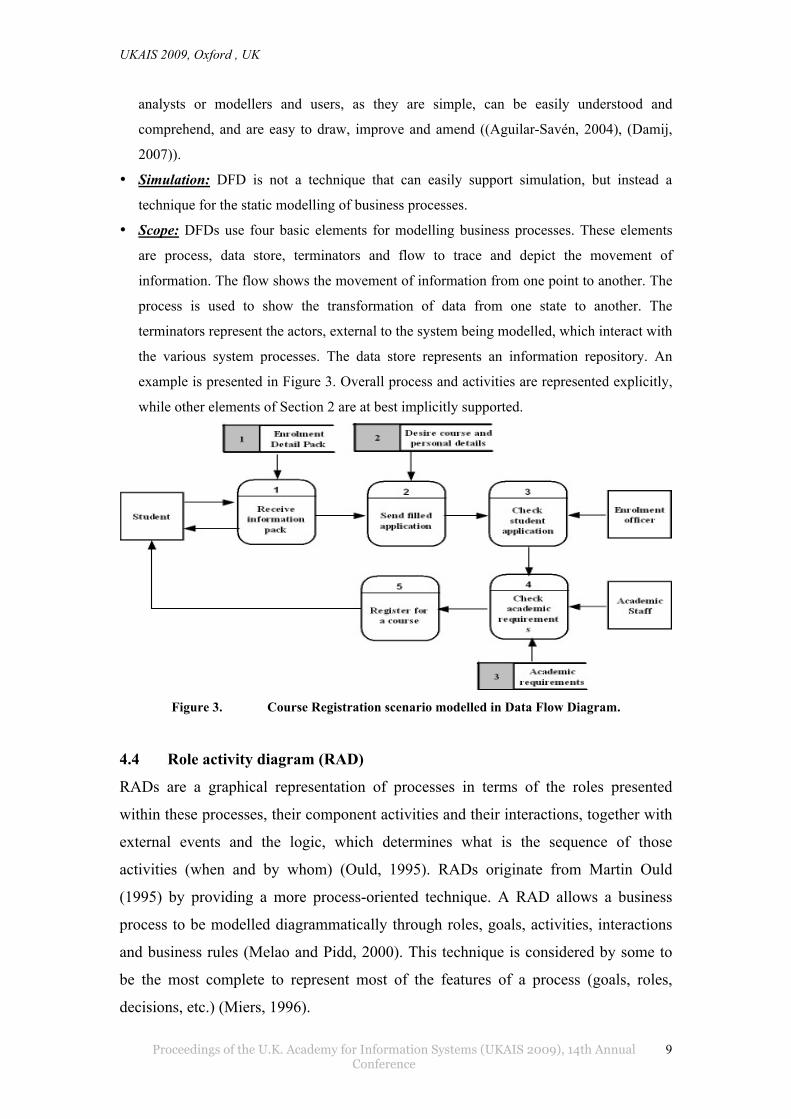
• Scope: DFDs use four basic elements for modelling business processes. These elements
are process, data store, terminators and flow to trace and depict the movement of
information. The flow shows the movement of information from one point to another. The
process is used to show the transformation of data from one state to another. The
terminators represent the actors, external to the system being modelled, which interact with
the various system processes. The data store represents an information repository. An
example is presented in Figure 3. Overall process and activities are represented explicitly,
while other elements of Section 2 are at best implicitly supported.
Figure 3. Course Registration scenario modelled in Data Flow Diagram.
4.4 Role activity diagram (RAD)
RADs are a graphical representation of processes in terms of the roles presented
within these processes, their component activities and their interactions, together with
external events and the logic, which determines what is the sequence of those
activities (when and by whom) (Ould, 1995). RADs originate from Martin Ould
(1995) by providing a more process-oriented technique. A RAD allows a business
process to be modelled diagrammatically through roles, goals, activities, interactions
and business rules (Melao and Pidd, 2000). This technique is considered by some to
be the most complete to represent most of the features of a process (goals, roles,
decisions, etc.) (Miers, 1996).
UKAIS 2009, Oxford , UK
Proceedings of the U.K. Academy for Information Systems (UKAIS 2009), 14th Annual Conference
10
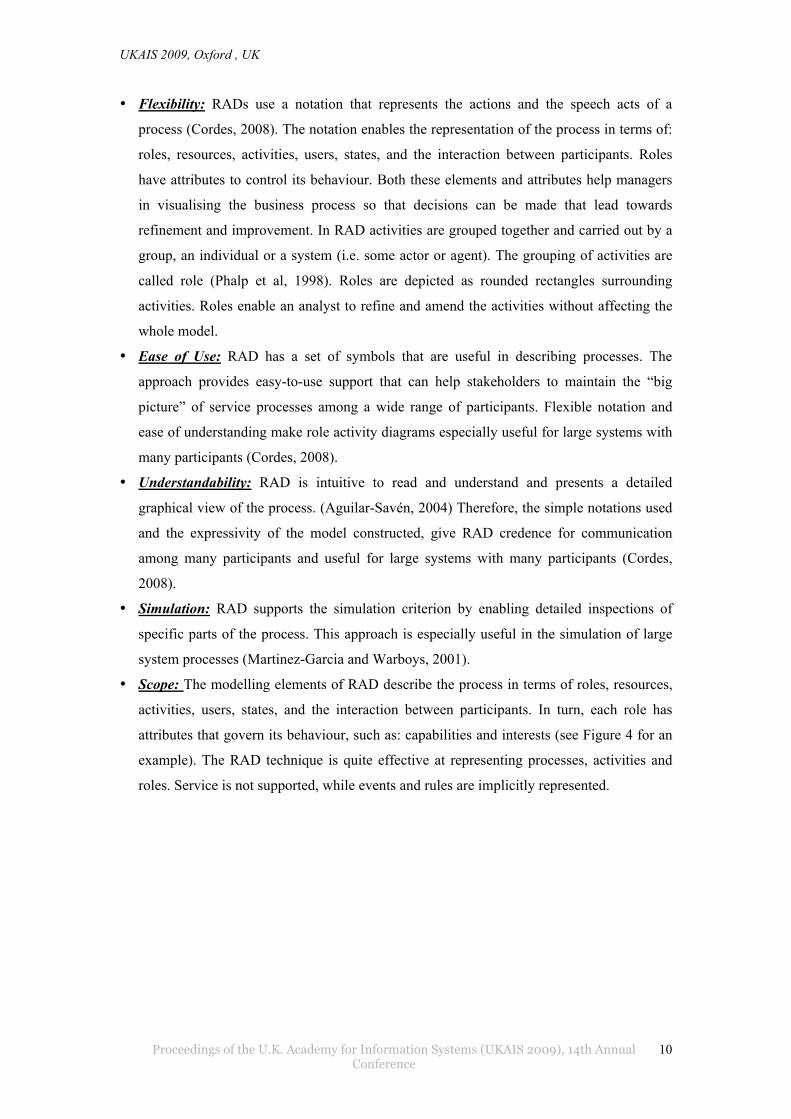
• Flexibility: RADs use a notation that represents the actions and the speech acts of a
process (Cordes, 2008). The notation enables the representation of the process in terms of:
roles, resources, activities, users, states, and the interaction between participants. Roles
have attributes to control its behaviour. Both these elements and attributes help managers
in visualising the business process so that decisions can be made that lead towards
refinement and improvement. In RAD activities are grouped together and carried out by a
group, an individual or a system (i.e. some actor or agent). The grouping of activities are
called role (Phalp et al, 1998). Roles are depicted as rounded rectangles surrounding
activities. Roles enable an analyst to refine and amend the activities without affecting the
whole model.
• Ease of Use: RAD has a set of symbols that are useful in describing processes. The
approach provides easy-to-use support that can help stakeholders to maintain the “big
picture” of service processes among a wide range of participants. Flexible notation and
ease of understanding make role activity diagrams especially useful for large systems with
many participants (Cordes, 2008).
• Understandability: RAD is intuitive to read and understand and presents a detailed
graphical view of the process. (Aguilar-Savén, 2004) Therefore, the simple notations used
and the expressivity of the model constructed, give RAD credence for communication
among many participants and useful for large systems with many participants (Cordes,
2008).
• Simulation: RAD supports the simulation criterion by enabling detailed inspections of
specific parts of the process. This approach is especially useful in the simulation of large
system processes (Martinez-Garcia and Warboys, 2001).
• Scope: The modelling elements of RAD describe the process in terms of roles, resources,
activities, users, states, and the interaction between participants. In turn, each role has
attributes that govern its behaviour, such as: capabilities and interests (see Figure 4 for an
example). The RAD technique is quite effective at representing processes, activities and
roles. Service is not supported, while events and rules are implicitly represented.
UKAIS 2009, Oxford , UK
Proceedings of the U.K. Academy for Information Systems (UKAIS 2009), 14th Annual Conference
11
Figure 4. Course Registration scenario modelled in Role Activity Diagram.
4.5 Business Process Modelling Notation (BPMN)
BPMN is richer in semantic than the other modelling techniques. It presents one type
of model called Business Process Diagram (BPD). BPMN is based on flowcharting
techniques specialised for business processes (Havey, 2005). BPMN is a recent
addition to the existing set of Business Process Modelling Languages (BPML) and it
was developed by the Business Process Management Initiative (BPMI) which
released it in 2004.
• Flexibility: BPMN is a powerful technique to be used in the design of business processes;
it is a well-structured technique for modelling the different aspects of processes in an
organisation. BPMN allows the representation of extended models for each process. This
decomposition enables flexible changes or improvement of any process in the extended
model without affecting the original model.
• Ease of Use: BPMN has been developed with the primary goals of being easy to use and
readily understandable by business and technology users. BPMN is particularly rich in
having a wide range of different kinds of flow of control and sequences, which make
BPMN well defined and as result easy to use approach for inexperience stakeholders.
Although BPMN is a complex diagramming technique due to some of its very specialised
notation, it is not necessary to know all of the specialised notation in order to create a
complete and useful BPMN diagram. Hence both novice and experts can cope.
• Understandability: A key objective of BPMN is to model business processes in a way that
is easily understood by the business end users and analysts. (Zou and Pavlovski, 2008)
BPMN provides a notation that is readily understandable by all business users, starting
UKAIS 2009, Oxford , UK
Proceedings of the U.K. Academy for Information Systems (UKAIS 2009), 14th Annual Conference
12
from the business analysts who create the initial drafts, to the technical developers who are
responsible for implementing those processes, and finally, to the business people who will
manage and monitor the processes. (White, 2004) BPMN is targeted at users, vendors and
service providers that need to communicate business processes in a standard manner.
• Simulation: BPMN supports the construction of simulation models. Simulation
technology can add considerable value to BPMN. Due to the ability provided to test
processes and the ability to visualise them before they are implemented, adds considerably
to their understanding.
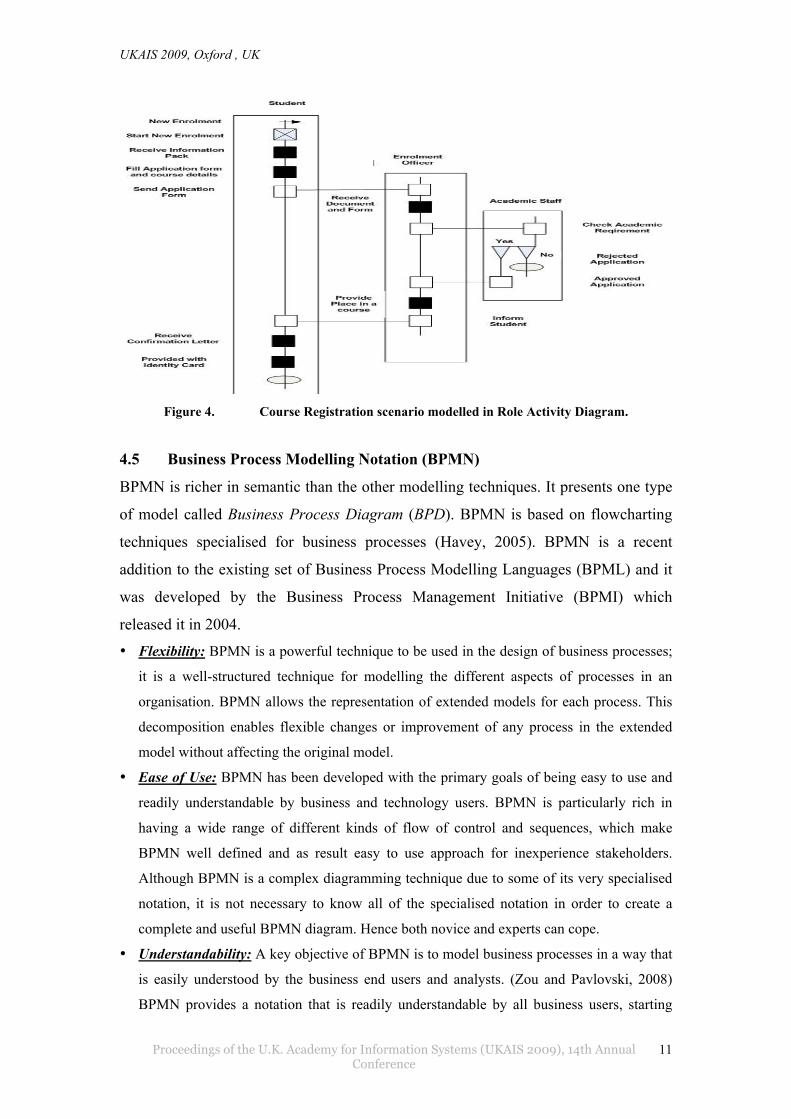
• Scope: The modelling elements of BPMN are categorised into flow objects, connecting
objects, swimlanes and artefacts (see Figure 5 for an example). BPMN supports all of the
business process modelling elements listed in Section 2.
Figure 5.Course Registration scenario modelled in BPMN.
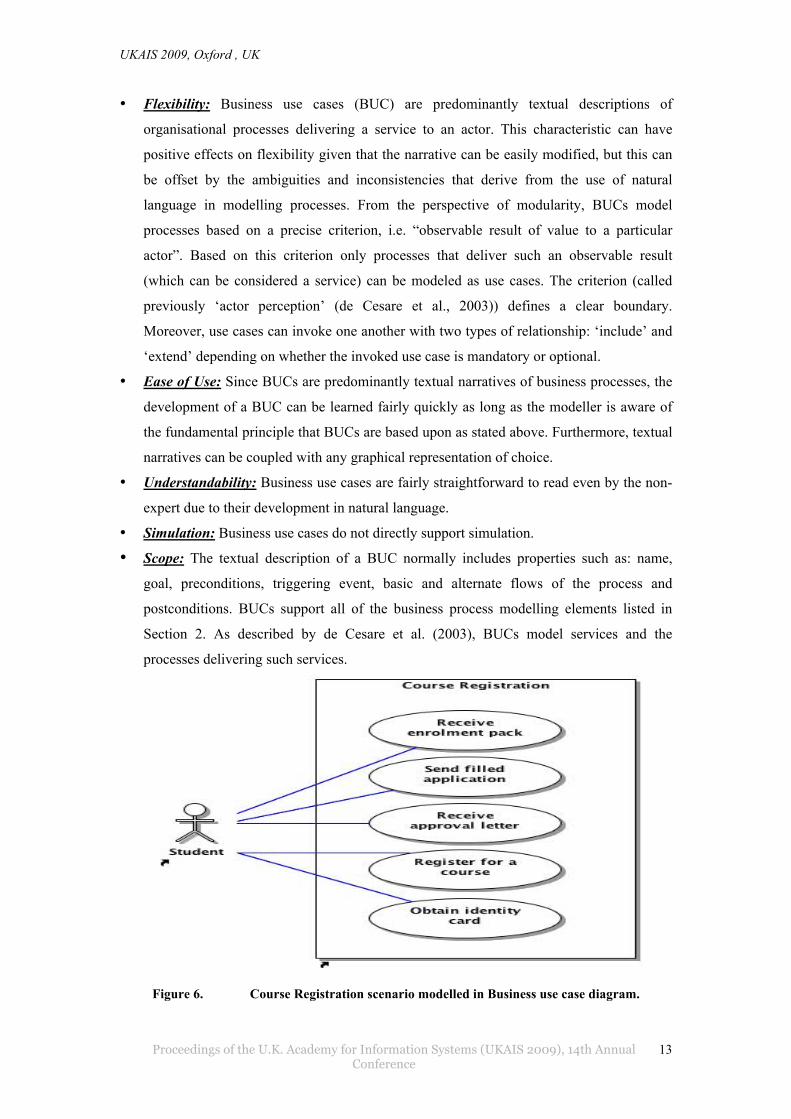
4.6 Business Use Cases
Use case modelling represents a technique that drives most present day object-
oriented development methods. In the Unified Process (Jacobson et al., 1999) use
cases are employed for both business and software modelling. A use case is “a
description of a set of sequence of actions, including variants, that a system performs
that yields an observable result of value to a particular actor” (Booch et al., 1999).
Consequently, a business use case is the description of organizational behaviour that
provides a service to an actor, with the functionality described in terms of a business
process (de Cesare et al., 2003). Figure 6 shows an example of a business use case
diagram normally used to provide an overview of a set of use cases of a business
system or subsystem.
UKAIS 2009, Oxford , UK
Proceedings of the U.K. Academy for Information Systems (UKAIS 2009), 14th Annual Conference
13
• Flexibility: Business use cases (BUC) are predominantly textual descriptions of
organisational processes delivering a service to an actor. This characteristic can have
positive effects on flexibility given that the narrative can be easily modified, but this can
be offset by the ambiguities and inconsistencies that derive from the use of natural
language in modelling processes. From the perspective of modularity, BUCs model
processes based on a precise criterion, i.e. “observable result of value to a particular
actor”. Based on this criterion only processes that deliver such an observable result
(which can be considered a service) can be modeled as use cases. The criterion (called
previously ‘actor perception’ (de Cesare et al., 2003)) defines a clear boundary.
Moreover, use cases can invoke one another with two types of relationship: ‘include’ and
‘extend’ depending on whether the invoked use case is mandatory or optional.
• Ease of Use: Since BUCs are predominantly textual narratives of business processes, the
development of a BUC can be learned fairly quickly as long as the modeller is aware of
the fundamental principle that BUCs are based upon as stated above. Furthermore, textual
narratives can be coupled with any graphical representation of choice.
• Understandability: Business use cases are fairly straightforward to read even by the non-
expert due to their development in natural language.
• Simulation: Business use cases do not directly support simulation.
• Scope: The textual description of a BUC normally includes properties such as: name,
goal, preconditions, triggering event, basic and alternate flows of the process and
postconditions. BUCs support all of the business process modelling elements listed in
Section 2. As described by de Cesare et al. (2003), BUCs model services and the
processes delivering such services.
Figure 6. Course Registration scenario modelled in Business use case diagram.
UKAIS 2009, Oxford , UK
Proceedings of the U.K. Academy for Information Systems (UKAIS 2009), 14th Annual Conference
14
4.7 Business Object Interaction Diagram
Although object-orientation is a paradigm conceived for and widely applied in
software engineering, there have been some attempts to introduce this paradigm into
the area of business modelling (Jacobson, 1995) and, in fact, the Unified Process
(Booch et al., 1999) does include among its business modelling techniques object
interaction diagrams to provide an object-oriented perspective to business use cases.
In the current version of the Unified Modelling Language (UML) two types of
interaction diagrams are included: communication and sequence diagrams. Figure 7
provides an example of a sequence diagram.
• Flexibility: With the introduction of ‘frames’ in UML 2.0 sequence diagrams can be
invoked by one another even through parameters, enabling different sequence diagrams to
focus on modelling the specific responsibilities of the corresponding use cases that they
realise. This achieves a certain level of modularisation and separation of concerns of
different organisational behaviour. These characteristics of modularity and focused
responsibility are present even at a finer grain level with the objects that form the core
elements of an interaction diagram.
• Ease of Use: Sequence diagrams are seldom applied in business modelling due to the
expertise required in mastering object-orientation when modelling business processes at
more detailed levels of abstraction.
• Understandability: Similar consideration can be made for understandability of sequence
diagrams. Even in this case some knowledge of object-orientation is required, however
given that the objects involved in business process modelling normally concern roles of
individuals or groups within an organisation, a novice in the technique would more likely
be able to more easily interpret a sequence diagram than produce one.
• Simulation: Simulation was originally the initial domain of application for objet-
orientation with the programming language Simula-67. As a consequence sequence
diagrams could theoretically be an ideal diagram type for running simulations of business
processes. The reality is that although modern UML CASE tools all have excellent
support for modelling sequence diagrams, simulation with this technique is not widely
supported. Some of these tools nowadays support simulation via BPMN diagrams (as
explained above), which represent processes in a way that is closer to the manner in
which business stakeholders view organisational processes.
• Scope: Since object interaction diagrams are used to realise use cases, the business
process modelling elements that are represented with BUCs can be represented with
sequence diagrams, but from an object-oriented perspective rather than a process/use case
perspective. For example, sequence diagrams do not strictly support the concepts of

UKAIS 2009, Oxford , UK
Proceedings of the U.K. Academy for Information Systems (UKAIS 2009), 14th Annual Conference
15
process and activity in the same way as BPMN and BUCs do. In object interaction
diagrams, processes would map to collaboration (between objects) and activities would
map to messages sent between objects.
Figure 7. Course Registration scenario modelled in Business Object Interaction Diagram (Sequence Diagram).
5. Conclusion and Future Work Organisations are constantly evolving. In order to understand and better manage
change, organisations develop models of their current and future business processes.
Due to the numerous business process modelling techniques that are available,
organisations, that seriously introduce business process modelling practices, need to
make informed decisions in relation to the representational technique(s) that are
eventually adopted; hence, the motivation for this study. In this paper seven business
process modelling techniques were compared according to five criteria: flexibility,
ease of use, understandability, simulation and scope.
The outcomes of this study are of particular interest to both academia and
organisations. Academia should be motivated to examine existing business process
modelling techniques in order understand the differences and similarities between
them. One area of application for such an evaluation is the possible mapping between
business process models represented according to different paradigms. Studies of this
kind would contribute to improve our understanding of the role of business modelling
UKAIS 2009, Oxford , UK
Proceedings of the U.K. Academy for Information Systems (UKAIS 2009), 14th Annual Conference
16
in model driven development and, more specifically of computational independent
models in the Object Management Group’s Model Driven Architecture initiative.
Such comparisons and evaluations can also feed into industry in which there is a
growing interest for business process modelling especially in relation to the emerging
service paradigm to systems development.
References Morgan, T. 2007, "Business Process Modelling and ORM", Lecture Notes in
Computer Science, vol. 4805, pp. 581. Luo, W. and Tung, Y.A. 1999, "A framework for selecting business process
modelling methods", Industrial Management and Data Systems, vol. 99, no. 7, pp. 312-319.
Ould, M.A. 1995, Business processes: modelling and analysis for re-engineering and improvement, Wiley.
Shen, H., Wall, B., Zaremba, M., Chen, Y. and Browne, J. (2004), “Integration of business modelling methods for enterprise information system analysis and user requirements gathering”, Computers in Industry, 54, 307–323.
Kettinger, W.J., Teng, J.T.C. and Guha, S. 1997, "Business Process Change: A Study of Methodologies, Techniques, and Tools", MIS Quarterly, vol. 21, no. 1, pp. 55-98.
Melao, N. and Pidd, M. 2000, "A conceptual framework for understanding business processes and business process modelling", Information Systems Journal, vol. 10, no. 2, pp. 105-129.
Giaglis, G.M. 2001, "A Taxonomy of Business Process Modelling and Information Systems Modelling Techniques", International Journal of Flexible Manufacturing Systems, vol. 13, no. 2, pp. 209-228.
Aguilar-Savén, R.S. 2004, "BPM: Review and framework", International Journal of Production Economics, vol. 90, no. 2, pp. 129-149.
Carnaghan, C. 2006, "BPMapproaches in the context of process level audit risk assessment: An analysis and comparison", International Journal of Accounting Information Systems, vol. 7, no. 2, pp. 170-204.
Ortiz-Hernández, J., Nieto-Ariza, E.M., Estrada-Esquivel, H., Rodríguez-Ortiz, G. and Montes-Rendon, A. 2007, "A theoretical evaluation for assessing the relevance of modelling techniques in business process modelling", Foundations of Software Engineering, pp. 102-107.
Vergidis, K., Tiwari, A. and Majeed, B. 2008, "Business Process Analysis and Optimization: Beyond Reengineering", IEEE Transactions on System Man and Cybernetics Part C Applications and Reviews, vol. 38, no. 1, pp. 69.
Mendling, J. 2008, Metrics for Process Models, Springer, Berlin Heidelberg. Jacobson, I., Ericsson, M. & Jacobson, A. 1995, The object advantage: business
process reengineering with object technology, Addison-Wesley, Wokingham. Hammer, M. and Champy, J. 2001, Reengineering the corporation: a manifesto for
business revolution, Rev. edition, Brealey, London. Davenport, T.H. 1993, Process Innovation: Reengineering Work Through Information
Technology, Harvard Business School Press, Boston, MA.

UKAIS 2009, Oxford , UK
Proceedings of the U.K. Academy for Information Systems (UKAIS 2009), 14th Annual Conference
17
Earl, M. 1994, "The New and Old of Business Process Redesign", Journal of Strategic Information Systems, vol. 3, no. 1, pp. 5-22.
Havey, M. 2005, Essential business process modelling, O'Reilly, Beijing, Cambridge. Eriksson, H. and Penker, M. 2000, Business modelling with UML: business patterns
at work, John Wiley & Sons, New York, Chichester. Caetano, A., Silva, A.R. and Tribolet, J. 2005, "Using roles and business objects to
model and understand business processes", Proceedings of the 2005 ACM symposium on Applied computing ACM, New York, NY, USA, pp. 1308.
Damji, N. 2007, "Business process modelling using diagrammatic and tabular techniques", Business Process Management Journal, vol. 13, no. 1, pp. 70-90.
Petri, C. 1962, Kommunikation mit Automaten. PhD thesis, University Bonn. List, B. and Korherr, B. 2006, "An evaluation of conceptual business process
modelling languages", Proceedings of the 2006 ACM symposium on Applied computing ACM New York, New York, USA, pp. 1532.
Desel, J. and Juhas, G. 2001, " What Is a Petri Net?" Informal Answers for the Informed Reader", Lecture Notes in Computer Science, pp. 1-25.
Gottschalk, F., van der Aalst, W.M.P., Jansen-Vullers, M.H. and Verbeek, H.M.W. 2008, "Protos2CPN: using colored Petri nets for configuring and testing business processes", International Journal on Software Tools for Technology Transfer (STTT), vol. 10, no. 1, pp. 95-110.
Shukla, A. and Robbi, A. 1991, "A Petri net simulation tool", Systems, Man, and Cybernetics, 1991.'Decision Aiding for Complex Systems, Conference Proceedings, 1991 IEEE International Conference on, pp. 361.
Lee, J. and Wyner, G.M. 2003, "Defining specialisation for dataflow diagrams", Information Systems, vol. 28, no. 6, pp. 651-671.
Kendall, K.E. and Kendall, J.E. 1995, Systems Analysis and Design, Prentice Hall, Upper Saddle River, NJ.
Miers, D. 1996, Business Process Engineering, C-T Colin, Kogan Page, London, UK. Cordes, S. 2008, "Process management for library multimedia development service",
Library Management, Emerald Limited, vol. 29, no. 3, pp. 185-198. Phalp, K.T., Henderson, P., Walters, R.J. and Abeysinghe, G. 1998, "RolEnact: role-
based enactable models of business processes", Information and Software Technology, vol. 40, no. 3, pp. 123-133.
Martinez-Garcia, A.I. and Warboys, B.C. 1998, "From RADs to DESs: a mapping from Process Models to Discrete Event Simulation", Proceedings of the Software Process Simulation Modelling (ProSim) Workshop.
Zou, J. and Pavlovski, C.J. 2008, "Control case approach to record and model non-functional requirements", Information Systems and E-Business Management, vol. 6, no. 1, pp. 49-67.
White, S.A. 2004, "Introduction to BPMN", IBM Cooperation. Jacobson, I., G. Booch, and J. Rumbaugh 1999, The Unified Software Development
Process. Upper Saddle River, New Jersey: Addison-Wesley. Booch, G., J. Rumbaugh, and I. Jacobson (1999) The Unified Modeling Language
User Guide: Addison-Wesley. de Cesare, S., Lycett, M., and Paul, R. 2003, Actor Perception in Business Use Case
Modelling. Communications of the AIS, 12, 223-241. Arlow, J. and Neustadt, I. 2002, UML and the Unified Process – Practical Object-
Oriented Analysis & Design, Pearson Education, Boston, MA. I. Jacobson 1992, Object-Oriented Software Engineering, Addison- Wesley, Physical
Verlag, 1998, pp. 45-57.