Embed Size (px)
Citation preview

A Comparative Analysis Of Applied Recycling
Collection Methods in Saint Paul
Presented by Eureka Recycling May 2002
for the Saint Paul Neighborhood Energy Consortium
for more information please visit: http://www.eurekarecycling.org

Executive Summary ....................................................................... 4
Overview .................................................................................................................................... 4 Recommended Changes...................................................................................................................... 4 Methodology ........................................................................................................................................ 5 Study Groups....................................................................................................................................... 6
Compiled Results for Tested Collection Methods .................................................................. 7 Table 1: Changes in Recycling Behavior - Tested Methods vs. Baseline Data ............................. 7 Table 2: Comparison of Program Elements of Tested Scenarios ................................................... 8 Information Supporting Recommendations ..................................................................................... 9
Summary.................................................................................................................................. 12
Full Report ................................................................................... 13
Overview .................................................................................................................................. 13 Partners.............................................................................................................................................. 13 Methodology ...................................................................................................................................... 14 Study Groups..................................................................................................................................... 14 Education Process ............................................................................................................................. 16 Hotline................................................................................................................................................ 17 What the Groups Tested .................................................................................................................. 18 Collecting Data .................................................................................................................................. 19
Compiled Results for Tested Collection Methods ................................................................ 20 Table 1: Changes in Recycling Behavior - Tested Methods vs. Baseline Data ........................... 21 Table 2: Comparison of Program Elements of Tested Scenarios .. Error! Bookmark not defined. Scenario A. Current System: Source-Separated (Impacts of Education Program) .................... 23 Scenario B: Two-Stream Commingled Bins (Bi-Weekly).............................................................. 24 Scenario C: Two-Stream Commingled Carts (Bi-Weekly) ........................................................... 25 Scenario D: Two-Stream Commingled Bins (Weekly) & Household Organics........................... 26 Scenario E: Single- Commingled Carts (Bi-Weekly) ..................................................................... 27
Study Results and Recommendations ................................................................................... 28
Residents Response ........................................................................................................................... 28 Information Supporting Recommendations ................................................................................... 29
PET & HDPE Plastic Bottles......................................................................................................... 29 Residential Mixed Paper (RMP) .................................................................................................... 29 Kitchen Organic Material .............................................................................................................. 30 Carts & Bins................................................................................................................................... 30 Weekly ............................................................................................................................................ 31 Education ....................................................................................................................................... 31 Residuals - What Really Gets Recycled.......................................................................................... 31
Recommended Changes.................................................................................................................... 32 City's Process for Change................................................................................................................. 33 Cost to residents ................................................................................................................................ 33
Summary.................................................................................................................................. 34 Presentations: .................................................................................................................................... 35
2

Appendices:APPENDIX A: Recycle Word Consulting Analysis
APPENDIX B: E4 Partners Survey Analysis
APPENDIX C: Residuals at Single Stream Facilities
APPENDIX D: Educational Materials Download a separate PDF of the educational materials at: www.eurekarecycling.org APPENDIX E: WMI Recommendations
APPENDIX F: Letter –NRG Processing Solutions
APPENDIX G: Letter- City of Saint Paul
3

A Comparative Analysis of Applied Recycling Collection Methods in Saint Paul
Executive Summary Overview Eureka Recycling, in partnership with the city of Saint Paul and the Minnesota Office of Environmental Assistance (MOEA), completed a study of curbside recycling collection methods in order to identify ways to improve the city of Saint Paul's curbside recycling program. According to the MOEA’s 2000 Solid Waste Policy Report, Waste Management in Minnesota: A Transition to the 21st Century, our waste generation will triple from the amount generated in 1995 to 2020 if Minnesotans stay on their current path. Even those that disagree with these projections do not disagree that waste generation is increasing each year - even with our recycling efforts. Ramsey County’s SCORE reports state that its citizens have achieved a recycling rate of about 40% of the waste generated but that increased waste reduction and curbside recycling is going to have to dramatically improve in order to keep up with the ever-increasing amounts of garbage. The recommended changes that Eureka Recycling proposes, as a result of the 14-month study just completed, aim to go beyond keeping up with the waste generated to further a recycling program that is more cost effective, more convenient and better protects the environment. Recommended Changes The results from data collected over the 14-month study have been evaluated to assess the environmental impacts, cost and convenience of each method. Our recommendation is made using these three indicators: • Environmental Impacts: Consider which collection method allows residents to
recycle the most materials while having the least amount of materials that have to be thrown out? (Contaminated and damaged materials have to be thrown out.) Consider the recycling collection method that gets the most recycled with the least pollution.
• Cost: Consider how much the different methods cost and how the cost of each impacts the residents’ choice.
• Convenience/Satisfaction: Consider why, how and what do people want to recycle and what would make them recycling more.
After measuring and analyzing the costs (combined collections and processing, less material revenues), convenience (measured through customer surveys and actual household participation levels) and environmental impacts (net recovery of materials that get to markets versus residuals) of the various collections the study concludes that:
4

In order to provide the greatest environmental benefits at a greater convenience and affordable costs to residents, Saint Paul’s recycling program should: • Move to a two-stream recycling sorting system: papers (including newspaper,
cardboard, paper and mail) and rigid containers (a mix of cans, glass and plastic bottles).
• Add PET (#1) & HDPE (#2) plastic bottles to curbside collection. • Provide 18-gallon recycling bins with weekly collection. Although recycling carts net
a greater diversion, the cost of the carts is a barrier to this method. Residents ranked this as a low funding priority. Blue bins that are collected weekly provide the same storage capacity as carts that are collected every other week.
• The study results clearly indicate that the greatest potential for diversion can be achieved through organics collection. Therefore, Saint Paul should aggressively work toward adding organics collection to its curbside program to significantly reduce Saint Paul’s waste generation
Organics collection should be further evaluated for transportation cost and residential acceptance issues. There is no doubt that big environmental savings are still being left in the trash. Eureka Recycling needs more information about the possibility of using transfer stations to reduce the cost of having to transport multiple loads to the nearest organics processor in Dakota County. Permits, regulations and other structures that inhibit this type of collection need to be analyzed by state, county and city regulators and changes should be made to streamline this collection alternative. Methodology The purpose of this project was to field test several different strategies for expanding the effectiveness of the existing program and for increasing the quantity of material diverted for recycling or composting. In order to provide objective and quantified data upon which to make sound decisions, rigorous study design procedures were implemented. First, a test area was designated in which to field test each of the strategies of approximately 200-400 households that, based upon prior experience, would produce statistically meaningful results (defined to be within +/-20% at the 90% significance level). Second, a nearby control area was designated that was demographically similar to the associated test area. The purpose of the control area was to be able to sift out any changes exogenous to the field test that affected the recycling characteristics of all of the residents of Saint Paul. That is to say, if the residents in the study area exhibited an increase in participation after the study started, but so did residents of the control area, then it was not assumed that the improvement in the study area was due to the study, but rather was caused by something else going on in the city. Only the difference between the test and control areas could be used in calculating the impacts of the test method. Third, the parameters were compared under examination in the test and control areas before and then after the change in collection strategy. This methodology is called a
5

before and after test with controls, and is well recognized as a way to develop solid field data. Study Groups Four neighborhoods (approximately 400 households each) tested new ways to sort and collect recyclable materials. Each household received a brochure that included a detailed description of the temporary recycling collection method and the collection dates. A fifth neighborhood, the control group, also received a brochure. This brochure explained the current program with their collection dates. The control group was monitored prior to the application of the education elements. The monitoring included the collection of set-out rates, participation rates and amounts of materials recycled. Staff canvassed all five neighborhoods and spoke to 83% of the residents in person. Shortly after the canvassing, appropriate recycling containers were delivered to their homes. This study was designed to measure the convenience, environmental impact and cost of five different recycling collection scenarios. Each scenario tested different parts of a recycling collection system, including education, the way materials are sorted, the types of containers (bins or carts) used by residents, frequency of pickup and the addition of new materials, like plastic bottles or household organics. Nearly 2000 households tested one of these scenarios for four months. Here is a snapshot of the five collection methods that were developed and tested:
1. Scenario A: Source-separated collection system. Residents sorted the materials at the curb into separate categories. Collection occurred bi-weekly.
2. Scenario B: Two-stream collection system using two 18-gallon blue bins. Residents sorted materials into two categories or streams: papers (including newspaper, cardboard, paper and mail) and containers (a mix of cans, glass and plastic bottles.) Collection occurred bi-weekly.
3. Scenario C: Two-stream collection, same as above, but using 35-gallon rolling carts to collect and set out their materials. Collection occurred bi-weekly.
4. Scenario D: Two-stream collection with 18-gallon blue bins and the collection of household organics (including food scraps and non-recyclable papers like pizza boxes and paper plates) in a 35-gallon rolling cart. In this neighborhood, recycling and household organics were collected every week.
5. Scenario E: Single-stream collection system using one large 60-gallon rolling cart to collect recyclables. Residents did not sort by stream. Materials were mixed together-cans, glass, plastic bottles and papers-and the entire separation took place at a recycling facility. Collection occurred bi-weekly.
Each study and control route had several data points that were established for tracking. They were as follows:
1. Each individual household, in each study and control route, was tracked each collection week as to whether or not they placed materials out for collection. Eureka Recycling staff drove through the study area just ahead of the collection
6

vehicle and recorded the information. This information was entered into a database to establish set-out rates for each collection week, as well as overall participation rates for each collection method.
2. Each truckload was weighed from each study and control route. The truckloads
were measured for percentages of paper and containers as well as overall weights. This information was entered into the database to determine average weight per set-out and for average weight per household.
3. Stratified load samples were sorted to determine material compositions. These
were compared between collection methods to determine impacts of collection methods on resident behavior.
Compiled Results for Tested Collection Methods The following table provides a view of the measured impacts of the tested collection methods when compared to their control routes. Included are the baseline numbers for the control route used for comparative purposes. Table 1: Changes in Recycling Behavior - Tested Methods vs. Baseline Data
Study Results Projected Set-Out Rate
Projected Participation Rate
% Increase in Materials Collected
% of Load Paper
% of Load Containers
Baseline Route Data 46% 71% 402 lbs./hh/yr.
85.16% 14.86%
A. Source-Separated 52% 75% 6.2% 84.72% 15.28% B. Two-Stream Bins (Bi-Weekly)
52% 75% 7.3% 82.25% 17.75%
C. Two-Stream Carts (Bi-Weekly)
58% 78% 32.8% 79.64% 20.36%
D. Two-Stream Bins (Weekly) 53% 78% 26.1% 82.55% 17.45% E. Single-Stream Carts (Bi-Weekly)
59% 76% 20.8% 76.50% 23.50%
This combination of field data collection, national information gathering and program participant surveys has provided a comprehensive evaluation and comparison of the costs of each tested collection method, the convenience of each method to the residents and the impact of that convenience on their participation, and the overall environmental impacts, or increase/decrease in materials getting to markets. Table 2 provides a comprehensive comparison of the various collection methods overall performance, combining the collection route performance measures with the cost and processing performance data that is provided in Appendix A.
7

Table 2: Comparison of Program Elements of Tested Scenarios A. Source-
Separated w/ Education
B. Two-Stream Commingled
C. Two-Stream Commingled
D. Two-Stream Commingled
D. Two-Stream Commingled & Organics
E. Single- Stream
Collection Schedule Bi-Weekly Bi-Weekly Bi-Weekly Weekly Weekly Bi-Weekly
Recycling Containers
18-Gallon Bins 18-Gallon Bins 2 - 35 gallon
Carts 18-Gallon Bins 18-Gallon Bins 35-Gallon Cart 64-Gallon Cart
% Increase in Tons Collected 6.2% 7.3% 32.8% 26.1% 91.6% 20.8%
City-Wide Materials Collected *
16,300 Ton/Yr 16,453 20,394 19,361 29,410 18,519
% Material Loss During Processing **
A 1%
B 1.6%
A 6.4%
B 10.9%
A 6.4%
B 11.6%
A 6.4%
B 10.8%
A 7.5%
B 11%
A 14.2%
B 27.2%
Net Program Material Recycled **
16,137
16,039
15,400
14,660
19,089
18,028
18,122
17,270
27,204
26,175
15,889
13,482
Net overall % Increase in Tons Recycled
5.1% 4.5% 0% -4.5% 24.4% 17.5% 18.1% 12.5% 77.2% 70.5% 3.5% -12.2%
Collection Costs / Ton $60 $50 $65 $59 $80 $51
Processing Costs / Ton $35 $50 $50 $50 $50 $30
(Rec) (Org) $60
Processing Revenue / Ton $50 $43 $44 $43 $43 $20 $33
Net Costs / Ton $45 $57 $71 $66 $88 $78
Customer Satisfaction*** N/A 80% 83% 76% 75% 87%
Willing to Pay for Change N/A 73% 63% 61% 54% 65%
* Excludes District 14 and Multifamily Program tonnages. ** Column “A” under “Material Loss During Processing” is the residual rate calculated without including mixed glass. Column “B” is the residual rate when including mixed glass as not being recycled. Eureka Recycling does not consider the use of mixed glass as an aggregate material or daily landfill cover as a recycled material. These residual rates are then applied to the total materials collected to calculate “Net Program Material Recycled” ***Percentage preference of the study method that group tested to the current source-separated program.
8
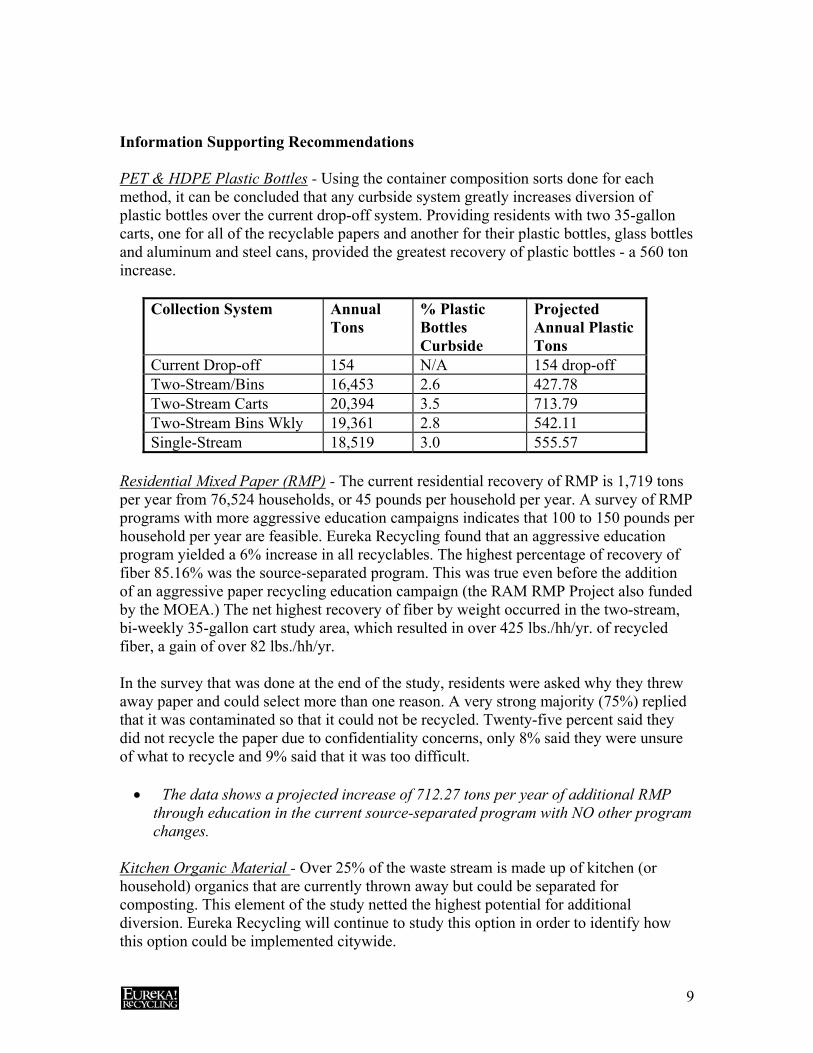
Information Supporting Recommendations PET & HDPE Plastic Bottles - Using the container composition sorts done for each method, it can be concluded that any curbside system greatly increases diversion of plastic bottles over the current drop-off system. Providing residents with two 35-gallon carts, one for all of the recyclable papers and another for their plastic bottles, glass bottles and aluminum and steel cans, provided the greatest recovery of plastic bottles - a 560 ton increase.
Collection System Annual Tons
% Plastic Bottles Curbside
Projected Annual Plastic Tons
Current Drop-off 154 N/A 154 drop-off Two-Stream/Bins 16,453 2.6 427.78 Two-Stream Carts 20,394 3.5 713.79 Two-Stream Bins Wkly 19,361 2.8 542.11 Single-Stream 18,519 3.0 555.57
Residential Mixed Paper (RMP) - The current residential recovery of RMP is 1,719 tons per year from 76,524 households, or 45 pounds per household per year. A survey of RMP programs with more aggressive education campaigns indicates that 100 to 150 pounds per household per year are feasible. Eureka Recycling found that an aggressive education program yielded a 6% increase in all recyclables. The highest percentage of recovery of fiber 85.16% was the source-separated program. This was true even before the addition of an aggressive paper recycling education campaign (the RAM RMP Project also funded by the MOEA.) The net highest recovery of fiber by weight occurred in the two-stream, bi-weekly 35-gallon cart study area, which resulted in over 425 lbs./hh/yr. of recycled fiber, a gain of over 82 lbs./hh/yr. In the survey that was done at the end of the study, residents were asked why they threw away paper and could select more than one reason. A very strong majority (75%) replied that it was contaminated so that it could not be recycled. Twenty-five percent said they did not recycle the paper due to confidentiality concerns, only 8% said they were unsure of what to recycle and 9% said that it was too difficult. • The data shows a projected increase of 712.27 tons per year of additional RMP
through education in the current source-separated program with NO other program changes.
Kitchen Organic Material - Over 25% of the waste stream is made up of kitchen (or household) organics that are currently thrown away but could be separated for composting. This element of the study netted the highest potential for additional diversion. Eureka Recycling will continue to study this option in order to identify how this option could be implemented citywide.
9

• The data shows a 254 lbs/hh/yr collection rate. Citywide this would increase diversion by 10,160 tons/yr, which is a 68% increase in tons diverted over the current curbside program.
Seventy-five percent of the residents who tested the method said that it was very valuable. Fifty-two percent said that they would pay for this service. Four percent preferred backyard composting and 12% used their sink disposal while 13% said they preferred to throw it in the trash. Forty-six percent of residents that tested this method noted that they preferred composting their organics because they had less trash - but only 20% said they did or could have reduced their garbage bill. NRG Processing Solutions reported no (negligible) contamination in the organic materials collected in the study. NRG Processing Solutions operators visually inspected all loads and all materials were accepted for composting. Because the volume of material was not sufficient for separate processing, it is not feasible to determine the specifications of those specific materials in the final product. NRG Processing Solutions maintains that the material met all of their specifications at the point of entry into the composting system.
Carts & Bins – Ninety-three percent of the residents either loved (29%), liked (41%) or thought the blue bins were okay (23%.) Over 80% of the residents that tested the carts preferred them and were willing to pay for them. Bins or carts - residents liked them. When asked specifically what they disliked about the carts less than half (47%) thought the carts were too big. • The data shows that the two-stream, bi-weekly 35-gallon cart recycling method
netted the highest diversion rates of all the tested methods-over a 32.8% increase from the baseline recycling program.
Weekly – Sixty-eight percent of the residents that tested weekly felt that it was just the right amount of service and 61% were willing to pay for this additional service. • The data shows that two-stream weekly collection in blue bins netted the second
highest diversion rate of all tested methods-over a 26% increase from the baseline recycling program.
Education - Residents liked all of the educational materials, but most preferred the information that was sent in the mail, followed by the information delivered to the door, the discussions with the staff and finally the hotline. With no other changes the control group recycled an additional 6% just due to increased awareness of the study and the educational materials. Residuals - What Really Gets Recycled - While all the methods showed promise as far as increasing what residents recycled, the way Eureka Recycling collects and then later processes (sorts) material effects what actually gets recycled. Eureka Recycling contacted the Government Advisory Associates, a consulting firm that specializes in recycling
10

industry research, to determine residuals rates at two-stream and single-stream facilities. Residuals consist of materials that are not accepted by the program but are picked up during collection, also known as out-throws (i.e. toys, #3-7 plastics, refuse), and recyclables that are too damaged or contaminated to be shipped to market and must be thrown away.
• Source Separated Collection - Currently Saint Paul’s program does not exceed a 1.6% residual rate.
• Two-Stream Collection – GAA research showed that two-stream programs average a 6.4% residual rate (based on a survey of 215 facilities nationwide).*
• Single-Stream programs average a 27.2% residual rate (based on a survey of 16 facilities nationwide).**
*This average was reported based upon the assumption that all glass collected was recycled back into glass. ** This average was reported based upon the assumption that no glass collected was recycled back into glass.
Glass is a significant part of the residual rate in both two-stream and single-stream programs. As stated earlier, residents were asked about their preference for managing glass. Overwhelmingly residents want the glass bottles and jars recycled back into bottles and jars. Eureka Recycling calls this the “highest and best use” and “closed loop recycling” where these materials can be recycled and remanufactured over and over again. Less than 1% of residents were willing to allow their glass to be used as a landfill cover. Table 3 below provides a comparison of the various methods of collection in two ways. Column A shows the average residual rates when the mixed-colored glass component of the recycling stream, after processing, is recognized as being recycled when used as an aggregate substitute or as daily landfill cover. This material is not made into glass bottles. Column B indicates the percentage of the glass in each collection method that, on average, ends up as mixed-colored glass. Column C shows the average percentage of glass of the total recyclable materials collected in each collection method. Column D provides the calculated residual rate if the mixed glass is not recognized as being recycled when used as landfill cover or aggregate.
TABLE 3 Impact of Strategy on Quality of Recyclables
A. Average
Residual Rates (excluding
Mixed Glass)
B.
Mixed Glass (% of all glass)*
C. Glass % of
Total Recyclable
Stream
D.
Total Residuals (%)¶
Truck Sort 1% 1% 12.2% 1.6% Two-Stream Bin 6.4% 41% 11.1% 10.9% Two-Stream Carts 6.4% 41% 12.6% 11.6% Two-Stream Weekly 6.4% 41% 10.7% 10.8% Single-Stream 14.2% 100% 13.0% 27.2% * Broken glass for truck sort is from Saint Paul experience; two-stream data is from WMI Saint Louis Park, MN facility; single-stream data is from Allied Wastes facility in Plano, TX. ¶ Residual data for truck sort is from Saint Paul experience; single-stream data is from GAA (see Appendix C).
11
Summary By carefully implementing important changes in what and how Saint Paul recycles, Eureka Recycling can control costs, improve convenience and divert, through composting and recycling, 74% of the discards that households generate. Organics collection needs to be analyzed in more detail since this is where the next greatest diversion can occur. There are still unanswered questions regarding the cost and method of collection but there is no doubt that residents are willing to sort the materials because of their commitment to the environment. The data that was gathered in this grant can and should be used by other communities in the metro area to ascertain the relative value of changing their current collection method. Although this project began with our baseline data, other communities should be able to begin with their baseline data and input the variables developed to create some projections for participation, diversion and net diversion after residuals. In particular, since communities are struggling with ways to maintain or increase their recycling rates, single-stream recycling has taken on significant interest and has resulted in many unanswered questions. Many communities move to this system without thorough analysis of its challenges and benefits in hopes of increasing residents’ convenience and thereby increasing recycling rates. It is important to note that in this study the single-stream method did not prove to be cost effective when compared to the other methods. Although single-stream, along with the bi-weekly two-stream bins scenario, resulted in the most inexpensive collection costs, the increased processing costs and decrease in revenues due to material loss made it the most expensive method when looking at the overall system. In addition, the net overall recovery (environmental benefit) in the single-stream method (i.e. materials reaching end markets) was less than every other tested method when subtracting the residuals from the collected amount. There is no single answer or one-size-fits-all solution to the leveling of recycling rates. Rather, it takes a recycling program tailored to meet each community’s values and needs to accomplish our recycling goals. Each community values different elements of their recycling program. In Saint Paul it is clear that the residents value the environment over convenience and then cost. Each community will interpret their data with an eye to their community’s overriding goals in resource management.
12

A Comparative Analysis of Applied Recycling Collection Methods in Saint Paul
Full Report Overview Eureka Recycling, in partnership with the city of Saint Paul and the Minnesota Office of Environmental Assistance (MOEA), completed a study of curbside recycling collection methods in order to identify ways to improve the city of Saint Paul's curbside recycling program. According to the MOEA’s 2000 Solid Waste Policy Report, Waste Management in Minnesota: A Transition to the 21st Century, our waste generation will triple from the amount generated in 1995 to 2020, if Minnesotans stay on their current path. Even those that disagree with these projections do not disagree that waste generation is increasing each year - even with our recycling efforts. Ramsey County’s SCORE reports state that its citizens have achieved a recycling rate of about 40% of the waste generated but that increased waste reduction and curbside recycling is going to have to dramatically improve in order to keep up with the ever-increasing amounts of garbage. The recommended changes that Eureka Recycling proposes, as a result of the 14-month study just completed, aim to go beyond keeping up with the waste generated to further a recycling program that is more cost effective, more convenient and better protects the environment. Partners Eureka Recycling was the lead organization for the collection study. It designed the various collection methods, developed the education program, worked with various community councils to select study areas, designed and conducted data collection mechanisms, and monitored resident satisfaction of the various collection methods. Eureka Recycling had three primary study partners, the City of Saint Paul's Public Works Department, Waste Management and NRG Processing Solutions, assisting in this project. The city of Saint Paul provided funds for special educational materials. Waste Management provided some of the additional collection and processing services, including specialized collection vehicles for some of the collection methods. NRG Processing Solutions, formerly known as SKB, contributed the processing and evaluation of the household organic materials that were collected. At their facility in Empire Township, NRG evaluated loads for processing and produced finished compost with the organics collected from the study.
13

Methodology The purpose of this project was to field test several different strategies for expanding the effectiveness of the existing program and for increasing the quantity of material diverted for recycling or composting. In order to provide objective and quantified data upon which to make sound decisions, rigorous study design procedures were implemented. First, a test area was designated in which to field test each of the strategies of approximately 200-400 households that, based upon prior experience, would produce statistically meaningful results (defined to be within +/-20% at the 90% significance level). Second, a nearby control area was designated that was demographically similar to the associated test area. The purpose of the control area was to be able to sift out any changes exogenous to the field test that affected the recycling characteristics of all of the residents of Saint Paul. That is to say, if the residents in the study area exhibited an increase in participation after the study started, but so did residents of the control area, then it was not assumed that the improvement in the study area was due to the study, but rather was caused by something else going on in the city. Only the difference between the test and control areas could be used in calculating the impacts of the test method. Third, the parameters were compared under examination in the test and control areas before and then after the change in collection strategy. This methodology is called a before and after test with controls, and is well recognized as a way to develop solid field data. Study Groups Four neighborhoods (approximately 400 households each) tested new ways to sort and collect recyclable materials. Each household received a brochure that included a detailed description of the temporary recycling collection method and the collection dates. A fifth neighborhood, the control group, also received a brochure. This brochure explained the current program with their collection dates. The control group was monitored prior to the application of the education elements. The monitoring included the collection of set-out rates, participation rates and amounts of materials recycled. Staff canvassed all five neighborhoods and spoke to 83% of the residents in person. Shortly after the canvassing, appropriate recycling containers were delivered to their homes. This study was designed to measure the convenience, environmental impact and cost of five different recycling collection scenarios. Each scenario tested different parts of a recycling collection system, including education, the way materials are sorted, the types of containers (bins or carts) used by residents, frequency of pickup and the addition of new materials, like plastic bottles or household organics. Nearly 2000 households tested one of these scenarios for four months.
14

The five tested scenarios can be categorized by the way materials were sorted at the curb. There are three primary ways that recyclable materials are sorted and collected at the curb: source-separated, two-stream and single-stream. Source-separated collection is the method currently used in Saint Paul. Source-separation means that residents sort the materials at the curb into separate categories. This means more work for residents, but the results are high quality materials that don’t need to be sorted at a recycling facility. For one of our five scenarios, Eureka Recycling collected data from a neighborhood participating in Saint Paul’s regular source-separated collection system, which does not include plastic bottles. This control group was monitored prior to the application of the education elements. The monitoring included the collection of set-out rates, participation rates and amounts of materials recycled.
Another way to collect materials is in two categories or streams: papers (including newspaper, cardboard, paper and mail) and containers (a mix of cans, glass and plastic bottles). This two-stream collection method means less sorting for residents, but requires a recycling facility where containers (cans, glass and plastic bottles) and papers (if desirable) are separated by machines
and people. Three of the study recycling scenarios tested a two-stream collection system. In one neighborhood, residents used their regular blue bins to sort recyclables into two categories, papers and containers, for collection every other week. Another neighborhood sorted the same way, but used 35-gallon rolling carts to collect and set out their materials every other week. The third neighborhood used blue bins for their recyclables, but also tested the collection of household organics (including food scraps and non-recyclable papers like pizza boxes and paper plates) in a rolling cart. In this neighborhood, recycling and household organics were collected every week. All three two-stream scenarios included the collection of plastic bottles in the container category. The final recycling scenario tested a single-stream collection system. Single-stream collection means residents mix all of their materials together - cans, glass, plastic bottles and papers - and all of the separation takes place at a recycling facility. This type of collection is easy for residents and allows haulers to use existing garbage trucks, but it raises questions regarding the quality of collected materials and the potential for more of the collected materials to be thrown away. For this study, one neighborhood tested a single-stream collection system and used large 64-gallon rolling carts to collect all the recyclables (including plastic bottles) mixed together. Collection occurred every other week. Over four months extensive data was collected describing how much was recycled, what was recycled and how often individual households participated. The goal of the tests was to identify ways to expand the existing program by increasing the amount of materials that residents put at the curb to recycle and by assuring that those materials get recycled. (See Data Collection Results for more details.)
15

Education Process (See Appendix D for a sample of the materials listed below) Focus groups were conducted to gauge resident’s response to the design theme used for the educational materials. The focus groups concluded that the STOP sign message and traffic light theme was attention grabbing and provided a wide range of applications. Students from Minneapolis Community Technical College, Eureka Recycling staff and other professional designers and printers were used to develop the educational materials. All of the educational materials and letters were created using post-consumer recycled content fiber and were printed with soy-based inks by a Minnesota Great Printer. Everything except the lawnsigns and the bin/cart labels were created with 100% post-consumer paper. A letter was sent to all households in the five study areas explaining that their household had been chosen to participate in Saint Paul’s recycling collection study. It alerted them that they would soon be asked to change the way they recycle and explained why it was important for them to participate in the study. It also explained that the new way of recycling would allow us to compare the cost, convenience and environmental impact of potential changes to the program. A brochure detailing the new sorting method and recycling containers (carts and/or bins) was sent to all residents in the study areas, including the control group. Each brochure explained what materials would and would not be picked up, how materials should be sorted and a calendar showing the recycling days in the study period. After participants received their brochure in the mail, Eureka Recycling staff went door-to-door to talk to participants about the study. The staff asked them to participate, explained the new sorting method and new materials and notified the resident when their new recycling containers would be delivered. The staff managed service issues by recording addresses of people who did not want to participate because they do not recycle, those who wanted to be a lawnsign volunteer, those who did not want a new recycling containers delivered, those who needed recycling pickup at their steps and those with other special needs. If, after two visits, no one was home at a particular residence, a notice was left on the doorknob. This notice alerted the resident that their new recycling containers would be delivered later that week and gave the number of the recycling hotline. Several days after the staff knocked on doors, new recycling containers were delivered to each household participating in the study. In some neighborhoods the Eureka Recycling staff who delivered the containers talked to residents who had not previously been home and delivered an extra brochure. Postcards were sent to participants several days before the first collection reminding them of the date the study was starting. And, several days before Labor Day, leaflets were distributed door-to-door reminding residents of a change in their schedule due to the holiday.
16

Approximately halfway through the recycling study, residents were mailed a reminder about how to correctly recycle plastic bottles at the curb. Residents testing the collection of organic materials were also given more detail about recycling all of their organic materials and non-recyclable papers. Residents participating in the source-separated part of the study were given a guide to recycling paper, a magnet and 3 brown paper bags to help them increase the amount of paper they set at the curb.
Prior to the last collection day, postcards were mailed to residents reminding them that the study was ending and that they would need to return to the regular source-separated program. On the last collection day, leaflets were distributed door-to-door as a reminder that the recycling study was over and that the special recycling containers were picked up with resident’s materials on the last recycling day in the study period. Residents who did not set out their containers for pickup on their last
recycling day were mailed a postcard, which requested they set out their containers empty on their first recycling day after the study was over. Residents in the control group did not receive a notice that the study was ending since they did not change from Saint Paul’s regular recycling program. Hotline Throughout the study, Eureka Recycling highly publicized its longstanding hotline number to residents participating in the study. The hotline, which is answered in Eureka Recycling’s communications room from 8 a.m. to 5 p.m. Monday through Friday, receives approximately 45,000 calls each year. In preparation for the collection study, the goals for the hotline staff were threefold. First, staffing levels were increased during the beginning months of the collection study to handle any initial confusion resulting from the changes in collection systems. Second, staff was cross-trained and primed for various calls about the logistics and issues involved in the collection study. Finally, extensive systems and procedures were created and utilized to track data and to ensure good customer service. Eureka Recycling hired additional staff for the summer to help with phones and increased staffing levels so that at least three people were always available to answer calls and help with residents’ questions. Before the study began, Eureka Recycling focused on training the staff about the logistics and issues involved in the collection study. Staff brainstormed possible questions that residents might ask and role-played scenarios to properly answer any tough issues or questions. Staff also compiled collection study phone manuals that included all of the information about the collection study, including: lists of participating addresses, schedules and timelines for different parts of the study, copies of all correspondence and printed educational materials, in-depth fact sheets and detailed question and answer samples to help phone staff handle recycling study calls. Up-to-date reports from the canvassing staff at the onset of the study allowed the staff to further anticipate calls and questions from residents. Throughout the study, Eureka Recycling emphasized systems and procedures to track and follow up with all collection
17

study calls. Eureka Recycling instituted several tracking forms and tracked all study calls by area and issue to help with everything from bin delivery at the beginning of the study to bin and cart removal at the end of the study. This organization allowed the staff to provide excellent customer service and to convey confidence to residents through knowledge of the collection study’s goals, methods and issues. When the study activities concluded, approximately 325 calls related to the study were logged. Considering that 2000 households participated in the study, Eureka Recycling contributed the relatively few calls to the success of the educational and outreach efforts at the beginning of the study. Most of these calls dealt with specific logistical questions about the study: cart/bin delivery and removal, questions about schedules and setting out materials, questions about plastics and organics and comments about residents’ experience with the study. What the Groups Tested In order to determine the best method all of the predominant possibilities were tested along with some newer and more progressive elements including the following: • Adding PET and HDPE plastic bottles in all but the control neighborhood. • Aggressively expanding education for recycling of residential paper in one
neighborhood (RAM Study has the results of this part of the project). • Including all household organic materials in a joint recyclable/organics collection in
one neighborhood. • Using different types of carts and bins for storing the recyclables in several
neighborhoods. • Changing the frequency of collection to a weekly frequency in one neighborhood. • Applying a comprehensive education campaign to all five neighborhoods. • Evaluating how the different methods affect what gets thrown away due to
contamination and damage during processing. Here is a snapshot of the five collection methods that were developed and tested: 1. Scenario A: Source-separated collection system. Residents sorted the materials at
the curb into separate categories. Collection occurred bi-weekly. 2. Scenario B: Two-stream collection system using two 18-gallon blue bins. Residents
sorted materials into two categories or streams: papers (including newspaper, cardboard, paper and mail) and containers (a mix of cans, glass and plastic bottles.) Collection occurred bi-weekly.
3. Scenario C: Two-stream collection, same as above, but using 35-gallon rolling carts to collect and set out their materials. Collection occurred bi-weekly.
4. Scenario D: Two-stream collection with 18-gallon blue bins and the collection of household organics (including food scraps and non-recyclable papers like pizza boxes and paper plates) in a 35-gallon rolling cart. In this neighborhood, recycling and household organics were collected every week.
5. Scenario E: Single-stream collection system using one large 60-gallon rolling cart to collect recyclables. Residents did not sort by stream. Materials were mixed together-cans, glass, plastic bottles and papers-and the entire separation took place at a recycling facility. Collection occurred bi-weekly.
18
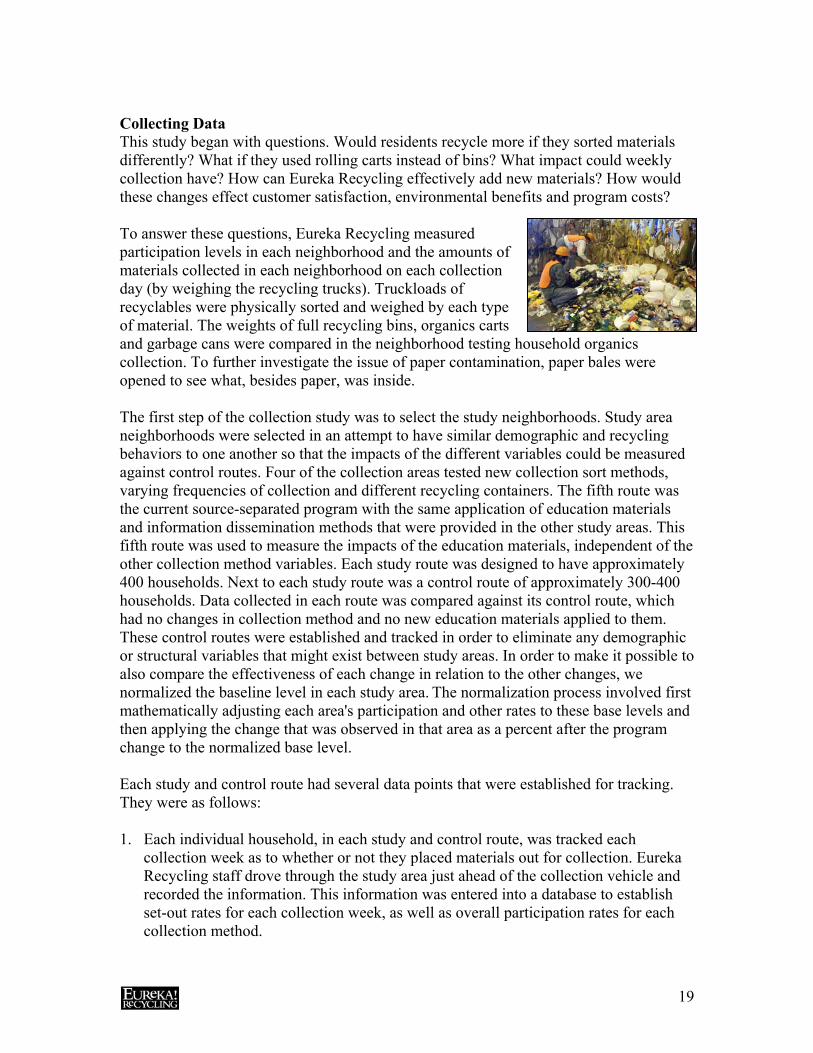
Collecting Data This study began with questions. Would residents recycle more if they sorted materials differently? What if they used rolling carts instead of bins? What impact could weekly collection have? How can Eureka Recycling effectively add new materials? How would these changes effect customer satisfaction, environmental benefits and program costs? To answer these questions, Eureka Recycling measured participation levels in each neighborhood and the amounts of materials collected in each neighborhood on each collection day (by weighing the recycling trucks). Truckloads of recyclables were physically sorted and weighed by each type of material. The weights of full recycling bins, organics carts and garbage cans were compared in the neighborhood testing household organics collection. To further investigate the issue of paper contamination, paper bales were opened to see what, besides paper, was inside. The first step of the collection study was to select the study neighborhoods. Study area neighborhoods were selected in an attempt to have similar demographic and recycling behaviors to one another so that the impacts of the different variables could be measured against control routes. Four of the collection areas tested new collection sort methods, varying frequencies of collection and different recycling containers. The fifth route was the current source-separated program with the same application of education materials and information dissemination methods that were provided in the other study areas. This fifth route was used to measure the impacts of the education materials, independent of the other collection method variables. Each study route was designed to have approximately 400 households. Next to each study route was a control route of approximately 300-400 households. Data collected in each route was compared against its control route, which had no changes in collection method and no new education materials applied to them. These control routes were established and tracked in order to eliminate any demographic or structural variables that might exist between study areas. In order to make it possible to also compare the effectiveness of each change in relation to the other changes, we normalized the baseline level in each study area. The normalization process involved first mathematically adjusting each area's participation and other rates to these base levels and then applying the change that was observed in that area as a percent after the program change to the normalized base level. Each study and control route had several data points that were established for tracking. They were as follows: 1. Each individual household, in each study and control route, was tracked each
collection week as to whether or not they placed materials out for collection. Eureka Recycling staff drove through the study area just ahead of the collection vehicle and recorded the information. This information was entered into a database to establish set-out rates for each collection week, as well as overall participation rates for each collection method.
19

2. Each truckload was weighed from each study and control route. The truckloads were
measured for percentages of paper and containers as well as overall weights. This information was entered into the database to determine average weight per set-out and for average weight per household.
3. Stratified load samples were sorted to determine material compositions. These were
compared between collection methods to determine impacts of collection methods on resident behavior.
For each collection method, Eureka Recycling staff tracked the quality of the materials collected. The amounts of non-recyclable garbage mixed in with recyclables and the amounts of recyclables damaged during collection and processing that were thrown away instead of recycled were measured and compared. To make these comparisons, discussions with recycling facility operators from across the country were held and collected materials were inspected.
Over the course of the study, the impact of the collection method on the composition of the materials recycled was measured. To collect this information each truck dumped a mixed sample of their materials. Each pile was sorted according to the type of material: aluminum, tin, glass, PET (#1) plastic, and HDPE (#2) plastic. Each material was weighed. The composition for each material was determined at the end of each
sort by dividing the weight of a given material by the weight of the total combined sample. The amount of non-recyclable material was sorted out and weighed in each sample to determine the percentage of out-throws. In addition, Eureka Recycling staff sorted through un-baled paper to determine the percentage of out-throws. From the single-stream area the composition of paper bales was established by opening bales and comparing the weight of fiber with the weight of any other materials in the bale. This was done in order to determine how much glass would end up in each bale as a percentage of the gross weight of the bale. In the neighborhood testing household organics, the weights of full recycling bins, organics carts and garbage cans were compared to determine the impact of organics collection on garbage weights and volumes. Compiled Results for Tested Collection Methods The following table provides a view of the measured impacts of the tested collection methods when compared to their control routes. Included are the baseline numbers for the control route used for comparative purposes.
20

Table 1: Changes in Recycling Behavior - Tested Methods vs. Baseline Data
Study Results Projected Set-Out Rate
Projected Participation
Rate
% Increase in Materials Collected
% of Load Paper
% of Load Containers
Baseline Route Data 46% 71% 402 lbs./hh/yr. 85.16% 14.86% A. Source-Separated 52% 75% 6.2% 84.72% 15.28% B. Two-Stream Bins (Bi-Weekly) 52% 75% 7.3% 82.25% 17.75% C. Two-Stream Carts (Bi-Weekly) 58% 78% 32.8% 79.64% 20.36% D. Two-Stream Bins (Weekly) 53% 78% 26.1% 82.55% 17.45% E. Single-Stream Carts (Bi-Weekly) 59% 76% 20.8% 76.50% 23.50%
In addition to these quantitative and qualitative measures that were conducted on route and in the processing facility, RecycleWorlds Consulting gathered extensive information about other programs that are operating these various scenarios around the country. Since this collection study was not able to pilot state-of-the-art collection equipment, or to run the collected material through full-scale processing facilities, interviews and information searches were conducted to determine program costs and accurate performance standards for each collection method. Waste Management, the project partner responsible for the collection and processing of the materials throughout the study, also provided input and information for productivity estimates for each collection method, recommended collection vehicles for each collection method, and provided processing cost differentials for each sort method based on their experience in this study and their experience operating each of these methods elsewhere in the country. (See Appendix E) All of the study participants were sent surveys to determine resident impressions and preferences about the various collection methods. With a response rate of over 55%, very detailed and comprehensive information was gathered about resident satisfaction and preferences. According to e4 partners Inc, an independent consulting firm contracted to design the survey and compile the results, a survey response rate of 20% (which is 35% less than what was achieved in this survey) can be expected to provide statistically significant results with a confidence interval (at 90% confidence) of three to four percentage points. Where necessary, the survey report (Appendix B) identifies results that are not statistically significant at this level of confidence. This combination of field data collection, national information gathering and program participant surveys has provided a comprehensive evaluation and comparison of the costs of each tested collection method, the convenience of each method to the residents and the impact of that convenience on their participation, and the overall environmental impacts, or increase/decrease in materials getting to markets. Table 2 provides a comprehensive comparison of the various collection methods overall performance, combining the collection route performance measures with the cost and processing performance data that is provided in Appendix A.
21

Table 2: Comparison of Program Elements of Tested Scenarios A. Source-
Separated w/ Education
B. Two-Stream Commingled
C. Two-Stream Commingled
D. Two-Stream Commingled
D. Two-Stream Commingled & Organics
E. Single- Stream
Collection Schedule Bi-Weekly Bi-Weekly Bi-Weekly Weekly Weekly Bi-Weekly
Recycling Containers
18-Gallon Bins 18-Gallon Bins 2 - 35 gallon
Carts 18-Gallon Bins 18-Gallon Bins 35-Gallon Cart 64-Gallon Cart
% Increase in Tons Collected 6.2% 7.3% 32.8% 26.1% 91.6% 20.8%
City-Wide Materials Collected *
16,300 Ton/Yr 16,453 20,394 19,361 29,410 18,519
% Material Loss During Processing **
A 1%
B 1.6%
A 6.4%
B 10.9%
A 6.4%
B 11.6%
A 6.4%
B 10.8%
A 7.5%
B 11%
A 14.2%
B 27.2%
Net Program Material Recycled **
16,137
16,039
15,400
14,660
19,089
18,028
18,122
17,270
27,204
26,175
15,889
13,482
Net overall % Increase in Tons Recycled
5.1% 4.5% 0% -4.5% 24.4% 17.5% 18.1% 12.5% 77.2% 70.5% 3.5% -12.2%
Collection Costs / Ton $60 $50 $65 $59 $80 $51
Processing Costs / Ton $35 $50 $50 $50 $50 $30
(Rec) (Org) $60
Processing Revenue / Ton $50 $43 $44 $43 $43 $20 $33
Net Costs / Ton $45 $57 $71 $66 $88 $78
Customer Satisfaction*** N/A 80% 83% 76% 75% 87%
Willing to Pay for Change N/A 73% 63% 61% 54% 65%
* Excludes District 14 and Multifamily Program tonnages. ** Column “A” under “Material Loss During Processing” is the residual rate calculated without including mixed glass. Column “B” is the residual rate when including mixed glass as not being recycled. Eureka Recycling does not consider the use of mixed glass as an aggregate material or daily landfill cover as a recycled material. These residual rates are then applied to the total materials collected to calculate “Net Program Material Recycled” ***Percentage preference of the study method that group tested to the current source-separated program. Each of the study areas provided opportunities to gather information about each scenario’s variables and was compared to the control routes that were operating next to them. These impacts were then normalized to anticipate the impacts on the city as a whole, not just based on the neighborhood that participated in the study. Tables 1 and 2 project those impacts over the entire residential curbside collection program. The individual scenarios provided valuable information about the variables and their impacts on the amount of materials recovered through the collection and processing systems. The following section recaps the findings of each of the different scenarios.
22

Scenario A. Current System: Source-Separated (Impacts of Education Program)
Eureka Recycling provided each of the collection study areas with education materials that explained the new program. In addition to mailed materials, program staff visited each household in the study areas to explain the new collection method and to explain that new recycling collection containers would be delivered within the week to each household. In order to measure the impact of the education campaign, and to be able to identify that impact separately from the other variables in the collection study, Eureka Recycling provided the same education elements to the 400 households in Scenario A, where
nothing in their collection program was altered. Prior to receiving the education materials, these households were tracked for three months and data was collected as to how often they set out materials for collection. Also, the trucks collecting the material were weighed to determine the amount of material being collected per set-out and per household. The education materials and door-to-door canvassing was then applied to those households and their participation was tracked for another three months to determine what, if any change in their behavior would occur. The program continued to be a curbside sort of seven different materials by the residents. The program also continued to provide every other week collection service and, unlike the other study areas, plastic bottles were not added in this scenario. The education program provided a program recovery increase of 6.2%. As Table 4 in Appendix (A) indicates, the collection costs on a per ton basis are in the middle of all the collection methods. However, due to having the lowest residual rates (materials that do not reach end market, but instead must be sent to a landfill) the net program costs and net recovery of this system placed it as one of the least expensive methods tested.
A. Source-Separated w/
Education Collection Schedule Bi-Weekly Recycling Containers 18-Gallon Bins City-Wide Materials Collected (Ton/Yr) * 16,300
Material Loss during Processing**
A 1%
B 1.6%
Net Program Material Recovered (Ton/Yr)** 16137 16,039
Collection Costs / Ton $60 Processing Costs / Ton $35 Processing Revenue / Ton $50 Net Costs / Ton $45 Customer Satisfaction*** N/A
Currently, the only means for the collection of plastic bottles with the source-separated program is through a series of eight plastic bottle drop-off stations located around the city of Saint Paul. This current program costs Eureka Recycling approximately $275 per ton for the collection and processing of commingled plastic bottles.
23

Scenario B: Two-Stream Commingled Bins (Bi-Weekly)
Scenario B provided residents the opportunity to sort materials into two streams: one for paper materials and the other for rigid containers. Also, PET (#1) and HDPE (#2) plastic bottles were added to the program. Each household was provided with two 18-gallon blue bins for their recyclables, one for each stream. The residents continued to place their materials at the curb every other week. The increase in materials recovered at the curb increased 7.3%, slightly better than the source-separated program with education.
The cost for collecting the materials in this manner is the lowest of all of the collection methods tested. Processing costs for this stream of materials increased, as it requires more equipment and labor to separate the materials, but these cost increases would be offset by the increase in revenues that occurred due to changes in the composition of materials. However, after taking into account the increase in the residual rate that this method of collection creates, a net overall decrease in materials recovered is a distinct possibility when compared to the current source-separated program.
B. Two-Stream Commingled
Collection Schedule Bi-Weekly Recycling Containers 18-Gallon Bins City-Wide Materials Collected (Ton/Yr)* 16,453
Material Loss during Processing**
A 6.4%
B 10.9
Net Program Material Recovered (Ton/Yr)** 15,400 14,660
Collection Costs / Ton $50 Processing Costs / Ton $50 Processing Revenue / Ton $43 Net Costs / Ton $57 Customer Satisfaction*** 80%
The most important limitation to this collection method is the storage capacity provided by the blue bins. These bins provide approximately 36 gallons of storage capacity between collection days (every other week). When comparing this collection method with the other two-stream collection methods, there was significantly less of an increase in recovery, despite the same “convenience” of the sort method. This differential is largely attributable to the lack of suitable storage capacity. The two-stream weekly bins and bi-weekly cart methods provided almost double the storage capacity (36 gallons a week and 70 gallons every two weeks respectively). These study areas collected approximately 20-25% more material than Scenario B.
24

Scenario C: Two-Stream Commingled Carts (Bi-Weekly)
This collection model provided the largest increase in materials collected, with a 33% increase over the control route. Not only was there an increase in the overall number of households that participated (7%) above the baseline, the frequency that households set out materials at the curb increased by 12%. Scenario C provided the same sort type and level of service as Scenario B; however, residents were provided with two 35-gallon rolling carts rather than two 18-gallon blue bins. The resident survey provided information as to why residents increased
their participation in Scenario C. The reasons that residents sited the most for preferring this method were the increase in storage capacity, materials did not spill out, and it was easier to move materials to the curb. As Table 9 in Appendix (B) demonstrates, this group had the strongest preference to this level of sorting when compared to the other methods.
C. Two-Stream Commingled
Collection Schedule Bi-Weekly Recycling Containers 2 35-Gallon Carts City-Wide Materials Collected (Ton/Yr) * 20,394
Material Loss during Processing** a 6.4% b 11.6%
Net Program Material Recovered (Ton/Yr)** 19,089 18,028
Collection Costs / Ton $65 Processing Costs / Ton $50 Processing Revenue / Ton $44 Net Costs / Ton $71 Customer Satisfaction*** 83%
As Table 1 shows, both Scenarios C and E experienced significant shifts in the composition of the materials collected. There was a significant increase in the amount of rigid containers recycled due to the use of carts. When conducting load samples, Eureka Recycling found that there was a higher percentage of all containers, but particularly glass, when compared to the bin systems. This is mostly likely do to the ease of moving materials to the curb combined with the privacy that carts provide by having the closed lids. There were more alcoholic beverage containers in the cart scenarios than were seen in the bin systems. The concerns with this system are with the costs associated with providing and servicing of the carts. This collection method utilizes two carts per household, which increases the capital costs required for their purchase. The service time per stop is increased due to the additional time required to attach and tip the carts into the collection vehicle, which decreases the number of households that each vehicle and driver can service in a day.
25

Scenario D: Two-Stream Commingled Bins (Weekly) & Household Organics
Scenario D provided the opportunity to not only determine the overall impact of changing the frequency of collecting recyclable materials weekly, it also provided residents with the opportunity to recycle their household organic waste, which was then processed into compost. The organic material that was collected was transported to NRG Processing Solutions processing facility in Inver Grove Heights to be composted into a finished product for soil amendment. The recycling component of this method was identical to Scenario B, with the sole change of providing weekly instead of bi-weekly collection. The sorting requirement was the same, paper materials in one bin and rigid containers in the other, and the bins were the same size. PET (#1) and HDPE (#2) plastic bottles
were also added to the collection program. As Table 1 demonstrates, this method provided significant increases in the household participation when compared to the source-separated program’s 7% increase. Furthermore, when compared to their control routes, Scenario D yielded a 20% greater increase in the materials collected than Scenario B, which was identical except for the frequency of collection. This difference can again be attributed to a few important elements. This method effectively doubled the storage capacity of the households when compared to the bi-weekly source-separated and two-stream bin programs. It provided convenience in that residents did not have to keep track of collection days, and it was easier for residents to move materials to the curb since the amount of material generated was less on a weekly basis. Over 68% of the residents that responded to the survey indicated that they preferred weekly collection to bi-weekly collection. As shown in Table 4 of Appendix (A) the overall costs per ton for collection are within the mid-range of all of the collection methods when including the costs for the vehicles and drivers needed for weekly collection and the cost of the collection containers.
D. Two-Stream Commingled
D. Two-Stream Commingled & Organics
Collection Schedule Weekly Weekly
Recycling Containers 18-Gallon Bins 18-Gallon Bins
35-Gallon Cart City-Wide Materials Collected (Ton/Yr) *
19,361 29,410
Material Loss during Processing**
A 6.4%
B 10.8%
A 7.5%
B 11%
Net Program Material Recovered (Ton/Yr)**
18,122 17,270 27,204 26,175
Collection Costs / Ton $59 $80
Processing Costs / Ton $50 $50 $30
(Rec.) (Org) Processing Revenue / Ton $43 $43 $20
Net Costs / Ton $66 $88 Customer Satisfaction*** 76% 75%
The organics collection component of Scenario D demonstrated the potential impacts of a source-separated organics collection program on the overall reduction of the waste stream. Households were provided with a 35-gallon cart for the collection of the organics, as well as an in-home storage pail with a supply of biodegradable cornstarch bags.
26

Approximately 73% of the households in the study area participated in the study by setting out materials at the curb for collection, with 56% of the households in the study area setting materials at the curb for collection on an average week. The materials that could be collected in the organics study included items such as all food scraps (including meat, bones and dairy products), coffee grounds and filters, soiled and non-recyclable paper (such as pizza and freezer boxes, tissue paper and napkins, paper plates and cups, milk and juice cartons, and plastic and waxed paper products) and other items like vacuum cleaner bags, flowers, and fireplace ashes. The general composition of materials collected, by weight, was approximately 60% food and vegetative scraps and 40% other material, primarily non-recyclable paper. The recovery rate of organics that was captured in the study area was applied citywide to calculate the quantities recovered as shown in Table 2. Over 10,000 tons a year could be recovered through this program. During the study, approximately 10% of the households in the organics study area were tracked for a month to measure the impact of this collection method on each household’s waste stream. For four weeks, Eureka Recycling staff weighed materials at the curb prior to collection at each of the 44 households. The process consisted of weighing four different streams of material; paper (fibers), containers, household organics, and garbage. Table 13 in Appendix (A) demonstrates that an average of over 21% of the materials collected, by weight, at each household was organic material. Combined with the recyclables collected, almost 74% of the waste stream generated at these households was recovered. Scenario E: Single- Commingled Carts (Bi-Weekly)
Scenario E tested the collection of materials with the least sorting requirement for the residents. Each household in this study area was provided with one 64-gallon cart for the commingled collection of all recyclable materials. This study area also included the collection of PET (#1) and HDPE (#2) plastic bottles. This collection method measured the impacts of a simplified sorting system for the residents along with a different collection container. As with Scenario C, the residents were provided bi-weekly collection service but had approximately twice the storage capacity of
the source-separated and two-stream, bi-weekly bin programs.
E. Single- Stream
Collection Schedule Bi-Weekly Recycling Containers 64-Gallon Cart City-Wide Materials Collected * 18,519
% Material Loss During Processing **
A 14.2%
B 27.2%
Net Program Material Recycled ** 15,889 13,482
Collection Costs / Ton $51 Processing Costs / Ton $60 Processing Revenue / Ton $33 Net Costs / Ton $78 Customer Satisfaction*** 87%
As shown in Table 1, there was a 5% increase in overall participation in the program and a 21% increase in curbside recovery of materials. This method had the largest percentage increase (13%) in the set-out rate of households placing materials at the curb for collection. This method of collection also received the highest preference rating by the residents that used this system when compared to the existing source-separated program.
27

When comparing this collection method against the two-stream cart method tested in Scenario C, it becomes clear that the ease in sorting materials by placing materials into one container instead of two had no impact on the recovery of materials collected. Rather, the convenience of the storage capacity of the cart was the reason for the increase in the amount of materials that the households recycled. This is consistent with the findings in both Scenarios C and D. The program costs for this collection method, when compared to the other methods tested appear to be the highest when including all the elements of collection cost, processing costs, and the decrease in the material revenue. There are significant costs in using the collection carts, as well as processing cost increases due to additional equipment and labor required for the additional separation of material required. In addition, there is a significant loss in revenues due to the residuals that are not sold to market, but are disposed of at a cost. Study Results and Recommendations Residents Response Eureka Recycling was able to learn what residents preferred in two important ways: the data collected about residents’ behavior at the curb (what materials they recycled and how often they set out materials for recycling), which is detailed in Appendix A, and what the residents said in the survey, detailed in Appendix B. These two complimentary sets of data have helped Eureka Recycling better understand the needs and desires of Saint Paul residents. To complete gaps in information, similar programs were researched around the country, detailed in Appendix C. At the end of the study residents went back to the regular recycling program and were asked to fill out a survey that reported their views on the different methods. 1848 surveys were sent (one to each participant) with an overwhelming response of 1016 or 55%.
In some ways the results of the study are not surprising. People overwhelmingly want to recycle plastic bottles at the curb and are willing to pay for this service. What Eureka Recycling found interesting was what residents actually did at the curb. For example - when residents were offered the opportunity to recycle plastic bottles at the curb it was frequency (weekly recycling collection) OR the receptacle
(35-gallon carts) that most influenced how many plastic bottles (and other materials) they recycled. Specific results from the testing of adding materials, plastic bottles and organics, suggest a strong interest and potential for both materials but the storage and capacity conditions have to be right. Residents were asked to rank cost, convenience and environmental benefit as priorities for Eureka Recycling to consider when making program changes. In all study areas, environmental benefit was the first priority. Although cost is an important consideration,
28

it was overwhelmingly ranked third as a priority. When it comes to spending money on recycling program changes, two-thirds of participants listed curbside plastic bottle collection as the #1 funding priority. Approximately 80% of participants tested this method. The other priorities, reflected what the resident tested adding collection of organics, collecting materials weekly and then replacing blue bins with wheeled carts. Residents also indicated their preferences for how materials get recycled. When asked which handling methods they would accept for glass, 51% want glass to be recycled into new glass bottles and 20% will accept the use of glass as roadbed material. None of the respondents accept using glass collected for recycling as a landfill cover, a practice referred to as “recycling” by some waste processors. This recognition by the residents of “closed-loop” recycling played a key role in our recommendation. (See Appendix A, page 5 and Appendix B, page 10) When asked what type of collection method was preferred, residents in all study areas preferred the method they had tested, and were more willing to pay for that program. Adding plastic bottle collection was the only option that a majority of residents in all study areas agreed to pay for. This survey did not identify a preference for using bins or carts. Both cart-users and bin-users had high satisfaction with their containers. However, from residents’ feedback and behavior it was determined that carts-or weekly collection of bins-could significantly influence the amount of materials recycled. Information Supporting Recommendations PET & HDPE Plastic Bottles - Using the container composition sorts done for each method, it can be concluded that any curbside system greatly increases diversion of plastic bottles over the current drop-off system. Providing residents with two 35-gallon carts, one for all of the recyclable papers and another for their plastic bottles, glass bottles and aluminum and steel cans, provided the greatest recovery of plastic bottles - a 560 ton increase.
Collection System Annual Tons
% Plastic Bottles Curbside
Projected Annual Plastic Tons
Current Drop-off 154 N/A 154 drop-off Two-Stream/Bins 16,453 2.6 427.78 Two-Stream Carts 20,394 3.5 713.79 Two-Stream Bins Wkly 19,361 2.8 542.11 Single-Stream 18,519 3.0 555.57
Residential Mixed Paper (RMP) - The current residential recovery of RMP is 1,719 tons per year from 76,524 households, or 45 pounds per household per year. A survey of RMP programs with more aggressive education campaigns indicates that 100 to 150 pounds per household per year are feasible. Eureka Recycling found that an aggressive education program yielded a 6% increase in all recyclables. The highest percentage of recovery of fiber 85.16% was the source-separated program. This was true even before the addition
29

of an aggressive paper recycling education campaign (the RAM RMP Project also funded by the MOEA.) The net highest recovery of fiber by weight occurred in the two-stream, bi-weekly 35-gallon cart study area, which resulted in over 425 lbs./hh/yr. of recycled fiber, a gain of over 82 lbs./hh/yr. In the survey that was done at the end of the study, residents were asked why they threw away paper and could select more than one reason. A very strong majority (75%) replied that it was contaminated so that it could not be recycled. Twenty-five percent said they did not recycle the paper due to confidentiality concerns, only 8% said they were unsure of what to recycle and 9% said that it was too difficult. • The data shows a projected increase of 712.27 tons per year of additional RMP
through education in the current source-separated program with NO other program changes.
Kitchen Organic Material - Over 25% of the waste stream is made up of kitchen (or household) organics that are currently thrown away but could be separated for composting. This element of the study netted the highest potential for additional diversion. Eureka Recycling will continue to study this option in order to identify how this option could be implemented citywide. • The data shows a 254 lbs/hh/yr collection rate. Citywide this would increase
diversion by 10,160 tons/yr, which is a 68% increase in tons diverted over the current curbside program.
Seventy-five percent of the residents who tested the method said that it was very valuable. Fifty-two percent said that they would pay for this service. Four percent preferred backyard composting and 12% used their sink disposal while 13% said they preferred to throw it in the trash. Forty-six percent of residents that tested this method noted that they preferred composting their organics because they had less trash - but only 20% said they did or could have reduced their garbage bill. NRG Processing Solutions reported no (negligible) contamination in the organic materials collected in the study. NRG Processing Solutions operators visually inspected all loads and all materials were accepted for composting. Because the volume of material was not sufficient for separate processing, it is not feasible to determine the specifications of those specific materials in the final product. NRG Processing Solutions maintains that the material met all of their specifications at the point of entry into the composting system.
Carts & Bins – Ninety-three percent of the residents either loved (29%), liked (41%) or thought the blue bins were okay (23%.) Over 80% of the residents that tested the carts preferred them and were willing to pay for them. Bins or carts - residents liked them. When asked specifically what they disliked about the carts less than half (47%) thought the carts were too big.
30

• The data shows that the two-stream, bi-weekly 35-gallon cart recycling method netted the highest diversion rates of all the tested methods-over a 32.8% increase from the baseline recycling program.
Weekly – Sixty-eight percent of the residents that tested weekly felt that it was just the right amount of service and 61% were willing to pay for this additional service. • The data shows that two-stream weekly collection in blue bins netted the second
highest diversion rate of all tested methods-over a 26% increase from the baseline recycling program.
Education - Residents liked all of the educational materials, but most preferred the information that was sent in the mail, followed by the information delivered to the door, the discussions with the staff and finally the hotline. With no other changes the control group recycled an additional 6% just due to increased awareness of the study and the educational materials. Residuals - What Really Gets Recycled - While all the methods showed promise as far as increasing what residents recycled, the way Eureka Recycling collects and then later processes (sorts) material effects what actually gets recycled. Eureka Recycling contacted the Government Advisory Associates, a consulting firm that specializes in recycling industry research, to determine residuals rates at two-stream and single-stream facilities. Residuals consist of materials that are not accepted by the program but are picked up during collection, also known as out-throws (i.e. toys, #3-7 plastics, refuse), and recyclables that are too damaged or contaminated to be shipped to market and must be thrown away.
• Source Separated Collection - Currently Saint Paul’s program does not
exceed a 1.6% residual rate. • Two-Stream Collection – GAA research showed that two-stream programs
average a 6.4% residual rate (based on a survey of 215 facilities nationwide).*
• Single-Stream programs average a 27.2% residual rate (based on a survey of 16 facilities nationwide).**
*This average was reported based upon the assumption that all glass collected was recycled back into glass. ** This average was reported based upon the assumption that no glass collected was recycled back into glass.
Glass is a significant part of the residual rate in both two-stream and single-stream programs. As stated earlier, residents were asked about their preference for managing glass. Overwhelmingly residents want the glass bottles and jars recycled back into bottles and jars. Eureka Recycling calls this the “highest and best use” and “closed loop recycling” where these materials can be recycled and remanufactured over and over again. Less than 1% of residents were willing to allow their glass to be used as a landfill cover.
31

Table 3 below provides a comparison of the various methods of collection in two ways. Column A shows the average residual rates when the mixed-colored glass component of the recycling stream, after processing, is recognized as being recycled when used as an aggregate substitute or as daily landfill cover. This material is not made into glass bottles. Column B indicates the percentage of the glass in each collection method that, on average, ends up as mixed-colored glass. Column C shows the average percentage of glass of the total recyclable materials collected in each collection method. Column D provides the calculated residual rate if the mixed glass is not recognized as being recycled when used as landfill cover or aggregate.
TABLE 3 Impact of Strategy on Quality of Recyclables
A. Average
Residual Rates (excluding Mixed
Glass)
B.
Mixed Glass (% of all glass)*
C. Glass % of
Total Recyclable
Stream
D.
Total Residuals (%)¶
Truck Sort 1% 1% 12.2% 1.6% Two-Stream Bin 6.4% 41% 11.1% 10.9% Two-Stream Carts 6.4% 41% 12.6% 11.6% Two-Stream Weekly 6.4% 41% 10.7% 10.8% Single-Stream 14.2% 100% 13.0% 27.2% * Broken glass for truck sort is from Saint Paul experience; two-stream data is from WMI Saint Louis Park, MN facility; single-stream data is from Allied Wastes facility in Plano, TX. ¶ Residual data for truck sort is from Saint Paul experience; single-stream data is from GAA (see Appendix C).
Recommended Changes The results from data collected over the 14-month study have been evaluated to assess the environmental impacts, cost and convenience of each method. Our recommendation is made using these three indicators. • Environmental Impacts: Consider which collection method allows residents to
recycle the most materials while having the least amount of materials that have to be thrown out? (Contaminated and damaged materials have to be thrown out.) Consider the recycling collection method that gets the most recycled with the least pollution.
• Cost: Consider how much the different methods cost and how the cost of each impacts the residents’ choice.
• Convenience/Satisfaction: Consider why, how and what do people want to recycle and what would make them recycling more.
After measuring and analyzing the costs (combined collections and processing, less material revenues), convenience (measured through customer surveys and actual household participation levels) and environmental impacts (net recovery of materials that get to markets versus residuals) of the various collections the study concludes that:
32

In order to provide the greatest environmental benefits at a greater convenience and affordable costs to residents, Saint Paul’s recycling program should: • Move to a two-stream recycling sorting system: papers
(including newspaper, cardboard, paper and mail) and rigid containers (a mix of cans, glass and plastic bottles).
• Add PET (#1) & HDPE (#2) plastic bottles to curbside collection.
• Provide 18-gallon recycling bins with weekly collection. Although recycling carts net a greater diversion, the cost of the carts is a barrier to this method. Residents ranked this as a low funding priority. Blue bins that are collected weekly provide the same storage capacity as carts that are collected every other week.
• The study results clearly indicate that the greatest potential for diversion can be achieved through organics collection. Therefore, Saint Paul should aggressively work toward adding organics collection to its curbside program to significantly reduce Saint Paul’s waste generation.
Organics collection should be further evaluated for transportation cost and residential acceptance issues. There is no doubt that big environmental savings are still being left in the trash. Eureka Recycling needs more information about the possibility of using transfer stations to reduce the cost of having to transport multiple loads to the nearest organics processor in Dakota County. Permits, regulations and other structures that inhibit this type of collection need to be analyzed by state, county and city regulators and changes should be made to streamline this collection alternative. City's Process for Change The results of this collection study provided ample information about how Eureka Recycling can improve recycling while increasing convenience and environmental benefits - all while keeping an eye to the costs. From our recommendations, the city will select the changes that Eureka Recycling will implement and will determine the implementation timeframe. Full implementation of these changes will likely occur after April 2003, at which time current agreements with Eureka Recycling’s sub-contractors become less constricted. Cost to residents Households in Saint Paul currently pay $22 per year ($1.84/month) for recycling through a service charge on their property taxes. Apartment building owners with four or more units pay $14 per year per unit ($1.17/month). Unlike most cities in the metro area, the city of Saint Paul pays its recycling provider for each ton of material recycled rather than by household. Included in this per ton payment is funding for education, a recycling hotline (222-SORT) and other waste reduction programs. The city of Saint Paul contracts with Eureka Recycling, a nonprofit that invests all of the “profits” from recycling back into the community through education programs and services.
33

In the metro area, most cities pay the companies that provide their recycling by the household, meaning they pay for recycling at every house whether the residents recycle or not. On average this costs each household around $24 per year ($2.00/household/month). These cities provide their own education and any other waste reduction programs at an additional cost. In contrast, the city of Saint Paul only pays for what is recycled. This provides an incentive for recycling since Eureka Recycling is paid based on how much is recycled, rather than an assured households fee whether or not the recycling is picked up, set out or left at the curb. According to estimates made in this report, Eureka Recycling’s initial recommended improvements for Saint Paul’s program could result in a 26% increase in collected materials if residents in the whole city responded similarly to residents who tested the changes. This increase in collected materials would result in higher revenues for the city, but would also mean that the city would pay for more tons of recycling. An increase in program costs would likely be passed along to residents; Eureka Recycling estimates that residents could pay $2 to $4 more per year to pay for these recommendations. Organics collection would result in additional costs but would net the greatest recovery of resources. Residents were asked in the survey to identify how Eureka Recycling should prioritize funding. Adding plastic bottles was the overwhelming choice. (All of the residents except the control group tested the addition of plastic bottles.) Next in importance to the residents was adding collection of organics, weekly collection and then the carts. In general, residents were willing to pay for the method they tested and less willing to pay for a method that they did not test. Summary By carefully implementing important changes in what and how Saint Paul recycles, Eureka Recycling can control costs, improve convenience and divert, through composting and recycling, 74% of the discards that households generate.
Organics collection needs to be analyzed in more detail since this is where the next greatest diversion can occur. There are still unanswered questions regarding the cost and method of collection but there is no doubt that residents are willing to sort the materials because of their commitment to the environment.
The data that was gathered in this grant can and should be used by other communities in the metro area to ascertain the relative value of changing their current collection method. Although this project began with our baseline data, other communities should be able to begin with their baseline data and input the variables developed to create some projections for participation, diversion and net diversion after residuals. In particular, since communities are struggling with ways to maintain or increase their recycling rates, single-stream recycling has taken on significant interest and has resulted
34

in many unanswered questions. Many communities move to this system without thorough analysis of its challenges and benefits in hopes of increasing residents’ convenience and thereby increasing recycling rates. It is important to note that in this study the single-stream method did not prove to be cost effective when compared to the other methods. Although single-stream, along with the bi-weekly two-stream bins scenario, resulted in the most inexpensive collection costs, the increased processing costs and decrease in revenues due to material loss made it the most expensive method when looking at the overall system. In addition, the net overall recovery (environmental benefit) in the single-stream method (i.e. materials reaching end markets) was less than every other tested method when subtracting the residuals from the collected amount. There is no single answer or one-size-fits-all solution to the leveling of recycling rates. Rather, it takes a recycling program tailored to meet each community’s values and needs to accomplish our recycling goals. Each community values different elements of their recycling program. In Saint Paul it is clear that the residents value the environment over convenience and then cost. Each community will interpret their data with an eye to their community’s overriding goals in resource management. Presentations: Eureka Recycling has or will present this information to the following: every community council in Saint Paul (Districts 1, 10, 13L and 16 complete - all others scheduled); Bob Sandquist, city of Saint Paul Public Works Director (continually through the project) upon completion April 10; National Recycling Coalition’s on-line forum April 11; SWANA Recycling Symposium in Houston on February 27; Wisconsin AROW Conference on March 5; Ramsey County Recycling Coordinators on March 21; ARM meeting on April 11; OEA SWMAC on May 3; Michigan Recycling Conference on May 21; Arm workshop on June 19; CRRA Conference on July 16; National Recycling Congress January 2002 in Seattle and September 2002 in Austin.
35

Appendices:
APPENDIX A:
Recycle Word Consulting Analysis

RecycleWorlds Consulting Report
Introduction
This study field tested five different strategies for collecting recyclables: •Source Separated •Two-Stream Bins •Two-Stream Carts •Two-Stream Weekly •Single-Stream In order to make a reasoned determination of which type of recycling strategy to deploy, the different ways that each strategy interacts with each of the following program elements in combination must be considered: •Acceptance by residents •Collection costs •Processing costs •Marketing revenues Strategies that lower the cost of either collection or of processing often do so by increasing the costs of the other, or by decreasing program performance as measured by the diversion rate or by degrading the quality of and thereby the price received for the recyclables. The purpose of this report is to evaluate how each of the changes in collection method impact all of the other parts of the program so that an informed decision can be made as to how those changes affect performance and net costs of the overall program. This was done either through direct observation of the tests or by modeling the costs of collection and processing and revenues from marketing under each of the five scenarios that were explored in field tests in St. Paul during 2001. Three items are dealt with in this narrative: (1) collection cost modeling; (2) processing cost modeling and (3) statistical analysis.
(1) Collection Analysis - Modeling Collection Costs for Each Scenario The field data that was collected and used in this analysis dealt with the patterns of response by the residents in the test areas to the education and program designs for different strategies to collecting recyclables curbside compared to a control area in which no changes in approach were made. The data that was collected included set out rates, participation rates, pounds set out per participant, the proportion of paper compared to containers that were set out, and the composition of the recyclables. However, because these tests were conducted for only a short time, it was not economically feasible to acquire a specialized vehicle best designed to work with each the four
1

new approaches. Instead, jerry-rigged vehicles had to be used that are not optimal for each type of collection in order that the other field data not dependent on the vehicle used could be acquired. In order to estimate the cost of collection with the strategy implemented, field measurements of those jerry-rigged vehicles would not be reflective of the conditions were the appropriate trucks used. It was necessary, therefore, to model the characteristics of the particular type of collection program for each strategy and its associated costs that would be expected in full-scale operation were the appropriate vehicle used. This work was done by RecycleWorlds Consulting, which has extensive experience modeling collection programs. Modeling collection is a complex process. For one thing, many collection factors interact with each other and often do so in seemingly contradictory and unpredictable ways. Increased participation rates, for example, will increase diversion, but also will increase the number of stops for the vehicle and the volume of material collected. Depending how full the truck previously was at day’s end, that could either produce economies of scale or impose disproportionate costs. Moreover, and most difficult to grapple with, collection costs do not follow simple linear relationships of costs relative to the volumes handled. Instead, collection is characterized by what engineers call “step functions.” This primarily occurs because a truck can only stay on its route collecting material until it tops out, after which it must go off route for approximately an hour in order to unload before resuming collection. In order to grapple with all of the interactive, non-linear factors in a way that realistically simulates the actual routes, RecycleWorlds developed a sophisticated computer program, RecycleWare™ that tracks the truck’s fill rate and time off-route throughout the day, accounting for all of the interactions and step functions. Among the factors considered to run the model are those shown in TABLE 1.
TABLE 1Factors Used to Specify
Collection Costs Recycle composition Pounds of recyclables per cubic yard Average set out rate Volume per set out Pickup rate divided by time at and time between stops Driveby rate Work day minus off-time Time to and from garage Time to and from MRF Size of vehicle Average utilization rate of vehicle Capital and operating truck costs Cost of money Households served
2

In addition to the capabilities of the model, the accuracy of the outputs are also a function of the reasonableness of the inputs. For those factors dependent upon local conditions, RecycleWorlds used the data that did exist such as set out rates, recycle composition and pounds and volume per stop, and then, for those inputs for which there was no field data, used various techniques to particularize the data that does exist for St. Paul. Thus, for example, the output is most sensitive to the pickup rate, namely the number of stops made per hour while on the route. In order to reduce the effect of uncertainty, we broke down the overall pickup rate into its component parts, namely the time between stops, the time getting off or and back onto the vehicle and the time actually loading the recyclables. While the time actually at the stop will vary with the type of receptacle used to store the recyclables and the type of vehicle, the time between stops, and the time getting in and out of the truck – which is known because we had that data from the existing route analysis – will be unaffected by which of the five strategies is used (so long as all the vehicles can be assumed to have low entry, right sided drive and PTO). We used available time/motion data from other cities about the time required to load a cart versus a bin to fill in that minor piece of the total pickup rate. TABLE 2 shows the salient distinguishing input values used for each of the five scenarios.
TABLE 2 Salient Distinguishing Input Values for Collection Cost Modeling
Truck Sort 2 Stream Bins
2 Stream Carts
2 Stream Weekly
2 Stream Organics
Single Stream
Collection Frequency 2 2 2 1 1 2Vehicle Top Select La Brie
MaximizerLa Brie
MaximizerLa Brie
MaximizerKann One
Pass LaBrie
Expert 2000Compaction Ratio 1.0 1.4 1.4 1.4 1.4 2.0
Purchase Price $116,000 $120,000 $120,000 $120,000 $140,000 $126,000Capacity 37 37 37 37 30 23
Truck Utilization§ 60% 90% 90% 90% 85% 95%Bin/Totter Cost($/HH) $12(3 bins) $8 (2 bins) $76(2
carts)$8 (2 bins) $8 (2 bins)
$38(1 cart) $48(1 cart)
Participation Rate* 75% 75% 78% 78% 78% 76%Set Out Rate* 52% 52% 58% 53% 53% 59%Pickup Rate* 56 95 78 95 62 100
Driveby Rate* 108 160 117 145 101 142Time to offload* 40 35 35 35 35 33
* Data from field tests. (See Definitions for details) § Utilization is varied with the number of compartments and the existence of compaction. (See Definitions for details)
A review of TABLE 2 illustrates the key thing to understand when the different strategies are evaluated. They each involve many tradeoffs in which an advantage in one part of the recycling program is offset in whole or in part by a disadvantage in another part. The major way that this arises is in whether more or less or the sorting process is handled on the truck or at the material recovery facility (MRF). Source separated programs move most of the sorting costs on the truck that otherwise would have to be done at the MRF; the two stream approaches limits the truck sort to a single split between fiber and containers, with the breakdown among each stream left to the MRF; and the single stream moves essentially all of the sorting costs to the MRF.
3

The more sorting that is done on the truck, the slower the pickup rate as the driver spends more time separating the materials before loading them into different compartments. In most, but not all cases (due to the complexities from non-linearity), that will increase collection costs. By the same token, truck-side sortation is more effective because the material hasn’t been broken or packed in transit or when the load is tipped onto the floor, producing substantially lower residuals than sorting at a MRF. Another consequence of adding sorting on the truck is the need to have more compartments on the vehicle. The more compartments on the truck, the more likely it is that one or more of the compartments will top out before the others, requiring the truck to leave the route to off-load even though the other compartments are not yet full. The effect is to decrease the utilization of the space, and increase the number of trucks needed to serve an area. Also, when a vehicle is subdivided into more compartments, the truck will spend more time at the MRF off-loading because each compartment must be tipped in a different bay, and sometimes each tip must be followed by re-queuing at the scale house. The different strategies also involved the use of different receptacles for the participant to store his or her recyclables (bins vs. carts). Carts were found, among other things, to increase the amount of material that participants captured. While in these tests carts improved the program’s diversion rate, it also has the effect of filling up the truck faster, necessitating more vehicles to service an area, and carts are very expensive. TABLE 3 shows the major inputs that are common to each scenario:
TABLE 3 Common Input Values
Workday 10 hoursBack Up Vehicle 5:1 Fully Loaded Wage Rate $50,694Households Served 76,524
TABLE 4 shows the final costs for each of the five scenarios, along with components of those costs that are of interest:
RW Model RW Model Number
of RoutesTons/Year Diverted
Container Cost/Yr.
Total Cost/Yr.
Costs Per Ton
Truck Sort 10.1 16,300 $187,917 $978,217 $60 2 Stream Bins 6.6 16,453 $178,443 $820,432 $50 2 Stream Carts 7.1 20,394 $756,536 $1,335,194 $65 2 Stream Weekly 11.5 19,361 $118,962 $1,143,437 $59 2 Stream Organics 16.5 29,410 $875,498 $2,340,820 $80 Single Stream 5.8 18,519 $479,139 $951,178 $51
TABLE 4Collection Costs of Different Scenarios
4

A review of TABLE 4 shows that, of the recycle-only scenarios, carts, closely followed by weekly collection, produce the highest diversion rate, but, because the carts and more frequent collection are expensive, at the greatest total cost. Two-stream bins method of collection was the least cost measured either by total cost of cost per ton, but, among the programs with plastic, it had 19% lower diversion as well. Adding expanded organics collection increased overall diversion by 80% more than the existing source separate program, and by 51% more than the same weekly program had without the organics. Single-stream fell in the middle in terms of cost and diversion. (2) Processing As noted, those scenarios that reduced collection costs typically do so by moving more sorting from the truck to the MRF. In general, it is possible to achieve greater scale economies on an assembly line at a MRF than a driver can achieve getting off and on the truck, but, those economies are at a cost in the form of less effective sortation, which shows up in lower quality material that commands a lower price from the markets. Also, increasing automation can reduce labor costs and increase throughputs, but sometimes that is at the expense of the ability to upgrade a material to its highest grade. Similarly, a MRF can reduce its processing costs by deciding to not, itself, sort a material by type (e.g. natural from pigmented HDPE), but at the expense of receiving a lower price from the markets that it sells into to whom it leaves that final split. As projected in the grant application, the short time and scale of the test, as well as the lack of local facilities, made it impossible to actually operate a MRF in the same way that each strategy would were it implemented. Therefore, as before, we modeled much of the MRF costs, using field data where we had it and data from other parts of the country to define the attributes of each type of strategy. The primary way in which the different strategies differed is in the amount of recyclables that they collected — carts and weekly collection drew more material than bins and bi-weekly – and in the quality of the recyclables – source separated followed by two stream had less glass breakage and residuals and single stream the most. TABLE 5 shows how we project that from data in other programs the ways in which the different approaches will impact glass breakage in particular and on the overall residuals rate of which unsortable glass is one part.
TABLE 5 Impact of Strategy on Quality of Recyclables
Mixed Glass (% of all glass)*
Residual (%)¶
Truck Sort 1% 2% Two Stream Bin 41% 11% Two Stream Carts 41% 12% Two Stream Weekly 41% 11% Single Stream 100% 27% * Broken glass for truck sort is from St. Paul experience, for two stream data is from WMI St. Louis Park facility, and for single stream is from Allied Wastes facility in Plano,Texas. ¶ Residuals for truck sort is from St. Paul experience; for two stream data is 6.42% from GAA exclusive of mixed glass, to which the mixed glass as a fraction of the total recycle stream is added to the residual rate without glass; for single stream is from Government Advisory Associates (see Appendix C).
5

TABLE 6 then compares the amount of material diverted from recycling on the truck to the amount actually processed and sold to secondary recycling markets.
TABLE 6 Impact of Strategy on Quantity Recycled
Amount Recycled on Truck
(lbs/HH/yr)*
Proportion Not Recycled at
MRF (%)
Amount Actually
Recycled (lbs/HH/yr)
Source Separated 426 2% 417 Two Stream Bin 430 11% 383 Two Stream Carts 533 12% 469 Two Stream Weekly 506 11% 450 Single Stream 484 27% 353 * Field data from test.
Another impact on quality of some processes is the downgrading of the grade that old newspapers are sold. TABLE 7 shows our estimates of the different quality levels that the different strategies would achieve based upon Eureka Recycling’s current program experience and interviews with the different types of MRFs across the country:
TABLE 7 Impact of Strategy on ONP Grades
ONP Grades* #6 #7 #8
Truck Sort 33% 0% 67%
2 Stream Bins 30% 30% 40%
2 Stream Carts 30% 30% 40%
2 Stream Weekly 30% 30% 40%
Single Stream 30% 30% 40%
* Grades for truck sort are from St. Paul experience, and for two stream and single stream are from Waste Management. Mills report skepticism that single stream MRFs will be able to achieve a strong #8 share, suggesting that the projected fractions for single stream may overstate the portion that is ultimately sold as #8.
TABLE 8 shows the price projected for the recyclables along with the proportion of each material in each scenario that we found in our test.
6

TABLE 8 Price and Proportion of Recyclables in Each Scenario
January ’02 Market Pricing
Separated Bin Cart Weekly Single Stream
CONTAINERS Sorted Clear $32 6.59% 3.83% 4.40% 6.39% 0.00%Sorted Green $20 2.20% 1.28% 1.47% 2.13% 0.00%Sorted Amber $12 2.20% 1.28% 1.47% 2.13% 0.00%Mixed Glass ($10) 0.11% 4.44% 5.09% 4.36% 14.34%Glass - Tin $10 2.36% 2.31% 2.65% 2.27% 3.06%Aluminum $956 1.82% 1.78% 2.04% 1.75% 2.35%PET $105 0.00% 1.24% 1.43% 1.22% 1.65%HDPE-nat $200 0.00% 0.80% 0.92% 0.79% 1.06%HDPE-colored $90 0.00% 0.80% 0.92% 0.79% 1.06%PAPER #6 $25 22.91% 20.22% 19.57% 20.29% 18.80%#7 $30 0.00% 20.22% 19.57% 20.29% 18.80%#8 $40 46.50% 26.95% 26.10% 27.05% 25.07%ONP - OCC $35 8.17% 7.93% 7.68% 7.96% 7.37%MOP $85 4.08% 3.96% 3.84% 3.98% 3.69%OMP $25 2.04% 1.98% 1.92% 1.99% 1.84%Phone $25 1.02% 0.99% 0.96% 0.99% 0.92%
TABLE 9 shows the price to process recyclables under the different MRF strategies of source separated compared to two stream compared to single stream recyclables, as well as for composting.
TABLE 9 Processing Cost of the
Different MRF Types ($/ton)
Truck Sort $35 2 Stream Bins $502 Stream Carts $50 2 Stream Weekly $50 2 Stream Organics $30 Single Stream $60 * Truck sort from St Paul contract; two stream and single stream from WMI in Appendix F.
TABLE 10 then calculates the costs to process and the revenues from each of the five tests were they implemented across the entire city.
7

TABLE 10 Costs to Process and Revenues for Different Scenarios
Source Separated
2 Stream Bins
2 Stream Carts
2 Stream Weekly
2 Stream Organics
Single Stream
Costs Processing Costs ($570,486) ($822,633) ($1,019,682) ($968,029) (301,470) ($1,111,128)
Residue Disposal ($9,708) ($42,250) ($52,371) ($49,718) ($10,049) ($95,298)
Revenues Paper ONP $390,191 $321,190 $382,670 $379,657 - $274,612
Other $113,780 $101,008 $120,342 $119,394 - $86,360 Containers Glass $44,927 $17,474 $24,663 $20,232 - ($19,326)
Other $282,709 $305,358 $430,978 $353,552 - $371,630 Organics - - - - $200,980 - Subtotal $831,607 $745,030 $958,652 $872,835 $200,980 $713,276
Net Total $251,412 ($119,854) ($113,401) ($144,912) ($110,539) ($493,150)
Per Ton $16 ($8) ($6) ($7) ($10) ($27)
TABLE 10 shows what was previously mentioned, namely that while the less expensive collection options that leave a part or all of the sorting for the MFR, at the sort facility, the truck sort exhibits the least processing costs. Variations among the dual stream options arise primarily from the fact that the variations involving the receptacle and collection frequency within those two streams resulted in different mixes of fibers relative to containers, each of which stream has different revenue characteristics. Interesting to note is that the single stream is substantially more expensive. TABLE 11 then compares the collection cost of each scenario from TABLE 4 with the net processing and revenues numbers from TABLE 10. In order so that costs do not receive more weight at the expense of program performance, overall diversion (minus residuals that wind up back in the landfill) are also shown of each scenario:
TABLE 11 Overall Costs and Performance
Collection $/Yr
Processing $/Yr
Net $/Yr
Tons Diverted
(after processing)
Truck Sort -$975,548 $251,412 -$724,136 16,039 2 Stream Bins -$820,432 -$119,854 -$940,286 14,666
2 Stream Carts -$1,335,194 -$113,401 -$1,448,595 18,046 2 Stream Week Rec -$1,143,437 -$144,912 -$1,288,349 17,273
2 Stream Rec+Org -$2,340,820 -$87,025 -$2,427,845 27,222 Single Stream -$951,178 -$493,150 -$1,444,328 13,482
8

The results of this comparison in TABLE 11 are very interesting. When all of the interactive and offsetting factors are included from within the recycle-only strategies, single stream, which is often thought of as being more efficient because of its extensive automation and collection side savings, is essentially ties with the most expensive, with significantly worse performance. Dual stream carts biweekly or bins with weekly collection have essentially the same high levels of performance, with dual stream biweekly carts having somewhat higher costs. (3) Statistics Whenever one uses a sample smaller than the total population to estimate such things as behavioral responses to changes, there is an issue of whether the sample size is sufficiently large to provide a reliable estimate of the whole. Too small a sample could yield a mean value that is calculated to eight decimal places but that is significantly different from what would be expected from everyone because the chance of pulling a non-representative sample increases. By examining how much each data point in the sample varies around the mean value for the sample, which is called the variance, in relation to the size of the sample, statistics permits estimates to be of how much uncertainty attaches to the estimate calculated from a sample. In this way, the reader can objectively determine whether the estimates made from the study can be relied upon for the degree of certainty he or she feel is needed for decision-making. In this study, we generally used a sample size for each scenario of approximately 400 households to be conservative, based upon past experience that suggested a minimum of 200 households are necessary in waste studies to produce meaningful results. As part of our evaluation, we then used statistical tools to test the data which we collected in order to determine whether the sample size was adequate to produce meaningful results. Uncertainty is measured in two ways:
The confidence interval (or margin or error or uncertainty band) is the range of uncertainty around the mean of the sample within which the true answer is expected to lie. Typically, the margin of error will be ±1, ±5%, ±10% or ±20% around the mean of the sample.
However, because of the way in which the statistics are calculated, the true answer will fall within that uncertainty band for a defined proportion of the time were samples are recurringly taken. That is called the confidence level. Typically, the confidence level will be 90%, 95% or 99%, as in the true answer is expected to be within the margin of error on 9 out of 10 times for a 90% confidence level that a sample would be rerun.
In this sort of study that does not involve mission critical measurements such as the failure mode for a support member of a bridge, we are looking for results that fall within ±20% at the 90% confidence level.
9

By calculating the uncertainty band for a given confidence level, we can determine whether the size of the samples used for each test (generally about 400 households) was adequate to produce reliable answers. The first data series involved the set out rates for each scenario. TABLE 12 shows that the confidence interval around the estimated set out rates for each scenario at the 90% confidence level were very narrow, all under ±10%, and all but one under ±5%.
TABLE 12 CONFIDENCE BANDS AROUND SET OUT RATES
at the 90% Confidence Level AVG STD NUMBER ST ERROR T Value CI
(+/- as %) Source Separated 52.3% 0.3956 384 0.0202 1.658 6.40%Two-Stream Bins 65.8% 0.3405 380 0.0175 1.658 4.40%Two-Stream Carts 76.85% 0.2538 352 0.0135 1.658 2.92%Two-Stream Weekly 74.5% 0.2943 349 0.0158 1.658 3.51%Single-Stream 153.3% 0.3237 318 0.0182 1.658 1.96%
In addition, there were data series for a mini sample taken from a part of Scenario D that measured the weights of the paper, container, organics and waste streams. TABLE 13 shows the confidence bands around those proportions.
TABLE 13 CONFIDENCE BANDS AROUND MATERIAL STREAM FRACTIONS
at the 90% Confidence Level AVG STD NUMBER ST ERROR T Value CI
(+/- as %) Fibers 42.1% 0.1247 44 0.0188 1.671 7.46%Containers 9.7% 0.0496 44 0.0075 1.671 12.92%Organics 21.6% 0.1053 44 0.0159 1.671 12.29%Garbage 26.6% 0.1639 44 0.0247 1.671 15.51%
Because of the difficulty collecting these measurements that involved scaling bins and cans just before the collection vehicle arrived, it was only possible to accomplish the task for a much smaller sample, 44. The fact that this sample was smaller in relation to its intrinsic variability resulted in a wider margin of error ranging from ±7% to ±16%, but within the target range of ±20%.
10

DEFINITIONS Setout Rate. The setout rate is a concept useful in calculating collection costs for the separate collection of recyclables. Unlike waste collection in which almost all household set out the garbage for collection in each week (with the minor exception of those on vacation), in recycle collection, some households do not participate in the recycling program and some households that do participate overall, do not happen to set out that particular week. The setout rate is a term used to reflect the fact that some significant proportion of all households will, in general, not set out recyclables for collection on a given week. The collection vehicle will drive by those households without stopping. The setout rate is calculated as:
Households with Setout All Households
PICKUP RATE. The pickup rate is the number of stops per hour while the truck is on the route (excluding time to and from the route, to and from unloading, atypical deadheading, and on breaks). DRIVEBY RATE. With solid waste collection, there is no compelling need to further refine the term “pickup rate”, but with recycle collection there is. This is because not every household participates at any time and, among those who do participate, not every participant sets out recyclables every week. Illustratively, if the participation rate were 90% and participants set out biweekly, then the recycle truck would only need to stop at 45% of the households on his or her route each collection day. On a given collection day, the recycle truck, then, passes by those 55% of the households which, in this example, either never participate or do participate, but not on that week. The driveby rate is calculated by the following formula:
3600 seconds (Setout Rate% H Time Atseconds)+Time Betweenseconds
COST OF MONEY. The cost of money is a financial term to reflect the overall cost of funding capital, or long-lived, investments by an entity. It includes the weighte cost of the different financial instruments used by the entity making the investments, such as stocks and bonds, in their proportion to the total portfolio. The cost of money can then be further specified to be on a “before” or “after” tax basis to reflect the fact that for profit entities must pay taxes on earnings on equity and can deduct the interest paid on debt. TIME TO OFF-LOAD. The time to off-load is the time from the route to the place where the collection vehicle off-loads when it is full and back. It includes the time queuing, scaling, and tipping at the place where it off-loads, along with the time to and from the route. Typical off-load times are one hour. There can be two times to off-load: the first is any mid-day trip off route to unload, which involves a trip from the route to the place where the load is tipped and back to the route, and the last day’s trip off route to unload, which involves a trip from the route to the place where the load is tipped and then back to the garage. UTILIZATION RATE. When recyclables are collected a vehicle with more than one compartment,
11

12
often one compartment will fill up before the other. This typically will force the vehicle to leave the route to off-load the full compartment, even though the other compartment(s) are not. The utilization rate refers to the fact that this means that the entire theoretical interior volume of the box is not available for collection. The utilization rate is calculated as:
Average Proportion of Interior Volume Utilized Total Interior Volume
Notes on Confidence Intervals PARTICIPATION RATE. We have shown the confidence interval for the setout frequency. Unfortunately, it is not appropriate to compute a band for the participation rate because of the way these data are collected by household. For the setout rate, each household’s setout pattern (Yes/No) is noted each week, and upon completion of the observation period, a setout rate over that period is calculated for each household. This series of setout rates across all of the households in the survey was then analyzed statistically to determine how much uncertainty attached to the average setout rate of all of the households. For the participation rate, the only thing that is noted is whether (Yes/No) a given household set out something at some point during the entire survey. We can calculate from this data the proportion of the total number of households that participate in some defined time period. However, since there is no value for each household, but rather only Yes/No, there is nothing to calculate statistically for confidence bands. Nonetheless, the narrow bands shown for the setout rates provides indirect confidence that overall participation rate is also likely to be close to the true answer. DIVERSION RATES. The diversion rates for the different field tests were estimated or calculated from aggregate weights for the entire test area surveyed. The calculation of confidence intervals requires data points for the weights at each individual household. For that reason, it is not possible to compute the uncertainty bands around the diversion rates. Where the aggregate weights are based upon scale weights of the entire population of collections for the test area, however, it ought to be noted that there would be no uncertainty band. The concept of uncertainty only applies when a sample of the total population is taken.

APPENDIX B:
E4 Partners Survey Analysis

Assessing Saint Paul Residents Values and Views on Proposed
Changes to their Recycling Collection Program.
A Survey Analysis
March 6, 2002
Presented to
Eureka Recycling
by
e4 partners, inc.
Table of Contents and Figures
Purpose ..................................................................................................................................................................3 Executive Summary ..............................................................................................................................................3
Methodology ..........................................................................................................................................................3
Weighing Environmental Benefit, Cost and Convenience ................................................................................4
Response To Tested Methods..............................................................................................................................6
Funding Priorities..................................................................................................................................................6
Plastics ...................................................................................................................................................................8
Carts and Bins .......................................................................................................................................................8
Collection Frequency ..........................................................................................................................................10
Glass Recycling...................................................................................................................................................11
Educational Material............................................................................................................................................12
Paper Recycling...................................................................................................................................................12
Organics ...............................................................................................................................................................12
Conclusions .........................................................................................................................................................14

Purpose
e4 partners, inc. prepared this report for Eureka Recycling (Eureka) and the Saint Paul Neighborhood Energy Consortium (NEC). The report present the results and analysis of survey data collected from residents in five Saint Paul neighborhoods. Each neighborhood tested a different variation of curbside recycling, with the intent of informing Eureka decisions on changes to the current program. The neighborhoods and the methods they tested are described in Table 1. Table 1
Group A Control Group, no changes to collection system but educational material on the study was provided.
Group B Bi-weekly collection with two blue bins, one for fiber and one for containers.
Group C Bi-weekly collection with two wheeled carts, one for fiber and one for containers.
Group D Weekly collection with two blue bins, one for fiber and one for containers, and a wheeled cart for the separation and collection of organic materials.
Group E Bi-weekly collection with one wheeled-cart for all the recyclables material.
The survey was designed to assess how residents view the recycling program, potential changes to the program they helped test, and the values of cost, convenience and environmental benefit in relationship to the recycling program. The survey will serve as a tool for Eureka to use in evaluating and considering potential changes to the recycling program for the City of Saint Paul. This survey is part of a 14-month, multi-neighborhood project to evaluate several methods of collecting recyclable materials. The Minnesota Office of Environmental Assistance provided funding assistance for this evaluation to Eureka.
Executive Summary Overall, the survey results support several conclusions.
1. Residents preferred the method they tested to the existing method, though residents also appeared satisfied with the current program.
2. There is strong, nearly overwhelming, support for the collection of plastics at the curb. 3. Environmental benefit is consistently the most important factor for residents, though
convenience was a close second. 4. Finally, residents who tested specific program elements are more likely to support paying
for those changes to the system. The survey results suggest that Eureka did not offer any program choices that residents will not embrace. However, the findings from the survey are insufficient to make the necessary program decisions. This information needs to be used in conjunction with the data Eureka gathered on set-out rates and amount of material collected to make program decisions.
Methodology There were five separate survey documents to reflect the different options tested by different neighborhoods. The survey was developed by e4 in consultation with Eureka staff. The survey was mailed out to a total of 1,848 residents in five neighborhoods. Completed surveys were mailed by Eureka and entered into a database by Eureka staff. Eureka received 1,016 responses, varying by neighborhood as shown in Table 2. With a minimum response rate of 20 percent, the responses can be expected to provide statistically significant results with confidence intervals (at 90 percent confidence) of three to four percentage

points. Where necessary, the report identifies results that are not statistically significant at this level of confidence. Otherwise, results reported can be assumed to be statistically significant.
Table 2
Neighborhood Surveys Mailed Responses Received Response Rate Group A 380 133 35% Group B 377 196 52% Group C 374 255 68% Group D 351 225 64% Group E 366 207 57%
Total 1,848 1,016 55% Each neighborhood tested a different method of collecting recyclables, except for Group A, which served as the control group. While each neighborhood received a survey with common questions, the surveys were structured to contain questions that explore resident’s reaction to and views on the specific changes tested in each neighborhood.
Weighing Environmental Benefit, Cost and Convenience Eureka was primarily concerned with how residents balance the values environmental benefit, cost and convenience in assessing Saint Paul’s recycling program and in evaluating potential changes to the collection system. Residents were asked to rank, in order of importance, cost, convenience and environmental benefit. Analysis of the survey results show that residents consistently rank environmental benefit first, convenience second and cost third. The figures below show the response among all neighborhoods. Residents chose environmental benefit first, convenience was second by a smaller margin and cost was a clear third choice. Figure 1
First Value Choice
37%
19%
44%ConvenienceCostEnvironmental Benefit
Figure 2
Second Value Choice
38%
29%
33%Convenience
Cost
EnvironmentalBenefit

Figure 3
Third Value Choice
25%
54%
21%
ConvenienceCostEnvironmental Benefit
As illustrated in Table 3, environmental benefit was rated first by every neighborhood, though in Groups A and C the difference was not statistically significant. While convenience was a strong and consistent second choice, it was not a unanimous second choice. Table 3
Neighborhood First Choice % Second Choice % Group A Env. Benefit 41% Cost 38% Group B Env. Benefit 45% Convenience 35% Group C Env. Benefit 43% Convenience 42% Group D Env. Benefit 49% Convenience 39% Group E Env. Benefit 52% Convenience 39%
Figure 4 below combines residents first and second choices. By doing this combination one can see there is no statistically significant difference between environmental benefit and convenience in terms of what are the combined first and second value choices. This same combination also reinforces the distance between cost and both environmental benefit and convenience. Figure 4
Combined First and Second Choices
37%19%
44%
38%
29%
33%
0%
10%
20%
30%
40%
50%
60%
70%
80%
90%
Convenience Cost Env. Benefit
Second ChoiceFirst Choice
These findings should not be used to infer that cost is not a consideration for residents. A detailed analysis of resident’s willingness to pay for specific program changes demonstrates that while environmental benefit and convenience remain important considerations, they are not overriding.

Response To Tested Methods
When asked for their preference, residents in each of the four neighborhoods that tried a new method indicated a strong preference for the new method. Figure 5
Residents Preference for Tested Methods over Existing Collection Systems
80% 83% 87%76%
0%10%20%30%40%50%60%70%80%90%
100%
Group B Group C Group D Group E
This table should not be used to compare the value of one collection method over another. It does not demonstrate or reveal the value of a two-sort collection system using carts over a two-sort using bins. Rather, it reflects an overriding preference for the methods being tested over the existing collection system. Residents were also asked why they liked the new method. The response indicates that there are a variety of reasons but there is no clear individual reason that stands out. The choices the residents had to choose from were:
a) It took less time; e) It was easy to store my recyclables b) It was easy to understand; f) Other; and, c) I could recycle more material; g) I didn’t like it. d) I had less garbage every week;
A quarter of residents who responded selected all five reasons why they liked the existing method. Nearly one third (31 percent) chose all five and added reasons of their own under “Other”. While these findings indicate support for all the methods and changes to the collection program that were tested in the pilot, the lack of distinction among the reasons for the preference make it difficult to discern any one reason as more important than others. The only discernible trend from these answers is that Group D tended to include “easy to understand” less than the other three neighborhoods. Groups B, C & E each had 58% of residents include “easy to understand” in their responses while D only had 40%. As Group D had the biggest change in their system through the inclusion of organics; their response here is to be expected and is not surprising.
Funding Priorities Residents were asked to prioritize, given a limited budget, among four specific changes to the program, or to add their own. The listed changes were:
a) Adding plastic bottles to curbside collection; b) Adding organics to curbside collection; c) Picking up my materials every week; and d) Using wheeled carts to replace blue bins;
A breakout of how the residents ranked these choices is shown in Figure 6.

Figure 6
Funding Priorities
Plastic Bottles
64%Organics
10%
Weekly7%
Wheeled Carts17%
Other2%
Plastic Bottles
WeeklyWheeled Carts
Organics
Other
Figure 7
Funding Priorities Adjusted for Plastics
Carts43%
Organics31%
Weekly23%
Other3%
Carts
Organics
Weekly
Other
Nearly two-thirds of the responses indicated that plastics collection was the first choice for a program change. As shown in Figure 7 incorporation of wheeled carts was the second choice. The survey was designed to not only identify preferred changes to the program, but also to explore whether residents would support paying for any added costs associated with those changes. Table 4 summarizes the response to questions related to willingness to pay for added services. The responses support three findings. First, neighborhoods that tested a specific method supported funding that specific method more than other neighborhoods. Second, the differences are substantial. Finally, the control group generally did not support paying for new program features, with the exception of plastics collection. Table 4
Service and group(s) that tested
that method
Willingness to pay among those who tested the method
Willingness to pay among the other neighborhoods (except control)
Willingness to pay in control neighborhood
(Group A)
Carts (C, E) 64% 22% 20% Organics (D) 52% 21% 8% Plastics (B,C, D, E) 78% N/A 59% Weekly (D) 61% 19% 6%

Plastics
As noted above, the choice of plastics collection overwhelmed all other choices among new service elements, demonstrating a clear and strong preference for the collection of plastics at the curbside. That choice is reinforced when residents were asked if they were willing to pay for plastics collection. Three quarters of residents, regardless of collection method tested, indicate a willingness to pay for plastics collection at the curb. The support for plastics collection is consistent throughout all five neighborhoods, with the control group showing the lowest level of support at 59 percent. Table 5
Neighborhood Percent Willing to Pay for Plastics Collection
Group A 59% Group B 73% Group C 81% Group D 78% Group E 78%
As with all questions about willingness to pay for program elements, the control group (A) showed less support than all other groups. However, plastics collection is the one issue that the control group demonstrated a willingness to fund.
Carts and Bins One of the biggest considerations for Eureka is not simply what to collect at the curb, but how to collect this material. The survey sought to gauge resident’s view of the wheeled carts that were tested and the blue bins that are now used in the citywide program. Based on survey responses, it is difficult, if not impossible, to determine whether residents prefer the carts to the bins. There was a high degree of satisfaction with the carts from those who tested them, which also translated into strong support among the same population for paying for the carts. At the same time, responses show a high degree of satisfaction with the blue bins. As noted in Table 4, there was support for paying for the carts among those residents who tested them – Groups C and E. But while about two thirds of those residents indicated they would be willing to pay for the carts, that support fell off dramatically in the other neighborhoods (22 percent) and the control group (20 percent). Among those in Groups C and E that chose carts as the first choice for program funding, a full 80 percent of them would be willing to pay for them. There was also very strong support for the blue bins from those neighborhoods that tested them and the control. Less than 1% of the respondents did not like the blue bins and barely one third of total responses even answered the question asking what they don’t like about the blue bins. This support is demonstrated below, which breaks out the three neighborhoods who continued to use their blue bins (A, B and D) and their characterization of the bins. Table 6
Reaction to Blue Bins Percentage Response I loved them! 29% I liked them. 41% They were OK. 23% I didn’t like them that much. 4% I didn’t like them at all! 2%
Residents were asked what they liked and disliked about the both the carts and bins. The following two tables show the responses based on collection method.

Table 7
Why carts/bins are liked C&E/Carts A&B/Bins D/Bins and Cart
Easy to move 83% 53% 49% Right size 64% 56% 56% Materials didn’t spill 78% 44% 59% I don’t have to keep as much in the house 71% 56% 59% Other 10% 7% 4%
This table demonstrates a strong and consistent degree of support from the neighborhoods that tested the carts for the carts. Residents who tested the bins had a high, but not as strong or as uniform, level of support for the bins with the only real difference between the grouping of A&B and D coming in on the issue of material spilling out of the bins. Table 8
Why carts/bins are disliked C&E/Carts A&B/Bins D/Bins and Cart
Too difficult to move 34% 20% 22% Too big 47% 33% 28% Too small 7% 7% 9% Don’t fit in the house 37% 14% 49% Material blew out 10% 18% 16% Other 35% 35% 21%
There is a noticeable dislike of how difficult they are to move, their size and not being able to fit into the house. The latter reason, don’t fit into the house, is the only shared dislike between Groups C&E and Group D. As Group D was also testing bins, the carts may have seemed relatively easier to move and the size more useful than the blue bins. However, it seems clear that not fitting in the house is both a reaction and comparison to the ability of the blue bin to fit neatly in a house.
Sorting and Contamination Among the changes to the recycling program tested by the neighborhoods, some included less source separation of materials. Because of the need for sorting after collection, aggregated collection can lead to greater contamination and reduce the amount of material ultimately recycled. When asked about their willingness to sort more in order to prevent or reduce contamination, the majority of respondents said they were not willing to do so. Table 9 provides a neighborhood-by-neighborhood breakdown of these responses. This question is significant because it represents a measure of “environmental benefit” relative to “convenience”. Table 9
Neighborhood Willing to Sort More than During Study
Unwilling to Sort More than During
Study
Undecided
Group A 32% 48% 20% Group B 42% 48% 10% Group C 30% 55% 15% Group D 43% 37% 20% Group E 39% 41% 20%
Groups B and C, whose collection method varied only by type of container (blue bins for B, wheeled carts for C), had very different responses to the question. Group C had the lowest percentage of respondents willing to sort more and the highest level of those unwilling to sort more. Group B’s willingness to sort more was not only the second highest, but also close to those in the same group who would be unwilling to sort more. Group B also had the lowest rate of undecided responses. The results suggest that the introduction of the carts makes the
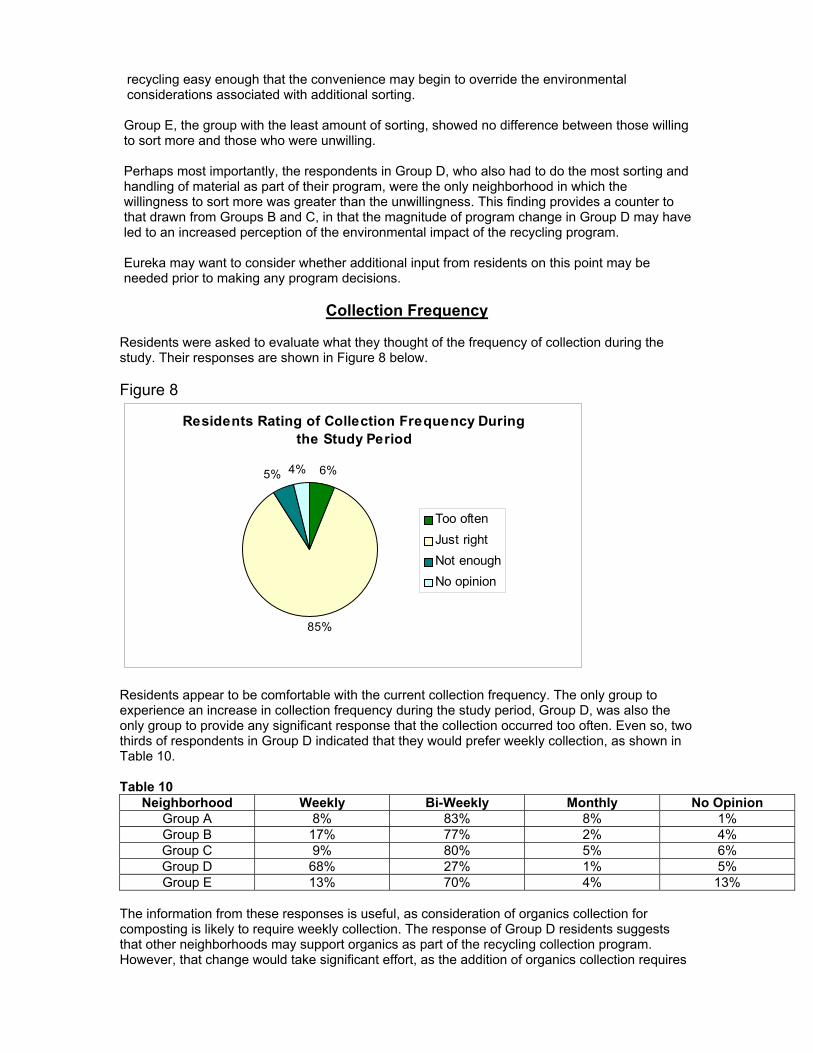
recycling easy enough that the convenience may begin to override the environmental considerations associated with additional sorting.
Group E, the group with the least amount of sorting, showed no difference between those willing to sort more and those who were unwilling. Perhaps most importantly, the respondents in Group D, who also had to do the most sorting and handling of material as part of their program, were the only neighborhood in which the willingness to sort more was greater than the unwillingness. This finding provides a counter to that drawn from Groups B and C, in that the magnitude of program change in Group D may have led to an increased perception of the environmental impact of the recycling program. Eureka may want to consider whether additional input from residents on this point may be needed prior to making any program decisions.
Collection Frequency
Residents were asked to evaluate what they thought of the frequency of collection during the study. Their responses are shown in Figure 8 below. Figure 8
Residents Rating of Collection Frequency During the Study Period
6%
85%
5% 4%
Too oftenJust rightNot enoughNo opinion
Residents appear to be comfortable with the current collection frequency. The only group to experience an increase in collection frequency during the study period, Group D, was also the only group to provide any significant response that the collection occurred too often. Even so, two thirds of respondents in Group D indicated that they would prefer weekly collection, as shown in Table 10. Table 10
Neighborhood Weekly Bi-Weekly Monthly No Opinion Group A 8% 83% 8% 1% Group B 17% 77% 2% 4% Group C 9% 80% 5% 6% Group D 68% 27% 1% 5% Group E 13% 70% 4% 13%
The information from these responses is useful, as consideration of organics collection for composting is likely to require weekly collection. The response of Group D residents suggests that other neighborhoods may support organics as part of the recycling collection program. However, that change would take significant effort, as the addition of organics collection requires

the most substantial changes on the part of residents. Given the support for it, Eureka should feel encouraged to further explore this program option.
Residents were asked if they were willing to pay for weekly collection. The answers are below. Table 11
Neighborhood Percentage willing to pay for weekly collection Overall 26% Group A 6% Group B 20% Group C 19% Group D 61% Group E 20%
Eureka asked specifically to see of those respondents in Group D who indicated that they “preferred the regular method” of recycling, how frequently did they indicate they wanted their recyclables collected. 19% of respondents in Group D preferred the “regular method” of recycling. Their preference for collection frequency follows:
45% want weekly collection. 50% want bi-weekly collection. 5% wanted monthly collection.
Also, Eureka asked to compare how Group D rated the collection frequency in the study period to their preferred frequency of collection. This comparison reveals that 80% of Group D thought the collection frequency was “just right” and 68% said they preferred weekly collection. Of those that thought collection frequency was “just right”, their indicated preference for collection frequency is as follows:
84% want weekly collection. 14% want bi-weekly collection. 2% want monthly collection.
Glass Recycling Eureka asked how residents would like to see their glass recycled. There is a growing concern that glass will be used as alternative daily landfill cover instead of being made back into glass containers or used as an aggregate additive for roadbed. The total responses clearly favor traditional glass-to-glass recycling systems. A complete breakdown of the responses follows. Figure 9
Prefered Management Method for Glass
Landfill Cover0%
Bottles and Jars51%
Roadbed20%
Disposal1%
No opinion28%
Landfill CoverBottles and JarsRoadbedDisposalNo opinion
If the “no opinions” are disregarded, less that 1% of residents who express a preference for how their glass should be recycled prefers seeing it used as landfill cover or discarded in the trash.

Educational Material
Eureka asked what method of providing educational assistance to residents was most preferred. The responses are presented in Table 12. More than half (52 percent) of respondents indicated that they preferred the materials received in the mail. This response was easily the most popular answer; it was rated first in all five neighborhoods. The material dropped at the door was second at 22 percent overall, with Eureka staff person going door-to-door placing third at 10 percent, and the phone hot-line was at 2 percent. Table 12
Neighborhood EUREKA Staff Material at Door
Material Mailed Hotline
Group A 14% 22% 37% 5% Group B 12% 14% 63% 1% Group C 9% 20% 52% 3% Group D 10% 29% 41% 2% Group E 8% 18% 59% 2%
Paper Recycling
In cooperation with the Recycling Association of Minnesota, Eureka was attempting to increase the volume of paper recovered in Group A through additional educational material. At issue is why residents throw otherwise recyclable paper into the trash. The results indicate the large majority of residents think the paper they do not recycle is not capable of being recycled due to contamination. Table 13
Reason for throwing paper away Percent of respondents Contamination 75% Confidentiality 25% Unsure of what to recycle 8% Sorting and recycling too difficult 9% Other 13%
Organics Collection
The State of Minnesota estimates that organic materials – unrecovered paper and food scraps – comprise one quarter of the waste stream. Eureka, as with many other recycling programs around the county, is interested in recovering and composting this material. To test the recovery of this material, one neighborhood, Group D, was provided a wheeled-cart, an ice-cream pail, compostable bags, weekly collection and very specific instructions on what to include in the collection program. Organics collection and composting would represent a major change in the recycling program, requiring fairly significant changes within households. The survey sought to evaluate the willingness or residents to embrace a change of this magnitude. Questions included assessing overall attitudes and willingness to pay for the service, and specific issues related to the impact the program had on garbage generation and which tools were most valuable for participants in the program. Residents were asked how valuable organics collection and composting is. A full 44% indicated that it was either “very valuable” (22%) or “somewhat valuable” (22%). This number increases dramatically when isolating Group D where 75% of the residents said it was either “very” or “somewhat” valuable to collect organics at the curb. However in Group A, the aggregate of those who thought organics collection was either very (10%) or somewhat valuable (16%) was only 26%.

Group D here exemplifies the finding that those that tested a method are most likely to support paying for that method. While this question does not address the issue of cost or payment,
Group D’s familiarity with the collection method facilitated a change in opinion that is not reflected in any other neighborhood. The table below demonstrates the range of opinion residents expressed when provided a range of options regarding management of organics. Table 14
Neighborhood Put into Garbage
Collect Curbside for Composting
Compost in Backyard
Put down in-sink disposal
No opinion
Group A 52% 8% 13% 8% 10% Group B 45% 13% 9% 12% 12% Group C 42% 19% 9% 12% 10% Group D 13% 56% 4% 12% 4% Group E 32% 18% 20% 15% 13% Total 39% 27% 12% 11% 11%
Most telling are the responses from Group D, which clearly demonstrate a preference for curbside collection, a substantially reduced preference for disposal in the garbage and a much smaller population of those with no opinion. It is important to note that in only one neighborhood, Group A, does the majority prefer throwing it away. As noted in “Response to Tested Methods” those who tested organics collection were the most likely to support paying for it. However, this level of support (52%) was the lowest among all the methods tested by the neighborhood that tested a specific method. Support for collection of organics in Group D was highest among those residents who indicated organics collection had a significant change on the amount of garbage they produced. Those in Group D who did not indicate any impact on their garbage were equally strong in their opposition to paying for curbside collection or organics. Respondents indicated that providing the tools and information reinforced their participation in the organics collection program. No single factor among the following – providing a pail for in-home collection, providing bags to line the pail, providing the wheeled-cart and educational material – was singled out as most important nor any identifiable combination of tools and information. However the role these items played in the organics collection should not be underestimated as only 12% of respondents indicated they would have participated without them. Group D was also asked what they liked about composting their organics. As with the other questions where residents were asked to select one or more reasons, the most respondents listed more than one reasons. The responses in Table 15 appear to show that residents embraced the environmental impact of organics collection and composting, though it is worth noting that the strong support for paying for the organics collection and composting program is strongest among those residents who experienced a noticeable decrease in their garbage volumes. Table 15
Reasons why residents liked composting organics Frequency of Response It was a new way for me to help improve the environment
60%
I could recycle my organics instead of throwing them in the trash
59%
I had less garbage 46% Once I set up my system, it was easy to do 41% I could have reduced my garbage bill 20% My garbage didn’t stink or leak 12% Other 11%

Residents in Group D were also asked to rate the specific program elements of the organics
collection system by identifying those things that were important to them for participation in the program. Their rankings of the program elements are below. Table 16
Program Element Frequency of Response Weekly Collection 50% Cart 46% Biocorp Bags 38% Information on what to compost 32% Kitchen pail 28% Would have participated anyway 20% Other 5%
There is a very strong preference for a frequent collection system that is easily accessible and usable. The combination of weekly collection and the wheeled cart seems to be a clear element of a successful organics program. Certainly, good information and in-house tools should be considered for the program as well. It is difficult to suggest that any program element is not important from these responses. The 20 percent who would have participated anyway suggests that any organics recycling program may be better received than the relatively weak support for organics collection in other neighborhoods indicates.
Conclusions Overall there are several clear conclusions: • Those neighborhoods that tested a new method of collecting recyclables generally supported
and were willing to pay for that method of collection. In order of preference, residents are willing to pay for plastics collection, carts, organics collection and weekly collection of material.
• Environmental benefit, convenience and cost, in that order, drive support for the various program changes. With the exception of the control group, cost is always the last consideration of the neighborhoods tested. However, outside of the collection of plastics at the curb there is no one cost that all five neighborhoods would agree to incur.
• Residents, while seemingly pleased with the current program, are willing to consider program changes that allow them to recycle more material in a more convenient manner.
Eureka appears to be a unique position to make changes to their recycling program that may increase overall participant satisfaction with the program,

APPENDIX C:
Governmental Advisory Associates- Residuals at Single Stream Facilities

RESIDUAL RATES AT SINGLE STREAM MRFs WITH GLASS
Name Location Operator Size Residuals
Valley Recycling Chandler AZ Valley Recycling Works
250 18%
37th Avenue SWM Fac
Phoenix AZ Waste Management 195 31%
Phoenix Materials Phoenix AZ Hudson Baylor 112 20% Tempe MRF Phoenix AZ Waste Management 50 31% Dart Downey Area Downey CA Maurey Adnoff &
LASan 160 20%
Sunset Waste Fresco Visalia CA Sunset Waste 110 23% Gilton MRF Modesto CA Gilton Res. Rec. 17 25% Bestway Recycling Los Angeles
CA Bestway Recycling 88 35%
North Hills MRF North Hills CA
City Fibers 55 35%
Health Sanitation Serv. Santa Maria CA
Waste Management 70 32%
CR&R Stanton CA CR&R 323 25% Victor Valley Victorville CA Burrtec Waste Ind. 85 25% Sunset Waste Paper Viscalia CA Sunset Waste 50 33% Tulare County Recycling
Visalia CA Waste Management 66 25%
Tidewater Fibre Newport News VA
Tidewater Fibre Corp. 129 30%
Average 117 27.2% Compiled by Governmental Advisory Associates

APPENDIX D:
Educational Materials
Download a separate PDF of the educational materials at: www.eurekarecycling.org

APPENDIX E:
WMI Recommendations


APPENDIX F:
Letter –NRG Processing Solutions


APPENDIX G:
Letter- City of Saint Paul