Embed Size (px)
Citation preview
A comparasion of classification
methods applyed on credit cardfraud detection
Manoel Fernando Alonso Gadi
Alair Pereira do Lago
Xidi Wang
Article presentedto
Brazil, Sao Paulo, april 2008
AbstractIn 2002, January the 31th, the famous journal Nature [Kla02], with a strongimpact in the scientific environment, published some news about immunebased systems. Amoung the diffenrent considered applications, we can finddetection of fraudulent financial transactions. One can find there the possibil-ity of a commercial use of such system as close as 2003, in a British company.In spite of that, we do not know of any scientific publication that uses Artifi-cial Immune Systems in financial fraud detection. This work reports resultsvery satisfactory on the application of Artificial Immune Systems (AIS) tocredit card fraud detection.
In fact, scientific finantion fraud detection publications are quite rare, aspoint out Phua et al. [PLSG05], in particular for credit card transactions.Phua et al. points out the fact that no public database of financial fraudtransactions is available for public tests as the main cause of such a smallnumber of publications. Two of the most important publications in this sub-ject that report results about their implementations are the prized [MTV00],that compairs Neural Networks and Bayesian Networks in credit card frauddetection, with a favoured result for Bayesian Networks and [SFL+97], thatproposed the method AdaCost. This thesis joins both these works and pub-lishes results in credit card fraud detection.
Moreover, in spite the non availability of Maes data and implementations,we reproduce the results of their e amplify the set of comparisons in such away to compare the methods Neural Networks, Bayesian Networks, and alsoArtificial Immune Systems, Decision Trees, and even the simple Naive Bayes.
All work presented here is a compilation of [Gad08] master thesis, whichtook into account the skewed nature of the dataset, as well as the need of aparametric adjustment, sometimes through the usage of genetic algorithms,in order to obtain the best results for each compared method.
1 Introduction
In recent years many bio-inspired algorithms are sprouting for resolu-tion of problems of classification and otimization. As examples of it thereis Ant Colony [MGdL01], Neural Networks [Ros62] and Artificial Immune
Systems [dCT02] and [dCZ].The human systems have been used as a source of inspiration for the
scientific development in some fronts, in artificial intelligence, for instance,some research try to create artificial systems to simulate the functioning ofthe human systems so it could take decisions considered intelligent. An im-portant example of this was the fact of that in January of 2002 the famousmagazine Nature [Kla02] published an article about imuno-based systems,it gave a special approach in applications in the protection of computersagainst intruders and in the detention of fraudulent financial transactions.The same article pointed the future commercial use of imuno-based systemswith respect to detention of fraud in systems does business for the year of2003. Despite of this, works on fraud detention in general are rare, as itwas pointed in Phua et al. [PLSG05]. It indicates the absence of a pub-lic database for application of diverse methods as the main cause of thislow number of publication. Two of the most important publications on thesubject are [MTV00] which compares Neural Nets and Bayesianas Nets inthe detention of fraud in credit cards, emerging with a favorable result toBayesianas Nets, and [SFL+97] that initiates presenting an excellent workon fraud detention, however finishes it for getting more conclusions on thedetention of intruders in computer networks.
The aim of this work was give a real life application of Artificial ImmuneSystems for Credit Card data, with the reproduction of [MTV00] resultsbeetwen Neural Nets and Bayesian Nets, and also including Naive Bayes andDecision Trees in the pool of compared methods. This comparison took intoaccount particularitities of these data, such like skewedness of data and thediferent costs of false positive and false negative. It also involved a parametricadjustment for each method.
Some of the applycation field backgroud: Fraud prevention is a sub-ject that always broght interest and investment from financial institutions,the advent of new technologies as telephone, auto-attendance machines (ATM)and credit card systems have laveraged the volume of fraud loss of manybanks. In this context, fraud prevention, with a special importance of fraudautomatic detection, arises as an open field for applycation of all knownclassification methods.
We live in a world where analysing whether each transaction is or notlegitimate is very expensive, or worst than that, confirming IF a transac-
3
tion was done by a client or a fraudster by calling the card holder is costprohibitive if we do it for all transactions.
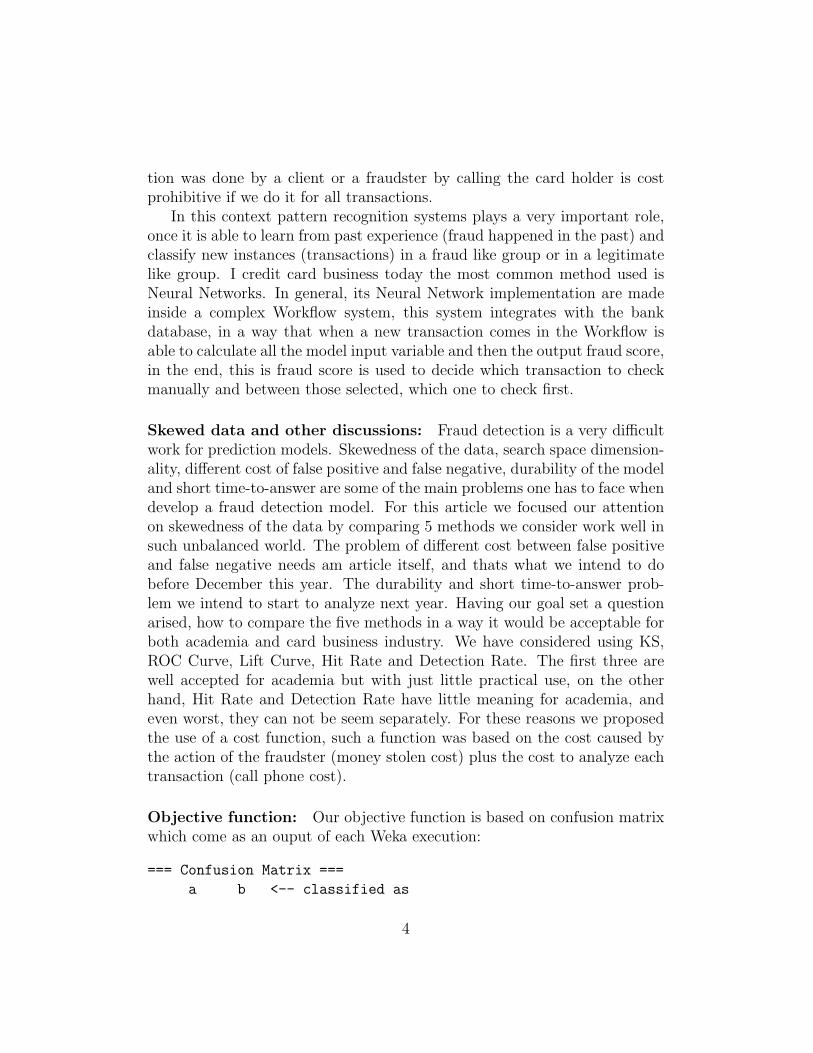
In this context pattern recognition systems plays a very important role,once it is able to learn from past experience (fraud happened in the past) andclassify new instances (transactions) in a fraud like group or in a legitimatelike group. I credit card business today the most common method used isNeural Networks. In general, its Neural Network implementation are madeinside a complex Workflow system, this system integrates with the bankdatabase, in a way that when a new transaction comes in the Workflow isable to calculate all the model input variable and then the output fraud score,in the end, this is fraud score is used to decide which transaction to checkmanually and between those selected, which one to check first.
Skewed data and other discussions: Fraud detection is a very difficultwork for prediction models. Skewedness of the data, search space dimension-ality, different cost of false positive and false negative, durability of the modeland short time-to-answer are some of the main problems one has to face whendevelop a fraud detection model. For this article we focused our attentionon skewedness of the data by comparing 5 methods we consider work well insuch unbalanced world. The problem of different cost between false positiveand false negative needs am article itself, and thats what we intend to dobefore December this year. The durability and short time-to-answer prob-lem we intend to start to analyze next year. Having our goal set a questionarised, how to compare the five methods in a way it would be acceptable forboth academia and card business industry. We have considered using KS,ROC Curve, Lift Curve, Hit Rate and Detection Rate. The first three arewell accepted for academia but with just little practical use, on the otherhand, Hit Rate and Detection Rate have little meaning for academia, andeven worst, they can not be seem separately. For these reasons we proposedthe use of a cost function, such a function was based on the cost caused bythe action of the fraudster (money stolen cost) plus the cost to analyze eachtransaction (call phone cost).
Objective function: Our objective function is based on confusion matrixwhich come as an ouput of each Weka execution:
=== Confusion Matrix ===
a b <-- classified as
4
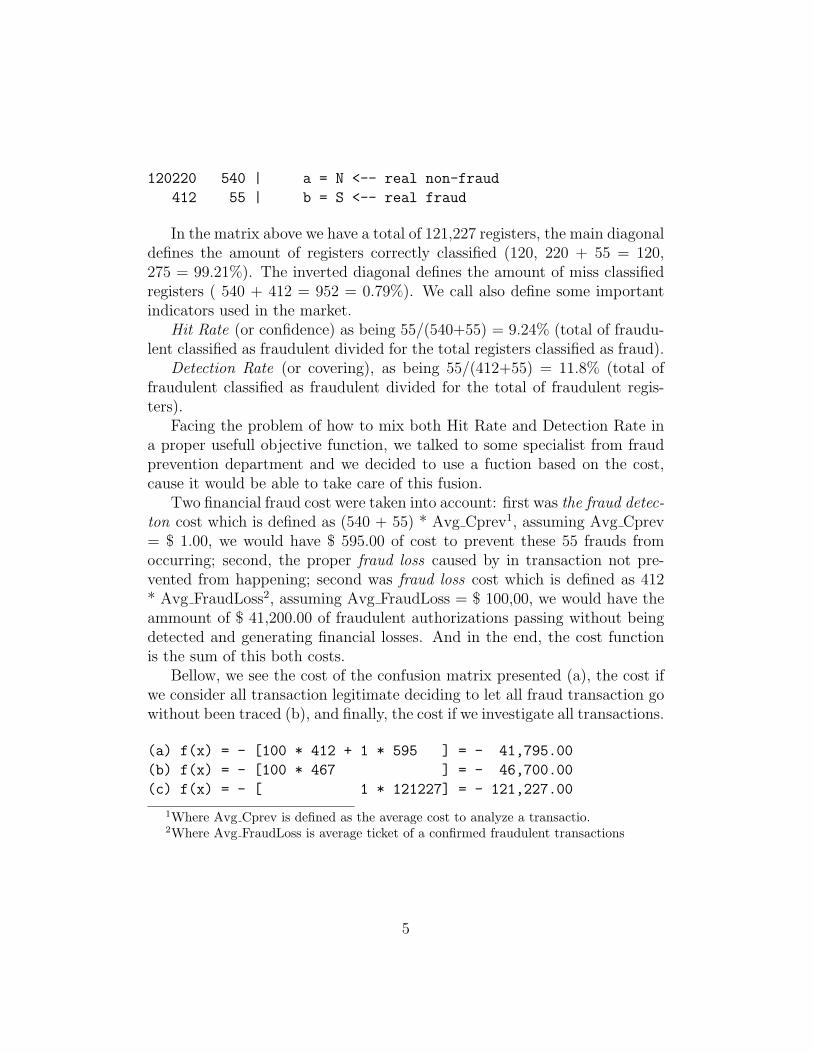
120220 540 | a = N <-- real non-fraud
412 55 | b = S <-- real fraud
In the matrix above we have a total of 121,227 registers, the main diagonaldefines the amount of registers correctly classified (120, 220 + 55 = 120,275 = 99.21%). The inverted diagonal defines the amount of miss classifiedregisters ( 540 + 412 = 952 = 0.79%). We call also define some importantindicators used in the market.
Hit Rate (or confidence) as being 55/(540+55) = 9.24% (total of fraudu-lent classified as fraudulent divided for the total registers classified as fraud).
Detection Rate (or covering), as being 55/(412+55) = 11.8% (total offraudulent classified as fraudulent divided for the total of fraudulent regis-ters).
Facing the problem of how to mix both Hit Rate and Detection Rate ina proper usefull objective function, we talked to some specialist from fraudprevention department and we decided to use a fuction based on the cost,cause it would be able to take care of this fusion.
Two financial fraud cost were taken into account: first was the fraud detec-ton cost which is defined as (540 + 55) * Avg Cprev1, assuming Avg Cprev= $ 1.00, we would have $ 595.00 of cost to prevent these 55 frauds fromoccurring; second, the proper fraud loss caused by in transaction not pre-vented from happening; second was fraud loss cost which is defined as 412* Avg FraudLoss2, assuming Avg FraudLoss = $ 100,00, we would have theammount of $ 41,200.00 of fraudulent authorizations passing without beingdetected and generating financial losses. And in the end, the cost functionis the sum of this both costs.
Bellow, we see the cost of the confusion matrix presented (a), the cost ifwe consider all transaction legitimate deciding to let all fraud transaction gowithout been traced (b), and finally, the cost if we investigate all transactions.
(a) f(x) = - [100 * 412 + 1 * 595 ] = - 41,795.00
(b) f(x) = - [100 * 467 ] = - 46,700.00
(c) f(x) = - [ 1 * 121227] = - 121,227.00
1Where Avg Cprev is defined as the average cost to analyze a transactio.2Where Avg FraudLoss is average ticket of a confirmed fraudulent transactions
5
2 Experimental Description:
The experimental part of our work was initiated when we received andwe transformed the database proceeding from credit card of the Bank, thatwas followed by the definition of the methodology of tests that we were use inour comparisons: the GA. In this chapter, we approach with more of detailsof the data transformation, the GA and the objective function.
In the last section, we argue on the functionality and the domain of theparameters associated to each method.
Data tranformation: Our research received support from an importantbank in the Brazilian credit card market.
We received from the Bank a database with 41647 registers. Each reg-ister represents an authorization of a credit card, in other words, with onlyapproved transactions. The transactions denied for any criteria of creditwas deleted from this database before arriving to the number of 41647 reg-isters. The time window of this this database is between Jul/14/2004 andSep/12/2004.
Evaluation of the cases as fraud and not-fraud: Still under decisionof the Bank, it decided to apply the follow rule for evaluation the class of anauthorization:
• If happened a plea (not recognition of the accomplishment) of a trans-action from the client, or the bank distrust it is a legitimate transactionand confirm it is not with the cliente, in the next 2 months after thedate of the transaction, called performance period, then this transac-tion is considered to be fraudulent.
• Otherwise it was considered legitimat.
Something important to be observed is that when an authorization isfraudulent the Bank has almost 100% of certainty about the class such trans-action belongs, but when we affirm that a transaction is legitimate, we cannotaffirm this in fact legitimate, we only can affirm that it was still not identifiedas fraudulent in the performance window. However, in practical it is almostno relevant, once, according to the Bank, at least 80% of the occured fraudsare identified as fraudulent in the period of 2 months.
6

Sampling: The sampling of transaction to be sent for our study had hadtwo stages:
1. First one was a random sampling of card numbers to be analyzed in thisperiod, not attempting to the fact of the card had or not a transactionin the historical period.
2. Second one was a weighted sampling of the class. Which selected 10% oftransactions evaluated as legitimate and 100% transactions evaluatedas fraudulent.
Categorization: With the database effectively in our hands, the prepara-tion can be illustrated in four stages:
1. First stage, we some frequencies and decide that some variable werenot important to be considered for the modeling (ex: card number).Figure ?? shows how the filtering were performed, the with an x inStage 2 column are those remained for next stage.
2. Second stage was the binding of the variables. All variables but Mer-chant Category Code (MCC) 3 were categorized in up to 10 groups,one digit only.
3. Third stage consisted in transforming the previous database, in a commaseparated value format (csv).
4. Fourth stage was responsible for generating 9 sets of bases. Each setpossessing a pair of bases, a database with 70% of transactions fordevelopment (training sample - training set), and another databasewith 30% of transaction for validation of the models (testing sample -testing set), the table [?] shows that this tables has around the samenumber of frauds and legimates transactions.
After this process of sampling, all databases was converted for Wekaproprietor format (.arff).
3MCC got 32 categories so it could fit the number of groups of Transaction CategoryCode (TCC).
7
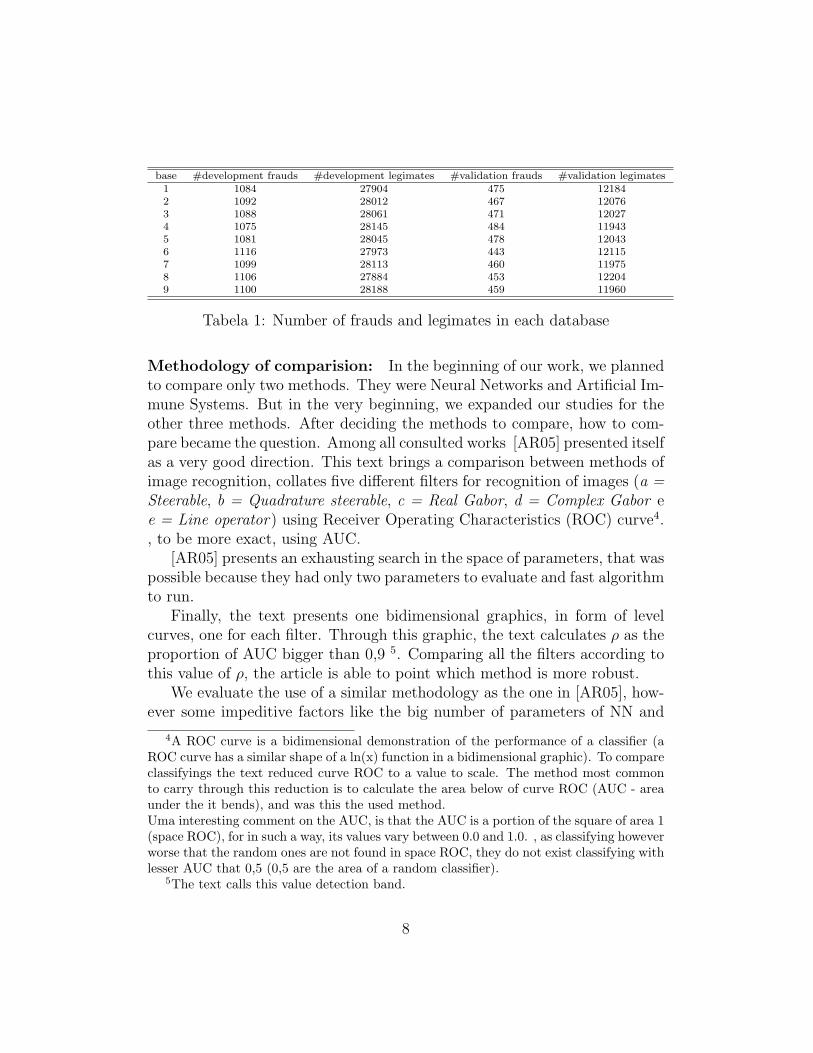
base #development frauds #development legimates #validation frauds #validation legimates1 1084 27904 475 121842 1092 28012 467 120763 1088 28061 471 120274 1075 28145 484 119435 1081 28045 478 120436 1116 27973 443 121157 1099 28113 460 119758 1106 27884 453 122049 1100 28188 459 11960
Tabela 1: Number of frauds and legimates in each database
Methodology of comparision: In the beginning of our work, we plannedto compare only two methods. They were Neural Networks and Artificial Im-mune Systems. But in the very beginning, we expanded our studies for theother three methods. After deciding the methods to compare, how to com-pare became the question. Among all consulted works [AR05] presented itselfas a very good direction. This text brings a comparison between methods ofimage recognition, collates five different filters for recognition of images (a =Steerable, b = Quadrature steerable, c = Real Gabor, d = Complex Gabor ee = Line operator) using Receiver Operating Characteristics (ROC) curve4., to be more exact, using AUC.
[AR05] presents an exhausting search in the space of parameters, that waspossible because they had only two parameters to evaluate and fast algorithmto run.
Finally, the text presents one bidimensional graphics, in form of levelcurves, one for each filter. Through this graphic, the text calculates ρ as theproportion of AUC bigger than 0,9 5. Comparing all the filters according tothis value of ρ, the article is able to point which method is more robust.
We evaluate the use of a similar methodology as the one in [AR05], how-ever some impeditive factors like the big number of parameters of NN and
4A ROC curve is a bidimensional demonstration of the performance of a classifier (aROC curve has a similar shape of a ln(x) function in a bidimensional graphic). To compareclassifyings the text reduced curve ROC to a value to scale. The method most commonto carry through this reduction is to calculate the area below of curve ROC (AUC - areaunder the it bends), and was this the used method.Uma interesting comment on the AUC, is that the AUC is a portion of the square of area 1(space ROC), for in such a way, its values vary between 0.0 and 1.0. , as classifying howeverworse that the random ones are not found in space ROC, they do not exist classifying withlesser AUC that 0,5 (0,5 are the area of a random classifier).
5The text calls this value detection band.
8

AIS, the time it takes to run and Weka not implement ROC/AUC forced usin another direction. As it will be presented in a future work we still workingon, there is this meta-heuristic Cost Sensitive Classifier which implements acost sensitive analysis, and it has a very good parallel with the ROC/AUCkind of analysis.
2.1 Tunning GA
In [Gad08] one can check a very detailed analysis that proves our GA findthe optimal, for page restriction we chose to omite it from here.
GA utilization: For Decison Tree, Bayesian Network and Naive Bayes GAoptimation was not necessary, once they had a reduced number of parametersand a short running time. GA optimation was used for NN and AIS thereforewhich an exhausting search was impracticable.
2.2 Short GA description - for parameter tunning
First step was a 50 random execution, followed by 20 GA generations.Each GA generation combined two random selected candidate ammoung the15 bests from previously generation, it combination performed: cross over,mutation, random change and no action for each parameter independently,and as the generation pass the chance of no action increases. In the end, weperformed a local search around the optimal founded by GA optimazion.
To clarify it, we present part of the code used for GA optimization algo-rithm (L is learning rate parameter of NN):
avg = rand();
if(avg<0.10){ //10% chance of fusion.
Lnew = int((L1 + L2)/2);
} elsif (avg<0.20) { //10% chance of fusion with up mutation.
Lnew = int(rand()*20)/100 + int((L1 + L2)/2);
} elsif (avg<0.30) { //10% chance of fusion with down mutation.
Lnew = -int(rand()*20)/100 + int((L1 + L2)/2);
} elsif (avg<0.40) { //10% chance of up mutation.
Lnew = int(rand()*20)/100 + L1;
} elsif (avg<0.50) { //10% chance of up mutation.
Lnew = -int(rand()*20)/100 + L1;
} elsif (avg<0.75) { //25% chance of no action.
Lnew = L1;
} elsif (avg<0.95) { //20% chance of cross-over.
Lnew = L2;
} else { //5% chance of a random choice.
Lnew = int(100*(rand()+0.001))/100.0;
9
}
L1 represents the learning rate of one of the best candidates from previousgeneration of GA. L2 represents the learning rate of another (and diferent)one of the best candidates from previous generation of GA. Lnew representsthe learning rate of the new candidate created in this generation to be eval-uated. rand() is the function that generates random numbers between 0 and1.0.
As well as performed for learning rate, the algorithm did to other pa-rameters, in a total of 5 of 7 parameters for NN and 7 of 9 parameters forAIS.
3 Parameter description
Instead of presenting the methods in detail our describing the Weka’simplementations, we chose to bring a discussion only about what matter themost for our tests, and that was the set of parameters of each method. Allinformation about the parameters were retrieved from [WF08] and [WF05].
Tree of Decision: DT has two parameters C and M:
• C confidence. Set confidence threshold for pruning. (Default: 0.25)
• M number. Set minimum number of instances per leaf. (Default: 2)
Neural Network: NN possesss seven parameters ( L, M, N, V, S, E, H):
• L num. Set the learning rate. (default 0.3). The closer to zero thesmaller the impact of a new income information.
• M num. Set the momentum (default 0.2). It varies between 0.00 and1.00, and its inclusion (values greater than zero) has for objective toincrease the speed of the training of a neural net and to reduce theinstability.
• N num. Set the number of epochs to train through. (default 500). Forstate space restrition and knowing, after tests, that using N greaterthan 500 did not icrease the performance much we decide to vary thisparameter, fixing it to its default 500.
10
• V num. Set the percentage size of the validation set from the trainingto use. (default 0 (no validation set is used, instead num of epochsis used). It varies between 0% and 99,99%, when this parameter isgreater that zero intend to reduce overfitting. If V = 0 then E loses itsmeaning.
• S num. Set the seed for the random number generator. (default 0). Inour case, as we would like eliminate any random factors, we decide tonot vary this parameter, fixing it to zero.
• E num. Set the threshold for the number of consequetive errors allowedduring validation testing. (default 20). Number between 1 and 100. Incombination with the parameter -N, forms the stop conditions of thealgorithm.
• H str. Set the number of nodes to be used on each layer. Each numberrepresents its own layer and the num of nodes on that layer. Eachnumber should be comma seperated. There are also the wildcards ’a’,’i’, ’o’, ’t’ (default 4).
This will set what the hidden layers are made up of when auto build isenabled. Note to have no hidden units, just put a single 0, Any more 0’swill indicate that the string is badly formed and make it unaccepted.Negative numbers, and floats will do the same. There are also somewildcards. These are ’a’ = (number of attributes + number of classes) /2, ’i’ = number of attributes, ’o’ = number of classes, and ’t’ = numberof attributes + number of classes.
Naive Bayes: NB does not have any parameter.
Bayesian Network: BN has three parameters (D, Q, E):
• D defines if a structure called ADTree will or not be used;
• Q defines which search for topology algorithm will be used, the avail-able ones are: GeneticSearch, HillClimber, K2, LocalScoreSearchAlgo-rithm, RepeatedHillClimber, SimulatedAnnealing, TabuSearch e TAN,the search algorithms has two parameters:
– P defines the number of parentes allowed in the topology.
11
– S defines the type of score to be used to build the conditionaltable, they can be: BAYES, BDeu, MDL, ENTROPY e AIC;
• E define the estimator. An estimator is algorithm to calculate the con-ditional tables. In Weka they can be: BayesNetEstimator, BMAEsti-mator, MultiNomialBMAEstimator e SimpleEstimator, this estimatorhas one parameter (A): A is called alpha and varies between 0% e 100%,and represent a start value for the conditional probability.
Artificial Immune System: AIS have 10 parameters ( S, F, C, H, M, R,V, A, E, K) 6:
• S num. Set the seed for the random number generator. (default 0). Inour case, as we would like eliminate any random factors, we decide tonot vary this parameter, fixing it to 1 (one). But for AIS, we found aproblem in convergence of some databases we test, so in sama case wehad to change this parameter.
• F perc. Set minimum number percentage affinity threshold (see [WTB04]page 6);
• C num. Clonal Rate is a integer which determine rate of clones .Variesbetween 0 and 100;
• H num. Hyper-mutation rate. Varies between 0 and 100, and deter-mines the percentage of clones (from last parameter) will suffer muta-tion;
• M perc. Mutation rate is a percentage between 0 and 1 that correspondsto the probability of given caracteristic be mutated, only works for thoseclones chose to be mutaded (last parameter);
• R num. Total resources is the maximum number of B-Cell (or ARB)allowed in the system;
• V perc. Stimulation threshold is a number between 0 and 1 used ascriteria to keep or drop a given B-Cell;
6The implementation used here is the 1.6 version (March 2006) of Jason Brownleeat [Bro05]. Brownlee says he has implemented the algorithm founded in [WTB04].
12
• A num. Number of affinity threshold instances. Unfortunatly, thisparameter did not receive explanation in [Bro05], so we decided to notchange it, fixing it to its default -1;
• E num. Memmory pool size. Define the number of random initialisationinstances. By simplicity we varied it between 0 and 10;
• K num. K nearest neighbors represent the number of B-Cell to bematched and consulted in a voting election of which class the currenttransaction belongs to (fraud or legitimate?). K equals to 1 means novoting.
4 Result’s Summary.
This section brings summarized view of the results reached in our execu-tions.
To clarify, the five compared methods were: Naive Bayes (NB), NeuralNetwork (NN), Bayesian Network (BN), Artificial Immune System (AIS) andDecision Tree(DT).
And the execution strategies for a given method M were: StandDEF (M)7, PadraoGA(M) and PadraoSTA(M).
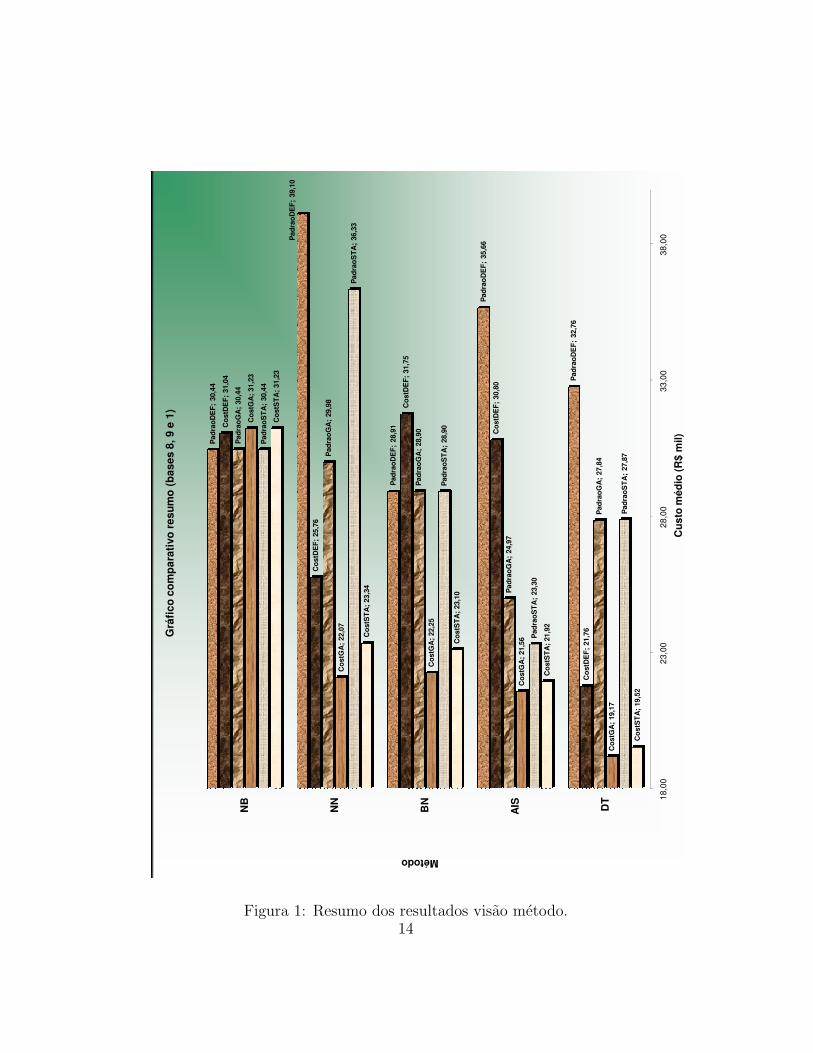
By method analyses: Figure 1 shows in a very condensed way how eachmethod performed in each different strategy we used. We choose to showhere only the results with the 3 databases for evaluation. With this figurewe can see that:
• Method NB does not has any parameter;
• NN obtained a decrease of 23.33%8 of the cost when we applied the GAin relation to the execution with default parameters;
7Stand must be to be interpreted as the standard execution of Weka (without any meta-heuristics); DEF must be interpreted as the use of the default parameters of Weka; GA mustbe interpreted as being used the optimized set of parameters using genetic algorithm foreach database; and STA must be interpreted as being used optimal stable set of parameters(in a semi-exhausting search for NN and AIS at 6 out of the 9 databases.
823.33% = 1 - $ 29.98 thousands / $ 39.10 thousands = 1 −PadraoGA(NN)/PadraoDEF (NN)
13
Pad
rao
DE
F;
32,7
6
Pad
rao
DE
F;
35,6
6
Pad
rao
DE
F;
28,9
1
Pad
rao
DE
F;
39,1
0
Pad
rao
DE
F;
30,4
4
Co
stD
EF
; 21,7
6
Co
stD
EF
; 30,8
0
Co
stD
EF
; 31,7
5
Co
stD
EF
; 25,7
6
Co
stD
EF
; 31,0
4
Pad
rao
GA
; 27,8
4
Pad
rao
GA
; 24,9
7
Pad
rao
GA
; 28,9
0
Pad
rao
GA
; 29,9
8
Pad
rao
GA
; 30,4
4
Co
stG
A;
19,1
7
Co
stG
A;
21,5
6
Co
stG
A;
22,2
5
Co
stG
A;
22,0
7
Co
stG
A;
31,2
3
Pad
rao
ST
A;
27,8
7
Pad
rao
ST
A;
23,3
0
Pad
rao
ST
A;
28,9
0
Pad
rao
ST
A;
36,3
3
Pad
rao
ST
A;
30,4
4
Co
stS
TA
; 19,5
2
Co
stS
TA
; 21,9
2
Co
stS
TA
; 23,1
0
Co
stS
TA
; 23,3
4
Co
stS
TA
; 31,2
3
18
,00
2
3,0
0
28
,00
3
3,0
0
38
,00
DT
AIS
BN
NN
NB
Cu
sto
mé
dio
(R
$ m
il)
Método
Grá
fic
o c
om
pa
rati
vo
re
su
mo
(b
as
es
8,
9 e
1)
Figura 1: Resumo dos resultados visao metodo.14
• BN, as well as NB, did not reduced the cost, therefore by changingthe maximum number of a node parents in the BN was not enough tomodify the probability so that it would changes the classification;
• AIS obtained a very interisting result. The use of GA reduced in29.98%9 the cost in relation to the execution with default parameters;
• Meanwhle, DT reached 15.01% 10 reduces at the cost in relation to theexecution with default parameters.
In all but BN and NB, we see that, in general, we obtain considerablereductions using the genetic algorithm for the parametric search.
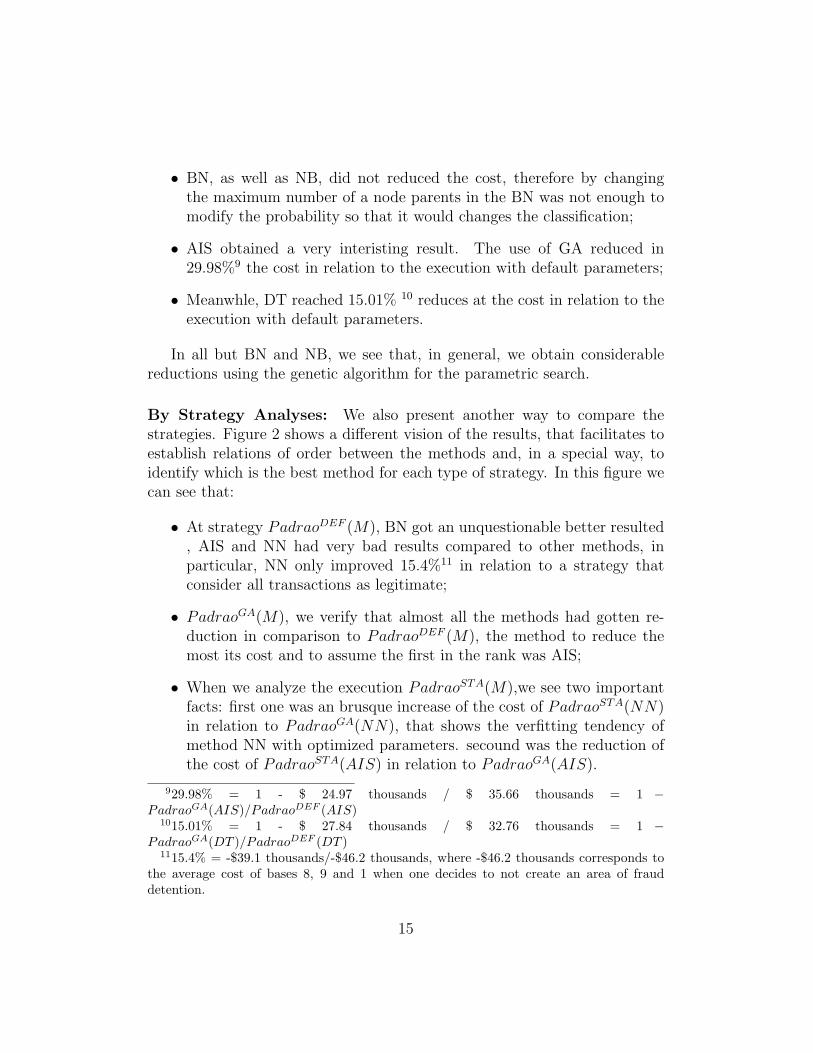
By Strategy Analyses: We also present another way to compare thestrategies. Figure 2 shows a different vision of the results, that facilitates toestablish relations of order between the methods and, in a special way, toidentify which is the best method for each type of strategy. In this figure wecan see that:
• At strategy PadraoDEF (M), BN got an unquestionable better resulted, AIS and NN had very bad results compared to other methods, inparticular, NN only improved 15.4%11 in relation to a strategy thatconsider all transactions as legitimate;
• PadraoGA(M), we verify that almost all the methods had gotten re-duction in comparison to PadraoDEF (M), the method to reduce themost its cost and to assume the first in the rank was AIS;
• When we analyze the execution PadraoSTA(M),we see two importantfacts: first one was an brusque increase of the cost of PadraoSTA(NN)in relation to PadraoGA(NN), that shows the verfitting tendency ofmethod NN with optimized parameters. secound was the reduction ofthe cost of PadraoSTA(AIS) in relation to PadraoGA(AIS).
929.98% = 1 - $ 24.97 thousands / $ 35.66 thousands = 1 −PadraoGA(AIS)/PadraoDEF (AIS)
1015.01% = 1 - $ 27.84 thousands / $ 32.76 thousands = 1 −PadraoGA(DT )/PadraoDEF (DT )
1115.4% = -$39.1 thousands/-$46.2 thousands, where -$46.2 thousands corresponds tothe average cost of bases 8, 9 and 1 when one decides to not create an area of frauddetention.
15
DT
; 19,5
2
DT
; 27,8
7
DT
; 19,1
7
DT
; 27,8
4
DT
; 21,7
6
DT
; 32,7
6
AIS
; 21,9
2
AIS
; 23,3
0
AIS
; 21,5
6
AIS
; 24,9
7
AIS
; 30,8
0
AIS
; 35,6
6
BN
; 23,1
0
BN
; 28,9
0
BN
; 22,2
5
BN
; 28,9
0
BN
; 31,7
5
BN
; 28,9
1
NN
; 23,3
4
NN
; 36,3
3
NN
; 22,0
7
NN
; 29,9
8
NN
; 25,7
6
NN
; 39,1
0
NB
; 31,2
3
NB
; 30,4
4
NB
; 31,2
3
NB
; 30,4
4
NB
; 31,0
4
NB
; 30,4
4
18
,00
2
3,0
0
28
,00
3
3,0
0
38
,00
Co
stS
TA
Pa
dra
oS
TA
Co
stG
A
Pa
dra
oG
A
Co
stD
EF
Pa
dra
oD
EF
Cu
sto
mé
dio
(R
$ m
il)
Estratégia
Grá
fic
o c
om
pa
rati
vo
re
su
mo
(b
as
es
8,
9 e
1)
NB
NN
BN
AIS
DT
Figura 2: Resumo dos resultados visao estrategia.Por limitacao tecnica da planilha utilizada, fixado o metodo, a barra deerros presente nas seis estrategias mostrada na figura precisa ser a mesma.Adotamos o maximo entre o os seis desvios-padrao.
16
We suppose that this happened due to the fact that AIS more param-etershan all the other, therefore the amplest parametric search space.In a way that when the parametric space is reduced, after the freezingof some parameters, during the process of stabilization of the parame-ters, can be observed a more efficient optimization. This phenomenonis many times mentioned as being “Curse of Dimensionality”.
• Temos como ultima estrategia, CostSTA(M). Aqui fica clara a supe-rioridade de DT sobre os demais metodos, AIS passa a ocupar umasegunda colocacao com folga, NN e BN se igualam na terceira posicao,e verificamos que NB se apresentou como sendo o pior metodo.
Finally, we detach that Naive Bayes was the worst amongst the comparedmethods, Neural Netwok loses much performance when a set of stable pa-rameters is required, and Artificial Immune System and Decision Tree hadpresented themselves as the best methods.
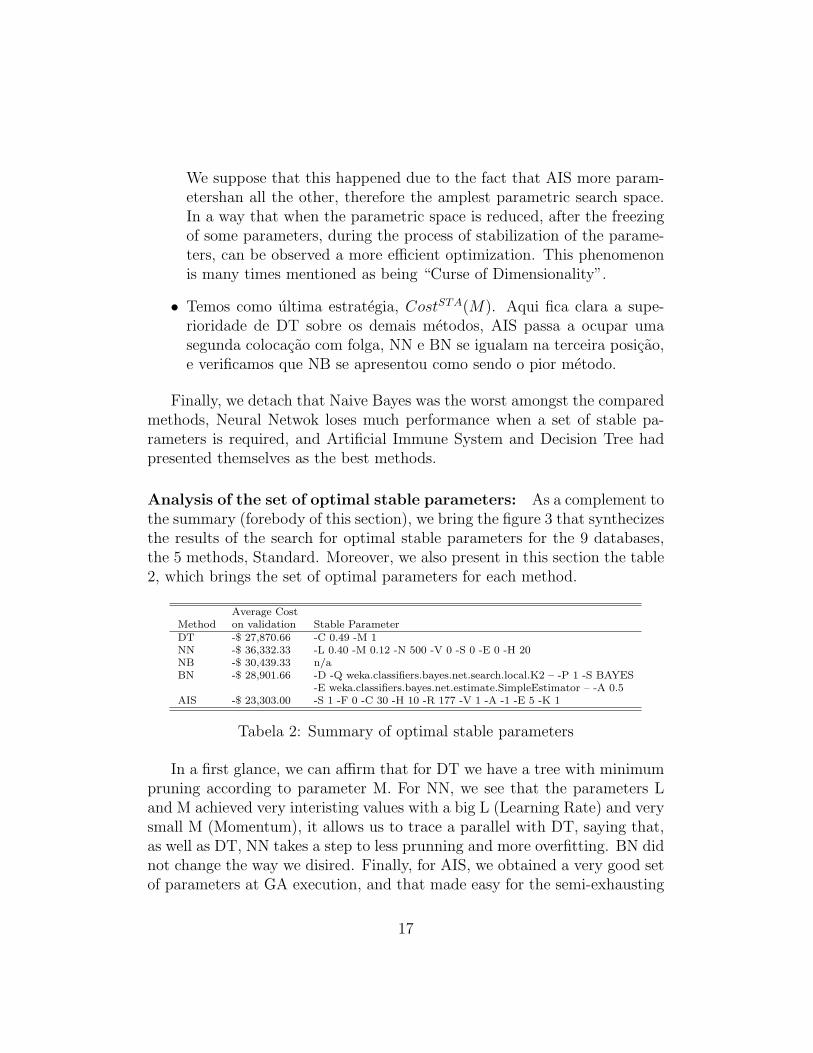
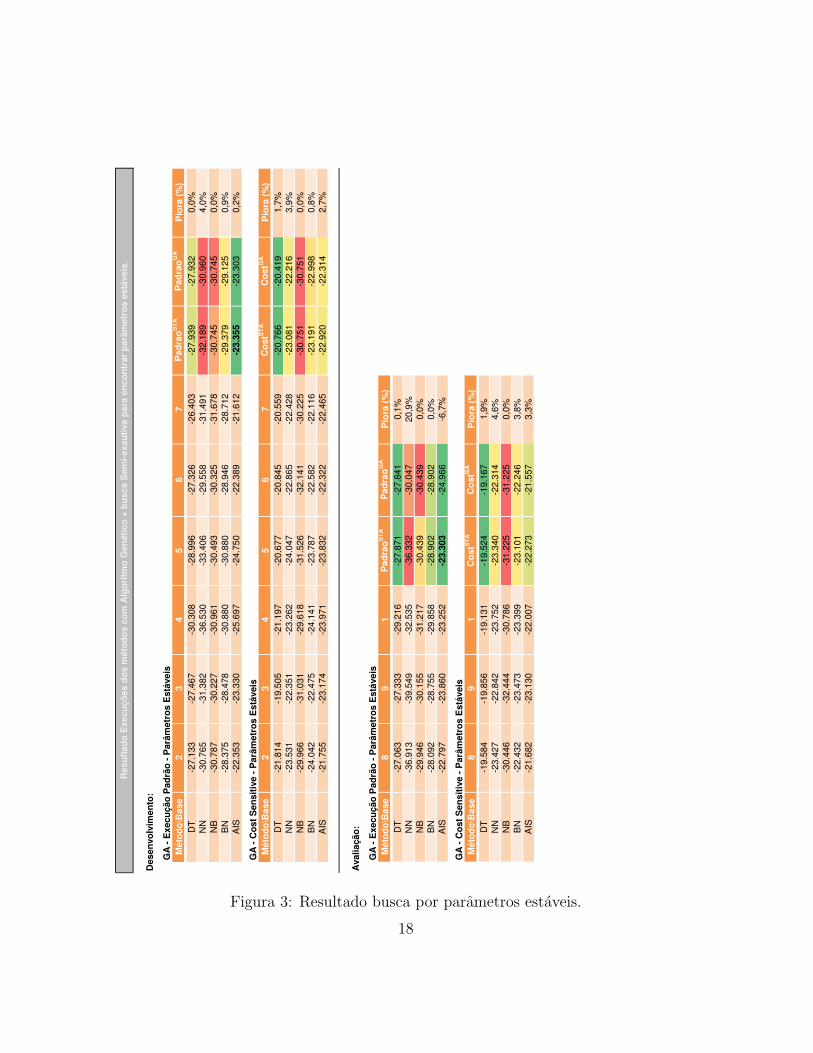
Analysis of the set of optimal stable parameters: As a complement tothe summary (forebody of this section), we bring the figure 3 that synthecizesthe results of the search for optimal stable parameters for the 9 databases,the 5 methods, Standard. Moreover, we also present in this section the table2, which brings the set of optimal parameters for each method.
Average CostMethod on validation Stable ParameterDT -$ 27,870.66 -C 0.49 -M 1NN -$ 36,332.33 -L 0.40 -M 0.12 -N 500 -V 0 -S 0 -E 0 -H 20NB -$ 30,439.33 n/aBN -$ 28,901.66 -D -Q weka.classifiers.bayes.net.search.local.K2 – -P 1 -S BAYES
-E weka.classifiers.bayes.net.estimate.SimpleEstimator – -A 0.5AIS -$ 23,303.00 -S 1 -F 0 -C 30 -H 10 -R 177 -V 1 -A -1 -E 5 -K 1
Tabela 2: Summary of optimal stable parameters
In a first glance, we can affirm that for DT we have a tree with minimumpruning according to parameter M. For NN, we see that the parameters Land M achieved very interisting values with a big L (Learning Rate) and verysmall M (Momentum), it allows us to trace a parallel with DT, saying that,as well as DT, NN takes a step to less prunning and more overfitting. BN didnot change the way we disired. Finally, for AIS, we obtained a very good setof parameters at GA execution, and that made easy for the semi-exhausting
17
Desen
vo
lvim
en
to:
GA
- E
xecu
ção
Pad
rão
- P
arâ
metr
os E
stá
veis
Méto
do
\Base
23
45
67
Pad
rao
ST
AP
ad
rao
GA
Pio
ra (
%)
DT
-27.1
33
-27.4
67
-30.3
08
-28.9
96
-27.3
26
-26.4
03
-27.9
39
-27.9
32
0,0
%
NN
-30.7
65
-31.3
82
-36.5
30
-33.4
06
-29.5
58
-31.4
91
-32.1
89
-30.9
60
4,0
%
NB
-30.7
87
-30.2
27
-30.9
61
-30.4
93
-30.3
25
-31.6
78
-30.7
45
-30.7
45
0,0
%
BN
-28.3
75
-28.4
78
-30.8
80
-30.8
80
-28.9
46
-28.7
12
-29.3
79
-29.1
25
0,9
%
AIS
-22.3
53
-23.3
30
-25.6
97
-24.7
50
-22.3
89
-21.6
12
-23.3
55
-23.3
03
0,2
%
GA
- C
ost
Sen
sit
ive -
Parâ
metr
os E
stá
veis
Méto
do
\Base
23
45
67
Co
stS
TA
Co
stG
AP
iora
(%
)
DT
-21.8
14
-19.5
05
-21.1
97
-20.6
77
-20.8
45
-20.5
59
-20.7
66
-20.4
19
1,7
%
NN
-23.5
31
-22.3
51
-23.2
62
-24.0
47
-22.8
65
-22.4
28
-23.0
81
-22.2
16
3,9
%
NB
-29.9
66
-31.0
31
-29.6
18
-31.5
26
-32.1
41
-30.2
25
-30.7
51
-30.7
51
0,0
%
BN
-24.0
42
-22.4
75
-24.1
41
-23.7
87
-22.5
82
-22.1
16
-23.1
91
-22.9
98
0,8
%
AIS
-21.7
55
-23.1
74
-23.9
71
-23.8
32
-22.3
22
-22.4
65
-22.9
20
-22.3
14
2,7
%
Avaliação
:
GA
- E
xecu
ção
Pad
rão
- P
arâ
metr
os E
stá
veis
Méto
do
\Base
89
1P
ad
rao
ST
AP
ad
rao
GA
Pio
ra (
%)
DT
-27.0
63
-27.3
33
-29.2
16
-27.8
71
-27.8
41
0,1
%
NN
-36.9
13
-39.5
49
-32.5
35
-36.3
32
-30.0
47
20,9
%
NB
-29.9
46
-30.1
55
-31.2
17
-30.4
39
-30.4
39
0,0
%
BN
-28.0
92
-28.7
55
-29.8
58
-28.9
02
-28.9
02
0,0
%
AIS
-22.7
97
-23.8
60
-23.2
52
-23.3
03
-24.9
66
-6,7
%
GA
- C
ost
Sen
sit
ive -
Parâ
metr
os E
stá
veis
Méto
do
\Base
89
1C
ostS
TA
Co
stG
AP
iora
(%
)
DT
-19.5
84
-19.8
56
-19.1
31
-19.5
24
-19.1
67
1,9
%
NN
-23.4
27
-22.8
42
-23.7
52
-23.3
40
-22.3
14
4,6
%
NB
-30.4
46
-32.4
44
-30.7
86
-31.2
25
-31.2
25
0,0
%
BN
-22.4
32
-23.4
73
-23.3
99
-23.1
01
-22.2
46
3,8
%
AIS
-21.6
82
-23.1
30
-22.0
07
-22.2
73
-21.5
57
3,3
%
Resu
ltad
o E
xecu
çõ
es d
os m
éto
do
s c
om
Alg
ori
tmo
Gen
éti
co
+ b
usca S
em
i-exau
tiva p
ara
en
co
ntr
ar
parâ
metr
os e
stá
veis
.
Figura 3: Resultado busca por parametros estaveis.
18
search for optimal stable parameters, one of the most surprisinly results wasthe K equals to 1, it means no voting is necessary, the first rule to matchdecides the class.
5 Conclusions and future works
Our work consisted in presenting a comparison of five methods of classi-fication (Decision Tree, Neural Network, Bayesian Network, Naive Baye andArtificial Immune System), all the used implementations had been proceed-ing from the basic package of the Weka-3-4-11, except AIS whose author wasLee [Bro05]. And, through the analysis of the results of the tests that wecarry through, we could arrive at some conclusions.
Perhaps because DT is a classic classification method, it has been forgot-ten in recent works, however still reveals itself as one of the best methods,with sufficient competitive results.
The definition of the objective function to be optimized has crucial impactin the quality of the generated model.
In all our executions, except for NB that does not possess any parame-ter, we verify that the best results had not been reached with default set ofparameters, in particular for NN and AIS, the results gotten using defaultparameters are insignificant when compared with those gotten after a para-metric adjustment using GA. Unfortunately, having in hands all results wereached, we can dare to say, that is practically possible to generate any orderof the five methods through an appropriate choice of parameters for eachone.
Our tests had reproduced the results of Maes em [MTV00] when analyzingthat BN is better that NN, this occurred in all our evaluated tests.
NN is the most used method in real application today, however our testshas showed that almost always it is between the worse methods.
On our tests AIS had a surprisingly increase of performance from defaultparameters to GA optimized parameters, and its parameters were such astable in a way that after the search for a set of stable parameters it still gota good performance, and this performance gave him the leadership of ourtests.
In addition to the confirmation of the awarded results achieved for Maes,who pointed that BN is better than NN to detect fraud, we concluded thatDT also belongs to the hall of methods that surpasses NN.
19

Future Works: In the coming future, we intend to analyze in details theset of optimal parameters founded, trying to interpret relations between thevalue of each parameter and the relation to skewedness of the data. We stillworking in a application of a meta-heuristic Cost Sensitive Classifier whichimplements a cost sensitive analysis which has a very good parallel with theROC/AUC kind of analysis.
We intend to compare the five methods of classification about it life spam(or lifetime time persistence) after generated. Because we know that fraud isvery volatile, and it is very common a model loses its prediction strength inshort time after it is in use. This happens because people fraudsters usuallysearch for the ways to embezzle that are not being monitored for models.Then, besides knowing which method generates the best model, is importantto know which one generates the model that remains assertive for longer.
In the beginning of the work we intended to also compare Support VectorMachine (SVM), in fact, we initiated experiments using it. We gave upbecause it was not showing a good performance in the initial experiments,and the available implementation of SVM in Weka (called SMO) is veryunstable for skewed data, in our tests entered in many times in infinite loops.That brings us the desire to search for a more stable implementation of SVMfor the Weka, and to generate all the analyses necessary to include SVMwithin the set of the five analyzed methods.
Referencias
[AR05] Fabio J. Ayres and Rangaraj M. Rangayyan. Performance anal-ysis of oriented feature detectors. In SIBGRAPI, pages 147–154,2005.
[Bro05] Jason Brownlee. Artificial immune recognition system (airs) - areview and analysis. Technical report, Victoria, Australia: Centrefor Intelligent Systems and Complex Processes (CISCP), Facultyof Information and Communication Technologies (ICT), Swin-burne University of Technology, Jan 2005.
[dCT02] Leandro Nunes de Castro and J. Timmis. Artificial Immune Sys-tems: A Novel Paradigm to Pattern Recognition. University ofPaisley, 2002.
20
[dCZ] Leandro Nunes de Castro and Fernando Jose Von Zuben. Artifi-cial immune systems: Part ii - a survey of applications. Technicalreport.
[Gad08] Manoel Fernando Alonso Gadi. Uma comparacao de metodos declassificacao aplicados a deteccao de fraude em cartoes de credito,2008.
[Kla02] Erica Klarreich. Inspired by immunity. Nature, (415):468–470,January 2002. doi:10.1038/415468a.
[MGdL01] Vittorio Maniezzo, Luca Maria Gambardella, and Fabio de Luigi.Ant colony optimization. In Future & Emerging Technologies unitof the European Commission through Project BISON, 2001.
[MTV00] S. Maes, K. Tuyls, and B. Vanschoenwinkel. Machine learningtechniques for fraud detection, 2000.
[PLSG05] Clifton Phua, Vincent Lee, Kate Smith, and Ross Gayler. A com-prehensive survey of data mining-based fraud detection research.In Nao informado, 2005.
[Ros62] F. Rosenblatt. Principles of Neurodynamics. Spartan, New York,1962.
[SFL+97] S. Stolfo, W. Fan, W. Lee, A. Prodromidis, and P. Chan. Creditcard fraud detection using meta-learning: Issues and initial re-sults, 1997.
[WF05] Ian H. Witten and Eibe Franku. Data Mining: Practical MachineLearning Tools and Techniques (Second Edition). Elsevier, 2005.
[WF08] Ian H. Witten and Eibe Franku. Software documentation: Weka,2008. file /Weka-3-4-11/doc/weka/classifiers/functions/
MultilayerPerceptron.html from Weka package.
[WTB04] Andrew Watkins, Jon Timmis, and Lois Boggess. Artificial im-mune recognition system (AIRS): An immune-inspired supervisedmachine learning algorithm. Genetic Programming and EvolvableMachines, 5(3):291–317, September 2004.
21