Embed Size (px)
Citation preview
A Community Profile
FEBRUARY 2013
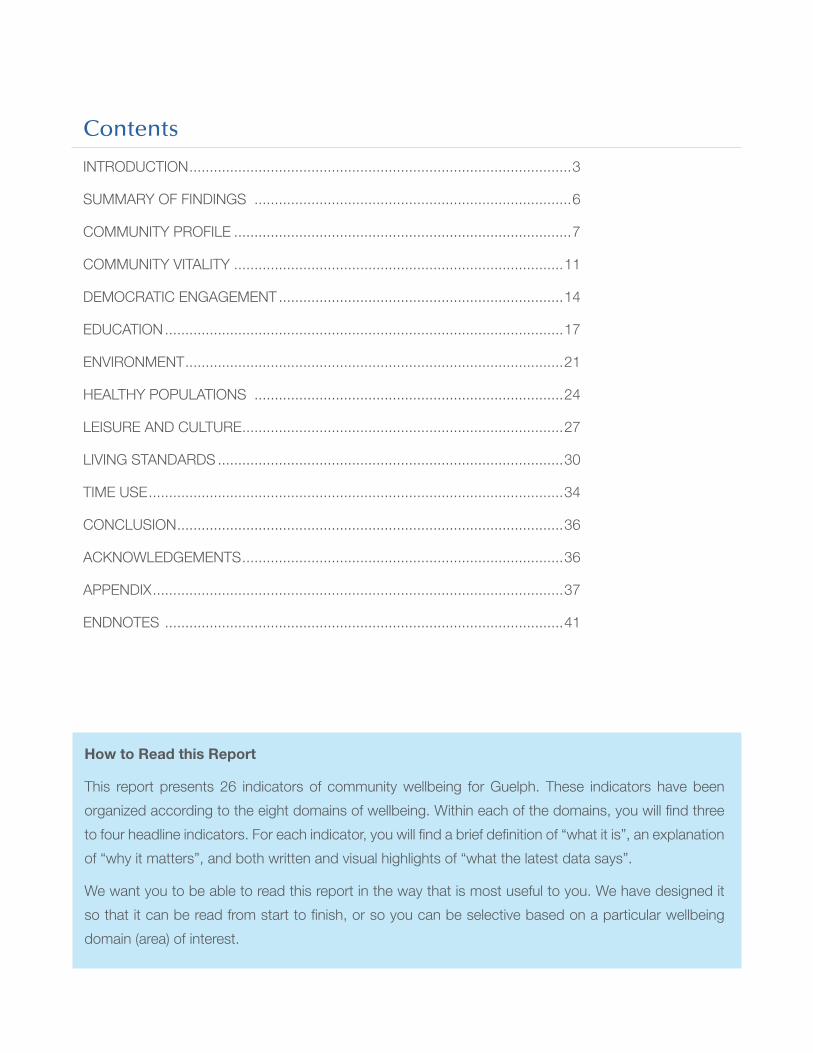
How to Read this Report
This report presents 26 indicators of community wellbeing for Guelph. These indicators have been
organized according to the eight domains of wellbeing. Within each of the domains, you will find three
to four headline indicators. For each indicator, you will find a brief definition of “what it is”, an explanation
of “why it matters”, and both written and visual highlights of “what the latest data says”.
We want you to be able to read this report in the way that is most useful to you. We have designed it
so that it can be read from start to finish, or so you can be selective based on a particular wellbeing
domain (area) of interest.
Contents
INTRODUCTION ..............................................................................................3
SUMMARY OF FINDINGS ..............................................................................6
COMMUNITY PROFILE ...................................................................................7
COMMUNITY VITALITY .................................................................................11
DEMOCRATIC ENGAGEMENT ......................................................................14
EDUCATION ..................................................................................................17
ENVIRONMENT .............................................................................................21
HEALTHY POPULATIONS ............................................................................24
LEISURE AND CULTURE ...............................................................................27
LIVING STANDARDS .....................................................................................30
TIME USE ......................................................................................................34
CONCLUSION ...............................................................................................36
ACKNOWLEDGEMENTS ...............................................................................36
APPENDIX .....................................................................................................37
ENDNOTES ..................................................................................................41
FEBRUARY 2013
Community Wellbeing initiative • a Community PRoFile 3
INTRODUCTION
Wellbeing 1, also known as quality of life, starts with the basics - food, housing and health. But it
also includes how we spend our time, how we care for each other, how we earn a living, and how
we treat the planet. Wellbeing means being safe, and feeling connected to the people and places
around you. It is about the quality of our neighbourhoods and parks, and our lived environment. It
is also about arts, culture and leisure, and having the time to take part in the activities that we love
and that nurture creativity.
What makes for good quality of life varies from one community to another. This report presents
some of the latest statistical measures that have been identified as important to Guelph. It explores
issues like the gap between the rich and poor, how often we participate in leisure activities, the
quality of our jobs and housing, and greenhouse gas emissions.
This document was prepared for the Community Wellbeing Initiative (CWI). It provides a snapshot of
the current state of wellbeing in Guelph based on selected indicators. Along with other measurements,
these indicators form a baseline against which the success of the CWI can be assessed. They show
us where we are making progress, where we are falling behind, and what we can do – both as a
society and as individuals – to improve quality of life.
About the Community Wellbeing Initiative (CWI)
The Community Wellbeing Initiative is a community project that has the goal of providing each
person the best possible quality of life in Guelph. The initiative will define a vision for the future and
develop a shared plan for action to achieve the goals set out by the community.
How the Indicators were Selected
The basis for this report was the Canadian Index of Wellbeing (www.ciw.ca) - a pan Canadian
initiative, which has developed an innovative, comprehensive and integrated system of indicators
to measure and report on wellbeing. This index is based on the understanding that a true measure
of wellbeing takes into account social, cultural, and environmental factors, as well as economic
ones. It emerged out of dissatisfaction with traditional measures of progress that focus primarily on
economic vitality, such as the Gross Domestic Product (GDP).
FEBRUARY 2013
Community Wellbeing initiative • a Community PRoFile 4
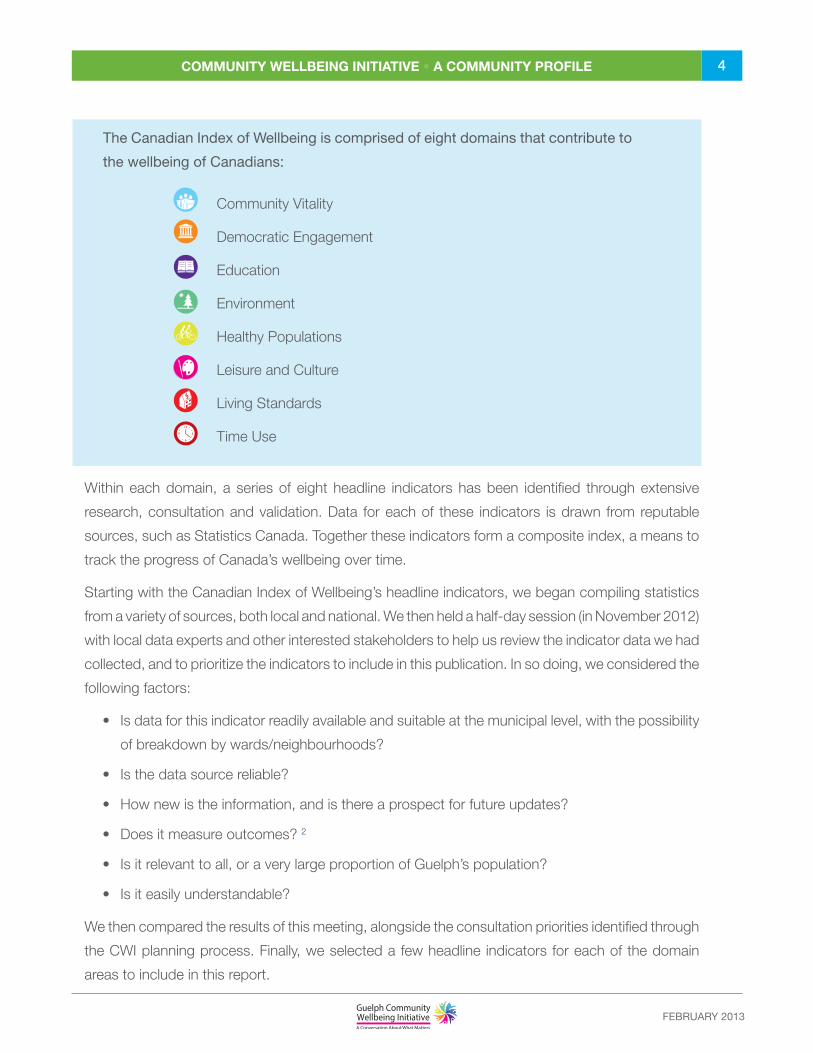
The Canadian Index of Wellbeing is comprised of eight domains that contribute to
the wellbeing of Canadians:
Community Vitality
Democratic Engagement
Education
Environment
Healthy Populations
Leisure and Culture
Living Standards
Time Use
Within each domain, a series of eight headline indicators has been identified through extensive
research, consultation and validation. Data for each of these indicators is drawn from reputable
sources, such as Statistics Canada. Together these indicators form a composite index, a means to
track the progress of Canada’s wellbeing over time.
Starting with the Canadian Index of Wellbeing’s headline indicators, we began compiling statistics
from a variety of sources, both local and national. We then held a half-day session (in November 2012)
with local data experts and other interested stakeholders to help us review the indicator data we had
collected, and to prioritize the indicators to include in this publication. In so doing, we considered the
following factors:
• Is data for this indicator readily available and suitable at the municipal level, with the possibility
of breakdown by wards/neighbourhoods?
• Is the data source reliable?
• How new is the information, and is there a prospect for future updates?
• Does it measure outcomes? 2
• Is it relevant to all, or a very large proportion of Guelph’s population?
• Is it easily understandable?
We then compared the results of this meeting, alongside the consultation priorities identified through
the CWI planning process. Finally, we selected a few headline indicators for each of the domain
areas to include in this report.
FEBRUARY 2013
Community Wellbeing initiative • a Community PRoFile 5
Due to gaps in available indicator data at the municipal level, some of the indicators included in this
report differ from the Canadian Index of Wellbeing. For a complete list of the 64 indicators in the
Canadian Index of Wellbeing, in comparison to the 26 indicators highlighted in this report, please
refer to the Appendix.
Data Explanations
All indicator data is presented for the City of Guelph (population 121,688, 2011 Census), unless
otherwise specified.
Much of the findings in this report come from a recent Community Wellbeing Survey, which was
designed and analyzed by staff of the Canadian Index of Wellbeing on behalf of the City. This survey
was conducted between June 20 and August 18, 2012, and involved 10,512 randomly selected
households in Guelph. The response rate to this survey was approximately 14%, and the results
have been weighted to ensure that the data is representative geographically within the City of
Guelph and that the gender distribution matches the City of Guelph 2011 Census Profile. 3
Other key sources of data include: the City of Guelph, Statistics Canada (Census), Wellington-
Dufferin-Guelph Public Health (which provided special tabulations from the Canadian Community
Health Survey), as well as other community organizations. For a detailed list of references, data
sources and definitions, please refer to the endnotes at the end of this document.
Where available, historical and provincial data has been included in order to provide some initial
context. It should be noted, however, that comparative data is not available for many of the reported
indicators (e.g. no time series is available for the Guelph Community Wellbeing Survey as it began
in 2012).
FEBRUARY 2013
Community Wellbeing initiative • a Community PRoFile 6
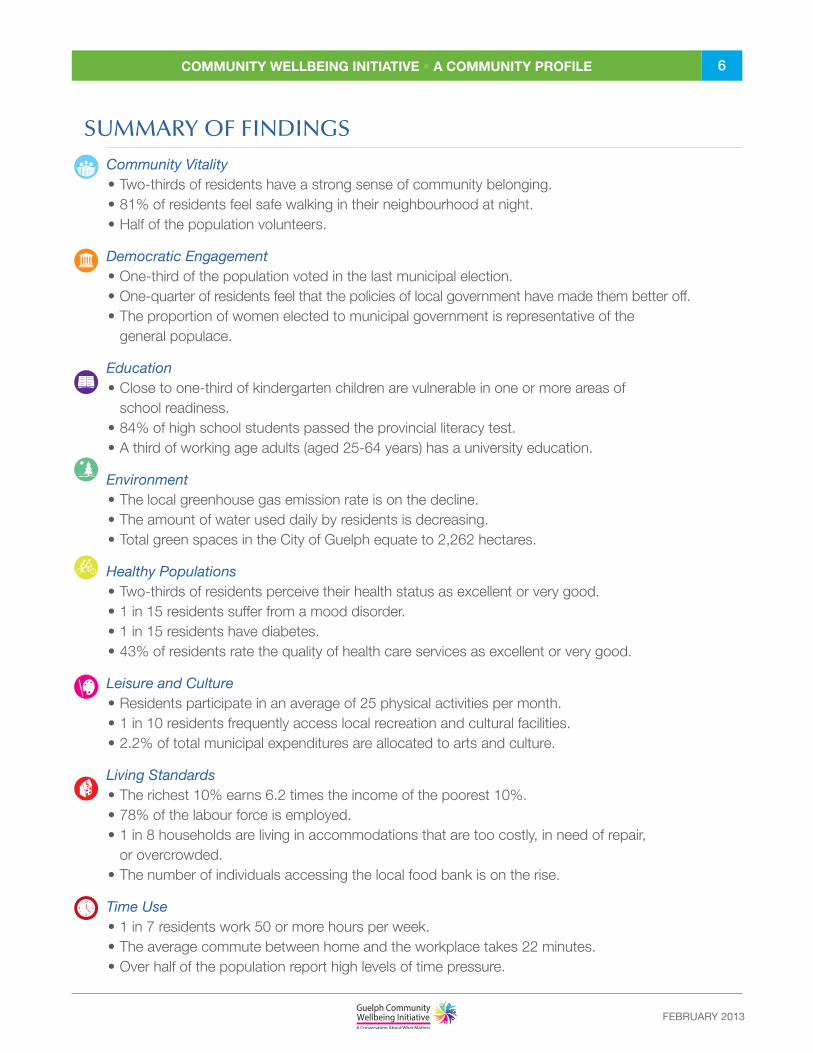
Community Vitality• Two-thirds of residents have a strong sense of community belonging.• 81% of residents feel safe walking in their neighbourhood at night.• Half of the population volunteers.
Democratic Engagement• One-third of the population voted in the last municipal election.• One-quarter of residents feel that the policies of local government have made them better off.• The proportion of women elected to municipal government is representative of the general populace.
Education• Close to one-third of kindergarten children are vulnerable in one or more areas of school readiness.• 84% of high school students passed the provincial literacy test. • A third of working age adults (aged 25-64 years) has a university education.
Environment• The local greenhouse gas emission rate is on the decline. • The amount of water used daily by residents is decreasing.• Total green spaces in the City of Guelph equate to 2,262 hectares.
Healthy Populations• Two-thirds of residents perceive their health status as excellent or very good.• 1 in 15 residents suffer from a mood disorder.• 1 in 15 residents have diabetes.• 43% of residents rate the quality of health care services as excellent or very good.
Leisure and Culture• Residents participate in an average of 25 physical activities per month.• 1 in 10 residents frequently access local recreation and cultural facilities. • 2.2% of total municipal expenditures are allocated to arts and culture.
Living Standards• The richest 10% earns 6.2 times the income of the poorest 10%.• 78% of the labour force is employed.• 1 in 8 households are living in accommodations that are too costly, in need of repair, or overcrowded.• The number of individuals accessing the local food bank is on the rise.
Time Use• 1 in 7 residents work 50 or more hours per week.• The average commute between home and the workplace takes 22 minutes. • Over half of the population report high levels of time pressure.
SUMMARY OF FINDINGS
FEBRUARY 2013
Community Wellbeing initiative • a Community PRoFile 7
COMMUNITY PROFILE
The City of Guelph was founded in 1827, and is considered to be one of the first planned towns
in Canada. Surrounded by the rolling hills of southwestern Ontario, Guelph covers a geographic
area of 87.2 km2, and is situated at the junction of the Speed and Eramosa Rivers. This location
was originally chosen as the headquarters of a British development firm known as the “Canada
Company” by its first superintendent, John Galt.
Guelph has experienced tremendous growth and changes since its inception. The following are
some recently published demographic statistics from the latest Census periods (2011 and 2006)
illustrating the present size and make-up of the community. 4
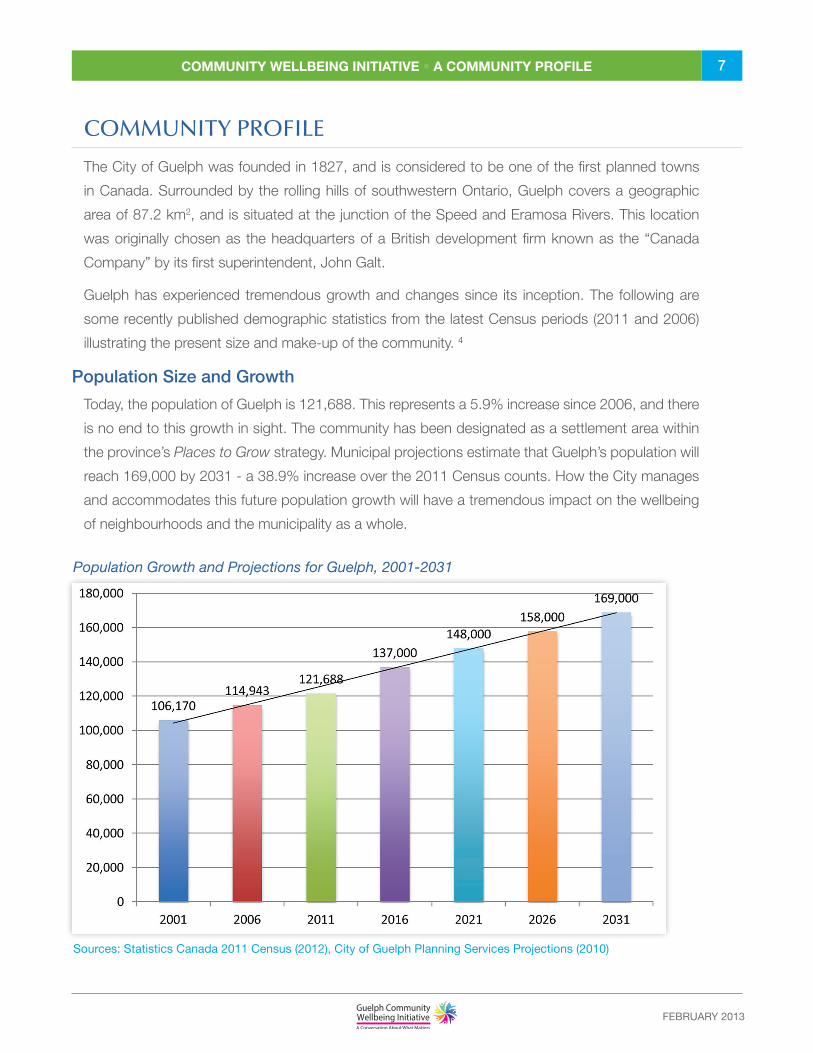
Population Size and Growth
Today, the population of Guelph is 121,688. This represents a 5.9% increase since 2006, and there
is no end to this growth in sight. The community has been designated as a settlement area within
the province’s Places to Grow strategy. Municipal projections estimate that Guelph’s population will
reach 169,000 by 2031 - a 38.9% increase over the 2011 Census counts. How the City manages
and accommodates this future population growth will have a tremendous impact on the wellbeing
of neighbourhoods and the municipality as a whole.
Population Growth and Projections for Guelph, 2001-2031
Sources: Statistics Canada 2011 Census (2012), City of Guelph Planning Services Projections (2010)
FEBRUARY 2013
Community Wellbeing initiative • a Community PRoFile 8
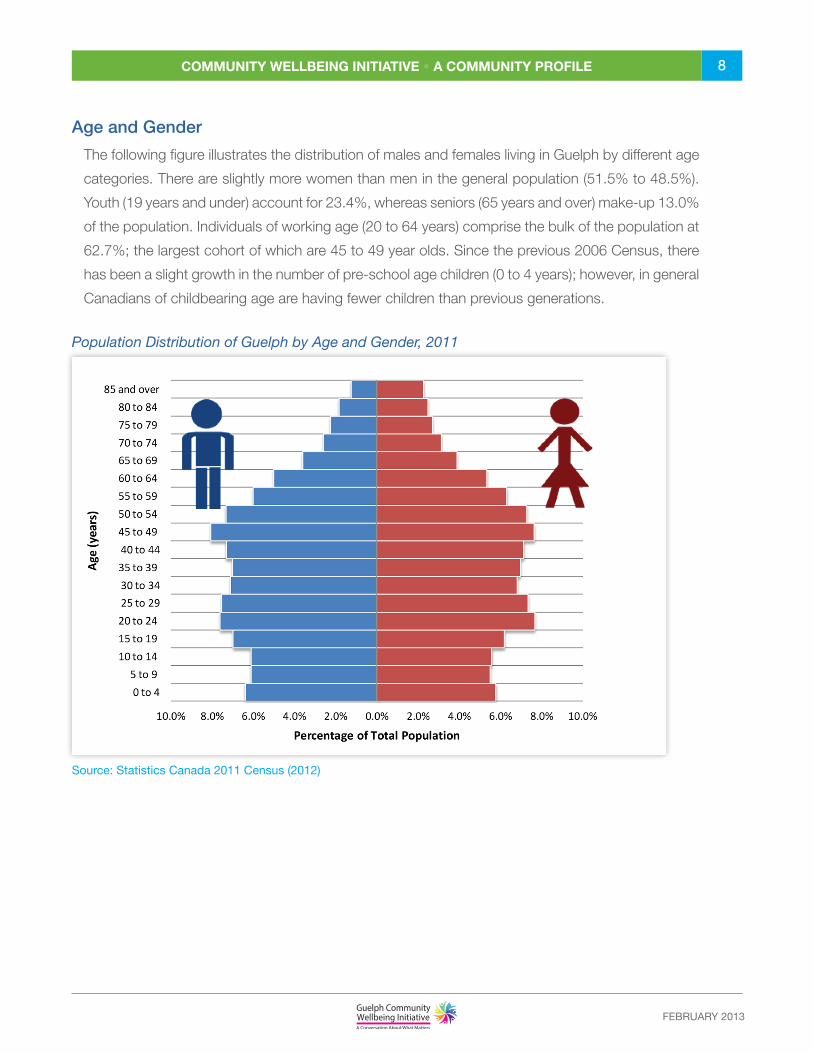
Age and Gender
The following figure illustrates the distribution of males and females living in Guelph by different age
categories. There are slightly more women than men in the general population (51.5% to 48.5%).
Youth (19 years and under) account for 23.4%, whereas seniors (65 years and over) make-up 13.0%
of the population. Individuals of working age (20 to 64 years) comprise the bulk of the population at
62.7%; the largest cohort of which are 45 to 49 year olds. Since the previous 2006 Census, there
has been a slight growth in the number of pre-school age children (0 to 4 years); however, in general
Canadians of childbearing age are having fewer children than previous generations.
Source: Statistics Canada 2011 Census (2012)
Population Distribution of Guelph by Age and Gender, 2011
FEBRUARY 2013
Community Wellbeing initiative • a Community PRoFile 9
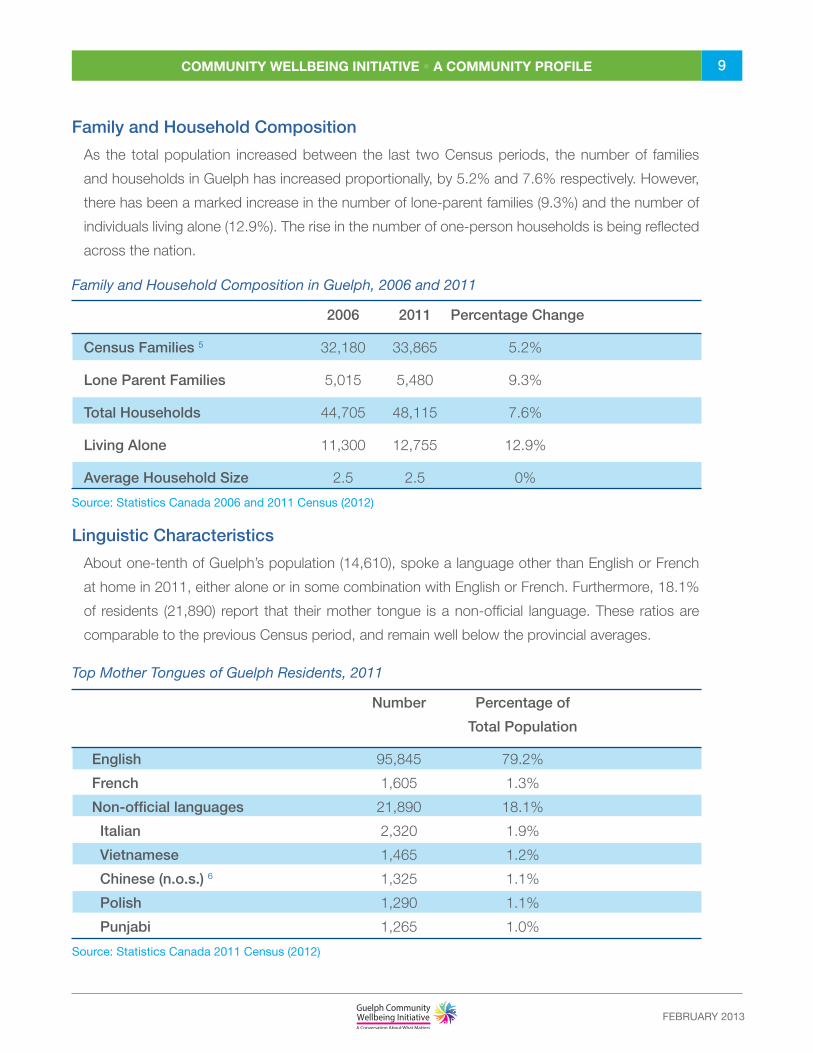
Family and Household Composition
As the total population increased between the last two Census periods, the number of families
and households in Guelph has increased proportionally, by 5.2% and 7.6% respectively. However,
there has been a marked increase in the number of lone-parent families (9.3%) and the number of
individuals living alone (12.9%). The rise in the number of one-person households is being reflected
across the nation.
Family and Household Composition in Guelph, 2006 and 2011
2006 2011 Percentage Change
Census Families 5 32,180 33,865 5.2%
Lone Parent Families 5,015 5,480 9.3%
Total Households 44,705 48,115 7.6%
Living Alone 11,300 12,755 12.9%
Average Household Size 2.5 2.5 0%
Source: Statistics Canada 2006 and 2011 Census (2012)
Linguistic Characteristics
About one-tenth of Guelph’s population (14,610), spoke a language other than English or French
at home in 2011, either alone or in some combination with English or French. Furthermore, 18.1%
of residents (21,890) report that their mother tongue is a non-official language. These ratios are
comparable to the previous Census period, and remain well below the provincial averages.
Top Mother Tongues of Guelph Residents, 2011
Number Percentage of
Total Population
English 95,845 79.2%
French 1,605 1.3%
Non-official languages 21,890 18.1%
Italian 2,320 1.9%
Vietnamese 1,465 1.2%
Chinese (n.o.s.) 6 1,325 1.1%
Polish 1,290 1.1%
Punjabi 1,265 1.0%
Source: Statistics Canada 2011 Census (2012)
FEBRUARY 2013
Community Wellbeing initiative • a Community PRoFile 10
Mother tongue refers to the first language learned, and is often the basis for cultural identity. The top
five mother tongues in Guelph are Italian, Chinese (not otherwise stated, n.o.s.), Vietnamese, Polish
and Punjabi (2011).
Newcomers
In 2006, there were 3,820 newcomers (immigrated between 2001 and 2006) living in the City of
Guelph, representing 3.3% of the total population. In comparison, recent immigrants made up 4.8%
of the population of Ontario.
Visible Minorities
In 2006, visible minorities made up 13.8% (15,800) of Guelph’s population – far below the provincial
average of 22.8%.
FEBRUARY 2013
Community Wellbeing initiative • a Community PRoFile 11
COMMUNITY VITALITY
The Community Vitality indicators explore community engagement and belonging, such as the
strength of personal relationships, participation in community organizations, as well as perceptions
of safety and security.
SENSE OF COMMUNITY BELONGINGWHAT IT IS – This indicator measures residents’ perceptions of belonging to their local community
on a 4-point scale (i.e. very strong, somewhat strong, somewhat weak or very weak).
WHY IT MATTERS - People who have a strong sense of community are happier, have greater
feelings of safety and security, and are more likely to be engaged and participate in community
affairs, such as voting, recycling, and volunteering. 7
WHAT THE LATEST DATA SAYS – 64.8% of residents (12 years and older) report a very strong
or somewhat strong sense of belonging to Guelph (2009-10) 8 – slightly below the provincial
average of 67.4%. 9
PERCEPTION OF SAFETY WHAT IT IS – The percentage of residents who feel safe walking alone in Guelph at night.
WHY IT MATTERS – Fear of crime can influence the quality of life in neighbourhoods by limiting
interaction and trust among residents. It is important to note that fear of crime refers to perceptions
of security, and may not be reflective of actual crime rates. 10
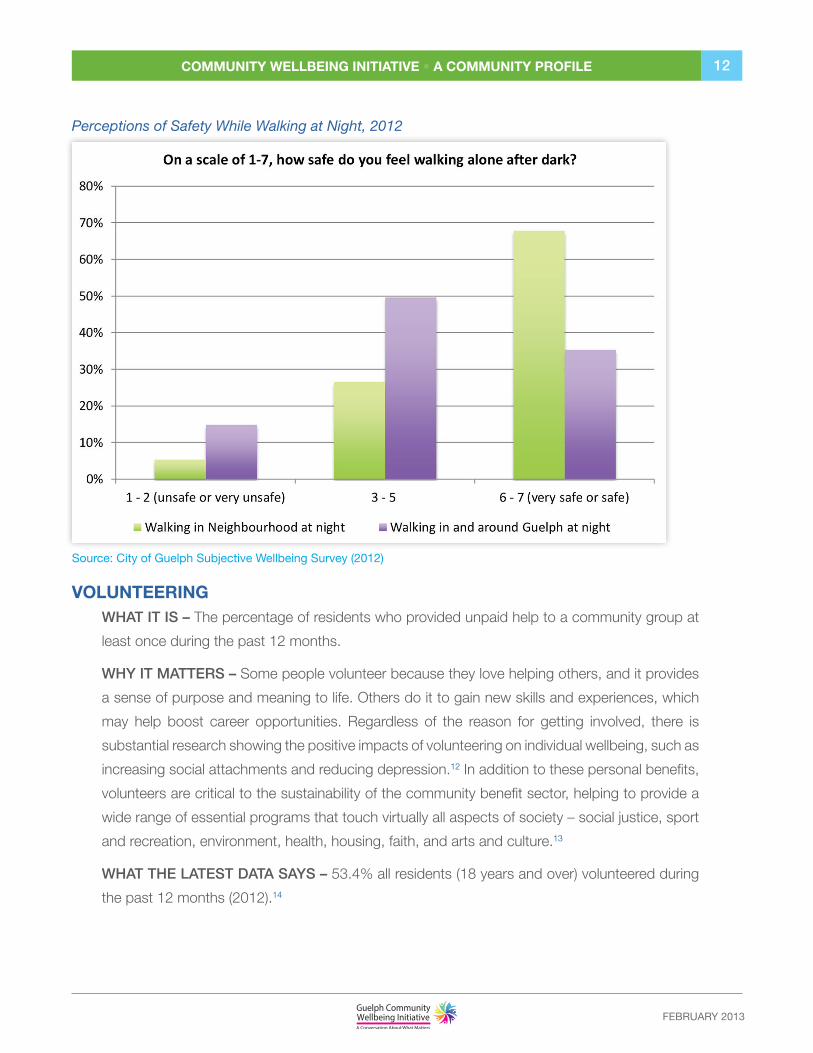
WHAT THE LATEST DATA SAYS – 80.8% of residents (18 years and older) feel very or somewhat
safe walking in their neighbourhood at night, and 57.4% feel very or somewhat safe walking in
Guelph at night (2012). 11
FEBRUARY 2013
Community Wellbeing initiative • a Community PRoFile 12
Perceptions of Safety While Walking at Night, 2012
Source: City of Guelph Subjective Wellbeing Survey (2012)
VOLUNTEERING WHAT IT IS – The percentage of residents who provided unpaid help to a community group at
least once during the past 12 months.
WHY IT MATTERS – Some people volunteer because they love helping others, and it provides
a sense of purpose and meaning to life. Others do it to gain new skills and experiences, which
may help boost career opportunities. Regardless of the reason for getting involved, there is
substantial research showing the positive impacts of volunteering on individual wellbeing, such as
increasing social attachments and reducing depression.12 In addition to these personal benefits,
volunteers are critical to the sustainability of the community benefit sector, helping to provide a
wide range of essential programs that touch virtually all aspects of society – social justice, sport
and recreation, environment, health, housing, faith, and arts and culture.13
WHAT THE LATEST DATA SAYS – 53.4% all residents (18 years and over) volunteered during
the past 12 months (2012).14
FEBRUARY 2013
Community Wellbeing initiative • a Community PRoFile 13
Did You Know?
Guelph had the lowest Crime Severity Index (47.0) of all Canadian census
metropolitan areas in 2011.15
Traditional crime rates provide information on the number of police-reported
incidents per capita. They measure the volume of crime coming to the attention
of the police. The Crime Severity Index, however, takes into account not only
the change in volume of crime, but also the relative seriousness of that crime.
For instance, is the crime coming to the attention of police more or less serious
than before, and is police-reported crime in Guelph more or less serious than in
other jurisdictions? 16
FEBRUARY 2013
Community Wellbeing initiative • a Community PRoFile 14
DEMOCRATIC ENGAGEMENT
The Democratic Engagement indicators illustrate citizen participation in public life and in the
functioning of government, and the role residents and their institutions play as global citizens.
VOTER TURNOUT WHAT IT IS – The percentage of eligible voters who cast a ballot in the most recent election.
WHY IT MATTERS – A high voter turnout is considered to be desirable, and is generally viewed
as evidence of the legitimacy of the democratic system. A low turnout reflects disenchantment
and indifference with the functioning of government. In addition, low turnouts can lead to
unequal representation among particular segments of the population, as non-voters tend to
be concentrated in certain socioeconomic groups, such as the young and poor. This has the
potential to skew policy. 17, 18
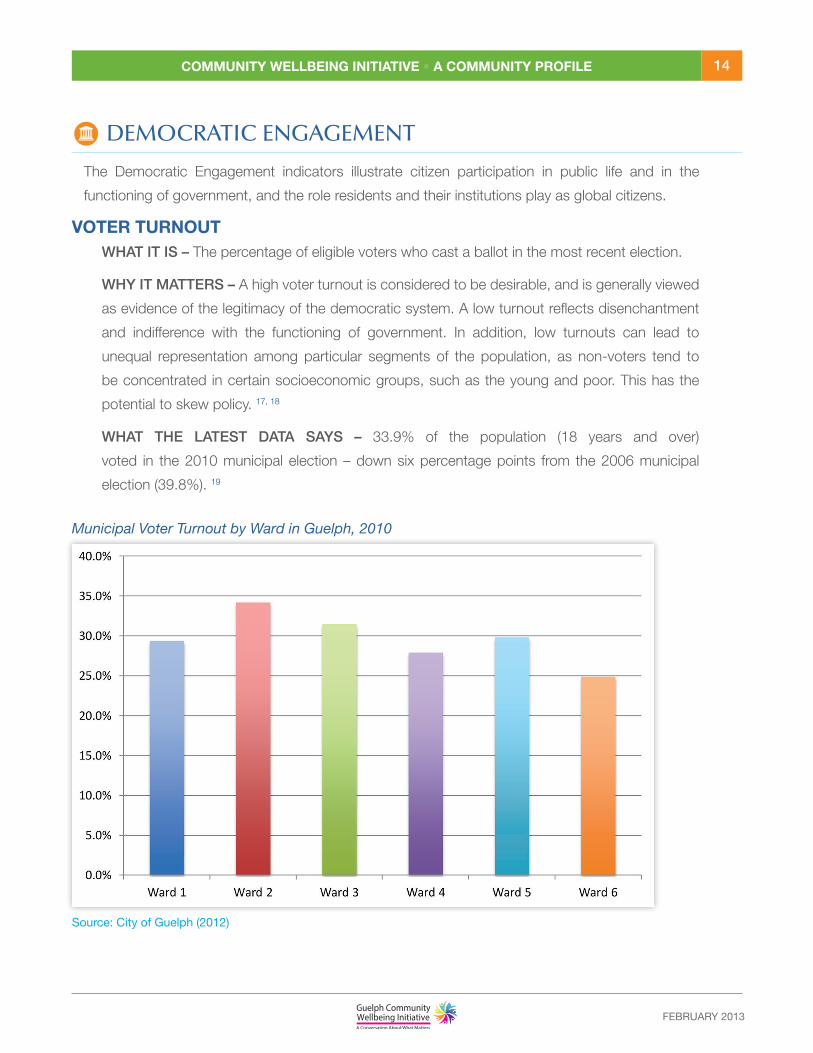
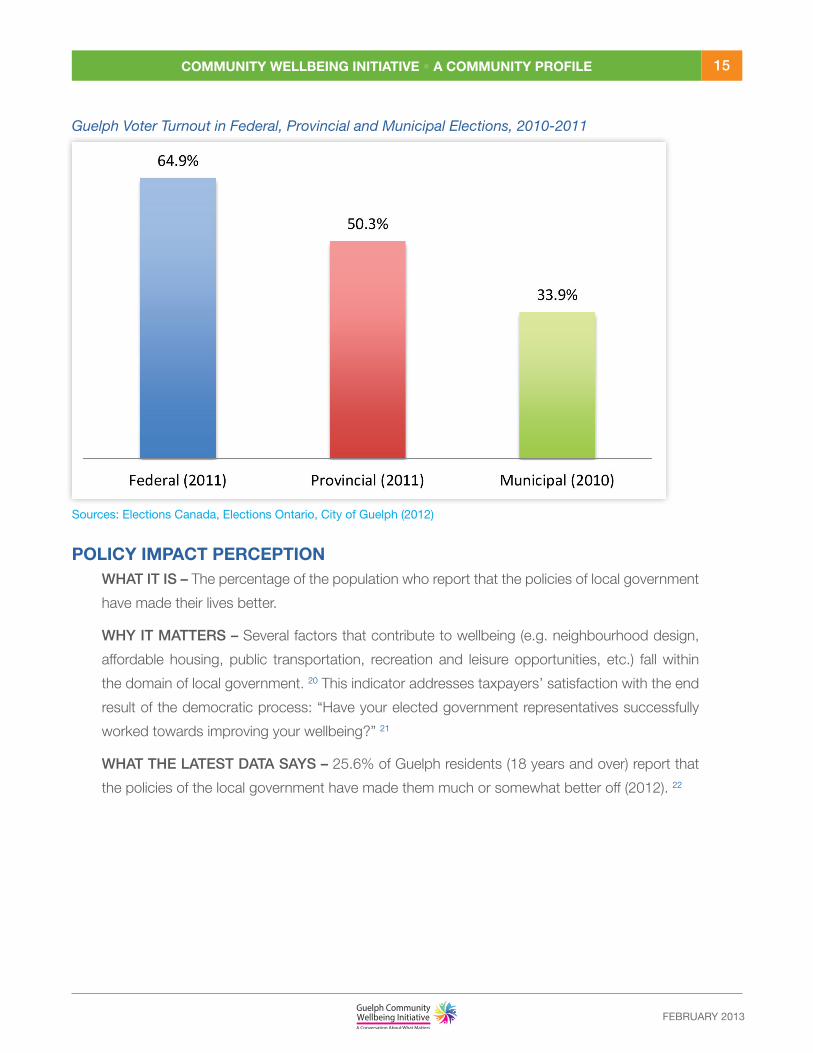
WHAT THE LATEST DATA SAYS – 33.9% of the population (18 years and over)
voted in the 2010 municipal election – down six percentage points from the 2006 municipal
election (39.8%). 19
Municipal Voter Turnout by Ward in Guelph, 2010
Source: City of Guelph (2012)
FEBRUARY 2013
Community Wellbeing initiative • a Community PRoFile 15
Guelph Voter Turnout in Federal, Provincial and Municipal Elections, 2010-2011
Sources: Elections Canada, Elections Ontario, City of Guelph (2012)
POLICY IMPACT PERCEPTION WHAT IT IS – The percentage of the population who report that the policies of local government
have made their lives better.
WHY IT MATTERS – Several factors that contribute to wellbeing (e.g. neighbourhood design,
affordable housing, public transportation, recreation and leisure opportunities, etc.) fall within
the domain of local government. 20 This indicator addresses taxpayers’ satisfaction with the end
result of the democratic process: “Have your elected government representatives successfully
worked towards improving your wellbeing?” 21
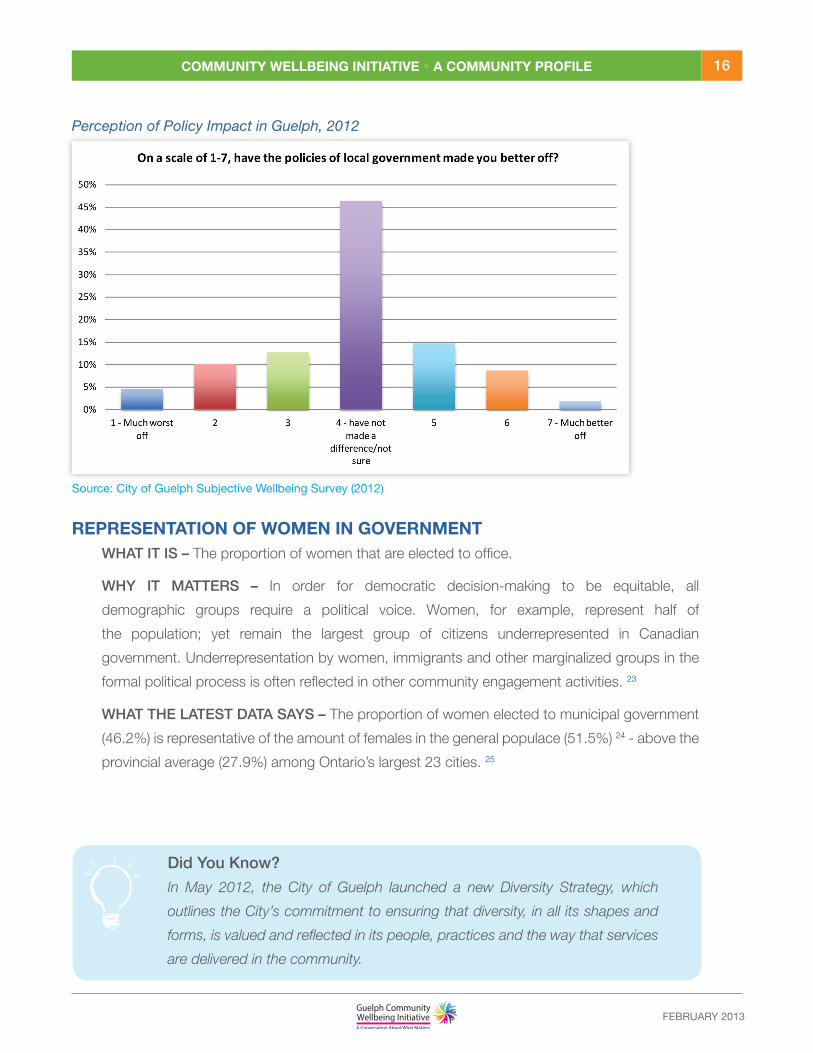
WHAT THE LATEST DATA SAYS – 25.6% of Guelph residents (18 years and over) report that
the policies of the local government have made them much or somewhat better off (2012). 22
FEBRUARY 2013
Community Wellbeing initiative • a Community PRoFile 16
Perception of Policy Impact in Guelph, 2012
Source: City of Guelph Subjective Wellbeing Survey (2012)
REPRESENTATION OF WOMEN IN GOVERNMENTWHAT IT IS – The proportion of women that are elected to office.
WHY IT MATTERS – In order for democratic decision-making to be equitable, all
demographic groups require a political voice. Women, for example, represent half of
the population; yet remain the largest group of citizens underrepresented in Canadian
government. Underrepresentation by women, immigrants and other marginalized groups in the
formal political process is often reflected in other community engagement activities. 23
WHAT THE LATEST DATA SAYS – The proportion of women elected to municipal government
(46.2%) is representative of the amount of females in the general populace (51.5%) 24 - above the
provincial average (27.9%) among Ontario’s largest 23 cities. 25
Did You Know?
In May 2012, the City of Guelph launched a new Diversity Strategy, which
outlines the City’s commitment to ensuring that diversity, in all its shapes and
forms, is valued and reflected in its people, practices and the way that services
are delivered in the community.
FEBRUARY 2013
Community Wellbeing initiative • a Community PRoFile 17
EDUCATION
The Education indicators explore the literacy and skill levels of the population, including the ability
of residents to participate effectively in society and the economy.
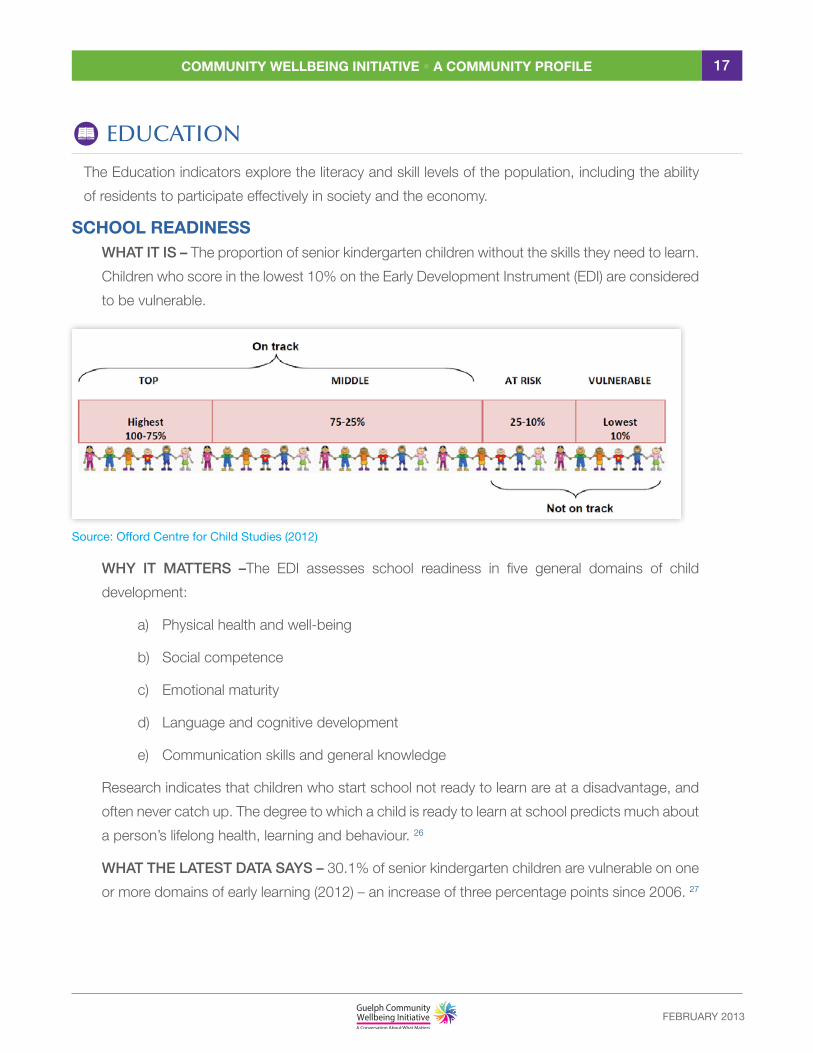
SCHOOL READINESS WHAT IT IS – The proportion of senior kindergarten children without the skills they need to learn.
Children who score in the lowest 10% on the Early Development Instrument (EDI) are considered
to be vulnerable.
Source: Offord Centre for Child Studies (2012)
WHY IT MATTERS –The EDI assesses school readiness in five general domains of child
development:
a) Physical health and well-being
b) Social competence
c) Emotional maturity
d) Language and cognitive development
e) Communication skills and general knowledge
Research indicates that children who start school not ready to learn are at a disadvantage, and
often never catch up. The degree to which a child is ready to learn at school predicts much about
a person’s lifelong health, learning and behaviour. 26
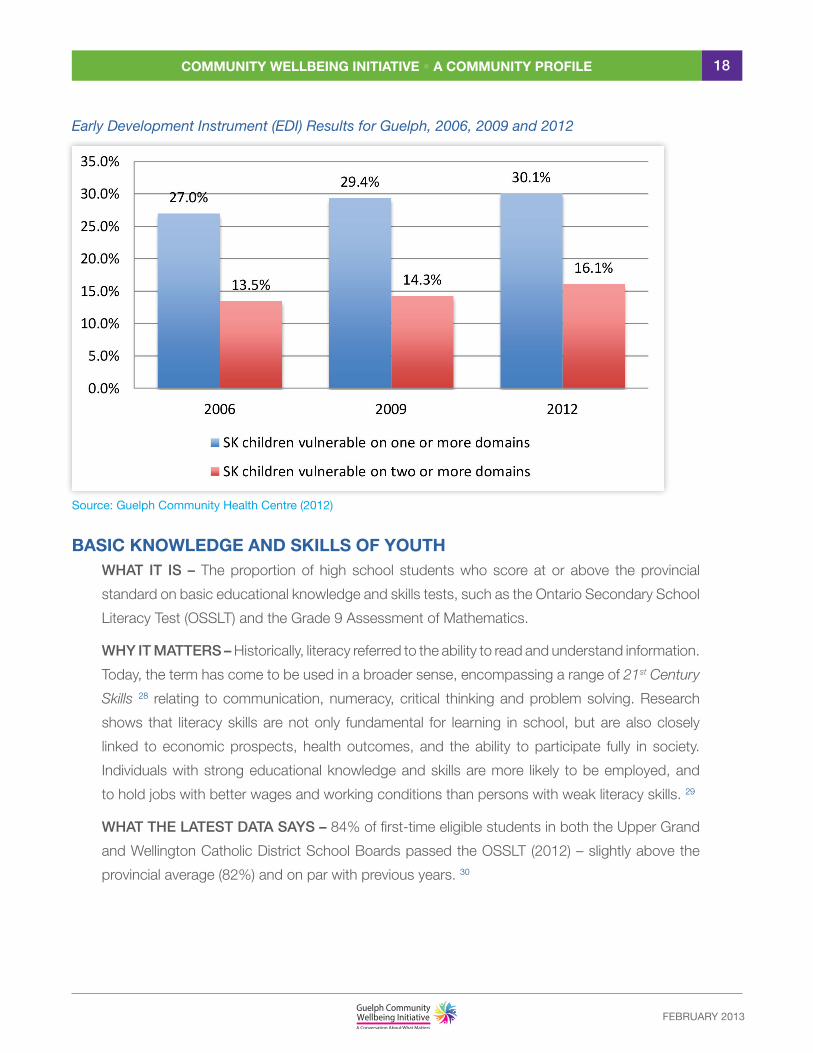
WHAT THE LATEST DATA SAYS – 30.1% of senior kindergarten children are vulnerable on one
or more domains of early learning (2012) – an increase of three percentage points since 2006. 27
FEBRUARY 2013
Community Wellbeing initiative • a Community PRoFile 18
Early Development Instrument (EDI) Results for Guelph, 2006, 2009 and 2012
Source: Guelph Community Health Centre (2012)
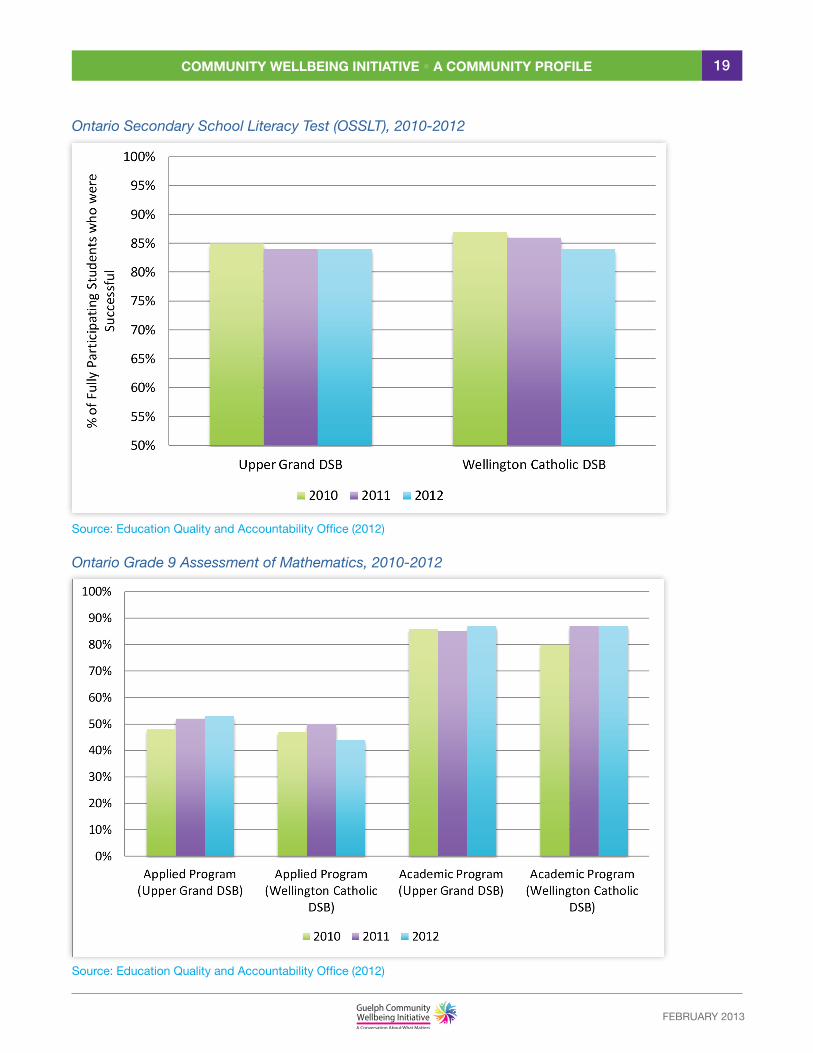
BASIC KNOWLEDGE AND SKILLS OF YOUTHWHAT IT IS – The proportion of high school students who score at or above the provincial
standard on basic educational knowledge and skills tests, such as the Ontario Secondary School
Literacy Test (OSSLT) and the Grade 9 Assessment of Mathematics.
WHY IT MATTERS – Historically, literacy referred to the ability to read and understand information.
Today, the term has come to be used in a broader sense, encompassing a range of 21st Century
Skills 28 relating to communication, numeracy, critical thinking and problem solving. Research
shows that literacy skills are not only fundamental for learning in school, but are also closely
linked to economic prospects, health outcomes, and the ability to participate fully in society.
Individuals with strong educational knowledge and skills are more likely to be employed, and
to hold jobs with better wages and working conditions than persons with weak literacy skills. 29
WHAT THE LATEST DATA SAYS – 84% of first-time eligible students in both the Upper Grand
and Wellington Catholic District School Boards passed the OSSLT (2012) – slightly above the
provincial average (82%) and on par with previous years. 30
FEBRUARY 2013
Community Wellbeing initiative • a Community PRoFile 19
Ontario Secondary School Literacy Test (OSSLT), 2010-2012
Source: Education Quality and Accountability Office (2012)
Ontario Grade 9 Assessment of Mathematics, 2010-2012
Source: Education Quality and Accountability Office (2012)
FEBRUARY 2013
Community Wellbeing initiative • a Community PRoFile 20
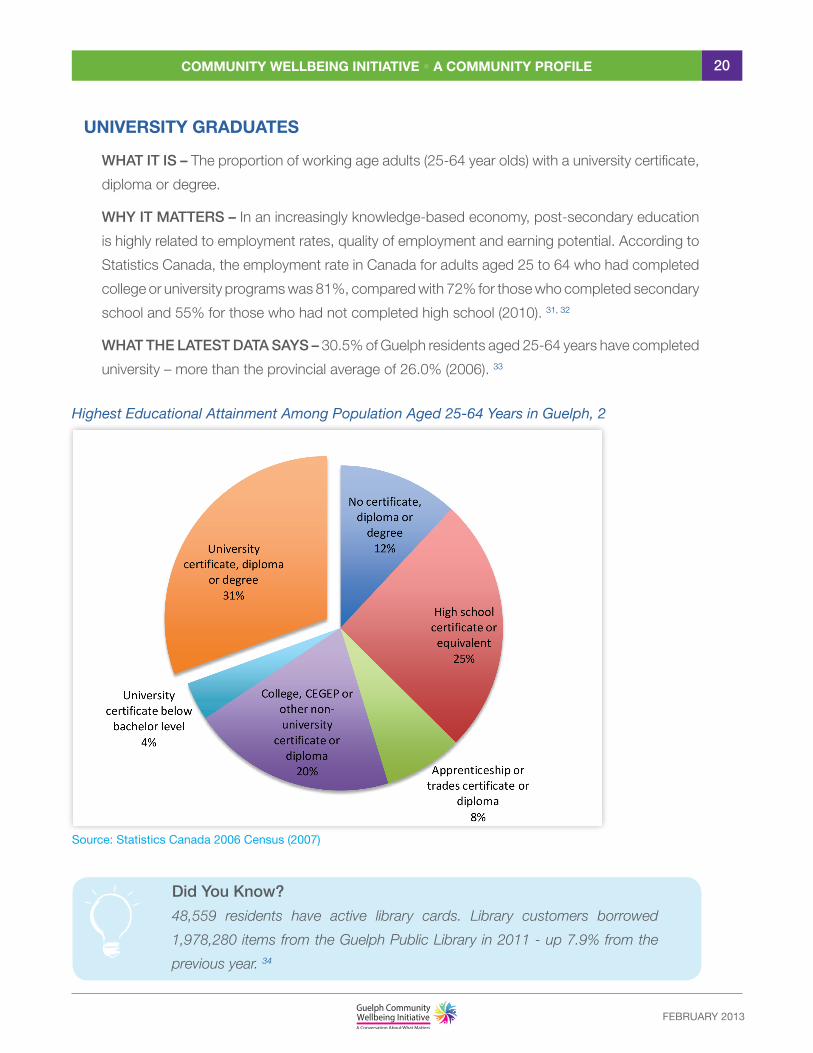
UNIVERSITY GRADUATES
WHAT IT IS – The proportion of working age adults (25-64 year olds) with a university certificate,
diploma or degree.
WHY IT MATTERS – In an increasingly knowledge-based economy, post-secondary education
is highly related to employment rates, quality of employment and earning potential. According to
Statistics Canada, the employment rate in Canada for adults aged 25 to 64 who had completed
college or university programs was 81%, compared with 72% for those who completed secondary
school and 55% for those who had not completed high school (2010). 31, 32
WHAT THE LATEST DATA SAYS – 30.5% of Guelph residents aged 25-64 years have completed
university – more than the provincial average of 26.0% (2006). 33
Source: Statistics Canada 2006 Census (2007)
Did You Know?
48,559 residents have active library cards. Library customers borrowed
1,978,280 items from the Guelph Public Library in 2011 - up 7.9% from the
previous year. 34
Highest Educational Attainment Among Population Aged 25-64 Years in Guelph, 2
FEBRUARY 2013
21Community Wellbeing initiative • a Community PRoFile
ENVIRONMENT
The Environment indicators tell us about the state of and trends in Guelph’s ecosystem, for example:
air, energy, water, non-renewable materials and biotic factors (i.e. climate, soil, and living things).
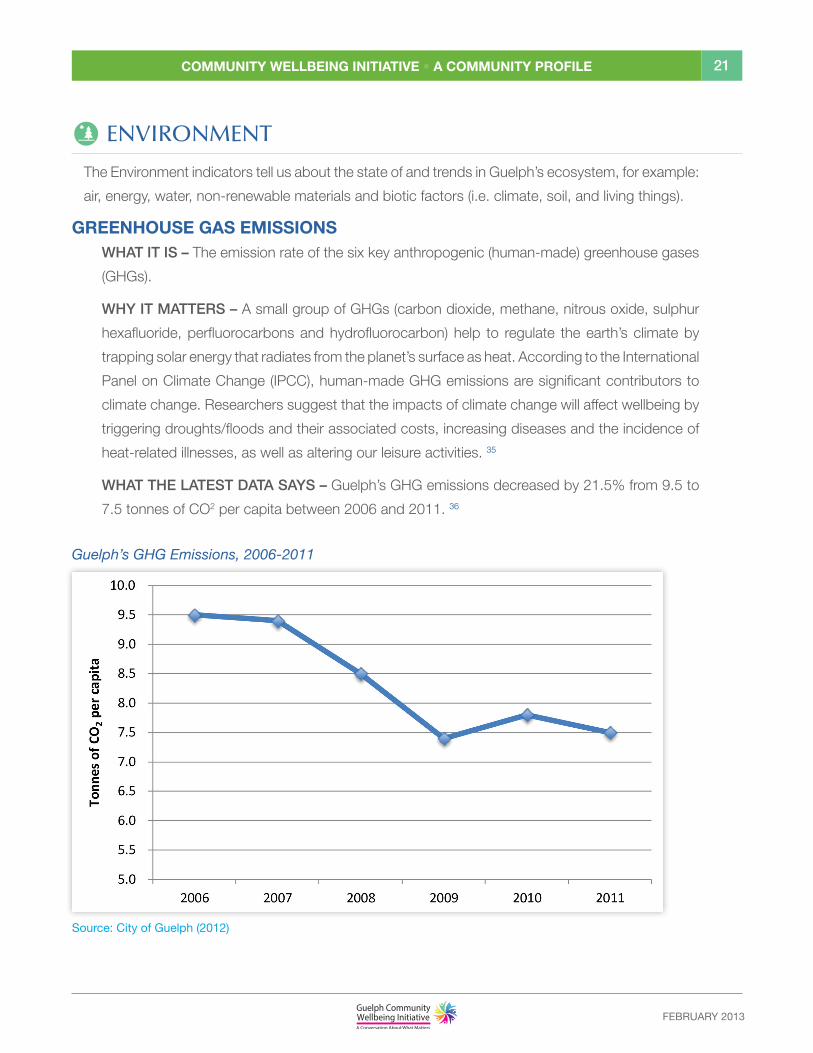
GREENHOUSE GAS EMISSIONSWHAT IT IS – The emission rate of the six key anthropogenic (human-made) greenhouse gases
(GHGs).
WHY IT MATTERS – A small group of GHGs (carbon dioxide, methane, nitrous oxide, sulphur
hexafluoride, perfluorocarbons and hydrofluorocarbon) help to regulate the earth’s climate by
trapping solar energy that radiates from the planet’s surface as heat. According to the International
Panel on Climate Change (IPCC), human-made GHG emissions are significant contributors to
climate change. Researchers suggest that the impacts of climate change will affect wellbeing by
triggering droughts/floods and their associated costs, increasing diseases and the incidence of
heat-related illnesses, as well as altering our leisure activities. 35
WHAT THE LATEST DATA SAYS – Guelph’s GHG emissions decreased by 21.5% from 9.5 to
7.5 tonnes of CO2 per capita between 2006 and 2011. 36
Source: City of Guelph (2012)
Guelph’s GHG Emissions, 2006-2011
FEBRUARY 2013
22Community Wellbeing initiative • a Community PRoFile
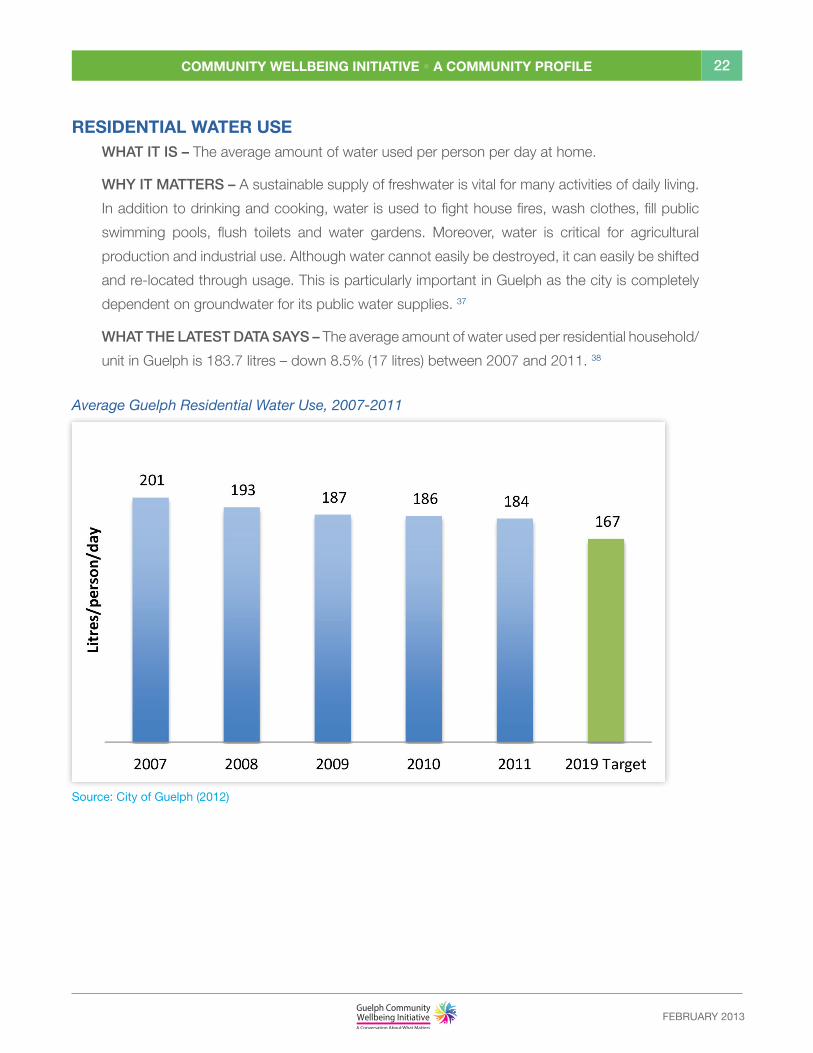
RESIDENTIAL WATER USEWHAT IT IS – The average amount of water used per person per day at home.
WHY IT MATTERS – A sustainable supply of freshwater is vital for many activities of daily living.
In addition to drinking and cooking, water is used to fight house fires, wash clothes, fill public
swimming pools, flush toilets and water gardens. Moreover, water is critical for agricultural
production and industrial use. Although water cannot easily be destroyed, it can easily be shifted
and re-located through usage. This is particularly important in Guelph as the city is completely
dependent on groundwater for its public water supplies. 37
WHAT THE LATEST DATA SAYS – The average amount of water used per residential household/
unit in Guelph is 183.7 litres – down 8.5% (17 litres) between 2007 and 2011. 38
Source: City of Guelph (2012)
Average Guelph Residential Water Use, 2007-2011
FEBRUARY 2013
23Community Wellbeing initiative • a Community PRoFile
GREEN SPACEWHAT IT IS – The proportion of hectares per capita that is designated as green areas
(i.e. parks, open spaces, ecological/conservation areas, cemeteries, golf courses, public plazas/
gathering spaces).
WHY IT MATTERS – Green spaces in urban areas serve multiple functions. From an environmental
perspective, they contribute to the quality of the air, help maintain the water cycle, and protect
the natural ecosystem. They also offer opportunities for recreation, leisure and social interactions.
In addition, green areas help to define the image and character of a city, by making it an attractive
place to live, work and play.
WHAT THE LATEST DATA SAYS – There are 1,859 hectares of green area per 100,000 people
in Guelph (2011). 39
Did You Know?
In keeping with the City’s Community Energy Initiative to reduce energy
consumption and GHG emissions by 50% by 2031, a new initiative - Net Zero
City - has been launched. The City of Guelph is working in partnership with Guelph
Environmental Leadership, Transition Guelph and other community groups
to connect local neighbourhoods, with residents on each street generating
their actual environmental footprint (energy, water, waste, transportation and
food) while developing the capacity to change behaviours, adopt innovative
technologies and implement action plans year over year.
FEBRUARY 2013
24Community Wellbeing initiative • a Community PRoFile
HEALTHY POPULATIONS
The Healthy Populations indicators illustrate different aspects of health status, with a focus on
physical, mental and social wellbeing, personal lifestyle and behaviours, and access to health care
services.
SELF-RATED HEALTH WHAT IT IS – This indicator measures residents’ perceptions of their general health status on a
5-point scale (i.e. excellent, very good, good, fair, or poor).
WHY IT MATTERS – Individuals’ self-assessments of their health are closely linked to their risk of
illness and disease. Studies have demonstrated that there is an association between how people
rate their own health and objective outcomes such as morbidity, mortality, and the use of health
care services. 40, 41
WHAT THE LATEST DATA SAYS – 66.2% of Guelph residents (12 years and older) rate their
health as excellent or very good (2009-10) 42 – above the provincial average of 61.0%. 43
PREVALENCE OF MOOD DISORDERS
WHAT IT IS – The proportion of residents who report that they have been diagnosed by
a health professional as having a mood disorder, such as depression, bipolar disorder, mania
or dysthymia.
WHY IT MATTERS – Depression and other mental illnesses represent major health issues
for society. Depression is now the fourth leading contributor to the global burden of disease
(as measured by disability adjusted life years), and it is expected to reach second place by
2020.44 The impact of depression on job performance has been estimated to be greater than
that of chronic conditions such as arthritis, hypertension, back problems and diabetes. 45
WHAT THE LATEST DATA SAYS – 6.8% of Guelph residents (12 years and older) report that
they have been diagnosed with a mood disorder (2009-10) 46 – the same as the provincial
average of 6.8%. 47
FEBRUARY 2013
25Community Wellbeing initiative • a Community PRoFile
PREVALENCE OF DIABETES
WHAT IT IS – The proportion of the population who report that they have been diagnosed by a
health professional as having diabetes.
WHY IT MATTERS – Diabetes was selected as a core indicator of physical health for the
Canadian Index of Wellbeing because it is closely linked to other conditions, including obesity,
high blood pressure, heart disease, and kidney failure. Of great importance is the fact that type-2
diabetes is largely preventable. Research suggests that 90% of diabetes can be prevented by
improved nutrition, exercise and a healthy weight. 48
WHAT THE LATEST DATA SAYS – 6.4% of Guelph residents (12 years and older) report that
they have been diagnosed with diabetes (2009-10) 49 – comparable to the provincial average of
6.8%. 50
PERCEPTION OF THE QUALITY OF HEALTH SERVICES
WHAT IT IS – This indicator measures residents’ perception of the quality of health care services
on a 5-point scale (i.e. excellent, very good, good, fair, or poor). 51
WHY IT MATTERS – Although the public health care system is a fundamental element of
Canadian life, health care in itself is not a determinant of population health status. Nevertheless,
residents’ perceptions of the quality of care provided by the health system is important to
track because it shapes consumer confidence in the system, and can impact personal health
behaviours with respect to usage of health services (including prevention) and compliance with
treatment regimes. 52
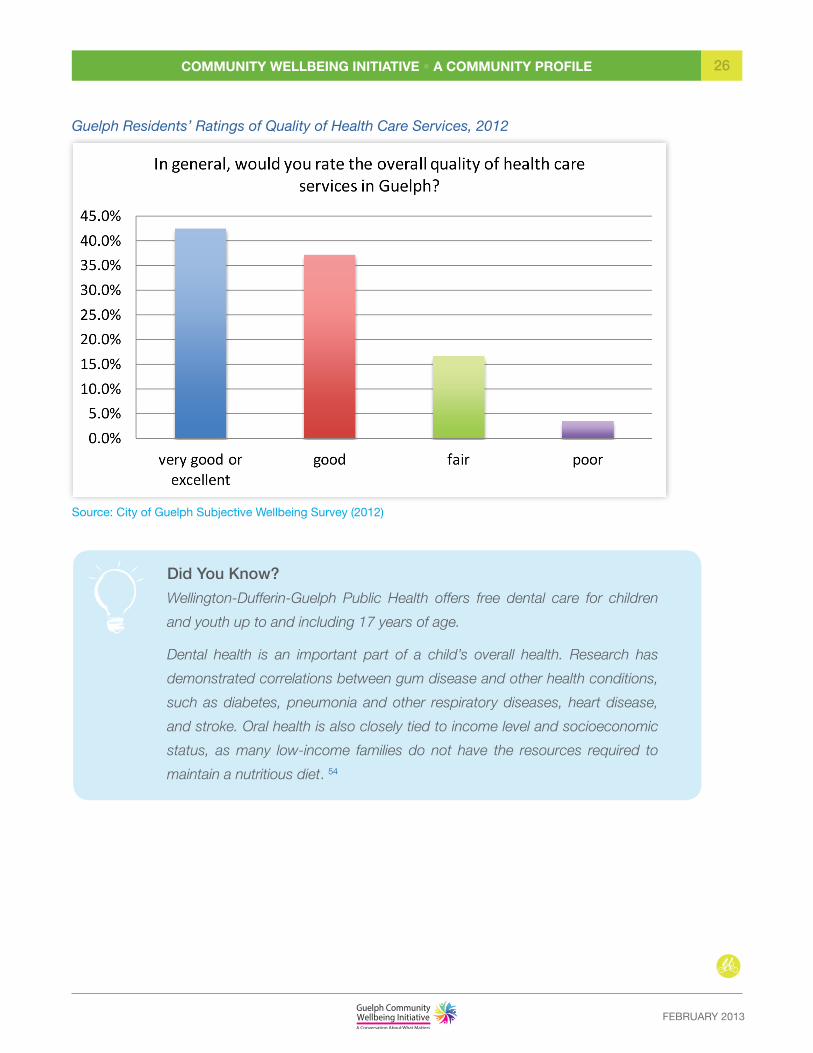
WHAT THE LATEST DATA SAYS – 42.5% of Guelph residents (18 years and over) rate the
quality of health care services in Guelph as excellent or very good (2012). 53
FEBRUARY 2013
26Community Wellbeing initiative • a Community PRoFile
Guelph Residents’ Ratings of Quality of Health Care Services, 2012
Source: City of Guelph Subjective Wellbeing Survey (2012)
Did You Know?
Wellington-Dufferin-Guelph Public Health offers free dental care for children
and youth up to and including 17 years of age.
Dental health is an important part of a child’s overall health. Research has
demonstrated correlations between gum disease and other health conditions,
such as diabetes, pneumonia and other respiratory diseases, heart disease,
and stroke. Oral health is also closely tied to income level and socioeconomic
status, as many low-income families do not have the resources required to
maintain a nutritious diet. 54
FEBRUARY 2013
Community Wellbeing initiative • a Community PRoFile 27
LEISURE AND CULTURE
The Leisure and Culture indicators explore all forms of human expression, such as activities focused
on the arts and culture, as well as recreational interests and pastimes.
PHYSICAL ACTIVITY PARTICIPATIONWHAT IT IS – The typical number of times residents participated in physical activities during the
past month.
WHY IT MATTERS – Participation in physical activities positively affects individuals’ wellbeing.
Regular exercise is associated with a range of health benefits, such a reduced risk of cardiovascular
disease, high blood pressure, osteoporosis, diabetes, obesity, and some types of cancer. People
with active lifestyles are also less likely to become depressed, suffer from stress and anxiety,
as well as have higher levels of life satisfaction. Among youth, time spent on physical activity is
associated with improved behavioural and academic scores, as well as a reduced risk of obesity.
In addition, research shows that early exposure to physical activities leads to early adoption by
children and adolescents, and that these patterns of participation are continued throughout
adulthood. 55, 56, 57
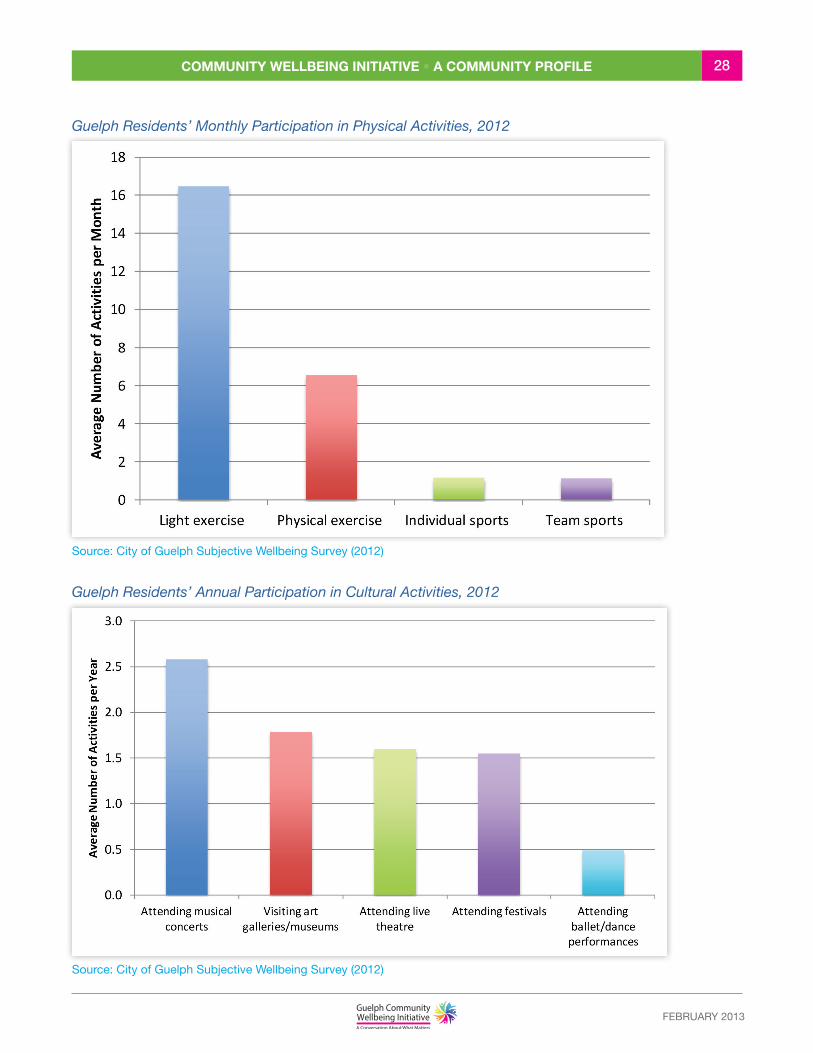
WHAT THE LATEST DATA SAYS – On average, Guelph residents (18 years and over) report that
they participate in a total of 25.3 physical activities per month (2012):
• Light exercise, e.g. going for a walk, bicycling (16.5)
• Physical exercise, e.g. aerobics, jogging, weight training (6.5)
• Individual sports, e.g. tennis, badminton, skiing (1.2)
• Team sports, e.g. baseball, hockey, volleyball, basketball (1.1) 58
FEBRUARY 2013
Community Wellbeing initiative • a Community PRoFile 28
Guelph Residents’ Monthly Participation in Physical Activities, 2012
Source: City of Guelph Subjective Wellbeing Survey (2012)
Guelph Residents’ Annual Participation in Cultural Activities, 2012
Source: City of Guelph Subjective Wellbeing Survey (2012)
FEBRUARY 2013
Community Wellbeing initiative • a Community PRoFile 29
USAGE OF LOCAL RECREATION AND CULTURAL FACILITIES
WHAT IT IS – The usage rate of municipal sports and recreation facilities, cultural and performing
arts centres, libraries and parks, as measured on a 5-point scale (i.e. never, sometimes, regularly,
quite often, all of the time).
WHY IT MATTERS – Community facilities (i.e., swimming pools, arenas, performing arts facility,
libraries, museums, parks, etc.) offer opportunities for leisure and culture, by providing the places
and spaces for people to use during their free time. Studies show that when people live in
proximity to parks, open spaces, and other arts and recreation facilities, they report higher rates
of participation in social leisure, cultural and physical activities. 59
WHAT THE LATEST DATA SAYS – 9.3% of Guelph residents (18 years and over) use municipal
recreation and cultural facilities quite often or all of the time (2012). 60
EXPENDITURES ON ARTS AND CULTURE
WHAT IT IS – Expenditures in past year on all aspects of arts and culture as a percentage of total
municipal expenditures (net of revenues). 61
WHY IT MATTERS – A strong arts and culture scene contributes to the City’s ability to compete
for talented individuals, leading-edge businesses and tourists. Beyond economic development
factors, Guelph’s award-winning festivals, cultural events, public spaces and venues are a source
of pride and attraction for many residents. They also help enrich the overall quality of life in the
community, by providing opportunities for leisure and social engagement. 62
WHAT THE LATEST DATA SAYS – 2.2% of total municipal expenditures were allocated to arts
and culture programming, facilities, and community grants in 2012 (including libraries, it was
6.5%).63 This equates to (using 2011 Census data) $32 per resident ($96 per resident including
libraries).
In comparison, research conducted by Hill Strategies of five major cities in Canada – Toronto,
Calgary, Vancouver, Montreal and Ottawa – found a net cultural investment of $35 per resident
in 2009 (The net investment in libraries was an additional $53 per capita). 64
Did You Know?
Fourth Fridays are fun, interactive, family friendly, community building events.
Different downtown Guelph merchants and the streets become venues for
the night, hosting artist’s paintings on their walls, demonstrations, musical
performances, theatre, spoken word poetry, crafts and interactive projects.
For more information, visit http://fourthfridaysguelph.ca/
FEBRUARY 2013
30Community Wellbeing initiative • a Community PRoFile
LIVING STANDARDS
The Living Standards indicators speak to financial security and material wellbeing. They establish
the level and distribution of income and wealth in the community, as well as trends in economic
security, such as employment rates, job quality, housing affordability, and poverty.
GAP BETWEEN THE RICH AND POORWHAT IT IS – The distribution of family incomes between top and bottom deciles (ratio between
the richest and poorest 10%).
WHY IT MATTERS – Wellbeing is dependent on both the level of income and the distribution
of income within the population. Differences in the distribution of income are often considered a
measure of fairness and social justice. Large income disparities are often associated with high
unemployment, but may also indicate that large numbers of people are in low-paid jobs and that
the skills and capacities of citizens are not being fully utilized. 65
WHAT THE LATEST DATA SAYS – The average (pre-tax) income of the top 10% of census
families in the Guelph CMA 66 is $161,000, while the average income for the bottom 10% is
$26,100 (2006). In other words, the richest earn 6.2 times the income of the poorest – up
3% from the previous Census (2001). 67
EMPLOYMENT RATEWHAT IT IS – The number of persons employed as a proportion of the working age population
(age 15 years and over).
WHY IT MATTERS – Employment contributes to wellbeing in many ways. It is the primary source
of income for most individuals and families, enabling them to satisfy basic needs and pursue other
interests. For many individuals, work also provides a sense of purpose and accomplishment.
At a societal level, employment generates efficiency, productivity, and competitiveness in the
local economy. 68, 69, 70
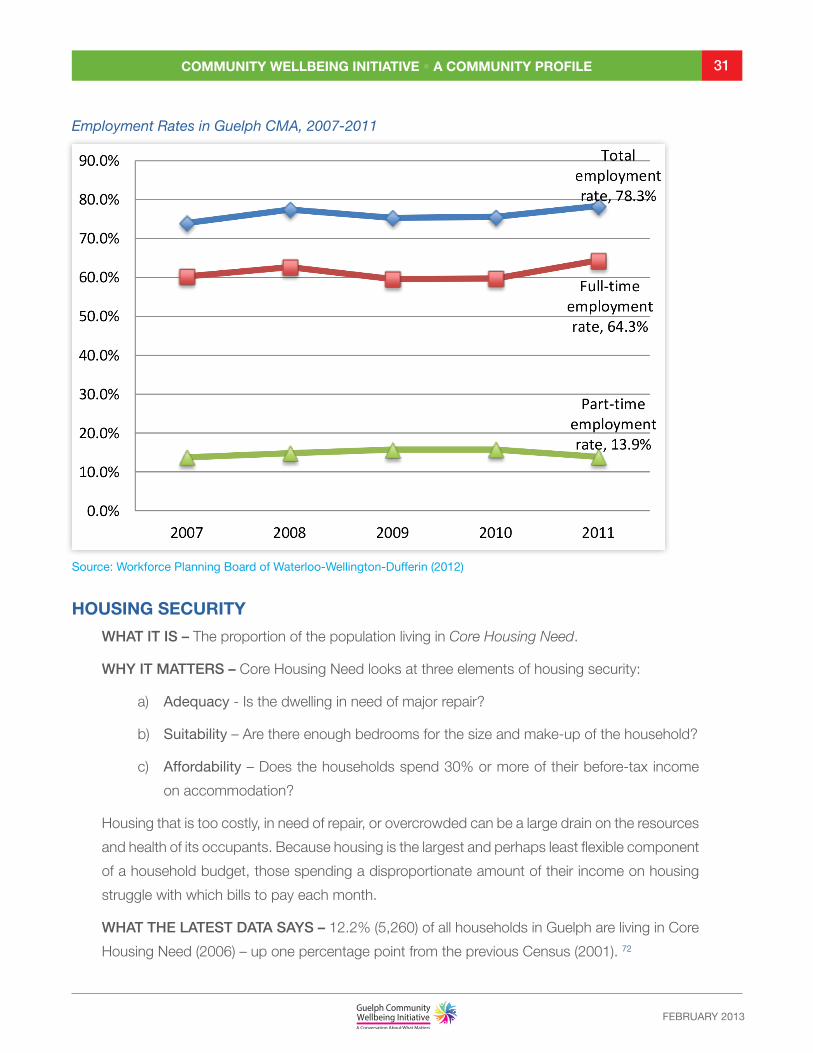
WHAT THE LATEST DATA SAYS – The employment rate in the Guelph CMA is 78.3% (2011) –
up three percentage points from the previous year. 71
FEBRUARY 2013
31Community Wellbeing initiative • a Community PRoFile
Employment Rates in Guelph CMA, 2007-2011
HOUSING SECURITY
WHAT IT IS – The proportion of the population living in Core Housing Need.
WHY IT MATTERS – Core Housing Need looks at three elements of housing security:
a) Adequacy - Is the dwelling in need of major repair?
b) Suitability – Are there enough bedrooms for the size and make-up of the household?
c) Affordability – Does the households spend 30% or more of their before-tax income
on accommodation?
Housing that is too costly, in need of repair, or overcrowded can be a large drain on the resources
and health of its occupants. Because housing is the largest and perhaps least flexible component
of a household budget, those spending a disproportionate amount of their income on housing
struggle with which bills to pay each month.
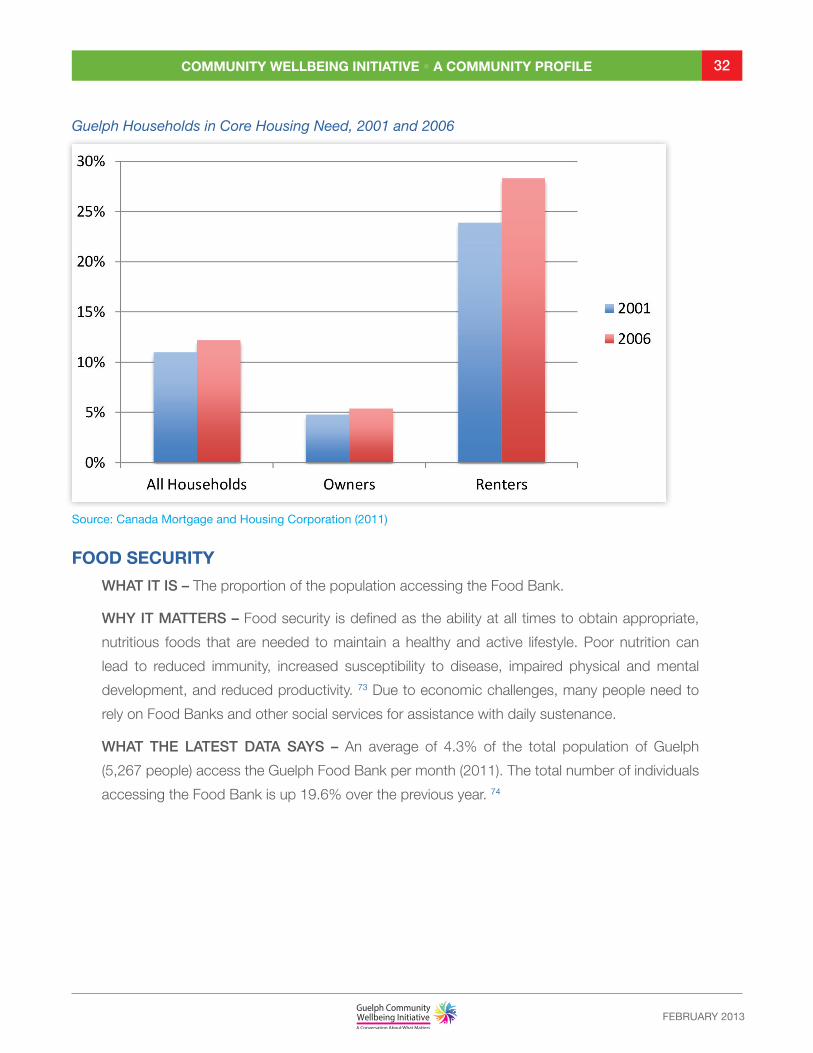
WHAT THE LATEST DATA SAYS – 12.2% (5,260) of all households in Guelph are living in Core
Housing Need (2006) – up one percentage point from the previous Census (2001). 72
Source: Workforce Planning Board of Waterloo-Wellington-Dufferin (2012)
FEBRUARY 2013
32Community Wellbeing initiative • a Community PRoFile
Guelph Households in Core Housing Need, 2001 and 2006
Source: Canada Mortgage and Housing Corporation (2011)
FOOD SECURITY
WHAT IT IS – The proportion of the population accessing the Food Bank.
WHY IT MATTERS – Food security is defined as the ability at all times to obtain appropriate,
nutritious foods that are needed to maintain a healthy and active lifestyle. Poor nutrition can
lead to reduced immunity, increased susceptibility to disease, impaired physical and mental
development, and reduced productivity. 73 Due to economic challenges, many people need to
rely on Food Banks and other social services for assistance with daily sustenance.
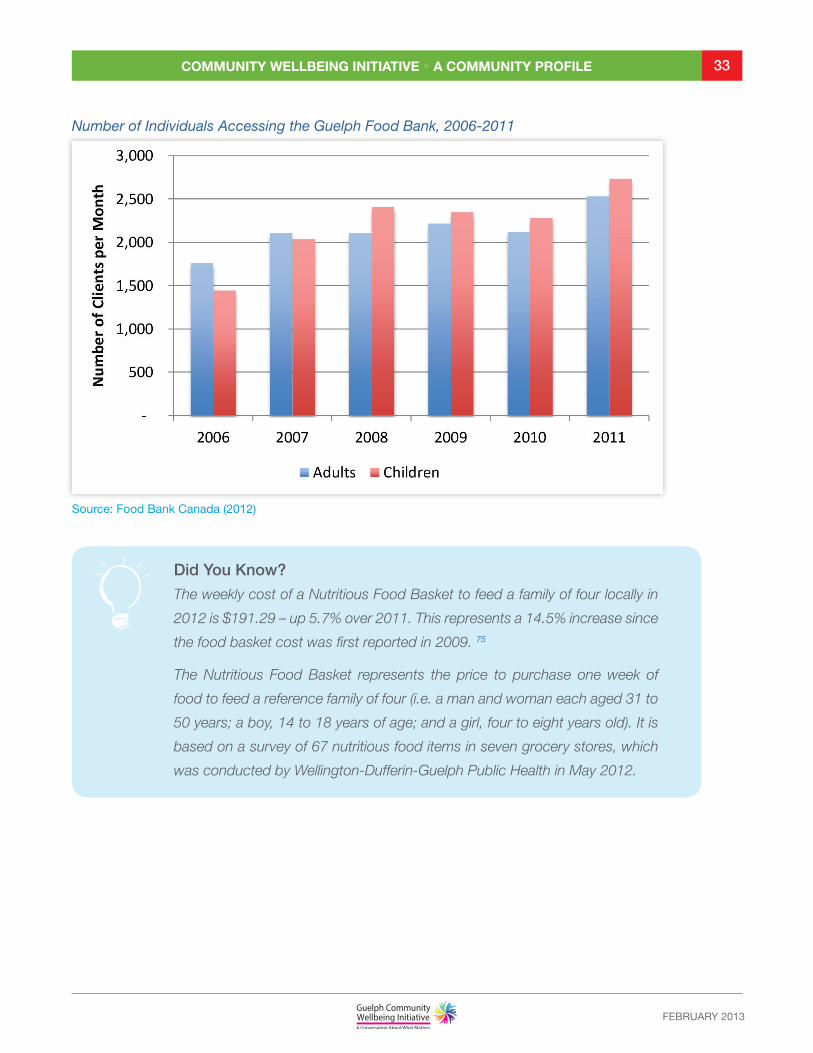
WHAT THE LATEST DATA SAYS – An average of 4.3% of the total population of Guelph
(5,267 people) access the Guelph Food Bank per month (2011). The total number of individuals
accessing the Food Bank is up 19.6% over the previous year. 74
FEBRUARY 2013
33Community Wellbeing initiative • a Community PRoFile
Number of Individuals Accessing the Guelph Food Bank, 2006-2011
Source: Food Bank Canada (2012)
Did You Know?
The weekly cost of a Nutritious Food Basket to feed a family of four locally in
2012 is $191.29 – up 5.7% over 2011. This represents a 14.5% increase since
the food basket cost was first reported in 2009. 75
The Nutritious Food Basket represents the price to purchase one week of
food to feed a reference family of four (i.e. a man and woman each aged 31 to
50 years; a boy, 14 to 18 years of age; and a girl, four to eight years old). It is
based on a survey of 67 nutritious food items in seven grocery stores, which
was conducted by Wellington-Dufferin-Guelph Public Health in May 2012.
FEBRUARY 2013
34Community Wellbeing initiative • a Community PRoFile
TIME USE
The Time Use indicators explore the use of time, how people experience time, what controls its use,
and how it affects wellbeing.
WORKING LONG HOURS
WHAT IT IS – The percentage of residents working 50 hours or more per week.
WHY IT MATTERS – Working excessive hours is associated with increased health risks for
employees, for example: work accidents and injuries, musculoskeletal disorders, fatigue,
psychological ill health, and unhealthy behaviours (i.e. smoking, drinking and poor diet). Long
work hours also increase the likelihood of job stress, job dissatisfaction, and time-related
pressures for non-work responsibilities. In addition, it can have a negative impact on work-life
balance and family time. 76
WHAT THE LATEST DATA SAYS – 14.0% of Guelph residents (18 years and over) work 50 or
more hours per week (2012).77
COMMUTING TIME
WHAT IT IS – The average commute time from home to the workplace (one-way).
WHY IT MATTERS – For many workers, commuting to work is routine and causes little concern.
For others, it can be a cause of stress and frustration. Generally, the longer the commute time is
(i.e. 45 minutes or more), the more stressful the experience. Public transit users are more likely
than car commuters to be dissatisfied with their commuting times as it takes them longer on
average to get to work. 78
WHAT THE LATEST DATA SAYS – It takes Guelph residents (18 years and over) an average of
21.8 minutes to get to work on a typical day (2012). 79
TIME PRESSURE
WHAT IT IS – The proportion of working age adults experiencing high levels of time pressures (i.e.
ranks 4 or less on 10 point scale, with lower scores indicating higher feelings of time pressure).
WHY IT MATTERS – The term time pressure - also referred to as time squeeze, time stress
or time crunch - refers to not having enough time in a day to do what is needed to be done.
High levels of time pressure are associated with stress, insomnia, and general dissatisfaction
with life. 80
WHAT THE LATEST DATA SAYS – 55.6% of Guelph residents (18 years and over) report high
levels of time pressure (2012).81
FEBRUARY 2013
35Community Wellbeing initiative • a Community PRoFile
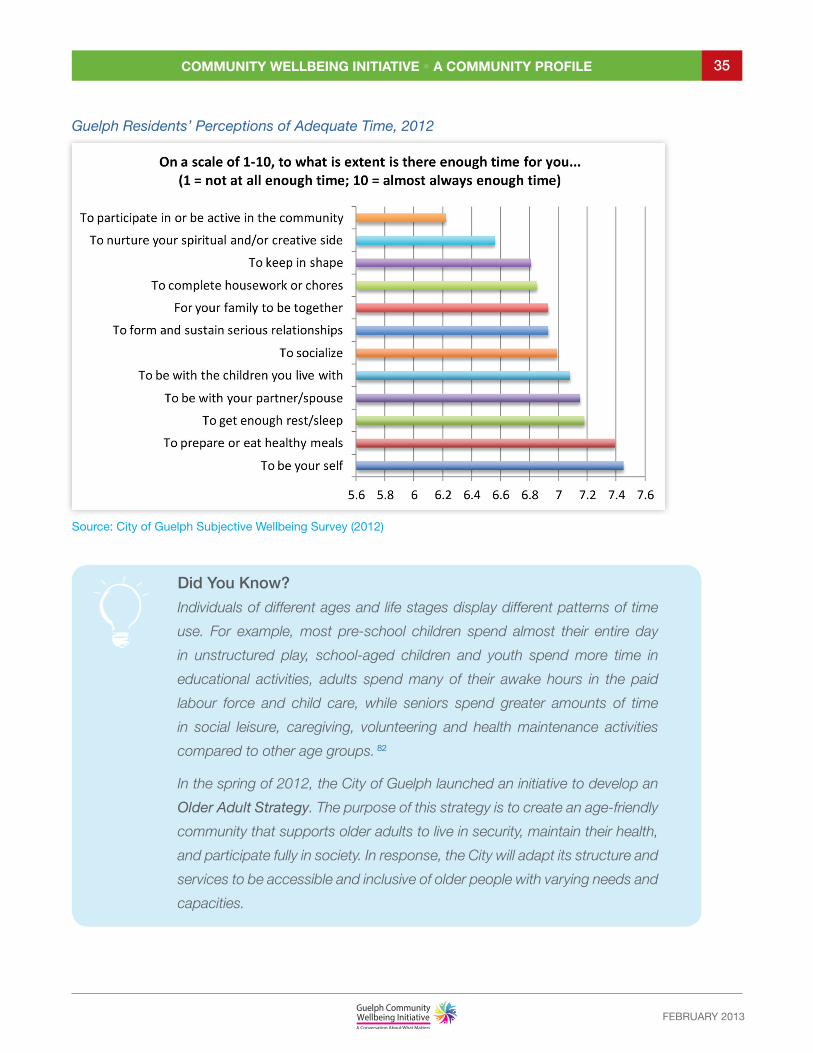
Guelph Residents’ Perceptions of Adequate Time, 2012
Source: City of Guelph Subjective Wellbeing Survey (2012)
Did You Know?
Individuals of different ages and life stages display different patterns of time
use. For example, most pre-school children spend almost their entire day
in unstructured play, school-aged children and youth spend more time in
educational activities, adults spend many of their awake hours in the paid
labour force and child care, while seniors spend greater amounts of time
in social leisure, caregiving, volunteering and health maintenance activities
compared to other age groups. 82
In the spring of 2012, the City of Guelph launched an initiative to develop an
Older Adult Strategy. The purpose of this strategy is to create an age-friendly
community that supports older adults to live in security, maintain their health,
and participate fully in society. In response, the City will adapt its structure and
services to be accessible and inclusive of older people with varying needs and
capacities.
FEBRUARY 2013
Community Wellbeing initiative • a Community PRoFile 36
CONCLUSION
This report presents a sampling of community indicators for Guelph, which viewed collectively
provide a snapshot of the current state of wellbeing in Guelph. These indicators were selected
based on community input and data availability, and have been organized according to the eight
domains of wellbeing. The findings highlight some of the issues that will be considered as part
of the CWI.
We hope this report will inspire conversations and action. We encourage you to talk with your family,
friends, neighbours and colleagues (and the City!) about ways to enhance wellbeing in Guelph.
For more information about the CWI and how to get involved, visit www.guelphwellbeing.ca or
call 519-822-1260.
ACKNOWLEDGEMENTS
We would like to thank all the individuals and organizations that contributed data for this
report, and who participated in various consultations relating to CWI. A special thanks goes
to Barbara Powell, Louise Daw and Jennifer Smith for their ongoing support and leadership to
the CWI, to Eden Grodzinski of JPMC Inc. for writing this report, and to An-Su De Lellis of the
Design Loft Inc. for the design and layout.
FEBRUARY 2013
Community Wellbeing initiative • a Community PRoFile 37
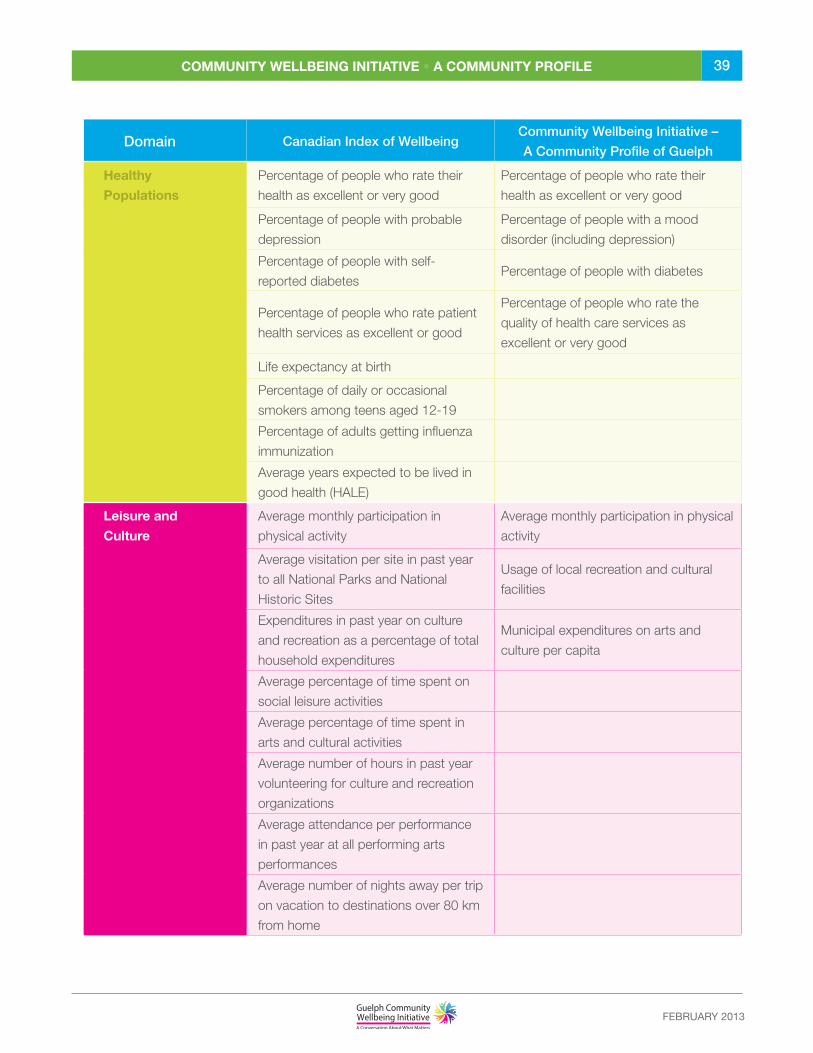
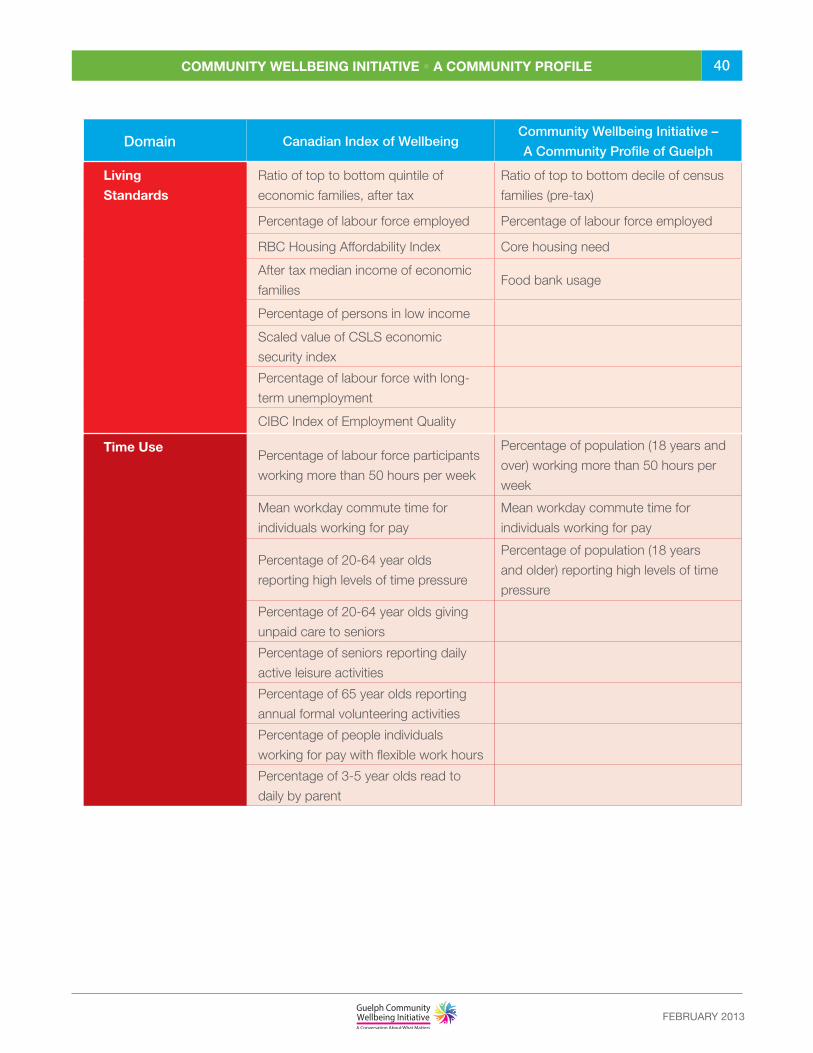
APPENDIX
The Community Wellbeing Initiative (CWI) models itself on the Canadian Index of Wellbeing (CIW) in
adopting the eight domains of wellbeing. It is important to note, however, how this CWI - Community
Profile differs from the CIW. This report includes only three to four indicators per domain, not eight
as in the CIW. In addition, of the 26 indicators presented here, only 19 of the indicators are actually
from the CIW. And a few of those indicator descriptions have been modified slightly for suitability at
the municipal level (see table below). Moreover, while the CIW combines the indicator results into an
aggregate CIW value, this CWI - Community Profile does not provide a composite index.
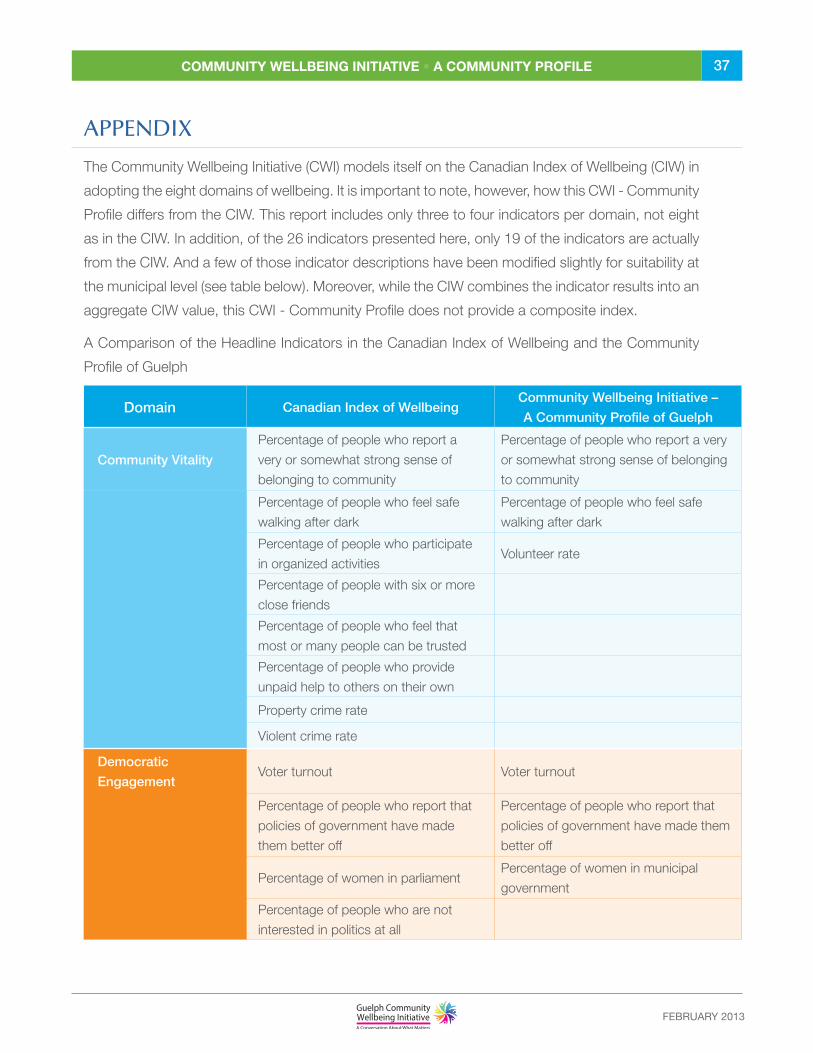
A Comparison of the Headline Indicators in the Canadian Index of Wellbeing and the Community
Profile of Guelph
Domain Canadian Index of WellbeingCommunity Wellbeing Initiative –
A Community Profile of Guelph
Community Vitality
Percentage of people who report a
very or somewhat strong sense of
belonging to community
Percentage of people who report a very
or somewhat strong sense of belonging
to community
Percentage of people who feel safe
walking after dark
Percentage of people who feel safe
walking after dark
Percentage of people who participate
in organized activitiesVolunteer rate
Percentage of people with six or more
close friends
Percentage of people who feel that
most or many people can be trusted
Percentage of people who provide
unpaid help to others on their own
Property crime rate
Violent crime rate
Democratic
EngagementVoter turnout Voter turnout
Percentage of people who report that
policies of government have made
them better off
Percentage of people who report that
policies of government have made them
better off
Percentage of women in parliamentPercentage of women in municipal
government
Percentage of people who are not
interested in politics at all
FEBRUARY 2013
Community Wellbeing initiative • a Community PRoFile 38
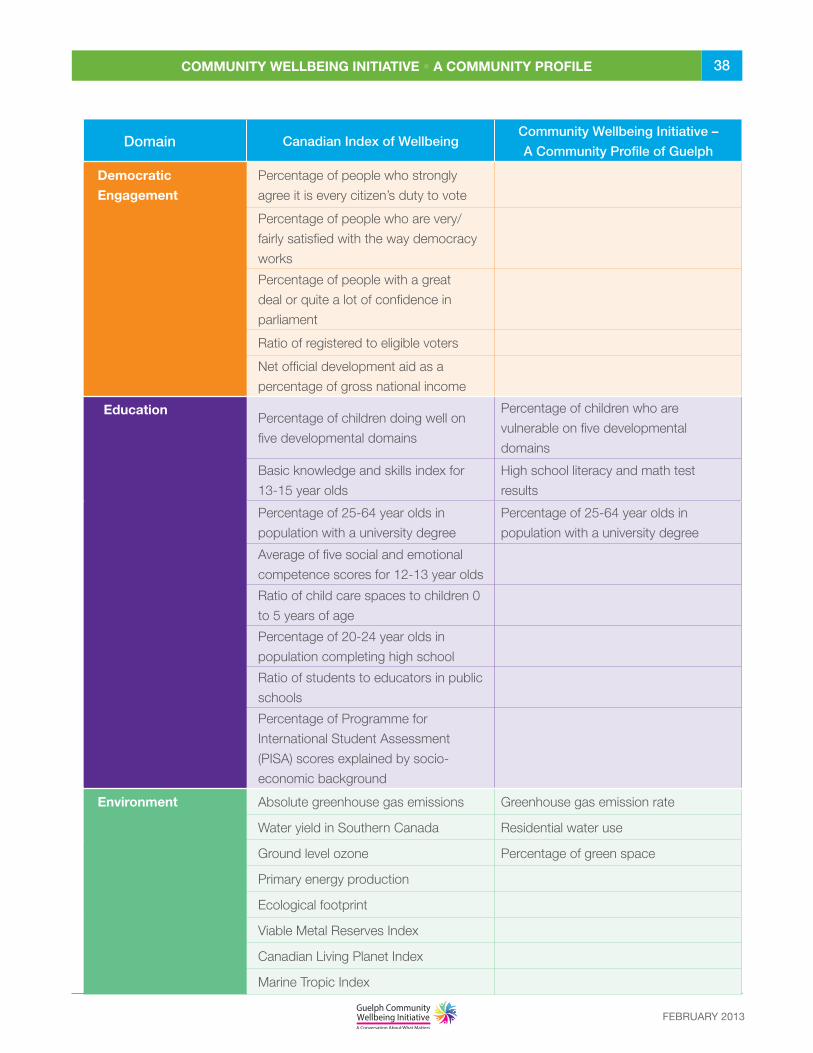
Domain Canadian Index of WellbeingCommunity Wellbeing Initiative –
A Community Profile of Guelph
Democratic
Engagement
Percentage of people who strongly
agree it is every citizen’s duty to vote
Percentage of people who are very/
fairly satisfied with the way democracy
works
Percentage of people with a great
deal or quite a lot of confidence in
parliament
Ratio of registered to eligible voters
Net official development aid as a
percentage of gross national income
EducationPercentage of children doing well on
five developmental domains
Percentage of children who are
vulnerable on five developmental
domains
Basic knowledge and skills index for
13-15 year olds
High school literacy and math test
results
Percentage of 25-64 year olds in
population with a university degree
Percentage of 25-64 year olds in
population with a university degree
Average of five social and emotional
competence scores for 12-13 year olds
Ratio of child care spaces to children 0
to 5 years of age
Percentage of 20-24 year olds in
population completing high school
Ratio of students to educators in public
schools
Percentage of Programme for
International Student Assessment
(PISA) scores explained by socio-
economic background
Environment Absolute greenhouse gas emissions Greenhouse gas emission rate
Water yield in Southern Canada Residential water use
Ground level ozone Percentage of green space
Primary energy production
Ecological footprint
Viable Metal Reserves Index
Canadian Living Planet Index
Marine Tropic Index
FEBRUARY 2013
Community Wellbeing initiative • a Community PRoFile 39
Domain Canadian Index of WellbeingCommunity Wellbeing Initiative –
A Community Profile of Guelph
Healthy
Populations
Percentage of people who rate their
health as excellent or very good
Percentage of people who rate their
health as excellent or very good
Percentage of people with probable
depression
Percentage of people with a mood
disorder (including depression)
Percentage of people with self-
reported diabetesPercentage of people with diabetes
Percentage of people who rate patient
health services as excellent or good
Percentage of people who rate the
quality of health care services as
excellent or very good
Life expectancy at birth
Percentage of daily or occasional
smokers among teens aged 12-19
Percentage of adults getting influenza
immunization
Average years expected to be lived in
good health (HALE)
Leisure and
Culture
Average monthly participation in
physical activity
Average monthly participation in physical
activity
Average visitation per site in past year
to all National Parks and National
Historic Sites
Usage of local recreation and cultural
facilities
Expenditures in past year on culture
and recreation as a percentage of total
household expenditures
Municipal expenditures on arts and
culture per capita
Average percentage of time spent on
social leisure activities
Average percentage of time spent in
arts and cultural activities
Average number of hours in past year
volunteering for culture and recreation
organizations
Average attendance per performance
in past year at all performing arts
performances
Average number of nights away per trip
on vacation to destinations over 80 km
from home
FEBRUARY 2013
Community Wellbeing initiative • a Community PRoFile 40
Domain Canadian Index of WellbeingCommunity Wellbeing Initiative –
A Community Profile of Guelph
Living
Standards
Ratio of top to bottom quintile of
economic families, after tax
Ratio of top to bottom decile of census
families (pre-tax)
Percentage of labour force employed Percentage of labour force employed
RBC Housing Affordability Index Core housing need
After tax median income of economic
familiesFood bank usage
Percentage of persons in low income
Scaled value of CSLS economic
security index
Percentage of labour force with long-
term unemployment
CIBC Index of Employment Quality
Time UsePercentage of labour force participants
working more than 50 hours per week
Percentage of population (18 years and
over) working more than 50 hours per
week
Mean workday commute time for
individuals working for pay
Mean workday commute time for
individuals working for pay
Percentage of 20-64 year olds
reporting high levels of time pressure
Percentage of population (18 years
and older) reporting high levels of time
pressure
Percentage of 20-64 year olds giving
unpaid care to seniors
Percentage of seniors reporting daily
active leisure activities
Percentage of 65 year olds reporting
annual formal volunteering activities
Percentage of people individuals
working for pay with flexible work hours
Percentage of 3-5 year olds read to
daily by parent
FEBRUARY 2013
Community Wellbeing initiative • a Community PRoFile 41
ENDNOTES 1. Wellbeing is typically defined as a state of being happy and healthy. The World Health Organization (2001) defines health
as: “a state of complete physical, mental and social wellbeing and not merely the absence of disease or infirmity”. These definitions recognize that wellbeing is not restricted to physical dimensions, but that it also encompasses psychological and social dimensions (Canadian Index of Wellbeing, 2010).
2. Outcome indicators measure how well an initiative accomplishes its intended results. They compare the result of an intervention to the situation beforehand. For example, the number of police per capita is a process (input) indicator, whereas crime rates are outcomes of community safety.
3. Hilbrecht, M., Smale, B., and Shifman, R. (2012). Guelph Community Wellbeing Survey, Stage 1 Results: A Profile of the Wellbeing of Guelph Residents. Waterloo: Canadian Index of Wellbeing.
4. Statistics Canada (2012). Census Profile, 2011 Census. Statistics Canada Catalogue no. 98-316-XWE. Ottawa.
5. Census family is defined as a married couple and the children, if any, of either or both spouses; a couple living common law and the children, if any, of either or both partners; or, a lone parent of any marital status with at least one child living in the same dwelling and that child or those children. All members of a particular census family live in the same dwelling. A couple may be of opposite or same sex. Children may be children by birth, marriage or adoption regardless of their age or marital status as long as they live in the dwelling and do not have their own spouse or child living in the dwelling. Grandchildren living with their grandparent(s) but with no parents present also constitute a census family. (Statistics Canada, n.d.) Retrieved from http://www.statcan.gc.ca/concepts/definitions/cfamily-rfamille-eng.htm
6. In 2011, there was a change in the way the Census reports Chinese languages. For the first time, Chinese languages are being analyzed separately. The term Chinese designated as ‘not otherwise specified’ (n.o.s.) refers to people who reported ‘Chinese’ in their response to the question on mother tongue without specifying Mandarin, Cantonese or other Chinese languages.
7. Scott, K. (2010). Community Vitality - A Report of the Canadian Index of Wellbeing. Waterloo: Canadian Index of Wellbeing.
8. Wellington-Dufferin-Guelph Public Health (2012). City of Guelph data from the 2009-10 Canadian Community Health Survey obtained by special request.
9. Statistics Canada (2012). Health Profile. Data from the 2009-10 Canadian Community Health Survey. Ottawa: Statistics Canada Catalogue No. 82-228-XWE. Retrieved from http://www12.statcan.gc.ca/health-sante/82-228/index.cfm?Lang=E
10. Fitzgerald, R. (2008). Fear of crime and the neighbourhood context in Canadian cities. Crime and Justice Research Paper Series, no.13. Ottawa: Statistics Canada Catalogue no. 85-561-M. Retrieved from http://www.statcan.gc.ca/pub/85-561-m/85-561-m2008013-eng.htm.
11. Hilbrecht, M., Smale, B., and Shifman, R. (2012). Guelph Community Wellbeing Survey, Stage 1 Results: A Profile of the Wellbeing of Guelph Residents. Waterloo: Canadian Index of Wellbeing.
12. Brooker, A. & Hyman, I. (2010). Time Use - A Report of the Canadian Index of Wellbeing. Waterloo: Canadian Index of Wellbeing.
13. Grodzinski, E. and Sutherns, R. (2012). A Portrait of Guelph’s Community Benefit Sector: A Background Report for the City of Guelph’s Community Investment Strategy. Guelph: City of Guelph.
14. Hilbrecht, M., Smale, B., and Shifman, R. (2012). Guelph Community Wellbeing Survey, Stage 1 Results: A Profile of the Wellbeing of Guelph Residents. Waterloo: Canadian Index of Wellbeing.
15. Statistics Canada (2012, July 24). Police-reported crime statistics, 2011. The Daily. Doi: http://www.statcan.gc.ca/daily-quotidien/120724/t120724b003-eng.htm.
FEBRUARY 2013
Community Wellbeing initiative • a Community PRoFile 42
16. Statistics Canada (2009). Measuring Crime in Canada: Introducing the Crime Severity Index and Improvements to the Uniform Crime Reporting Survey. Canadian Centre for Justice Statistics, Catalogue no. 85-004-X. Retrieved from http://www.policecouncil.ca/reports/SCMeasuringCrimeinCanada09.pdf.
17. Wikipedia (2012). Voter Turnout. Retrieved from http://en.wikipedia.org/wiki/Voter_turnout.
18. Prairie Wild Consulting Co. (2010). Democratic Engagement - A Report of the Canadian Index of Wellbeing. Waterloo: Canadian Index of Wellbeing.
19. City of Guelph (2012). 2010 Municipal Election Results. Retrieved from http://guelph.ca/council/index.php/?page_id=13.
20. Aked, J., Michaelson, J. and Steuer, N. (2010). The role of local government in promoting wellbeing. UK: Local Government Improvement and Development and the National Mental Health Development Unit. Retrieved from http://www.local.gov.uk/c/document_library/get_file?uuid=867e0406-35a5-4e91-910d-6b13305d2319&groupId=10171.
21. Prairie Wild Consulting Co. (2010). Democratic Engagement - A Report of the Canadian Index of Wellbeing. Waterloo: Canadian Index of Wellbeing.
22. Hilbrecht, M., Smale, B., and Shifman, R. (2012). Guelph Community Wellbeing Survey, Stage 1 Results: A Profile of the Wellbeing of Guelph Residents. Waterloo: Canadian Index of Wellbeing.
23. Prairie Wild Consulting Co. (2010). Democratic Engagement - A Report of the Canadian Index of Wellbeing. Waterloo: Canadian Index of Wellbeing.
24. Calculated by author using data from the City of Guelph (2012) and Statistics Canada (2012). Census Profile, 2011 Census. Ottawa: Statistics Canada Catalogue no. 98-316-XWE.
25. Welcoming Community Initiative (2011, February). E-bulletin. Retrieved from http://welcomingcommunities.ca/wp-content/uploads/2011/09/english11.pdf
26. Janus, M., Brinkman, S., Duku, E., Hertzman, C., Santos, R., Sayers, M. and Schroeder, J. (2007). The Early Development Instrument: A Population-based measure for communities. A handbook on development, properties, and use. Hamilton: Offord Centre for Child Studies. Retrieved from http://www.offordcentre.com/readiness/pubs/publications.html.
27. Guelph Community Health Centre (2012). EDI Results for Guelph and Wellington County.
28. The 21st Century Skills are also referred to as employability skills or essential skills and can be organized into six categories: numeracy; communication; critical thinking and problem solving; personal; interpersonal; and information management, technology and information systems. Retrieved from the Partnership for 21st Century Skills: http://www.p21.org/.
29. Statistics Canada (2012). Literacy Counts. Retrieved from http://www.statcan.gc.ca/pub/81-004-x/200404/6853-eng.htm.
30. Education Quality and Accountability Office (2012). Retrieved from https://eqaoweb.eqao.com/pbs/Listing.aspx.
31. Statistics Canada (2012, February 11). Education indicators in Canada: An international perspective, 2010. The Daily. Doi: http://www.statcan.gc.ca/daily-quotidien/120911/dq120911b-eng.htm
32. Guhn, M., Gadermann, A. & Zumbo, B. (2010). Education - A Report of the Canadian Index of Wellbeing. Waterloo: Canadian Index of Wellbeing.
33. Calculated by author using data from Statistics Canada (2007). Census Profile, 2006 Census. Ottawa: Statistics Canada Catalogue no. 92-591-XWE.
34. Guelph Public Library (2012). 2011 Annual Report. Retrieved from http://www.library.guelph.on.ca/about/uploads/reportspubs/GPL%20Annual%20Report%202011.pdf
FEBRUARY 2013
Community Wellbeing initiative • a Community PRoFile 43
35. Morgan, A. (2011). Environment - A Report of the Canadian Index of Wellbeing. Waterloo: Canadian Index of Wellbeing.
36. Guelph Hydro Inc. (2012). The City of Guelph Energy and Emissions Monitoring Report 2011. Guelph: The City of Guelph.
37. Morgan, A. (2011). Environment - A Report of the Canadian Index of Wellbeing. Waterloo: Canadian Index of Wellbeing.
38. City of Guelph (2012). Guelph Water Conservation Progress Report. Retrieved from http://guelph.ca/living.cfm?subCatID=1762&smocid=2338.
39. City of Guelph (2012).
40. Statistics Canada (2010). Perceived health. Retrieved from http://www.statcan.gc.ca/pub/82-229-x/2009001/status/phx-eng.htm.
41. Labonte, R., Pelot, C., Croxford, A., & Auger, D. (2010). Healthy Populations - A Report of the Canadian Index of Wellbeing. Waterloo: Canadian Index of Wellbeing.
42. Wellington-Dufferin-Guelph Public Health (2012). City of Guelph data from the 2009-10 Canadian Community Health Survey obtained by special request.
43. Statistics Canada (2012). Health Profile. Data from the 2009-10 Canadian Community Health Survey. Ottawa: Statistics Canada Catalogue No. 82-228-XWE. Retrieved from http://www12.statcan.gc.ca/health-sante/82-228/index.cfm?Lang=E
44. Labonte, R., Pelot, C., Croxford, A., & Auger, D. (2010). Healthy Populations - A Report of the Canadian Index of Wellbeing. Waterloo: Canadian Index of Wellbeing.
45. Statistics Canada (2009). Mood Disorders. Retrieved from http://www.statcan.gc.ca/pub/82-625-x/2010002/article/11265-eng.htm.
46. Wellington-Dufferin-Guelph Public Health (2012). City of Guelph data from the 2009-10 Canadian Community Health Survey obtained by special request.
47. Statistics Canada (2012). Health Profile. Data from the 2009-10 Canadian Community Health Survey. Ottawa: Statistics Canada Catalogue No. 82-228-XWE. Retrieved from http://www12.statcan.gc.ca/health-sante/82-228/index.cfm?Lang=E
48. Labonte, R., Pelot, C., Croxford, A., & Auger, D. (2010). Healthy Populations - A Report of the Canadian Index of Wellbeing. Waterloo: Canadian Index of Wellbeing.
49. Wellington-Dufferin-Guelph Public Health (2012). City of Guelph data from the 2009-10 Canadian Community Health Survey obtained by special request.
50. Statistics Canada (2012). Health Profile. Data from the 2009-10 Canadian Community Health Survey. Ottawa: Statistics Canada Catalogue No. 82-228-XWE. Retrieved from http://www12.statcan.gc.ca/health-sante/82-228/index.cfm?Lang=E
51. The rating used in the Guelph Wellbeing Survey differs from the Canadian Community Health Survey, which rates quality of care is according to four categories: excellent, good, fair, and poor.
52. Labonte, R., Pelot, C., Croxford, A., & Auger, D. (2010). Healthy Populations - A Report of the Canadian Index of Wellbeing. Waterloo: Canadian Index of Wellbeing.
53. Hilbrecht, M., Smale, B., and Shifman, R. (2012). Guelph Community Wellbeing Survey, Stage 1 Results: A Profile of the Wellbeing of Guelph Residents. Waterloo: Canadian Index of Wellbeing.
54. Wellington-Dufferin-Guelph Coalition for Report Cards on the Well-Being of Children (2011). The well-being of children ages 7 to 13: A report card for Wellington-Dufferin-Guelph.
FEBRUARY 2013
Community Wellbeing initiative • a Community PRoFile 44
55. Smale, B., Donohoe, H., Pelot, C. Croxford, A. & Auger, D. (2010). Leisure & Culture - A Report of the Canadian Index of Wellbeing. Waterloo: Canadian Index of Wellbeing.
56. Labonte, R., Pelot, C., Croxford, A., & Auger, D. (2010). Healthy Populations - A Report of the Canadian Index of Wellbeing. Waterloo: Canadian Index of Wellbeing.
57. Brooker, A. & Hyman, I. (2010). Time Use - A Report of the Canadian Index of Wellbeing. Waterloo: Canadian Index of Wellbeing.
58. Hilbrecht, M., Smale, B., and Shifman, R. (2012). Guelph Community Wellbeing Survey, Stage 1 Results: A Profile of the Wellbeing of Guelph Residents. Waterloo: Canadian Index of Wellbeing.
59. Smale, B., Donohoe, H., Pelot, C. Croxford, A. & Auger, D. (2010). Leisure & Culture - A Report of the Canadian Index of Wellbeing. Waterloo: Canadian Index of Wellbeing.
60. Hilbrecht, M., Smale, B., and Shifman, R. (2012). Guelph Community Wellbeing Survey, Stage 1 Results: A Profile of the Wellbeing of Guelph Residents. Waterloo: Canadian Index of Wellbeing.
61. The “net” investment in the arts figures excludes funds transferred from other levels of government as well as other sources of revenue for civic theatres and other municipal facilities that charge admission. The net expenditures figures provide estimates of what was spent from the tax supported municipal operating budget.
62. Hill Strategies (2012). Municipal Cultural Investment in Five Large Canadian Cities. Retrieved from http://www.hillstrategies.com/content/municipal-cultural-investment-five-large-canadian-cities.
63. City of Guelph (2012).
64. Hill Strategies (2012). Municipal Cultural Investment in Five Large Canadian Cities. Retrieved from http://www.hillstrategies.com/content/municipal-cultural-investment-five-large-canadian-cities.
65. Human Resources and Skills Development Canada (n.d.). Indicators of Wellbeing in Canada, Financial Security, Income Distribution. Retrieved from http://www4.hrsdc.gc.ca/[email protected]?iid=22.
66. The Guelph Census Metropolitan Area (CMA) is comprised of the City of Guelph and the Township of Guelph/Eramosa.
67. The Guelph Community Foundation (2009). Guelph & Wellington’s Vital Signs 2009: Taking the Pulse of our Community.
68. Marshall, K. (2000). Part-time by Choice. Perspectives on Labour and Income, Vol. 1, No. 2. Doi: http://www.statcan.gc.ca/pub/75-001-x/00200/5608-eng.html. Ottawa: Statistics Canada.
69. Human Resources and Skills Development Canada (n.d.). Indicators of Wellbeing in Canada, Work. Retrieved from http://www4.hrsdc.gc.ca/[email protected]?did=3.
70. Sharpe, A. (2011). Living Standards - A Report of the Canadian Index of Wellbeing. Waterloo: Canadian Index of Wellbeing.
71. Workforce Planning Board of Waterloo-Wellington-Dufferin (2012). Workforce Planning Consultation Document, Wellington County 2012-2013.
72. County of Wellington (2012). Interim Study of findings and Conclusions of the Need and Demand Study for 2006 to 2011. 2001 and 2006 Core Housing Need data supplied by Canada Mortgage Housing Corporation.
73. World Health Organization (n.d.). Health Topics: Nutrition. Retrieved from http://www.who.int/topics/nutrition/en/,
74. Guelph & Wellington Task Force for Poverty Elimination (2013). Data from Food Banks Canada.
75. Wellington-Dufferin-Guelph Public Health (2012). Ontario Nutritious Food Basket. Retrieved from http://www.wdgpublichealth.ca/sites/default/files/wdgphfiles/Revised-BOH-report-H%2001-OCT0312-R22.pdf?utm_source=GW+Poverty+E-News+List&utm_campaign=ccf931ac7a-RSS_EMAIL_CAMPAIGN&utm_medium=email
FEBRUARY 2013
Community Wellbeing initiative • a Community PRoFile 45
76. Brooker, A. & Hyman, I. (2010). Time Use - A Report of the Canadian Index of Wellbeing. Waterloo: Canadian Index of Wellbeing.
77. Hilbrecht, M., Smale, B., and Shifman, R. (2012). Guelph Community Wellbeing Survey, Stage 1 Results: A Profile of the Wellbeing of Guelph Residents. Waterloo: Canadian Index of Wellbeing.
78. Statistics Canada (2011, August 24). Commuting to Work, 2010. The Daily. Doi: http://www.statcan.gc.ca/daily-quotidien/110824/dq110824b-eng.htm.
79. Hilbrecht, M., Smale, B., and Shifman, R. (2012). Guelph Community Wellbeing Survey, Stage 1 Results: A Profile of the Wellbeing of Guelph Residents. Waterloo: Canadian Index of Wellbeing.
80. Statistics Canada (2011, August 24). Commuting to Work, 2010. The Daily. Doi: http://www.statcan.gc.ca/daily-quotidien/110824/dq110824b-eng.htm.
81. Hilbrecht, M., Smale, B., and Shifman, R. (2012). Guelph Community Wellbeing Survey, Stage 1 Results: A Profile of the Wellbeing of Guelph Residents. Waterloo: Canadian Index of Wellbeing.
82. Brooker, A. & Hyman, I. (2010). Time Use - A Report of the Canadian Index of Wellbeing. Waterloo: Canadian Index of Wellbeing.