Embed Size (px)
Citation preview
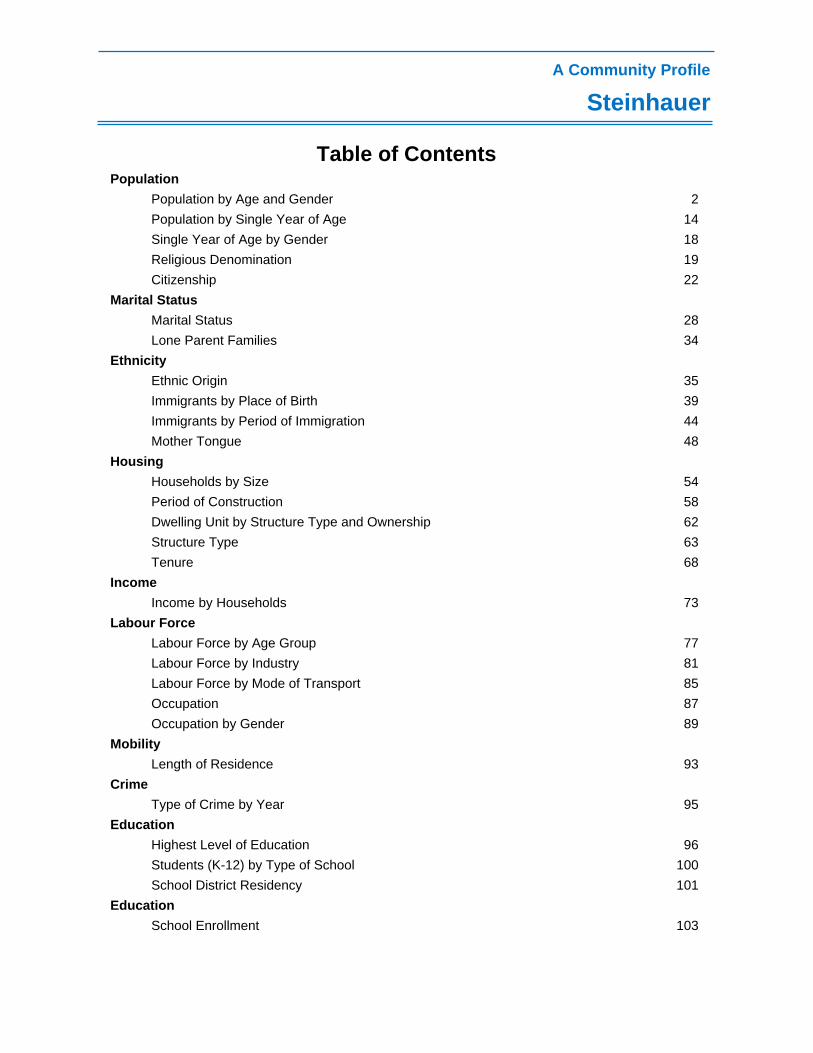
SteinhauerA Community Profile
School Enrollment 103
Education
Highest Level of Education 96
Students (K-12) by Type of School 100
School District Residency 101
Education
Type of Crime by Year 95
Crime
Length of Residence 93
Mobility
Labour Force by Industry 81
Labour Force by Age Group 77
Labour Force by Mode of Transport 85
Occupation by Gender 89
Occupation 87
Labour Force
Income by Households 73
Income
Tenure 68
Structure Type 63
Households by Size 54
Period of Construction 58
Dwelling Unit by Structure Type and Ownership 62
Housing
Immigrants by Place of Birth 39
Ethnic Origin 35
Mother Tongue 48
Immigrants by Period of Immigration 44
Ethnicity
Marital Status 28
Lone Parent Families 34
Marital Status
Population by Single Year of Age 14
Population by Age and Gender 2
Single Year of Age by Gender 18
Citizenship 22
Religious Denomination 19
Population
Table of Contents

SteinhauerA Community ProfilePopulation
Source: Municipal Census
Page 2 of 103
0110-114 0.0 0 0.0 0 0.0
0105-109 0.0 0 0.0 0 0.0
0100-104 0.0 0 0.0 0 0.0
195-99 0.1 0 0.0 1 0.0
290-94 0.2 1 0.1 3 0.1
185-89 0.1 1 0.1 2 0.1
780-84 0.7 7 0.6 14 0.6
2075-79 1.9 23 2.0 43 2.0
3970-74 3.6 31 2.8 70 3.2
5265-69 4.9 46 4.1 98 4.5
6860-64 6.3 71 6.3 139 6.3
8055-59 7.5 86 7.6 166 7.5
8550-54 7.9 108 9.6 193 8.8
7545-49 7.0 87 7.7 162 7.4
8840-44 8.2 103 9.1 191 8.7
7535-39 7.0 72 6.4 147 6.7
6930-34 6.4 64 5.7 133 6.0
6425-29 6.0 56 5.0 120 5.5
6520-24 6.1 84 7.5 149 6.8
8415-19 7.8 75 6.7 159 7.2
6510-14 6.1 82 7.3 147 6.7
765-9 7.1 69 6.1 145 6.6
560-4 5.2 61 5.4 117 5.3
Note: Group Count is included in the table. Group Count means total numbers of individuals residing in a multiple resident facility (such as a group home, transient drop-in centre, residential hotel, or a criminal detention centre) where the personal information that can be conveyed about those individuals by the facility administration is limited by legislation or the facilities regulations.
1,072Total 100.0 1,127 100.0 2,199 100.0
Age Group No. % No. % No. %
Males Females Total
Population by Age and Gender
2005 Municipal Census

SteinhauerPopulation A Community Profile
Page 3 of 103
Source: Municipal Census
Population by Age and Gender
2005 Municipal Census

SteinhauerA Community ProfilePopulation
Source: Federal Census, Statistics Canada
Page 4 of 103
3575+ 3.0 30 2.5 65 2.8
10565 - 74 9.1 55 4.6 160 6.8
8060 - 64 6.9 45 3.8 125 5.3
8055 - 59 6.9 105 8.8 185 7.9
11050 - 54 9.5 120 10.1 230 9.8
8045 - 49 6.9 135 11.3 215 9.2
8540 - 44 7.4 80 6.7 165 7.0
8535 - 39 7.4 60 5.0 145 6.2
7530 - 34 6.5 90 7.6 165 7.0
6525 - 29 5.6 45 3.8 110 4.7
10520 - 24 9.1 105 8.8 210 9.0
9015 - 19 7.8 115 9.7 205 8.7
5510 - 14 4.8 70 5.9 125 5.3
555 - 9 4.8 65 5.5 120 5.1
500 - 4 4.3 70 5.9 120 5.1
1,155Total 100.0 1,190 100.0 2,345 100.0
Note: For privacy, numbers on the report are rounded.
Age Group No. % No. % No. %
Males Females Total
Population by Age and Gender
2001 Federal Census

SteinhauerPopulation A Community Profile
Page 5 of 103
Source: Federal Census, Statistics Canada
Population by Age and Gender
2001 Federal Census

SteinhauerA Community ProfilePopulation
Source: Municipal Census
Page 6 of 103
6Group Count 0.5 0 0.0 6 0.3
285+ 0.2 3 0.3 5 0.2
180 - 84 0.1 4 0.3 5 0.2
675 - 79 0.5 7 0.6 13 0.6
2370 - 74 2.0 25 2.2 48 2.1
4065 - 69 3.6 34 3.0 74 3.3
6060 - 64 5.3 50 4.4 110 4.9
8355 - 59 7.4 74 6.5 157 6.9
9950 - 54 8.8 100 8.7 199 8.8
9345 - 49 8.3 120 10.5 213 9.4
7840 - 44 6.9 107 9.4 185 8.2
9335 - 39 8.3 93 8.1 186 8.2
6030 - 34 5.3 65 5.7 125 5.5
7025 - 29 6.2 62 5.4 132 5.8
8420 - 24 7.5 67 5.9 151 6.7
10215 - 19 9.1 102 8.9 204 9.0
8210 - 14 7.3 102 8.9 184 8.1
625 - 9 5.5 76 6.6 138 6.1
800 - 4 7.1 52 4.5 132 5.8
Note: Group Count means total numbers of individuals residing in a multiple resident facility (such as a group home, transient drop-in centre, residential hotel, or a criminal detention centre) where the personal information that can be conveyed about those individuals by the facility administration is limited by legislation or the facilities regulations.
1,124Total 100.0 1,143 100.0 2,267 100.0
Age Group No. % No. % No. %
Males Females Total
Population by Age and Gender
1999 Municipal Census

SteinhauerPopulation A Community Profile
Page 7 of 103
Source: Municipal Census
Population by Age and Gender
1999 Municipal Census

SteinhauerA Community ProfilePopulation
Source: Federal Census, Statistics Canada
Page 8 of 103
1075+ 0.9 10 0.8 20 0.8
4565 - 74 3.9 50 4.1 95 4.0
4060 - 64 3.5 55 4.5 95 4.0
9055 - 59 7.9 50 4.1 140 5.9
9050 - 54 7.9 85 6.9 175 7.4
10545 - 49 9.2 110 9.0 215 9.1
10540 - 44 9.2 135 11.0 240 10.1
7535 - 39 6.6 95 7.8 170 7.2
6030 - 34 5.3 95 7.8 155 6.6
6025 - 29 5.3 75 6.1 135 5.7
9020 - 24 7.9 95 7.8 185 7.8
12015 - 19 10.5 90 7.3 210 8.9
11510 - 14 10.1 125 10.2 240 10.1
455 - 9 3.9 80 6.5 125 5.3
900 - 4 7.9 75 6.1 165 7.0
1,140Total 100.0 1,225 100.0 2,365 100.0
Note: For privacy, numbers on the report are rounded.
Age Group No. % No. % No. %
Males Females Total
Population by Age and Gender
1996 Federal Census

SteinhauerPopulation A Community Profile
Page 9 of 103
Source: Federal Census, Statistics Canada
Population by Age and Gender
1996 Federal Census

SteinhauerA Community ProfilePopulation
Source: Federal Census, Statistics Canada
Page 10 of 103
1075+ 0.8 15 1.2 25 1.0
2565 - 74 2.0 35 2.8 60 2.4
3560 - 64 2.8 25 2.0 60 2.4
6555 - 59 5.2 50 4.0 115 4.6
9550 - 54 7.6 75 5.9 170 6.8
9545 - 49 7.6 110 8.7 205 8.2
11540 - 44 9.2 140 11.1 255 10.2
12035 - 39 9.6 130 10.3 250 10.0
8530 - 34 6.8 110 8.7 195 7.8
6525 - 29 5.2 90 7.1 155 6.2
10020 - 24 8.0 85 6.7 185 7.4
10015 - 19 8.0 95 7.5 195 7.8
12010 - 14 9.6 105 8.3 225 9.0
1205 - 9 9.6 125 9.9 245 9.8
950 - 4 7.6 75 5.9 170 6.8
1,245Total 100.0 1,265 100.0 2,510 100.0
Note: For privacy, numbers on the report are rounded.
Age Group No. % No. % No. %
Males Females Total
Population by Age and Gender
1991 Federal Census

SteinhauerPopulation A Community Profile
Page 11 of 103
Source: Federal Census, Statistics Canada
Population by Age and Gender
1991 Federal Census
SteinhauerA Community ProfilePopulation
Source: Federal Census, Statistics Canada
Page 12 of 103
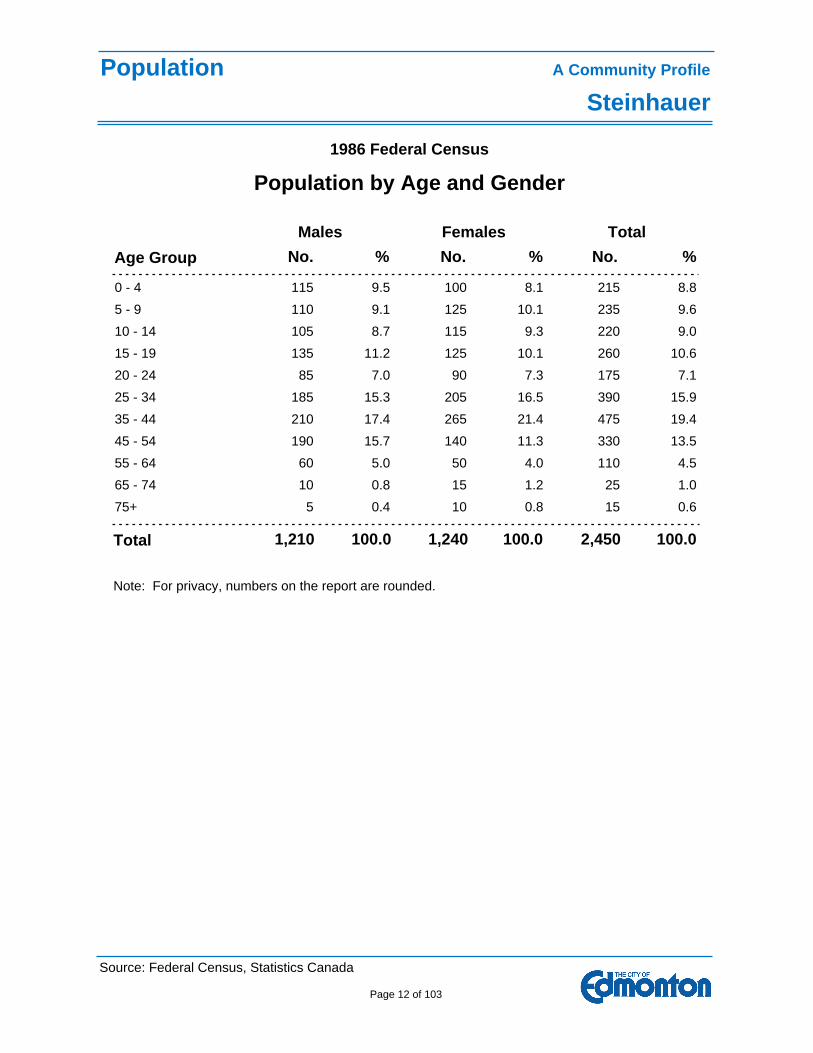
575+ 0.4 10 0.8 15 0.6
1065 - 74 0.8 15 1.2 25 1.0
6055 - 64 5.0 50 4.0 110 4.5
19045 - 54 15.7 140 11.3 330 13.5
21035 - 44 17.4 265 21.4 475 19.4
18525 - 34 15.3 205 16.5 390 15.9
8520 - 24 7.0 90 7.3 175 7.1
13515 - 19 11.2 125 10.1 260 10.6
10510 - 14 8.7 115 9.3 220 9.0
1105 - 9 9.1 125 10.1 235 9.6
1150 - 4 9.5 100 8.1 215 8.8
Note: For privacy, numbers on the report are rounded.
1,210Total 100.0 1,240 100.0 2,450 100.0
Age Group No. % No. % No. %
Males Females Total
Population by Age and Gender
1986 Federal Census

SteinhauerPopulation A Community Profile
Page 13 of 103
Source: Federal Census, Statistics Canada
Population by Age and Gender
1986 Federal Census

SteinhauerA Community ProfilePopulation
Source: Municipal Census
Page 14 of 103
2128 2662 096
1927 2661 195
2626 3860 094
3625 1959 193
1724 4358 092
2623 3957 091
2822 3156 290
3621 3455 089
4220 3854 088
3119 4653 087
3418 3752 186
3817 3451 185
2516 3750 184
3115 3749 083
3514 3248 482
2613 3447 281
2512 3446 780
2911 2445 1279
3210 4044 578
289 3343 977
298 4342 1076
307 3741 775
306 3740 1274
285 3039 1073
304 3438 1572
283 2837 1571
192 2536 1870
261 2835 1769
140 2734 2368
2005 Municipal Census
Age No. Age No. Age No.
Population by Single Year of Age

SteinhauerPopulation A Community Profile
Page 15 of 103
Source: Municipal Census
2733 1767 0100+
2932 1366 0100
2931 2865 099
2130 2364 098
1829 2663 097
Total 2,194
Note: Group Count is NOT included in the table. Group Count means total numbers of individuals residing in a multiple resident facility (such as a group home, transient drop-in centre, residential hotel, or a criminal detention centre) where the personal information that can be conveyed about those individuals by the facility administration is limited by legislation or the facilities regulations.
2005 Municipal Census
Age No. Age No. Age No.
Population by Single Year of Age

SteinhauerA Community ProfilePopulation
Source: Municipal Census
Page 16 of 103
2128 2165 0102
2627 1964 0101
3026 2263 0100
3125 2362 099
2624 2661 098
2423 2060 097
2822 3659 096
3721 3758 095
3620 2357 094
4119 3356 093
2918 2855 092
4317 4154 091
5016 2553 090
4115 5352 089
3214 4451 088
5313 3650 387
3412 3849 086
3511 4248 285
3010 4647 384
319 3946 183
258 4845 182
307 4444 081
276 3843 080
255 3242 179
294 4241 278
333 2940 277
252 3239 576
301 4438 375
150 3137 1074
1999 Municipal Census
Age No. Age No. Age No.
Population by Single Year of Age

SteinhauerPopulation A Community Profile
Page 17 of 103
Source: Municipal Census
6Group Count
4336 1373 0110
3635 572 0109
3334 1071 0108
2333 1070 0107
2132 769 0106
2531 1468 0105
2330 1667 0104
2429 1666 0103
Total 2,267
Note: Group Count means total numbers of individuals residing in a multiple resident facility (such as a group home, transient drop-in centre, residential hotel, or a criminal detention centre) where the personal information that can be conveyed about those individuals by the facility administration is limited by legislation or the facilities regulations.
1999 Municipal Census
Age No. Age No. Age No.
Population by Single Year of Age
SteinhauerPopulation A Community ProfilePopulation
Source: Municipal Census
Page 18 of 103
Source: Municipal Census
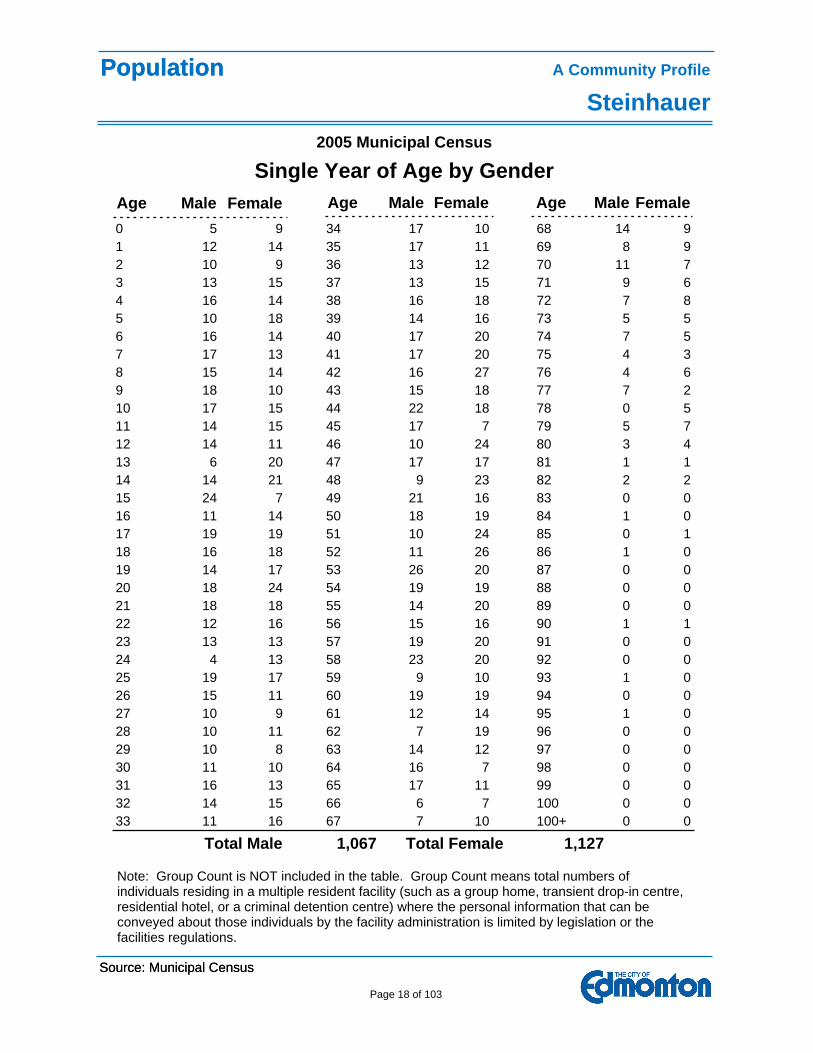
1133 767 0100+16 10 01432 666 010015 7 01631 1765 09913 11 01130 1664 09810 7 01029 1463 0978 12 01028 762 09611 19 01027 1261 1959 14 01526 1960 09411 19 01925 959 19317 10 0
424 2358 09213 20 01323 1957 09113 20 01222 1556 19016 16 11821 1455 08918 20 01820 1954 08824 19 01419 2653 08717 20 01618 1152 18618 26 01917 1051 08519 24 11116 1850 18414 19 02415 2149 0837 16 01414 948 28221 23 2
613 1747 18120 17 11412 1046 38011 24 41411 1745 57915 7 71710 2244 07815 18 5189 1543 77710 18 2158 1642 47614 27 6177 1741 47513 20 3166 1740 77414 20 5105 1439 57318 16 5164 1638 77214 18 8133 1337 97115 15 6102 1336 11709 12 7121 1735 86914 11 9
50 1734 14689 10 9
Total Male 1,067 Total Female 1,127
Note: Group Count is NOT included in the table. Group Count means total numbers of individuals residing in a multiple resident facility (such as a group home, transient drop-in centre, residential hotel, or a criminal detention centre) where the personal information that can be conveyed about those individuals by the facility administration is limited by legislation or the facilities regulations.
2005 Municipal Census
Age Male Female Age Male Female Age Male Female
Single Year of Age by Gender

SteinhauerA Community ProfilePopulation
Source: Federal Census, Statistics Canada
Page 19 of 103
10Ukrainian Catholic 0.4
20Sikh 0.9
0Serbian Orthodox 0.0
0Salvation Army 0.0
435Roman Catholic 18.6
70Protestant 3.0
25Presbyterian 1.1
35Pentecostal 1.5
0Pagan 0.0
0Orthodox not included elsewhere 0.0
10Non-denominational 0.4
620No Religion 26.4
20Native Indian or Inuit 0.9
55Muslim 2.3
10Methodist 0.4
10Mennonite 0.4
70Lutheran 3.0
0Jewish 0.0
0Jehovah's Witnesses 0.0
0Hutterite 0.0
170Hindu 7.2
0Greek Orthodox 0.0
10Evangelical Missionary Church 0.4
35Church of Jesus Christ of Latter-day Saints 1.5
0Christian Reformed Church 0.0
120Christian not included elsewhere 5.1
35Christian and Missionary Alliance 1.5
70Buddhist 3.0
0Brethren in Christ 0.0
70Baptist 3.0
110Anglican 4.7
0Adventist - Seventh-day 0.0
2001 Federal Census
Religious Denomination No. %
Religious Denomination

SteinhauerPopulation A Community Profile
Page 20 of 103
Source: Federal Census, Statistics Canada
325United Church 13.9
10Ukrainian Orthodox 0.4
2,345Total 100.0
Note: For privacy, numbers on the report are rounded.
2001 Federal Census
Religious Denomination No. %
Religious Denomination

SteinhauerPopulation A Community ProfilePopulation
Source: Federal Census, Statistics Canada
Page 21 of 103
Source: Federal Census, Statistics Canada
375United Church 14.9
75Ukrainian Catholic 3.0
10Sikh 0.4
15Salvation Army 0.6
500Roman Catholic 19.8
0Reformed Bodies 0.0
25Presbyterian 1.0
95Pentecostal 3.8
10Other Religions 0.4
255Other Protestant 10.1
630No Religion 25.0
0Mennonite 0.0
70Lutheran 2.8
0Jewish 0.0
0Jehovah's Witnesses 0.0
80Islam 3.2
25Hindu 1.0
70Eastern Orthodox 2.8
35Church of Jesus Christ of Latter-day Saints 1.4
35Buddhist 1.4
110Baptist 4.4
110Anglican 4.4
2,525Total 100.0
Note: For privacy, numbers on the report are rounded.
1991 Federal Census
Religious Denomination No. %
Religious Denomination

SteinhauerPopulation A Community ProfilePopulation
Source: Municipal Census
Page 22 of 103
Source: Municipal Census
102Non Canadian Citizen 4.6
2,097Canadian Citizen 95.4
2,199Total 100.0
Note: Group Count is included in the table. Group Count means total numbers of individuals residing in a multiple resident facility (such as a group home, transient drop-in centre, residential hotel, or a criminal detention centre) where the personal information that can be conveyed about those individuals by the facility administration is limited by legislation or the facilities regulations.
2005 Municipal Census
Citizenship No. %
Citizenship

SteinhauerPopulation A Community ProfilePopulation
Source: Federal Census, Statistics Canada
Page 23 of 103
Source: Federal Census, Statistics Canada
200Non Canadian Citizenship 8.5
2,140Canadian Citizenship 91.5
2,340Total 100.0
Note: For privacy, numbers on the report are rounded.
2001 Federal Census
Citizenship No. %
Citizenship

SteinhauerPopulation A Community ProfilePopulation
Source: Municipal Census
Page 24 of 103
Source: Municipal Census
103Non Canadian Citizenship 4.5
6Group Count 0.3
2,158Canadian Citizenship 95.2
2,267Total 100.0
Note: Group Count means total numbers of individuals residing in a multiple resident facility (such as a group home, transient drop-in centre, residential hotel, or a criminal detention centre) where the personal information that can be conveyed about those individuals by the facility administration is limited by legislation or the facilities regulations.
1999 Municipal Census
Citizenship No. %
Citizenship

SteinhauerPopulation A Community ProfilePopulation
Source: Federal Census, Statistics Canada
Page 25 of 103
Source: Federal Census, Statistics Canada
160Non Canadian Citizenship 6.7
2,215Canadian Citizenship 93.3
2,375Total 100.0
Note: For privacy, numbers on the report are rounded.
1996 Federal Census
Citizenship No. %
Citizenship

SteinhauerPopulation A Community ProfilePopulation
Source: Federal Census, Statistics Canada
Page 26 of 103
Source: Federal Census, Statistics Canada
135Non Canadian Citizenship 5.3
2,390Canadian Citizenship 94.7
2,525Total 100.0
Note: For privacy, numbers on the report are rounded.
1991 Federal Census
Citizenship No. %
Citizenship

SteinhauerPopulation A Community ProfilePopulation
Source: Federal Census, Statistics Canada
Page 27 of 103
Source: Federal Census, Statistics Canada
160Non Canadian Citizenship 6.5
2,310Canadian Citizenship 93.5
2,470Total 100.0
Note: For privacy, numbers on the report are rounded.
1986 Federal Census
Citizenship No. %
Citizenship

SteinhauerMarital Status A Community ProfileMarital Status
Source: Municipal Census
Page 28 of 103
Source: Municipal Census
5Unknown 0.2
62Widowed 2.8
113Separated, divorced 5.1
16Other 0.7
899Never Married 40.9
1,031Married 46.9
73Common-law 3.3
2,199Total 100.0
Note: Group Count is included in the table as Unknown. Group Count means total numbers of individuals residing in a multiple resident facility (such as a group home, transient drop-in centre, residential hotel, or a criminal detention centre) where the personal information that can be conveyed about those individuals by the facility administration is limited by legislation or the facilities regulations.
2005 Municipal Census
Marital Status No. %
Marital Status

SteinhauerMarital Status A Community ProfileMarital Status
Source: Federal Census, Statistics Canada
Page 29 of 103
Source: Federal Census, Statistics Canada
50Widowed 2.5
45Separated (but still legally married) 2.3
140Divorced 7.1
1,115Legally Married (and not separated) 56.5
625Never Legally Married (single) 31.6
1,975Total 100.0
Note: For privacy, numbers on the report are rounded.
2001 Federal Census
Marital Status No. %
Marital Status

SteinhauerMarital Status A Community ProfileMarital Status
Source: Municipal Census
Page 30 of 103
Source: Municipal Census
6Group Count 0.3
41Widowed 1.8
74Common Law 3.3
3Other 0.1
127Separated / Divorced 5.6
1,023Legally Married (and not separated) 45.1
993Never Legally Married (single) 43.8
2,267Total 100.0
Note: Group Count means total numbers of individuals residing in a multiple resident facility (such as a group home, transient drop-in centre, residential hotel, or a criminal detention centre) where the personal information that can be conveyed about those individuals by the facility administration is limited by legislation or the facilities regulations.
1999 Municipal Census
Marital Status No. %
Marital Status

SteinhauerMarital Status A Community ProfileMarital Status
Source: Federal Census, Statistics Canada
Page 31 of 103
Source: Federal Census, Statistics Canada
45Widowed 2.5
55Separated (but still legally married) 3.0
80Divorced 4.4
1,090Legally Married (and not separated) 59.4
565Never Legally Married (single) 30.8
1,835Total 100.0
Note: For privacy, numbers on the report are rounded.
1996 Federal Census
Marital Status No. %
Marital Status

SteinhauerMarital Status A Community ProfileMarital Status
Source: Federal Census, Statistics Canada
Page 32 of 103
Source: Federal Census, Statistics Canada
40Widowed 2.1
35Separated (but still legally married) 1.9
90Divorced 4.8
1,185Legally Married (and not separated) 63.4
520Never Legally Married (single) 27.8
1,870Total 100.0
Note: For privacy, numbers on the report are rounded.
1991 Federal Census
Marital Status No. %
Marital Status

SteinhauerMarital Status A Community ProfileMarital Status
Source: Federal Census, Statistics Canada
Page 33 of 103
Source: Federal Census, Statistics Canada
50Widowed 2.8
35Divorced 2.0
1,210Legally Married (includes separated) 68.6
470Never Legally Married (single) 26.6
1,765Total 100.0
Note: For privacy, numbers on the report are rounded.
1986 Federal Census
Marital Status No. %
Marital Status

SteinhauerMarital Status A Community ProfileMarital Status
Source: Federal Census, Statistics Canada
Page 34 of 103
Source: Federal Census, Statistics Canada
952001
901996
751991
751986
Note: For privacy, numbers on the report are rounded.
Federal Census
Year No.
Lone Parent Families

SteinhauerEthnicity A Community ProfileEthnicity
Source: Federal Census, Statistics Canada
Page 35 of 103
Source: Federal Census, Statistics Canada
2,400Multiple Origins 67.5
10Welsh 0.3
90Ukrainian 2.5
15Swedish 0.4
45Scottish 1.3
0Russian 0.0
0Québécois 0.0
45Polish 1.3
0Norwegian 0.0
0North American Indian 0.0
10Métis 0.3
0Lebanese 0.0
10Italian 0.3
50Irish 1.4
0Inuit 0.0
0Haitian 0.0
0Greek 0.0
110German 3.1
20French 0.6
10Filipino 0.3
35English 1.0
220East Indian 6.2
15Dutch (Netherlands) 0.4
0Danish 0.0
260Chinese 7.3
210Canadian 5.9
0British 0.0
0American (USA) 0.0
0Acadian 0.0
1,155Sub Total 32.5
Single Origins No. %
Note: For privacy, numbers on the report are rounded.
Ethnic Origin2001 Federal Census

SteinhauerEthnicity A Community ProfileEthnicity
Source: Federal Census, Statistics Canada
Page 36 of 103
Source: Federal Census, Statistics Canada
3,360Multiple Origins 77.2
0Welsh 0.0
90Ukrainian 2.1
0Swedish 0.0
25Scottish 0.6
0Russian 0.0
0Portuguese 0.0
55Polish 1.3
10Norwegian 0.2
10North American Indian 0.2
0Metis 0.0
0Jewish 0.0
10Italian 0.2
50Irish 1.1
0Inuit 0.0
10Hungarian (Magyar) 0.2
0Haitian 0.0
0Greek 0.0
85German 2.0
10French 0.2
0Filipino 0.0
115English 2.6
130East Indian 3.0
0Dutch (Netherlands) 0.0
10Danish 0.2
130Chinese 3.0
250Canadian 5.7
0American 0.0
0Acadian 0.0
990Sub Total 22.8
Single Origins No. %
Note: For privacy, numbers on the report are rounded.
Ethnic Origin1996 Federal Census

SteinhauerEthnicity A Community ProfileEthnicity
Source: Federal Census, Statistics Canada
Page 37 of 103
Source: Federal Census, Statistics Canada
1,030Multiple Origins 40.8
0Yugoslav 0.0
25Vietnamese 1.0
135Ukrainian 5.3
10Swedish 0.4
0Spanish 0.0
70Scottish 2.8
0Portuguese 0.0
45Polish 1.8
95Other single origins 3.8
0Other British 0.0
20Norwegian 0.8
0Lebanese 0.0
20Korean 0.8
0Jewish 0.0
0Japanese 0.0
10Italian 0.4
60Irish 2.4
10Hungarian (Magyar) 0.4
0Greek 0.0
175German 6.9
20French 0.8
0Finnish 0.0
15Filipino 0.6
105English 4.2
95East Indian 3.8
0Dutch (Netherlands) 0.0
0Danish 0.0
10Croatian 0.4
355Chinese 14.1
190Canadian 7.5
10Black 0.4
20Aboriginal 0.8
1,495Sub Total 59.2
Single Origins No. %
Note: For privacy, numbers on the report are rounded.
Ethnic Origin1991 Federal Census
SteinhauerEthnicity A Community ProfileEthnicity
Source: Federal Census, Statistics Canada
Page 38 of 103
Source: Federal Census, Statistics Canada
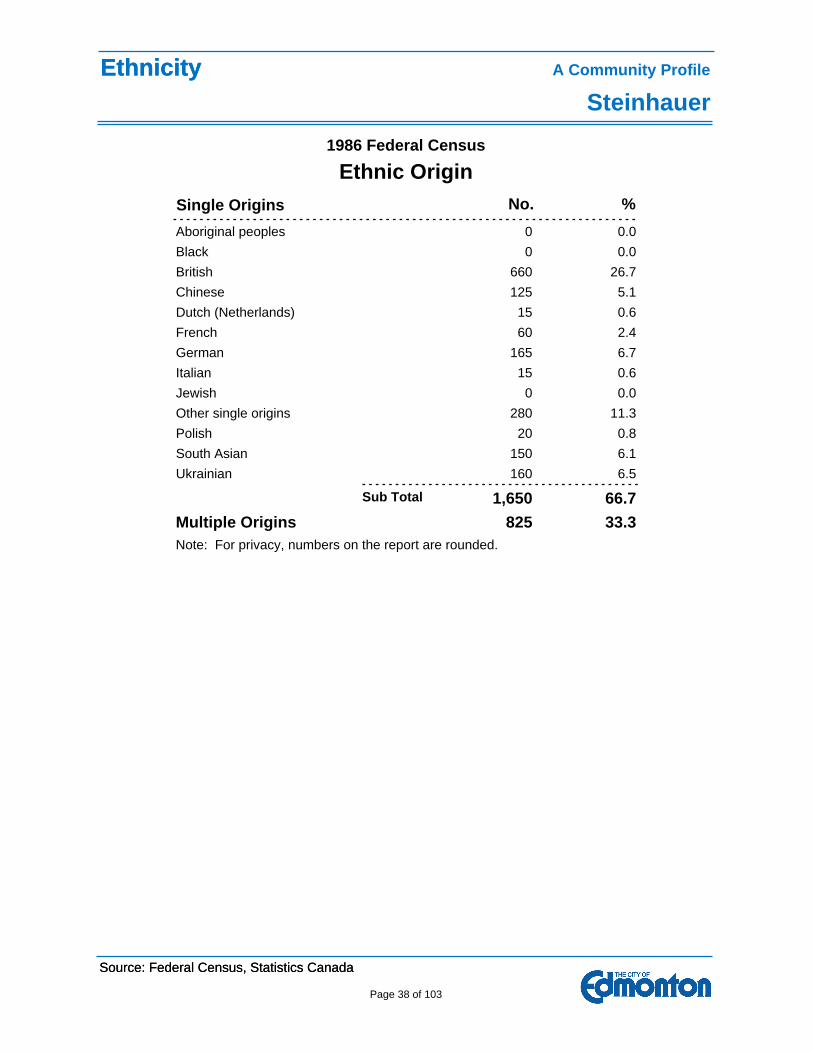
825Multiple Origins 33.3
160Ukrainian 6.5
150South Asian 6.1
20Polish 0.8
280Other single origins 11.3
0Jewish 0.0
15Italian 0.6
165German 6.7
60French 2.4
15Dutch (Netherlands) 0.6
125Chinese 5.1
660British 26.7
0Black 0.0
0Aboriginal peoples 0.0
1,650Sub Total 66.7
Single Origins No. %
Note: For privacy, numbers on the report are rounded.
Ethnic Origin1986 Federal Census

SteinhauerEthnicity A Community ProfileEthnicity
Source: Federal Census, Statistics Canada
Page 39 of 103
Source: Federal Census, Statistics Canada
0Yugoslavia 0.0
35Vietnam 4.2
15United States 1.8
60United Kingdom 7.2
10Ukraine 1.2
30Taiwan 3.6
0Switzerland 0.0
10South Africa, Republic of 1.2
0Portugal 0.0
40Poland 4.8
10Philippines 1.2
205Other 24.6
15Netherlands 1.8
0Morocco 0.0
0Mexico 0.0
0Lebanon 0.0
30Korea, South 3.6
0Jamaica 0.0
20Italy 2.4
10Ireland, Republic of (Eire) 1.2
155India 18.6
50Hong Kong, Special Administrative Region 6.0
0Haiti 0.0
0Guyana 0.0
0Greece 0.0
35Germany 4.2
0France 0.0
0Egypt 0.0
0Croatia 0.0
105China, People's Republic of 12.6
0Austria 0.0
835Total 100.0
Note: For privacy, numbers on the report are rounded.
2001 Federal Census
Place of Birth No. %
Immigrants by Place of Birth

SteinhauerA Community ProfileEthnicity
Source: Federal Census, Statistics Canada
Page 40 of 103
15Sri Lanka 2.8
55South Korea 10.4
0South Africa, Republic of 0.0
0Russian Federation 0.0
0Romania 0.0
0Portugal 0.0
40Poland 7.5
0Philippines 0.0
0Pakistan 0.0
10Other Asia 1.9
50Other 9.4
0Netherlands 0.0
0Malaysia 0.0
0Lebanon 0.0
0Kenya 0.0
10Jamaica 1.9
10Italy 1.9
10Ireland, Republic of (Eire) 1.9
60India 11.3
10Hungary 1.9
20Hong Kong 3.8
0Guyana 0.0
0Greece 0.0
10Germany 1.9
0France 0.0
0Fiji 0.0
0El Salvador 0.0
10Denmark 1.9
0Czechoslovakia 0.0
10Croatia 1.9
85China, People's Republic of 16.0
0Chile 0.0
0Cambodia 0.0
10Austria 1.9
1996 Federal Census
Place of Birth No. %
Immigrants by Place of Birth

SteinhauerEthnicity A Community Profile
Page 41 of 103
Source: Federal Census, Statistics Canada
0Yugoslavia 0.0
25Vietnam 4.7
10United States of America 1.9
70United Kingdom 13.2
0Ukraine 0.0
10Trinidad and Tobago 1.9
0Tanzania, United Republic of 0.0
530Total 100.0
Note: For privacy, numbers on the report are rounded.
1996 Federal Census
Place of Birth No. %
Immigrants by Place of Birth

SteinhauerEthnicity A Community ProfileEthnicity
Source: Federal Census, Statistics Canada
Page 42 of 103
Source: Federal Census, Statistics Canada
25United States of America 4.0
60United Kingdom 9.7
115Other Europe 18.5
270Other Asia 43.5
10Oceania & Other 1.6
55India 8.9
10Central and South America 1.6
20Caribbean and Bermuda 3.2
55Africa 8.9
620Total 100.0
Note: For privacy, numbers on the report are rounded.
1991 Federal Census
Place of Birth No. %
Immigrants by Place of Birth

SteinhauerEthnicity A Community ProfileEthnicity
Source: Federal Census, Statistics Canada
Page 43 of 103
Source: Federal Census, Statistics Canada
40United States of America 7.7
135United Kingdom 26.0
140Other Europe 26.9
130Other Asia 25.0
0Other Americas 0.0
0Other 0.0
0Oceania 0.0
0Italy 0.0
75India 14.4
0Africa 0.0
520Total 100.0
Note: For privacy, numbers on the report are rounded.
1986 Federal Census
Place of Birth No. %
Immigrants by Place of Birth

SteinhauerEthnicity A Community ProfileEthnicity
Source: Federal Census, Statistics Canada
Page 44 of 103
Source: Federal Census, Statistics Canada
1701996-2001 20.2
451991-1995 5.4
2551981-1990 30.4
1851971-1980 22.0
901961-1970 10.7
95Before 1961 11.3
840Total 100.0
Note: For privacy, numbers on the report are rounded.
2001 Federal Census
Period of Immigration No. %
Immigrants by Period of Immigration

SteinhauerEthnicity A Community ProfileEthnicity
Source: Federal Census, Statistics Canada
Page 45 of 103
Source: Federal Census, Statistics Canada
851991-1995 16.0
801981-1990 15.1
2151971-1980 40.6
851961-1970 16.0
65Before 1961 12.3
530Total 100.0
Note: For privacy, numbers on the report are rounded.
1996 Federal Census
Period of Immigration No. %
Immigrants by Period of Immigration

SteinhauerEthnicity A Community ProfileEthnicity
Source: Federal Census, Statistics Canada
Page 46 of 103
Source: Federal Census, Statistics Canada
1551981-1990 25.4
1951971-1980 32.0
1901961-1970 31.1
70Before 1961 11.5
610Total 100.0
Note: For privacy, numbers on the report are rounded.
1991 Federal Census
Period of Immigration No. %
Immigrants by Period of Immigration

SteinhauerEthnicity A Community ProfileEthnicity
Source: Federal Census, Statistics Canada
Page 47 of 103
Source: Federal Census, Statistics Canada
01983-1986 0.0
451978-1982 8.0
3651967-1977 64.6
1201956-1966 21.2
351946-1955 6.2
0Before 1946 0.0
565Total 100.0
Note: For privacy, numbers on the report are rounded.
1986 Federal Census
Period of Immigration No. %
Immigrants by Period of Immigration

SteinhauerA Community ProfileEthnicity
Source: Federal Census, Statistics Canada
Page 48 of 103
0Russian 0.0
25Punjabi 1.1
0Portuguese 0.0
40Polish 1.7
55Persian (Farsi) 2.3
180Other languages 7.7
0Ojibway 0.0
10Mandarin 0.4
0Kutchin-Gwich'in (Loucheux) 0.0
25Korean 1.1
15Italian 0.6
0Inuktitut (Eskimo) 0.0
10Hungarian 0.4
30Hindi 1.3
0Greek 0.0
65German 2.8
15Dutch 0.6
0Danish 0.0
0Croatian 0.0
0Creoles 0.0
10Cree 0.4
0Chipewyan 0.0
145Chinese 6.2
60Cantonese 2.6
0Arabic 0.0
Non-Official
15French 0.6
1,540English 65.7
1,555 66.3
Official
Single Responses
Mother Tongue No. %
2001 Federal Census
Mother Tongue

SteinhauerEthnicity A Community Profile
Page 49 of 103
Source: Federal Census, Statistics Canada
Multiple Responses 10 0.4
40Vietnamese 1.7
0Urdu 0.0
30Ukrainian 1.3
10Tagalog (Pilipino) 0.4
15Spanish 0.6
0South Slave 0.0
0Serbo-Croatian 0.0
780 33.3
Non-Official
2,345Grand Total 100.0
Note: For privacy, numbers on the report are rounded.
2001 Federal Census
Mother Tongue

SteinhauerA Community ProfileEthnicity
Source: Federal Census, Statistics Canada
Page 50 of 103
0Tagalog (Pilipino) 0.0
25Spanish 1.1
0South Slave 0.0
0Serbo-Croatian 0.0
0Punjabi 0.0
0Portuguese 0.0
45Polish 1.9
155Other languages 6.5
0Ojibway 0.0
0Norwegian 0.0
0Japanese 0.0
0Italian 0.0
0Inuktitut (Eskimo) 0.0
10Hungarian 0.4
10Hindi 0.4
0Greek 0.0
70German 2.9
0Frisian 0.0
0Dutch 0.0
0Dogrib 0.0
0Dene 0.0
0Creoles 0.0
0Cree 0.0
105Chinese 4.4
0Arabic 0.0
Non-Official
30French 1.3
1,845English 77.7
1,875 78.9
Official
Single Responses
Mother Tongue No. %
1996 Federal Census
Mother Tongue

SteinhauerEthnicity A Community Profile
Page 51 of 103
Source: Federal Census, Statistics Canada
Multiple Responses 25 1.1
25Vietnamese 1.1
30Ukrainian 1.3
475 20.0
Non-Official
2,375Grand Total 100.0
Note: For privacy, numbers on the report are rounded.
1996 Federal Census
Mother Tongue

SteinhauerEthnicity A Community ProfileEthnicity
Source: Federal Census, Statistics Canada
Page 52 of 103
Source: Federal Census, Statistics Canada
Multiple Responses 85 3.4
35Ukrainian 1.4
10Tagalog (Pilipino) 0.4
5Spanish 0.2
0South Slave 0.0
15Punjabi 0.6
0Portuguese 0.0
20Polish 0.8
155Other languages 6.2
10Italian 0.4
0Inuktitut (Eskimo) 0.0
0Greek 0.0
90German 3.6
5Dutch 0.2
0Cree 0.0
0Chipewyan 0.0
175Chinese 7.0
0Athapaskan languages 0.0
10Arabic 0.4
530 21.1
Non-Official
20French 0.8
1,880English 74.8
1,900 75.5
Official
Single Responses
Mother Tongue No. %
2,515Grand Total 100.0
Note: For privacy, numbers on the report are rounded.
1991 Federal Census
Mother Tongue

SteinhauerEthnicity A Community ProfileEthnicity
Source: Federal Census, Statistics Canada
Page 53 of 103
Source: Federal Census, Statistics Canada
Multiple Responses 95 3.9
5Vietnamese 0.2
35Ukrainian 1.4
5Tagalog (Pilipino) 0.2
5Spanish 0.2
10Punjabi 0.4
5Portuguese 0.2
15Polish 0.6
105Other languages 4.3
5Italian 0.2
10Hungarian 0.4
5Greek 0.2
100German 4.1
5Dutch 0.2
5Cree 0.2
110Chinese 4.5
5Arabic 0.2
430 17.7
Non-Official
25French 1.0
1,880English 77.4
1,905 78.4
Official
Single Responses
Mother Tongue No. %
2,430Grand Total 100.0
Note: For privacy, numbers on the report are rounded.
1986 Federal Census
Mother Tongue

SteinhauerHousing A Community ProfileHousing
Source: Federal Census, Statistics Canada
Page 54 of 103
Source: Federal Census, Statistics Canada
356 or more persons 4.4
2104-5 persons 26.4
1903 persons 23.9
2802 persons 35.2
801 person 10.1
795Total 100.0
Average Number of Persons in Private Household 2.9
Note: For privacy, numbers on the report are rounded.
Household Size No. %
Households by Size2001 Federal Census

SteinhauerHousing A Community ProfileHousing
Source: Federal Census, Statistics Canada
Page 55 of 103
Source: Federal Census, Statistics Canada
306 or more persons 3.9
2654-5 persons 34.6
1553 persons 20.3
2252 persons 29.4
901 person 11.8
765Total 100.0
Average Number of Persons in Private Household 3.0
Note: For privacy, numbers on the report are rounded.
Household Size No. %
Households by Size1996 Federal Census

SteinhauerHousing A Community ProfileHousing
Source: Federal Census, Statistics Canada
Page 56 of 103
Source: Federal Census, Statistics Canada
456 or more persons 5.8
2904-5 persons 37.4
1653 persons 21.3
1952 persons 25.2
801 person 10.3
775Total 100.0
Average Number of Persons in Private Household 3.2
Note: For privacy, numbers on the report are rounded.
Household Size No. %
Households by Size1991 Federal Census

SteinhauerHousing A Community ProfileHousing
Source: Federal Census, Statistics Canada
Page 57 of 103
Source: Federal Census, Statistics Canada
356 or more persons 5.0
3204-5 persons 45.4
1753 persons 24.8
1352 persons 19.1
401 person 5.7
705Total 100.0
Average Number of Persons in Private Household 3.4
Note: For privacy, numbers on the report are rounded.
Household Size No. %
Households by Size1986 Federal Census

SteinhauerHousing A Community ProfileHousing
Source: Federal Census, Statistics Canada
Page 58 of 103
Source: Federal Census, Statistics Canada
01996-2001 0.0
01991-1995 0.0
301986-1990 3.8
351981-1985 4.5
6901971-1980 87.9
301961-1970 3.8
01946-1960 0.0
0Before 1946 0.0
785Total 100.0
Note: For privacy, numbers on the report are rounded.
2001 Federal Census
Period of Construction No. %
Occupied Private Dwellings
Period of Construction

SteinhauerHousing A Community ProfileHousing
Source: Federal Census, Statistics Canada
Page 59 of 103
Source: Federal Census, Statistics Canada
01991-1996 0.0
801981-1990 10.6
6601971-1980 87.4
151961-1970 2.0
01946-1960 0.0
0Before 1946 0.0
755Total 100.0
Note: For privacy, numbers on the report are rounded.
1996 Federal Census
Period of Construction No. %
Occupied Private Dwellings
Period of Construction

SteinhauerHousing A Community ProfileHousing
Source: Federal Census, Statistics Canada
Page 60 of 103
Source: Federal Census, Statistics Canada
201986-1990 2.6
751981-1985 9.6
6751971-1980 86.5
101961-1970 1.3
01946-1960 0.0
0Before 1946 0.0
780Total 100.0
Note: For privacy, numbers on the report are rounded.
1991 Federal Census
Period of Construction No. %
Occupied Private Dwellings
Period of Construction

SteinhauerHousing A Community ProfileHousing
Source: Federal Census, Statistics Canada
Page 61 of 103
Source: Federal Census, Statistics Canada
201981-1985 2.9
6801971-1980 97.1
01961-1970 0.0
01946-1960 0.0
0Before 1946 0.0
700Total 100.0
Note: For privacy, numbers on the report are rounded.
1986 Federal Census
Period of Construction No. %
Occupied Private Dwellings
Period of Construction

SteinhauerHousing A Community ProfileHousing
Source: Municipal Census
Page 62 of 103
Source: Municipal Census
57024546Single-detached house
20461143Row house
000Rooming house/collective residence
000Other residential
000Manufactured home/mobile home
000Hotel or motel
202Duplex/triplex/fourplex
000Apartment with less than 5 stories
000Apartment with 5 or more stories
77685691Total
Structure Type Owned Rented Total
Dwelling Unit by Structure Type and Ownership2005 Municipal Census

SteinhauerHousing A Community ProfileHousing
Source: Municipal Census
Page 63 of 103
Source: Municipal Census
575Single-detached house 73.3
207Row house 26.4
0Rooming house/collective residence 0.0
0Other residential 0.0
0Manufactured home/mobile home 0.0
0Hotel or motel 0.0
2Duplex/triplex/fourplex 0.3
0Apartment with less than 5 stories 0.0
0Apartment with 5 or more stories 0.0
784Total 100.0
2005 Municipal Census
Structure Type No. %
Structure Type

SteinhauerHousing A Community ProfileHousing
Source: Federal Census, Statistics Canada
Page 64 of 103
Source: Federal Census, Statistics Canada
560Single-detached house 70.9
0Semi-detached house 0.0
230Row house 29.1
0Other single-attached house 0.0
0Movable dwelling 0.0
0Apartment, detached duplex 0.0
0Apartment, building that has five or more storeys 0.0
0Apartment, building that has fewer than five storeys 0.0
790Total 100.0
2001 Federal Census
Structure Type No. %
Occupied Private Dwellings
Structure Type

SteinhauerHousing A Community ProfileHousing
Source: Municipal Census
Page 65 of 103
Source: Municipal Census
569Single-detached house 73.0
209Row house 26.8
0Rooming house/collective residence 0.0
0Other residential 0.0
0Manufactured/mobile home 0.0
0Hotel or motel 0.0
0Duplex/triplex/fourplex 0.0
0Apartment with 5 or more stories 0.0
1Apartment less than 5 stories 0.1
779Total 100.0
1999 Municipal Census
Structure Type No. %
Occupied Private Dwellings
Structure Type

SteinhauerHousing A Community ProfileHousing
Source: Federal Census, Statistics Canada
Page 66 of 103
Source: Federal Census, Statistics Canada
555Single-detached house 73.0
0Semi-detached house 0.0
205Row house 27.0
0Other single-attached house 0.0
0Movable dwelling 0.0
0Apartment, detached duplex 0.0
0Apartment, building that has five or more storeys 0.0
0Apartment, building that has fewer than five storeys 0.0
760Total 100.0
Note: For privacy, numbers on the report are rounded.
1996 Federal Census
Structure Type No. %
Occupied Private Dwellings
Structure Type

SteinhauerHousing A Community ProfileHousing
Source: Federal Census, Statistics Canada
Page 67 of 103
Source: Federal Census, Statistics Canada
560Single-detached house 71.8
0Semi-detached house 0.0
215Row house 27.6
0Other single-attached house 0.0
0Movable dwelling 0.0
0Apartment, detached duplex 0.0
0Apartment, building that has five or more storeys 0.0
5Apartment, building that has fewer than five storeys 0.6
780Total 100.0
Note: For privacy, numbers on the report are rounded.
1991 Federal Census
Structure Type No. %
Occupied Private Dwellings
Structure Type

SteinhauerHousing A Community ProfileHousing
Source: Federal Census, Statistics Canada
Page 68 of 103
Source: Federal Census, Statistics Canada
75Rented 9.5
715Owned 90.5
Note: For privacy, numbers on the report are rounded.
790Total 100.0
Tenure2001 Federal Census
Tenure No. %
Occupied Private Dwellings

SteinhauerHousing A Community ProfileHousing
Source: Municipal Census
Page 69 of 103
Source: Municipal Census
98Rented 12.6
678Owned 87.4
776Total 100.0
Tenure1999 Municipal Census
Tenure No. %
Occupied Private Dwellings

SteinhauerHousing A Community ProfileHousing
Source: Federal Census, Statistics Canada
Page 70 of 103
Source: Federal Census, Statistics Canada
120Rented 15.8
640Owned 84.2
Note: For privacy, numbers on the report are rounded.
760Total 100.0
Tenure1996 Federal Census
Tenure No. %
Occupied Private Dwellings

SteinhauerHousing A Community ProfileHousing
Source: Federal Census, Statistics Canada
Page 71 of 103
Source: Federal Census, Statistics Canada
90Rented 11.6
685Owned 88.4
Note: For privacy, numbers on the report are rounded.
775Total 100.0
Tenure1991 Federal Census
Tenure No. %
Occupied Private Dwellings

SteinhauerHousing A Community ProfileHousing
Source: Federal Census, Statistics Canada
Page 72 of 103
Source: Federal Census, Statistics Canada
90Rented 12.9
605Owned 87.1
Note: For privacy, numbers on the report are rounded.
695Total 100.0
Tenure1986 Federal Census
Tenure No. %
Occupied Private Dwellings

SteinhauerIncome A Community ProfileIncome
Source: Federal Census, Statistics Canada
Page 73 of 103
Source: Federal Census, Statistics Canada
160$100,000 and over 20.4
35$ 90,000 - $99,999 4.5
85$ 80,000 - $89,999 10.8
90$ 60,000 - $69,999 11.5
90$ 50,000 - $59,999 11.5
75$ 40,000 - $49,999 9.6
95$ 30,000 - $39,999 12.1
25$ 20,000 - $29,999 3.2
30$ 10,000 - $19,999 3.8
10Under $10,000 1.3
$74,778Average Household Income:
785Total 100.0
Note: For privacy, numbers on the report are rounded.
In 2000 Dollars
Income Range ($) No. %
2001 Federal Census
Income by Households

SteinhauerIncome A Community ProfileIncome
Source: Federal Census, Statistics Canada
Page 74 of 103
Source: Federal Census, Statistics Canada
90$100,000 and over 11.8
35$ 90,000 - $99,999 4.6
105$ 80,000 - $89,999 13.8
115$ 60,000 - $69,999 15.1
95$ 50,000 - $59,999 12.5
110$ 40,000 - $49,999 14.5
55$ 30,000 - $39,999 7.2
55$ 20,000 - $29,999 7.2
30$ 10,000 - $19,999 3.9
30Under $10,000 3.9
$69,669Average Household Income:
760Total 100.0
Note: For privacy, numbers on the report are rounded.
in 1995 Dollars
Income Range ($) No. %
1996 Federal Census
Income by Households
SteinhauerIncome A Community ProfileIncome
Source: Federal Census, Statistics Canada
Page 75 of 103
Source: Federal Census, Statistics Canada
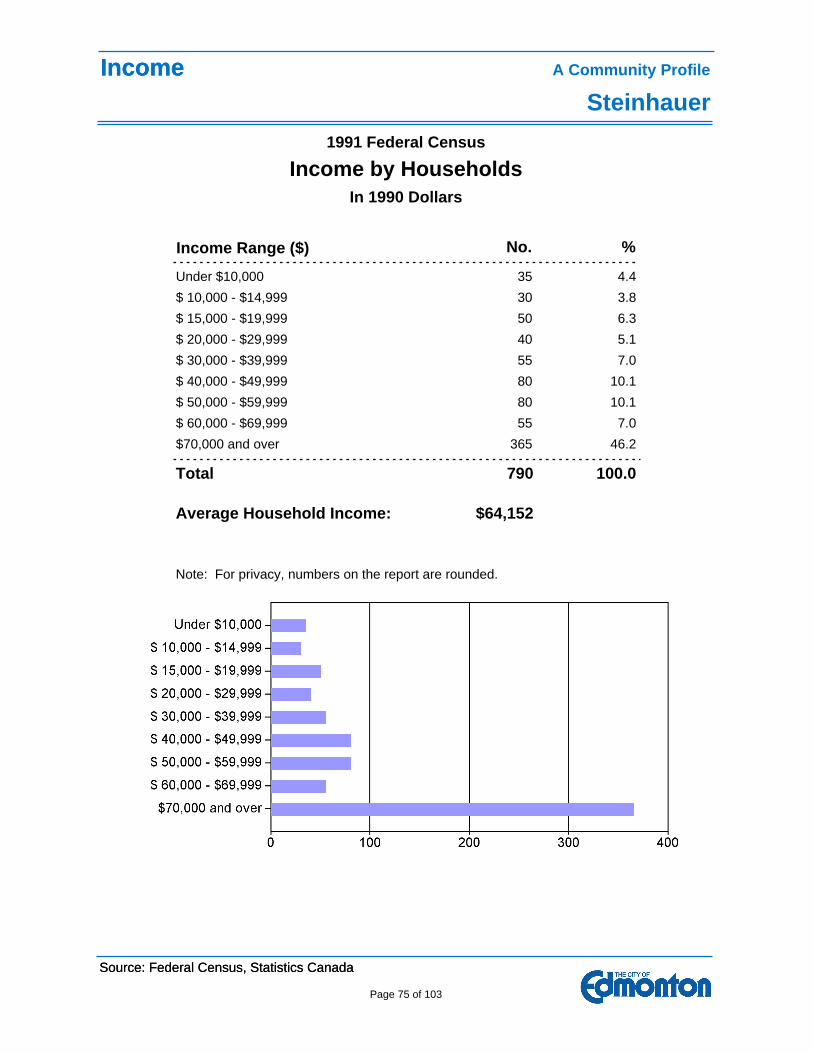
365$70,000 and over 46.2
55$ 60,000 - $69,999 7.0
80$ 50,000 - $59,999 10.1
80$ 40,000 - $49,999 10.1
55$ 30,000 - $39,999 7.0
40$ 20,000 - $29,999 5.1
50$ 15,000 - $19,999 6.3
30$ 10,000 - $14,999 3.8
35Under $10,000 4.4
$64,152Average Household Income:
790Total 100.0
Note: For privacy, numbers on the report are rounded.
In 1990 Dollars
Income Range ($) No. %
1991 Federal Census
Income by Households

SteinhauerIncome A Community ProfileIncome
Source: Federal Census, Statistics Canada
Page 76 of 103
Source: Federal Census, Statistics Canada
355$50,000 and over 51.4
115$40,000 - $49,999 16.7
45$35,000 - $39,999 6.5
50$30,000 - $34,999 7.2
45$25,000 - $29,999 6.5
30$20,000 - $24,999 4.3
15$15,000 - $19,999 2.2
35$10,000 - $14,999 5.1
0$5,000 - $9,999 0.0
0Under $5,000 0.0
$54,896Average Household Income:
690Total 100.0
Note: For privacy, numbers on the report are rounded.
In 1985 Dollars
Income Range ($) No. %
1986 Federal Census
Income by Households
SteinhauerLabour Force A Community ProfileLabour Force
Source: Federal Census, Statistics Canada
Page 77 of 103
Source: Federal Census, Statistics Canada
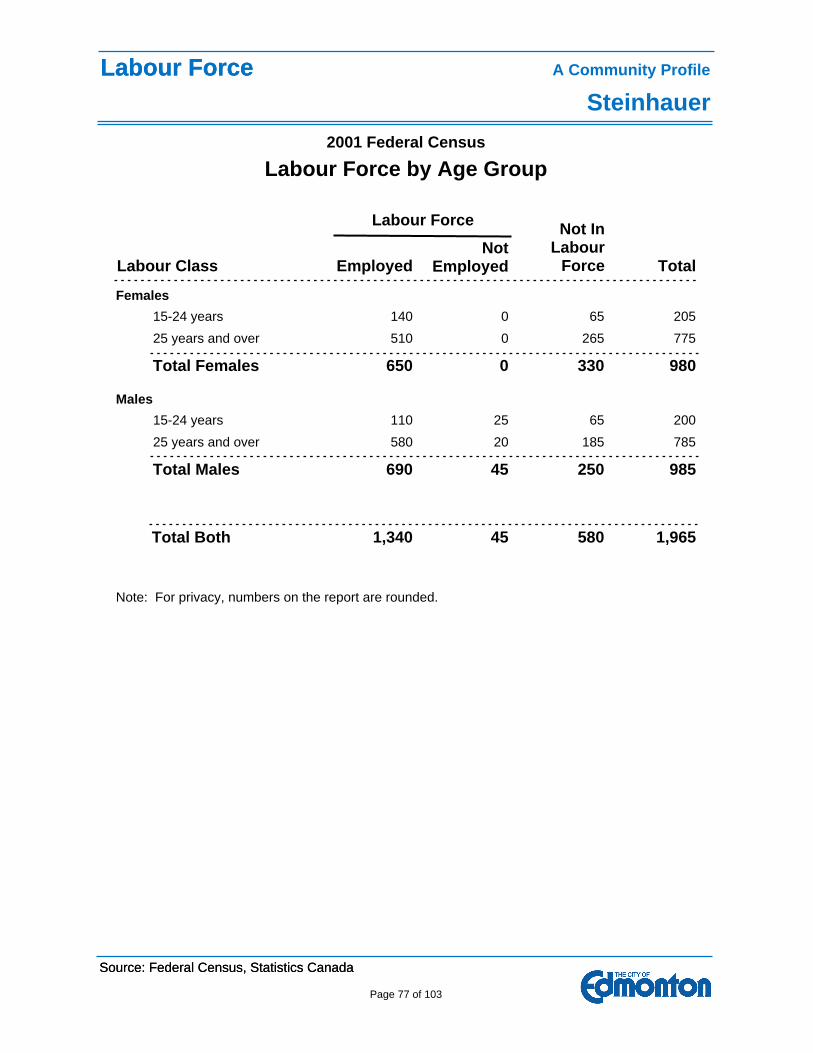
7852058025 years and over 185
2002511015-24 years 65
690 45 250 985Total Males
Males
775051025 years and over 265
205014015-24 years 65
650 0 330 980Total Females
Females
1,340 45 580 1,965Total Both
Note: For privacy, numbers on the report are rounded.
2001 Federal Census
Labour Class EmployedNot
Employed Total
Not In Labour
Force
Labour Force
Labour Force by Age Group
SteinhauerLabour Force A Community ProfileLabour Force
Source: Federal Census, Statistics Canada
Page 78 of 103
Source: Federal Census, Statistics Canada
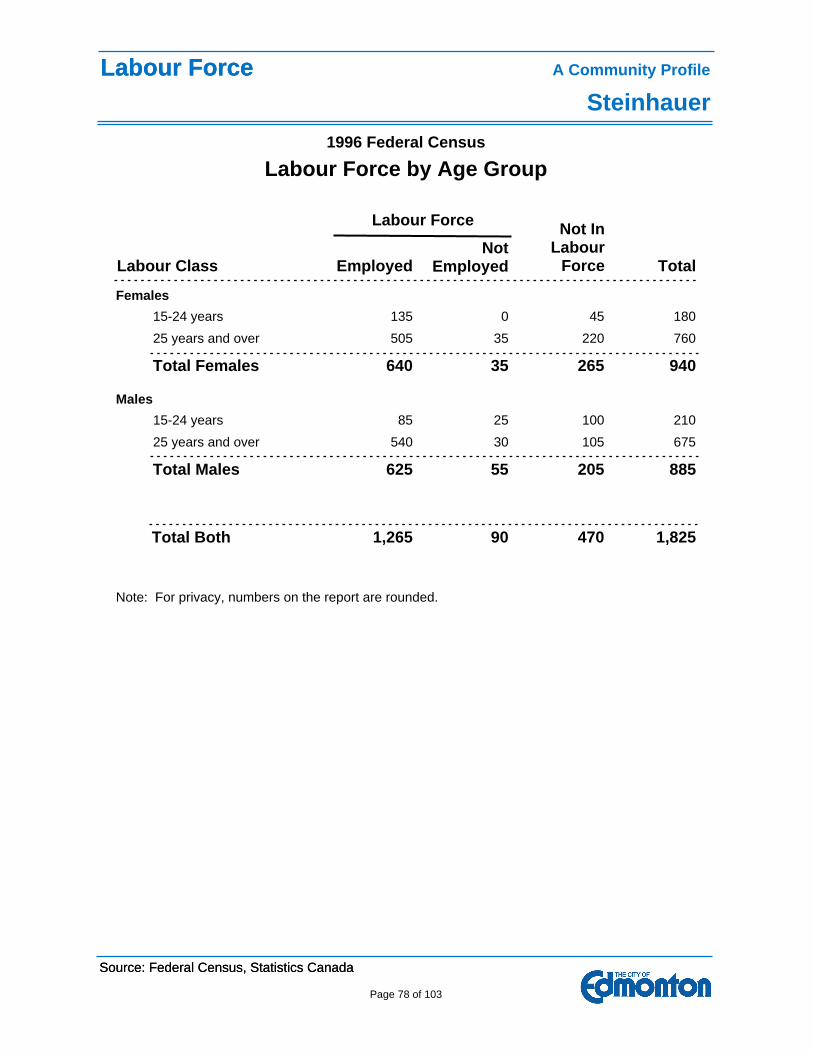
6753054025 years and over 105
210258515-24 years 100
625 55 205 885Total Males
Males
7603550525 years and over 220
180013515-24 years 45
640 35 265 940Total Females
Females
1,265 90 470 1,825Total Both
Note: For privacy, numbers on the report are rounded.
1996 Federal Census
Labour Class EmployedNot
Employed Total
Not In Labour
Force
Labour Force
Labour Force by Age Group

SteinhauerLabour Force A Community ProfileLabour Force
Source: Federal Census, Statistics Canada
Page 79 of 103
Source: Federal Census, Statistics Canada
6903058525 years and over 75
2201515015-24 years 55
735 45 130 910Total Males
Males
7952555525 years and over 215
1703510015-24 years 35
655 60 250 965Total Females
Females
1,390 105 380 1,875Total Both
Note: For privacy, numbers on the report are rounded.
1991 Federal Census
Labour Class EmployedNot
Employed Total
Not In Labour
Force
Labour Force
Labour Force by Age Group

SteinhauerLabour Force A Community ProfileLabour Force
Source: Federal Census, Statistics Canada
Page 80 of 103
Source: Federal Census, Statistics Canada
8804573515 years and over 100
735 45 100 880Total Males
Males
9153064015 years and over 245
640 30 245 915Total Females
Females
1,375 75 345 1,795Total Both
Note: For privacy, numbers on the report are rounded.
1986 Federal Census
Labour Class EmployedNot
Employed Total
Not In Labour
Force
Labour Force
Labour Force by Age Group

SteinhauerLabour Force A Community ProfileLabour Force
Source: Federal Census, Statistics Canada
Page 81 of 103
Source: Federal Census, Statistics Canada
35Wholesale trade 2.6
20Utilities 1.5
20Transportation and warehousing 1.5
215Retail trade 15.8
20Real estate and rental and leasing 1.5
125Public administration 9.2
135Professional, scientific and technical services 9.9
45Other services (except public administration) 3.3
50Mining and oil and gas extraction 3.7
100Manufacturing 7.3
0Management of companies and enterprises 0.0
45Information and cultural industries 3.3
155Healthcare and social assistance 11.4
60Finance and insurance 4.4
90Educational services 6.6
55Construction 4.0
35Arts, entertainment and recreation 2.6
0Agriculture, forestry, fishing and hunting 0.0
45Administrative and support, and waste management services 3.3
115Accommodation and food services 8.4
1,365Total 100.0
Note: Based on North American Industrial Classification System (NAIC). Note: For privacy, numbers on the report are rounded.
2001 Federal Census
Industry No. %
15 Years and Over
Labour Force by Industry
SteinhauerLabour Force A Community ProfileLabour Force
Source: Federal Census, Statistics Canada
Page 82 of 103
Source: Federal Census, Statistics Canada
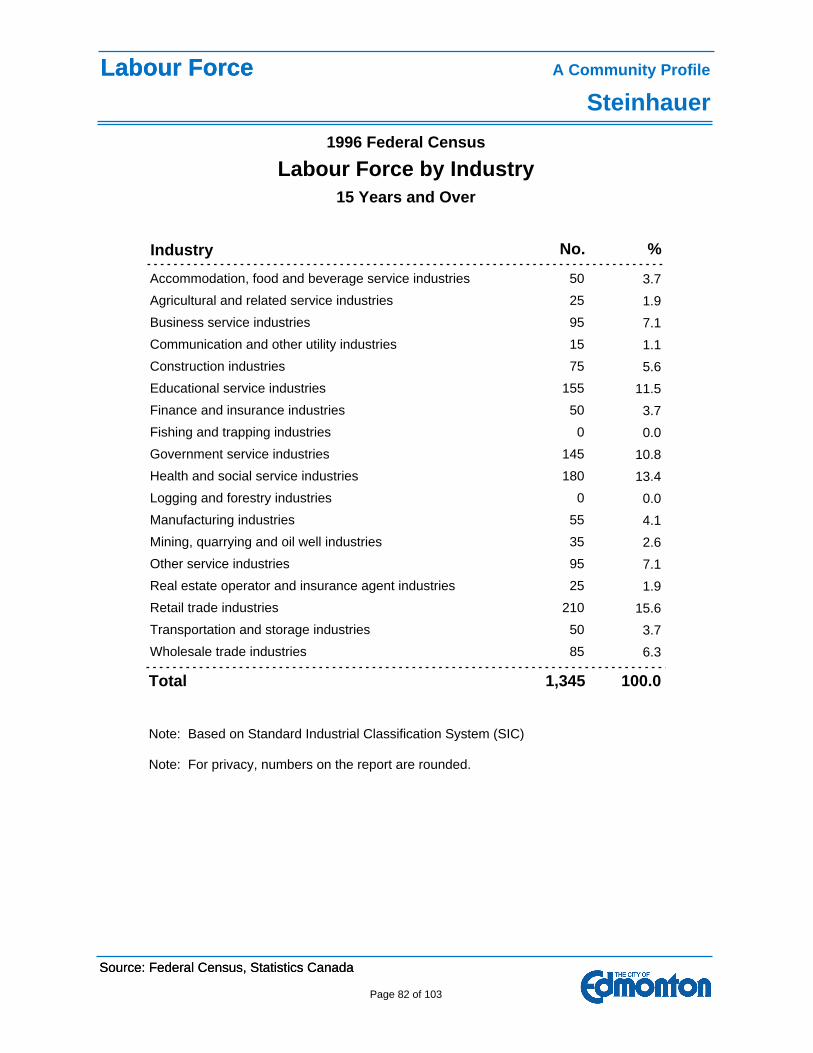
85Wholesale trade industries 6.3
50Transportation and storage industries 3.7
210Retail trade industries 15.6
25Real estate operator and insurance agent industries 1.9
95Other service industries 7.1
35Mining, quarrying and oil well industries 2.6
55Manufacturing industries 4.1
0Logging and forestry industries 0.0
180Health and social service industries 13.4
145Government service industries 10.8
0Fishing and trapping industries 0.0
50Finance and insurance industries 3.7
155Educational service industries 11.5
75Construction industries 5.6
15Communication and other utility industries 1.1
95Business service industries 7.1
25Agricultural and related service industries 1.9
50Accommodation, food and beverage service industries 3.7
1,345Total 100.0
Note: Based on Standard Industrial Classification System (SIC) Note: For privacy, numbers on the report are rounded.
1996 Federal Census
Industry No. %
15 Years and Over
Labour Force by Industry

SteinhauerLabour Force A Community ProfileLabour Force
Source: Federal Census, Statistics Canada
Page 83 of 103
Source: Federal Census, Statistics Canada
55Wholesale trade industries 3.7
50Transportation and storage industries 3.4
175Retail trade industries 11.9
20Real estate operator and insurance agent industries 1.4
95Other service industries 6.4
0Mining (incl. milling), quarrying and oil well industries 0.0
140Manufacturing industries 9.5
0Logging and forestry industries 0.0
150Health and social service industries 10.2
205Government service industries 13.9
0Fishing and trapping industries 0.0
80Finance and insurance industries 5.4
220Educational service industries 14.9
70Construction industries 4.7
35Communication and other utility industries 2.4
70Business service industries 4.7
15Agricultural and related service industries 1.0
95Accommodation, food and beverage service industries 6.4
1,475Total 100.0
Note: Based on Standard Industrial Classification System (SIC) Note: For privacy, numbers on the report are rounded.
1991 Federal Census
Industry No. %
15 Years and Over
Labour Force by Industry

SteinhauerLabour Force A Community ProfileLabour Force
Source: Federal Census, Statistics Canada
Page 84 of 103
Source: Federal Census, Statistics Canada
30Wholesale trade 2.1
40Transportation and warehousing 2.8
240Retail trade 16.7
55Real estate and related 3.8
115Other services 8.0
35Mining and oil and gas extraction 2.4
65Manufacturing 4.5
0Logging and forestry industry 0.0
150Healthcare and social assistance 10.4
160Government services 11.1
60Finance and insurance 4.2
140Educational services 9.7
145Construction 10.1
55Communication and utilities 3.8
105Business services 7.3
0Agriculture 0.0
45Accommodation and food services 3.1
1,440Total 100.0
Note: Based on Standard Industrial Classification System (SIC). Note: For privacy, numbers on the report are rounded.
1986 Federal Census
Industry No. %
15 Years and Over
Labour Force by Industry

SteinhauerLabour Force A Community ProfileLabour Force
Source: Federal Census, Statistics Canada
Page 85 of 103
Source: Federal Census, Statistics Canada
0Other method 00
10Taxicab 100
0Motorcycle 00
0Bicycle 1010
20Walked 3515
85Public transit 10015
40Car, Truck, Van (as passenger) 6525
475Car, Truck, Van (as driver) 1,025550
615Total 1,245630
Note: For privacy, numbers on the report are rounded.
2001 Federal Census
Mode of Transport Female TotalMale
15 Years and Over
Labour Force by Mode of Transport

SteinhauerLabour Force A Community ProfileLabour Force
Source: Federal Census, Statistics Canada
Page 86 of 103
Source: Federal Census, Statistics Canada
0Other method 00
0Taxicab 00
0Motorcycle 00
10Bicycle 2010
15Walked 2510
85Public transit 11530
45Car, Truck, Van (as passenger) 6520
430Car, Truck, Van (as driver) 940510
580Total 1,165585
Note: For privacy, numbers on the report are rounded.
1996 Federal Census
Mode of Transport Female TotalMale
15 Years and Over
Labour Force by Mode of Transport

SteinhauerLabour Force A Community ProfileLabour Force
Source: Municipal Census
Page 87 of 103
Source: Municipal Census
5Unknown 0.5 0 0.0
7Other 0.7 17 1.5
63Preschool 5.9 67 5.9
104Kind - Gr.6 9.7 99 8.8
37Gr.7 - Gr.9 3.5 51 4.5
53Gr.10 - Gr.12 4.9 41 3.6
61Post Sec. Student 5.7 83 7.4
7Perm. unable to work 0.7 3 0.3
126Retired 11.8 132 11.7
23Unemployed 2.1 19 1.7
3Homemaker 0.3 103 9.1
32Employed 0 - 30 hrs 3.0 110 9.8
551Employed 30+ hrs 51.4 402 35.7
1,072Total 100.0 1,127 100.0
Note: Group Count is included in the table as Unknown. Group Count means total numbers of individuals residing in a multiple resident facility (such as a group home, transient drop-in centre, residential hotel, or a criminal detention centre) where the personal information that can be conveyed about those individuals by the facility administration is limited by legislation or the facilities regulations.
2005 Municipal Census
Age Group
Females
No. %
Males
No. %
Occupation

SteinhauerLabour Force A Community ProfileLabour Force
Source: Municipal Census
Page 88 of 103
Source: Municipal Census
6Group Count 0.5 0 0.0
2Other 0.2 1 0.1
82Preschool 7.3 57 5.0
95Kind - Gr.6 8.5 109 9.5
54Gr.7 - Gr.9 4.8 70 6.1
62Gr.10 - Gr.12 5.5 73 6.4
100Post Sec. Student 8.9 67 5.9
4Perm. unable to work 0.4 4 0.3
98Retired 8.7 100 8.7
27Unemployed 2.4 14 1.2
6Homemaker 0.5 135 11.8
36Employed 0 - 30 hrs 3.2 140 12.2
552Employed 30+ hrs 49.1 373 32.6
1,124Total 100.0 1,143 100.0
Note: Group Count means total numbers of individuals residing in a multiple resident facility (such as a group home, transient drop-in centre, residential hotel, or a criminal detention centre) where the personal information that can be conveyed about those individuals by the facility administration is limited by legislation or the facilities regulations.
1999 Municipal Census
Age Group
Females
No. %
Males
No. %
Occupation

SteinhauerLabour Force A Community ProfileLabour Force
Source: Federal Census, Statistics Canada
Page 89 of 103
Source: Federal Census, Statistics Canada
10010Occupation - Not applicable
351520Processing, manufacturing and utilities
25025Primary industry
90090Trades, transport and equipment operators and related occupations
330185145Sales and service occupations
652540Art, culture, recreation and sport
955045Social science, education, government service and religion
1059015Health occupations
20555150Natural and applied sciences and related occupations
25517580Business, finance and administration occupations
16060100Management occupations
1,375655720Total
Note: Based on 2001 National Occupational Classification System. Note: For privacy, numbers on the report are rounded.
2001 Federal Census
Occupation Male Female Total
15 Years and Over
Occupation by Gender

SteinhauerLabour Force A Community ProfileLabour Force
Source: Federal Census, Statistics Canada
Page 90 of 103
Source: Federal Census, Statistics Canada
10010Occupation - Not applicable
201010Occupations unique to processing, manufacturing and utilities
301515Occupations unique to primary industry
80080Trades, transport and equipment operators and related occupations
315185130Sales and service occupations
402020Occupations in art, culture, recreation and sport
1558075Occupations in social science, education, government service and religion
1209030Health occupations
1004060Natural and applied sciences and related occupations
310205105Business, finance and administrative occupations
18045135Management occupations
1,360690670Total
Note: Based on 1991 Standard Occupational Classification System Note: For privacy, numbers on the report are rounded.
1996 Federal Census
Occupation Male Female Total
15 Years and Over
Occupation by Gender

SteinhauerLabour Force A Community ProfileLabour Force
Source: Federal Census, Statistics Canada
Page 91 of 103
Source: Federal Census, Statistics Canada
10010Transport equipment operating occupations
1458065Teaching and related occupations
25025Product fabricating, assembling & repairing occupations
000Other crafts and equipment operating occupations
30030Occupations not elsewhere classified
20020Processing occupations
302010Occupations in social sciences and related fields
10010Occupations in religion
1051590Occupations in natural sciences, engineering and math
1259035Occupations in medicine and health
1809090Service occupations
000Mining & quarrying, oil & gas field occupations
18511075Sales occupations
10010Material handling and related occupations
25575180Managerial, administrative and related occupations
301020Machining and related occupations
000Forestry and logging occupations
000Fishing, trapping and related occupations
10010Farming, horticultural and animal husbandry occupations
35035Construction trades occupations
24519550Clerical and related occupations
452025Artistic, literary, recreational and related occupations
1,495705790Total
Note: Based on 1980 Standard Occupational Classification System. Note: For privacy, numbers on the report are rounded.
1991 Federal Census
Occupation Male Female Total
15 Years and Over
Occupation by Gender

SteinhauerLabour Force A Community ProfileLabour Force
Source: Federal Census, Statistics Canada
Page 92 of 103
Source: Federal Census, Statistics Canada
000Other occupations
10010Other crafts and equipment
10010Material handling and related
15015Transport
1050105Construction trades
45045Product fabrication and assembly
15015Machining and related
10010Processing occupations
000Mining, quarrying, oil and gas
000Forestry and logging
000Farming, horticulture and animal husbandry
1456580Service occupations
1506090Sales occupations
37532055Clerical and related
25025Artistic, literary and recreation
1007525Medicine and health
703535Teaching and related
000Religion
604515Social science
951580Natural science, engineering and math
20040160Managerial and administration
1,430655775Total
Note: Based on 1980 Standard Occupational Classification System. Note: For privacy, numbers on the report are rounded.
1986 Federal Census
Occupation Male Female Total
15 Years and Over
Occupation by Gender
SteinhauerMobility A Community ProfileMobility
Source: Municipal Census
Page 93 of 103
Source: Municipal Census
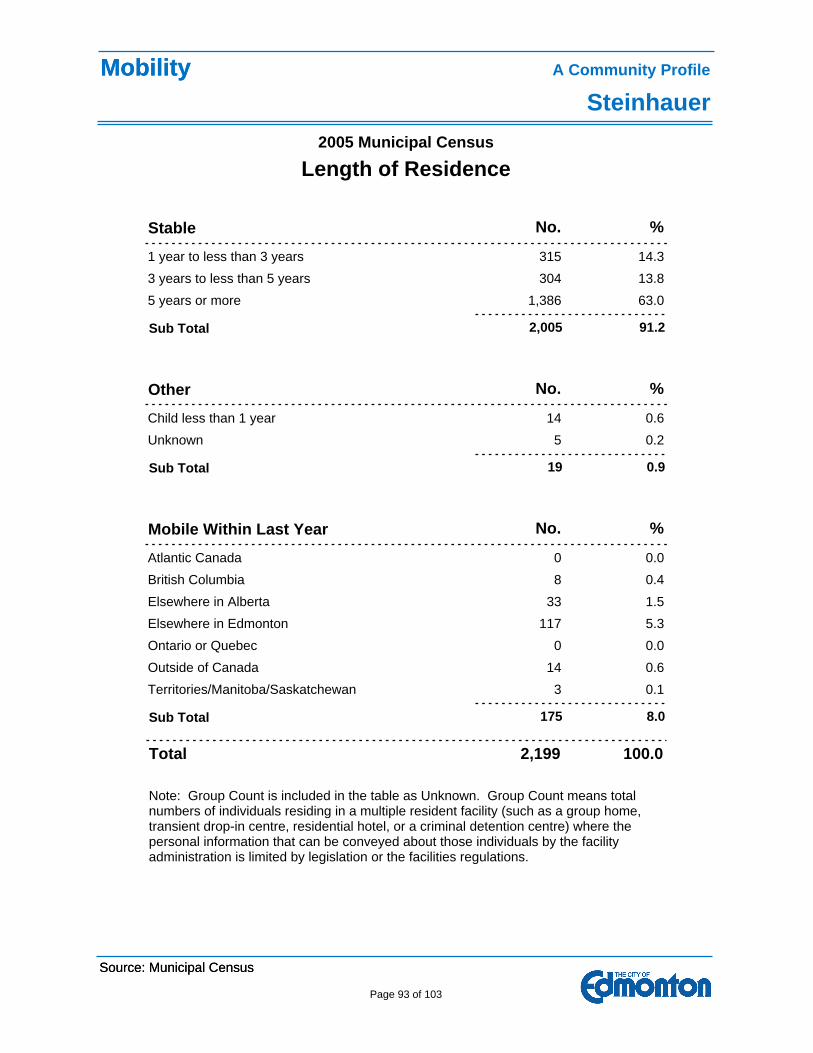
0.13Territories/Manitoba/Saskatchewan
0.614Outside of Canada
0.00Ontario or Quebec
5.3117Elsewhere in Edmonton
1.533Elsewhere in Alberta
0.48British Columbia
0.00Atlantic Canada
175 8.0Sub Total
%No.Mobile Within Last Year
0.25Unknown
0.614Child less than 1 year
19 0.9Sub Total
%No.Other
63.01,3865 years or more
13.83043 years to less than 5 years
14.33151 year to less than 3 years
2,005 91.2Sub Total
%No.Stable
Total 2,199 100.0
Note: Group Count is included in the table as Unknown. Group Count means total numbers of individuals residing in a multiple resident facility (such as a group home, transient drop-in centre, residential hotel, or a criminal detention centre) where the personal information that can be conveyed about those individuals by the facility administration is limited by legislation or the facilities regulations.
Length of Residence2005 Municipal Census

SteinhauerMobility A Community ProfileMobility
Source: Municipal Census
Page 94 of 103
Source: Municipal Census
0.36Territories/Manitoba/Saskatchewan
0.01Outside of Canada
0.37Ontario or Quebec
7.0158Elsewhere in Edmonton
1.124Elsewhere in Alberta
0.717British Columbia
0.48Atlantic Canada
221 9.7Sub Total
%No.Mobile Within Last Year
0.36Group Count
0.715Child less than 1 year
21 0.9Sub Total
%No.Other
63.71,4455 years or more
10.52373 years to less than 5 years
15.13431 year to less than 3 years
2,025 89.3Sub Total
%No.Stable
Total 2,267 100.0
Note: Group Count means total numbers of individuals residing in a multiple resident facility (such as a group home, transient drop-in centre, residential hotel, or a criminal detention centre) where the personal information that can be conveyed about those individuals by the facility administration is limited by legislation or the facilities regulations.
Length of Residence1999 Municipal Census

SteinhauerCrime A Community ProfileCrime
Source: Edmonton Police Service
Page 95 of 103
Source: Edmonton Police Service
95702005 83 5
93802004 79 6
2311402003 200 17
1601102002 146 3
1511702001 126 8
1242302000 90 11
1231901999 96 8
Violent Crime: Crimes of violence involve offences that deal with the application or threat of application of force to a person. They include homicide, attempted murder, sexual assault, non-sexual assault, other sexual offences, abduction and robbery. Traffic incidents that result in death or bodily harm are included under Criminal Code Traffic Offences.
Property Crime: Property crime involves unlawful acts with the intent of gaining property. It includes actual and attempted break and enter, actual and attempted motor vehicle theft, ‘other’ theft (i.e. theft from vehicle, shoplifting, theft of bicycle, and other thefts), possession of stolen property, and fraud.
Criminal Code Traffic: Includes dangerous driving, impaired driving, refuse breath or blood sample, and failure to remain at the scene of an accident.
Crime Stoppers TIPS Line: 1-800-222-TIPS (8477) or
Website: www.police.edmonton.ab.ca
The categorization of crime is based on the definition of crime provided by Statistics Canada in their Uniform Crime Reports (UCR).
Other Criminal Code Offences: Includes Criminal Code offences that are not classified as violent, property or traffic offences. Examples are mischief offences, administration of justice offences (e.g. failure to comply with a summons or an appearance notice, bail violations, failure to appear in court) and offensive weapons offences.
www.tipsubmit.com
Due to variable reporting procedures, counterfeiting currency offences have been excluded for all years reported.
Edmonton Police Service
Year Violent Other CC TotalPropertyCC
Traffic
Type of Crime by Year

SteinhauerEducation A Community ProfileEducation
Source: Federal Census, Statistics Canada
Page 96 of 103
Source: Federal Census, Statistics Canada
625University with bachelor's degree or higher 35.4
150University without degree 8.5
250College with certificate or diploma 14.2
120College without certificate or diploma 6.8
145Trades certificate or diploma 8.2
210Grades 9 to 13 with high school graduation certificate 11.9
195Grades 9 to 13 without high school graduation certificate 11.0
70Less than grade 9 4.0
1,765Total 100.0
Note: For privacy, numbers on the report are rounded.
2001 Federal Census
Highest Education No. %
20 Years and Over
Highest Level of Education

SteinhauerEducation A Community ProfileEducation
Source: Federal Census, Statistics Canada
Page 97 of 103
Source: Federal Census, Statistics Canada
550University with bachelor's degree or higher 29.9
305University without degree 16.6
305Non-University with certificate or diploma 16.6
50Non-University without certificate or diploma 2.7
35Trades certificate or diploma 1.9
225Grades 9 to 13 with high school graduation certificate 12.2
340Grades 9 to 13 without high school graduation certificate 18.5
30Less than grade 9 1.6
1,840Total 100.0
Note: For privacy, numbers on the report are rounded.
1996 Federal Census
Highest Education No. %
15 Years and Over
Highest Level of Education

SteinhauerEducation A Community ProfileEducation
Source: Federal Census, Statistics Canada
Page 98 of 103
Source: Federal Census, Statistics Canada
520University with bachelor's degree or higher 27.6
325University without degree 17.2
240College with certificate or diploma 12.7
40College without certificate or diploma 2.1
90Trades certificate or diploma 4.8
255Grades 9 to 13 with high school graduation certificate 13.5
330Grades 9 to 13 without high school graduation certificate 17.5
85Less than grade 9 4.5
1,885Total 100.0
Note: For privacy, numbers on the report are rounded.
1991 Federal Census
Highest Education No. %
15 Years and Over
Highest Level of Education

SteinhauerEducation A Community ProfileEducation
Source: Federal Census, Statistics Canada
Page 99 of 103
Source: Federal Census, Statistics Canada
375University with bachelor's degree or higher 20.8
230University without degree 12.8
370College with certificate or diploma 20.6
130College without certificate or diploma 7.2
35Trades certificate or diploma 1.9
215Grades 9 to 13 with high school graduation certificate 11.9
380Grades 9 to 13 without high school graduation certificate 21.1
65Less than grade 9 3.6
1,800Total 100.0
Note: For privacy, numbers on the report are rounded.
1986 Federal Census
Highest Education No. %
15 Years and Over
Highest Level of Education

SteinhauerEducation A Community ProfileEducation
Source: Municipal Census
Page 100 of 103
Source: Municipal Census
373Public 80.6
14Private 3.0
0Charter 0.0
69Catholic 14.9
7At home 1.5
463Total 100.0
1999 Municipal Census
Type of School No. %
Students (K-12) by Type of School

SteinhauerEducation A Community ProfileEducation
Source: Municipal Census
Page 101 of 103
Source: Municipal Census
1,783Edmonton Public School District Resident
416Edmonton Catholic School District Resident
2,199Total
Note: Group Count is included in the table. Group Count means total numbers of individuals residing in a multiple resident facility (such as a group home, transient drop-in centre, residential hotel, or a criminal detention centre) where the personal information that can be conveyed about those individuals by the facility administration is limited by legislation or the facilities regulations.
2005 Municipal Census
School District No.
School District Residency

SteinhauerEducation A Community ProfileEducation
Source: Municipal Census
Page 102 of 103
Source: Municipal Census
6Group Count
1,862Edmonton Public School District Resident
399Edmonton Catholic School District Resident
2,267Total
Note: Group Count means total numbers of individuals residing in a multiple resident facility (such as a group home, transient drop-in centre, residential hotel, or a criminal detention centre) where the personal information that can be conveyed about those individuals by the facility administration is limited by legislation or the facilities regulations.
1999 Municipal Census
School District No.
School District Residency
SteinhauerEducation A Community ProfileEducation
Source: Edmonton Public Schools
Page 103 of 103
Source: Edmonton Public Schools
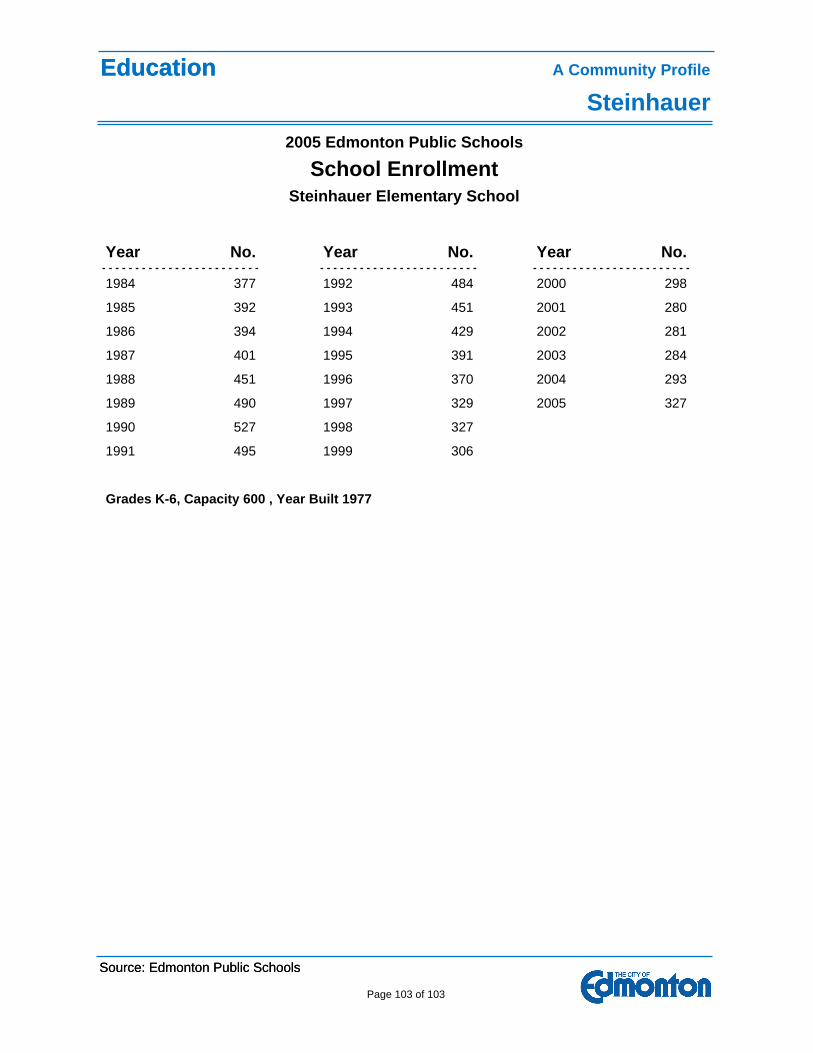
4951991 3061999
5271990 3271998
4901989 3291997 3272005
4511988 3701996 2932004
4011987 3911995 2842003
3941986 4291994 2812002
3921985 4511993 2802001
3771984 4841992 2982000
Grades K-6, Capacity 600 , Year Built 1977
Steinhauer Elementary School
Year No. Year No. Year No.
2005 Edmonton Public Schools
School Enrollment