Embed Size (px)
Citation preview

Sensors 2010, 10, 11498-11511; doi:10.3390/s101211498
sensors ISSN 1424-8220
www.mdpi.com/journal/sensors
Article
A Combined Experimental and Theoretical Study on the
Immunoassay of Human Immunoglobulin Using a Quartz
Crystal Microbalance
Po-Jen Liao, Jeng-Shian Chang *, Sheng D. Chao *, Hung-Chi Chang, Kuan-Rong Huang,
Kuang-Chong Wu and Tzong-Shyan Wung
Institute of Applied Mechanics, National Taiwan University, Taipei 106, Taiwan;
E-Mails: [email protected] (K.R.H.); [email protected] (K.C.W.);
[email protected] (T.S.W)
* Authors to whom correspondence should be addressed; E-Mails: [email protected] (J.S.C.);
[email protected] (S.D.C.); Tel.: +886-2-3366-5066; Fax: +886-2-2363-9290.
Received: 3 November 2010; in revised form: 29 November 2010 / Accepted: 6 December 2010 /
Published: 15 December 2010
Abstract: We investigate a immunoassay biosensor that employs a Quartz Crystal
Microbalance (QCM) to detect the specific binding reaction of the (Human
IgG1)-(Anti-Human IgG1) protein pair under physiological conditions. In addition to
experiments, a three dimensional time domain finite element method (FEM) was used to
perform simulations for the biomolecular binding reaction in microfluidic channels. In
particular, we discuss the unsteady convective diffusion in the transportation tube, which
conveys the buffer solution containing the analyte molecules into the micro-channel where
the QCM sensor lies. It is found that the distribution of the analyte concentration in the
tube is strongly affected by the flow field, yielding large discrepancies between the
simulations and experimental results. Our analysis shows that the conventional assumption
of the analyte concentration in the inlet of the micro-channel being uniform and constant in
time is inadequate. In addition, we also show that the commonly used procedure in kinetic
analysis for estimating binding rate constants from the experimental data would
underestimate these rate constants due to neglected diffusion processes from the inlet to the
reaction surface. A calibration procedure is proposed to supplement the basic kinetic
analysis, thus yielding better consistency with experiments.
OPEN ACCESS

Sensors 2010, 10
11499
Keywords: biosensor; Quartz Crystal Microbalance; Finite Element Method (FEM); basic
kinetic analysis; human IgG1
1. Introduction
Efficient, accurate, and real-time monitoring of chronic diseases becomes more and more important
for an aging society. Biosensors provide a quick and convenient technology for real-time surveillance
in health-care. Biosensors use a receptor molecule (the ligand) fixed on the substrate as the
bio-recognition layer. When the specific target molecules (the analyte) carried by the buffer solution
flow over the reaction surface of a biosensor, a specific binding reaction occurs between the analyte
molecules and the immobilized ligand molecules. A variety of physical mechanisms have been used in
the transducer to record the specific binding and the subsequent real-time examination takes place by
amplifying these signals [1]. With its superior characteristics of timely reaction and high sensitivity,
the Quartz Crystal Microbalance (QCM) has recently become a commonly used biosensor. The QCM
uses the indirect piezoelectric effect as a way of energy transformation to timely record the resonance
frequency shifts with a tiny mass loading. In 1959, Sauerbrey [2] derived an equation (called Sauerbrey
equation) to relate the change of the resonance frequency shift to the change of loaded mass on the
crystal surface; namely, ∆𝑓 = −2𝑓0∆𝑀/A 𝜇𝑄𝜌𝑄, where ∆f is the frequency shift, ∆M is the change
of the load mass, f0 is the oscillating frequency of the quartz without loaded mass, μQ is the elastic
modulus of the quartz, ρQ is the density of the quartz and A is the area of the electrode. Initially, QCM
was applied as a gas-sensing device [3]; nowadays, it is widely used in research on bioimmune
tests [4,5].
In this study, we use a Quartz Crystal Microbalance for detecting and tracking the specific binding
reaction between Human IgG1 and Anti-Human IgG1. The mass change due to the formation of the
(Human IgG1)-(Anti-Human IgG1) complex was recorded as the frequency shift versus time, which
reflects the time evolution of the analyte concentration, the observable of most concern in a clinical
diagnosis. Following the conventional procedure, a direct kinetic analysis based on the experimental
data can be employed to estimate the binding rate constants, which are then used in the follow-up
numerical studies of the binding reaction. We performed three dimensional finite element simulations
of the binding reaction and compared our simulation results with the experimental data. Surprisingly,
large discrepancies were found between the predicted and the experimental results. We indentified two
major issues in the conventional analysis that could cause such inaccurate predictions. The first is the
assumption of uniform and time-independent profile of the analyte concentration at the inlet of the
micro-channel and the second is the inaccurate estimation of the binding rate constants.
In the experiments, we used a transportation tube conveying the analyte solution to the
micro-channel. The cross-sectional concentration profile of the analyte at the end of the transportation
tube, which is also the inlet to the micro-channel, is usually assumed to be uniform and
time-independent in the simulations. However, when the transportation tube is long, the deviation of
the analyte concentration profile from uniformity across the tube section and time-independence is
large [6-8]. In this work, we will show that the effect of such non-uniformity and time-dependence of
Sensors 2010, 10
11500
the analyte concentration profile is important for analyzing the binding behavior and should be taken
into account during the simulation.
Binding rate constants are usually estimated directly from a basic kinetic analysis of the
experimental data under the assumption [9] that the concentration of the analyte near the surface of the
biosensor is the same as that in the bulk of the fluid. This assumption in fact leads only to an “apparent”
binding rate constant which may significantly differ from the “true” one because the diffusion
processes from the inlet to the reaction surface cannot be neglected in a real situation. This can be
cross-checked by an inverse calculation of the “apparent” binding rate constants from the simulated
binding reaction curves, where the “true” rate constants are assumed to be known a priori. We show
that the “apparent” rate constants underestimate the “true” ones. Therefore, an effective calibration
procedure is proposed to amend the estimation of binding rate constants. The calibrated binding rate
constants are then deemed to be the “true” binding rate constants and used to do further numerical
simulations. Using this procedure, numerical predictions self-consistent with the experimental data are
then found.
This paper is organized as follows. In Section 2 we describe the detailed experimental procedures
and the results. The governing equations used in the simulations are presented in Section 3. The
detailed theoretical analysis is presented in Section 4. We compare and discuss the experimental and
theoretical results in Section 5 and a brief summary is provided in Section 6.
2. Experiment
2.1. Materials and Methods
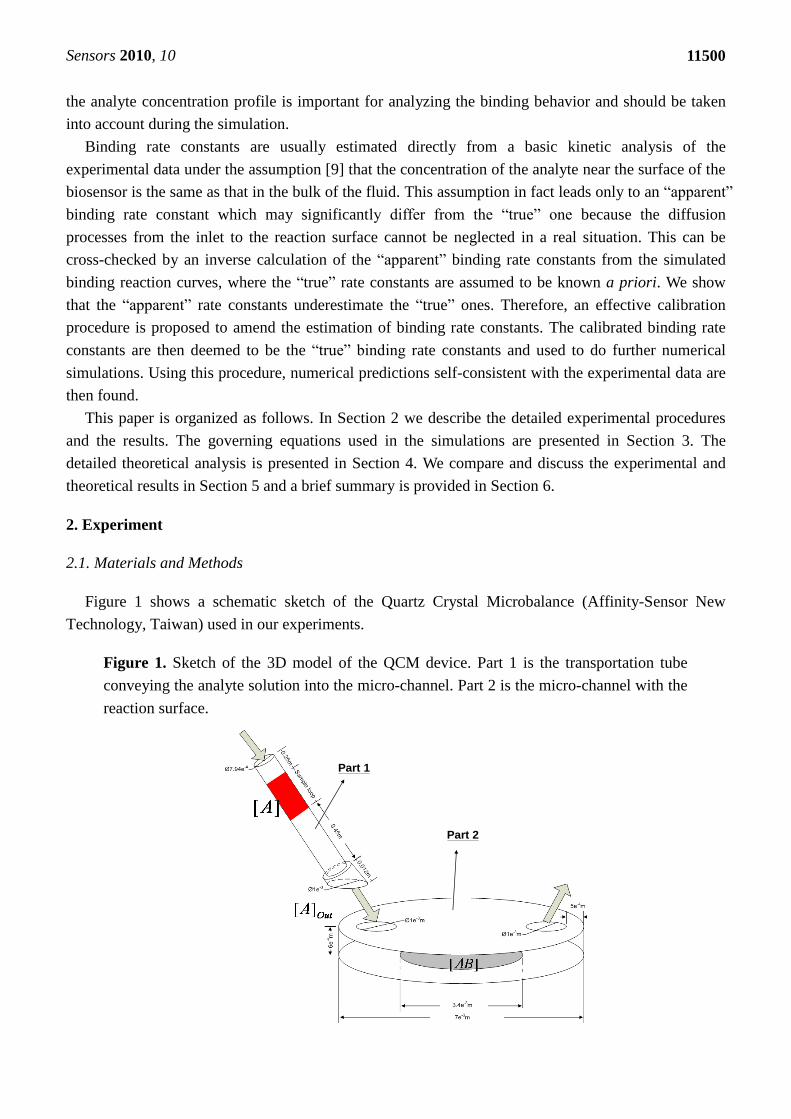
Figure 1 shows a schematic sketch of the Quartz Crystal Microbalance (Affinity-Sensor New
Technology, Taiwan) used in our experiments.
Figure 1. Sketch of the 3D model of the QCM device. Part 1 is the transportation tube
conveying the analyte solution into the micro-channel. Part 2 is the micro-channel with the
reaction surface.
Part 1
Part 2
Part 1
Part 2
Sensors 2010, 10
11501
This QCM system consists of a flow-injection system and a QCM chip. The QCM chip is a 9-MHz
quartz crystal placed as a sandwich between two gold electrodes and driven by an oscillator circuit to
produce the oscillating frequency. The upper gold electrode is also used as the reaction surface. The
flow-injection system uses a peristaltic pump to supply the QCM with a steady and continuous amount
of phosphate-buffered saline (PBS, pH 7.2, 22 °C) at a flow rate of 50 μL/min. The designated
supplement of the analyte solution is continuously injected and stored in the sample loop, and placed
between the buffer solutions via the injection valve, as shown in Figure 1. Then, the analyte solution
can follow with the running buffer solution into the micro-channel where the QCM chip sits on the
bottom side.
2.2. Experiment Procedure
In these immunoassay experiments, we used the QCM to monitor the real-time specific binding
reaction of the immobilized ligand Human IgG1 (I5154, Sigma) and the Anti-Human IgG1 (I2513,
Sigma) analyte. We considered three groups according to the total volume of Anti-Human IgG1
solution supplied during the individual experiments: 800, 500 and 100 μL, respectively. Each group
also included four concentrations of Anti-Human IgG1 solution: 50, 25, 10 and 5 μg/mL. Before the
experiment started, a self-assembled monolayer (SAM) of the linker molecules was formed on the
QCM chip by immersing their upper gold electrode surface in 16-mercaptohexadecanoic acid
(MHDA). The covalent bonded linkers served to efficiently immobilize the ligand bio-molecules on
the reaction surface. There were four steps in the experiment process. First, a 2.5% glutaraldehyde
solution in PBS was added into the QCM to activate the linker on the reaction surface. Following the
activation a running PBS solution is used to rinse away the excess glutaraldehyde. The second step is
to inject the ligand solution (Human IgG1 50 μg/mL in PBS) into the QCM to bind covalently with the
linkers to form the immobilized layer on the reaction surface. Again the excess immobilization ligands
were rinsed away with a running PBS solution. The third step is to add a glycine solution (1 M in PBS)
to block the unbound linkers to prevent the occurrence of non-specific binding. After the blocking, the
running PBS solution again rinses away the excess glycine. In the last step, the designated supplement
(800, 500 or 100 μL) of Anti-Human IgG1 solution of various concentrations (50, 25, 10 or 5 μg/mL)
was added into the QCM to react specifically with the immobilized Human IgG1.
2.3. Experimental Results
Figure 2 shows a typical result of the frequency shift versus time in a QCM experiment. Notice that
for convenience and better visibility, we present only the magnitude of the frequency shift (drop) in the
rest figures of this paper. Figures 3(A-C) present all of our experimental results of the binding curves
for the Human IgG-Anti-Human IgG protein pair for the total volumes of Anti-Human IgG1 solution
supplied during the individual experiments (800, 500 and 100 μL, respectively). Each subfigure in
Figure 3 contains four curves corresponding to the four different concentrations of the Anti-Human
IgG1 solution: 50, 25, 10 and 5 μg/mL, respectively. Comparing the curves presented in Figure 3, it is
observed that the behavior of binding reaction depends not only on the concentration of the
Anti-Human IgG1 solution but also on the amount of Anti-Human IgG1 solution supplied.

Sensors 2010, 10
11502
Figure 2. A typical result of the QCM experiment. There are four steps in the experimental
process, as described in the text.
Figure 3. The (Human IgG1)-(Anti-Human IgG1) protein pair binding curves. The
supplemented volume of the Anti-Human IgG1 solution is: (A) 800 μL, (B) 500 μL and
(C) 100 μL. For each case there are four concentrations of Anti-Human IgG1 solution (50,
25, 10 and 5 μg/mL). The error bar at each time point is marked according to 4~5 replicates
of the experimental raw data; namely picking the largest positive (negative) deviation value
as our upper (lower) bound to the average value.
(A) (B)
(C)
Glutaraldehyde(Activator)
Human IgG1
(Ligand)
Anti-Human IgG1
(Analyte)Glycine
(Block)
Glutaraldehyde(Activator)
Human IgG1
(Ligand)
Anti-Human IgG1
(Analyte)Glycine
(Block)
(A)(A) (B)(B)
(C)(C)

Sensors 2010, 10
11503
3. Simulation
In this work the 3D simulation on the immunoassay in the QCM device is performed using the
finite element analysis software, COMSOL Multiphysics [10], to simulate the experiments done in the
above section for the (Human IgG1)-(Anti-Human IgG1) binding interactions. The equations
governing the flow field, the concentration field and the biochemical reaction are described in this
section. Detailed geometry, flow properties, binding constants and other conditions that are required
for simulation are described in Section 4.
3.1. The Flow Field
In this work it is assumed that the fluid is incompressible so that:
𝜕𝑢
𝜕𝑥+
𝜕𝑣
𝜕𝑦+
𝜕𝑤
𝜕𝑧= 0 (1)
where u, v and w are the x, y and z velocity components, respectively. The equations of motion are:
𝜌𝜕𝑢
𝜕𝑡+ 𝜌 𝑢
𝜕𝑢
𝜕𝑥+ 𝑣
𝜕𝑢
𝜕𝑦+ 𝑤
𝜕𝑢
𝜕𝑧 − 𝜂𝛻2𝑢 +
𝜕𝑝
𝜕𝑥= 0
𝜌𝜕𝑣
𝜕𝑡+ 𝜌 𝑢
𝜕𝑣
𝜕𝑥+ 𝑣
𝜕𝑣
𝜕𝑦+ 𝑤
𝜕𝑣
𝜕𝑧 − 𝜂𝛻2𝑣 +
𝜕𝑝
𝜕𝑦= 0 (2)
𝜌𝜕𝑤
𝜕𝑡+ 𝜌 𝑢
𝜕𝑤
𝜕𝑥+ 𝑣
𝜕𝑤
𝜕𝑦+ 𝑤
𝜕𝑤
𝜕𝑧 − 𝜂𝛻2𝑤 +
𝜕𝑝
𝜕𝑧= 0
where η is the dynamic viscosity of the fluid and p is the pressure. In this work it is assumed that the
density ρ and η viscosity of the modeled incompressible fluid are constant independent of temperature
and concentration.
3.2. The Concentration Field
Transport of the analyte to and from the reaction surface is assumed to be described by Fick’s
second law with convective terms:
∂[𝐴]
∂𝑡+ 𝑢
∂[𝐴]
∂𝑥+ 𝑣
𝜕[𝐴]
𝜕𝑦+ 𝑤
𝜕[𝐴]
𝜕𝑧= 𝐷(
𝜕2 𝐴
𝜕𝑥2 +𝜕2 𝐴
𝜕𝑦2 +𝜕2 𝐴
𝜕𝑧2 ) (3)
where [A] is the concentration of the analyte and D is the diffusion coefficient of the analyte.
3.3. The Reaction Surface
The reaction between immobilized ligand and analyte is assumed to follow the first order Langmuir
adsorption model [11,12]. During the reaction, the reaction complex [AB] increases as a function of
time according to the reaction rate:
∂[𝐴𝐵]
∂𝑡= 𝑘𝑎 𝐴 𝑠𝑢𝑟𝑓𝑎𝑐𝑒 𝐵0 − 𝐴𝐵 − 𝑘𝑑 [𝐴𝐵] (4)
where [A]surface is the concentration of the analyte at the reaction surface by mass-transport, [B0] is the
surface concentration of the ligand on the reaction surface, and [AB] is the surface concentration of the
reaction complex.

Sensors 2010, 10
11504
4. Simulation Detail and Kinetic Analysis
As shown in Figure 1, our QCM device consists of a Part 1 and a Part 2. Part 1 is the tube loop for
storing and transporting the sample solutions into the micro-channel. The lengths of the sample loop
are 1.62, 1.10 and 0.20 m, corresponding to 800, 500 and 100 μL analyte supplements, respectively.
Part 2 is the micro-channel where the QCM sensor is placed. The reaction surface is located at the
bottom of the micro-channel. The dimensions of the 3D model are depicted in Figure 1. The analyte
solution together with the buffer solution flows through the tube and passes through the left inlet to the
right outlet of the micro-channel. The flow field in the tube is a fully developed laminar flow. The
concentration profile of the analyte at the tube outlet (that is, inlet of the micro-channel) is strongly
affected by the flow field in the tube. It is shown below that this concentration profile at the tube outlet
is in fact not uniform and time-independent. This will in turn affect significantly the behavior of the
binding reaction occurred on the QCM. Therefore, we shall first discuss the distribution of the analyte
concentration at the tube outlet in Part 1, and then use the results obtained in Part 1 to simulate the
reaction curves of the ligand and analyte in Part 2.
4.1. The Flow Field
The value of dynamic viscosity η is set as that of water, 6.96 × 10⁻³
Pa·s. Since the flows in the tube
and micro-channel are in low Reynolds number condition, it is assumed that the flow is laminar. The
average velocity of the parabolic profile is set to u = 1.68× 10⁻³
m/s in the tube according to the
experiment condition. The pressure at the micro-channel outlet is p = 0.
4.2. The Concentration Field
The diffusion coefficient of Anti-Human IgG1 is 5 × 10⁻¹¹
m2/s [13]. The initial concentrations of
the analyte in the tube are chosen as [A] = 3.125 × 10⁻⁴
mol/m3 (50 μg/mL), 1.5625 × 10
−4 mol/m
3
(25 μg/mL), 6.25 × 10⁻⁴
mol/m3 (10 μg/mL) and 3.125 × 10
−5 mol/m
3 (5 μg/mL). The initial surface
concentrations [B0] are assumed as 7.8 × 10⁻⁸
mol/m2 in the model of 800 μL, 5.6 × 10
−8 mol/m
2 in the
model of 500 μL and 5.2 × 10⁻⁸
mol/m2 in the model of 100 μL from the experimental results. Since
[B0] is not a constant in our experiments, the following normalized equation is used to represent the
reaction between ligand and analyte:
1
[𝐵𝑜 ]
∂[𝐴𝐵]
∂𝑡= ka A surface 1 −
𝐴𝐵
𝐵0 − 𝑘𝑑
[𝐴𝐵]
[𝐵0] (5)
4.3. Kinetics of the Specific Binding
The specific recognition of the analytes and immobilized ligands occurs on the reaction surface.
The reaction kinetics can be described as a two-step process [14].
Mass-transport process: the analyte is transported by diffusion from the bulk solution toward the
reaction surface:
[𝐴]𝑏𝑢𝑙𝑘 ⇆ [𝐴]𝑠𝑢𝑟𝑓𝑎𝑐𝑒 (6)
Chemical reaction process: the binding of the protein pair takes place:

Sensors 2010, 10
11505
a
surface
d
kA B AB
k
(7)
where [A]bluk, [A]surface, [B] and [AB] are the concentrations of the analyte in the bulk, the analyte at the
reaction surface, the ligand on the reaction surface, and the analyte-ligand complex on the reaction
surface, respectively. ka and kd are the association and dissociation rate constants, respectively.
Conventionally, the association rate constant ka and dissociation rate constant kd of the specific
protein pairs can be estimated from the experimental data by a basic kinetic analysis [9]. In this basic
kinetic analysis, the mass-transport process is assumed so fast that the surface concentration [A]surface is
the same as the bulk concentration[A]bluk, which is true for QCM working in an air environment.
However, such an assumption is not valid in a solution environment since the diffusion of
biomolecules, especially for the large molecules like Anti-Human IgG1, is slow in liquids. In addition,
the flow speed in the micro-channel is usually also low, which limits the convective transport of the
analyte. Therefore, the conventional analysis actually yields the “apparent” association and
dissociation rate constants k' a and k
' d, but not the “true” ones. To remedy this deficiency in the basic
kinetic analysis, in the following we propose a modified method, which calibrates the calculation of
the conventional kinetic analysis, to recover the “true” reaction rate constants.
4.3.1. Basic Kinetic Analysis and Calculation of Reaction Rate Constants
The “apparent” reaction rate constants k' a and k
' d are estimated by the method of Karlsson [14]
under the assumption [A]surface ≈ [A]bluk, Equation (4) can then be rewritten as:
∂[𝐴𝐵]
∂𝑡= 𝑘𝑎[𝐴]𝑠𝑢𝑟𝑓𝑎𝑐𝑒 [𝐵0 − [𝐴𝐵]] − 𝑘𝑑 [𝐴𝐵] ≈ 𝑘𝑎
′ 𝐴 𝑏𝑢𝑙𝑘 [ 𝐵0 − [𝐴𝐵]] − 𝑘𝑑′ [𝐴𝐵] (8)
In general, the response R is equal to α[AB], where α is a proportional constant. When analyte
solution is of very high concentration, all the binding sites of the ligand are occupied and the
maximum response Rmax is equal to α[B0]. Thus, Equation (8) can be rewritten as:
∂𝑅
∂𝑡= 𝑘𝑎
′ 𝐶𝑅𝑚𝑎𝑥 − (𝑘𝑎′ 𝐶 + 𝑘𝑑
′ )𝑅 (9)
where the constant C is the concentration of the analyte in the bulk, that is [A]bluk. There are usually
two methods to retrieve the rate constants.
Method 1:
According to the Equation (9), we can draw a plot of ∂𝑅/𝜕𝑡 versus R and the plot will have a slope
−ks equal to –(k' aC + k
' d). Therefore, by calculating ∂𝑅/𝜕𝑡 from the experimental data of R versus
time t, we can plot the curve of ∂𝑅/𝜕𝑡 versus R, whose slope is −ks for a given analyte concentration
C. Then, the plot of −ks versus C can be drawn to obtain the slope k' a and the intercept k
' d.
Method 2:
We also can solve R from Equation (9) to yield:
𝑅 =𝑘𝑎′ 𝐶𝑅𝑚𝑎𝑥
𝑘𝑎′ 𝐶+𝑘𝑑
′ (1 − 𝑒−(𝑘𝑎′ 𝐶+𝑘𝑑
′ )𝑡) (10)
Then, we can obtain the apparent reaction rate constants k' a and k
' d by curve fitting. Table 1 shows

Sensors 2010, 10
11506
the estimated rate constants using the above two methods. We see that method 1 and method 2 yield
similar k' a and k
' d values.
Table 1. Reaction rate constants of the (Human IgG1)-(Anti-Human IgG1) binding
reaction in the PBS solution by the basic kinetic analysis for three supplements of
Anti-Human IgG1 solution: (A) 800 μL, (B) 500 μL, and (C) 100 μL. Here K' D = k
' d/k
' a.
(A) k' a (M
−1 s
−1) k
' d (s
−1) K
' D (M)
Method 1 1.27 × 10⁴ 1.60 × 10
−3 1.26 × 10
−7
Method 2 1.20 × 10⁴ 1.60 × 10
−3 1.33 × 10
−7
(B) k' a (M
−1 s
−1) k
' d (s
−1) K
' D (M)
Method 1 1.58 × 10⁴ 2.80 × 10
−3 1.77 × 10
−7
Method 2 1.69 × 10⁴ 2.90 × 10
−3 1.72 × 10
−7
(C) k' a (M
−1 s
−1) k
' d (s
−1) K
' D (M)
Method 1 1.89 × 10⁴ 4.01 × 10
−3 2.12 × 10
−7
Method 2 1.93 × 10⁴ 4.06 × 10
−3 2.10 × 10
−7
Next, we use the apparent k' a and k
' d to perform a three dimensional finite element simulation. The
simulation results are presented in Figure 4. By comparing to the experimental data shown in Figure 3,
large errors are observed due to the inaccurate estimation of the binding rate constants.
Figure 4. Simulated binding reaction curves. The supplement volume of the Anti-Human
IgG1 solution is (A) 800 μL (B) 500 μL and (C) 100 μL.
(A) (B)
(C)

Sensors 2010, 10
11507
Therefore, we propose below a modified method to calibrate the calculation of the reaction rate
constants in the conventional kinetic analysis. The calibrated rate constants will be used in the further
3D simulation to verify their correctness.
4.3.2. Modified Kinetic Analysis
When the reaction reaches saturation, the time variation of the concentration of the analyte-ligand
complex vanishes and [A]surface = [A]bluk Equation (8) can then be written as:
𝐵0 = 𝐴𝐵 𝑠𝑎𝑡 1 +𝑘𝑑/𝑘𝑎
𝐴 𝑏𝑢𝑙𝑘 ≈ [𝐴𝐵]
𝑠𝑎𝑡 if [𝐴]𝑏𝑢𝑙𝑘 ≫𝑘𝑑
𝑘𝑎 (11)
In the equation above, if we pick the concentration of the analyte solution to be high (designated
[A]bluk = [Ã]bluk) that [Ã]bluk ≫𝑘𝑑
𝑘𝑎, then Equation (11) yields:
𝐵0 = 𝐴𝐵 𝑠𝑎𝑡
when [𝐴 ]𝑏𝑢𝑙𝑘 ≫𝑘𝑑
𝑘𝑎 (12)
where 𝐴𝐵 𝑠𝑎𝑡
is the corresponding saturated concentration of the reaction complex when the
concentration of the analyte is very high such that [A]bluk ≫𝑘𝑑
𝑘𝑎. Then from Equations (11) and (12),
the equilibrium association constant KD can be computed as:
𝐾𝐷 =𝑘𝑑
𝑘𝑎= 𝐴 𝑏𝑢𝑙𝑘
𝐵0
𝐴𝐵 𝑠𝑎𝑡− 1 = 𝐴 𝑏𝑢𝑙𝑘 (
𝐴𝐵 𝑠𝑎𝑡
𝐴𝐵 𝑠𝑎𝑡− 1) (13)
The experimental results shown in Figure 3(A) are for the case of 800 μL Anti-Human IgG1
solution, in which the reaction curves for the analyte concentrations [A] = 50 μg/mL and 50 μg/mL are
saturated, and these two concentrations are deemed as [Ã]bluk and [A]bluk, respectively. So, we use the
two corresponding maximum frequency shifts to calculate KD:
𝐾𝐷 = 𝐴 𝑏𝑢𝑙𝑘 𝐴𝐵 𝑠𝑎𝑡
𝐴𝐵 𝑠𝑎𝑡− 1 = 1.5625 × 10−7 ×
221
209− 1 = 8.97 × 10⁻⁹ (𝑀) (14)
Then, we perform the 3D simulation of binding reaction for thirty pairs of trial ka and kd, and
compute the apparent association rate constant k' a by the basic kinetic analysis to set up a look-up
Table 2.
Table 2. The k' a table.
ka 2 × 10⁴ 5 × 10
4 8 × 10
4 11 × 10
4 15 × 10
4
kd 0.9 × 10⁻⁴
k' a 4.68 × 10
3 1.28 × 10
4 1.87 × 10
4 2.93 × 10
4 4.76 × 10
4
kd 2 ×10⁻⁴
k' a 4.30 × 10
3 1.17 × 10
4 1.67 × 10
4 2.95 × 10
4 4.14 × 10
4
kd 5 × 10⁻⁴
k' a 4.01 × 10
3 1.14 × 10
4 1.48 × 10
4 2.84 × 10
4 4.39 × 10
4
kd 8 × 10⁻⁴
k' a
4.26 × 10³
9.80 × 10
3
1.38 × 10
4
2.78 × 10
4
4.17 × 10
4
kd 11 × 10
−4
k
' a
4.08 × 10³
9.76 × 10
3
1.41 × 10
4
2.86 × 10
4
3.93 × 10
4
kd 30 × 10
−4
k
' a
3.78 × 10³ 9.61 × 10
3 1.33 × 10
4 2.30 × 10
4 3.39 × 10
4

Sensors 2010, 10
11508
Then we can use this table and the apparent k' a calculated from the experimental data (see Table 1)
by the basic kinetic analysis to access the “true” ka, which is roughly 8 × 10⁴ (M
−1 s
−1). Since the
apparent dissociation rate constant k' d is very small, direct extrapolation from the basic kinetic analysis
would yield large error. Instead, we can compute the “true” kd by kd = ka × kD, which gives
kd = 7.17 × 10⁻⁴
(s−1
). This value is about one fifth of the apparent k' d (see Table 1).
5. Comparative Results
The calibrated ka and kd can be found by the modified kinetic analysis in Section 4. Next, we use the
calibrated ka and kd to simulate the IgG1-Anti-IgG1 binding reaction. First, the analyte concentration
profiles at the tube outlet for 800 μL, 500 μL, and 100 μL analyte solutions, respectively, are shown in
Figure 5 (A-C). On the right panel of Figure 5, denoted as (D), (E), and (F), are shown the
corresponding curves of the binding reaction. Each of the subfigures presents the four curves
corresponding to the four different concentrations of Anti-Human IgG1: 50, 25, 10 and 5 μg/mL,
respectively. It is clearly seen that the analyte concentration profile in the tube is strongly affected by
the laminar flow, and definitely is not uniform and constant. By decreasing the supplement of the
analyte, the concentration of the analyte is apparently decayed when length of the tube is fixed. From
Figures 5(D-F), we can see that the behavior of the reaction curves depends significantly on the
supplement of the analyte. For example, consider the case of high concentration of Anti-Human IgG1
solution, say 50 μg/mL. When the supplement of the Anti-Human IgG1 solution is sufficient, say
800 μL, the reaction time required for saturation of forming Anti-Human IgG1/ Human IgG1 complex
(and is the frequency shift) is 600 s as shown in Figure 5(D), which falls before the maximum
concentration of Anti-Human IgG1 solution, which is about 45 μg/mL (a little less than 50 μg/mL),
reached at the inlet of reaction chamber, say 780 s, as shown in Figure 5(A). Thus, saturation can be
reached and maintained a period of time. In contrast, when the supplement of the Anti-Human IgG1
solution is insufficient, say only 100 μL, Figures 5(C) and 5(F) show that the maximum concentration
of Anti-Human IgG1 solution at the inlet of reaction chamber is only 12 μg/mL (much less 50 μg/mL),
and the maximum frequency shift is 83% of that obtained when we have 800 μL the supplement of
Anti-Human IgG1 solution. In addition, the maximum frequency shift cannot be maintained but starts
to fall immediately. As for the case of low concentration of Anti-Human IgG1 solution, say 5 μg/mL,
Figures 5(D) and 5(F) show that the maximum frequency shift for 100 μL supplement of the
Anti-Human IgG1 solution is only 25% of that for 800 μL supplement of the Anti-Human IgG1
solution.
We compare the normalized reaction curves of experiment and simulation to verify the accuracy of
the simulated model. These results are shown in Figures 6, 7 and 8 for supplements of 800, 500 and
100 μL, respectively (Figures 7 and 8 may be found in the Supplementary material). We see that
overall the simulations reproduce the main features of the experimental curves for a wide range of
analyte concentrations, including the initial slope of frequency, reaction time to saturation, and
maximum frequency shift (reduction), etc.

Sensors 2010, 10
11509
Figure 5. The distribution of the analyte concentration at the outlet of the tube, which is
the inlet of the micro-channel, and the corresponding binding reaction curves.
(A)
(B)
(C)
(D)
(E)
(F)
(A)
(B)
(C)
(D)
(E)
(F)

Sensors 2010, 10
11510
Figure 6. The normalized experimental and simulated binding reaction curves for the
800 μL supplement volume. Here the concentrations of the Anti-Human IgG1 solution are
(A) 50 μg/mL, (B) 25 μg/mL, (C) 10 μg/mL, and (D) 5 μg/mL.
6. Conclusions
In this work, immunoassay experiments on Human IgG1 and the Anti-Human IgG1 were monitored
with a QCM. In addition, we performed 3D finite element analysis to simulate the
(Human IgG1)-(Anti-Human IgG1) binding reactions. We compare the results of the experiments and
the simulations to verify the simulation model. Here we summarize our conclusions:
(1) The analyte concentration distribution in the tube is strongly affected by the unsteady
convective diffusion in the fully developed laminar flow.
(2) The assumption of [A]surface = [A]bulk is not valid because of the effect of the slower mass
transport in a fluid environment than that in the air. The small diffusion coefficients of
Anti-Human IgG1, the high micro-channel height, and the slow flow rate are reasons for the
limitation of mass transport.
(3) The apparent association rate constant k' a and the apparent dissociation rate constant k
' d of
(Human IgG1)-(Anti-Human IgG1) pairs found by the basic kinetic analysis are not the real
(A) (B)
(C) (D)
(A) (B)
(C) (D)
(A) (B)
(C) (D)
(A) (B)
(C) (D)

Sensors 2010, 10
11511
constants of the specific binding reaction because of these above-mentioned reasons, and
needed to be corrected.
(4) We propose a modified method to improve the basic kinetic analysis to obtain the calibrated ka
and kd. Using the calibrated ka and kd to simulate reaction curves, we obtain the simulation
results more consistent with the experiment results than those using the “apparent” k' aand k
' d.
References
1. Collings, A.F.; Caruso, F. Biosensors: Recent advances. Rep. Progr. Phys. 1997, 60, 1397-1445.
2. Sauerbrey, G.Z. Verwendung von Schwingquarzen zur Wagung dunner Schichten undzur
Mikrowagung. Z. Phys. 1959, 155, 206-222.
3. King, W.H. Piezoelectric Sorption Detector. Anal. Chem. 1964, 36, 1735-1739.
4. Thompson, M.; Arthur, C.L.; Dhaliwal, G.K. Liquid-Phase Piezoelectric and Acoustic
Transmission Studies of Interfacial Immunochemistry. Anal. Chem. 1986, 58, 1206-1209.
5. Hengerer, A.; Kosslinger, C.; Decker, J.; Hauck, S.; Queitsch, I.; Wolf, H.; Dubel, S. Determination
of Phage Antibody Affinities to Antigen by a Microbalance Sensor System. Biotechniques 1999,
26, 956-964.
6. Konermann, L. Monitoring Reaction Kinetics in Solution by Continuous-Flow Methods: The
Effects of Convection and Molecular Diffusion under Laminar Flow Conditions. Phys. Chem. A
1999, 103, 7210-7216.
7. Gill, W.N. A Note on the Solution of Transient Dispersion Problems. Proc. Roy. Soc. Lond. Math.
Phys. Sci. 1967, 298, 335-339.
8. Gill, W.N. Exact Analysis of Unsteady Convective Diffusion. Proc. Roy. Soc. Lond. Math. Phys.
Sci. 1970, 316, 341-350.
9. Karlsson, R.; Michaelsson, A.; Mattsson, L. Kinetic analysis of monoclonal antibody-antigen
interactions with a new biosensor based analytical system. J. Immunol. Method. 1991, 145,
229-240.
10. Comsol Multiphysics, Version 3.4a, COMSOL Ltd., Stokhelm, Sweden.
11. Hibbert, D.B.; Gooding, J.J. Kinetics of Irreversible Adsorption with Diffusion: Application to
Biomolecule Immobilization. Langmuir 2002, 18, 1770-1776.
12. Langmuir, I. The adsorption of gases on plane surfaces of glass, mica and platinum. J. Am. Chem.
Soc. 1918, 40, 1361-1403.
13. Leddy, H.A.; Guilak, F. Site-specific molecular diffusion in articular cartilage measured using
fluorescence recovery after photobleaching. Ann. Biomed. Eng. 2003, 31, 753-760.
14. Camillone, N. Diffusion-Limited Thiol Adsorption on the Gold(111) Surface. Langmuir 2004, 20,
1199-1206.
© 2010 by the authors; licensee MDPI, Basel, Switzerland. This article is an open access article
distributed under the terms and conditions of the Creative Commons Attribution license
(http://creativecommons.org/licenses/by/3.0/).