Embed Size (px)
Citation preview
A combined approach toward resolving the phylogeny of Mollusca
by
Kevin Michael Kocot
A dissertation submitted to the Graduate Faculty of Auburn University
in partial fulfillment of the requirements for the Degree of
Doctor of Philosophy
Auburn, Alabama May 4, 2012
Phylogenomics, Mollusca, Aculifera, Panpulmonata, Aplacophora
Copyright 2013 by Kevin M. Kocot
Approved by
Kenneth M. Halanych, Chair, Professor of Biology Scott R. Santos, Associate Professor of Biology
Leslie R. Goertzen, Professor of Biology Jason E. Bond, Professor of Biology
Christiane Todt, Researcher
ii
Abstract
The overarching goal of my Ph.D. dissertation research is to improve understanding of
the phylogeny and evolution of Mollusca. With estimates of up to 200,000 extant species,
Mollusca is second in number of species only to Arthropoda. Moreover, with species as different
as meiofaunal worms and giant squid, Mollusca is one of the most morphologically variable
metazoan phyla. This extreme disparity in morphology among the major lineages (i.e., classes)
has prompted numerous conflicting phylogenetic hypotheses which have been widely debated.
Likewise, relationships within some major molluscan lineages (e.g., Gastropoda and
Aplacophora) and which other phylum or phyla constitute the sister taxon of Mollusca have also
been long-standing questions. In order to address these questions, in my Ph.D. dissertation
research, I have employed high-throughput DNA sequencing technologies and bioinformatic
tools in a phylogenomic approach.
Chapter 1 provides an introduction to Mollusca and outlines the objectives of my
dissertation research. Chapter 2 corresponds to a publication in the journal Nature where my
collaborators and I sought to address the relationships among the major lineages of Mollusca
using a phylogenomic approach. I lead the development of a novel bioinformatic pipeline and
analyzed data from 308 nuclear protein-coding genes from 42 diverse molluscs plus outgroups.
My collaborators and I recovered, for the first time, a well-supported phylogeny for Mollusca.
Our results strongly supported the Aculifera hypothesis placing chitons in a clade with a
monophyletic Aplacophora (worm-like molluscs). This clade was placed sister to Conchifera,
iii
more familiar shelled molluscs such as gastropods, bivalves, and cephalopods. Within
Conchifera, we found strong support for a sister taxon relationship between Gastropoda and
Bivalvia, a group not previously hypothesized by morphologists. In light of these results, we
conducted ancestral character state reconstruction which indicated that aculiferans have retained
several molluscan plesiomorphies and that advanced cephalization and shells may have had
multiple origins within Mollusca.
Pulmonates, with more than 30,000 described species, represent the largest radiation of
molluscs. Studies based on mitochondrial genomes versus datasets dominated by nuclear
ribosomal RNA genes drew conflicting conclusions about pulmonate monophyly, and support
for a sister group has been lacking, hindering our understanding of this major animal radiation.
Chapter 3 presents an attempt to resolve evolutionary relationships at the base of the pulmonate
radiation through phylogenomic analysis of 102 nuclear protein-coding genes from 19
gastropods. We recovered Opisthobranchia (sea slugs) paraphyletic with respect to
Panpulmonata, a clade in which Sacoglossa (an opisthobranch group that feeds algae) was sister
to Pulmonata. Siphonarioidea (intertidal, limpet-like snails) was recovered as the basal
pulmonate lineage. Siphonarioideans, which share a similar gill structure with the putatively
plesiomorphic shelled sacoglossans but lack the contractile pneumostome of pulmonates, likely
descended from an evolutionary intermediate that facilitated the gastropod radiation into non-
marine habitats. These results have important implications for understanding the series of
evolutionary events that facilitated the pulmonate radiation into non-marine habitats.
Because Aculifera is the sister taxon of all other molluscs, understanding the phylogeny
of this group is critical to understanding early molluscan evolution. In particular, a well-resolved
phylogeny for Aplacophora would provide polarity for the evolution of key morphological
iv
characters such as the radula. Accordingly, my collaborators and I employed a phylogenomic
approach to resolve the evolutionary relationships of Aplacophora. Ancestral character state
reconstruction was utilized to improve understanding of the evolution of key molluscan
characters. For this chapter, I also collaborated with Dr. Christiane Todt to describe four new
species of solenogasters from histological, SEM, and LM data (Appendix 1).
For my last dissertation data chapter, my collaborators and I sought to identify the sister
taxon of Mollusca and improve understanding of the phylogeny of Lophotrochozoa as a whole.
To this end, my collaborators and I sequenced cDNA libraries from 34 diverse lophotrochozoans
using the Illumina HiSeq platform. Phylogenetic analyses of this dataset indicate that a clade
including annelids, brachiopods, and phoronids constitutes the sister taxon of Mollusca.
Entoprocta, which has been hypothesized to be the molluscan sister taxon based on
morphological characters, was instead placed sister to Ectoprocta with strong support.
v
Acknowledgments
First and foremost, I thank my adviser, Dr. Ken Halanych for his guidance, support,
patience, and friendship during my graduate studies at Auburn University. Ken has been an
exceptional adviser who has always had my best interest in mind. It was Ken who first suggested
that I consider focusing on molluscs for my dissertation research and I am especially thankful for
this great advice. I am greatful to my dissertation committee members Drs. Scott Santos, Les
Goertzen, Christiane Todt, and Jason Bond for their help, guidance, and support. I am especially
greatful to Dr. Christiane Todt for hosting me in Bergen, Norway and training me in
aplacophoran taxonomy. Special thanks are also due to the late Dr. Christoffer Schander who
was a member of my committee and a good friend but unexpectedly passed away. I thank my
labmates, past and present, who have all been amazing colleagues and friends: Liz Borda, Pam
Brannock, David Branson, Joie Cannon, Matt Galaska, Justin Havird, Rebecca Hunter, Stephanie
Irvin, Alexis Janosik, Nate Kirk, Gil Koplovitz, Andy Mahon, Dan Thornhill, Damien Waits,
David Weese, Min Zhong, and Li. Finally, I thank my parents for their unending patience and
support during my time as a graduate student.
Financial support for this research came from numerous sources including an NSF
doctoral dissertation improvement grant, the American Malacological Society, the Malacological
Society of London, and the Auburn University Graduate School.
vi
Table of Contents
Abstract ......................................................................................................................................... ii
Acknowledgments......................................................................................................................... v
List of Figures ............................................................................................................................... x
List of Tables .............................................................................................................................xiii
List of Abbreviations .................................................................................................................. xv
Chapter 1. Introduction to dissertation ......................................................................................... 1
1.1 General introduction and background............................................................................... 1
1.1.1 Deep molluscan phylogeny...................................................................................... 1
1.1.2 Phylogeny of Euthyneura (Gastropoda)................................................................... 5
1.1.3 Phylogeny of Aplacophora and Aculifera................................................................ 6
1.1.4 The molluscan sister taxon: Phylogeny of Lophotrochozoa.................................... 7
1.1.5 Phylogenomics......................................................................................................... 9
1.2 Resesarch objectives ....................................................................................................... 11
1.3 References....................................................................................................................... 12
Chapter 2. Phylogenomics reveals deep molluscan relationships ............................................. 25
2.1 Abstract ........................................................................................................................... 25
2.2 Introduction..................................................................................................................... 25
2.3 Materials and Methods.................................................................................................... 27
2.3.1 Molecular techniques ............................................................................................. 29
vii
2.3.2 Sequence processing .............................................................................................. 29
2.3.3 Orthology assignment and dataset assembly ......................................................... 29
2.3.4 Contamination screening ....................................................................................... 31
2.3.5 Phylogenetic analyses ............................................................................................ 32
2.3.6. Ancestral state reconstruction ............................................................................... 33
2.4 Results and Discussion ................................................................................................... 33
2.5 References....................................................................................................................... 41
Chapter 3. Phylogenomics supports Panpulmonata: Opisthobranch paraphyly and key evolutionary steps in a major radiation of gastropod molluscs............................................. 78
3.1 General introduction and background............................................................................. 78
3.2 Introduction..................................................................................................................... 78
3.3 Materials and Methods.................................................................................................... 82
3.4 Results............................................................................................................................. 84
3.5 Discussion ....................................................................................................................... 86
3.5.1 Euthyneuran phylogeny ......................................................................................... 86
3.5.2 Panpulmonata and the pulmonate transition to land .............................................. 88
3.6 References....................................................................................................................... 91
Chapter 4. Molecular phylogeny of Aplacophora..................................................................... 104
4.1 Abstract ......................................................................................................................... 104
4.2 Introduction................................................................................................................... 105
4.2.1 General Introduction ............................................................................................ 105
4.2.2 Introduction to Aplacophora ................................................................................ 107
4.2.3 Chaetodermomorpha (Caudofoveata).................................................................. 109
4.2.4 Neomeniomorpha (Solenogastres)....................................................................... 110
viii
4.2.5 Current State of Aplacophoran Taxonomy and Systematics ............................... 111
4.3 Materials and Methods.................................................................................................. 115
4.3.1 Specimen Collection ............................................................................................ 115
4.3.2 Taxon Selection ................................................................................................... 117
4.3.3 Molecular Techniques.......................................................................................... 118
4.3.4 Sequence Processing............................................................................................ 119
4.3.5 Dataset Assembly................................................................................................. 121
4.3.6 Phylogenetic Analysis and Hypothesis Testing................................................... 123
4.4 Results........................................................................................................................... 124
4.5 Discussion ..................................................................................................................... 129
4.6 Discussion ..................................................................................................................... 158
4.7 References..................................................................................................................... 138
Chapter 5. Molecular Phylogeny of Lophotrochozoa and the search for the Molluscan Sister Taxon .................................................................................................................................. 158
5.1 Abstract ......................................................................................................................... 158
5.2 Introduction................................................................................................................... 159
5.2.1 General Introduction to Lophotrochozoa............................................................. 159
5.2.2 Trochozoa ............................................................................................................ 160
5.2.3 Entoprocta (=Kamptozoa), Cycliophora, and Bryozoa (=Ectoprocta) ................ 164
5.2.4 Platyzoa................................................................................................................ 166
5.3 Materials and Methods.................................................................................................. 167
5.3.1 Taxon Sampling Considerations .......................................................................... 167
5.3.2 Molecular Techniques.......................................................................................... 168
5.3.3 Sequence Processing............................................................................................ 170
ix
5.3.4 Dataset Assembly................................................................................................. 171
5.3.5 Phylogenetic Analysis.......................................................................................... 173
5.4 Results........................................................................................................................... 174
5.4.1 Data Matrix and Overall Tree Topology ............................................................. 174
5.4.2 Trochozoa ............................................................................................................ 175
5.4.3 Polyzoa................................................................................................................. 177
5.4.4 Platyzoa................................................................................................................ 178
5.5 Discussion ..................................................................................................................... 178
5.5.1 Trochozoa ............................................................................................................ 178
5.5.2 Polyzoa................................................................................................................. 182
5.5.3 Platyzoa................................................................................................................ 184
5.6 Conclusions................................................................................................................... 186
5.7 References..................................................................................................................... 186
Chapter 6. Conclusions and Future Directions .........................................................................214
6.1 Deep Molluscan Phylogeny .......................................................................................... 214
6.2 Phylogeny of Gastropoda and Panpulmonata ............................................................... 215
6.3 Phylogeny of Aplacophora ........................................................................................... 216
6.4 Phylogeny of Lophotrochozoa and the Sister Taxon of Mollusca................................ 217
6.5 Future Directions .......................................................................................................... 218
6.6 References..................................................................................................................... 222
Appendix 1. Three new species of meiofaunal solenogasters (Mollusca: Aplacophora) .........225
x
List of Figures
Chapter 1
Figure 1: Representatives of the eight major lineages of Mollusca .......................................... 23
Figure 2: Leading hypotheses of molluscan phylogeny ............................................................ 24
Chapter 2
Figure 1: Leading hypotheses of molluscan phylogeny ............................................................ 47
Figure 2: Flow chart of bioinformatics pipeline ........................................................................ 48
Figure 3: Data matrix coverage................................................................................................... 49
Figure 4: Relationships among major lineages of Mollusca based on 308 genes ...................... 50
Figure 5: Deep molluscan phylogeny as inferred in the present study ....................................... 51
Figure 6: Maximum likelihood topology based on 308 genes with broad outgroup sampling .. 52
Figure 7: Bayesian inference topology based on 308 genes with broad outgroup sampling ..... 53
Figure 8: Maximum likelihood topology based on 308 genes with Annelida outgroup ............ 54
Figure 9: Bayesian inference topology based on 200 best sampled genes ................................. 55
Figure 10: Bayesian inference topology based on 100 best sampled genes ............................... 56
Figure 11: Bayesian inference topology based on non-ribosomal proteins................................ 57
Figure 12: Bayesian inference topology based on ribosomal proteins ....................................... 58
Figure 13: InParanoid screening of genes................................................................................... 59
Figure 14: Maximum likelihood topology based on all 308 genes (WAG + CAT + F model).. 60
xi
Figure 15: Maximum likelihood topology based on all 308 genes (LG + CAT + F model) ...... 61
Figure 16: FastTree topology based on all 308 genes using the JTT + CAT model .................. 62
Chapter 3
Figure 1: Competing phylogenetic hypotheses for major lineages within Euthyneura. ............. 98
Figure 2: Inferred phylogeny of Euthyneura .............................................................................. 99
Figure 3: Summary tree showing relationships among key euthyneuran lineages.. ................. 100
Chapter 4
Figure 1: Examples of aplacophoran molluscs. ........................................................................ 144
Figure 2: Data matrix coverage................................................................................................. 146
Figure 3: Aplacophoran phylogeny based on 193 genes .......................................................... 147
Figure 4: Aplacophoran phylogeny when Neomenia aff. herwigi is excluded......................... 148
Figure 5: Aplacophoran phylogeny when Neomenia megatrapezata is excluded.................... 149
Figure 6: Aplacophoran phylogeny when the conchiferan outgroups are excluded................. 150
Figure 7: Aplacophoran phylogeny when both Neomenia species are excluded...................... 151
Chapter 5
Figure 1: Consensus view of metazoan phylogeny from Kocot et al. (2011)........................... 194
Figure 2: Illustration of a generalized annelid trochophore larva............................................. 195
Figure 3: Data matrix coverage................................................................................................. 196
Figure 4: Lophotrochozoan Phylogeny based on 122 genes.. .................................................. 197
Figure 5: Summary of relationships among lophotrochozoan phyla as inferred in the present study.................................................................................................................................... 199
xii
Appendix 1
Figure 1: Schematic map of the San Juan Islands..................................................................... 241
Figure 2: Scanning electron micrographs of Macellomenia schanderi .................................... 242
Figure 3: Light micrograph of sclerites of Macellomenia schanderi ....................................... 243
Figure 4: Light micrographs of sections of Macellomenia schanderi ...................................... 244
Figure 5: Genital cone of a relaxed specimen of Macellomenia schanderi.............................. 245
Figure 6: Scanning electron micrographs of Macellomenia morseae ...................................... 246
Figure 7: Photomicrograph of relaxed specimen of Macellomenia morseae ........................... 247
Figure 8: Light micrographs of sections of Macellomenia morseae ........................................ 248
Figure 9: Photomicrograph of fixed (contracted) specimen of Hypomenia sanjuanensis........ 249
Figure 10: Scanning electron micrograph of Hypomenia sanjuanensis ................................... 250
Figure 11: Light micrograph of sclerites of Hypomenia sanjuanensis ..................................... 251
Figure 12: Light micrographs of sections of Hypomenia sanjuanensis.................................... 252
xiii
List of Tables
Chapter 2
Table 1: Specimen data for sequenced taxa ............................................................................... 63
Table 2: Taxon sampling ........................................................................................................... 64
Table 3: Approximately unbiased (AU) test results .................................................................. 71
Table 4: Morphological matrix for ancestral state reconstruction ............................................. 72
Table 5: Ancestral states affected by placement of Monoplacophora ....................................... 77
Chapter 3
Table 1: Taxon sampling ......................................................................................................... 101
Table 2: Leaf stability and taxon instability index results. ...................................................... 102
Table 3: Approximately unbiased (AU) test results. ............................................................... 103
Chapter 4
Table 1: Collection information............................................................................................... 152
Table 2: Taxon sampling. ........................................................................................................ 154
Table 3: BLAST databses used in contamination screening. .................................................. 156
Table 4: SH-test results. ........................................................................................................... 157
Chapter 5
Table 1: Taxon Sampling......................................................................................................... 200
xiv
Table 2: Collection Information............................................................................................... 206
Table 3: Genes Used in this Study........................................................................................... 209
Table 4: BLAST Databases Used in Contamination Screening. ............................................. 213
xv
List of Abbreviations
AU approximately unbiased
BI Bayesian inference
cDNA complimentary DNA
DNA deoxyribonucleic acid
EST expressed sequence tag
ML maximum likelihood
OG orthology group
OTU operational taxonomic unit
PCR polymerase chain reaction
PE paired-end
rDNA ribosomal DNA
RNA ribonucleic acid
rRNA ribosomal RNA
SH test Shimodaira-Hasegawa test
1
Chapter 1. Introduction to dissertation
1.1 General introduction and background
With approximately 130,000 described extant species, molluscs are second in species
richness only to arthropods. Moreover, with species as different as meiofaunal worms and giant
squid, Mollusca is also one of the most morphologically variable phyla. Molluscs are
economically important as food, vectors of parasites, producers of pearls and shells,
bioremediators, and biofoulers. Many molluscs are ecologically important as keystone, as well as
invasive, species. Many molluscs are endangered species, several of which are endemic to
Alabama. A large body of research on molluscs attests to their scientific importance to fields
such as neurobiology, parasitology, environmental science, and comparative genomics, among
others (reviewed by Haszprunar et al., 2008; Haszprunar and Wanninger, 2012). Despite their
diversity and importance, the extreme disparity in morphology among the major lineages (i.e.,
classes) has prompted numerous conflicting phylogenetic hypotheses (reviewed by Haszprunar et
al., 2008; Ponder and Lindberg, 2008; Kocot, 2013) about relationships among the eight major
lineages, or classes, of Mollusca: Chaetodermomorpha (=Caudofoveata), Neomeniomorpha
(=Solenogastres), Polyplacophora (chitons), Monoplacophora, Gastropoda (snails and slugs),
Bivalvia (clams, scallops, oysters, etc.), Cephalopoda (octopuses, squids, and Nautilus), and
Scaphopoda (tusk shells) (Figure 1). Additionally, relationships within certain molluscan clades
and which other phyla are most closely related to Mollusca are also unclear.
1.1.1 Deep molluscan phylogeny
The relationships among the major lineages (i.e., classes) of Mollusca have been a long-
standing unanswered question, the answer to which is important for comparative studies in
2
numerous diverse fields. For example, because molluscs are well represented in the early animal
fossil record, understanding molluscan evolutionary history has significant implications for
understanding early animal evolution and the identity of several Cambrian fossil taxa
hypothesized to be stem-group molluscs including Odontogriphus omalus and Kimberella
quadrata (Caron et al., 2006; Fedonkin et al., 2007; Ivantsov, 2009, 2011). Also, several
molluscs are important models for the study of learning and memory (Moroz, 2009, 2012).
Most traditional hypotheses of molluscan class-level phylogeny are based on adult
morphological characters. The worm-like aplacophorans –
Chaetodermomorpha (=Caudofoveata) and Neomeniomorpha (=Solenogastres) – have
traditionally been considered plesiomorphic and “basal” because of their relatively simple
morphology and/or possession of aragonitic sclerites rather than one or more shells (Salvini-
Plawen, 1980, 1981, 1985, 1990, 2003; Salvini-Plawen and Steiner, 1996; Haszprunar, 2000).
Whether these two groups constitute a monophyletic taxon called Aplacophora (Scheltema,
1993; Ivanov, 1996; Scheltema and Taylor, 1996; Waller, 1998) or a paraphyletic grade has been
widely debated (reviewed by Haszprunar et al. 2008, Todt et al. 2008). Morphology has been
variously interpreted to suggest basal placement for chaetoderms (Adenopoda hypothesis;
Salvini-Plawen 1985; Figure 2A) as well as neomenioids (Hepagastralia hypothesis; Salvini-
Plawen and Steiner 1996, Haszprunar 2000; Figure 2B). Studies (Bartolomaeus, 1993; Ax, 1999;
Wanninger et al., 2007; Haszprunar and Wanninger, 2008; Wanninger, 2009) examining the
anatomy of the phylum Entoprocta (=Kamptozoa), a hypothesized molluscan sister taxon,
strengthened support for the Hepagastralia hypothesis. Most notably, the neomenioid nervous
system and preoral sensory organ are strikingly similar to those of larval entoprocts (Wanninger
et al., 2007). In contrast to hypotheses placing aplacophorans basal, the Aculifera hypothesis
3
(Scheltema, 1993; Ivanov, 1996; Scheltema and Taylor, 1996) (Figure 2C) unites molluscs that
possess sclerites by placing Polyplacophora as the sister taxon of Aplacophora. Aculifera is
sometimes also called Amphineura although this latter term has also been confined to refer only
to chitons by some workers (see Salvini-Plawen 1980 and Scheltema 1993 for discussion). Other
workers place the eight-shelled chitons sister to Conchifera (molluscs with one or two shells;
Monoplacophora [=Tryblidia], Gastropoda, Cephalopoda, Scaphopoda, and Bivalvia) under the
Testaria hypothesis (Salvini-Plawen 1985; Salvini-Plawen and Steiner 1996; Haszprunar 2000)
uniting all molluscs with shells. Molecular studies (Giribet et al., 2006; Wilson et al., 2010) have
suggested a close relationship between Polyplacophora and Monoplacophora (Figure 2D) uniting
the extant shelled molluscs with serially repeated muscles and ctenidia (except Nautilus). Within
Conchifera, the previously most widely held hypothesis places Monoplacophora basal to two
clades: Cyrtosoma (=Visceroconcha; Gastropoda and Cephalopoda) and Diasoma
(=Loboconcha; Bivalvia and Scaphopoda) (Runnegar and Pojeta Jr, 1974; Pojeta and Runnegar,
1976; Salvini-Plawen, 1985; Trueman and Brown, 1985; Salvini-Plawen and Steiner, 1996)
(Figure 2E). Notably, Cyrtosoma was originally described to include Monoplacophora
(Runnegar and Pojeta Jr, 1974) but the term has more recently been used by some (including
Kocot et al. 2011 and Smith et al. 2011) to describe a clade including only gastropods and
cephalopods.
Because of conflicting hypotheses based on morphological data, molecular data are
desirable as an independent source of data to address deep molluscan evolutionary relationships.
Prior to my dissertation research and two other recent investigations of mollusc phylogeny (see
Results and Discussion section of Chapter 2), molecular studies have relied primarily on the
nuclear small subunit (SSU or 18S) and large subunit (LSU or 28S) ribosomal genes
4
(Winnepenninckx et al., 1996; Rosenberg et al., 1997; Passamaneck et al., 2004; Giribet et al.,
2006; Meyer et al., 2010; Wilson et al., 2010). Briefly, the results of some of the most recent
studies will be summarized. A maximum likelihood (ML) analysis of complete 18S and partial
28S sequences from 32 molluscs performed by Passamaneck et al. (2004) recovered all classes
except for Bivalvia monophyletic, but support values at higher-level nodes were generally weak.
Notably, analyses of 28S recovered Aplacophora monophyletic and strongly contradicted the
previously widely accepted Diasoma hypothesis suggesting that scaphopods are more closely
related to gastropods and/or cephalopods than bivalves (Figure 2F). Giribet et al. (2006)
analyzed a combined dataset with sequences from 18S, 28S, 16S, cytochrome oxidase I (COI),
and histone H3 from 101 molluscs using a dynamic homology approach with parsimony as the
optimality criterion for direct optimization as well as a model-based approach using Bayesian
inference (BI). As in Passamaneck et al. (2004), support values at higher-level nodes were
mostly weak. Also, neither Bivalvia nor Gastropoda were recovered monophyletic. Notably, a
clade nesting the monoplacophoran Laevipilina antarctica Warén and Hain, 1992 inside
Polyplacophora, termed Serialia by the authors, was recovered and well-supported in both
analyses. However, the single monoplacophoran 28S sequence analyzed was later shown to be a
chimera of monoplacophoran and chiton 28S (Wilson et al. 2010). After adding authentic data
from a second monoplacophoran species and removing the contaminated portion of the
Laevipilina antarctica 28S sequence, ML and BI analyses of the same genes by Wilson et al.
(2010) still found support for Serialia. However, Neomeniomorpha was placed in a clade with
Annelida (including Sipuncula) rendering Mollusca paraphyletic. Wilson et al. (2010) noted that
the available Helicoradomenia (Neomeniomorpha, Simrothiellidae) 18S sequences appear
similar to available annelid 18S sequences but not unambiguously enough to support their
5
exclusion. Subsequent work by Meyer et al. (2010) substantiated the notion that the available
18S sequences from Helicoradomenia, which, like at least some other simrothiellids is thought to
feed on annelids (Todt and Salvini-Plawen, 2005), are chimeras with annelid 18S. Otherwise,
Wilson et al. (2010) generally found weak support for other higher-level relationships as in
previous studies.
1.1.2 Phylogeny of Euthyneura (Gastropoda)
In addition to uncertainty about the relationships among the major lineages of Mollusca,
relationships within some groups still remain far from resolved. Gastropoda is the largest major
molluscan lineage and it includes the greatest number of described marine species of any animal
phylum. Within Gastropoda, Euthyneura, a clade that includes 36,000 species of freshwater and
terrestrial snails (Pulmonata) and sea slugs (“Opisthobranchia”), is by far the most species-rich
clade (Mordan and Wade, 2008; Wägele et al., 2008). Traditionally, on the basis of morphology,
Pulmonata and Opisthobranchia were viewed as two reciprocally monophyletic sister taxa.
Heterobranchia is a larger, more inclusive clade that includes Euthyneura as well as several
additional groups of snails and slugs (e.g., pyramidellids, rissoelloids, sundial snails, and others)
which are thought by most workers to form a basal paraphyletic assemblage with respect to
Euthyneura (reviewed by Wägele et al., 2008). This informal group is usually referred to as the
“lower Heterobranchia.”
Recent molecular studies have challenged the traditional view of euthyneuran phylogeny
by rejecting either the monophyly of Opisthobranchia, Pulmonata, or both, but no consensus has
yet emerged. Datasets dominated by mitochondrial genes versus nuclear rDNA sequences have
yielded dramatically different phylogenetic hypotheses for Euthyneura. Three analyses of amino
6
acid sequences from mitochondrial protein-coding genes recovered an essentially monophyletic
Opisthobranchia radiating from within a paraphyletic Pulmonata (Grande et al., 2008; Medina et
al., 2011; White et al., 2011). In contrast, analyses of nuclear and mitochondrial rRNA genes
plus the cytochrome c oxidase I (COI) gene consistently recover Opisthobranchia paraphyletic
with respect to a monophyletic “Pulmonata,” if some traditional “lower heterobranchs” are
reassigned as pulmonates (Dinapoli and Klussmann-Kolb, 2010; Jӧrger et al., 2010; Dayrat et al.,
2011). These conflicting results have led some to claim Opisthobranchia as a valid taxon, while
others explicitly said “bye-bye” to Opisthobranchia (Jӧrger et al., 2010; Medina et al., 2011;
Schrödl et al., 2011).
1.1.3 Phylogeny of Aplacophora and Aculifera
With only around 400 described species (Todt in press), the aplacophoran molluscs are
not nearly as diverse as the gastropods. However, aplacophorans are of great interest because
they have traditionally been considered to be the most plesiomorphic extant molluscs.
Aplacophorans are unique among molluscs because of their vermiform body shape, relatively
simple internal anatomy, and lack of shells (Salvini-Plawen 1985, Salvini-Plawen and Steiner
1996, Haszprunar 2000). Recent studies showing similarities between aplacophorans and
entoprocts, one hypothesized molluscan sister taxon, have bolstered arguments that
aplacophorans have retained plesiomorphic characters that have been lost in other molluscs
(reviewed by Haszprunar et al. 2008). However, because relationships within Aplacophora and
even whether or not it is a monophyletic group have been widely debated (Todt et al. 2008), the
phylogenetic framework needed to understand the evolutionary polarity of such aplacophoran
morphological characters has been lacking.
7
The current taxonomy of Aplacophora divides the group into two major lineages:
Chaetodermomorpha (=Caudofoveata) and Neomeniomorpha (Solenogastres). Within
Chaetodermomorpha, one order and three or four families are recognized. Within the more
diverse Neomeniomorpha, four orders and 23 families are recognized (Garcia-Alvarez and
Salvini-Plawen 2007). To date, the only study explicitly addressing aplacophoran phylogeny was
a cladistic morphological analysis focused on relationships within Neomeniomorpha.
Interestingly, all of the recognized orders and some families were not recovered monophyletic
suggesting that either the current taxonomy does not reflect the evolutionary history of the group
or that at least some of the characters used were homoplastic (Salvini-Plawen 2003). No
molecular studies have evaluated the traditional taxonomy of Aplacophora but some workers
have collected sequence data from aplacophorans in order to address other questions (e.g.,
molluscan class-level phylogeny). Evidentially, at least some aplacophorans have a GC-rich
nuclear ribosomal operon which resists standard PCR amplification and can form chimaeras with
amplicons from their prey (Okusu and Giribet, 2003; Meyer et al., 2010).
1.1.4 The molluscan sister taxon: Phylogeny of Lophotrochozoa
Lophotrochozoa was defined by Halanych et al. (1995) on the basis of an analysis of 18S
rDNA as the last common ancestor of the three traditional lophophorate taxa (Brachiopoda,
Phoronida, and Bryozoa [=Ectoprocta]), molluscs, annelids, and all of the descendants of that
common ancestor. Monophyly of Lophotrochozoa has since been supported by numerous
molecular phylogenetic investigations (e.g., Peterson and Eernisse 2001 [when the long-
branched gastrotrich and gnathostomulid sequences are excluded]; Philippe et al., 2005;
8
Passamaneck and Halanych, 2006; Dunn et al., 2008; Hejnol et al., 2009). However, the
interrelationships among the phyla that constitute this taxon are largely unclear.
Trochozoa includes Mollusca, Annelida, Nemertea, Brachiopoda, Phoronida and possibly
Entoprocta (=Kamptozoa) and Cycliophora (reviewed by Edgecombe et al., 2011). Trochozoans
are united by the presence of a trochophore larva although this larval type has been lost or
modified in some taxa (e.g., brachiopods, phoronids, and nemerteans). Some molluscs (e.g.,
cephalopods) and annelids (e.g., earthworms) also lack a a trochophore larval but in these cases,
it is clearly a secondary loss. Molecular studies have generally supported the monophyly of
Trochozoa although support for most nodes has been generally weak. Dunn et al. (2008)
recovered a monophyletic Trochozoa in which Mollusca was sister to a clade comprised of
Annelida, Brachiopoda, Phoronida, and Nemertea (Annelida, ((Brachiopoda, Phoronida),
Nemertea))). A similar topology for Trochozoa was recovered by Helmkampf et al. (2008)
although Entoprocta was sister to Bryozoa (=Ectoprocta) and this clade was sister to the
remainder of Trochozoa. Brachiopods, phoronids, and bryozoans were traditionally allied as the
clade Lophophorata (Hyman, 1940; Nielsen, 1985). While these taxa all possess a horseshoe-
shaped ring of hollow tentacles termed a lophophore, there are significant structural differences
arguing against a common origin of these structures (Halanych, 1996). Molecular studies have
mostly supported the monophyly of Brachiopoda and Phoronida to the exclusion of Bryozoa
(Anderson et al., 2004; Passamaneck and Halanych, 2006; Dunn et al., 2008; Helmkampf et al.,
2008; Paps et al., 2009). Paps et al. (2009) analyzed 13 nuclear protein-coding genes and also
recovered a monophyletic Trochozoa with strong support in BI analyses but fairly weak support
in ML but support for relationships within Trochozoa was weak in both analyses.
9
1.1.5 Phylogenomics
Several of the major changes in our understanding of animal phylogeny in the late
twentieth century were initially hypothesized on the basis of the nuclear ribosomal small subunit
(SSU or 18S) rDNA gene (Field et al., 1988; Halanych et al., 1995; Aguinaldo et al., 1997; Ruiz-
Trillo et al., 1999). The advantages of this gene include the presence of both variable and
conserved regions, the latter of which facilitate oligonucleotide primer design for polymerase
chain reaction (PCR). This marker also has some potential pitfalls, the most serious of which are
rate heterogeneity across taxa and its susceptibility to long-branch attraction (Felsenstein, 1988)
that can mislead phylogenetic interpretation (Abouheif et al., 1998). Although nuclear ribosomal
genes have been extremely informative to our understanding of deep metazoan phylogeny
(Halanych et al., 1995; Aguinaldo et al., 1997), several studies employing these markers have
been unable to unambiguously resolve many aspects of animal phylogeny including deep
molluscan phylogeny, gastropod phylogeny, and lophotrochozoan phylogeny. As the field has
matured, other markers, such as mitochondrial genomes, Hox genes, and nuclear protein-coding
genes have come into use. Additionally, the number of taxa employed in phylogenetic analyses
of metazoans has increased significantly from early studies with less than 10 taxa (e.g. Halanych
1995, Bromham and Degnan 1999) to studies with hundreds of taxa (Giribet et al., 2000;
Peterson and Eernisse, 2001; Mallatt et al., 2012).
Studies that employ a polymerase chain reaction-based or target-gene approach are
dependent on PCR to amplify specific DNA markers for sequencing. Until recently, the use of
single-copy nuclear protein-coding genes for metazoan phylogeny has been limited because of
variation in intron boundaries, challenges involved in working with RNA, and the need for
preexisting sequence data for primer design. As genomic resources have become available from
10
even some of the most obscure taxa, and molecular methods have developed, phylogenetic
investigations targeting multiple nuclear protein-coding genes have become more feasible
(Ruiz-Trillo et al., 2002; Anderson et al., 2004; Peterson et al., 2004; Helmkampf et al., 2008;
Paps et al., 2009; Sperling et al., 2009; Regier et al., 2010). Also, high-throughput sequencing
approaches allowing for molecular data to be obtained in a PCR-independent manner have
become more accessible and affordable. The approach of using high-throughput sequencing to
collect and analyze large amounts of transcriptome or genome data for phylogeny reconstruction
is typically referred to phylogenomics (Delsuc et al., 2005; Telford, 2008) although the term has
also been used to describe the study of the evolution of gene families (Eisen, 1998).
Most recent phylogenomic studies have made use of expressed sequence tag (EST) data.
By way of a brief description, EST data are generated by extracting mRNA, reverse transcribing
it to complimentary DNA (cDNA), and then sequencing a randomly selected subset of the
cDNA, producing partial sequences or ‘tags.’ Data collection for early phylogenomic studies was
conducted using capillary sequencers, and by necessity included the laborious process of
bacterial cloning of the cDNA. However, more recently, so-called next-generation sequencing
platforms such as 454, Illumina, IonTorrent, PacBio, SOLiD, and others have made it possible to
collect very large amounts of transcriptome data at a low cost per base pair relative to capillary
sequencing. The phylogenomic approach is a powerful one for studies of deep animal
relationships because many of the sequences obtained belong to ‘housekeeping’ genes which are
vital to the function of any given cell. Because such genes are usually constitutively expressed,
they are likely to be recovered in a typical EST survey regardless of the source of the material.
Furthermore, because of their functional importance, housekeeping genes tend to be highly
evolutionarily conserved, furnishing phylogenetic signal for the study of deep relationships.
11
1.2 Research objectives
Previous molecular studies addressing deep molluscan phylogeny have relied primarily
on nuclear ribosomal and mitochondrial genes and have been unable to resolve the evolutionary
relationships among the major lineages of Mollusca. Prior to my dissertation work, no studies
had addressed deep molluscan phylogeny using nuclear protein-coding genes as molecular
markers.
In addition to uncertainty regarding the relationships among the major molluscan
lineages, relationships within some of the major lineages are poorly understood as well. This is
particularly the case for the gastropod clade Euthyneura, the most species-rich radiation of
molluscs that includes the familiar land snails and the beautiful sea slugs. Additionally,
relationships within Aplacophora, especially the cnidarivorous Neomeniomorpha, have received
virtually no attention from molecular systematists due in part to problems with the GC-richness
of their nuclear ribosomal RNA genes.
Lastly, the identity of the phylum or grouping of phyla that comprises the sister taxon of
Mollusca is unknown although previous studies (Passamaneck and Halanych, 2006; Hausdorf et
al., 2007; Dunn et al., 2008; Helmkampf et al., 2008) have narrowed the list to a handful of
phyla. Therefore, the research objectives of my Ph.D. dissertation work are as follows:
1. Investigate molluscan class-level phylogeny using a phylogenomic approach.
2. Test hypotheses of euthyneuran gastropod phylogeny and evolution using a
phylogenomic approach.
3. Investigate aplacophoran phylogeny using a phylogenomic approach.
4. Investigate lophotrochozoan phylogeny and identify the sister taxon of Mollusca using a
phylogenomic approach.
12
1.3 References
Abouheif E., Zardoya R., Meyer A., 1998. Limitations of metazoan 18S rRNA sequence data:
implications for reconstructing a phylogeny of the animal kingdom and inferring the
reality of the Cambrian explosion. Journal of Molecular Evolution. 47, 394–405.
Aguinaldo A.M.., Turbeville J.M., Linford L.S., Rivera M.C., Garey J.R., Raff R.A., Lake J.A.,
1997. Evidence for a clade of nematodes, arthropods and other moulting animals. Nature.
387, 489–493.
Anderson F.E., Córdoba A.J., Thollesson M., 2004. Bilaterian phylogeny based on analyses of a
region of the sodium–potassium ATPase $\beta$-subunit gene. Journal of molecular
evolution. 58, 252–268.
Ax P., 1999. Das System der Metazoa III. , Gustav Fischer Verlag, Stuttgart.
Bartolomaeus T., 1993. Die Leibeshöhlenverhältnisse und Verwandtschaftsbeziehungen der
Spiralia. Verhandlungen der Deutschen Zoologischen Gesellschaft. 86, 42.
Caron J.B., Scheltema A., Schander C., Rudkin D., 2006. A soft-bodied mollusc with radula
from the Middle Cambrian Burgess Shale. Nature. 442, 159–163.
Dayrat B., Conrad M., Balayan S., White T.R., Albrecht C., Golding R., Gomes S.R.,
Harasewych M.G., De Frias Martins A.M., 2011. Phylogenetic relationships and
evolution of pulmonate gastropods (Mollusca): New insights from increased taxon
sampling. Molecular Phylogenetics and Evolution. 59, 425–437.
13
Delsuc F., Brinkmann H., Philippe H., 2005. Phylogenomics and the reconstruction of the tree of
life. Nature Reviews Genetics. 6, 361–375.
Dinapoli A., Klussmann-Kolb A., 2010. The long way to diversity – Phylogeny and evolution of
the Heterobranchia (Mollusca: Gastropoda). Molecular Phylogenetics and Evolution. 55,
60–76.
Dunn C.W., Hejnol A., Matus D.Q., Pang K., Browne W.E., Smith S.A., Seaver E., Rouse G.W.,
Obst M., Edgecombe G.D., others, 2008. Broad phylogenomic sampling improves
resolution of the animal tree of life. Nature. 452, 745–749.
Edgecombe G.D., Giribet G., Dunn C.W., Hejnol A., Kristensen R.M., Neves R.C., Rouse G.W.,
Worsaae K., Sørensen M.V., 2011. Higher-level metazoan relationships: recent progress
and remaining questions. Organisms Diversity and Evolution. 11, 151.
Eisen J.A., 1998. Phylogenomics: Improving Functional Predictions for Uncharacterized Genes
by Evolutionary Analysis. Genome Research. 8, 163 –167.
Fedonkin M.A., Simonetta A., Ivantsov A.Y., 2007. New data on Kimberella, the Vendian
mollusc-like organism (White Sea region, Russia): palaeoecological and evolutionary
implications. Geological Society, London, Special Publications. 286, 157 –179.
Felsenstein J., 1988. Phylogenies from molecular sequences: inference and reliability. Annual
review of genetics. 22, 521–565.
Field K.G., Olsen G.J., Lane D.J., Giovannoni S.J., Ghiselin M.T., Raff E.C., Pace N.R., Raff
R.A., 1988. Molecular phylogeny of the animal kingdom. Science. 239, 748–753.
14
Giribet G., Distel D.L., Polz M., Sterrer W., Wheeler W.C., 2000. Triploblastic Relationships
with Emphasis on the Acoelomates and the Position of Gnathostomulida, Cycliophora,
Plathelminthes, and Chaetognatha: A Combined Approach of 18S rDNA Sequences and
Morphology. Syst Biol. 49, 539–562.
Giribet G., Okusu A., Lindgren A.R., Huff S.W., Schrödl M., Nishiguchi M.K., 2006. Evidence
for a clade composed of molluscs with serially repeated structures: Monoplacophorans
are related to chitons. .
Grande C., Templado J., Zardoya R., 2008. Evolution of gastropod mitochondrial genome
arrangements. BMC Evolutionary Biology. 8, 61.
Halanych K.M., Bacheller J.D., Aguinaldo A.M.., Liva S.M., Hillis D.M., Lake J.A., 1995.
Evidence from 18S ribosomal DNA that the lophophorates are protostome animals.
Science(Washington). 267, 1641–1641.
Halanych K.M., 1996. Convergence in the feeding apparatuses of lophophorates and pterobranch
hemichordates revealed by 18S rDNA: an interpretation. The Biological Bulletin. 190, 1–
5.
Haszprunar G., Schander C., Halanych K., 2008. Relationships of Higher Molluscan Taxa.,
Phylogeny and Evolution of the Mollusca, University of California Press, Berkeley and
Los Angeles, CA, pp. 19–32.
Haszprunar G., Wanninger A., 2008. On the fine structure of the creeping larva of Loxosomella
murmanica: additional evidence for a clade of Kamptozoa (Entoprocta) and Mollusca.
Acta Zoologica. 89, 137–148.
15
Haszprunar G., Wanninger A., 2012. Molluscs. Current Biology. 22, R510–R514.
Haszprunar G., 2000. Is the Aplacophora monophyletic? A cladistic point of view. American
Malacological Bulletin. 15, 115–130.
Hausdorf B., Helmkampf M., Meyer A., Witek A., Herlyn H., Bruchhaus I., Hankeln T., Struck
T.H., Lieb B., 2007. Spiralian phylogenomics supports the resurrection of Bryozoa
comprising Ectoprocta and Entoprocta. Molecular biology and evolution. 24, 2723.
Hejnol A., Obst M., Stamatakis A., Ott M., Rouse G.W., Edgecombe G.D., Martinez P., Bagu\
nà J., Bailly X., Jondelius U., others, 2009. Assessing the root of bilaterian animals with
scalable phylogenomic methods. Proceedings of the Royal Society B: Biological
Sciences. 276, 4261.
Helmkampf M., Bruchhaus I., Hausdorf B., 2008. Phylogenomic analyses of lophophorates
(brachiopods, phoronids and bryozoans) confirm the Lophotrochozoa concept.
Proceedings of the Royal Society B: Biological Sciences. 275, 1927.
Hyman L.H., 1940. The invertebrates: mollusca I. , McGraw-Hill,
Ivanov D.L., 1996. Origin of Aculifera and problems of monophyly of higher taxa in molluscs.
Origin and evolutionary radiation of the Mollusca. 59–65.
Ivantsov A.Y., 2009. New reconstruction of Kimberella, problematic Vendian metazoan.
Paleontological Journal. 43, 601–611.
Ivantsov A.Y., 2011. Paleontological evidence for the supposed precambrian occurrence of
mollusks. Paleontological Journal. 44, 1552–1559.
16
Jӧrger K., Stoger I., Kano Y., Fukuda H., Knebelsberger T., Schrodl M., 2010. On the origin of
Acochlidia and other enigmatic euthyneuran gastropods, with implications for the
systematics of Heterobranchia. BMC Evolutionary Biology. 10, 323.
Kocot K.M., 2013. Recent advances and unanswered questions in deep molluscan phylogenetics.
American Malacological Bulletin. 31, 1–14.
Mallatt J., Craig C.W., Yoder M.J., 2012. Nearly complete rRNA genes from 371 Animalia:
Updated structure-based alignment and detailed phylogenetic analysis. Molecular
Phylogenetics and Evolution. .
Medina M., Lal S., Vallès Y., Takaoka T.L., Dayrat B.A., Boore J.L., Gosliner T., 2011.
Crawling through time: Transition of snails to slugs dating back to the Paleozoic, based
on mitochondrial phylogenomics. Marine Genomics. 4, 51–59.
Meyer A., Todt C., Mikkelsen N., Lieb B., 2010. Fast evolving 18S rRNA sequences from
Solenogastres (Mollusca) resist standard PCR amplification and give new insights into
mollusk substitution rate heterogeneity. BMC Evolutionary Biology. 10, 70.
Mordan P., Wade C., 2008. Heterobranchia II: The Pulmonata., Phylogeny and evolution of the
Mollusca Ponder WF, Lindberg DR, University of California Press, Berkeley and Los
Angeles, CA, pp. 409–426.
Moroz L.L., 2009. On the Independent Origins of Complex Brains and Neurons. Brain Behav
Evol. 74, 177–190.
17
Moroz L.L., 2012. Phylogenomics meets neuroscience: How many times might complex brains
have evolved? Acta Biologica Hungarica. 63, 3–19.
Nielsen C., 1985. Animal phylogeny in the light of the trochaea theory. Biological Journal of the
Linnean Society. 25, 243–299.
Okusu A., Giribet G., 2003. New 18S rRNA sequences from neomenioid aplacophorans and the
possible origin of persistent exogenous contamination. Journal of Molluscan Studies. 69,
385.
Paps J., Bagunà J., Riutort M., 2009. Bilaterian phylogeny: A broad sampling of 13 nuclear
genes provides a new Lophotrochozoa phylogeny and supports a paraphyletic basal
Acoelomorpha. Molecular biology and evolution. 26, 2397–2406.
Passamaneck Y., Halanych K.M., 2006. Lophotrochozoan phylogeny assessed with LSU and
SSU data: evidence of lophophorate polyphyly. Molecular phylogenetics and evolution.
40, 20–28.
Passamaneck Y.J., Schander C., Halanych K.M., 2004. Investigation of molluscan phylogeny
using large-subunit and small-subunit nuclear rRNA sequences. Molecular Phylogenetics
and Evolution. 32, 25–38.
Peterson K.J., Eernisse D.J., 2001. Animal phylogeny and the ancestry of bilaterians: inferences
from morphology and 18S rDNA gene sequences. Evolution & Development. 3, 170–
205.
18
Peterson K.J., Lyons J.B., Nowak K.S., Takacs C.M., Wargo M.J., McPeek M.A., 2004.
Estimating metazoan divergence times with a molecular clock. Proceedings of the
National Academy of Sciences of the United States of America. 101, 6536 –6541.
Philippe H., Lartillot N., Brinkmann H., 2005. Multigene analyses of bilaterian animals
corroborate the monophyly of Ecdysozoa, Lophotrochozoa, and Protostomia. Molecular
biology and evolution. 22, 1246–1253.
Pojeta J., Runnegar B., 1976. The paleontology of rostroconch mollusks and the early history of
the phylum Mollusca. U.S. Geological Survey Professional Paper. 986, 1–88.
Ponder W., Lindberg D., 2008. Phylogeny and Evolution of the Mollusca. , University of
California Press, Berkeley and Los Angeles, CA.
Regier J.C., Shultz J.W., Zwick A., Hussey A., Ball B., Wetzer R., Martin J.W., Cunningham
C.W., 2010. Arthropod relationships revealed by phylogenomic analysis of nuclear
protein-coding sequences. Nature. 463, 1079–1083.
Rosenberg G., Tillier S., Tillier A., Kuncio G.S., Hanlon R.T., Masselot M., Williams C.J., 1997.
Ribosomal RNA Phylogeny of Selected major Clades in the Mollusca. Journal of
Molluscan Studies. 63, 301.
Ruiz-Trillo I., Paps J., Loukota M., Ribera C., Jondelius U., Baguñà J., Riutort M., 2002. A
phylogenetic analysis of myosin heavy chain type II sequences corroborates that Acoela
and Nemertodermatida are basal bilaterians. Proceedings of the National Academy of
Sciences. 99, 11246 –11251.
19
Ruiz-Trillo I., Riutort M., Littlewood D.T.J., Herniou E.A., Baguna J., 1999. Acoel flatworms:
earliest extant bilaterian metazoans, not members of Platyhelminthes. Science. 283,
1919–1923.
Runnegar B., Pojeta Jr J., 1974. Molluscan phylogeny: the paleontological viewpoint. Science.
186, 311–317.
Salvini-Plawen L. v., Steiner G., 1996. Synapomorphies and plesiomorphies in higher
classification of Mollusca., Origin and Evolutionary Radiation of the Mollusca, Oxford
University Press, Oxford, pp. 29–51.
Salvini-Plawen L., 1980. A reconsideration of systematics in the Mollusca (phylogeny and
higher classification). Malacologia: International Journal of Malacology. 19, 249–278.
Salvini-Plawen L., 1981. On the origin and evolution of the Mollusca. Atti Conv Lincei. 49,
235–293.
Salvini-Plawen L., 1985. Early evolution and the primitive groups., The Mollusca, Academic
Press, Orlando, pp. 59–150.
Salvini-Plawen L., 1990. Origin, phylogeny and classification of the phylum Mollusca. Iberus. 9,
1–33.
Salvini-Plawen L., 2003. On the phylogenetic significance of the aplacophoran Mollusca. Iberus.
21, 67–97.
20
Scheltema A.H., Taylor J.D., 1996. Phylogenetic position of Sipuncula, Mollusca and the
progenetic Aplacophora. Phylogenetic position of Sipuncula, Mollusca and the
progenetic Aplacophora. 53.
Scheltema A.H., 1993. Aplacophora as progenetic aculiferans and the coelomate origin of
mollusks as the sister taxon of Sipuncula. The Biological Bulletin. 184, 57–78.
Schrödl M., Jörger K.M., Klussman Kolb A., Wilson N.G., 2011. Bye bye “Opisthobranchia”! A
review on the contribution of mesopsammic sea slugs to euthyneuran systematics.
Thalassas: An international journal of marine sciences. 27, 101–112.
Sperling E.A., Peterson K.J., Pisani D., 2009. Phylogenetic-Signal Dissection of Nuclear
Housekeeping Genes Supports the Paraphyly of Sponges and the Monophyly of
Eumetazoa. Molecular Biology and Evolution. 26, 2261 –2274.
Telford M.J., 2008. Resolving Animal Phylogeny: A Sledgehammer for a Tough Nut?
Developmental Cell. 14, 457–459.
Todt C., Salvini-Plawen L., 2005. The digestive tract of Helicoradomenia (Solenogastres,
Mollusca), aplacophoran molluscs from the hydrothermal vents of the East Pacific Rise.
Invertebrate Biology. 124, 230–253.
Trueman E.R., Brown A.C., 1985. The mechanism of shell elevation in Haliotis (Mollusca:
Gastropoda) and a consideration of the evolution of the hydrostatic skeleton in Mollusca.
Journal of Zoology. 205, 585–594.
21
Wägele H., Klussmann-Kolb A., Vonnemann V., Medina M., 2008. Heterobranchia I: The
Opisthobranchia., Phylogeny and Evolution of the Mollusca, University of California
Press, Berkeley and Los Angeles, CA, pp. 385–408.
Waller T.R., 1998. Origin of the molluscan class Bivalvia and a phylogeny of major groups., The
Bivalvia: Half a Billion Years of Evolution, University of Calgary Press, Calgary,
Canada, pp. 1–47.
Wanninger A., Fuchs J., Haszprunar G., 2007. Anatomy of the serotonergic nervous system of an
entoproct creeping-type larva and its phylogenetic implications. Invertebrate Biology.
126, 268–278.
Wanninger A., 2009. Shaping the Things to Come: Ontogeny of Lophotrochozoan
Neuromuscular Systems and the Tetraneuralia Concept. The Biological Bulletin. 216,
293 –306.
White T.R., Conrad M.M., Tseng R., Balayan S., Golding R., Martins A.M. de F., Dayrat B.A.,
2011. Ten new complete mitochondrial genomes of pulmonates (Mollusca: Gastropoda)
and their impact on phylogenetic relationships. BMC Evolutionary Biology. 11, 295.
Wilson N.G., Huang D., Goldstein M.C., Cha H., Giribet G., Rouse G.W., 2009. Field collection
of Laevipilina hyalina McLean, 1979 from southern California, the most accessible living
monoplacophoran. J. Mollus. Stud. 75, 195–197.
Wilson N.G., Rouse G.W., Giribet G., 2010. Assessing the molluscan hypothesis Serialia
(Monoplacophora+ Polyplacophora) using novel molecular data. Molecular
phylogenetics and evolution. 54, 187–193.
22
Winnepenninckx B., Backeljau T., De Wachter R., 1996. Investigation of molluscan phylogeny
on the basis of 18S rRNA sequences. Molecular biology and evolution. 13, 1306–1317.
23
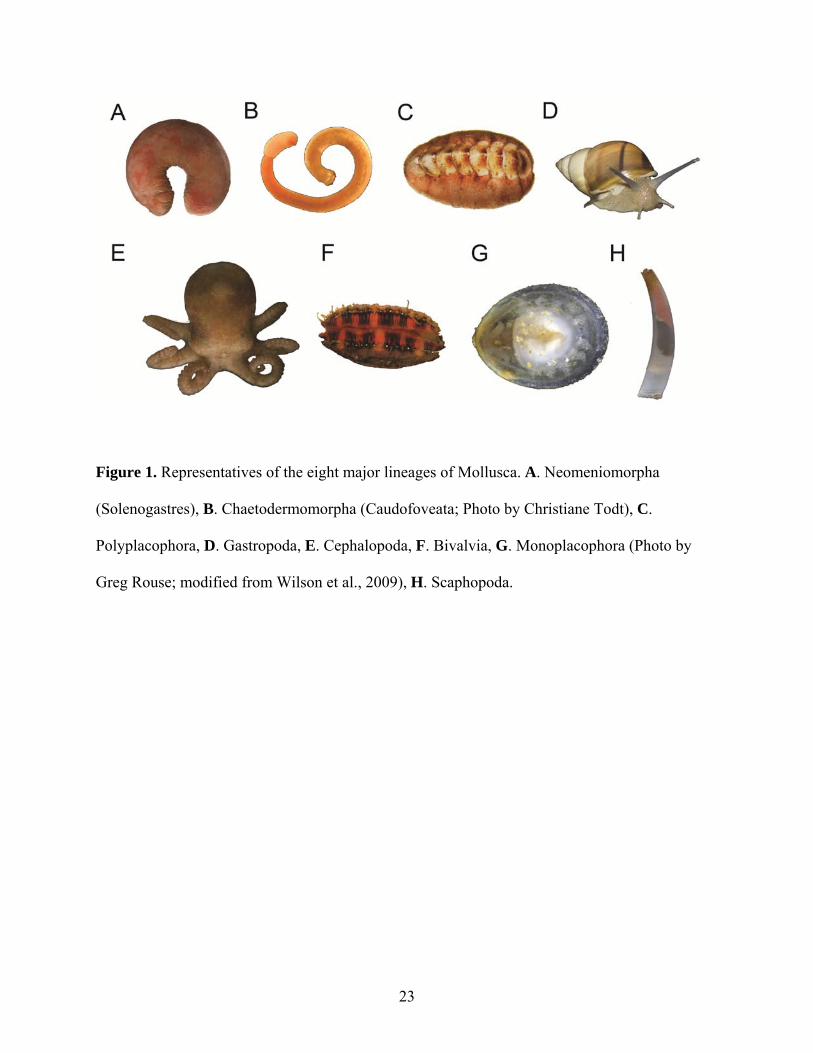
Figure 1. Representatives of the eight major lineages of Mollusca. A. Neomeniomorpha
(Solenogastres), B. Chaetodermomorpha (Caudofoveata; Photo by Christiane Todt), C.
Polyplacophora, D. Gastropoda, E. Cephalopoda, F. Bivalvia, G. Monoplacophora (Photo by
Greg Rouse; modified from Wilson et al., 2009), H. Scaphopoda.

24
Figure 2. Leading hypotheses of molluscan phylogeny. A, Adenopoda hypothesis placing
Chaetodermomorpha basal. B, Hepagastralia hypothesis placing Neomeniomorpha basal. C,
Aculifera hypothesis placing Aplacophora sister to Polyplacophora. D, Serialia hypothesis
allying Polyplacophora and Monoplacophora. E, Diasoma and Cyrtosoma hypotheses allying
bivalves to scaphopods and gastropods to cephalopods, respectively. F, Unnamed hypothesis,
allying scaphopods and cephalopods.
25
Chapter 2. Phylogenomics reveals deep molluscan relationships
2.1 Abstract
Evolutionary relationships among the eight major lineages of Mollusca have remained
unresolved despite their diversity and importance. Previous investigations of molluscan
phylogeny, based primarily on nuclear ribosomal gene sequences or morphological data have
been unsuccessful at elucidating these relationships. Recently, phylogenomic studies employing
dozens to hundreds of genes have greatly improved our understanding of deep animal
relationships. However, limited genomic resources spanning molluscan diversity has prevented
use of a phylogenomic approach. Here we use transcriptome and genome data from all major
lineages (except Monoplacophora) and recover a well-supported topology for Mollusca. Our
results strongly support the Aculifera hypothesis placing Polyplacophora (chitons) in a clade
with a monophyletic Aplacophora (worm-like molluscs). Additionally, within Conchifera, a
sister-taxon relationship between Gastropoda and Bivalvia is supported. This grouping has
received little consideration and contains most (>95%) molluscan species. Thus we propose the
node-based name Pleistomollusca. In light of these results, we examined the evolution of
morphological characters and found support for advanced cephalization and shells as possibly
having multiple origins within Mollusca.
2.2 Introduction
With over 100,000 described extant species in eight major lineages, Mollusca is the
second most speciose animal phylum. Many molluscs are economically important as food and
producers of pearls and shells while others cause economic damage as pests, biofoulers, and
26
invasive species. Molluscs are also biomedically important as models for the study of brain
organization, learning, and memory as well as vectors of parasites. Although shelled molluscs
have one of the best fossil records of any animal group, evolutionary relationships among major
molluscan lineages have been elusive (Haszprunar et al., 2008; Haszprunar and Wanninger,
2012).
Morphological disparity among the major lineages of Mollusca has prompted numerous
conflicting phylogenetic hypotheses (Figure 1) which were recently reviewed by Haszprunar et
al. (2008) and Kocot (2013). The vermiform Chaetodermomorpha (= Caudofoveata) and
Neomeniomorpha (= Solenogastres) traditionally have been considered to represent the
plesiomorphic state of Mollusca because of their “simple” internal morphology and lack of
shells. Whether these two lineages constitute a monophyletic group, Aplacophora (Scheltema,
1993), or a paraphyletic grade has been widely debated. Some workers have considered the
presence of sclerites a synapomorphy for a clade Aculifera, uniting Polyplacophora (chitons;
which have both sclerites and shells) and Aplacophora. In contrast, Polyplacophora has
alternatively been placed with Conchifera (Bivalvia, Cephalopoda, Gastropoda,
Monoplacophora, and Scaphopoda) in a clade called Testaria uniting the shelled molluscs.
Morphology has been interpreted to divide Conchifera into a gastropod/cephalopod clade
(Cyrtosoma) and a bivalve/scaphopod clade (Diasoma). Unfortunately, because of varying
interpretations of features as derived or plesiomorphic, a lack of clear synapomorphies, and often
unclear character homology, the ability of morphology to resolve such deep phylogenetic events
is limited.
Molecular investigations of molluscan phylogeny have relied primarily on nuclear
ribosomal gene sequences (18S and 28S), and have also offered little resolution. Maximum
27
likelihood (ML) analyses of 18S, 28S or both by Passamaneck et al. (2004) recovered most
major lineages monophyletic, but support at deeper nodes was generally weak. Subsequent
analyses of a combined dataset (18S, 28S, 16S, cytochrome c oxidase I, and histone H3) by
Giribet et al. (2006) yielded similar results to Passamaneck et al. (2004), namely that bivalves
were not monophyletic and support values at most deep nodes were low. Expanding on Giribet et
al. (2006), Wilson et al. (2010) supported a sister taxon relationship between chitons and
monoplacophorans (Serialia) but support at other deep nodes was generally low. Moreover,
Mollusca was not recovered monophyletic possibly due to contaminated neomenioid sequences
(Meyer et al., 2010).
Morphological and traditional molecular phylogenetic approaches have failed to robustly
reconstruct mollusc phylogeny. Notably, several recent phylogenomic studies (Dunn et al., 2008;
Struck et al., 2011) have significantly advanced our understanding of metazoan evolution by
employing sequences derived from genome and transcriptome data. With this approach,
numerous orthologous protein-coding genes can be identified and employed in phylogeny
reconstruction. Many of these genes are constitutively expressed and can be easily recovered
from even limited expressed sequence tag (EST) surveys. Additionally, these genes are usually
informative for inferring higher-level phylogeny because of their conserved nature due to their
functional importance.
2.3 Materials and Methods
2.3.1 Molecular techniques
Although Kevin Kocot led the data analysis, this was a collaborative project that involved data
collection by several different laboratories. Slightly different methods were used by the
28
Halanych, Lieb, Moroz and Todt labs to prepare cDNA for sequencing (Table 1). For the
Halanych lab taxa, total RNA was extracted from frozen or RNAlater-fixed tissue using TRIzol
(Invitrogen) and purified using the RNeasy kit (Qiagen) with on-column DNase digestion.
Specimens of Wirenia argentea were starved for approximately 2 months prior to RNA
extraction to reduce cnidarian contamination. First-strand cDNA was synthesized using the
SMART cDNA library construction kit (Clontech). Full-length cDNA was then amplified using
the Advantage 2 PCR system (Clontech) and normalized using the Trimmer-Direct kit
(Evrogen). Normalized cDNA was sent to The University of South Carolina Environmental
Genomics Core Facility (Columbia, SC, USA) for sequencing using 454 GS-FLX or Titanium
(Roche). For the Lieb Lab taxa, total RNA was extracted from fresh or liquid nitrogen frozen
tissue using TRIzol (Invitrogen) with DNase digestion using Nucleospin (Machery-Nagel).
First-strand cDNA was prepared by the Max Planck Institute for Molecular Genetics using the
Mini kit (Evrogen) followed by size selection with Chromaspin 1000 columns (Clontech). Full-
length cDNA was amplified using PCR and normalized using the Trimmer-Direct kit (Evrogen).
Normalized cDNA was sequenced using 454 Titanium (Roche). For the Moroz Lab taxa, total
RNA was extracted with RNAqueous (Life Technologies) and reverse transcribed to cDNA
using the Marathon cDNA amplification kit (BD Biosciences) and an oligo dT primer. Double-
stranded cDNA was digested with a restriction enzyme followed by adaptor ligation to both
ends. The adaptor ligated cDNA fragments were then amplified by PCR, purified, and sent to
The University of Florida Interdisciplinary Center for Biotechnology Research (Gainesville, FL,
USA) or SeqWright (Houston, TX, USA) for sequencing using 454 GS-FLX or Titanium. For
the Todt Lab taxa, total RNA which was extracted using TRIzol (Invitrogen). For Scutopus,
PolyA+ RNA was isolated using PolyATract (Promega) and for Wirenia, animals were starved
29
for approximately two months prior to total RNA isolation using the RNeasy kit (Qiagen) and
cDNA library construction using the Creator SMART cDNA Library construction kit (Clontech)
by GENterprise (Mainz, Germany) with directional cloning using a modified pSPORT vector.
Around 1,000 clones were sequenced for both taxa using an ABI 3730 (Applied Biosystems).
2.3.2 Sequence processing
The bioinformatic pipeline employed in this study is presented in Figure 2. Raw ESTs were
processed and assembled using the EST2uni pipeline (Forment et al., 2008). This software
removes low-quality regions with lucy (Chou and Holmes, 2001), removes vector with lucy and
SeqClean (http://compbio.dfci.harvard.edu/tgi/software), masks low complexity regions with
RepeatMasker (www.repeatmasker.org), and assembles contigs with CAP3 (Huang and Madan,
1999). Data on sequence quality were used by CAP3 when available. Unigenes were translated
with ESTScan (Lottaz et al., 2003) and sequences shorter than 100 AAs were deleted. Manual
BLAST searches of samples of unigenes for vector sequences as well as examination of contig
assembly diagrams generated by EST2uni indicated that these programs performed well at
removing vector and low-quality sequences and assembling contigs, respectively.
To reduce the amount of missing data per taxon, sequences from two or more closely
related taxa were combined to create the following 11 chimerical OTUs: Chitonida, Crassostrea,
Dreissena, Haliotis, Helicoidea, Loligo, Mytilus, Pectinidae, Pedicellina, Sipuncula, and
Venerupis.
2.3.3 Orthology assignment and dataset assembly
30
Orthologous gene (OG) identification employed HaMStR local 7 (Ebersberger et al., 2009),
which utilizes profile hidden Markov models (pHMMs) generated from completely sequenced
reference taxa in the InParanoid database34. Translated unigenes were searched against the 1,032
single-copy OGs of HaMStR’s “model organism” pHMMs derived from Homo, Ciona,
Drosophila, Caenorhabditis, and Saccharomyces. Translated unigenes matching an OG’s
pHMM were then compared to the proteome of Drosophila using BLASTP. If the Drosophila
protein contributing to the pHMM was the best BLASTP hit, the unigene was then placed in that
OG.
If one of the first or last 20 characters of an amino acid sequence was an X
(corresponding to a codon with an ambiguity, gap, or missing data), all characters between the X
and that end of the sequence were deleted and treated as missing data. This step was important as
ends of singletons were occasionally, but obviously, mistranslated. Each OG was aligned with
MAFFT (Katoh et al., 2005) using the default alignment strategy. Aligned OGs were then
manually inspected and subjected to trimming or deleting of partially mistranslated sequences,
screening for paralogs, and combining incomplete sequences from the same OTU into one, more
complete consensus sequence. These alignments were then trimmed with Aliscore and Alicut
(Kück, 2009; Kück et al., 2010) to remove regions with ambiguous alignment or little to no
phylogenetic signal. Lastly, any alignments less than 25 amino acids in length were discarded.
Maximum likelihood (ML) trees were inferred for each OG using RaxML 7.2.7
(Stamatakis, 2006) using the best-fitting AA substitution model as determined using the RAxML
amino acid substitution model selection Perl script. OGs with strongly supported deep nodes
suggesting the inclusion of paralogs were edited to delete obviously paralogous sequences or
31
discarded. To reduce missing data in the final matrices, only OGs with sequences from at least
ten molluscs were retained for analysis.
If an OG still possessed more than one sequence from one or more OTUs (inparalogs),
the sequence with the shortest average pairwise distance to all others was retained. Pairwise
distances were calculated using a gamma distribution with 4 rate categories as implemented in
SCaFoS37. If two or more sequences from the same taxon were >10% divergent, all sequences
from that taxon were discarded from that OG. To visualize the amount of data sampled for each
taxon, a gene sampling diagram (Figure 3) was created using MARE (http://mare.zfmk.de).
To evaluate our orthology determination method that utilized Drosophila as the primer
taxon, comparisons were made between Lottia sequences identified as orthologs to the
Drosophila sequences using our methods relative to orthologs identified using the InParanoid 7
database. This revealed only 6 instances in which both methods identified one or more Lottia
sequences as orthologs to a Drosophila sequence, but disagreed on which sequence was the
correct ortholog. There were 36 Drosophila genes for which InParanoid did not identify a Lottia
ortholog but our methods did. Alternatively, there were 6 Drosophila sequences for which our
methods did not identify a Lottia ortholog but InParanoid did. Although this may give the
impression that our methods are less stringent than those of InParanoid, manual examination of
these alignments revealed no obvious paralogous groups.
2.3.4 Contamination screening
Neomenioids have been reported to harbor nucleic acid contamination from their prey (Okusu
and Giribet, 2003). Given this, specimens of Wirenia argentea (which feed on cnidarians) were
starved for 2 months prior to RNA extraction. Gut content analysis of Neomenia sp. confirmed
32
that this undescribed Antarctic species also feeds on cnidarians. Therefore, Neomenia unigenes
were compared to predicted transcripts of Lottia and Nematostella using TBLASTX and
sequences with a lower E-value for Nematostella than Lottia (i.e., sequences more similar to a
sequence in the proteome of Nematostella than Lottia) were discarded. ML trees for each gene
were manually evaluated and any remaining cnidarian contamination in the neomenioid datasets
was removed by deleting sequences which either formed a clade with Nematostella or were part
of a polytomy that included Nematostella. Finally, Nematostella was included in analyses with
broad outgroup sampling to demonstrate that there is no obvious attraction between it and either
neomenioid.
2.3.5 Phylogenetic analyses
Phylogenetic analyses were conducted using ML in RAxML 7.2.7 (Stamatakis, 2006) and BI in
PhyloBayes 2.3 (Lartillot et al., 2009) on the Alabama Supercomputer Authority Dense Memory
Cluster (http://www.asc.edu/). For ML analyses, the best fitting AA substitution model for each
gene was determined using the RAxML model selection Perl script. This script tests the fit of
each available model of amino acid substitution by optimizing model parameters and branch
lengths on a JTT start tree for each OG. Additionally, for comparative purposes, ML analyses
using one model for the entire matrix were performed using the WAG + CAT + F and LG +
CAT + F models in RAxML and an approximately-ML analysis was performed using the JTT +
CAT model in FastTree 2.1 (Price et al., 2010). Topological robustness (i.e., nodal support) for
all ML analyses was assessed with 100 replicates of nonparametric bootstrapping. Stabilities of
OTUs among the bootstrapped trees were calculated using the leaf stability index in Phyutility
(Smith and Dunn, 2008). Competing hypotheses of mollusc phylogeny were evaluated using the
33
AU test (Shimodaira, 2002) with the best-fitting model for each partition. For all BI analyses, the
CAT model was employed to account for site-specific rate heterogeneity (Lartillot and Philippe,
2004). Unless otherwise noted, all BI analyses were conducted with five parallel chains run for
15,000 cycles each, with the first 5,000 trees discarded as burn-in. A 50% majority rule
consensus tree was computed from the remaining 10,000 trees from each chain. Topological
robustness was assessed using posterior probabilities. Maxdiff values below 0.3 indicated that all
chains in a run had converged.
2.3.6. Ancestral state reconstruction
Ancestral character state reconstruction was performed using an updated and modified version of
the morphological matrix of Haszprunar (2000) in Mesquite 2.74 (http://mesquiteproject.org/)
using maximum parsimony as the reconstruction method.
2.4 Results and Discussion
Here, we employed a phylogenomic approach to investigate evolutionary relationships
among the major lineages of Mollusca. High throughput transcriptome data were collected from
18 operational taxonomic units (OTUs; Table 1), and augmented with publicly available ESTs
and genomes (Table 2). To increase dataset completeness, data from closely related species were
combined in eleven cases, resulting in a total of 42 mollusc OTUs. Every major lineage of
Mollusca was represented in the dataset by at least two distantly related species, except for
monoplacophorans that live in deep marine habitats and could not be procured in adequate
condition for transcriptome analyses. Our bioinformatic pipeline identified 308 orthologous
genes suitable for concatenation and phylogenetic analyses totalling 84,614 amino acid (AA)
34
positions. Numerous analyses were performed (see below) but our main result is based on an
analysis using Annelida as the outgroup (Figure 4; main findings summarized in Figure 5).
To determine the appropriate outgroup to Mollusca, preliminary analyses including a
broad range of lophotrochozoans and the cnidarian Nematostella were conducted. Nematostella
was included to verify that neomenioid data did not contain cnidarian contamination. Maximum
likelihood (ML) analyses using the best-fitting model for each gene strongly supported Annelida
as the sister taxon of Mollusca (bootstrap support, bs = 100, Figure 6), whereas Bayesian
inference (BI) placed Entoprocta + Cycliophora sister to Mollusca with poor support (posterior
probability, pp = 0.62, Figure 7). Relationships among the major lineages of Mollusca were
consistent between analyses with multiple outgroups (Figures 6-7) or with only Annelida as the
outgroup (Figures 4, 8). Based on these results, Annelida was selected as outgroup for all other
analyses in order to reduce computational complexity and potential homoplasy from distant or
fast-evolving outgroups. This final data matrix including all 308 genes (Figure 3) had an average
percentage of genes sampled per taxon of 41% and an overall matrix completeness of 25.6%,
comparable to other major phylogenomic datasets (e.g., Dunn et al., 2008). ML and BI analyses
of this matrix yielded nearly identical topologies within Mollusca, except for relationships
among basal gastropods and placements of the sea slug Pleurobranchaea and the bivalve Mytilus
(Figures 4, 8). High leaf stability scores for all OTUs (Table 2) and strong support for most
nodes suggest all OTUs were represented by sufficient data to be reliably placed. Remarkably,
branch lengths were relatively uniform; cephalopods did not show long-branches as previously
reported in analyses of 18S and 28S (Passamaneck et al., 2004; Giribet et al., 2006; Meyer et al.,
2010; Wilson et al., 2010).
35
All major lineages of Mollusca were monophyletic with strong support (bs = 100%, pp =
1.00). Importantly, there was strong support at all deep nodes, although the node placing
Scaphopoda received moderate support in ML (bs = 72%) but strong support in BI (pp = 0.98). A
clade including Aplacophora and Polyplacophora was unequivocally supported (bs = 100%, pp =
1.00) and placed sister to Conchifera, consistent with the Aculifera hypothesis. Moreover, we
found strong support (bs = 100%, pp = 0.99) for a sister relationship between Neomeniomorpha
and Chaetodermomorpha, supporting the Aplacophora hypothesis but contrary to previous
molecular (Passamaneck et al., 2004; Giribet et al., 2006; Wilson et al., 2010) and morphological
(Haszprunar, 2000) studies. To evaluate alternatives to the Aculifera and Aplacophora
hypotheses, we employed Approximately Unbiased (AU) tests (Table 3). These tests rejected the
Testaria hypothesis which allies chitons with the other shelled molluscs (P < 0.02) and placement
of either aplacophoran taxon as sister to all other molluscs (both P < 0.01). Aculiferan
monophyly supports interpretation of the Palaeozoic taxa ‘Helminthochiton’ thraivensis and
Kulindroplax perissokomos as possessing features intermediate between chitons and
aplacophorans, and interpretation of dorsal, serially arranged calcareous structures as a possible
aculiferan synapomorphy (Sutton and Sigwart, 2012; Sutton et al., 2012). Specifically, the
chaetoderm Chaetoderma (Nielsen et al., 2007) and some, but not all, neomenioids (Scheltema
and Ivanov, 2002) possess dorsal, serially repeated sclerite-secreting regions during
development. Notably, chiton valves are not thought to be homologous to aculiferan sclerites
(Scheltema and Schander, 2006), although certain genes involved in patterning these structures
may be. Our results highlight a need for developmental gene expression studies of aculiferans to
address this issue.
36
Within a monophyletic Conchifera (bs = 100%, pp = 0.98), Gastropoda and Bivalvia
were supported as derived sister taxa (bs = 100%, pp = 1.0). Traditionally, a sister relationship
between gastropods and bivalves, which relates the two most speciose lineages of molluscs, has
received little consideration. However, this relationship has been recovered in molecular studies
with relatively limited taxon sampling across Mollusca (Dunn et al., 2008; Meyer et al., 2011).
Similarities between the veliger larvae of gastropods and lamellibranch bivalves have been long
recognized. Most notably, both possess larval retractor muscles and a velum muscle ring
(Wanninger and Haszprunar, 2002). Another potential synapomorphy is loss of the anterior
ciliary rootlet in locomotory cilia of gastropods and bivalves (Lundin et al., 2009). Because of
strong support for a gastropod/bivalve clade in most analyses and the implications of this
hypothesis for understanding molluscan evolution, we proposed the node-based name
Pleistomollusca, which includes the last common ancestor of Gastropoda and Bivalvia and all
descendents (Figure 5). Etymology of this name (pleistos from Greek for “most”) recognizes the
incredible species diversity of this clade of molluscs which we conservatively estimate to contain
>95% of described mollusc species.
Sister to Pleistomollusca is Scaphopoda (albeit with moderate support in ML; bs = 72%,
pp = 0.98) and Cephalopoda represents the sister taxon of all other conchiferan lineages. Despite
strong support values for a gastropod/bivalve clade, AU tests failed to reject Scaphopoda as
sister to any other conchiferan lineage (P > 0.5). Given the limited sampling for Scaphopoda,
additional data may help solidify its position. Nonetheless, all results presented here clearly
refute the traditional view of a sister relationship between gastropods and cephalopods
(Cyrtosoma; P < 0.01). Features thought to be diagnostic of this clade include a well-developed,
free head with cerebrally innervated eyes and a nervous system with visceral loop inwards of the
37
dorsoventral musculature6. However, these characters must be reinterpreted as either
symplesiomorphies lost in scaphopods and bivalves, or convergences. Notably, the high degree
of cephalization in gastropods and cephalopods has recently been suggested to have evolved
independently (Moroz, 2009, 2012).
The phylogenomic approach used here also holds promise for resolving relationships
within major lineages. For example, although caenogastropod phylogeny has been widely
debated, our broadly sampled caenogastropod subtree was strongly supported throughout (bs =
100, pp = 1.0) and consistent with one cladistic morphological analysis (Simone, 2000). We also
recovered opisthobranchs paraphyletic with respect to Pulmonata, agreeing with recent
morphological and molecular studies (Jӧrger et al., 2010). Additionally, our analyses confirm
bivalve monophyly with deposit-feeding protobranchs sister to filter-feeding lamellibranchs.
To further assess robustness of the reconstructed topology, we examined the influences of
matrix completeness, gene inclusion, and substitution models on phylogenetic reconstruction.
Analyses of the 200 and 100 best-sampled genes (Figures 9-10) recovered the same branching
order and relative level of support among major lineages as the full dataset. For gene inclusion,
matrices of only non-ribosomal (Figure 11) and only ribosomal protein genes (Figure 12) were
analyzed to address issues of different gene classes (e.g., ribosomal proteins) biasing
phylogenetic signal (Dunn et al., 2008). Support values for deep nodes inferred from non-
ribosomal protein genes were generally weak and Aplacophora, Polyplacophora and Bivalvia
were not recovered monophyletic. In contrast, analysis of only ribosomal protein genes
recovered all major lineages monophyletic with strong support in BI but moderate support for
most deep nodes in ML (see also Meyer et al. 2011). Although ribosomal protein and non-
ribosomal protein genes appear to be contributing different amounts of phylogenetic signal,
38
support for most nodes was greater when all gene classes were included, in accordance with
previous phylogenomic studies (Dunn et al., 2008; Struck et al., 2011). We also performed an
analysis based on very conservative orthology determination using only the 243 genes for which
our method and InParanoid identified the same Lottia sequence as orthologous to the primer
taxon (Drosophila) sequence (see Methods). Branching order (Figure 13) was identical to the
tree based on all 308 genes (Figure 4). Our ML analyses differ from other phylogenomic studies
by using gene-specific AA substitution models rather than a single model across the entire
matrix. Thus, for comparative reasons, we also ran single-model ML analyses using the WAG +
CAT + F model (Figure 14) and the LG + CAT + F model (Figure 15). These analyses yielded
the same relationships as the ML analysis using the best-fitting model for each gene (Figure 8)
with similar overall support in all three analyses. We also assessed the effect of model selection
by performing a BI analysis using the CAT-GTR model on the dataset of the 100 best-sampled
genes (Figure 10); this model is too computationally intensive for the full 308 gene dataset.
Except for the placement of Pleurobranchaea, this analysis yielded the same branching order as
the analysis using the CAT model (Figure 4) with similar support values. Finally, even an
approximately-ML analysis (Figure 16), which is less computationally intensive, yielded the
same relationships among major lineages as the fully parameterized ML analysis.
A primary goal of resolving molluscan phylogeny is to improve our understanding of
their early evolutionary history. Perhaps more than any other animal group, understanding of
molluscan early evolution has been constrained by the notion of a generalized bauplan or
“archetype” which is still propagated by some invertebrate zoology textbooks. Arguably, such a
viewpoint has hindered our ability to consider how individual characters have evolved within
Mollusca. Using a modified version of the morphological character matrix of Haszprunar (2000),
39
we performed ancestral state reconstruction using maximum parsimony and a simplified
topology based on our results (Figure 5) to infer ancestral states for 60 characters across
Mollusca (Table 4). Even though monoplacophoran transcriptome data were unavailable herein,
we were able to evaluate how placement of Monoplacophora influences our understanding of
early molluscan evolution. Ancestral state reconstruction of most characters for the last common
ancestor of Mollusca was unaffected by the placement of monoplacophorans. We considered
three possibilities: 1) Monoplacophora basal within Conchifera; 2) sister to Polyplacophora, and;
3) absent from the analysis. In all three cases, only 6 out of 60 characters were influenced (Table
5). For example, ancestral state reconstruction for shell(s) secreted by a shell gland and
periostracum changed between absent (Monoplacophora basal conchiferan) and equivocal
(Monoplacophora sister to Polyplacophora, or not considered).
Results of these ancestral state reconstructions shed light on the early evolution of
Mollusca. Odontogriphus, a Middle Cambrian form hypothesized to be a stem-group mollusc,
exhibited character states consistent with our reconstructions (ventral muscular foot, dorsal
cuticular mantle, mantle cavity containing ctenidia or gills, and regionalized gut) (Caron et al.,
2006). Ancestral state reconstruction based our results suggests that a ventral muscular foot,
dorsal cuticularized mantle, mantle cavity containing ctenidia, and regionalized gut are
plesiomorphic for Mollusca. However, for some characters, results of the ancestral state
reconstruction analyses are ambiguous or in contrast with other studies. For example, ancestral
state reconstruction suggested that the plesiomorphic condition of the molluscan radula is broad
and rasping with multiple teeth per row (polystichous) attached to a flexible radular membrane
supported by muscular and cartilage-like bolsters as in chitons and most conchiferans (see
Scheltema et al., (2003) and references therein). In contrast, two putative stem-group molluscs,
40
Odontogriphus and Wiwaxia have been interpreted to have had a narrow, distichous radula like
that found in most aplacophorans (Scheltema et al., 2003; Caron et al., 2006) suggesting that a
distichous radula is plesiomorphic for Mollusca. Under this scenario, our results would suggest
that chitons and conchiferans appear to have independently evolved broad, rasping radulae while
most aplacophorans have retained the plesiomorphic state. However, recently Smith (2012)
examined the feeding apparatuses of over 300 specimens of Odontogriphus and Wiwaxia using
backscatter electron microscopy and presented a dramatically different reconstruction of the
radulae of these taxa. Smith found that Odontogriphus and Wiwaxia have two or three rows of
teeth each with a single medial tooth flanked on either side by multiple, separate shoehorn-
shaped teeth. Thus, Odontogriphus and Wiwaxia possessed a polystichous radula more like that
of chitons and conchiferans than that of most aplacophorans.
The origin and evolution of molluscan epidermal hardparts (shells and sclerites) is
another contentious issue. Although aculiferan sclerites, chiton valves, and conchiferan shells are
all calcareous secretions of the mantle, developmental and structural differences indicate that
these structures are not homologous (Scheltema and Schander, 2006). Sclerites are only present
in aculiferans, and shells secreted by a shell gland are only present in conchiferans. Moreover,
fossil taxa do not help clarify the plesiomorphic state of the molluscan scleritome as
Odontogriphus lacked both sclerites and shells (Caron et al., 2006), Wiwaxia had uncalcified,
chitinous sclerites, and other putative stem-group molluscs had calcareous sclerites and/or shells
(Lieb and Todt, 2008). Therefore, organization of the ancestral scleritome, if present, remains
ambiguous.
In summary, our robustly supported evolutionary framework for Mollusca consists of two
major clades: Aculifera, which includes a monophyletic Aplacophora sister to Polyplacophora,
41
and Conchifera, including a gastropod/bivalve clade we term Pleiostomollusca.
Neomeniomorpha was not placed as the basal-most molluscan lineage as previously suggested
nor is the Testaria hypothesis supported. Thus, several aplacophoran features commonly argued
to be molluscan plesiomorphies (e.g., non-muscular foot, organization of midgut, primarily
distichous radula without subradular membrane) are reinterpreted as aplacophoran
synapomorphies, while others are reinterpreted as neomenioid apomorphies (e.g., prepedal cirri,
pericalymma-type larva). Within Conchifera, our results show that gastropods are sister to
bivalves (not cephalopods), a result that has important implications for molluscan model
systems. Also, possible independent evolution of highly cephalized morphologies in gastropods
and cephalopods suggests additional work addressing neural features across conchiferans is
needed (Moroz, 2009, 2012).
2.5 References
Caron J.B., Scheltema A., Schander C., Rudkin D., 2006. A soft-bodied mollusc with radula
from the Middle Cambrian Burgess Shale. Nature. 442, 159–163.
Chou H.-H., Holmes M.H., 2001. DNA sequence quality trimming and vector removal.
Bioinformatics. 17, 1093 –1104.
Dunn C.W., Hejnol A., Matus D.Q., Pang K., Browne W.E., Smith S.A., Seaver E., Rouse G.W.,
Obst M., Edgecombe G.D., others, 2008. Broad phylogenomic sampling improves
resolution of the animal tree of life. Nature. 452, 745–749.
Ebersberger I., Strauss S., Von Haeseler A., 2009. HaMStR: Profile hidden markov model based
search for orthologs in ESTs. BMC Evolutionary Biology. 9, 157.
42
Forment J., Gilabert F., Robles A., Conejero V., Nuez F., Blanca J., 2008. EST2uni: an open,
parallel tool for automated EST analysis and database creation, with a data mining web
interface and microarray expression data integration. BMC Bioinformatics. 9, 5.
Giribet G., Okusu A., Lindgren A.R., Huff S.W., Schrödl M., Nishiguchi M.K., 2006. Evidence
for a clade composed of molluscs with serially repeated structures: Monoplacophorans
are related to chitons. .
Haszprunar G., Schander C., Halanych K., 2008. Relationships of Higher Molluscan Taxa.,
Phylogeny and Evolution of the Mollusca, University of California Press, Berkeley and
Los Angeles, CA, pp. 19–32.
Haszprunar G., Wanninger A., 2012. Molluscs. Current Biology. 22, R510–R514.
Haszprunar G., 2000. Is the Aplacophora monophyletic? A cladistic point of view. American
Malacological Bulletin. 15, 115–130.
Huang X., Madan A., 1999. CAP3: A DNA Sequence Assembly Program. Genome Research. 9,
868 –877.
Jӧrger K., Stoger I., Kano Y., Fukuda H., Knebelsberger T., Schrodl M., 2010. On the origin of
Acochlidia and other enigmatic euthyneuran gastropods, with implications for the
systematics of Heterobranchia. BMC Evolutionary Biology. 10, 323.
Katoh K., Kuma K., Toh H., Miyata T., 2005. MAFFT version 5: improvement in accuracy of
multiple sequence alignment. Nucleic Acids Research. 33, 511 –518.
43
Kocot K.M., 2013. Recent advances and unanswered questions in deep molluscan phylogenetics.
American Malacological Bulletin. 31, 1–14.
Kück P., Meusemann K., Dambach J., Thormann B., Von Reumont B.M., Wägele J.W., Misof
B., 2010. Parametric and non-parametric masking of randomness in sequence alignments
can be improved and leads to better resolved trees. Frontiers in Zoology. 7, 1–12.
Kück P., 2009. ALICUT: a PerlScript which cuts ALISCORE identified RSS. Department of
Bioinformatics, Zoologisches Forschungsmuseum A. Koenig (ZFMK), Bonn, Germany,
version. 2, .
Lartillot N., Lepage T., Blanquart S., 2009. PhyloBayes 3: a Bayesian software package for
phylogenetic reconstruction and molecular dating. Bioinformatics. 25, 2286.
Lartillot N., Philippe H., 2004. A Bayesian mixture model for across-site heterogeneities in the
amino-acid replacement process. Molecular biology and evolution. 21, 1095.
Lieb B., Todt C., 2008. Hemocyanin in mollusks–a molecular survey and new data on
hemocyanin genes in Solenogastres and Caudofoveata. Molecular phylogenetics and
evolution. 49, 382–385.
Lottaz C., Iseli C., Jongeneel C.V., Bucher P., 2003. Modeling sequencing errors by combining
Hidden Markov models. Bioinformatics. 19, ii103–ii112.
Lundin K., Schander C., Todt C., 2009. Ultrastructure of epidermal cilia and ciliary rootlets in
Scaphopoda. Journal of Molluscan Studies. 75, 69–73.
44
Meyer A., Todt C., Mikkelsen N., Lieb B., 2010. Fast evolving 18S rRNA sequences from
Solenogastres (Mollusca) resist standard PCR amplification and give new insights into
mollusk substitution rate heterogeneity. BMC Evolutionary Biology. 10, 70.
Meyer A., Witek A., Lieb B., 2011. Selecting ribosomal protein genes for invertebrate
phylogenetic inferences: how many genes to resolve the Mollusca? Methods in Ecology
and Evolution. 2, 34–42.
Moroz L.L., 2009. On the Independent Origins of Complex Brains and Neurons. Brain Behav
Evol. 74, 177–190.
Moroz L.L., 2012. Phylogenomics meets neuroscience: How many times might complex brains
have evolved? Acta Biologica Hungarica. 63, 3–19.
Nielsen C., Haszprunar G., Ruthensteiner B., Wanninger A., 2007. Early development of the
aplacophoran mollusc Chaetoderma. Acta Zoologica. 88, 231–247.
Okusu A., Giribet G., 2003. New 18S rRNA sequences from neomenioid aplacophorans and the
possible origin of persistent exogenous contamination. Journal of Molluscan Studies. 69,
385.
Passamaneck Y.J., Schander C., Halanych K.M., 2004. Investigation of molluscan phylogeny
using large-subunit and small-subunit nuclear rRNA sequences. Molecular Phylogenetics
and Evolution. 32, 25–38.
Price M.N., Dehal P.S., Arkin A.P., 2010. FastTree 2 – Approximately Maximum-Likelihood
Trees for Large Alignments. PLoS ONE. 5, e9490.
45
Scheltema A., Schander C., 2006. Exoskeletons: Tracing Molluscan Evolution. Venus. 65, 19–
26.
Scheltema A.H., Ivanov D.L., 2002. An aplacophoran postlarva with iterated dorsal groups of
spicules and skeletal similarities to Paleozoic fossils. Invertebrate Biology. 121, 1–10.
Scheltema A.H., Kerth K., Kuzirian A.M., 2003. Original molluscan radula: comparisons among
Aplacophora, Polyplacophora, Gastropoda, and the Cambrian fossil Wiwaxia corrugata.
Journal of Morphology. 257, 219–245.
Scheltema A.H., 1993. Aplacophora as progenetic aculiferans and the coelomate origin of
mollusks as the sister taxon of Sipuncula. The Biological Bulletin. 184, 57–78.
Shimodaira H., 2002. An approximately unbiased test of phylogenetic tree selection. 51, 492–
508.
Simone L.R.L., 2000. Filogenia das superfamílias de Caenogastropoda (Mollusca) com base em
morfologia comparativa. .
Smith M.R., 2012. Mouthparts of the Burgess Shale fossils Odontogriphus and Wiwaxia:
implications for the ancestral molluscan radula. Proceedings of the Royal Society B:
Biological Sciences. 279, 4287–4295.
Smith S.A., Dunn C.W., 2008. Phyutility: a phyloinformatics tool for trees, alignments and
molecular data. Bioinformatics. 24, 715 –716.
Stamatakis A., 2006. RAxML-VI-HPC: maximum likelihood-based phylogenetic analyses with
thousands of taxa and mixed models. Bioinformatics. 22, 2688.
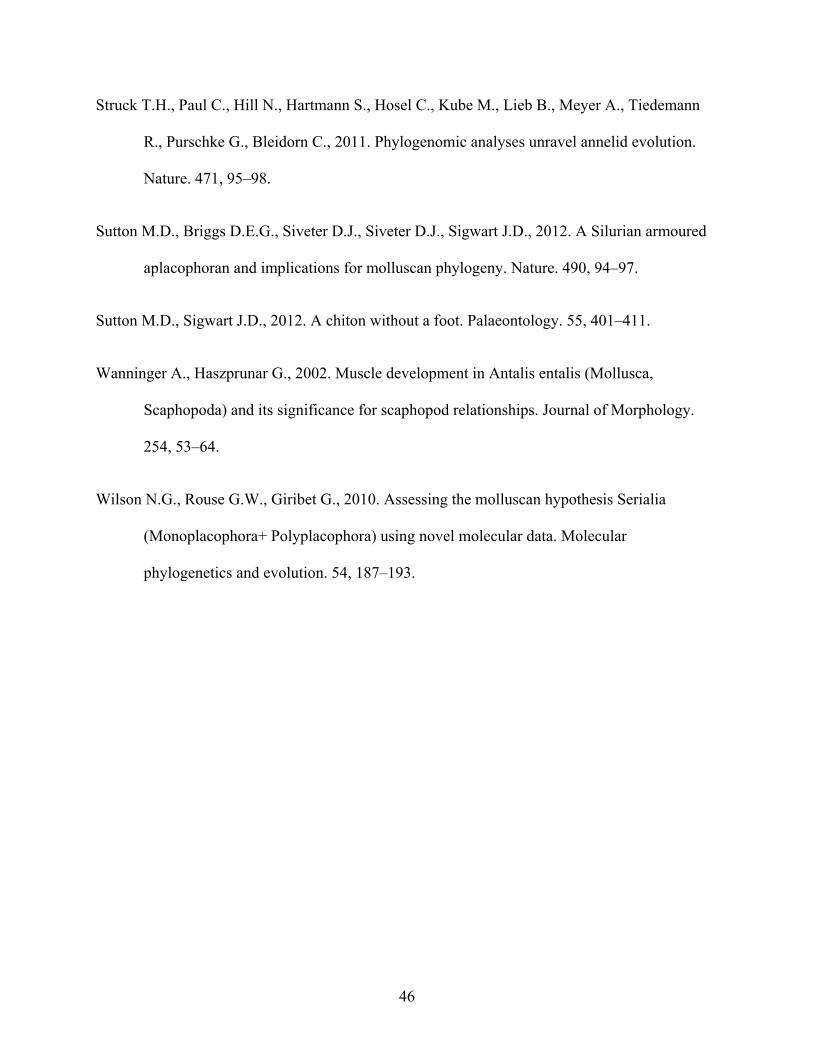
46
Struck T.H., Paul C., Hill N., Hartmann S., Hosel C., Kube M., Lieb B., Meyer A., Tiedemann
R., Purschke G., Bleidorn C., 2011. Phylogenomic analyses unravel annelid evolution.
Nature. 471, 95–98.
Sutton M.D., Briggs D.E.G., Siveter D.J., Siveter D.J., Sigwart J.D., 2012. A Silurian armoured
aplacophoran and implications for molluscan phylogeny. Nature. 490, 94–97.
Sutton M.D., Sigwart J.D., 2012. A chiton without a foot. Palaeontology. 55, 401–411.
Wanninger A., Haszprunar G., 2002. Muscle development in Antalis entalis (Mollusca,
Scaphopoda) and its significance for scaphopod relationships. Journal of Morphology.
254, 53–64.
Wilson N.G., Rouse G.W., Giribet G., 2010. Assessing the molluscan hypothesis Serialia
(Monoplacophora+ Polyplacophora) using novel molecular data. Molecular
phylogenetics and evolution. 54, 187–193.
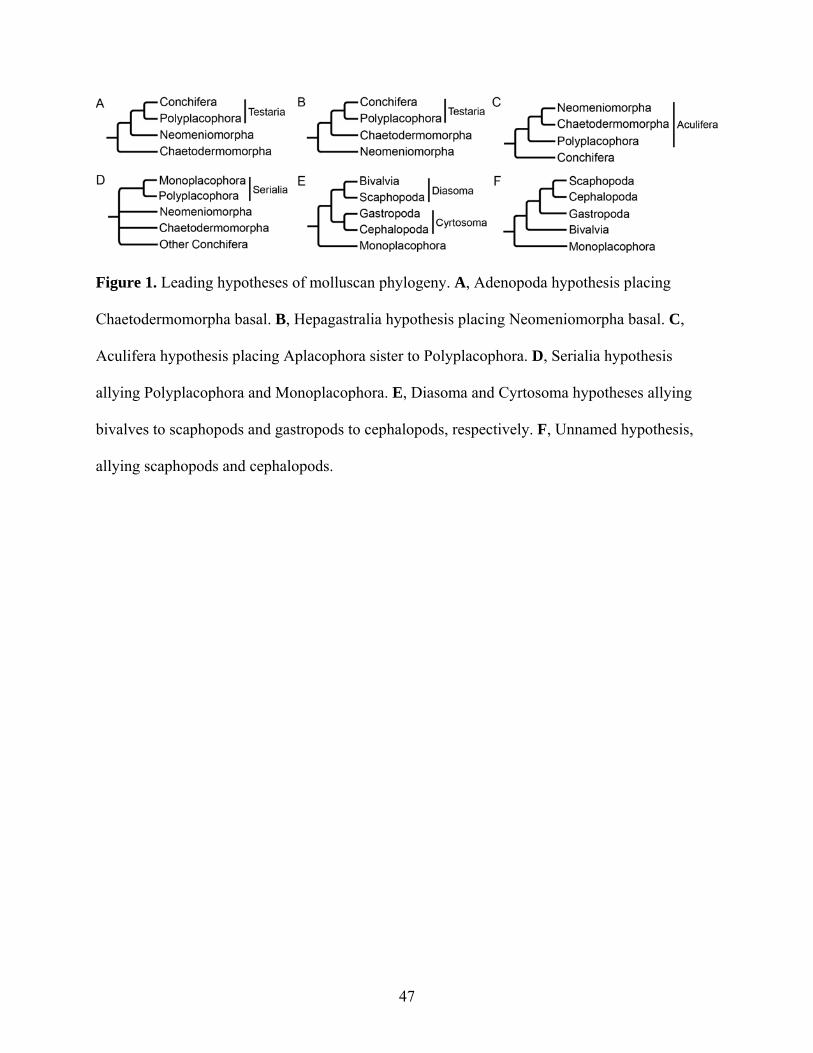
47
Figure 1. Leading hypotheses of molluscan phylogeny. A, Adenopoda hypothesis placing
Chaetodermomorpha basal. B, Hepagastralia hypothesis placing Neomeniomorpha basal. C,
Aculifera hypothesis placing Aplacophora sister to Polyplacophora. D, Serialia hypothesis
allying Polyplacophora and Monoplacophora. E, Diasoma and Cyrtosoma hypotheses allying
bivalves to scaphopods and gastropods to cephalopods, respectively. F, Unnamed hypothesis,
allying scaphopods and cephalopods.
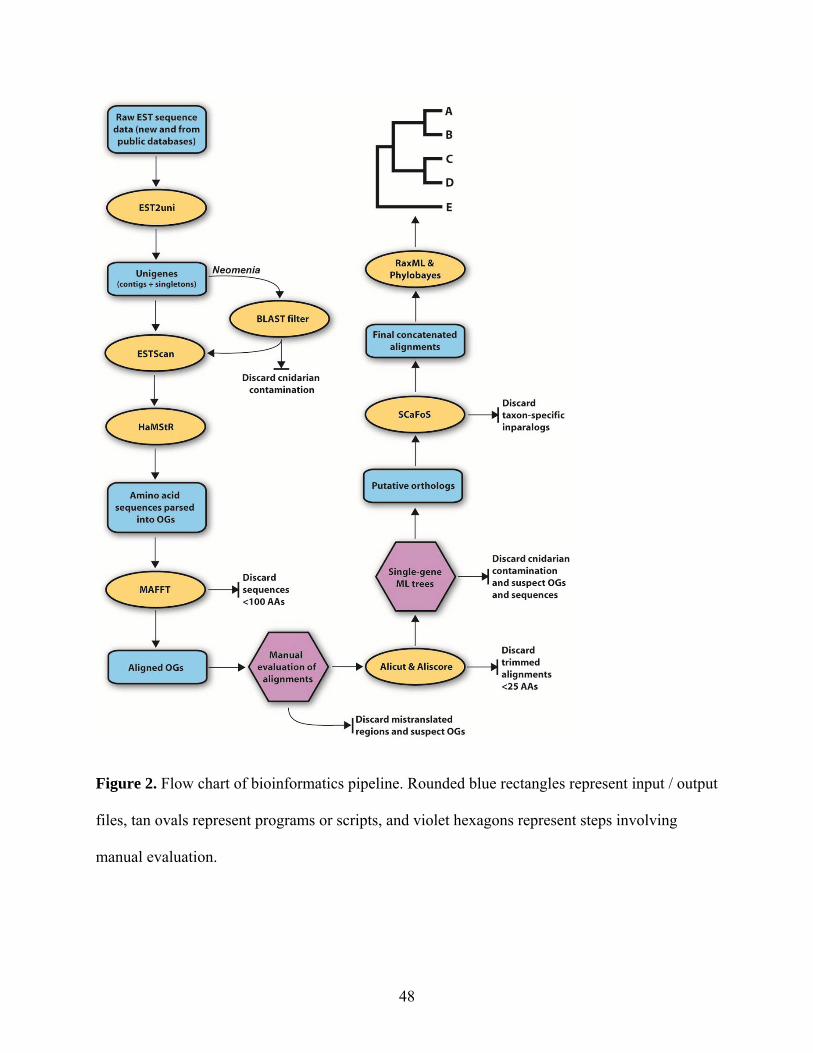
48
Figure 2. Flow chart of bioinformatics pipeline. Rounded blue rectangles represent input / output
files, tan ovals represent programs or scripts, and violet hexagons represent steps involving
manual evaluation.
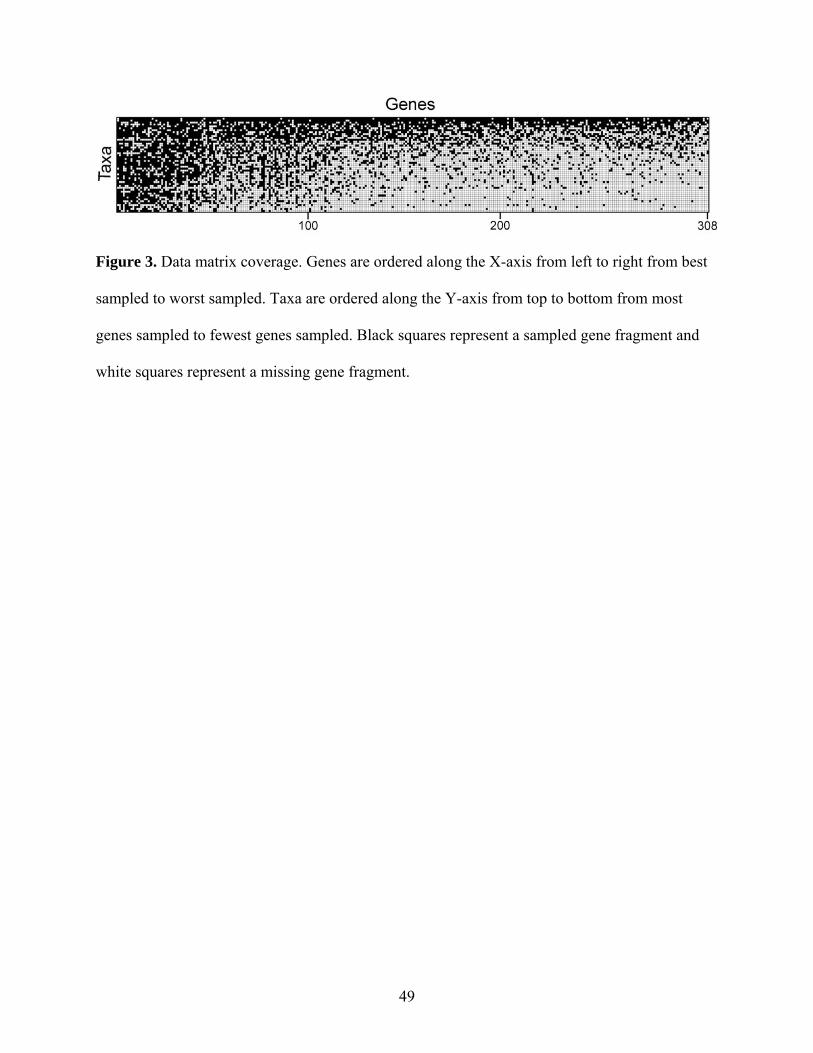
49
Figure 3. Data matrix coverage. Genes are ordered along the X-axis from left to right from best
sampled to worst sampled. Taxa are ordered along the Y-axis from top to bottom from most
genes sampled to fewest genes sampled. Black squares represent a sampled gene fragment and
white squares represent a missing gene fragment.
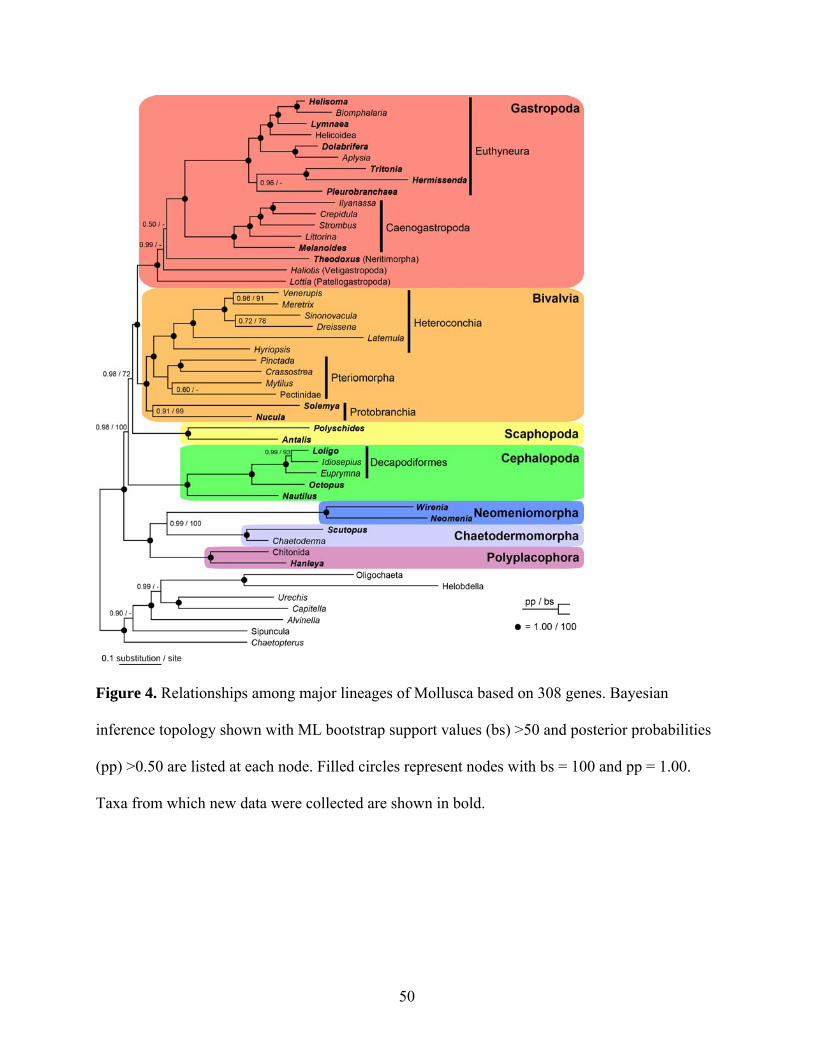
50
Figure 4. Relationships among major lineages of Mollusca based on 308 genes. Bayesian
inference topology shown with ML bootstrap support values (bs) >50 and posterior probabilities
(pp) >0.50 are listed at each node. Filled circles represent nodes with bs = 100 and pp = 1.00.
Taxa from which new data were collected are shown in bold.
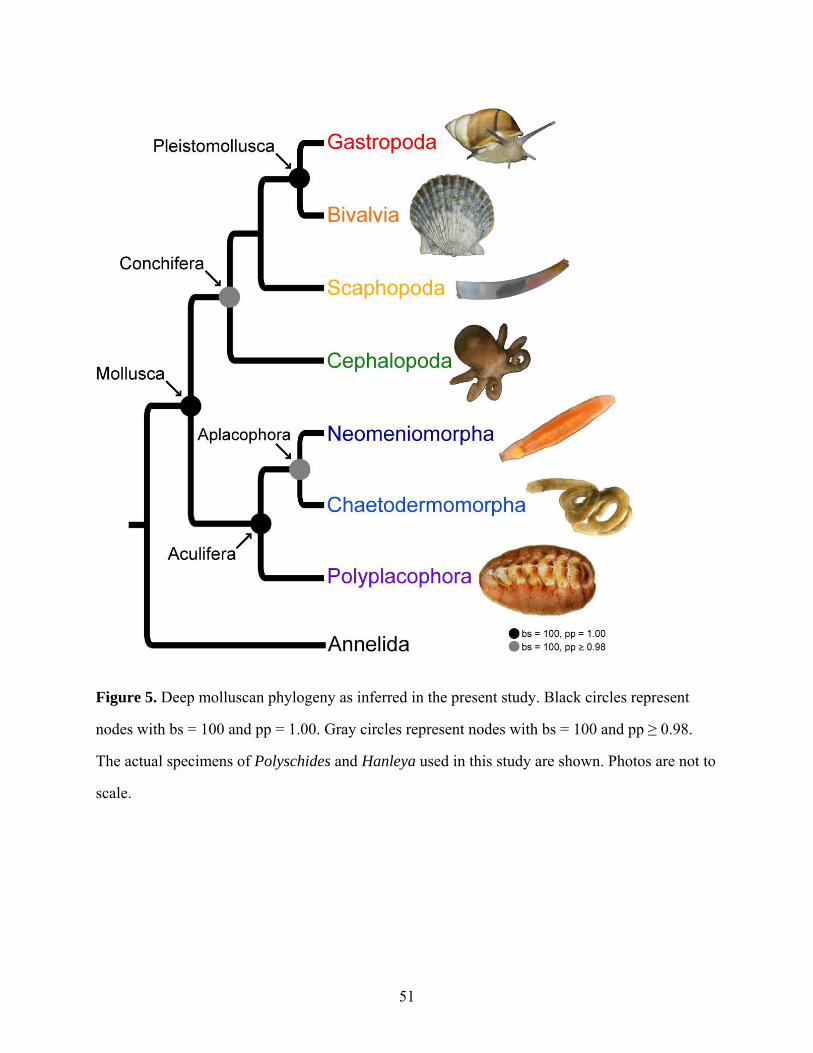
51
Figure 5. Deep molluscan phylogeny as inferred in the present study. Black circles represent
nodes with bs = 100 and pp = 1.00. Gray circles represent nodes with bs = 100 and pp ≥ 0.98.
The actual specimens of Polyschides and Hanleya used in this study are shown. Photos are not to
scale.
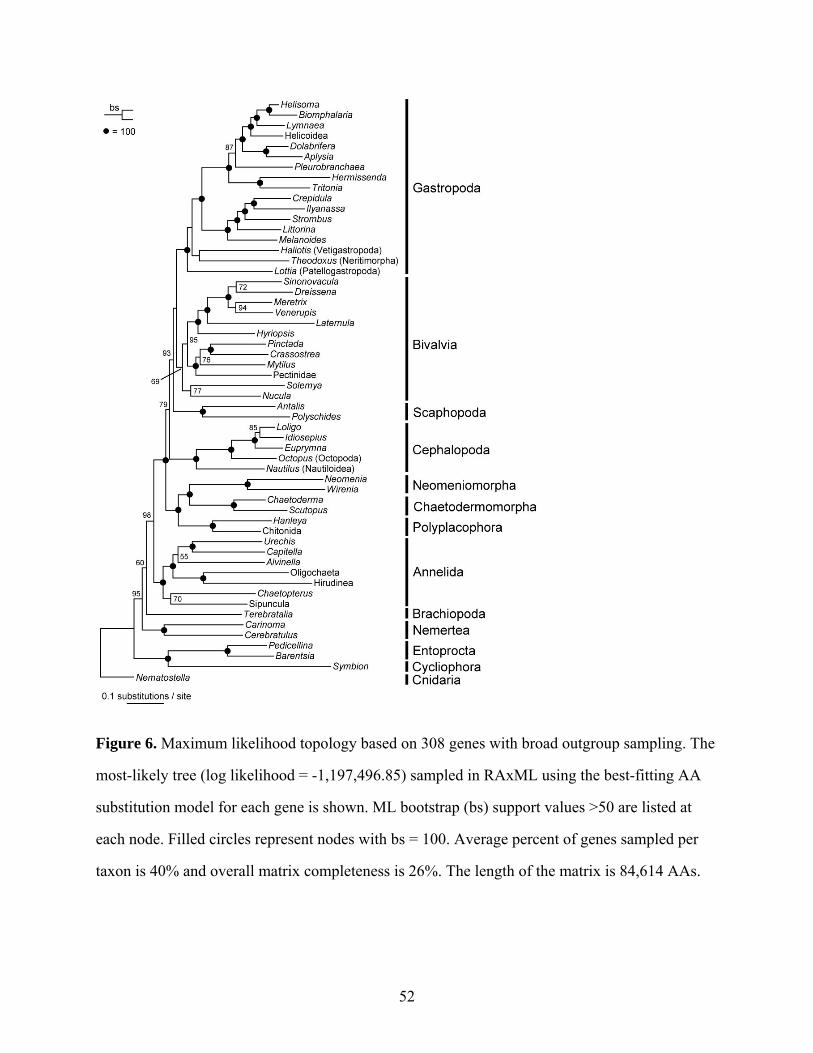
52
Figure 6. Maximum likelihood topology based on 308 genes with broad outgroup sampling. The
most-likely tree (log likelihood = -1,197,496.85) sampled in RAxML using the best-fitting AA
substitution model for each gene is shown. ML bootstrap (bs) support values >50 are listed at
each node. Filled circles represent nodes with bs = 100. Average percent of genes sampled per
taxon is 40% and overall matrix completeness is 26%. The length of the matrix is 84,614 AAs.
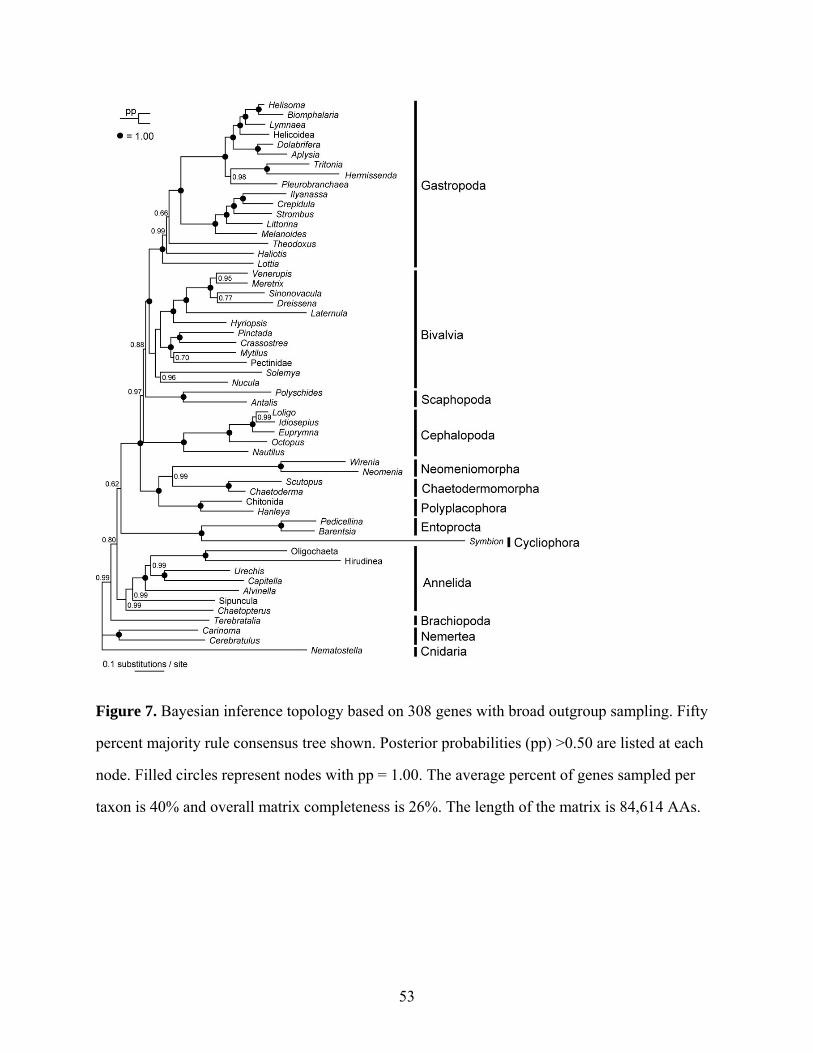
53
Figure 7. Bayesian inference topology based on 308 genes with broad outgroup sampling. Fifty
percent majority rule consensus tree shown. Posterior probabilities (pp) >0.50 are listed at each
node. Filled circles represent nodes with pp = 1.00. The average percent of genes sampled per
taxon is 40% and overall matrix completeness is 26%. The length of the matrix is 84,614 AAs.
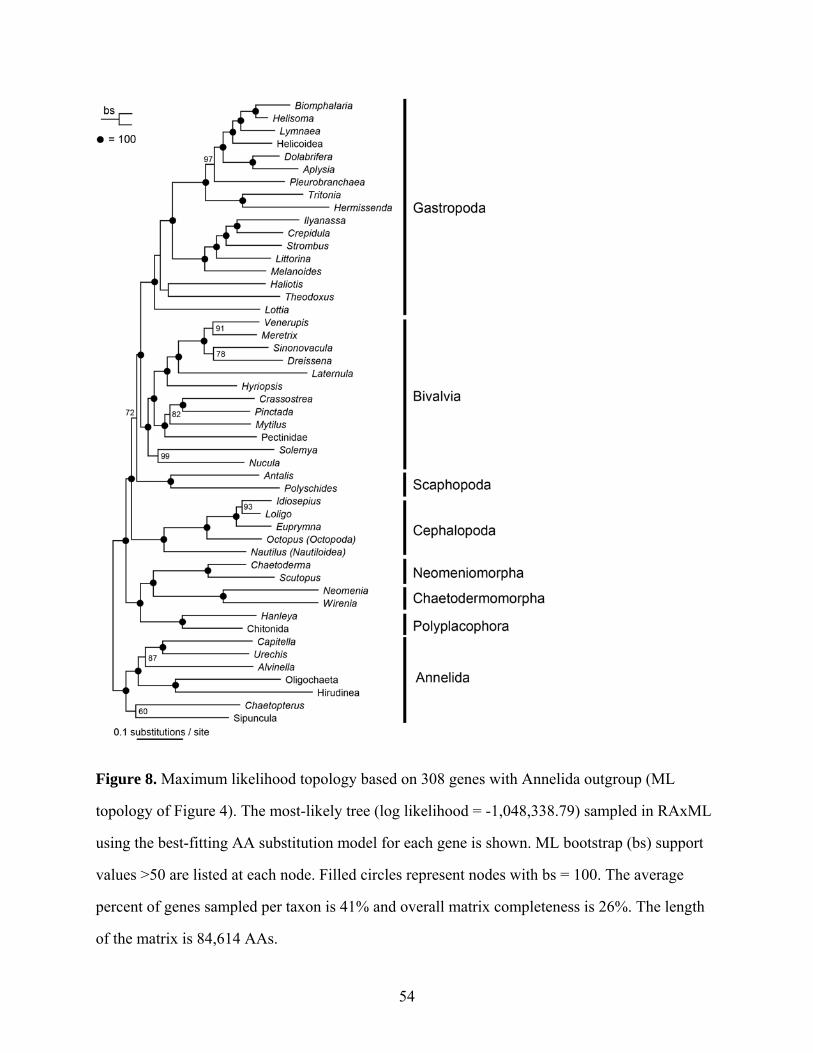
54
Figure 8. Maximum likelihood topology based on 308 genes with Annelida outgroup (ML
topology of Figure 4). The most-likely tree (log likelihood = -1,048,338.79) sampled in RAxML
using the best-fitting AA substitution model for each gene is shown. ML bootstrap (bs) support
values >50 are listed at each node. Filled circles represent nodes with bs = 100. The average
percent of genes sampled per taxon is 41% and overall matrix completeness is 26%. The length
of the matrix is 84,614 AAs.
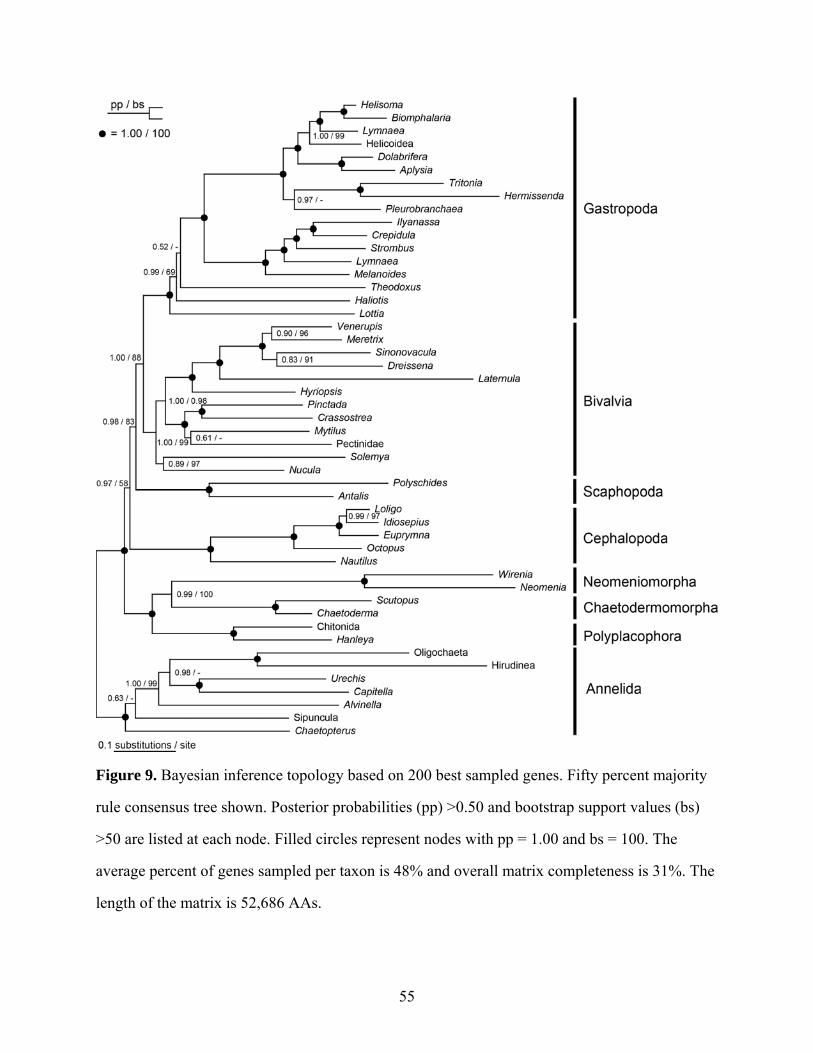
55
Figure 9. Bayesian inference topology based on 200 best sampled genes. Fifty percent majority
rule consensus tree shown. Posterior probabilities (pp) >0.50 and bootstrap support values (bs)
>50 are listed at each node. Filled circles represent nodes with pp = 1.00 and bs = 100. The
average percent of genes sampled per taxon is 48% and overall matrix completeness is 31%. The
length of the matrix is 52,686 AAs.
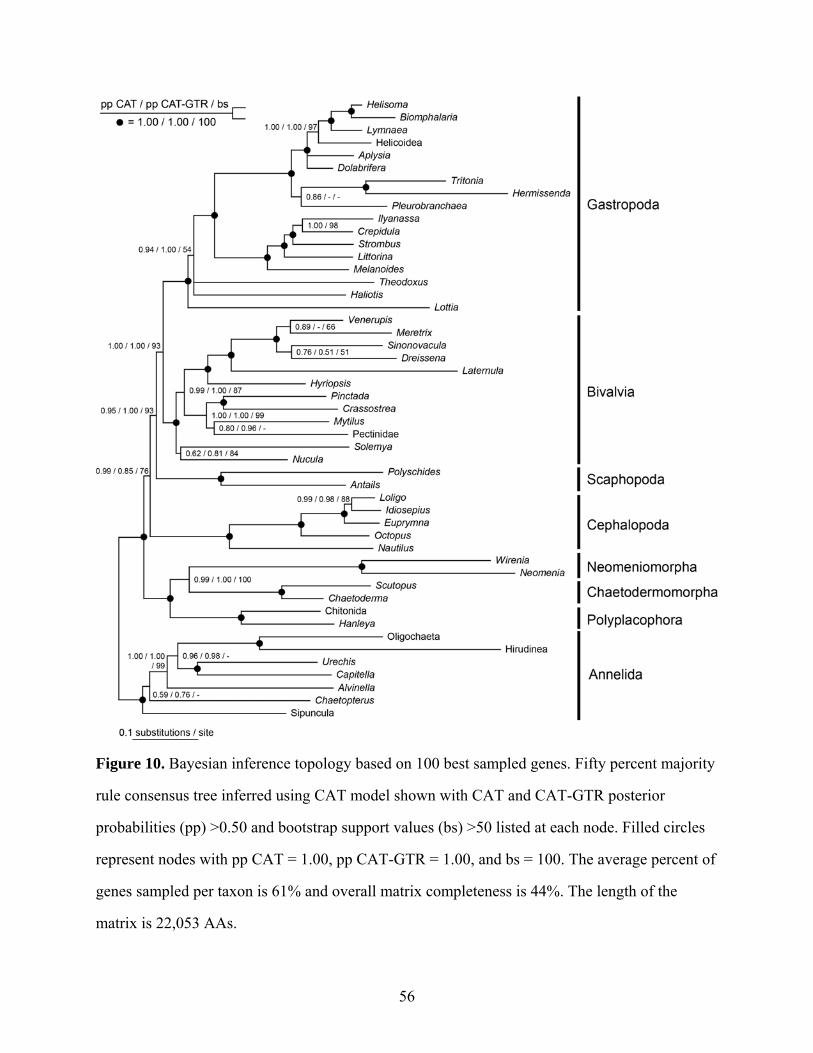
56
Figure 10. Bayesian inference topology based on 100 best sampled genes. Fifty percent majority
rule consensus tree inferred using CAT model shown with CAT and CAT-GTR posterior
probabilities (pp) >0.50 and bootstrap support values (bs) >50 listed at each node. Filled circles
represent nodes with pp CAT = 1.00, pp CAT-GTR = 1.00, and bs = 100. The average percent of
genes sampled per taxon is 61% and overall matrix completeness is 44%. The length of the
matrix is 22,053 AAs.
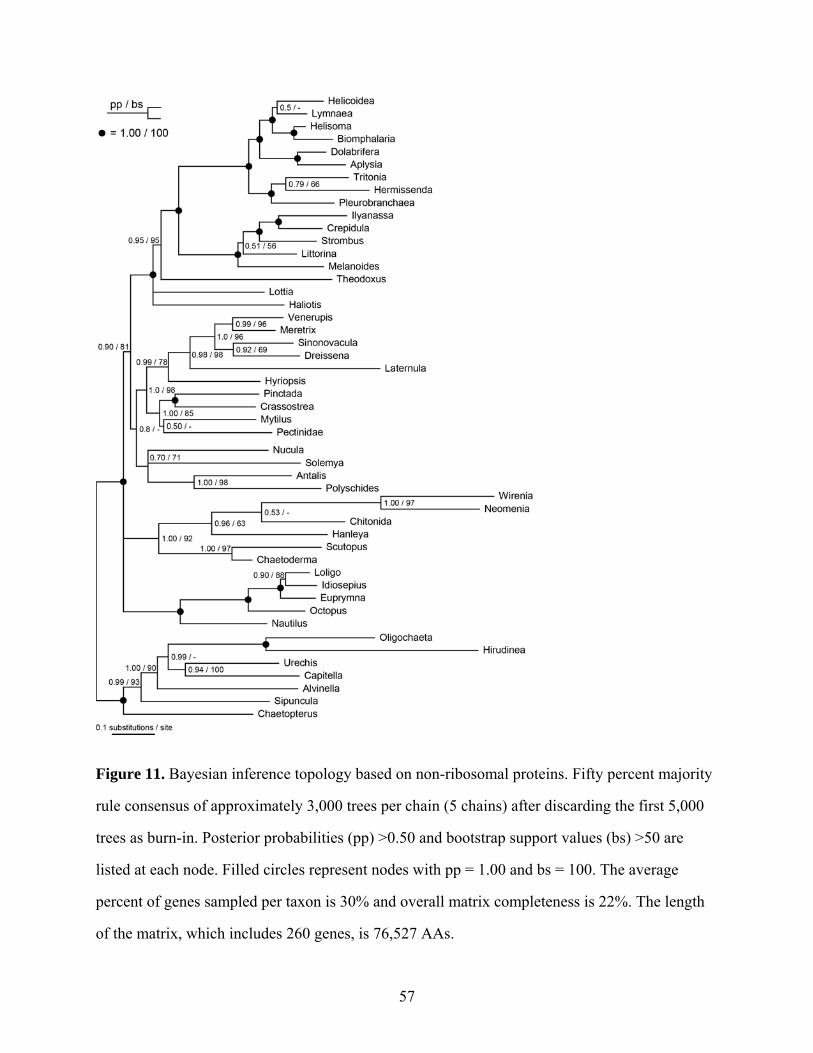
57
Figure 11. Bayesian inference topology based on non-ribosomal proteins. Fifty percent majority
rule consensus of approximately 3,000 trees per chain (5 chains) after discarding the first 5,000
trees as burn-in. Posterior probabilities (pp) >0.50 and bootstrap support values (bs) >50 are
listed at each node. Filled circles represent nodes with pp = 1.00 and bs = 100. The average
percent of genes sampled per taxon is 30% and overall matrix completeness is 22%. The length
of the matrix, which includes 260 genes, is 76,527 AAs.
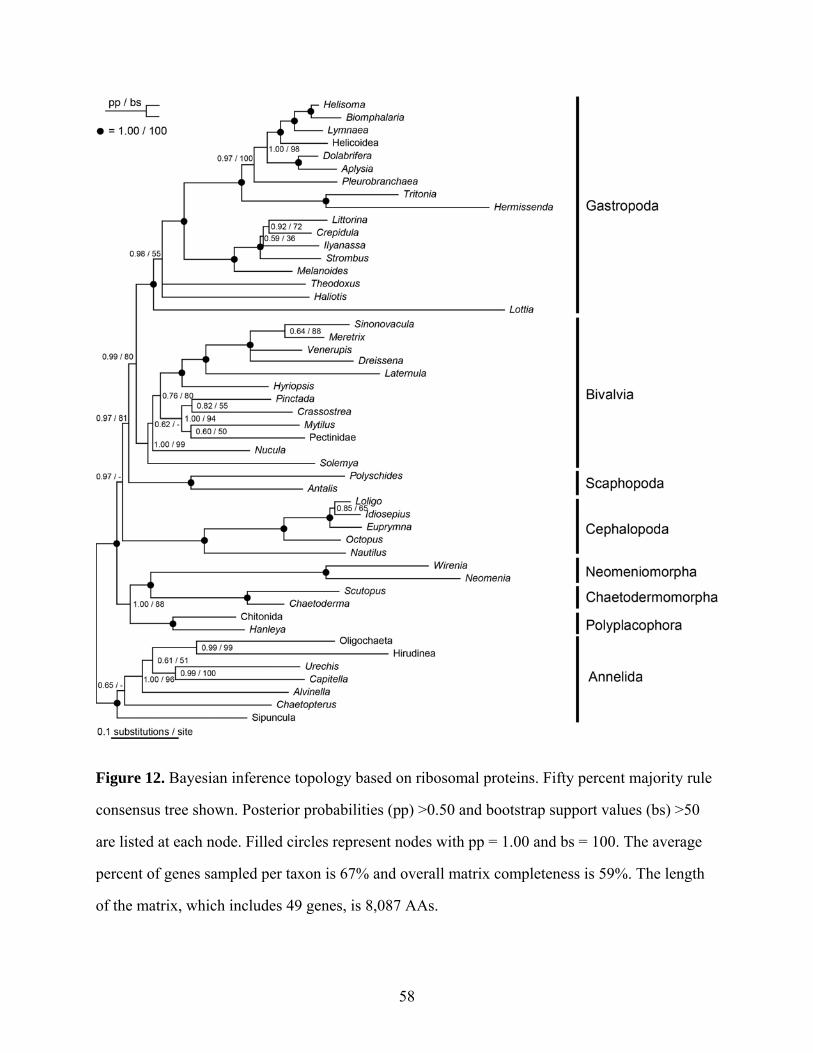
58
Figure 12. Bayesian inference topology based on ribosomal proteins. Fifty percent majority rule
consensus tree shown. Posterior probabilities (pp) >0.50 and bootstrap support values (bs) >50
are listed at each node. Filled circles represent nodes with pp = 1.00 and bs = 100. The average
percent of genes sampled per taxon is 67% and overall matrix completeness is 59%. The length
of the matrix, which includes 49 genes, is 8,087 AAs.
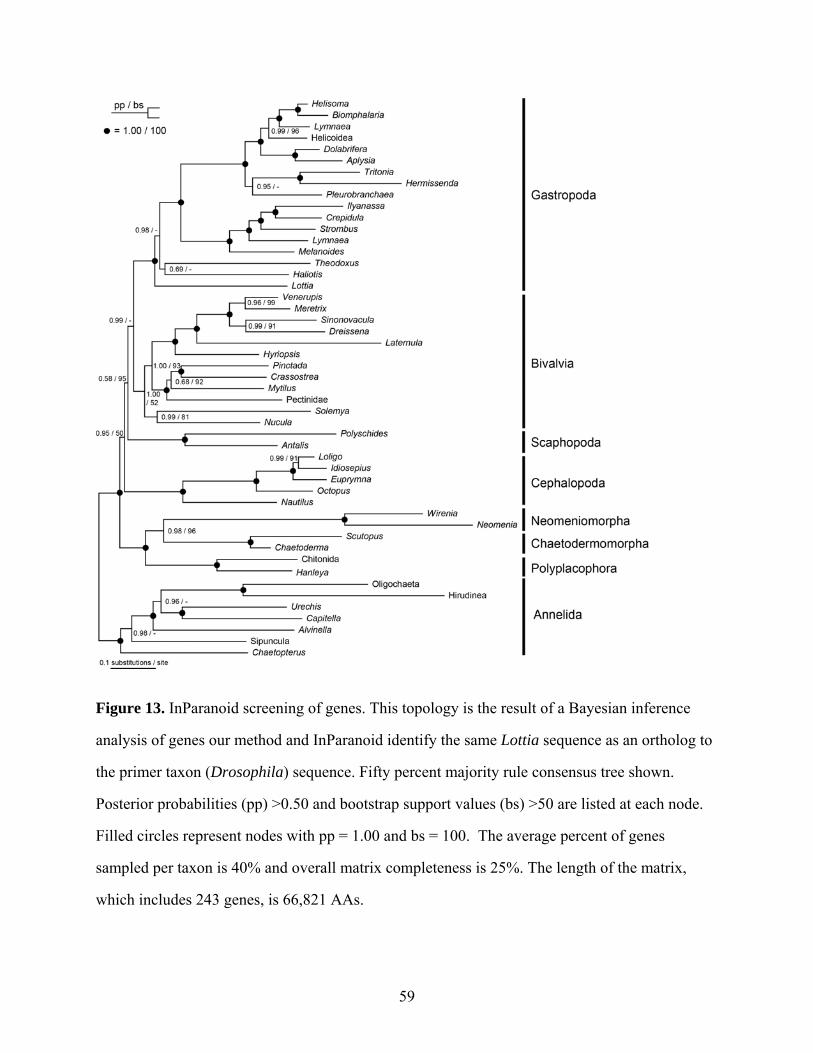
59
Figure 13. InParanoid screening of genes. This topology is the result of a Bayesian inference
analysis of genes our method and InParanoid identify the same Lottia sequence as an ortholog to
the primer taxon (Drosophila) sequence. Fifty percent majority rule consensus tree shown.
Posterior probabilities (pp) >0.50 and bootstrap support values (bs) >50 are listed at each node.
Filled circles represent nodes with pp = 1.00 and bs = 100. The average percent of genes
sampled per taxon is 40% and overall matrix completeness is 25%. The length of the matrix,
which includes 243 genes, is 66,821 AAs.
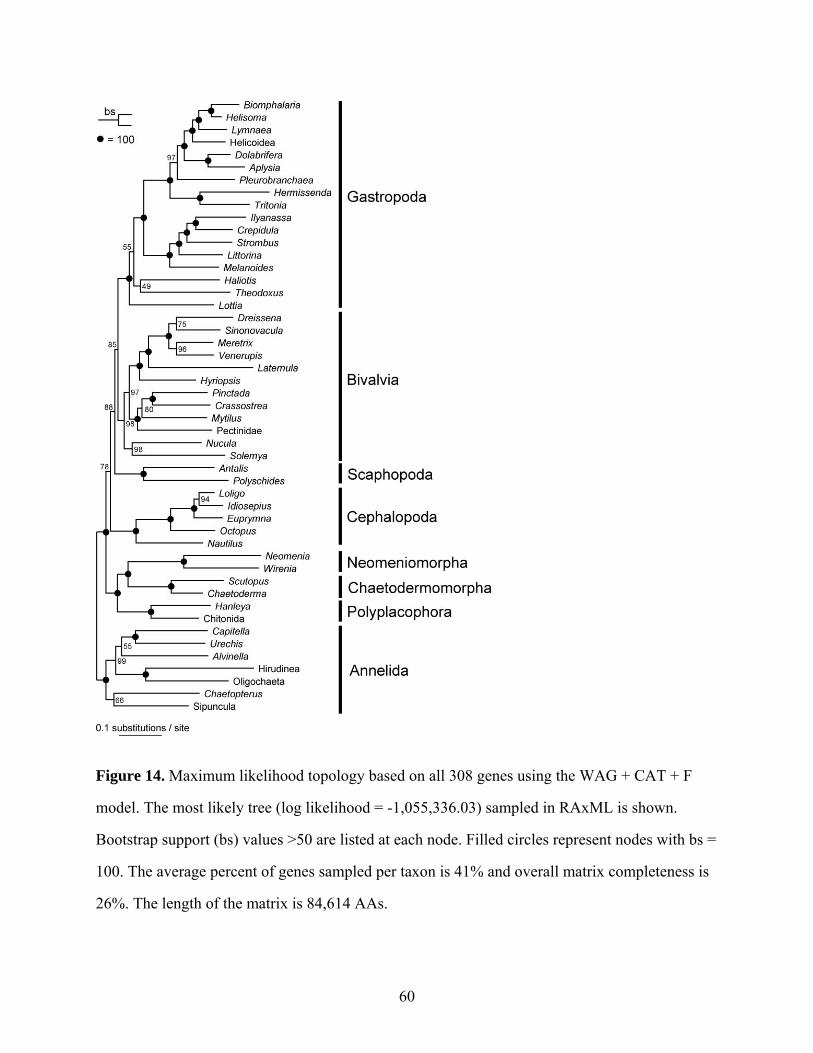
60
Figure 14. Maximum likelihood topology based on all 308 genes using the WAG + CAT + F
model. The most likely tree (log likelihood = -1,055,336.03) sampled in RAxML is shown.
Bootstrap support (bs) values >50 are listed at each node. Filled circles represent nodes with bs =
100. The average percent of genes sampled per taxon is 41% and overall matrix completeness is
26%. The length of the matrix is 84,614 AAs.
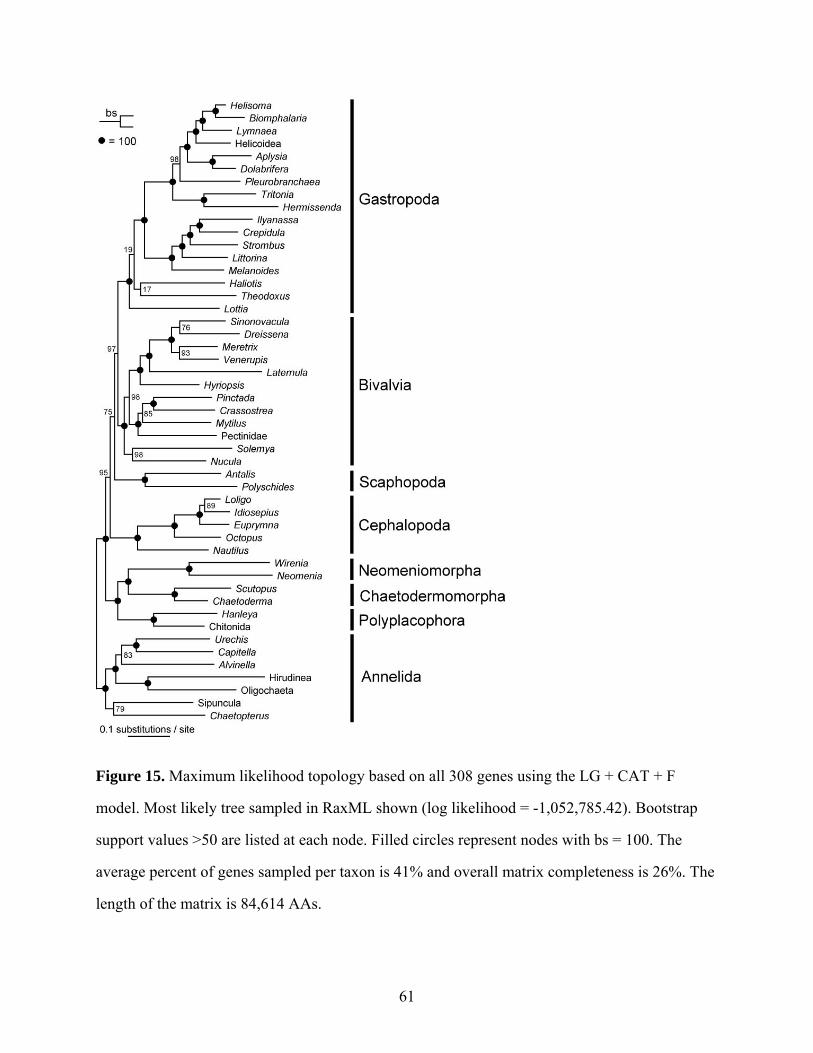
61
Figure 15. Maximum likelihood topology based on all 308 genes using the LG + CAT + F
model. Most likely tree sampled in RaxML shown (log likelihood = -1,052,785.42). Bootstrap
support values >50 are listed at each node. Filled circles represent nodes with bs = 100. The
average percent of genes sampled per taxon is 41% and overall matrix completeness is 26%. The
length of the matrix is 84,614 AAs.
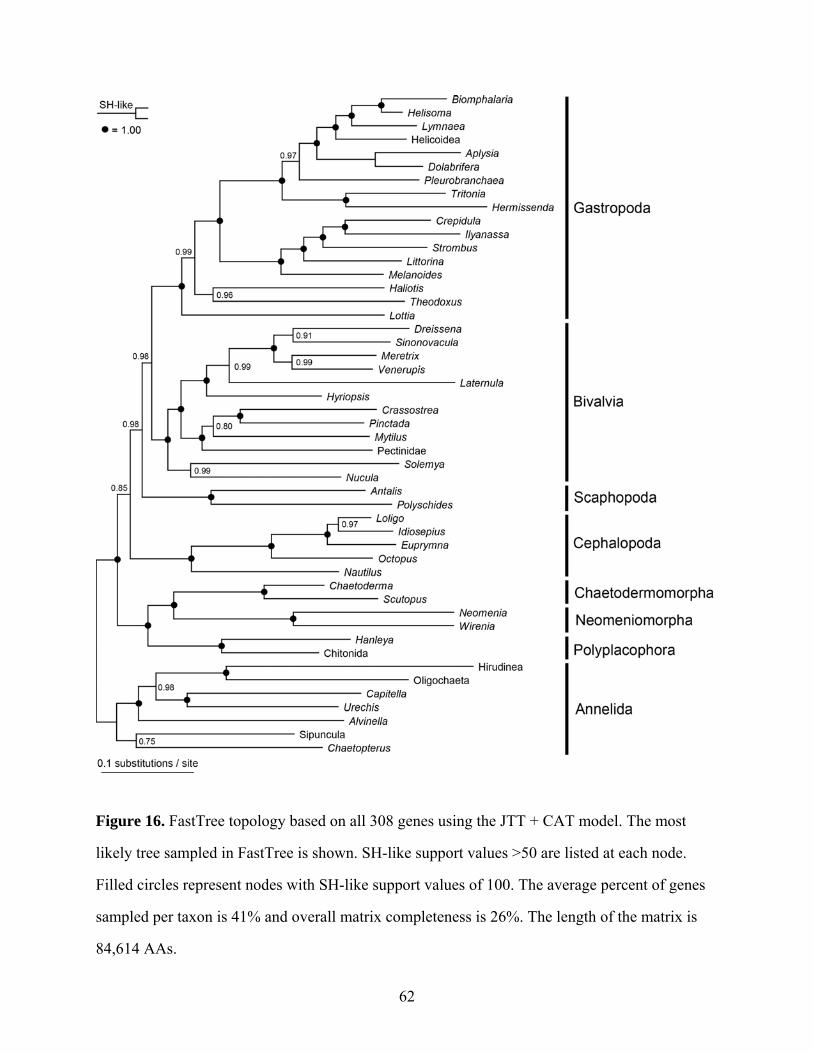
62
Figure 16. FastTree topology based on all 308 genes using the JTT + CAT model. The most
likely tree sampled in FastTree is shown. SH-like support values >50 are listed at each node.
Filled circles represent nodes with SH-like support values of 100. The average percent of genes
sampled per taxon is 41% and overall matrix completeness is 26%. The length of the matrix is
84,614 AAs.
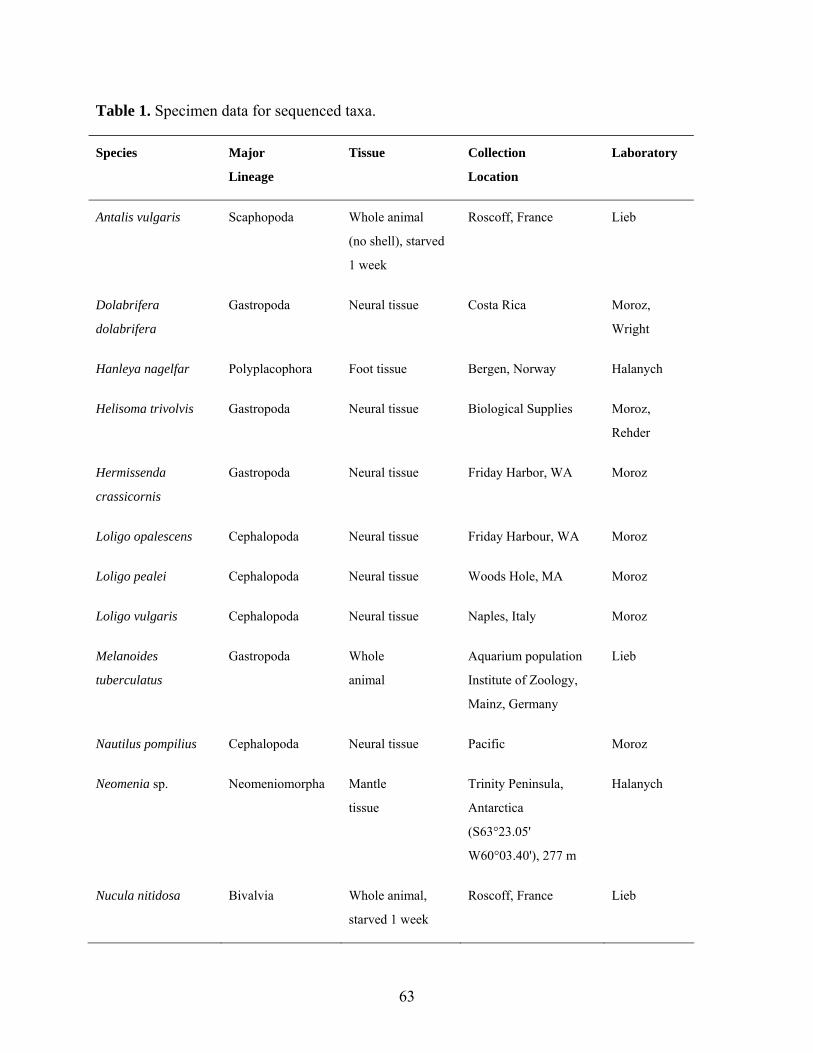
63
Table 1. Specimen data for sequenced taxa.
Species Major
Lineage
Tissue Collection
Location
Laboratory
Antalis vulgaris Scaphopoda Whole animal
(no shell), starved
1 week
Roscoff, France Lieb
Dolabrifera
dolabrifera
Gastropoda Neural tissue Costa Rica Moroz,
Wright
Hanleya nagelfar Polyplacophora Foot tissue Bergen, Norway Halanych
Helisoma trivolvis Gastropoda Neural tissue Biological Supplies Moroz,
Rehder
Hermissenda
crassicornis
Gastropoda Neural tissue Friday Harbor, WA Moroz
Loligo opalescens Cephalopoda Neural tissue Friday Harbour, WA Moroz
Loligo pealei Cephalopoda Neural tissue Woods Hole, MA Moroz
Loligo vulgaris Cephalopoda Neural tissue Naples, Italy Moroz
Melanoides
tuberculatus
Gastropoda Whole
animal
Aquarium population
Institute of Zoology,
Mainz, Germany
Lieb
Nautilus pompilius Cephalopoda Neural tissue Pacific Moroz
Neomenia sp. Neomeniomorpha Mantle
tissue
Trinity Peninsula,
Antarctica
(S63°23.05'
W60°03.40'), 277 m
Halanych
Nucula nitidosa Bivalvia Whole animal,
starved 1 week
Roscoff, France Lieb
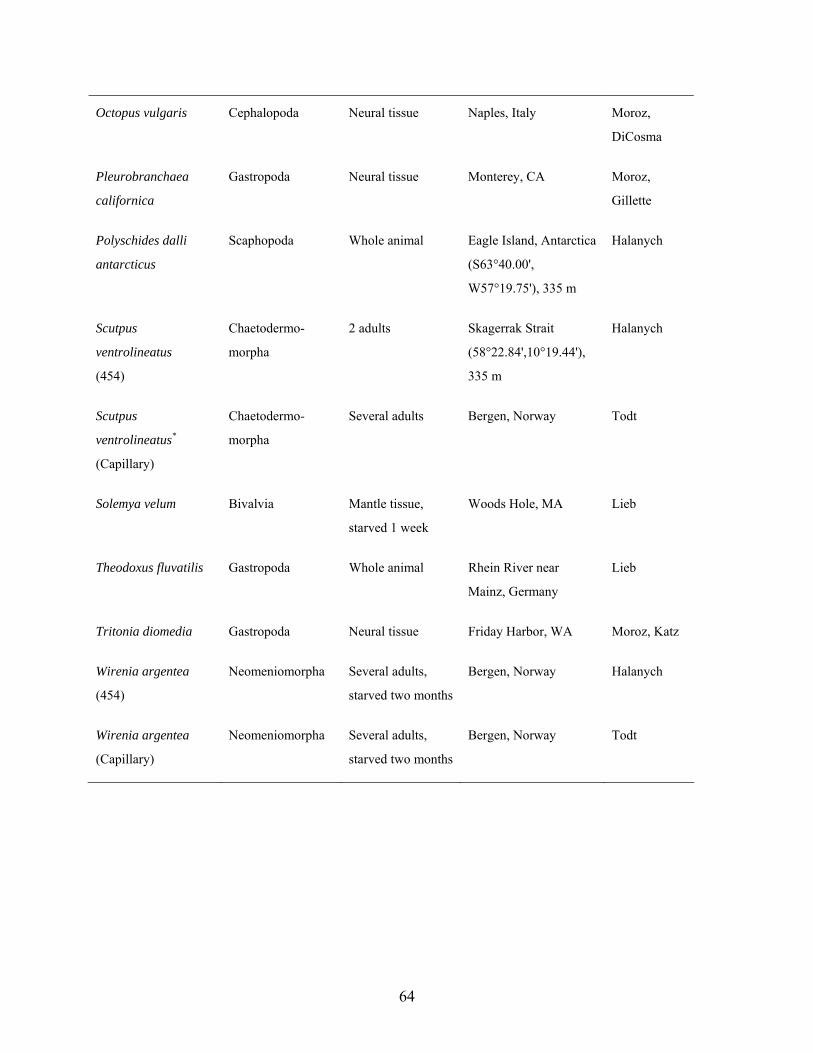
64
Octopus vulgaris Cephalopoda Neural tissue Naples, Italy Moroz,
DiCosma
Pleurobranchaea
californica
Gastropoda Neural tissue Monterey, CA Moroz,
Gillette
Polyschides dalli
antarcticus
Scaphopoda Whole animal Eagle Island, Antarctica
(S63°40.00',
W57°19.75'), 335 m
Halanych
Scutpus
ventrolineatus
(454)
Chaetodermo-
morpha
2 adults Skagerrak Strait
(58°22.84',10°19.44'),
335 m
Halanych
Scutpus
ventrolineatus*
(Capillary)
Chaetodermo-
morpha
Several adults Bergen, Norway Todt
Solemya velum Bivalvia Mantle tissue,
starved 1 week
Woods Hole, MA Lieb
Theodoxus fluvatilis Gastropoda Whole animal Rhein River near
Mainz, Germany
Lieb
Tritonia diomedia Gastropoda Neural tissue Friday Harbor, WA Moroz, Katz
Wirenia argentea
(454)
Neomeniomorpha Several adults,
starved two months
Bergen, Norway Halanych
Wirenia argentea
(Capillary)
Neomeniomorpha Several adults,
starved two months
Bergen, Norway Todt
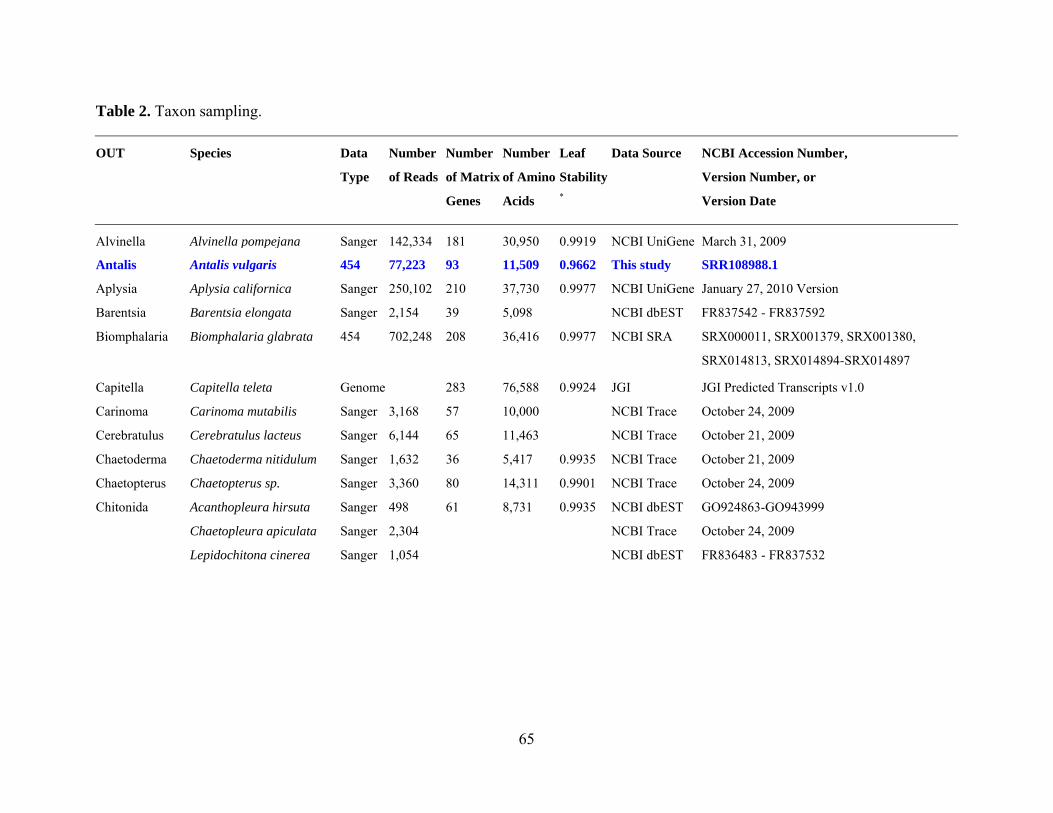
65
Table 2. Taxon sampling.
OUT Species Data
Type
Number
of Reads
Number
of Matrix
Genes
Number
of Amino
Acids
Leaf
Stability*
Data Source NCBI Accession Number,
Version Number, or
Version Date
Alvinella Alvinella pompejana Sanger 142,334 181 30,950 0.9919 NCBI UniGene March 31, 2009
Antalis Antalis vulgaris 454 77,223 93 11,509 0.9662 This study SRR108988.1
Aplysia Aplysia californica Sanger 250,102 210 37,730 0.9977 NCBI UniGene January 27, 2010 Version
Barentsia Barentsia elongata Sanger 2,154 39 5,098 NCBI dbEST FR837542 - FR837592
Biomphalaria Biomphalaria glabrata 454 702,248 208 36,416 0.9977 NCBI SRA SRX000011, SRX001379, SRX001380,
SRX014813, SRX014894-SRX014897
Capitella Capitella teleta Genome 283 76,588 0.9924 JGI JGI Predicted Transcripts v1.0
Carinoma Carinoma mutabilis Sanger 3,168 57 10,000 NCBI Trace October 24, 2009
Cerebratulus Cerebratulus lacteus Sanger 6,144 65 11,463 NCBI Trace October 21, 2009
Chaetoderma Chaetoderma nitidulum Sanger 1,632 36 5,417 0.9935 NCBI Trace October 21, 2009
Chaetopterus Chaetopterus sp. Sanger 3,360 80 14,311 0.9901 NCBI Trace October 24, 2009
Chitonida Acanthopleura hirsuta Sanger 498 NCBI dbEST GO924863-GO943999
Chaetopleura apiculata Sanger 2,304 NCBI Trace October 24, 2009
Lepidochitona cinerea Sanger 1,054
61 8,731 0.9935
NCBI dbEST FR836483 - FR837532
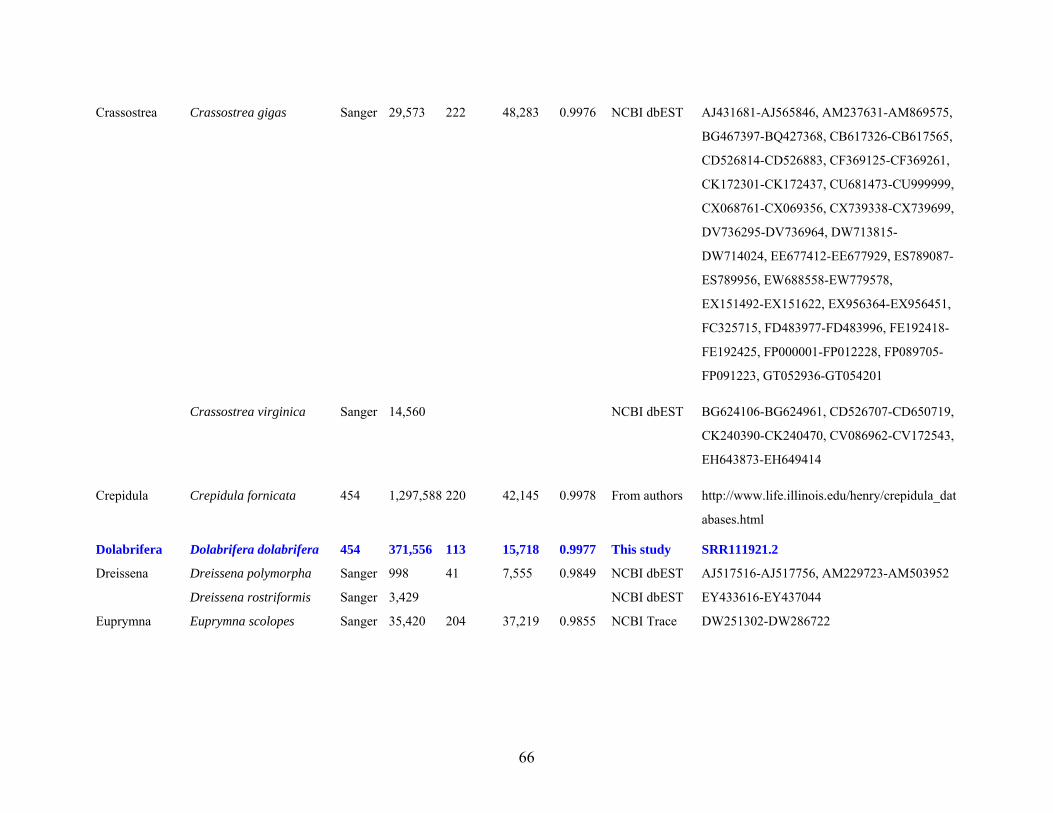
66
Crassostrea Crassostrea gigas Sanger 29,573 NCBI dbEST AJ431681-AJ565846, AM237631-AM869575,
BG467397-BQ427368, CB617326-CB617565,
CD526814-CD526883, CF369125-CF369261,
CK172301-CK172437, CU681473-CU999999,
CX068761-CX069356, CX739338-CX739699,
DV736295-DV736964, DW713815-
DW714024, EE677412-EE677929, ES789087-
ES789956, EW688558-EW779578,
EX151492-EX151622, EX956364-EX956451,
FC325715, FD483977-FD483996, FE192418-
FE192425, FP000001-FP012228, FP089705-
FP091223, GT052936-GT054201
Crassostrea virginica Sanger 14,560
222 48,283 0.9976
NCBI dbEST BG624106-BG624961, CD526707-CD650719,
CK240390-CK240470, CV086962-CV172543,
EH643873-EH649414
Crepidula Crepidula fornicata 454 1,297,588 220 42,145 0.9978 From authors http://www.life.illinois.edu/henry/crepidula_dat
abases.html
Dolabrifera Dolabrifera dolabrifera 454 371,556 113 15,718 0.9977 This study SRR111921.2
Dreissena Dreissena polymorpha Sanger 998 NCBI dbEST AJ517516-AJ517756, AM229723-AM503952
Dreissena rostriformis Sanger 3,429
41 7,555 0.9849
NCBI dbEST EY433616-EY437044
Euprymna Euprymna scolopes Sanger 35,420 204 37,219 0.9855 NCBI Trace DW251302-DW286722
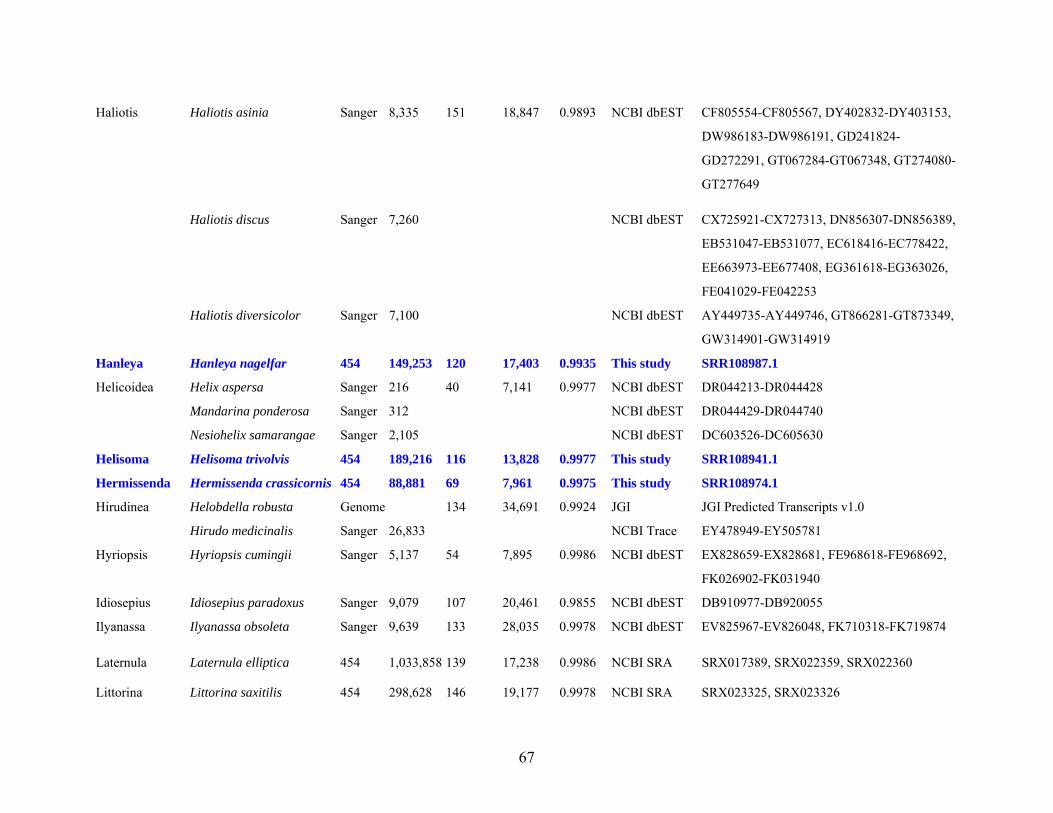
67
Haliotis Haliotis asinia Sanger 8,335 NCBI dbEST CF805554-CF805567, DY402832-DY403153,
DW986183-DW986191, GD241824-
GD272291, GT067284-GT067348, GT274080-
GT277649
Haliotis discus Sanger 7,260 NCBI dbEST CX725921-CX727313, DN856307-DN856389,
EB531047-EB531077, EC618416-EC778422,
EE663973-EE677408, EG361618-EG363026,
FE041029-FE042253
Haliotis diversicolor Sanger 7,100
151 18,847 0.9893
NCBI dbEST AY449735-AY449746, GT866281-GT873349,
GW314901-GW314919
Hanleya Hanleya nagelfar 454 149,253 120 17,403 0.9935 This study SRR108987.1
Helicoidea Helix aspersa Sanger 216 NCBI dbEST DR044213-DR044428
Mandarina ponderosa Sanger 312 NCBI dbEST DR044429-DR044740
Nesiohelix samarangae Sanger 2,105
40 7,141 0.9977
NCBI dbEST DC603526-DC605630
Helisoma Helisoma trivolvis 454 189,216 116 13,828 0.9977 This study SRR108941.1
Hermissenda Hermissenda crassicornis 454 88,881 69 7,961 0.9975 This study SRR108974.1
Hirudinea Helobdella robusta Genome JGI JGI Predicted Transcripts v1.0
Hirudo medicinalis Sanger 26,833
134 34,691 0.9924
NCBI Trace EY478949-EY505781
Hyriopsis Hyriopsis cumingii Sanger 5,137 54 7,895 0.9986 NCBI dbEST EX828659-EX828681, FE968618-FE968692,
FK026902-FK031940
Idiosepius Idiosepius paradoxus Sanger 9,079 107 20,461 0.9855 NCBI dbEST DB910977-DB920055
Ilyanassa Ilyanassa obsoleta Sanger 9,639 133 28,035 0.9978 NCBI dbEST EV825967-EV826048, FK710318-FK719874
Laternula Laternula elliptica 454 1,033,858 139 17,238 0.9986 NCBI SRA SRX017389, SRX022359, SRX022360
Littorina Littorina saxitilis 454 298,628 146 19,177 0.9978 NCBI SRA SRX023325, SRX023326
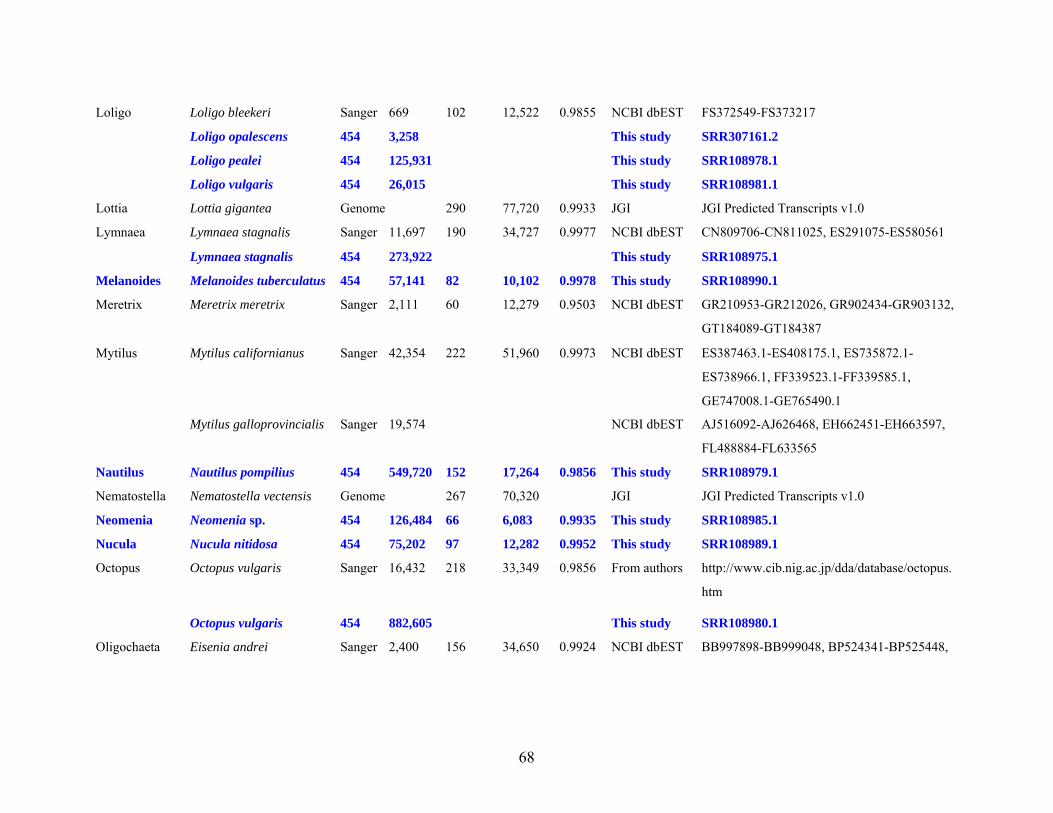
68
Loligo Loligo bleekeri Sanger 669 NCBI dbEST FS372549-FS373217
Loligo opalescens 454 3,258 This study SRR307161.2
Loligo pealei 454 125,931 This study SRR108978.1
Loligo vulgaris 454 26,015
102 12,522 0.9855
This study SRR108981.1
Lottia Lottia gigantea Genome 290 77,720 0.9933 JGI JGI Predicted Transcripts v1.0
Lymnaea Lymnaea stagnalis Sanger 11,697 NCBI dbEST CN809706-CN811025, ES291075-ES580561
Lymnaea stagnalis 454 273,922
190 34,727 0.9977
This study SRR108975.1
Melanoides Melanoides tuberculatus 454 57,141 82 10,102 0.9978 This study SRR108990.1
Meretrix Meretrix meretrix Sanger 2,111 60 12,279 0.9503 NCBI dbEST GR210953-GR212026, GR902434-GR903132,
GT184089-GT184387
Mytilus Mytilus californianus Sanger 42,354 NCBI dbEST ES387463.1-ES408175.1, ES735872.1-
ES738966.1, FF339523.1-FF339585.1,
GE747008.1-GE765490.1
Mytilus galloprovincialis Sanger 19,574
222 51,960 0.9973
NCBI dbEST AJ516092-AJ626468, EH662451-EH663597,
FL488884-FL633565
Nautilus Nautilus pompilius 454 549,720 152 17,264 0.9856 This study SRR108979.1
Nematostella Nematostella vectensis Genome 267 70,320 JGI JGI Predicted Transcripts v1.0
Neomenia Neomenia sp. 454 126,484 66 6,083 0.9935 This study SRR108985.1
Nucula Nucula nitidosa 454 75,202 97 12,282 0.9952 This study SRR108989.1
Octopus Octopus vulgaris Sanger 16,432 218 33,349 0.9856 From authors http://www.cib.nig.ac.jp/dda/database/octopus.
htm
Octopus vulgaris 454 882,605 This study SRR108980.1
Oligochaeta Eisenia andrei Sanger 2,400 156 34,650 0.9924 NCBI dbEST BB997898-BB999048, BP524341-BP525448,
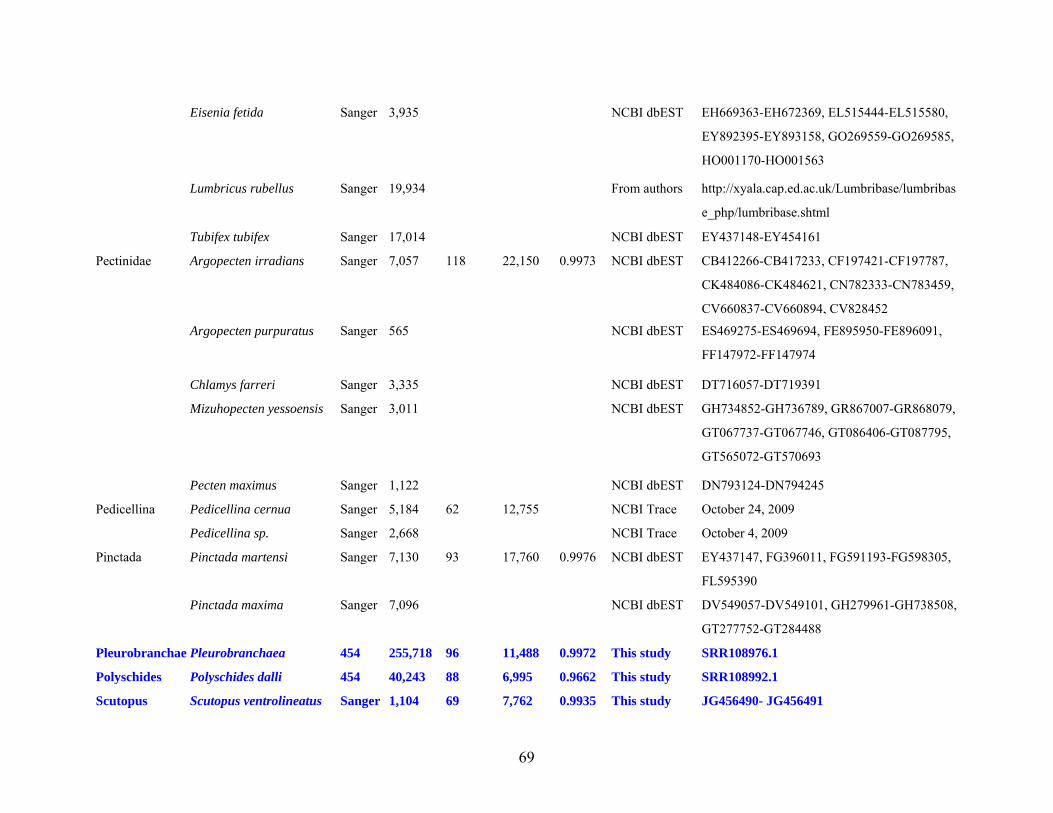
69
Eisenia fetida Sanger 3,935 NCBI dbEST EH669363-EH672369, EL515444-EL515580,
EY892395-EY893158, GO269559-GO269585,
HO001170-HO001563
Lumbricus rubellus Sanger 19,934 From authors http://xyala.cap.ed.ac.uk/Lumbribase/lumbribas
e_php/lumbribase.shtml
Tubifex tubifex Sanger 17,014 NCBI dbEST EY437148-EY454161
Pectinidae Argopecten irradians Sanger 7,057 NCBI dbEST CB412266-CB417233, CF197421-CF197787,
CK484086-CK484621, CN782333-CN783459,
CV660837-CV660894, CV828452
Argopecten purpuratus Sanger 565 NCBI dbEST ES469275-ES469694, FE895950-FE896091,
FF147972-FF147974
Chlamys farreri Sanger 3,335 NCBI dbEST DT716057-DT719391
Mizuhopecten yessoensis Sanger 3,011 NCBI dbEST GH734852-GH736789, GR867007-GR868079,
GT067737-GT067746, GT086406-GT087795,
GT565072-GT570693
Pecten maximus Sanger 1,122
118 22,150 0.9973
NCBI dbEST DN793124-DN794245
Pedicellina Pedicellina cernua Sanger 5,184 NCBI Trace October 24, 2009
Pedicellina sp. Sanger 2,668
62 12,755
NCBI Trace October 4, 2009
Pinctada Pinctada martensi Sanger 7,130 NCBI dbEST EY437147, FG396011, FG591193-FG598305,
FL595390
Pinctada maxima Sanger 7,096
93 17,760 0.9976
NCBI dbEST DV549057-DV549101, GH279961-GH738508,
GT277752-GT284488
Pleurobranchae Pleurobranchaea 454 255,718 96 11,488 0.9972 This study SRR108976.1
Polyschides Polyschides dalli 454 40,243 88 6,995 0.9662 This study SRR108992.1
Scutopus Scutopus ventrolineatus Sanger 1,104 69 7,762 0.9935 This study JG456490- JG456491
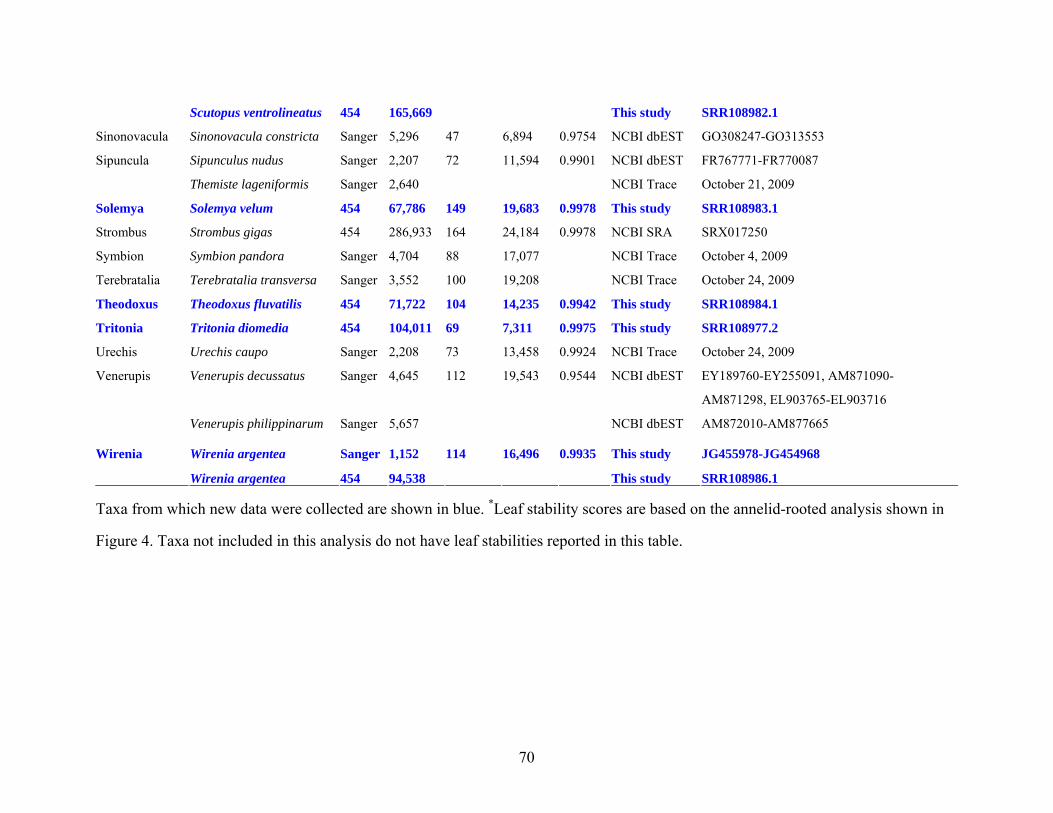
70
Scutopus ventrolineatus 454 165,669 This study SRR108982.1
Sinonovacula Sinonovacula constricta Sanger 5,296 47 6,894 0.9754 NCBI dbEST GO308247-GO313553
Sipuncula Sipunculus nudus Sanger 2,207 NCBI dbEST FR767771-FR770087
Themiste lageniformis Sanger 2,640
72 11,594 0.9901
NCBI Trace October 21, 2009
Solemya Solemya velum 454 67,786 149 19,683 0.9978 This study SRR108983.1
Strombus Strombus gigas 454 286,933 164 24,184 0.9978 NCBI SRA SRX017250
Symbion Symbion pandora Sanger 4,704 88 17,077 NCBI Trace October 4, 2009
Terebratalia Terebratalia transversa Sanger 3,552 100 19,208 NCBI Trace October 24, 2009
Theodoxus Theodoxus fluvatilis 454 71,722 104 14,235 0.9942 This study SRR108984.1
Tritonia Tritonia diomedia 454 104,011 69 7,311 0.9975 This study SRR108977.2
Urechis Urechis caupo Sanger 2,208 73 13,458 0.9924 NCBI Trace October 24, 2009
Venerupis Venerupis decussatus Sanger 4,645 NCBI dbEST EY189760-EY255091, AM871090-
AM871298, EL903765-EL903716
Venerupis philippinarum Sanger 5,657
112 19,543 0.9544
NCBI dbEST AM872010-AM877665
Wirenia Wirenia argentea Sanger 1,152 This study JG455978-JG454968
Wirenia argentea 454 94,538
114 16,496 0.9935
This study SRR108986.1
Taxa from which new data were collected are shown in blue. *Leaf stability scores are based on the annelid-rooted analysis shown in
Figure 4. Taxa not included in this analysis do not have leaf stabilities reported in this table.
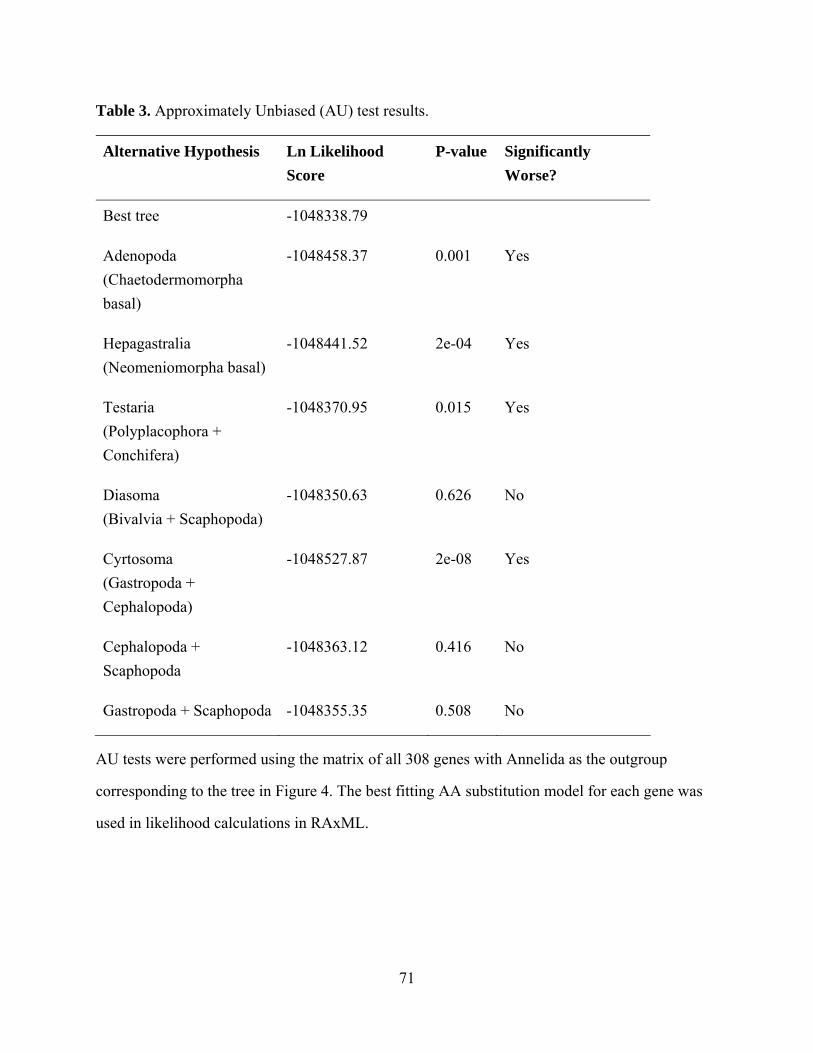
71
Table 3. Approximately Unbiased (AU) test results.
Alternative Hypothesis Ln Likelihood
Score
P-value Significantly
Worse?
Best tree -1048338.79
Adenopoda
(Chaetodermomorpha
basal)
-1048458.37 0.001 Yes
Hepagastralia
(Neomeniomorpha basal)
-1048441.52 2e-04 Yes
Testaria
(Polyplacophora +
Conchifera)
-1048370.95 0.015 Yes
Diasoma
(Bivalvia + Scaphopoda)
-1048350.63 0.626 No
Cyrtosoma
(Gastropoda +
Cephalopoda)
-1048527.87 2e-08 Yes
Cephalopoda +
Scaphopoda
-1048363.12 0.416 No
Gastropoda + Scaphopoda -1048355.35 0.508 No
AU tests were performed using the matrix of all 308 genes with Annelida as the outgroup
corresponding to the tree in Figure 4. The best fitting AA substitution model for each gene was
used in likelihood calculations in RAxML.
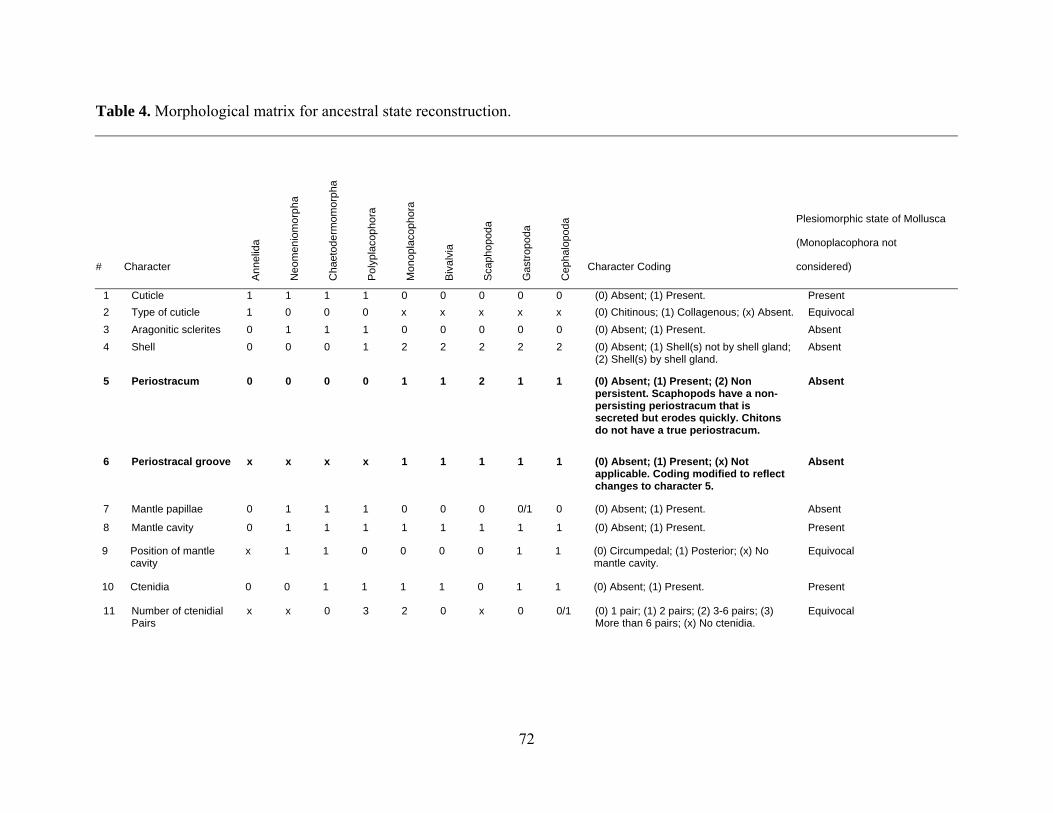
72
Table 4. Morphological matrix for ancestral state reconstruction.
# Character A
nnel
ida
Neo
men
iom
orp
ha
Cha
etod
erm
omo
rpha
Pol
ypla
coph
ora
Mon
opla
coph
ora
Biv
alv
ia
Sca
phop
oda
Gas
trop
oda
Cep
halo
poda
Character Coding
Plesiomorphic state of Mollusca
(Monoplacophora not
considered)
1 Cuticle 1 1 1 1 0 0 0 0 0 (0) Absent; (1) Present. Present
2 Type of cuticle 1 0 0 0 x x x x x (0) Chitinous; (1) Collagenous; (x) Absent. Equivocal
3 Aragonitic sclerites 0 1 1 1 0 0 0 0 0 (0) Absent; (1) Present. Absent
4 Shell 0 0 0 1 2 2 2 2 2 (0) Absent; (1) Shell(s) not by shell gland; (2) Shell(s) by shell gland.
Absent
5 Periostracum 0 0 0 0 1 1 2 1 1 (0) Absent; (1) Present; (2) Non persistent. Scaphopods have a non-persisting periostracum that is secreted but erodes quickly. Chitons do not have a true periostracum.
Absent
6 Periostracal groove
x x x x 1 1 1 1 1 (0) Absent; (1) Present; (x) Not applicable. Coding modified to reflect changes to character 5.
Absent
7 Mantle papillae 0 1 1 1 0 0 0 0/1 0 (0) Absent; (1) Present. Absent
8 Mantle cavity 0 1 1 1 1 1 1 1 1 (0) Absent; (1) Present. Present
9 Position of mantle cavity
x 1 1 0 0 0 0 1 1 (0) Circumpedal; (1) Posterior; (x) No mantle cavity.
Equivocal
10
Ctenidia 0 0 1 1 1 1 0 1 1 (0) Absent; (1) Present. Present
11 Number of ctenidial Pairs
x x 0 3 2 0 x 0 0/1 (0) 1 pair; (1) 2 pairs; (2) 3-6 pairs; (3) More than 6 pairs; (x) No ctenidia.
Equivocal
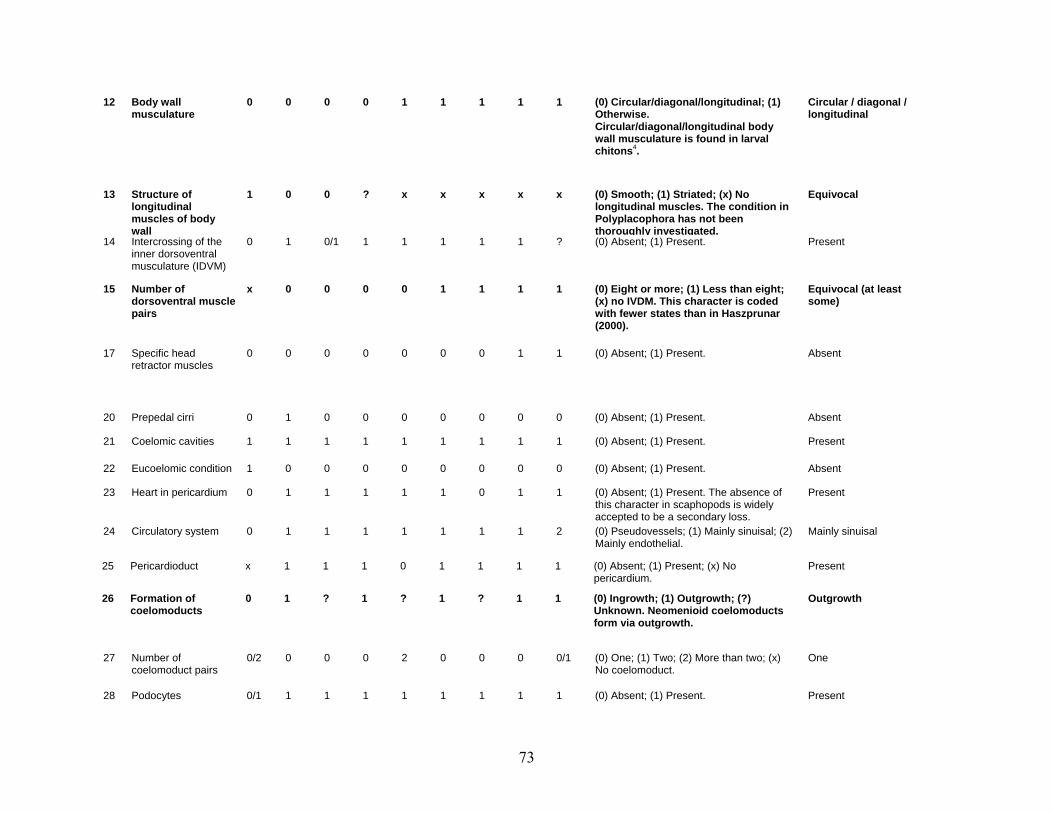
73
12 Body wall musculature
0 0 0 0 1 1 1 1 1 (0) Circular/diagonal/longitudinal; (1) Otherwise. Circular/diagonal/longitudinal body wall musculature is found in larval chitons4.
Circular / diagonal / longitudinal
13 Structure of longitudinal muscles of body wall
1 0 0 ? x x x x x (0) Smooth; (1) Striated; (x) No longitudinal muscles. The condition in Polyplacophora has not been thoroughly investigated.
Equivocal
14 Intercrossing of the inner dorsoventral musculature (IDVM)
0 1 0/1 1 1 1 1 1 ? (0) Absent; (1) Present. Present
15 Number of dorsoventral muscle pairs
x 0 0 0 0 1 1 1 1 (0) Eight or more; (1) Less than eight; (x) no IVDM. This character is coded with fewer states than in Haszprunar (2000).
Equivocal (at least some)
17 Specific head retractor muscles
0 0 0 0 0 0 0 1 1 (0) Absent; (1) Present. Absent
20 Prepedal cirri 0 1 0 0 0 0 0 0 0 (0) Absent; (1) Present. Absent
21 Coelomic cavities 1 1 1 1 1 1 1 1 1 (0) Absent; (1) Present. Present
22 Eucoelomic condition 1 0 0 0 0 0 0 0 0 (0) Absent; (1) Present. Absent
23 Heart in pericardium 0 1 1 1 1 1 0 1 1 (0) Absent; (1) Present. The absence of this character in scaphopods is widely accepted to be a secondary loss.
Present
24 Circulatory system 0 1 1 1 1 1 1 1 2 (0) Pseudovessels; (1) Mainly sinuisal; (2) Mainly endothelial.
Mainly sinuisal
25 Pericardioduct x 1 1 1 0 1 1 1 1 (0) Absent; (1) Present; (x) No pericardium.
Present
26 Formation of coelomoducts
0 1 ? 1 ? 1 ? 1 1 (0) Ingrowth; (1) Outgrowth; (?) Unknown. Neomenioid coelomoducts form via outgrowth.
Outgrowth
27 Number of coelomoduct pairs
0/2 0 0 0 2 0 0 0 0/1 (0) One; (1) Two; (2) More than two; (x) No coelomoduct.
One
28 Podocytes 0/1 1 1 1 1 1 1 1 1 (0) Absent; (1) Present. Present
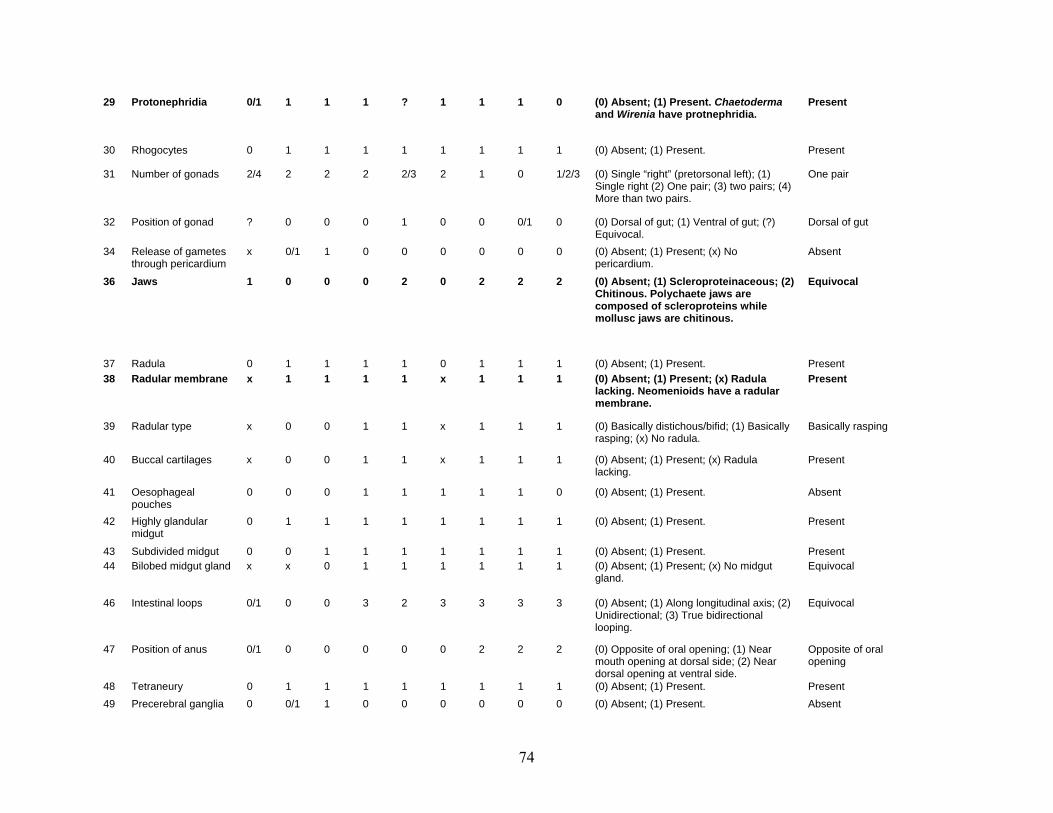
74
29 Protonephridia 0/1 1 1 1 ? 1 1 1 0 (0) Absent; (1) Present. Chaetoderma and Wirenia have protnephridia.
Present
30 Rhogocytes 0 1 1 1 1 1 1 1 1 (0) Absent; (1) Present. Present
31 Number of gonads 2/4 2 2 2 2/3 2 1 0 1/2/3 (0) Single “right” (pretorsonal left); (1) Single right (2) One pair; (3) two pairs; (4) More than two pairs.
One pair
32 Position of gonad ? 0 0 0 1 0 0 0/1 0 (0) Dorsal of gut; (1) Ventral of gut; (?) Equivocal.
Dorsal of gut
34 Release of gametes through pericardium
x 0/1 1 0 0 0 0 0 0 (0) Absent; (1) Present; (x) No pericardium.
Absent
36 Jaws 1 0 0 0 2 0 2 2 2 (0) Absent; (1) Scleroproteinaceous; (2) Chitinous. Polychaete jaws are composed of scleroproteins while mollusc jaws are chitinous.
Equivocal
37 Radula 0 1 1 1 1 0 1 1 1 (0) Absent; (1) Present. Present
38 Radular membrane x 1 1 1 1 x 1 1 1 (0) Absent; (1) Present; (x) Radula lacking. Neomenioids have a radular membrane.
Present
39 Radular type x 0 0 1 1 x 1 1 1 (0) Basically distichous/bifid; (1) Basically rasping; (x) No radula.
Basically rasping
40 Buccal cartilages x 0 0 1 1 x 1 1 1 (0) Absent; (1) Present; (x) Radula lacking.
Present
41 Oesophageal pouches
0 0 0 1 1 1 1 1 0 (0) Absent; (1) Present. Absent
42 Highly glandular midgut
0 1 1 1 1 1 1 1 1 (0) Absent; (1) Present. Present
43 Subdivided midgut 0 0 1 1 1 1 1 1 1 (0) Absent; (1) Present. Present 44 Bilobed midgut gland x x 0 1 1 1 1 1 1 (0) Absent; (1) Present; (x) No midgut
gland. Equivocal
46 Intestinal loops 0/1 0 0 3 2 3 3 3 3 (0) Absent; (1) Along longitudinal axis; (2) Unidirectional; (3) True bidirectional looping.
Equivocal
47 Position of anus 0/1 0 0 0 0 0 2 2 2 (0) Opposite of oral opening; (1) Near mouth opening at dorsal side; (2) Near dorsal opening at ventral side.
Opposite of oral opening
48 Tetraneury 0 1 1 1 1 1 1 1 1 (0) Absent; (1) Present. Present
49 Precerebral ganglia 0 0/1 1 0 0 0 0 0 0 (0) Absent; (1) Present. Absent
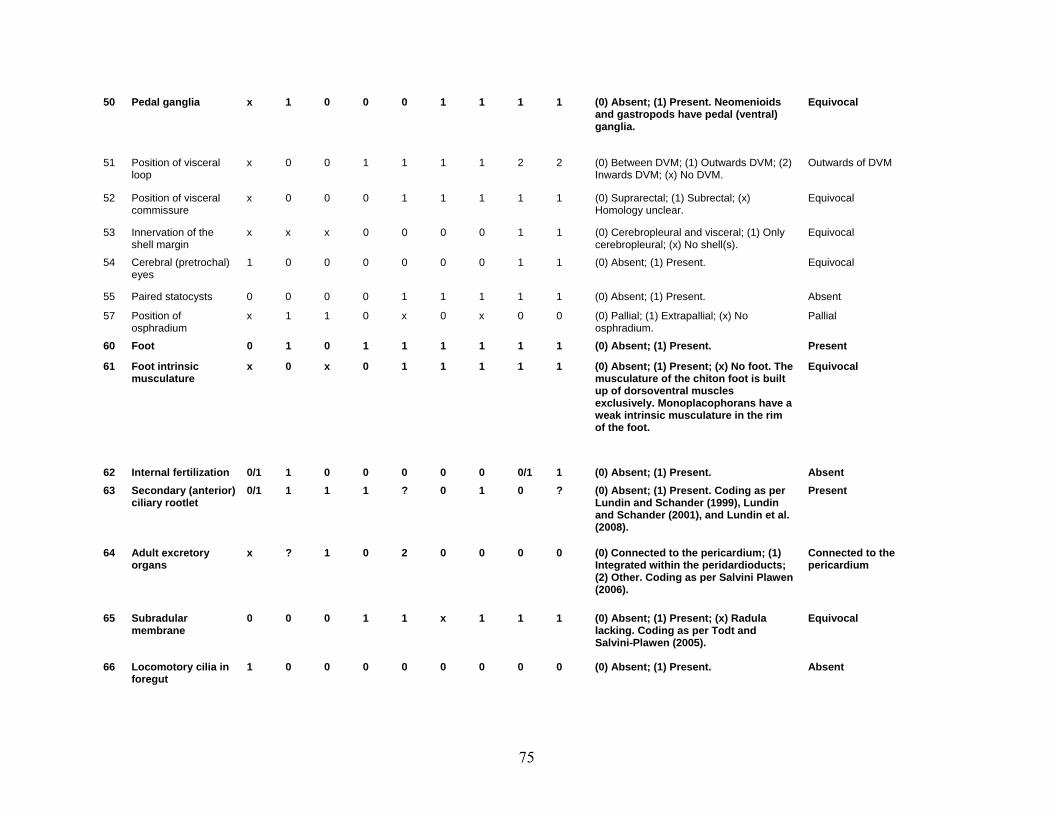
75
50 Pedal ganglia x 1 0 0 0 1 1 1 1 (0) Absent; (1) Present. Neomenioids and gastropods have pedal (ventral) ganglia.
Equivocal
51 Position of visceral loop
x 0 0 1 1 1 1 2 2 (0) Between DVM; (1) Outwards DVM; (2) Inwards DVM; (x) No DVM.
Outwards of DVM
52 Position of visceral commissure
x 0 0 0 1 1 1 1 1 (0) Suprarectal; (1) Subrectal; (x) Homology unclear.
Equivocal
53 Innervation of the shell margin
x x x 0 0 0 0 1 1 (0) Cerebropleural and visceral; (1) Only cerebropleural; (x) No shell(s).
Equivocal
54 Cerebral (pretrochal) eyes
1 0 0 0 0 0 0 1 1 (0) Absent; (1) Present. Equivocal
55 Paired statocysts 0 0 0 0 1 1 1 1 1 (0) Absent; (1) Present. Absent
57 Position of osphradium
x 1 1 0 x 0 x 0 0 (0) Pallial; (1) Extrapallial; (x) No osphradium.
Pallial
60 Foot 0 1 0 1 1 1 1 1 1 (0) Absent; (1) Present. Present
61 Foot intrinsic musculature
x 0 x 0 1 1 1 1 1 (0) Absent; (1) Present; (x) No foot. The musculature of the chiton foot is built up of dorsoventral muscles exclusively. Monoplacophorans have a weak intrinsic musculature in the rim of the foot.
Equivocal
62 Internal fertilization 0/1 1 0 0 0 0 0 0/1 1 (0) Absent; (1) Present. Absent
63 Secondary (anterior) ciliary rootlet
0/1 1 1 1 ? 0 1 0 ? (0) Absent; (1) Present. Coding as per Lundin and Schander (1999), Lundin and Schander (2001), and Lundin et al. (2008).
Present
64 Adult excretory organs
x ? 1 0 2 0 0 0 0 (0) Connected to the pericardium; (1) Integrated within the peridardioducts; (2) Other. Coding as per Salvini Plawen (2006).
Connected to the pericardium
65 Subradular membrane
0 0 0 1 1 x 1 1 1 (0) Absent; (1) Present; (x) Radula lacking. Coding as per Todt and Salvini-Plawen (2005).
Equivocal
66 Locomotory cilia in foregut
1 0 0 0 0 0 0 0 0 (0) Absent; (1) Present. Absent
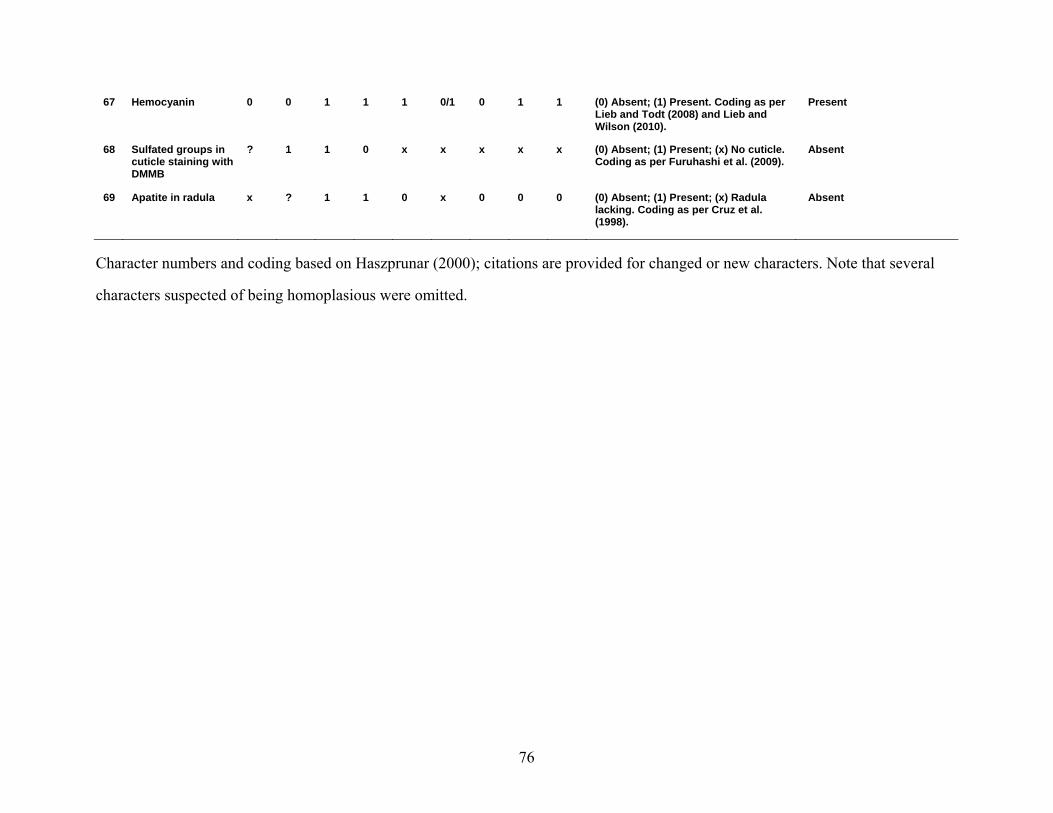
76
67 Hemocyanin 0 0 1 1 1 0/1 0 1 1 (0) Absent; (1) Present. Coding as per Lieb and Todt (2008) and Lieb and Wilson (2010).
Present
68 Sulfated groups in cuticle staining with DMMB
? 1 1 0 x x x x x (0) Absent; (1) Present; (x) No cuticle. Coding as per Furuhashi et al. (2009).
Absent
69 Apatite in radula x ? 1 1 0 x 0 0 0 (0) Absent; (1) Present; (x) Radula lacking. Coding as per Cruz et al. (1998).
Absent
Character numbers and coding based on Haszprunar (2000); citations are provided for changed or new characters. Note that several
characters suspected of being homoplasious were omitted.
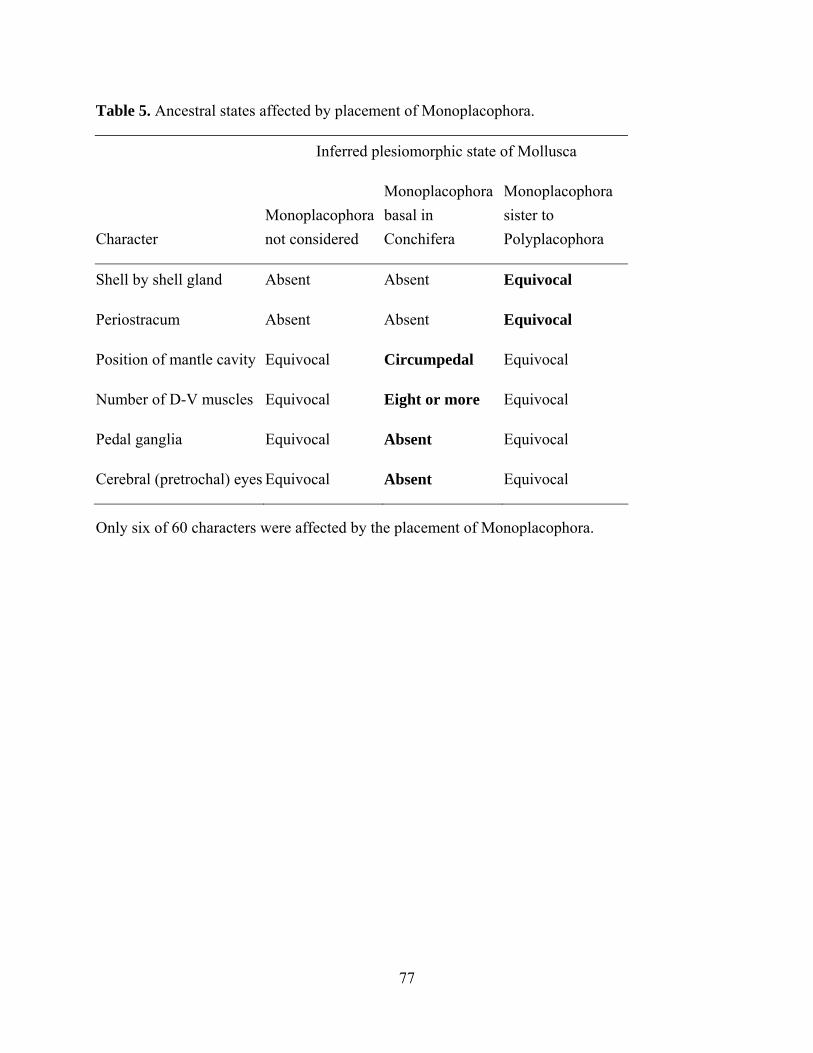
77
Table 5. Ancestral states affected by placement of Monoplacophora.
Inferred plesiomorphic state of Mollusca
Character
Monoplacophora
not considered
Monoplacophora
basal in
Conchifera
Monoplacophora
sister to
Polyplacophora
Shell by shell gland Absent Absent Equivocal
Periostracum Absent Absent Equivocal
Position of mantle cavity Equivocal Circumpedal Equivocal
Number of D-V muscles Equivocal Eight or more Equivocal
Pedal ganglia Equivocal Absent Equivocal
Cerebral (pretrochal) eyes Equivocal Absent Equivocal
Only six of 60 characters were affected by the placement of Monoplacophora.
78
Chapter 3. Phylogenomics supports Panpulmonata: Opisthobranch paraphyly and key
evolutionary steps in a major radiation of gastropod molluscs
3.1 Abstract
Pulmonates, with over 30,000 described species, represent the largest radiation of non-
marine animals outside of Arthropoda. The pulmonate lung was a key evolutionary innovation
enabling the diversification of terrestrial and freshwater snails and slugs. However, recent studies
drew conflicting conclusions about pulmonate monophyly, and support for a sister group is
lacking, hindering our understanding of this major animal radiation. Analyses of mitochondrial
protein-coding genes recovered a paraphyletic Pulmonata grading into a monophyletic
Opisthobranchia, a traditional group of sea slugs long considered sister to pulmonates.
Conversely, analyses of datsets dominated by rDNA indicated Opisthobranchia is paraphyletic
with respect to Pulmonata. No study resolved the placement of two key taxa: Sacoglossa, an
opisthobranch group including photosynthetic sea slugs, and Siphonarioidea, false intertidal
limpets usually considered pulmonates. To examine evolutionary relationships at the base of the
pulmonate radiation, we performed a phylogenomic analysis of 102 nuclear protein-coding gene
regions for 19 gastropods. Opisthobranchia was recovered as paraphyletic with respect to
Panpulmonata, a clade in which Sacoglossa was sister to Pulmonata, with Siphonarioidea as the
basal pulmonate lineage. Siphonarioideans share a similar gill structure with shelled
sacoglossans but lack the contractile pneumostome of pulmonates, and likely descended from an
evolutionary intermediate that facilitated the pulmonate radiation into non-marine habitats.
3.2 Introduction
79
A key innovation fueling the diversification of molluscs was the evolution of air-
breathing in pulmonate snails and slugs (Mordan and Wade, 2008). The ensuing radiation into
terrestrial and freshwater niches generated about a third of extant molluscan diversity, with
estimates of up to 60,000 pulmonate species including undescribed taxa (Lydeard et al., 2004;
Strong et al., 2008). Identifying the sister group to Pulmonata is therefore key to understanding
the evolutionary transition to non-marine habitats in one of the most successful animal lineages.
Traditionally, Pulmonata is placed in a clade called Euthyneura along with Opisthobranchia, a
clade of sea slugs. Opisthobranchia is a traditional group of six major lineages, each with parallel
reduction or loss of the ancestral shell, together with minor lineages of undetermined affinity.
However, no clear synapomorphy defines Opisthobranchia, and relationships among lineages
remain unresolved due to rampant convergence and parallel loss of characters (Wägele and
Klussmann-Kolb, 2005; Dayrat et al., 2011; Schrödl et al., 2011a). Heterobranchia is a larger,
more inclusive taxon that includes Euthyneura plus several other minor gastropod lineages
(Haszprunar, 1985).
Recent molecular studies have challenged the traditional view of euthyneuran phylogeny
by rejecting either the monophyly of Opisthobranchia, Pulmonata, or both. No consensus has
emerged because analyses of mitochondrial protein-coding genes yielded dramatically different
phylogenetic hypotheses from datasets dominated by nuclear rDNA (Figure 1). Three analyses of
complete amino acid sequences for 12 or 13 mitochondrial protein-coding genes recovered an
essentially monophyletic Opisthobranchia radiating from within a paraphyletic or unresolved
Pulmonata (Figure 1A,B) (Grande et al., 2008; Medina et al., 2011; White et al., 2011). In
contrast, analyses of nuclear and mitochondrial rRNA genes plus the cytochrome c oxidase I
(COI) gene consistently recover Opisthobranchia as paraphyletic with respect to a monophyletic
80
Pulmonata, if some traditionally basal heterobranch lineages are reassigned as pulmonates
(Figure 1C) (Dinapoli and Klussmann-Kolb, 2010; Jӧrger et al., 2010; Dayrat et al., 2011). These
conflicting results have led some to claim Opisthobranchia as a valid taxon, while others
explicitly said “bye-bye” to Opisthobranchia (Jӧrger et al., 2010; Dayrat et al., 2011; Medina et
al., 2011; Schrödl et al., 2011a).
Despite the broad taxon sampling of “lower heterobranch” lineages in rDNA studies, the
evolutionary relationships of two key euthyneuran taxa, Siphonarioidea and Sacoglossa, remain
unresolved. Siphonarioidea is a group of false limpets that inhabit marine intertidal zones.
Traditionally considered pulmonates, siphonarioids respire using both a gill concealed in the
mantle cavity and a lung with a non-contractile pneumostome opening (Hodgson, 1999).
Sacoglossa, a clade of herbivorous opisthobranchs that specialize on green and red algae, are
noted for the ability of some species to sustain functional chloroplasts in their bodies for weeks
or months after feeding (Händeler et al., 2009; Pierce and Curtis, 2012; Pierce et al., 2012). The
ancestral shell and gill were retained in the sacoglossan clade Oxynoacea but lost in its sister
group Plakobranchacea (Händeler et al., 2009). The origins of Sacoglossa have long been
enigmatic, and no major opisthobranch group has been convincingly supported as the
sacoglossan sister taxon in any phylogenetic analysis (Dayrat and Tillier, 2002; Grande et al.,
2008; Dinapoli and Klussmann-Kolb, 2010; Jӧrger et al., 2010; Dayrat et al., 2011; Medina et al.,
2011; White et al., 2011).
Analyses of mitochondrial protein-coding genes recovered Siphonarioidea nesting within
an otherwise monophyletic Opisthobranchia. In two studies, Siphonarioidea and Sacoglossa
formed a clade named “Siphoglossa,” despite the lack of bootstrap support by maximum
likelihood (ML) analysis (Figure 1A) (Grande et al., 2008; Medina et al., 2011). A third study
81
found strong support for Sacoglossa as sister to a clade in which Siphonarioidea was sister to the
remaining opisthobranchs (Figure 1B) (White et al., 2011). In contrast, all rDNA analyses
recovered a clade (“Panpulmonata”) comprising Pulmonata, Siphonarioidea, and Sacoglossa,
occupying a derived position within a grade of opisthobranchs (Figure 1C). Panpulmonata
received maximum posterior probability (PP) and significant ML support, but alternative
topologies were not rejected by Approximately Unbiased (AU) tests (Dinapoli and Klussmann-
Kolb, 2010; Jӧrger et al., 2010; Dayrat et al., 2011). However, the relative positions of
Siphonarioidea, Sacoglossa and Pulmonata were not resolved in any study. Thus, only some
analyses supported a monophyletic Pulmonata, and even those failed to resolve its sister group or
determine whether Siphonarioidea is a pulmonate taxon.
Recent analyses of data from multiple nuclear protein-coding genes have provided a
framework for understanding the evolutionary diversification of Mollusca, largely resolving the
relationships among major molluscan lineages (Kocot et al., 2011; Smith et al., 2011; Vinther et
al., 2011). To test whether amino acid sequences from many independent nuclear loci could
reject some of the competing phylogenetic hypotheses for euthyneuran relationships, we
analyzed transcriptomic datasets for 14 ingroup taxa to test three main hypotheses. First, the
release of transcriptomes for the sacoglossans Elysia timida and Plakobranchus ocellatus
(Wägele et al., 2011), and the siphonarioidean Siphonaria pectinata (Smith et al., 2011),
presented the opportunity to place Siphonarioidea and Sacoglossa within a phylogenetic
framework, and to test the monophyly of Panpulmonata. Second, we tested the monophyly of
key lineages representing Pulmonata (Siphonarioidea + Stylommatophora + Hygrophila) that
were recovered paraphyletic or polyphyletic in analyses of mitochondrial genomes (Grande et
al., 2008; Medina et al., 2011; White et al., 2011). Third, we tested the monophyly of key
82
lineages representing Opisthobranchia (Nudibranchia + Pleurobranchaea + Anaspidea +
Sacoglossa) that were recovered paraphyletic in studies of nuclear rDNA (Dinapoli and
Klussmann-Kolb, 2010; Jӧrger et al., 2010; Dayrat et al., 2011). Our results have important
implications for understanding how gastropods transitioned out of marine habitats, resulting in
one of the most significant adaptive radiations among metazoans.
3.3 Materials and Methods
Predicted transcripts and transcriptome data (downloaded as assembled contigs when
available) were obtained from public databases for six traditional pulmonates, eight
opisthobranchs, four outgroup caenogastropods and one outgroup patellogastropod (Table 1).
Pulmonata was represented by four freshwater snails (Hygrophila) from three families
(Planorbidae, Physidae, and Lymnaeidae), one stylommatophoran land snail (Nesiohelix), and
one siphonarioidean (Siphonaria). Unassembled Sanger and 454 transcriptome data were
processed and assembled using EST2uni (Forment et al., 2008). This software removes low-
quality regions with lucy (Chou and Holmes, 2001), removes vector with lucy and SeqClean
(http://compbio.dfci.harvard.edu/tgi/software), masks low complexity regions with
RepeatMasker (www.repeatmasker.org), and assembles contigs with CAP3 (Huang and Madan,
1999). Data on sequence quality were used by CAP3 when available. Assembled transcripts were
translated to amino acid sequences using ESTScan (Lottaz et al., 2003) with the Drosophila
melanogaster sequence matrix table as the translation guide.
To group sequences into putatively orthologous groups, an all-versus-all BLASTP
(Altschul et al., 1990) comparison was performed with an e-value cut-off of 10-5 followed by
Markov clustering in OrthoMCL 2.0 (Li et al., 2003) using an inflation parameter of 2.1. The
83
resulting putatively orthologous groups were processed with an improved version of the
bioinformatics pipeline employed by Kocot et al. (2011). Groups that did not have sequences
from at least 10 of the 19 taxa were discarded. To remove mistranslated sequence ends, if one of
the first or last 20 characters of an amino acid sequence was an X (corresponding to a codon with
an ambiguity, gap, or missing data), all characters from the X to the end of that sequence were
deleted. Each group was then aligned with MAFFT (Katoh et al., 2005) using the default
alignment strategy. To further remove mistranslated sequence ends, stretches of ≤10 A-Z
characters surrounded by ≥10 gaps on either side were replaced with gaps. Alignments were then
trimmed with Aliscore (Misof and Misof, 2009) and Alicut (Kück et al., 2010) to remove regions
with ambiguous alignment, or little phylogenetic signal. Any sequences or alignments shorter
than 100 amino acids in length (excluding gaps) after trimming were discarded.
To screen groups for evidence of paralogy, an approximately maximum likelihood tree
was inferred for each remaining alignment using FastTree 2 (Price et al., 2010) using the “slow”
and “gamma” options. A phylogenetic tree-based approach was then employed to screen each
single-gene tree for evidence of paralogy. First, nodes with ≤0.50 support were collapsed into
polytomies. Next, using a custom script (Kocot and Citarella et al., unpublished), the maximally
inclusive subtree was identified and retained where all taxa were represented by zero or one
sequence(s) or, in cases where more than one sequence was present for one or more taxa, all
sequences from a given taxon were monophyletic or part of the same polytomy. Polytomies
containing more than one sequence from two or more taxa were permitted. Putative paralogs
(sequences falling outside of this maximally inclusive subtree) were then deleted from the input
alignment. In cases where multiple sequences from the same taxon formed a clade or were part
of the same polytomy, all sequences but the longest (presumably the most complete splice
84
variant) were deleted. Lastly, in order to reduce the amount of missing data in the final data
matrix, any groups sampled for fewer than 10 taxa were discarded.
Remaining alignments were then concatenated into a supermatrix and analysed using ML
in RAxML 7.2.7 (Stamatakis, 2006) and Bayesian Inference (BI) in PhyloBayes 2.3 (Lartillot et
al., 2009) on the Alabama Supercomputer Authority Dense Memory Cluster
(http://www.asc.edu/). For the ML analysis, the best fitting amino acid substitution model for
each partition was determined using the RAxML model selection Perl script. Topological
robustness for the ML analysis was assessed with 100 replicates of nonparametric bootstrapping,
treating any BP ≥70 as significant nodal support (Douady et al., 2003). Leaf stability (LS) and
taxonomic instability (TI) indices were calculated for all taxa using the Exlexis Lab
RogueNaRock server (http://exelixis-lab.org/roguenarok.html) using the default settings. For the
BI analysis, the CAT model was used to account for site-specific rate heterogeneity. Five parallel
chains were run for 15,000 cycles each, with the first 5,000 discarded as burn-in. A 50% majority
rule consensus tree was computed from the remaining 10,000 trees. Nodal support was estimated
as the posterior probability of a clade in the post-burnin tree sample, with PP values ≥0.9 taken
as significant (Huelsenbeck and Rannala, 2004). Competing phylogenetic hypotheses were
evaluated using the AU test (Shimodaira, 2002) in RAxML 7.2.7.
3.4 Results
OrthoMCL identified 14,182 groups of putatively orthologous sequences, but after
excluding groups with data from fewer than 10 taxa, only 355 groups remained. After removing
mistranslated sequence ends and trimming with Alicut/Aliscore, 194 groups with sequences at
least 100 amino acids long sampled from at least10 species remained. After screening these
85
groups for evidence of paralogy, 102 groups with sequences from at least 10 taxa that were
unambiguously orthologous remained.
Both ML and BI analyses of the concatenated dataset (with 61% overall matrix
completeness) yielded equivalent tree topologies, and most nodes were strongly supported by a
posterior probability (PP) of 1.0 and a bootstrap percentage (BP) ≥99 (Figure 2). We recovered a
monophyletic Euthyneura in which Opisthobranchia was paraphyletic with respect to a
monophyletic Pulmonata (Siphonarioidea + Hygrophila + Stylommatophora), in agreement with
recent analyses of datasets dominated by rDNA (result summarized in Figure 3). Nudipleura
(Nudibranchia + Pleurobranchaea) was recovered as a paraphyletic grade at the base of
Euthyneura, with Nudibranchia as the most basal euthyneuran lineage sampled. The three
anaspideans (sea hares), formed a clade sister to a monophyletic Panpulmonata with strong
support (1.0/99).
Within Panpulmonata (Figure 2, green box), the traditional opisthobranch group
Sacoglossa was sister to a strongly supported clade (1.0/99) comprising all sampled pulmonates.
Siphonarioidea was recovered as the basal pulmonate lineage, sister to a strongly supported clade
(1.0/100) comprising terrestrial and freshwater pulmonates. The four freshwater snails
(Hygrophila) formed a strongly supported clade (1.0/100) sister to the terrestrial snail Nesiohelix
(Stylommatophora). Within Hygrophila, representatives of Lymnaeoidea (Radix and Lymnaea)
grouped with high support (1.0/92), forming an unresolved polytomy with Helisoma
(Planorbidae) and Physella (Physidae). Both LS and TI indices indicated that placements of most
taxa were highly stable among bootstrap replicates (Table 2). Although some taxa had relatively
lower LS or relatively higher TI, all nodes of interest had strong support values, indicating leaf
instability was not a concern.
86
Hypothesis testing with the Approximately Unbiased (AU) test strongly rejected the
monophyly of Opisthobranchia as traditionally defined (Table 3). A clade comprising traditional
opisthobranchs plus Siphonarioidea, advanced by studies of mitochondrial protein-coding genes,
was also strongly rejected. Although less likely than our consensus topology, the hypothesis of
Siphoglossa (Sacoglossa + Siphonarioidea) as sister to a clade comprising the non-marine
pulmonates was not explicitly rejected by AU test (Table 3).
3.5 Discussion
3.5.1 Euthyneuran phylogeny
Diversification of snails and slugs on land and in freshwater led to the most successful
adaptive radiation of non-marine animals outside Arthropoda, with some estimates of pulmonate
biodiversity exceeding the total number of vertebrate species (Lydeard et al., 2004; Mordan and
Wade, 2008; Strong et al., 2008). As a likely key character underlying this adaptive radiation, the
pulmonate lung stands as one of the most important evolutionary advancements among
metazoans. Identifying the pulmonate sister group is paramount to our understanding of the
evolutionary transition to non-marine habitats in the most successful molluscan lineage.
Opisthobranchia was traditionally considered to be sister to Pulmonata, together forming the
clade Euthyneura; however, no clear synapomorphy defines Opisthobranchia, and relationships
among opisthobranch lineages remain unresolved (Haszprunar, 1985; Dayrat and Tillier, 2002;
Wägele and Klussmann-Kolb, 2005; Schrödl et al., 2011a).
Our results confirm the results of recent analyses of datasets dominated by rDNA
sequences (Dinapoli and Klussmann-Kolb, 2010; Jӧrger et al., 2010; Dayrat et al., 2011),
recovering Opisthobranchia as paraphyletic with respect to a monophyletic Pulmonata including
87
Siphonarioidea. We rejected alternative hypotheses of a monophyletic Opisthobranchia including
only traditional sea slug groups, or a monophyletic Opisthobranchia that included
Siphonarioidea. We concur with calls to say “bye-bye” to Opisthobranchia as a formal group,
given the lack of evidence for opisthobranch monophyly from either morphological or molecular
studies (Schrödl et al., 2011a, 2011b).
Analyses of rDNA sequences indicate that some lineages traditionally considered to be
basal heterobranchs are in fact pulmonates, but no transcriptomic data were available for such
groups. Our study did not aim to address comprehensively what lineages are contained within
Pulmonata or Euthyneura, which would require transcriptomes from several minor lineages of
gastropods. Rather, we tested competing phylogenetic hypotheses regarding the monophyly of
major lineages that were both (a) ascribed to Opisthobranchia or Pulmonata, and (b) represented
in three different datasets dominated respectively by mitochondrial genomes, rDNA, or nuclear
protein-coding genes. In phylogenies based on mitochondrial genes, the pulmonate lineages
Hygrophila and Stylommatophora were strongly (Grande et al., 2008) or weakly (White et al.,
2011) recovered as paraphyletic with respect to Opisthobranchia, and Siphonarioidea was
strongly supported as a derived opisthobranch taxon (Grande et al., 2008; Medina et al., 2011;
White et al., 2011). Our sampling of pulmonate lineages was sufficient to reject the hypothesis of
a pulmonate grade and a monophyletic, derived Opisthobranchia. Instead, our analyses of
nuclear protein-coding genes strongly supported the hypothesis that opisthobranchs are
paraphyletic with respect to major pulmonate lineages, in accordance with rDNA studies with
more comprehensive taxonomic sampling.
In addition to the evolutionary importance of unraveling the euthyneuran radiation, the
relationships among “opisthobranch” lineages are biomedically relevant since several taxa are
88
model organisms for neurophysiology, such as Aplysia californica (Anaspidea) and Tritonia
diomedea (Nudibranchia). Unfortunately the Euopisthobranchia hypothesis (Jӧrger et al., 2010)
could not be tested, as transcriptomic data were not available for cephalaspideans, pteropods, or
other minor opisthobranch lineages. Notably, we did not recover a monophyletic Nudipleura
(Nudibranchia + Pleurobranchaea), in contrast to recent molecular studies (but see Kocot et al.
2011). However, most previous studies included only 1-2 pleurobranchs, so broader taxon
sampling may be needed to clarify the status of Nudipleura. Our results support recent rRNA
analyses indicating Nudibranchia is a basal euthyneuran lineage despite the absence of a shell in
this group, previously interpreted as evidence that nudibranchs are a highly derived taxon
(Dinapoli and Klussmann-Kolb, 2010; Jӧrger et al., 2010; Dayrat et al., 2011).
3.5.2 Panpulmonata and the pulmonate transition to land
Surprisingly, even in prior studies with broader sampling of lower heterobranch and
opisthobranch taxa, relationships of Sacoglossa and Siphonarioidea were never resolved with
significant support. Sacoglossans were traditionally considered a derived opisthobranch group,
with the ancestral shell and gill retained only in the non-photosynthetic clade Oxynoacea.
However, the evolutionary relationships of Sacoglossa to other opisthobranchs were never
resolved in likelihood-based phylogenetic analyses of molecular data (Dinapoli and Klussmann-
Kolb, 2010; Jӧrger et al., 2010), or cladistic studies of morphological data (Dayrat and Tillier,
2002).
Our results are consistent with rDNA studies, finding strong support for Panpulmonata
comprising Siphonarioidea, Sacoglossa and Pulmonata. In rDNA analyses, Panpulmonata
received maximum posterior probability (PP) and significant Maximum Likelihood (ML)
89
support (Dinapoli and Klussmann-Kolb, 2010; Jӧrger et al., 2010; Dayrat et al., 2011). However,
alternative topologies were not rejected by hypothesis testing in prior studies, and relationships
among Siphonarioidea, Sacoglossa and Pulmonata were not previously resolved. We found
strong support from BI and ML analyses for Sacoglossa as sister to the traditional pulmonates
(including Siphonarioidea). The Siphoglossa hypothesis, based on analyses of mitochondrial
protein-coding genes, posited a sister relationship for Sacoglossa and Siphonarioidea despite the
lack of ML bootstrap support (Medina et al., 2011). Siphoglossa was originally presumed to fall
within a monophyletic Opisthobranchia, here rejected by hypothesis testing. Although we could
not rule out Siphoglossa as sister to the non-marine pulmonates, no study has found support for
that alternative phylogenetic hypothesis, and both likelihood scores and nodal support values
favor our consensus topology.
Based on our results, sacoglossans and siphonarioideans may share plesiomorphies that
were present in the ancestral pulmonate. For instance, siphonarioideans have a one-sided plicate
gill suspended in the pallial cavity, similar to that of shelled sacoglossans such as Ascobulla and
Berthelinia (Dayrat and Tillier, 2002). Some Siphonaria species are also chemically defended by
de novo synthesized polypropionate metabolites similar to compounds produced by
sacoglossans, anaspideans and cephalaspideans (Faulkner and Ghiselin, 1983). A plesiomorphic
biosynthetic pathway may thus have been inherited by Panpulmonata and Euopisthobranchia
(traditional opisthobranchs excepting Nudipleura). Identification of other traits shared by
Sacoglossa and Siphonarioidea may yield further insight into the early stages of pulmonate
diversification.
Our analyses further support Siphonarioidea as the basal lineage within a monophyletic
Pulmonata, a result that has not received significant support in any prior molecular phylogenetic
90
study. Hyman (1940) proposed that Siphonaria was the basal pulmonate group, but later workers
moved siphonariids to various derived positions within Pulmonata (Hodgson, 1999). An analysis
of morphological characters across Euthyneura also recovered Siphonarioidea as sister to the rest
of Pulmonata, consistent with our findings (Dayrat and Tillier, 2002).
The position of Siphonarioidea at the base of the pulmonate radiation suggests the lung of
terrestrial pulmonates may have evolved from the pallial cavity in an intertidal ancestor that
possessed a sacoglossan-like gill (Ruthensteiner, 1997). After the divergence of Siphonarioidea,
the gill was lost and a contractile pneumostome evolved in the ancestor of modern pulmonates,
facilitating their successful colonization of diverse non-marine habitats. Further evidence of a
marine origin for Pulmonata is the ubiquity of planktotrophic (feeding) veliger larvae in all
intertidal, estuarine or mangrove-affiliated pulmonate lineages, including Siphonarioidea
(Chambers and McQuaid, 1994), Amphiboloidea (Little et al., 1985), Ellobioidea (Russell-
Hunter et al., 1972), Onchidiidae (Wang et al., 2005), and Trimusculoidea (Haven, 1973), as well
as the marine Pyramidelloidea (Collin and Wise, 1997). A fully encapsulated larval stage or
direct development likely evolved several times following independent colonization of
freshwater (Glacidorboidea, Hygrophila) and terrestrial (Stylommatophora, Veronicellidae)
habitats by divergent pulmonate lineages, given current phylogenetic hypotheses. A non-marine
origin of pulmonates is unlikely, requiring the re-evolution of complex larval characters multiple
times in independent high-intertidal and marine lineages.
Overall, this study demonstrates the utility of phylogenomics to address long-standing
controversies of molluscan evolution. Our results confirm that the charismatic opisthobranchs are
a paraphyletic assemblage, and demonstrate the need for a comprehensive revision of
heterobranch systematics. Moreover, our findings shed light on the progressive adaptations that
91
occurred early in pulmonate evolution, supporting Siphonariodea as the basal pulmonate and
Sacoglossa as the pulmonate sister taxon. These results have important implications for
understanding how gastropods transitioned out of marine habitats, resulting in one of the most
significant adaptive radiations among animals.
3.6 References
Altschul, S.F., Gish, W., Miller, W., Myers, E.W., Lipman, D.J., 1990. Basic local alignment
search tool. J. Mol. Biol. 215, 403–410.
Chambers, R.J., McQuaid, C.D., 1994. A review of larval development in the intertidal limpet
genus Siphonaria (Gastropoda: Pulmonata). J. Molluscan Stud. 60, 415–423.
Chou, H.-H., Holmes, M.H., 2001. DNA sequence quality trimming and vector removal.
Bioinformatics. 17, 1093 –1104.
Collin, R., Wise, J.B., 1997. Morphology and development of Odostomia columbiana Dall and
Bartsch (Pyramidellidae): implications for the evolution of gastropod development. Biol.
Bull. 192, 243–252.
Dayrat, B., Conrad, M., Balayan, S., White, T.R., Albrecht, C., Golding, R., Gomes, S.R.,
Harasewych, M.G., De Frias, Martins, A.M., 2011. Phylogenetic relationships and
evolution of pulmonate gastropods (Mollusca): New insights from increased taxon
sampling. Mol. Phylogenet. Evol. 59, 425–437.
Dayrat, B., Tillier, S., 2002. Evolutionary relationships of euthyneuran gastropods (Mollusca): a
cladistic re-evaluation of morphological characters. Zool. J. Linnean Soc. 135, 403–470.
92
Dinapoli, A., Klussmann-Kolb, A., 2010. The long way to diversity – Phylogeny and evolution
of the Heterobranchia (Mollusca: Gastropoda). Mol. Phylogenet. Evol. 55, 60–76.
Douady, C.J., Delsuc, F., Boucher, Y., Doolittle, W.F., Douzery, E.J.P., 2003. Comparison of
Bayesian and Maximum Likelihood Bootstrap Measures of Phylogenetic Reliability.
Mol. Biol. Evol. 20, 248–254.
Faulkner, D.J., Ghiselin, M.T., 1983. Chemical defense and evolutionary ecology of dorid
nudibranchs and some other opisthobranch gastropods. Mar. Ecol. Prog. Ser. 13, 295–
301.
Forment, J., Gilabert, F., Robles, A., Conejero, V., Nuez, F., Blanca, J., 2008. EST2uni: an open,
parallel tool for automated EST analysis and database creation, with a data mining web
interface and microarray expression data integration. BMC Bioinformatics. 9, 5.
Grande, C., Templado, J., Zardoya, R., 2008. Evolution of gastropod mitochondrial genome
arrangements. BMC Evol. Biol. 8, 61.
Händeler, K., Grzymbowski, Y.P., Krug, P.J., Wägele, H., 2009. Functional chloroplasts in
metazoan cells - a unique evolutionary strategy in animal life. Front. Zool. 6, 28.
Haszprunar, G., 1985. The Heterobranchia – a new concept of the phylogeny of the higher
Gastropoda. J. Zool. Syst. Evol. Res. 23, 15–37.
Haven, N., 1973. Reproduction, development and feeding of the Australian marine pulmonate
Trimusculus (Gadinia) conica. Veliger. 16, 61–65.
93
Hodgson, A.N., 1999. The biology of siphonariid limpets (Gastropoda: Pulmonata), in: Gibson,
R.N. (Ed.) Oceanography and Marine Biology, An Annual Review. 37, 245–314.
Huang, X., Madan, A., 1999. CAP3: A DNA Sequence Assembly Program. Genome Res. 9, 868
–877.
Huelsenbeck, J.P., Rannala, B., 2004. Frequentist Properties of Bayesian Posterior Probabilities
of Phylogenetic Trees Under Simple and Complex Substitution Models. Syst. Biol. 53,
904–913.
Hyman, L. H., 1967. Mollusca, in: Hyman, L.H. (Ed.), The Invertebrates. MacGraw-Hill Co.,
New York, pp. 1-792.
Jӧrger, K., Stoger, I., Kano, Y., Fukuda, H., Knebelsberger, T., Schrodl, M., 2010. On the origin
of Acochlidia and other enigmatic euthyneuran gastropods, with implications for the
systematics of Heterobranchia. BMC Evol. Biol. 10, 323.
Katoh, K., Kuma, K., Toh, H., Miyata, T., 2005. MAFFT version 5: improvement in accuracy of
multiple sequence alignment. Nucleic Acids Res. 33, 511 –518.
Kocot, K.M., Cannon, J.T., Todt, C., Citarella, M.R., Kohn, A.B., Meyer, A., Santos, S.R.,
Schander, C., Moroz, L.L., Lieb, B., Halanych, K.M., 2011. Phylogenomics reveals deep
molluscan relationships. Nature. 477, 452–456.
Kück, P., Meusemann, K., Dambach, J., Thormann, B., Von Reumont, B.M., Wägele J.W.,
Misof B., 2010. Parametric and non-parametric masking of randomness in sequence
alignments can be improved and leads to better resolved trees. Front. Zool. 7, 1–12.
94
Lartillot, N., Lepage, T., Blanquart, S., 2009. PhyloBayes 3: a Bayesian software package for
phylogenetic reconstruction and molecular dating. Bioinformatics. 25, 2286.
Li, L., Stoeckert, C.J., Roos, D.S., 2003. OrthoMCL: Identification of Ortholog Groups for
Eukaryotic Genomes. Genome Res. 13, 2178–2189.
Little, C., Stirling, P., Pilkington, M., Pilkington, J., 1985. Larval development and
metamorphosis in the marine pulmonate Amphibola crenata (Mollusca: Pulmonata). J.
Zool. 205, 489–510.
Lottaz, C., Iseli, C., Jongeneel, C.V., Bucher, P., 2003. Modeling sequencing errors by
combining Hidden Markov models. Bioinformatics. 19, ii103–ii112.
Lydeard, C., Cowie, R.H., Ponder, W.F., Bogan, A.E., Bouchet, P., Clark, S.A., Cummings,
K.S., Frest, T.J., Gargominy, O., Herbert, D.G., Hershler, R., Perez, K.E., Roth, B.,
Seddon, M., Strong, E.E., Thompson, F.G., 2004. The global decline of nonmarine
mollusks. BioScience. 54, 321–330.
Medina, M., Lal, S., Vallès, Y., Takaoka, T.L., Dayrat, B.A., Boore, J.L., Gosliner, T., 2011.
Crawling through time: Transition of snails to slugs dating back to the Paleozoic, based
on mitochondrial phylogenomics. Mar. Genomics. 4, 51–59.
Misof, B., Misof, K., 2009. A Monte Carlo Approach Successfully Identifies Randomness in
Multiple Sequence Alignments: A More Objective Means of Data Exclusion. Syst. Biol.
58, 21 –34.
95
Mordan, P., Wade, C., 2008. Heterobranchia II: The Pulmonata., Phylogeny and evolution of the
Mollusca in: Ponder, W.F., Lindberg D.R., University of California Press, Berkeley and
Los Angeles, CA, pp. 409–426.
Pierce, S.K., Curtis, N.E., 2012. The cell biology of the chloroplast symbiosis in sacoglossan sea
slugs. Int. Rev. Cell. Mol. Biol. 293, 123–148.
Pierce, S.K., Fang, X., Schwartz, J.A., Jiang, X., Zhao, W., Curtis, N.E., Kocot, K.M., Yang, B.,
Wang, J., 2012. Transcriptomic evidence for the expression of horizontally transferred
algal nuclear genes in the photosynthetic sea slug, Elysia chlorotica. Mol. Biol. Evol. 29,
1545–1556.
Price, M.N., Dehal, P.S., Arkin, A.P., 2010. FastTree 2 – Approximately maximum-likelihood
trees for large alignments. PLoS ONE. 5, e9490.
Russell-Hunter, W.D., Apley, M.L., Hunter, R.D., 1972. Early life-history of Melampus and the
significance of semilunar synchrony. Biol. Bull. 143, 623–656.
Ruthensteiner, B., 1997. Homology of the pallial and pulmonary cavity of gastropods. J.
Molluscan Stud. 63, 353–367.
Schrödl, M., Jörger, K.M., Klussman-Kolb, A., Wilson, N.G., 2011a. Bye bye
“Opisthobranchia”! A review on the contribution of mesopsammic sea slugs to
euthyneuran systematics. Thalassas. 27, 101–112.
96
Schrödl, M., Jörger, K.M., Wilson, N.G., 2011b. A reply to Medina et al. (2011): Crawling
through time: Transition of snails to slugs dating back to the Paleozoic based on
mitochondrial phylogenomics. Mar. Genomics. 4, 301–303.
Shimodaira, H., 2002. An approximately unbiased test of phylogenetic tree selection. Syst. Biol.
51, 492–508.
Smith, S.A., Wilson, N.G., Goetz, F.E., Feehery, C., Andrade, S.C.S., Rouse, G.W., Giribet, G.,
Dunn, C.W., 2011. Resolving the evolutionary relationships of molluscs with
phylogenomic tools. Nature. 480, 364–367.
Stamatakis, A., 2006. RAxML-VI-HPC: maximum likelihood-based phylogenetic analyses with
thousands of taxa and mixed models. Bioinformatics. 22, 2688.
Strong, E., Gargominy, O., Ponder, W., Bouchet, P., 2008. Global diversity of gastropods
(Gastropoda; Mollusca) in freshwater. Hydrobiologia. 595, 149–166.
Vinther, J., Sperling, E.A., Briggs, D.E.G., Peterson, K.J., 2011. A molecular palaeobiological
hypothesis for the origin of aplacophoran molluscs and their derivation from chiton-like
ancestors. Proc. R. Soc. Lond. [Biol]. 279, 1259-1268.
Wägele, H., Deusch, O., Händeler, K., Martin, R., Schmitt, V., Christa, G., Pinzger, B., Gould,
S.B., Dagan, T., Klussmann-Kolb, A., Martin, W., 2011. Transcriptomic evidence that
Longevity of acquired plastids in the photosynthetic slugs Elysia timida and
Plakobranchus ocellatus does not entail lateral transfer of algal nuclear genes. Mol. Biol.
Evol. 28, 699–706.
97
Wägele, H., Klussmann-Kolb, A., 2005. Opisthobranchia (Mollusca, Gastropoda) – more than
just slimy slugs. Shell reduction and its implications on defence and foraging. Front.
Zool. 2, 1–18.
Wang, J.Q., Cheng, Y.X., Wu, X.G., 2005. Embryonic and larval development of Onchidium
struma. J. Shanghai Fish. Univ. 14, 108–115.
White, T.R., Conrad, M.M., Tseng, R., Balayan, S., Golding, R., Martins, A.M. de F., Dayrat,
B.A., 2011. Ten new complete mitochondrial genomes of pulmonates (Mollusca:
Gastropoda) and their impact on phylogenetic relationships. BMC Evol. Biol. 11, 295.
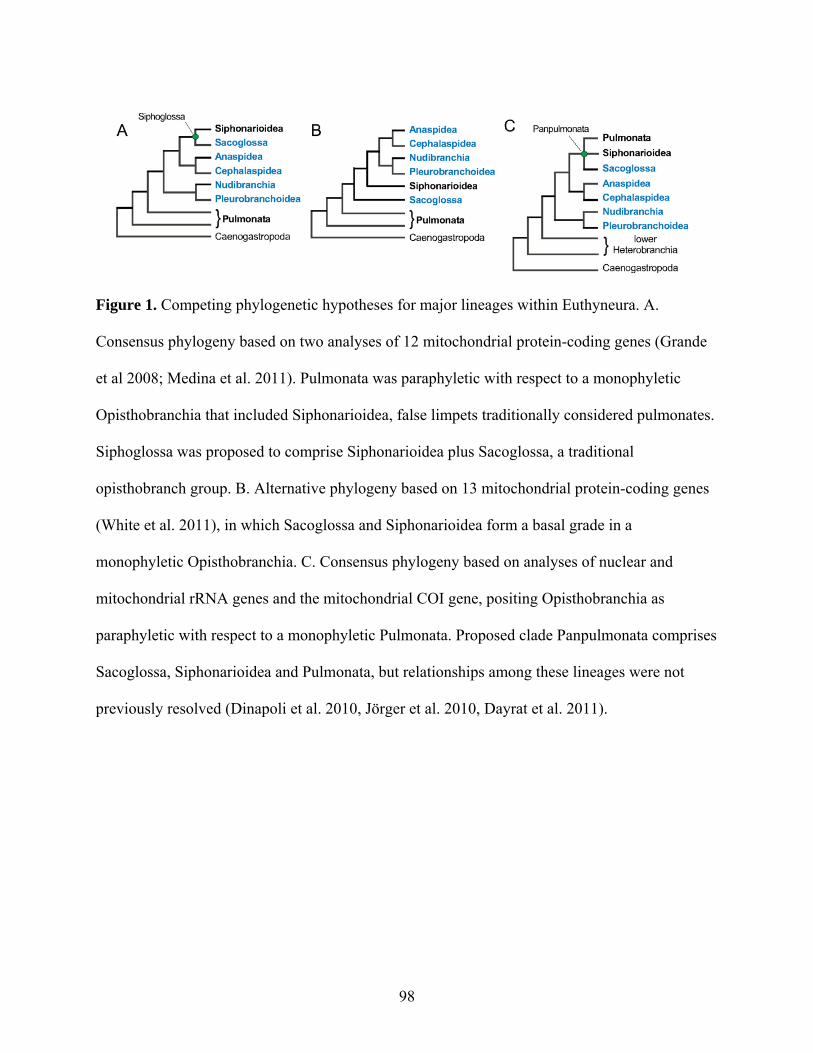
98
Figure 1. Competing phylogenetic hypotheses for major lineages within Euthyneura. A.
Consensus phylogeny based on two analyses of 12 mitochondrial protein-coding genes (Grande
et al 2008; Medina et al. 2011). Pulmonata was paraphyletic with respect to a monophyletic
Opisthobranchia that included Siphonarioidea, false limpets traditionally considered pulmonates.
Siphoglossa was proposed to comprise Siphonarioidea plus Sacoglossa, a traditional
opisthobranch group. B. Alternative phylogeny based on 13 mitochondrial protein-coding genes
(White et al. 2011), in which Sacoglossa and Siphonarioidea form a basal grade in a
monophyletic Opisthobranchia. C. Consensus phylogeny based on analyses of nuclear and
mitochondrial rRNA genes and the mitochondrial COI gene, positing Opisthobranchia as
paraphyletic with respect to a monophyletic Pulmonata. Proposed clade Panpulmonata comprises
Sacoglossa, Siphonarioidea and Pulmonata, but relationships among these lineages were not
previously resolved (Dinapoli et al. 2010, Jörger et al. 2010, Dayrat et al. 2011).
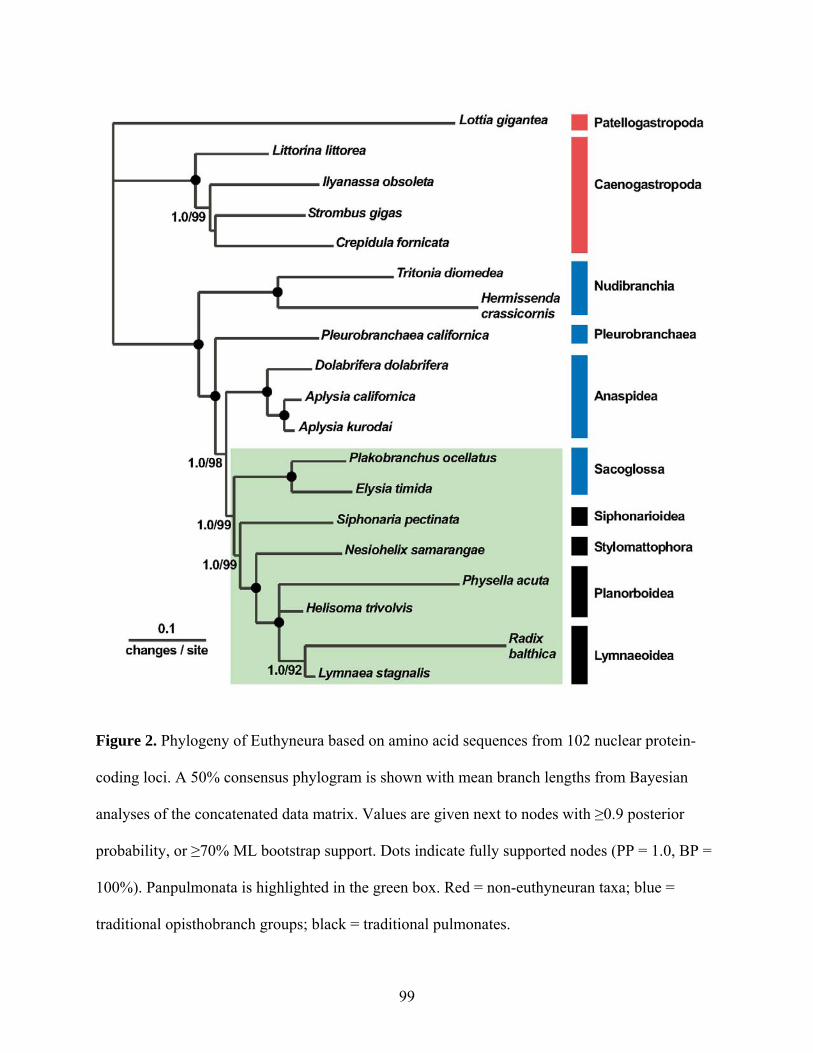
99
Figure 2. Phylogeny of Euthyneura based on amino acid sequences from 102 nuclear protein-
coding loci. A 50% consensus phylogram is shown with mean branch lengths from Bayesian
analyses of the concatenated data matrix. Values are given next to nodes with ≥0.9 posterior
probability, or ≥70% ML bootstrap support. Dots indicate fully supported nodes (PP = 1.0, BP =
100%). Panpulmonata is highlighted in the green box. Red = non-euthyneuran taxa; blue =
traditional opisthobranch groups; black = traditional pulmonates.
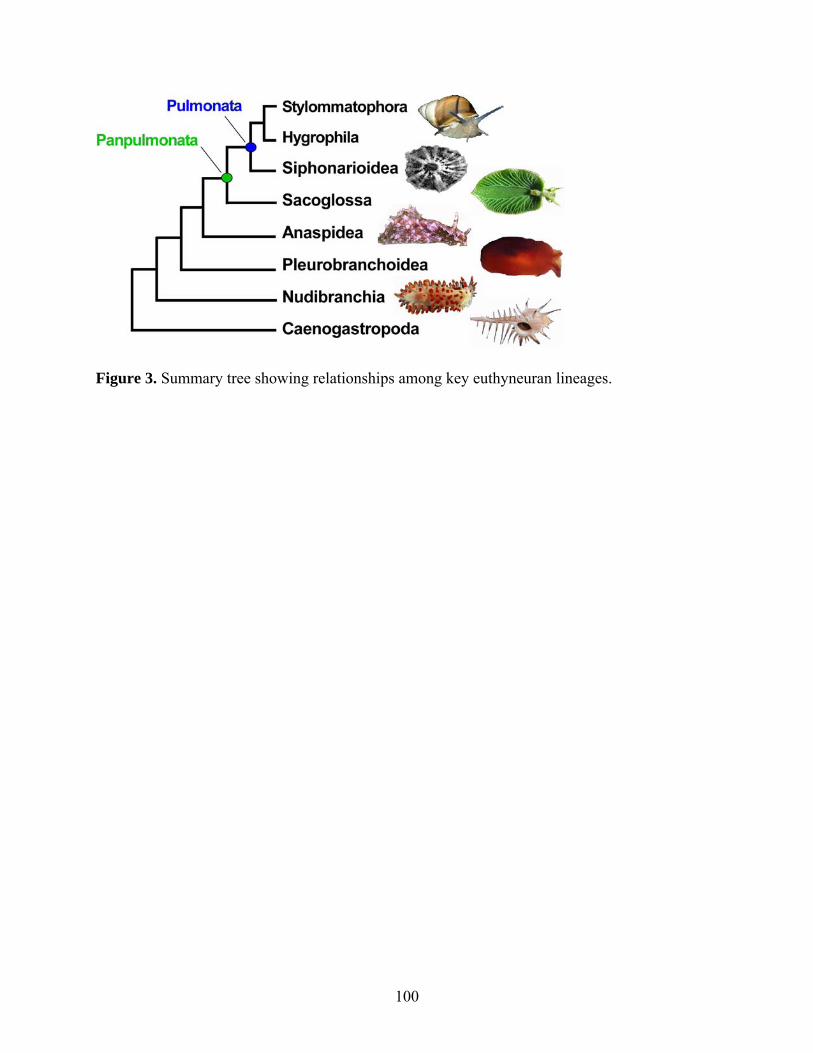
100
Figure 3. Summary tree showing relationships among key euthyneuran lineages.
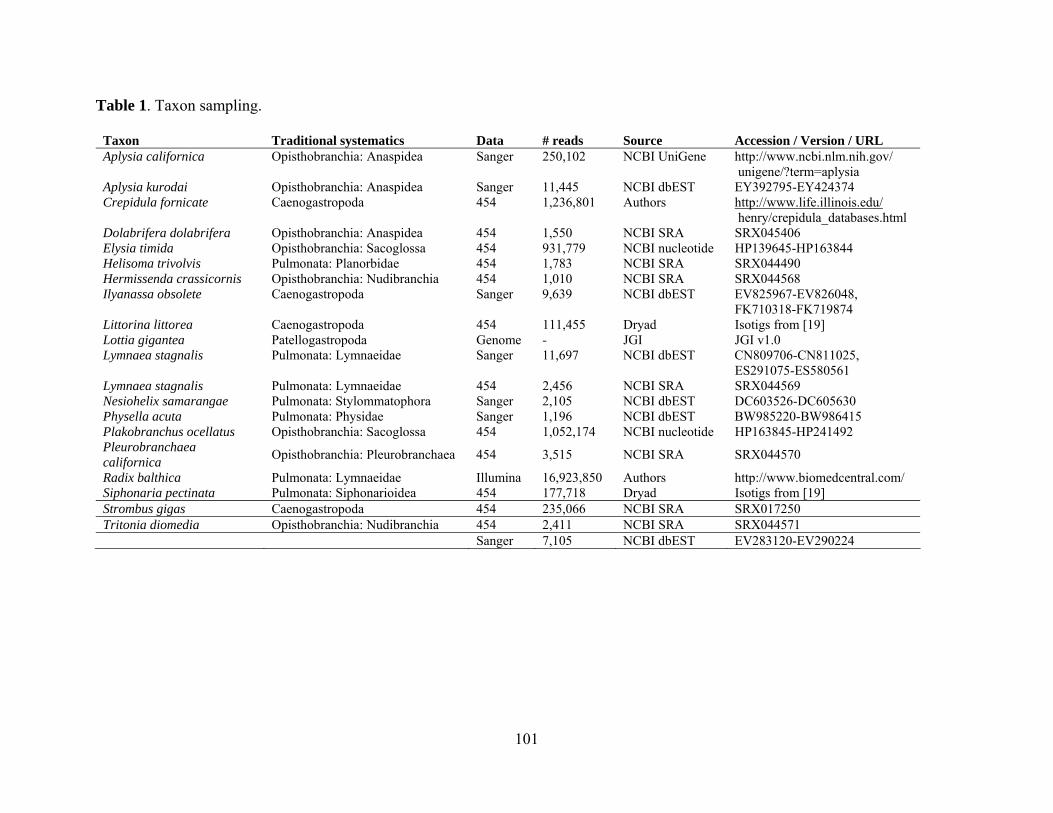
101
Table 1. Taxon sampling.
Taxon Traditional systematics Data # reads Source Accession / Version / URL Aplysia californica Opisthobranchia: Anaspidea Sanger 250,102 NCBI UniGene http://www.ncbi.nlm.nih.gov/ unigene/?term=aplysia Aplysia kurodai Opisthobranchia: Anaspidea Sanger 11,445 NCBI dbEST EY392795-EY424374 Crepidula fornicate Caenogastropoda 454 1,236,801 Authors http://www.life.illinois.edu/ henry/crepidula_databases.html Dolabrifera dolabrifera Opisthobranchia: Anaspidea 454 1,550 NCBI SRA SRX045406 Elysia timida Opisthobranchia: Sacoglossa 454 931,779 NCBI nucleotide HP139645-HP163844 Helisoma trivolvis Pulmonata: Planorbidae 454 1,783 NCBI SRA SRX044490 Hermissenda crassicornis Opisthobranchia: Nudibranchia 454 1,010 NCBI SRA SRX044568 Ilyanassa obsolete Caenogastropoda Sanger 9,639 NCBI dbEST EV825967-EV826048, FK710318-FK719874 Littorina littorea Caenogastropoda 454 111,455 Dryad Isotigs from [19] Lottia gigantea Patellogastropoda Genome - JGI JGI v1.0 Lymnaea stagnalis Pulmonata: Lymnaeidae Sanger 11,697 NCBI dbEST CN809706-CN811025, ES291075-ES580561 Lymnaea stagnalis Pulmonata: Lymnaeidae 454 2,456 NCBI SRA SRX044569 Nesiohelix samarangae Pulmonata: Stylommatophora Sanger 2,105 NCBI dbEST DC603526-DC605630 Physella acuta Pulmonata: Physidae Sanger 1,196 NCBI dbEST BW985220-BW986415 Plakobranchus ocellatus Opisthobranchia: Sacoglossa 454 1,052,174 NCBI nucleotide HP163845-HP241492 Pleurobranchaea californica
Opisthobranchia: Pleurobranchaea 454 3,515 NCBI SRA SRX044570
Radix balthica Pulmonata: Lymnaeidae Illumina 16,923,850 Authors http://www.biomedcentral.com/ Siphonaria pectinata Pulmonata: Siphonarioidea 454 177,718 Dryad Isotigs from [19] Strombus gigas Caenogastropoda 454 235,066 NCBI SRA SRX017250 Tritonia diomedia Opisthobranchia: Nudibranchia 454 2,411 NCBI SRA SRX044571 Sanger 7,105 NCBI dbEST EV283120-EV290224
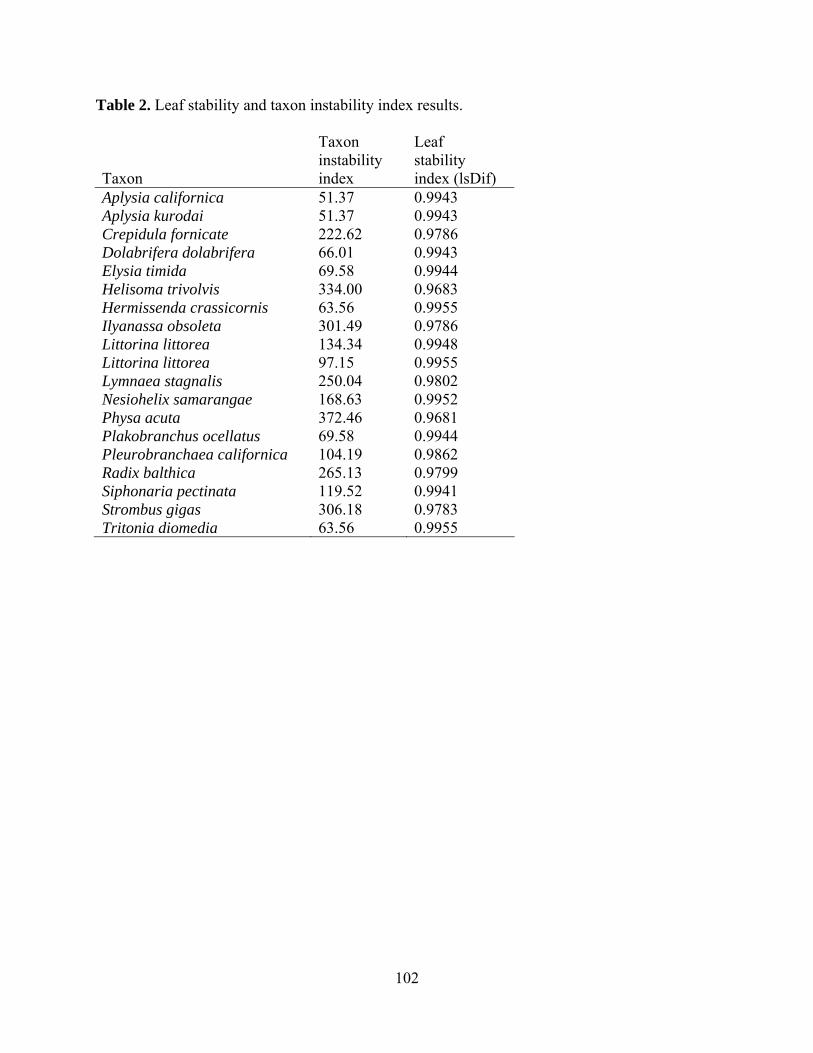
102
Table 2. Leaf stability and taxon instability index results.
Taxon
Taxon instability index
Leaf stability index (lsDif)
Aplysia californica 51.37 0.9943 Aplysia kurodai 51.37 0.9943 Crepidula fornicate 222.62 0.9786 Dolabrifera dolabrifera 66.01 0.9943 Elysia timida 69.58 0.9944 Helisoma trivolvis 334.00 0.9683 Hermissenda crassicornis 63.56 0.9955 Ilyanassa obsoleta 301.49 0.9786 Littorina littorea 134.34 0.9948 Littorina littorea 97.15 0.9955 Lymnaea stagnalis 250.04 0.9802 Nesiohelix samarangae 168.63 0.9952 Physa acuta 372.46 0.9681 Plakobranchus ocellatus 69.58 0.9944 Pleurobranchaea californica 104.19 0.9862 Radix balthica 265.13 0.9799 Siphonaria pectinata 119.52 0.9941 Strombus gigas 306.18 0.9783 Tritonia diomedia 63.56 0.9955
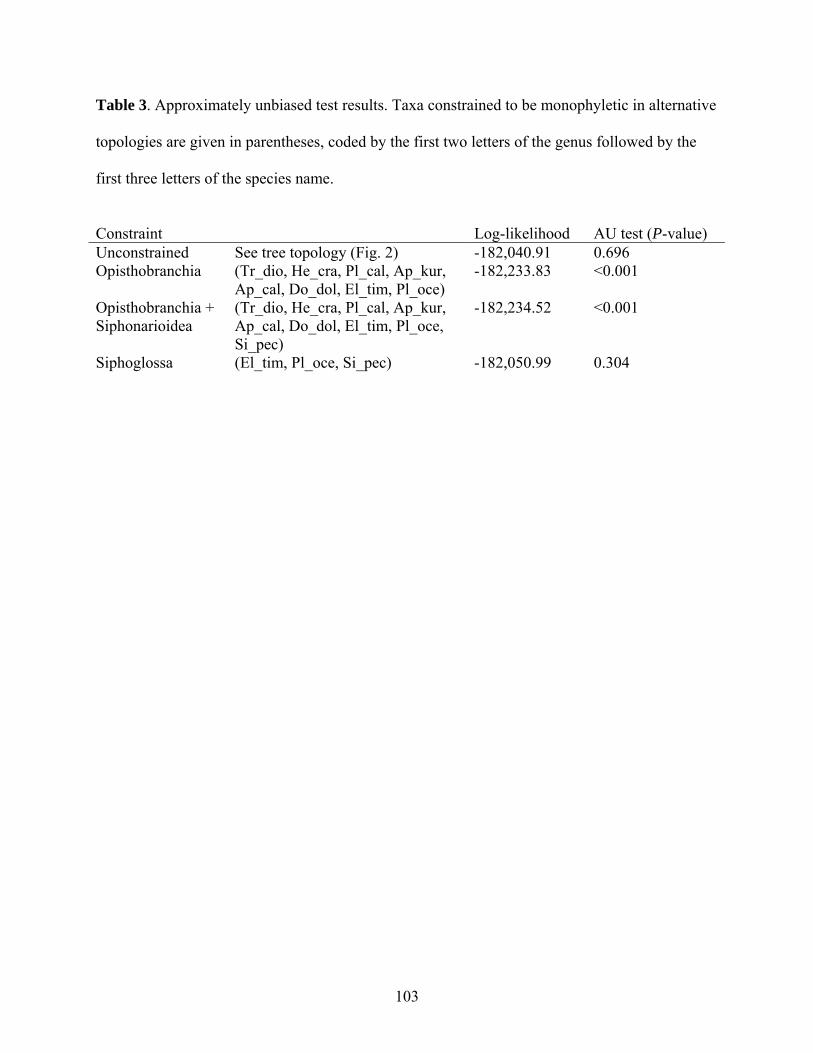
103
Table 3. Approximately unbiased test results. Taxa constrained to be monophyletic in alternative
topologies are given in parentheses, coded by the first two letters of the genus followed by the
first three letters of the species name.
Constraint
Log-likelihood AU test (P-value)
Unconstrained See tree topology (Fig. 2) -182,040.91 0.696 Opisthobranchia (Tr_dio, He_cra, Pl_cal, Ap_kur,
Ap_cal, Do_dol, El_tim, Pl_oce) -182,233.83 <0.001
Opisthobranchia + Siphonarioidea
(Tr_dio, He_cra, Pl_cal, Ap_kur, Ap_cal, Do_dol, El_tim, Pl_oce, Si_pec)
-182,234.52 <0.001
Siphoglossa (El_tim, Pl_oce, Si_pec) -182,050.99 0.304
104
Chapter 4. Molecular phylogeny of Aplacophora
4.1 Abstract
The shell-less, worm-like aplacophoran molluscs have been central to discussions of
early molluscan evolution. Recent molecular investigations strongly supported placement of
Neomeniomorpha (=Solenogastres) and Chaetodermomorpha (=Caudofoveata) in a
monophyletic clade, Aplacophora, which is sister to Polyplacophora (chitons). This clade, called
Aculifera, comprises the sister taxon of all other molluscs and thus is important to understanding
the early evolution of this diverse and important phylum. Within Aculifera, some work has
addressed evolutionary relationships within Polyplacophora, but little is known about
evolutionary relationships within Aplacophora. Therefore, the phylogenetic framework needed to
understand the evolution of key characters for Aplacophora, Aculifera, and even Mollusca as a
whole has been lacking. Here, we employed a phylogenomic approach to obtain the phylogenetic
backbone for the aplacophoran molluscs. Specifically, we sequenced Illumina transcriptomes
from twelve aplacophorans (plus one chiton outgroup) to greatly expand on the paucity of
available genomic data for the group. Our results provide further support for aplacophoran
monophyly and a sister taxon relationship of Aplacophora and Polyplacophora (Aculifera).
Within Chaetodermomorpha, Prochaetodermatidae was placed basal to a clade comprised of
Limifossoridae + Chaetodermatidae, a result at odds with the commonly held hypothesis placing
the putatively plesiomorphic Limifossoridae as the basal-most chaetoderm family. Within the
much more diverse Neomeniomorpha, we find that Cavibelonia, the traditional order defined by
hollow, acicular sclerites and a thick cuticle, is not monophyletic. Our results place
Alexandromenia (Cavibelonia, Amphimeniidae) basal to the remainder of Neomeniomorpha with
105
strong support in all analyses. The remainder of “Cavibelonia” (represented by the families
Proneomeniidae, Simrothiellidae, and Pruvotinidae) is rendered paraphyletic by the order
Neomeniamorpha (Neomenia) although support for the exact placement of Neomeniamorpha
varied among analyses. Lastly, the order Pholidoskepia, which is characterized by sclerites as
thin scales, was recovered monophyletic in all analyses.
4.2 Introduction
4.2.1 General Introduction
Molluscs exhibit remarkable variation in body plan ranging from tiny meiofaunal worms
to giant squid. Nonetheless, these and other molluscs all stem from one common ancestor.
Unfortunately, despite a number of publications on the topic (reviewed by Lindberg and
Ghiselin, 2003), little has been known about the plesiomorphic character states of Mollusca
because of the lack of a phylogenetic framework for the group. Inferring ancestral character
states is especially important and interesting for Mollusca because of their extreme diversity and
because the affinities of several Precambrian and Cambrian fossil taxa, interpreted by most as
stem-group molluscs, have been widely debated (Vinther and Nielsen, 2005; Butterfield, 2006,
2008; Caron et al., 2006; Morris and Caron, 2006; Vinther, 2009; Seilacher and Hagadorn,
2010). Also, because some of the earliest bilaterian fossils are putative molluscs (e.g., Fedonkin
et al., 2007; Ivantsov, 2009), identifying plesiomorphic character states of Mollusca is important
for studies addressing early animal evolution in general.
The two clades of aplacophoran molluscs have generally been regarded as early-
branching molluscs and therefore have been central to questions surrounding the early evolution
of the phylum. Whether these two groups constitute a monophyletic taxon, Aplacophora
106
(Scheltema, 1993, 1996; Ivanov, 1996), or a basal, paraphyletic grade (Salvini-Plawen, 1980,
1981a, 1985a, 2003; Salvini-Plawen and Steiner, 1996; Haszprunar, 2000) has been intensely
debated (reviewed by Todt et al. 2008; Todt 2013). The Aculifera hypothesis (Scheltema, 1993),
which posits a monophyletic Aplacophora sister to Polyplacophora (chitons), implies that the
most recent common ancestor of extant molluscs probably had one or more dorsal shells
(although the homology of chiton and conchiferan shells has been questioned; Haas, 1981;
Scheltema, 1993; Furuhashi et al., 2009) a broad locomotory foot, and some degree of serial
repetition (Scheltema 1993). Alternatively, the Testaria hypothesis (Salvini-Plawen, 1985a;
Salvini-Plawen and Steiner, 1996; Haszprunar, 2000) places the aplacophorans as a basal,
paraphyletic grade with Polyplacophora sister to Conchifera. Under this scenario, the last
common ancestor of extant molluscs would most parsimoniously be reconstructed as a shell-less,
aplacophoran-like animal.
In 2011, three studies addressing deep molluscan phylogeny were published: Kocot et al.,
(2011), Smith et al. (2011), and Vinther et al. (2011). Prior to this time, no phylogenetic studies
based on molecular or morphological characters had provided strong support for the placement
of Neomeniomorpha or Chaetodermomorpha. Importantly, virtually all analyses of all three
studies recovered Neomeniomorpha and Chaetodermomorpha in a monophyletic clade,
Aplacophora, sister to Polyplacophora (chitons) with strong support. This clade, Aculifera, was
originally hypothesized on the basis of shared characters of the nervous system, sclerites, and
epidermal papillae (see Hyman, 1967 and Scheltema, 1993 and references therein. The presence
of dorsal, serially secreted calcareous structures in some aculiferans has been interpreted by
some as support for this hypothesis (although this does not occur in all aculiferans; see Kocot,
2013 and Todt, 2013 for review). Fossil animals interpreted to be morphological intermediates
107
between aplacophorans and chitons have also been cited as support for the Aculifera hypothesis
(Sigwart and Sutton, 2007; Vinther et al., 2011; Sutton and Sigwart, 2012; Sutton et al., 2012).
Support for the Aculifera hypothesis has had an important impact on our understanding
of the plesiomorphic characteristics of Mollusca (Kocot et al., 2011) but many more questions
remain unanswered. Chitons have a fairly rich fossil record (e.g., Puchalski et al. 2008) and their
phylogeny is at least generally understood (Okusu et al. 2003, Sigwart et al. 2011). However, no
bona fide aplacophoran fossils are known (but see Sutton et al. 2001, 2004, 2012) and only one
cladistic morphological analysis has addressed the phylogeny of Neomeniomorpha (Salvini-
Plawen 2003). Although aplacophorans are not the basal-most molluscs as previously thought
(Salvini-Plawen 1985, Salvini-Plawen and Steiner 1996, Haszprunar 2000, Haszprunar et al.
2008), resolving aplacophoran phylogeny is critical to understanding early molluscan evolution
as it could help reveal the evolutionary polarity of key morphological characters for
Aplacophora, Aculifera, and Mollusca as a whole.
4.2.2 Introduction to Aplacophora
The worm-like aplacophoran molluscs are exclusively marine animals characterized by a
narrow or completely reduced foot, a unique dorsoterminal sensory organ, and a small mantle
(=pallial) cavity restricted to the posterior-most part of the body. As the name suggests,
aplacophorans completely lack a shell. Instead, they are covered in a dense coat of spiny and/or
scale-like calcareous sclerites (Scheltema, 1978, 1993; Salvini-Plawen, 1985a, 2003; Todt et al.,
2008). There are two distinct lineages of aplacophorans: Chaetodermomorpha (also called
Caudofoveata) and Neomeniomorpha (also called Solenogastres). Although unfamiliar to even
108
some zoologists, the roughly 400 described species of aplacophoran molluscs are important
members of many marine benthic communities (Scheltema, 1978, 1990; Todt, 2013).
The first two described species of what are now recognized as aplacophoran molluscs,
Chaetoderma nitidulum Lovén, 1844 and Neomenia carinata Tullberg, 1875, perplexed
zoologists. Like other chaetoderms, Chaetoderma nitidulum lacks a foot and, although it has a
radula (tooth-like molluscan feeding organ), this structure is reduced to a single pair of teeth in
this genus. Because of its worm-like shape and the presence of dermal calcareous bodies,
Chaetoderma was initially classified as an echinoderm (together with Priapulus and Echiuris)
rather than a mollusc. Likewise, the molluscan nature of the neomenioid Neomenia carinata was
not immediately accepted because this species has a narrow foot that differs in general
appearance from that of other groups of molluscs and it completely lacks a radula. Thiele (1897,
1907, 1911, Thiele and Schulze, 1913) described additional aplacophoran species and recognized
some molluscan features in these animals. However, he concluded that aplacophorans were not
proper molluscs but rather an evolutionary intermediate between annelids and molluscs. This
view was accepted by most of his contemporaries (e.g., Odhner, 1921) although aplacophorans
appeared in the mollusc volume of Bronn's Classes and Orders of the Animal Kingdom (title
translated from German; Hoffmann, 1929). Pelseneer was the first to suggest that the pedal
groove and fold of solenogasters are homologous to the mantle cavity and foot of chitons,
respectively (See Pelseneer, 1897 and references therein). Wirén (1892) partly agreed with this
view, homologizing the solenogaster “anal chamber” with the mantle cavity of other molluscs.
Hyman (1967), in her thorough review of studies on aplacophoran molluscs to that point, agreed
that aplacophorans are indeed molluscs. The molluscan nature of aplacophorans is now
universally accepted (e.g., Ruppert et al., 2004). The most detailed discussions of the biology of
109
the aplacophoran molluscs to date are provided by Hyman (1967), Salvini-Plawen, (1985a,
2003), Scheltema (1993), Todt et al. (2008), and Todt (2013). In the following two sections, I
will present a brief overview of the biology of each of the two aplacophoran lineages:
Chaetodermomorpha and Neomeniomorpha.
4.2.3 Chaetodermomorpha (Caudofoveata)
Chaetoderm aplacophorans (Figure 1 A-C) are distinguished from neomenioids and other
molluscs by a suite of morphological characters, the most obvious of which are the complete
absence of a foot and the presence of an oral shield (an anterior, muscular structure used in
burrowing and feeding). Chaetoderms have a small mantle cavity restricted to the posterior-most
part of the body that contains one pair of true ctenidia (gills). Notably, the digestive system
differs from that of neomenioids (see below) as it includes a midgut with a distinct glandular
diverticulum separate from the stomach (Salvini-Plawen, 1985a). Only one study has examined
the development of these animals to date but, at least in Chaetoderma, adults are dioecious, free-
spawners with external fertilization giving rise to pelagic, lecithotrophic larvae (Nielsen et al.,
2007). Adult chaetoderms range in size from around 1 mm (most prochaetodermatids;
Scheltema, 1985) to over 40 cm (Chaetoderma felderi; Ivanov and Scheltema, 2007) in length,
although most described species are on the order of 2 mm to 5 cm (Ivanov and Scheltema, 2007).
Chaetoderm aplacophorans commonly inhabit muddy substrata in calm, coastal waters
but they are also common and, in some places, relatively abundant in the deep sea (Scheltema,
1985). For example, Prochaetoderma yongei can reach densities of 400 individuals / m2 in the
north Atlantic although such densities are exceptional. Because of the obvious difficulties in
studying these animals in their natural habitat, little is known about the behavior of chaetoderms
110
in situ. At least some species appear to form horizontal burrows keeping their mantle cavity
(containing the respiratory ctenidia) near the surface of the substratum (see Salvini Plawen 1985a
for discussion). Although without a typical molluscan foot, chaetoderms are able to burrow
efficiently in a peristaltic fashion using their circular and longitudinal musculature. Chaetoderms
are thought to feed on microorganisms such as foraminiferans and/or detritus (Scheltema and
Ivanov 2009). Examination of transcriptome data from Falcidens caudatus suggests that
nematodes may also be on the menu (but a nematode parasite cannot be ruled out; Kocot,
personal observation).
4.2.4 Neomeniomorpha (Solenogastres)
Neomenioids (Figure 1, D-I) are characterized by a narrow, non-muscular foot, and an
anterior ciliated sensory organ (variously referred to in the literature as the atrial sensory organ,
atrium, or vestibulum). Like chaetoderms, neomenioids have a posterior mantle cavity.
Neomenioids lack true molluscan ctenidia although some taxa have secondary elaborations of the
mantle cavity (respiratory papillae) that function in gas exchange (Salvini-Plawen, 1985a). The
radula is highly variable in Neomeniomorpha and may be monoserial (one tooth per row),
biserial/distichous (two teeth per row), tetraserial (four teeth per row; rare), polyserial (many
teeth per row) and the number and arrangement of denticles (spine-like projections on each
tooth) is variable. In some taxa, the radula has been secondarily lost altogether. Neomenioids
have a relatively simple, tube-like midgut that combines the function of a midgut gland and
stomach (Todt and Salvini-Plawen, 2004, 2005). Unlike chaetoderms, neomenioids exhibit a
diversity in the types of sclerites (Scheltema and Schander, 2000, 2006) which may be scales,
needle-like, hooked, or of various other forms with different shaped sclerites associated with
111
different parts of the body (see García-Álvarez and Salvini-Plawen, 2007 for a summary).
Sclerites may be solid or, in the order Cavibelonia, hollow. In terms of their reproduction,
neomenioids are simultaneous hermaphrodites with internal fertilization. Depending on their
body size, mature animals lay just one to hundreds of eggs that usually develop into a pelagic,
lecithotrophic test cell-bearing larval stage called a pericalymma (e.g., Thompson, 1960; Okusu,
2002; Todt and Wanninger, 2010). Some species brood fertilized eggs in a brood pouch
associated with the mantle cavity (Thiele and Schulze, 1913; Heath, 1918; Baba, 1938; Salvini-
Plawen, 1978; Scheltema and Jebb, 1994, Todt and Kocot unpublished data).
Neomenioids range in size from meiofaunal species less than 1 mm long (e.g.,
Meiomenia) to large, epibenthic species that can grow up to around 30 cm in length (e.g.,
Epimenia). They inhabit a wide array of benthic marine environments including coarse sand
(e.g., Meiomenia, Meioherpia), on top of sandy or packed muddy substrates (e.g., Micromenia,
Wirenia), on branching cnidarians (e.g., Anamenia, Epimenia), and even burrowing in sediments
(Neomenia). Most neomenioids are carnivores that feed on cnidarians (Salvini-Plawen 1985a,
Scheltema 1993, Todt et al. 2008) although at least some species in the families Simrothiellidae
(Todt and Salvini-Plawen, 2005) and (probably) Macellomeniidae (Todt, personal
communication) feed on annelids.
4.2.5 Current State of Aplacophoran Taxonomy and Systematics
Within Chaetodermomorpha, classification is based primarily on characteristics of the
sclerites and radula. Around 130 species have been described and three families are generally
recognized (Glaubrecht et al., 2005; Todt, 2013). Limifossoridae has been hypothesized to show
the most ancestral morphology (Salvini-Plawen, 1972) because of the presence of several
112
putatively plesiomorphic characters. These include an anterior, midventral suture in the
limifossorid Scutopus ventrolineatus, which has been interpreted as a vestige of the foot. The
presence of a longitudinal-submarginal muscle system and serially arranged pairs of bundles of
muscle in Scutopus species have also been interpreted as a retained plesiomorphy (Salvini-
Plawen 1985a). Additionally, the anterior, undivided midgut and posterior blind-ended midgut
sac of at least some limifossorids (e.g., Psilodens elongatus; Salvini-Plawen, 1972) have a
similar appearance in histological sections whereas these different regions of the gut are more
specialized in other chaetoderms (see Salvini-Plawen 2003 for discussion). Also, limifossorids
have a relatively large, distichous, neomenioid-like radula (although so do prochaetodermatids;
Scheltema, 1985), which is thought to be plesiomorphic for Chaetodermomorpha.
Chaetodermatids, on the other hand, appear to have a secondarily modified/reduced radula. In the
case of Chaetoderma, the radula is reduced to a simple, two-toothed, forceps-like structure
thought to be an adaptation for selective feeding on infaunal prey (Scheltema et al., 1994).
Prochaetodermatids are typically characterized by a small, short and stout body and a distichous
radula with a unique jaw-like structure. Notably, this family is the most diverse chaetoderm
group in the deep sea and certain species can be the numerically dominant macrofauna in some
places (Scheltema, 1985; Scheltema and Ivanov, 2009).
Within the much more diverse Neomeniomorpha, classification is based primarily on the
cuticle, sclerites, radula, and ventrolateral foregut glandular organs. García-Álvarez and Salvini-
Plawen (2007) present a thorough overview of the taxonomy and systematics of the group which
were largely developed by Salvini-Plawen (1978). Presently, around 280 species in 23 families
and four orders are recognized (García-Álvarez and Salvini-Plawen 2007, Todt 2013). However,
the validity of one of the four orders, Sterrofustia, is dubious (see Discussion). Pholidoskepia and
113
Neomeniamorpha (not to be confused with the similarly spelled name Neomeniomorpha used for
the entire taxon) are grouped together in a higher taxon called Aplotegmentaria on the basis of a
thin cuticle, solid mantle sclerites arranged in one layer, and the absence of epidermal papillae.
Pholidoskepia includes species covered by sclerites that are usually flattened into scales and
with one of two types of ventrolateral foregut glandular organs (see below). Neomeniamorpha
includes the genera Neomenia, Hemimenia, and Archaeomenia which are characterized by a low
body length to diameter ratio, the lack of ventrolateral foregut glandular organs, solid, lanceolate
sclerites, a complicated copulatory apparatus including stylets and associated glands, and
respiratory organs in the mantle cavity. Neomenia and Hemimenia lack a radula while the
putatively plesiomorphic Archaeomenia has retained a polystichous radula. Cavibelonia and
Sterrofustia are grouped together in a higher taxon called Pachytegmentaria on the basis of
acicular sclerites, a thick cuticle, and the presence of epidermal papillae (although exceptions in
the form of species with a thin cuticle and/or lacking epidermal papillae are known). Cavibelonia
is distinguished from Sterrofustia by the presence of hollow acicular sclerites.
This classification system, however, does not reflect the views of García-Álvarez and
Salvini-Plawen (2007) on the phylogeny of the group. They state “The Pholidoskepia represent
the basal group and show different lines of development within the order and, on the one hand,
gave rise to the Neomeniamorpha, and on the other to the Sterrofustia among which, in turn,
might have been the origin of the presumably monophyletic Cavibelonia (Salvini-Plawen, 1978,
1985a, 2003).”
Cladistic morphological analyses by Salvini-Plawen (2003) generally failed to recover
most orders and several families monophyletic, suggesting that the existing taxonomy does not
reflect the evolutionary history of the group or a lack of phylogenetic signal in the analyzed data.
114
Cladistic morphological analyses conducted by Scheltema and Schander (2000) and Scheltema et
al. (2012) addressing more specific questions of neomenioid relationships also had somewhat
limited resolution. Of significance, the analyses of Salvini-Plawen (2003) did recover
Pholidoskepia as a basal, paraphyletic grade, consistent with the phylogenetic hypothesis of
García-Álvarez and Salvini-Plawen (2007) outlined above. However, Salvini-Plawen (2003)
stated “…the available [morphological] characters are extremely homoplastic and that homology
decisions are far too uncertain to accept the resulting trees as reflections of the phylogeny of the
Solenogastres [Neomeniomorpha].” Therefore, molecular data provide an excellent alternative
source of characters to evaluate aplacophoran phylogeny and evolution.
Unfortunately, neomenioid aplacophorans have been shown to pose significant
challenges to molecular systematists (Okusu and Giribet, 2003; Meyer et al., 2010; reviewed by
Todt 2013). All authentic nuclear rRNA gene sequences obtained from neomenioids to date
contain highly GC-rich regions with highly stable secondary structures. Because of these
secondary structures, attempts to amplify rRNA genes from neomenioids often fail, yield
sequences from prey instead, or yield a chimaeric amplicon with pieces from both the
neomenioid and its prey fused together. Attempts to circumvent this problem by employing the
mitochondrial markers COI and 16S resulted in a poorly resolved topology (Kocot et al.,
unpublished data). Moreover, even some COI sequences obtained via PCR and sequencing of
bacterially cloned PCR products may represent exogenous contamination (Kocot et al.,
unpublished data).
Recent phylogenetic analyses based on multiple nuclear protein-coding genes have
provided a framework for understanding the evolutionary diversification of Mollusca, largely
resolving relationships among major molluscan lineages (Kocot et al., 2011; Smith et al., 2011;
115
Vinther et al., 2011). Because of the promise shown by datasets comprised of nuclear protein-
coding genes and difficulties in employing nuclear ribosomal and even mitochondrial genes in
studies of aplacophoran phylogeny, we elected to employ a phylogenomic approach to
reconstruct a phylogenentic framework for Aplacophora. Specifically, we sequenced the
transcriptomes of ten neomenioids, two chaetoderms, and one chiton and conducted a
phylogenomic analysis based on these plus publicly available aculiferan and outgroup
transcriptome and genome data.
4.3 Materials and Methods
4.3.1. Specimen collection and identification
We collected specimens from Norway (several research cruises), Iceland (IceAGE cruise
September-October 2011), North Carolina, USA (WormNet II cruise May 2012), and Friday
Harbor, Washington, USA (See Table 1 for collection information). Specimens were collected
by epibenthic sledge (Norway), Agassiz trawl (Norway, IceAGE), box corer (WormNet II), or
van Veen grab (Friday Harbor). Samples acquired with these various gears were put into buckets
filled with sea water and their contents were gently stirred by hand. After stirring, the relatively
heavy sand and shell fragments were allowed to settle for a few seconds and the remaining
supernatant was gently decanted into a 100 or 250 µm sieve. After several rounds of this gentle
extraction method, the remaining mud/sand was then stirred more roughly by hand. Extracts
were sorted on ice under the dissecting microscope.
Sclerites were isolated by dissolving pieces of mantle tissue in 10% sodium hypochlorite
(household bleach) on a microscope slide until they could be easily scraped away from the
cuticle with a fine needle. Bleach was then rinsed away from the extracted sclerites with multiple
116
rinses of deionized water and the slide was allowed to air dry. Sclerites were then either
embedded in araldite and polymerized overnight at 70°C or they were embedded in euparol and
allowed to dry overnight at 37°C.
In order to identify specimens of most neomenioids, histological sectioning is necessary.
Specimens were relaxed using a 1:1 ratio of 7.5% magnesium chloride solution : filtered sea
water and fixed in 4% phosphate buffered formalin or 4% glutaraldehyde in 0.1 molar sodium
cacodylate buffer pH 7.4 overnight at 4°C and then dehydrated stepwise to 70% ethanol for
storage. Specimens were decalcified in a dilute solution of HCl overnight (about 1 drop in 5 ml
of 70% ethanol). Small specimens were stained with rose bengal (4,5,6,7-tetrachloro-2',4',5',7'-
tetraiodofluorescein) followed by stepwise dehydration in an ethanol series and embedding in
agar low viscosity resin. After polymerizing for around 16 hours at 70°C, the resin blocks were
trimmed and cross section series (2 µm thickness) were made for the anterior and posterior
regions using a Leica RM2255 microtome with a Leica zoom-microscope MZ6 and a Diatome
Jumbo diamond knife. Sections were stained with toluidine blue. Larger specimens were
embedded in paraffin and cross section series (8-10 µm thickness) were made for the anterior
and posterior regions using the same microtome but with a steel knife. De-paraffined sections
were stained with Gomori’s trichorome and hematoxylin. Histological sections were imaged on a
Leica DM600B microscope with a Leica DFC420 digital camera using differential interference
contrast (DIC) or brightfield.
4.3.2. Taxon selection
We aimed to broadly sample as many currently recognized aplacophoran taxa as possible
while including the greatest amount of morphological diversity possible. Collection data for all
117
newly sequenced taxa and overall taxon sampling are presented in Table 2. Previous studies
(Dunn et al., 2008; Kocot et al., 2011; Smith et al., 2011) published data from the chaetoderms
Chaetoderma nitidulum (Chaetodermatidae) and Scutopus ventrolineatus (Limifossoridae) and
the neomenioids Neomenia aff. herwigi (Neomeniidae), Neomenia megatrapezata
(Neomeniidae), Wirenia argentea (Gymnoemniidae), and an unidentified small, white species
collected from a Lithothamnion-dominated habitat in Diskofjord, Greenland (Greg Rouse,
personal communication).
We sought to identify the unidentified species sequenced by Smith et al. (2011). The
authors collected two specimens; one specimen was used for RNA extraction and the other was
fixed for histology/TEM as a voucher and kindly provided to us by the authors. Unfortunately,
the fixative dissolved the sclerites of this specimen making species-level identification or
description impossible. However, we histologically sectioned this specimen and found that it is
an adult cavibelonian with a relatively thin cuticle, lacking stalked epidermal papillae, a radula,
vestibular papillae, respiratory papillae, a dorsoterminal sense organ, and copulatory stylets.
Neither ventrolateral foregut glandular organs nor a dorsal pharyngeal papillary gland were
observed. By considering this combination of characters and examining photos provided to us by
the authors, we were able to determine that this animal is a member of the family Pruvotinidae.
However, no currently described genus within the family exactly matches this combination of
characters. Forcepimenia is probably the closest, although the one described species,
Forcepimenia protecta, has a distichous radula.
To compliment the available chaetoderm transcriptome data, we sequenced the
transcriptome of Spathoderma clenchi (Prochaetodermatidae). Additionally, we sequenced
118
Falcidens caudatus (Chaetodermatidae) to increase representation of Chaetormatidae as
Chaetoderma is represented by only a fairly small Sanger EST library.
Within Neomeniomorpha, we sampled representatives of nine families representing three
of the four currently recognized orders. Of the six families in Pholidoskepia, we sampled
representatives of four including new Illumina data from Meiomeniidae (Meiomenia swedmarki),
Macellomeniidae (Macellomenia sp. nov.), and the diverse family Dondersiidae (Helluoherpia
aegiri and Micromenia fodiens). With twelve families, Cavibelonia is the largest order of
Neomeniomorpha. Although we were only able to sample a limited number of representatives,
our taxon sampling was carefully designed to capture the diversity of the group. We collected
data from representatives of the family Amphimeniidae (Alexandromenia crassa), Pruvotinidae
(Hypomenia sp. nov.), Simrothiellidae (Simrothiella margaritacea and Kruppomenia borealis),
and Proneomeniidae (Proneomenia sluiteri and Proneomenia sp. nov. “brooder”).
4.3.3 Molecular techniques
Because neomenioids have presented problems with prey nucleic acid contamination in
previous molecular studies, most specimens were starved in the laboratory prior to fixation in
RNAlater. Specimens were usually fixed overnight at 4°C followed by storage at -20°C.
Whenever possible, specimens were wiped off with a lab tissue to remove foreign material
adhering to the outside of their body prior to RNA extraction. Notably, because RNAlater
dissolves aplacophoran sclerites, most fixed specimens appeared very clean because foreign
material that had collected on and amongst the sclerites separated from the body during fixation.
Total RNA was extracted from RNAlater-fixed tissue using the RNAqueous Micro kit
(Ambion), the RNeasy Micro kit (Qiagen) with on-column DNase digestion, or TRIzol
119
(Invitrogen) followed by purification using the RNeasy kit (Qiagen) with on-column DNase
digestion. RNA concentration was measured using a Qubit fluorometer (Invitrogen) and RNA
quality was evaluated on a 1% SB agarose gel. For most libraries, first-strand cDNA was
synthesized from 1 µg of total RNA. However, for some very small samples (e.g., the
meiofaunal neomenioids) the eluted RNA was too dilute to measure using the Qubit or visualize
with agaorse gel electrophoresis. In cases where less than 1 µg of total RNA was available, 1 µl
of RNase-OUT (Invitrogen) was mixed with all of the eluted RNA, this mixture was vacuum-
centrifuged to a volume of 3 µl, and all 3 µl were used to make cDNA. First-strand cDNA
synthesis was performed using the SMART cDNA library construction kit (Clontech) as per the
manufacturer’s instructions except that the provided 3’ oligo was replaced with the Cap-Trsa-CV
oligo (5’-AAGCAGTGGTATCAACGCAGAGTCGCAGTCGGTACTTTTTTCTTTTTTV-3’)
as per Meyer et al. (2009). Full-length cDNA was then amplified using the Advantage 2 PCR
system (Clontech) using the minimum number of PCR cycles possible (usually 17-19) and sent
to the HudsonAlpha Institute for Biotechnology (Huntsville, AL, USA) for Illumina TrueSeq
paired-end (PE) library preparation and Illumina sequencing. Each library was sequenced using
approximately one-sixth of an Illumina HiSeq 2000 lane using the 2 X 100 bp PE chemistry.
4.3.4 Sequence processing
Raw PE Illumina reads were digitally normalized using khmer (normalize-by-median.py
-C 30 -k 20 -N 4 -x 2.5e9; Brown et al., 2012). Read pairing was restored by deleting singleton
reads using a custom bioinformatic pipeline that included scripts provided with khmer. The
remaining PE reads were assembled on the Auburn University Molette Lab SkyNet server using
the October 2012 version of Trinity (Grabherr et al., 2011) using the default settings (the number
120
of CPUs used varied with availability). Sanger and 454 transcriptome data were processed and
assembled using the EST2uni pipeline (Forment et al., 2008) following the approach used by
Kocot et al. (2011). This pipeline removes low-quality regions with lucy (Chou and Holmes,
2001), removes vector/adapter sequences with lucy and SeqClean
(http://compbio.dfci.harvard.edu/tgi/software), masks low complexity regions with
RepeatMasker (www.repeatmasker.org), and assembles contigs with CAP3 (Huang and Madan,
1999). Data on sequence quality were used by CAP3 when available. For Illumina data, only
contigs produced by Trinity were retained and processed with TransDecoder for translation
(https://sourceforge.net/p/transdecoder/) but for Sanger and 454 data, contigs and high-quality
singletons (collectively called unigenes) were retained and processed by TransDecoder. Any 454
or Sanger (but not Illumina) sequences not translated by TransDecoder were then processed with
ESTScan for a second attempt at translation (Lottaz et al., 2003). ESTScan employs profile
hidden Markov models based on codon usage in completely sequenced genomes to indentify
indels in protein-coding sequences. The software inserts gaps or deletes erroneous bases as
necessary to correctly translate the input sequence. Thus, this software was useful for the
translation of the more error-prone 454 and Sanger unigenes not translated by TransDecoder.
Because short sequences are more likely to be incorrectly aligned, translated sequences shorter
than 100 AAs were deleted for all taxa with Illumina transcriptomes. However, because taxa
represented by 454 and Sanger transcriptomes generally had much smaller datasets, shorter
sequences were permitted for these taxa in order to reduce the amount of missing data for these .
Extra care was taken to verify correct alignment of these sequences during the manual evaluation
step (see below)
121
4.3.5 Dataset assembly
Because most of the animals sampled in this study were less than 1 cm in length, entire
animals were used for RNA extraction in most cases. Using entire animals for RNA extraction
can be advantageous because some genes are only expressed in certain tissues. On the other
hand, using an entire animal is potentially disadvantageous because contamination from gut
contents, epibionts, and parasites is more likely to occur. In order to screen for, and exclude,
exogenous contamination in our transcriptomes, we employed a BLAST-based filter prior to
orthology inference followed by manual evaluation of amino acid alignments and single-gene
trees. First, a BLAST database was constructed including sequences from close relatives of the
molluscs sampled in this study (“good” sequences; Table 3) as well as sequences from likely
sources of exogenous contamination (“contamination” sequences; Table 3). Notably, some taxa
sampled in this study (Simrothiella, Kruppomenia, and possibly Macellomenia) feed on annelids
(Salvini-Plawen, 1981b; Todt and Salvini-Plawen, 2005; Todt, personal observation). Therefore,
a different contamination database including annelid genomes and transcriptomes was used for
these taxa (“contamination with annelids” sequences; Table 3). Each translated assembly was
searched against the database using BLASTP with an e-value cutoff of 0.0001. Any sequence
with a top BLAST hit to a sequence in the “contamination” database that had an e-value ≥2
orders of magnitude larger than its top BLAST hit to a sequence in the “good” database was
discarded and not considered further. We included our new Illumina transcriptome data from
Proneomenia sp. nov. “brooder” and Alexandromenia crassa in the construction of the “good”
database. Because carefully cleaned, unhatched eggs were used for RNA extraction from
Proneomenia sp. nov., exogenous contamination in this dataset was considered highly unlikely.
122
Likewise, Alexandromenia crassa was starved in the laboratory for an extended period of time so
exogenous contamination was considered highly unlikely.
For orthology inference, we employed HaMStR local 9 (Ebersberger et al., 2009), which
utilizes profile hidden Markov models (pHMMs) generated from completely sequenced
reference taxa in the InParanoid database (Ostlund et al., 2009). Translated unigenes were
searched against the 1,032 single-copy OGs of HaMStR’s “model organism” pHMMs derived
from Homo, Ciona, Drosophila, Caenorhabditis, and Saccharomyces. Translated unigenes
matching an OG’s pHMM were then compared to the proteome of each of these primer taxa
using BLASTP (-strict option). If the primer taxon amino acid sequence contributing to the
pHMM was the best BLASTP hit in each of these back-BLASTs, the unigene was then assigned
to that OG.
If one of the first or last 20 characters of an amino acid sequence was an X
(corresponding to a codon with an ambiguity, gap, or missing data), all characters between the X
and that end of the sequence were deleted and treated as missing data. This step was important as
ends of singletons were occasionally, but obviously, mistranslated. Each OG was aligned with
MAFFT (mafft --auto --localpair --maxiterate 1000; Katoh et al., 2005). Single-OG trees were
then constructed for each OG using FastTreeMP (-slow -gamma; Price et al., 2010). The aligned
OGs and corresponding trees were then manually inspected. During this step, each alignment
was screened for partially mistranslated sequences, paralogs, contaminant sequences, and the
presence of two or more incomplete, non-overlapping sequences from the same OTU that could
be combined into one, more complete chimaeric sequence. Mistranslated sequences were deleted
or trimmed as appropriate. Groups containing putative paralogs were trimmed to the largest set
of orthologous sequences or discarded when orthology could not be confidently ascertained.
123
Highly divergent (long-branch) sequences and sequences otherwise suspected to be
contamination missed by the initial BLAST screen were searched against the NCBI non-
redundant (NR) protein database using BLASTP and were deleted if the results did not return a
mollusc as the top BLAST hit.
The reduced alignments were then trimmed with Gblocks (b1=b2=b3=half the number of
sequences + 1, b4=2, b5=h) to remove regions with ambiguous alignment. Lastly, any
alignments less than 100 amino acids in length were discarded.
If an OG still possessed more than one sequence from one or more OTUs (inparalogs),
the sequence with the shortest average pairwise distance to all others was retained. Pairwise
distances were calculated using a gamma distribution with four rate categories as implemented in
SCaFoS (Roure et al., 2007). If two or more sequences from the same taxon were >25%
divergent, all sequences from that taxon were discarded from that OG. To visualize the amount
of data sampled for each taxon, a gene sampling diagram (Figure 2) was created using MARE
(http://mare.zfmk.de).
4.3.6 Phylogenetic Analysis and Hypothesis Testing
Phylogenetic analyses were conducted using ML in RAxML 7.3.8 (Stamatakis, 2006) and
BI in PhyloBayes MPI 1.2f (Lartillot et al., 2009). For the ML analyses in RAxML the
PROTCATLGF model was used and topological robustness (i.e., nodal support) was assessed
with 100 replicates of nonparametric bootstrapping. Stabilities of OTUs among the bootstrapped
trees were calculated using the leaf stability index (ls_dif) in using the Roguenarok server
(http://193.197.73.70:8080/rnr/roguenarok/about). Competing hypotheses of mollusc phylogeny
were evaluated using the SH-test (Shimodaira, 2002) as implemented in RAxML with the
124
PROTGAMMALGF model. For the BI analysis in Phylobayes, the options “-dir” and “-gtr”
were employed to account for site-specific rate heterogeneity and use a general time reversal
model of amino acid evolution (Lartillot and Philippe, 2004). It should be noted that the
Phylobayes “-dir” flag corresponds to the former “-cat” flag. This option was renamed to clarify
that the CAT model employed by Phylobayes is a Dirichlet process used to account for site-
specific rate heterogeneity not related to the CAT approximation dealing with among-site rate
heterogeneity employed by RAxML. The BI analysis was conducted with five parallel chains run
for 15,000 cycles each, with the first 5,000 trees discarded as burn-in. A 50% majority rule
consensus tree was computed from the remaining 10,000 trees from each chain. Topological
robustness was assessed using posterior probabilities. Maxdiff values below 0.3 indicated that all
chains had converged. All phylogenetic analyses were performed on the Auburn University
Molette Lab SkyNet server.
4.4 Results
After BLAST-based screening to exclude potential contamination, our bioinformatic
pipeline retained only genes sampled from at least ten taxa that are single-copy in the genomes of
Human, Ciona, Drosophila, Caenorhabditis, and Saccharomyces. Manual evaluation of the
alignments and single-gene trees resulted in the exclusion of genes that appeared to contain two
or more paralogs resulting in a final dataset of 193 genes. Because some mistranslated or
otherwise suspect sequences were deleted during the manual evaluation, as few as eight taxa
were sampled for some genes but, on average, fifteen taxa were sampled per gene. The final data
matrix was 56,476 amino acid positions in length with only 46.56% missing data.
125
The ML and BI analyses with Conchifera as the outgroup yielded the same general tree
topology (Figure 3) recovering the monophyly of Polyplacophora (ML bootstrap / BI posterior
probability = 100/100) Chaetodermomorpha (78/96), and Neomeniomorpha (100/100).
Within Chaetodermomorpha, we sampled at least one member of each recognized family
and recovered a strongly supported (100/99) Chaetodermatidae (Falcidens + Chaetoderma) sister
to the limifossorid Scutopus with strong support (100/99). The prochaetodermatid Spathoderma
was placed in a basal position within Chaetodermomorpha in all analyses rooted by Conchifera
although support for its placement (78/96) was somewhat weak. Interestingly, Spathoderma was
placed sister to Polyplacophora in many of the single-gene analyses, albeit with weak support
(data not shown). Hypothesis testing based on the ML topology was conducted using the SH-test
to determine if placement of Spathoderma (Prochaetodermatidae) as the basal chaetoderm was
significantly more likely than the traditional hypothesis placing Scutopus (Limifossoridae) basal
to a clade including Chaetodermatidae and Prochaetodermatidae. Indeed, the SH-test results
(Table 4) showed that basal placement of Limifossoridae (represented by Scutopus) is rejected
given our data (D(LH) = -533.43). Notably, examination of leaf stability scores showed that
Spathoderma was by far the least stable taxon (ls_dif=0.75; Table 2).
Interestingly, manual evaluation of single-gene alignments and trees indicates that
Falcidens caudatus has undergone a partial genome duplication event. In many cases, two
distinctly different copies of a gene were placed into the same putative orthology group, but
these sequences usually formed a clade in the corresponding single-gene trees and BLAST
searches of these sequences against the NCBI NR database usually returned a mollusc as the top
hit. A similar situation was observed in single-gene trees including predicted transcripts derived
from the genome of the annelid Helobdella robusta (see Supplementary Information of Kocot et
126
al. 2011 and references therein). There was no evidence of such a genome duplication event in
the other sampled chaetoderms including the confamilial Chaetoderma nitidulum. However, this
species is represented in the dataset by only a small Sanger EST library so it is possible that such
inparalogs are present in the genome of Chaetoderma and were expressed but were not
sequenced. Aside from the partial genome duplication event, a small amount of contamination
appeared to be present in the Falcidens transcriptome. In some instances, multiple sequences
were present with some clustering together in the single-gene tree while others were placed at
other parts of the tree and had very long branch lengths. Manual BLASTing of these sequences
revealed possible nematode contamination. Because of the paucity of genomic data available
from free-living marine nematodes (e.g., Enoplida), we were unable to determine if this
specimen had nematode contamination because it feeds on them or because it had a nematode
parasite. Also, it is possible that these sequences are actually authentic Falcidens sequences but
they are superficially similar to nematode sequences due to an increased evolutionary rate due to
paralog subfunctionlization after the gene duplication event.
Within Neomeniomorpha, the traditionally recognized order Cavibelonia was not
recovered monophyletic. All analyses placed Alexandromenia (Amphimeniidae) as the basal-
most neomenioid sampled with strong support (100/100) whereas the remaining taxa
traditionally ascribed to Cavibelonia plus the two representatives of Neomeniamorpha formed a
well-supported clade (100/100) sister to Pholidoskepia. Hypothesis testing using the SH-test
showed that monophyly of Cavibelonia including Alexandromenia is significantly less likely
than the topology of the best tree recovered by ML (D(LH) = -1418.00).
We recovered Pholidoskepia (Meiomenia, Wirenia, Macellomenia, Helluoherpia, and
Micromenia) monophyletic with strong support (100/100). In all analyses, the two
127
representatives of Dondersiidae (Micromenia and Helluoherpia) formed a monophyletic clade
with strong support (100/100). The unusual pholidoskepian Macellomenia (Macellomeniidae)
was placed sister to Dondersiidae with moderate to strong support (83/99). Support for
placement of Wirenia relative to Meiomenia and other pholidoskepians was relatively weak in all
analyses. Meiomenia (Meiomeniidae) and Wirenia (Gymnomeniidae) were recovered as a
paraphyletic grade with Meiomenia placed as the basal (sampled) pholidoskepian and Wirenia
sister to Macellomenia + Dondersiidae (53/73). Hypothesis testing using the SH-test based on
the ML topology showed that a sister taxon relationship of Wirenia (Gymnomeniidae) and
Meiomenia (Meiomeniidae) was not significantly less likely than the paraphyletic grade
recovered in the best tree (D(LH) = -0.17).
Neomeniamorpha (represented by Neomenia aff. herwigi and Neomenia megatrapezata;
both Neomeniidae) was recovered monophyletic with strong support in all analyses (100/100).
Interestingly, Neomeniamorpha was placed within Cavibelonia (excluding Alexandromenia)
sister to Proneomeniidae + Simrothiellidae although this placement was weakly support (56/91).
Despite this, hypothesis testing based on the ML topology rejected placement of
Neomeniomorpha sister to the clade including all of the traditional cavibelonians except
Alexandromenia (D(LH) = -115.68). Examination of leaf stability scores showed that Neomenia
megatrapezata, Neomenia aff. herwigi, the unidentified neomenioid from Greenland, and
Hypomenia sp. nov. were tied as the second most unstable taxon (lsi_dif=0.92).
In order to test for potential library-specific problems in the Neomenia spp. libraries (such
as mistranslation, contamination, or paralogy) that were missed during the manual evaluation
steps, we conducted additional ML analyses where 1) Neomenia aff. herwigi was excluded
(Figure 4), 2) Neomenia megatrapezata was excluded (Figure 5), and 3) both species were
128
excluded (Figure 6). When Neomenia aff. herwigi was excluded, Neomenia megatrapezata
remained as the sister taxon of Proneomeniidae + Simrothiellidae with weak to moderate support
(bootstrap support value = 60). However, when Neomenia megatrapezata was excluded,
Neomenia aff. herwigi was placed as sister to Pruvotinidae (89). Exclusion of Neomenia
megatrapezata also affected relationships within Pholidoskepia; Wirenia was basal with
Meiomenia sister to Macellomenia + Dondersiidae but support for placements of Wirenia and
Meiomenia were still relatively weak. Neomeniamorpha was also placed sister to Pruvotinidae
when the conchiferan outgroups were excluded (Figure 6). When both Neomenia species were
excluded (Figure 7), relationships among the remaining taxa were identical to that of the analysis
including all taxa (Figure 3).
In all analyses, the two sampled representatives of Proneomeniidae (Proneomenia sluiteri
and Proneomenia sp. nov.) formed a strongly supported (100/100) clade as did the two sampled
representatives of Simrothiellidae (Simrothiella margaritacea and Kruppomenia borealis;
100/100). Also, the unidentified neomenioid from Greenland sequenced by Smith et al. (2011)
that we identified as a pruvotinid formed a strongly supported (100/100) clade with Hypomenia
(Pruvotinidae).
In order to test the effect of outgroup choice on aplacophoran ingroup relationships, we
conducted a ML analysis in which Lottia gigantea, Crassostrea gigas, and Octopus vulgaris
were excluded and Polyplacophora was used to root the tree (Figure 7). Relationships within
Polyplacophora and Neomeniomorpha were the same as recovered in the ML analysis with
conchiferan outgroups. However, Chaetodermomorpha was paraphyletic with Spathoderma
placed sister to a weakly supported (bs = 67) clade including the remainder of
Chaetodermomorpha + Neomeniomorpha.
129
4.5 Discussion
Here, we present the first molecular phylogenetic hypothesis for Aplacophora which
differs dramatically from the current phylogenetic hypothesis based on morphology. Within
Aplacophora, Chaetodermomorpha and Neomeniomorpha were reciprocally monophyletic in all
analyses except the ML analysis where the conchiferan outgroup taxa were excluded. In that
case, Spathoderma was recovered as sister to a clade including the remainder of
Chaetodermomorpha + Neomeniomorpha (see below). Within Chaetodermomorpha, we sampled
at least one representative of each of the three recognized families. Limifossoridae (represented
by Scutopus) has been viewed as the basal-most chaetoderm taxon because of the presence of
several putative plesiomorphies found in members of the family. However, our results support
placement of Prochaetodermatidae (represented by Spathoderma) as the basal-most chaetoderm
lineage. This result has also been recovered in analyses of a combined dataset of sequences from
the nuclear ribosomal genes 18S and 28S (Mikkelsen et al., unpublished data).
Prochaetodermatids are small, mostly deep sea aplacophorans that differ from other chaetoderms
by characteristics of the oral shield, the presence of a large pair of cuticular jaws, and a small,
distichous radula with eight to twelve rows of teeth on an undivided radular membrane.
Interestingly, when the Conchiferan outgroups were excluded, the prochaetodermatid
Spathoderma was recovered as sister to a clade including the remainder of Chaetodermomorpha
+ Neomeniomorpha, albeit with weak support. Although this result merits further consideration,
support for monophyly of Chaetodermomorpha from morphology as well as nuclear ribosomal
genes (Mikkelsen et al., unpublished data) suggests that this result is an artefact. Why removal of
the conchiferan outgroups would result in chaetoderm paraphyly is unclear. However,
130
Spathoderma is the shortest branched aplacophoran sampled by far. Attraction of Spathoderma
towards the chitons could be caused by so-called “short branch attraction” where two or more
slowly-evolving lineages share symplesiomorphies that have been lost in faster evolving lineages
(reviewed by Philippe et al., 2005, Zhong et al. 2011). Future studies addressing chaetoderm
phylogeny including additional representatives of this mostly deep-sea taxon will hopefully shed
further light on this issue. All analyses recover a monophyletic Chaetodermatidae (Falcidens +
Chaetoderma) with strong support.
Within the much more diverse Neomeniomorpha, we were only able to sample
representatives of three of the four recognized orders: Pholidoskepia, Cavibelonia, and
Neomeniamorpha. However, the fourth order, Sterrofustia (Salvini-Plawen 1978), consists
almost exclusively of Antarctic species which generally fit into the range of morphological
diversity of the cavibelonian family Pruvotinidae. Pruvotinidae is a large, diverse family with
species that span a wide range of morphological variation (summarized by García-Álvarez and
Salvini-Plawen, 2007). Aside from some genus-specific characters (e.g., the tetraserial radula of
Imeroherpia and the unusual reproductive anatomy of Phyllomenia), the order Sterrofustia is
distinguished from Pruvotinidae almost exclusively on the basis of solid versus hollow sclerites.
However exceptions are known and some cavibelonians have exclusively solid sclerites. For
example, Helicoradomenia sp. has sclerites with a solid medullary matrix (Kingsley et al., 2012).
Also, the undescribed species of Hypomenia from which genetic data were collected for this
study exhibits a continuum of sclerite internal cavity sizes ranging from those with a hollow
cavity that fills around half the volume of the sclerite to those with no solid cavity at all (Kocot,
personal observations). The status of Sterrofustia therefore questionable.
131
Cavibelonia is defined by the presence of hollow, acicular sclerites and a thick cuticle
(Salvini-Plawen, 1978). Other characters used in neomenioid taxonomy such as the radula and
ventrolateral foregut glandular organs are quite variable within the group. Of significance, our
results do not recover Cavibelonia monophyletic. Instead, the amphimeniid Alexandromenia is
placed as the basal-most sampled neomenioid while the other cavibelonians form a paraphyletic
group with respect to Neomeniamorpha. Although this result may be surprising, placement of
Alexandromenia is strongly supported by bootstrapping, hypothesis testing, and leaf stability
indices. Moreover, manual evaluation of the single-gene trees revealed that Alexandromenia was
placed basal to the remainder of Neomeniomorpha in most of the single-gene trees (data not
shown). When discussing Cavibelonia, Salvini-Plawen (1985) stated “There is a broad variety in
other characters, viz. the radula (monoserial, biserial, or polyserial-polystich[ous]), the
lateroventral foregut glandular organs (types A-D), and even the hollow spicules (partially
needle-shaped with distal hook; radially one-layered, tangentially polylayered, or both), which
could indicate a polyphyletic differentiation of the hollowed spicules…” Our results are
consistent with either multiple independent origins of hollow sclerites (in Amphimeniidae,
Pruvotinidae, and the last common ancestor of Proneomeniidae + Simrothiellidae) or the
presence of hollow sclerites as the ancestral condition for Neomeniomorpha with independent
losses (in Neomeniamorpha and Pholidoskepia). Given the apparent complexity involved in the
secretion of hollow sclerites, it is perhaps more likely that this sclerite type evolved once with
independent modifications in other lineages such as Pholidoskepia and Neomeniamorpha.
Observations of cavibelonians with reduced hollow cavities in their sclerites (Kocot and Todt,
unpublished data) or solid sclerites (Kingsley et al. 2012) support this hypothesis. Interestingly,
in both Cavibelonia and Pholidoskepia, the first sclerites to appear during development are scales
132
similar to those of Pholidoskepia (Okusu 2000, Todt and Wanninger 2010, Todt and Kocot,
unpublished data). The hollow acicular sclerites of Epimenia (Cavibelonia) appear secondarily
(Okusu 2000) and at least in Wirenia (Pholidoskepia), the adult scales are different from the
larval ones (Todt and Wanninger, 2010). Additional developmental and gene expression studies
examining the process of sclerite biomineralization of these and other aplacophoran taxa will
undoubtedly provide further insight into the evolution of the molluscan scleritome and
biomineralization in general.
The unidentified neomenioid from Greenland, identified by examination of histological
section series as a pruvotinid, was placed sister to Hypomenia sp. nov. As noted above,
Pruvotinidae includes a great deal of morphological variation. Future studies including additional
pruvotinids plus representatives of “Sterrofustia” will likely have significant impacts on the
current taxonomy of these taxa.
Within Neomeniamorpha, we sampled two members of the most diverse genus,
Neomenia, and recovered them as a monophyletic clade with strong support. However, support
for placement of this clade was surprisingly weak and variable among analyses. In the ML and
BI analyses with complete taxon sampling, Neomeniamorpha was placed sister to
Proneomeniidae + Simrothiellidae with poor support. Because of this weak support, we
questioned whether problems with one or both of the Neomenia libraries could be creating
artefactual signal. Therefore, we conducted analyses where we excluded either Neomenia aff.
herwigi, Neomenia megatrapezata, or both. When Neomenia aff. herwigi was excluded,
placement of Neomenia megatrapezata was unaffected (Figure 4) and support for this placement
remained low. However, when Neomenia megatrapezata was excluded, Neomenia aff. herwigi
was placed sister to Pruvotinidae (Figure 5) although support for this placement was also
133
relatively weak. Notably, Neomenia aff. herwigi was represented by a relatively small 454
dataset (60% missing genes, 87% missing positions) while Neomenia megatrapezata was much
more deeply sequenced (19% missing genes and 21% missing positions). Given our thorough
screening for contaminants and paralogy and the fact that both Neomenia datasets are still
recalcitrant to placement when singled-out, we interpret the poor support for placement of this
group as being due to a legitimately difficult node. Future work with broader taxon sampling
including other representatives of Neomeniamorpha such Archaeomenia and Hemimenia would
likely help improve understanding of this issue. Interestingly, Archaeomenia has a polyserial
radula (many teeth per row) – the same condition found in the family Proneomeniidae. It is
possible that the polystichous condition of the radula of Archaeomenia and Proneomeniidae
represents a synapomorphy of the Neomeniamorpha/Proneomeniidae/Simrothiellidae clade with
the very specialized biserial radula of simrothiellids being derived from a polystichous radula. Of
significance, chitons and conchiferans also generally have a polystichous radula. Ancestral state
reconstruction based on maximum parsimony or maximum likelihood was unable to reconstruct
the plesiomorphic state of the radula for Aplacophora or Neomeniomorpha (data not shown) but
our results are at least consistent with broad, rasping radula being plesiomorphic for Mollusca
(Kocot et al. 2011) with independent reductions in the number of teeth per row in
Chaetodermomorpha and several neomenioid lineages.
Pholidoskepia is characterized by a thin cuticle, solid, scale-like sclerites, ventrolateral
foregut glands either as subepithelial accumulated groups of cell bodies opening directly into the
foregut (“clustered type”) or as muscular ducts with subepithelial (extraepithelial) glandular cells
(“type A” after Salvini-Plawen, or Pararrhopalia-type after Handl and Todt 2005), and a radula
that is monoserial (one tooth per row), distichous (two teeth per row), or rarely absent. We
134
sampled four of the six currently recognized families of Pholidoskepia and recovered the group
(as sampled) monophyletic with strong support. Pholidoskepia has been viewed as the most
plesiomorphic extant lineage of Neomeniomorpha (e.g., Salvini-Plawen, 2003). This, combined
with the hypothesis that Neomeniomorpha is the basal-most lineage of Mollusca (now generally
rejected; Kocot et al. 2011, Smith et al. 2011, Vinther et al. 2011) may have in part prompted the
hypothesis that the last common ancestor of Mollusca was a small, aplacophoran-like animal
(e.g., Haszprunar et al., 2008). Our results placing large-bodied taxa throughout
Neomeniomorpha call for a re-evaluation of this hypothesis. However, even if large body size is
a plesiomorphy for Neomeniomorpha, as suggested by our results, large body size is not
necessarily a plesiomorphy for Mollusca as a whole.
Within Pholidoskepia, Dondersiidae includes nine diverse genera characterized by the
presence of two or more different types of mantle scales, a monoserial radula, type A
ventrolateral foregut glandular organs, and the absence of specialized respiratory organs. We
sampled Micromenia fodiens and the unusual species Helluoherpia aegiri because they largely
span the range of morphological variation in the family. Micromenia and Helluoherpia differ in
terms of the sclerites (solid spines present in Helluoherpia but absent in Micromenia),
relationship of the mouth to the vestibulum/atrial sensory organ (separate in Micromenia but
fused in Helluoherpia), number of denticles per tooth of the radula (an even number in
Micromenia and most dondersiids but three in Helluoherpia), and dorsoterminal sense organ
(present in Micromenia but absent in Helluoherpia; Handl and Büchinger, 1996, García-Álvarez
and Salvini-Plawen, 2007). Nonetheless, these two rather different species were recovered in a
well-supported monophyletic clade.
135
Sister to Dondersiidae is Macellomenia sp. nov. The monogeneric Macellomeniidae is
unique within Pholidoskepia in that instead of being covered by thin, scale-like sclerites, they
possess nail-shaped acicular sclerites with a broad base that is anchored into the cuticle. A sister
taxon relationship of Dondersiidae and Macellomeniidae is supported by the presence of type A
ventrolateral foregut glands and a monostichous radula – a character combination not present in
any other described neomenioids except possibly the incompletely described Pholidoherpia
(García-Álvarez and Salvini-Plawen, 2007). However, it should be noted that the radulae of
dondersiids and macellomeniids, although of the same general type, are quite different in
appearance.
Gymnomeniidae and its type species Gymnomenia pellucida were originally described by
Odhner (1921) on the basis of a single naked specimen that completely lacked scales.
Subsequent studies demonstrated that Gymnomenia species do possess thin, scale-like sclerites
(Scheltema, 1999 for G. virgulata; Todt personal observation for G. pellucida) but those of the
specimen studied by Odhner had been dissolved. Gymnomeniidae (represented here by Wirenia)
has been thought to be closely related to Meiomeniidae (represented here by Meiomenia) as the
two families are distinguished almost exclusively on the basis of body size and the number of
different types of sclerites present (Salvini-Plawen, 1985b). Characters shared by these two taxa
include the pedal commissure sac (a unique statocyst-like, geotactic sense organ), an almost
complete lack of a basal lamina in the epidermis and a very thin cuticle together resulting in a
very fragile integument, lateroventral foregut glands lacking ducts, and the persistence of
protonephridia in postlarval or even adult animals (Todt, unpublished data). Our results suggest
that these characters could be plesiomorphies for Pholidoskepia rather than synapomorphies for a
clade including Meiomeniidae + Gymnomeniidae but poor support for the relative placement of
136
these two taxa makes it difficult to make firm conclusions. Sampling of additional members of
both families as well as the putatively closely related family Lepidomeniidae will undoubtedly
help to address this issue.
4.6 Conclusions
For this study, we sequenced the transcriptomes of twelve aplacophorans (plus one chiton
outgroup) and conducted a phylogenomic analysis based on 193 genes from eighteen species of
aplacophorans and seven outgroup species. This work represents the first molecular phylogeny
of Aplacophora and has significantly altered understanding of the evolutionary history of this
interesting but often overlooked group. Molecular phylogenetics practically turns upside-down
previous hypotheses of phylogenetic relationships in both Neomeniomorpha (a cavibelonian
taxon as the first branch within the clade) and Chaetodermomorpha (Prochaetodermatidae as the
first branch within the clade). Especially in Neomeniomorpha, our results are consistent with a
shift from support for the Testaria-hypothesis (small-sized pholidoskepian neomeniomorphs
display the most ancestral morphology within Mollusca) to the Aculifera-hypothesis (ancestral
mollusks were relatively large-sized, polyplacophoran-like animals). Consequently, evolution of
recent aplacophoran molluscs appears to have included several steps of reduction of organ
systems, including the digestive gland, a broad rasping radula, and a kidney. Unfortunately,
because of the expense of transcriptome sequencing and the difficulty of collecting specimens of
this largely deep-sea group, our taxon sampling was necessarily limited. Although we sampled at
least one representative of each family of Chaetodermomorpha, additional studies sampling a
greater range of morphological diversity (especially including more prochaetodermatids and
limifossorids) are necessary. Within Neomeniomorpha, of particular interest for future studies is
137
to substantiate placement of Neomeniamorpha as well as investigate the placement of other
families ascribed to the non-monophyletic order “Cavibelonia,” for example Acanthomeniidae.
This family is characterized by a monostichous radula, “type A” ventrolateral foregut glandular
organs, a thin cuticle, and a combination of hollow acicular sclerites plus solid scale-like sclerites
making it morphologically intermediate between the early-branching Alexandromenia and the
order Pholidoskepia and thus of particular phylogenetic interest. Additionally, molecular data
from taxa belonging to the order Sterrofustia are needed to test the hypothesis that this order is,
at least in part, nested within the family Pruvotinidae. The sterrofustian Phyllomenia is of
particular interest because it has a uniquely organized reproductive system that is thought to
represent the plesiomorphic condition for Neomeniomorpha (reviewed by Salvini-Plawen 1985).
In addition to providing the first molecular phylogenetic hypothesis for Aplacophora, we
have dramatically expanded the previously limited amount of genetic data from aculiferan
molluscs by producing deeply sequenced, high-quality Illumina transcriptomes for nineteen taxa.
It is our hope that these transcriptome data, made available en toto as unassembled reads (NCBI
SRA accession numbers TBD) and as assembled contigs (Data Dryad accession numbers TBD),
will be of use to researchers addressing a wide array of evolutionary questions. Moreover, it is
our intention to build on this research by employing this dataset as a template for oligomer probe
design for target-capture studies (e.g., Lemmon et al., 2012) employing a smaller number of
phylogentically informative loci from a much broader range of aplacophoran taxa. We are
optimistic that future studies with improved taxon sampling will continue to provide insight into
the evolution of Aplacophora, Aculifera, and Mollusca as a whole.
4.7 References
138
Baba K., 1938. The later development of a solenogastre, Epimenia verrucosa (Nierstraz). J. Dept. Agric. Fukuoka Univ. 6, 21–40.
Brown C.T., Howe A., Zhang Q., Pyrkosz A.B., Brom T.H., 2012. A Reference-Free Algorithm for Computational Normalization of Shotgun Sequencing Data. arXiv:1203.4802. .
Butterfield N.J., 2006. Hooking some stem-group “worms”: fossil lophotrochozoans in the Burgess Shale. BioEssays. 28, 1161–1166.
Butterfield N.J., 2008. An early Cambrian radula. J. Paleontol. 82, 543–554.
Caron J.B., Scheltema A., Schander C., Rudkin D., 2006. A soft-bodied mollusc with radula from the Middle Cambrian Burgess Shale. Nature. 442, 159–163.
Chou H.-H., Holmes M.H., 2001. DNA sequence quality trimming and vector removal. Bioinformatics. 17, 1093 –1104.
Dunn C.W., Hejnol A., Matus D.Q., Pang K., Browne W.E., Smith S.A., Seaver E., Rouse G.W., Obst M., Edgecombe G.D., others, 2008. Broad phylogenomic sampling improves resolution of the animal tree of life. Nature. 452, 745–749.
Ebersberger I., Strauss S., Von Haeseler A., 2009. HaMStR: Profile hidden markov model based search for orthologs in ESTs. BMC Evol. Biol. 9, 157.
Fedonkin M.A., Simonetta A., Ivantsov A.Y., 2007. New data on Kimberella, the Vendian mollusc-like organism (White Sea region, Russia): palaeoecological and evolutionary implications. Geological Society, London, Special Publications. 286, 157–179.
Forment J., Gilabert F., Robles A., Conejero V., Nuez F., Blanca J., 2008. EST2uni: an open, parallel tool for automated EST analysis and database creation, with a data mining web interface and microarray expression data integration. BMC Bioinformatics. 9, 5.
Furuhashi T., Schwarzinger C., Miksik I., Smrz M., Beran A., 2009. Molluscan shell evolution with review of shell calcification hypothesis. Comp. Biochem. Phys. B. 154, 351–371.
García-Álvarez O., Salvini-Plawen L., 2007. Species and diagnosis of the families and genera of Solenogastres (Mollusca). Iberus. 25, 73–143.
Glaubrecht M., Maitas L., v. Salvini‐Plawen L., 2005. Aplacophoran Mollusca in the Natural History Museum Berlin. An annotated catalogue of Thiele’s type specimens, with a brief review of “Aplacophora” classification. Zoosystematics and Evol. 81, 145–166.
Grabherr M.G., Haas B.J., Yassour M., Levin J.Z., Thompson D.A., Amit I., Adiconis X., Fan L., Raychowdhury R., Zeng Q., Chen Z., Mauceli E., Hacohen N., Gnirke A., Rhind N., Palma F. di, Birren B.W., Nusbaum C., Lindblad-Toh K., Friedman N., Regev A., 2011. Full-length transcriptome assembly from RNA-Seq data without a reference genome. Nature Biotechnol. 29, 644–652.
139
Haas W., 1981. Evolution of calcareous hardparts in primitive molluscs. Malacologia. 21, 403-418.
Handl C.H., Büchinger T., 1996. Helluoherpia aegiri gen.n. et sp.n. aus Norwegen (Mollusca: Solenogastres: Dondersiidae). Ann. Naturhist. Mus. Wien. 98, 65–70.
Haszprunar G., Schander C., Halanych K.M., 2008. Relationships of higher molluscan taxa. Phylogeny and Evolution of the Mollusca. University of California, Berkeley, Los Angeles, CA, pp. 19–32.
Haszprunar G., 2000. Is the Aplacophora monophyletic? A cladistic point of view. Am. Malacol. Bull. 15, 115–130.
Heath H., 1918. Solenogastres from the eastern coast of North Am. Mem. Mus. Comp. Zool. 45, 185–263.
Hoffmann H., 1929. Aplacophora, Polyplacophora., Klassen und Ordnung des Tierreichs, Leipzig,
Huang X., Madan A., 1999. CAP3: A DNA Sequence Assembly Program. Genome Research. 9, 868 –877.
Ivanov D.L., Scheltema A.H., 2007. Chaetoderma felderi—a new giant caudofoveate species from the Gulf of Mexico (Mollusca: Aplacophora). Ruthenica. 17, 7.
Ivanov D.L., 1996. Origin of Aculifera and problems of monophyly of higher taxa in molluscs. Origin and Evolutionary Radiation of the Mollusca. 59–65.
Ivantsov A.Y., 2009. New reconstruction of Kimberella, problematic Vendian metazoan. Paleontological J. 43, 601–611.
Katoh K., Kuma K., Toh H., Miyata T., 2005. MAFFT version 5: improvement in accuracy of multiple sequence alignment. Nucleic Acids Res. 33, 511 –518.
Kingsley R., Froelich J., Marks C., Spicer L., Todt C., 2012. Formation and morphology of epidermal sclerites from a deep-sea hydrothermal vent solenogaster Helicoradomenia sp. (Solenogastres, Mollusca). Zoomorphology. 1–9.
Kocot K.M., Cannon J.T., Todt C., Citarella M.R., Kohn A.B., Meyer A., Santos S.R., Schander C., Moroz L.L., Lieb B., Halanych K.M., 2011. Phylogenomics reveals deep molluscan relationships. Nature. 477, 452–456.
Kocot K.M., 2013. Recent advances and unanswered questions in deep molluscan phylogenetics. Am. Malacol. Bull. 31, 1–14.
Lartillot N., Lepage T., Blanquart S., 2009. PhyloBayes 3: a Bayesian software package for phylogenetic reconstruction and molecular dating. Bioinformatics. 25, 2286.
140
Lartillot N., Philippe H., 2004. A Bayesian mixture model for across-site heterogeneities in the amino-acid replacement process. Mol. Biol. Evol. 21, 1095.
Lemmon A.R., Emme S.A., Lemmon E.M., 2012. Anchored hybrid enrichment for massively high-throughput phylogenomics. Syst. Biol. 61, 727–744.
Lindberg D.R., Ghiselin M.T., 2003. Fact, theory and tradition in the study of molluscan origins. Proc. Cal. Acad Sci. 54, 663–686.
Lottaz C., Iseli C., Jongeneel C.V., Bucher P., 2003. Modeling sequencing errors by combining Hidden Markov models. Bioinformatics. 19, ii103–ii112.
Meyer A., Todt C., Mikkelsen N., Lieb B., 2010. Fast evolving 18S rRNA sequences from Solenogastres (Mollusca) resist standard PCR amplification and give new insights into mollusk substitution rate heterogeneity. BMC Evol. Biol. 10, 70.
Meyer A., Witek A., Lieb B., 2011. Selecting ribosomal protein genes for invertebrate phylogenetic inferences: how many genes to resolve the Mollusca? Methods Ecol. Evol. 2, 34–42.
Meyer E., Aglyamova G.V., Wang S., Buchanan-Carter J., Abrego D., Colbourne J.K., Willis B.L., Matz M.V., 2009. Sequencing and de novo analysis of a coral larval transcriptome using 454 GSFlx. BMC Genomics. 10, 219.
Morris S.C., Caron J.B., 2006. Halwaxiids and the Early Evolution of the Lophotrochozoans. Science. 313, 951.
Nielsen C., Haszprunar G., Ruthensteiner B., Wanninger A., 2007. Early development of the aplacophoran mollusc Chaetoderma. Acta Zoologica. 88, 231–247.
Odhner N.H., 1921. Norwegian Solenogastres. Bergens Museums Aarbok 1918-1919, Avhandl. og Aarsber., Naturvid. raekke. 3, 1–86.
Okusu A., Giribet G., 2003. New 18S rRNA sequences from neomenioid aplacophorans and the possible origin of persistent exogenous contamination. J. Molluscan Stud. 69, 385.
Okusu A., 2002. Embryogenesis and development of Epimenia babai (Mollusca Neomeniomorpha). Biol. Bull. 203, 87–103.
Ostlund G., Schmitt T., Forslund K., Kostler T., Messina D.N., Roopra S., Frings O., Sonnhammer E.L.L., 2009. InParanoid 7: new algorithms and tools for eukaryotic orthology analysis. Nucleic Acids Res. 38, D196–D203.
Pelseneer P., 1897. Mollusques. Rueff, Paris.
Philippe H., Zhou Y., Brinkmann H., Rodrigue N., Delsuc F., 2005. Heterotachy and long-branch attraction in phylogenetics. BMC Evol. Biol. 5, 50.
141
Price M.N., Dehal P.S., Arkin A.P., 2010. FastTree 2 – Approximately Maximum-Likelihood Trees for Large Alignments. PLoS ONE. 5, e9490.
Roure B., Rodriguez-Ezpeleta N., Philippe H., 2007. SCaFoS: a tool for Selection, Concatenation and Fusion of Sequences for phylogenomics. BMC Evol. Biol. 7, S2.
Ruppert E.E., Fox R.S., Barnes R.D., 2004. Invertebrate Zoology. Thomson, Belmont, CA.
Salvini-Plawen L. v., Steiner G., 1996. Synapomorphies and plesiomorphies in higher classification of Mollusca., Origin and Evolutionary Radiation of the Mollusca, Oxford University Press, Oxford, pp. 29–51.
Salvini-Plawen L., 1972. Zur Morphologie und Phylogenie der Mollusken: Die Beziehungen der Caudofoveata und der Solenogastres als Aculifera, als Mollusca und als Spiralia. Z. Wiss. Zool. 184, 205–394.
Salvini-Plawen L., 1978. Antarktische und subuntarktische Solenogastres. Zoologica. 44, 1–315.
Salvini-Plawen L., 1980. A reconsideration of systematics in the Mollusca (phylogeny and higher classification). Malacologia. 19, 249–278.
Salvini-Plawen L., 1981a. On the origin and evolution of the Mollusca. Atti. Conv. Lincei. 49, 235–293.
Salvini-Plawen L., 1981b. The molluscan digestive system in evolution. Malacologia. 21, 371–401.
Salvini-Plawen L., 1985a. Early evolution and the primitive groups., The Mollusca, Academic Press, Orlando, pp. 59–150.
Salvini-Plawen L., 1985b. New interstitial Solenogastres (Mollusca). Stygologia. 1, 101–108.
Salvini-Plawen L., 2003. On the phylogenetic significance of the aplacophoran Mollusca. Iberus. 21, 67–97.
Scheltema A., Schander C., 2006. Exoskeletons: Tracing Molluscan Evolution. Venus. 65, 19–26.
Scheltema A.H., Ivanov D.L., 2009. A natural history of the deep-sea aplacophoran Prochaetoderma yongei and its relationship to confamilials (Mollusca, Prochaetodermatidae). Deep-Sea Res. II. 56, 1856–1864.
Scheltema A.H., Jebb M., 1994. Natural history of a solenogaster mollusc from Papua New Guinea, Epimenia australis (Thiele)(Aplacophora: Neomeniomorpha). J. Nat. Hist. 28, 1297–1318.
Scheltema A.H., Schander C., Kocot K.M., 2012. Hard and Soft Anatomy in Two Genera of Dondersiidae (Mollusca, Aplacophora, Solenogastres). Biol. Bull. 222, 233–269.
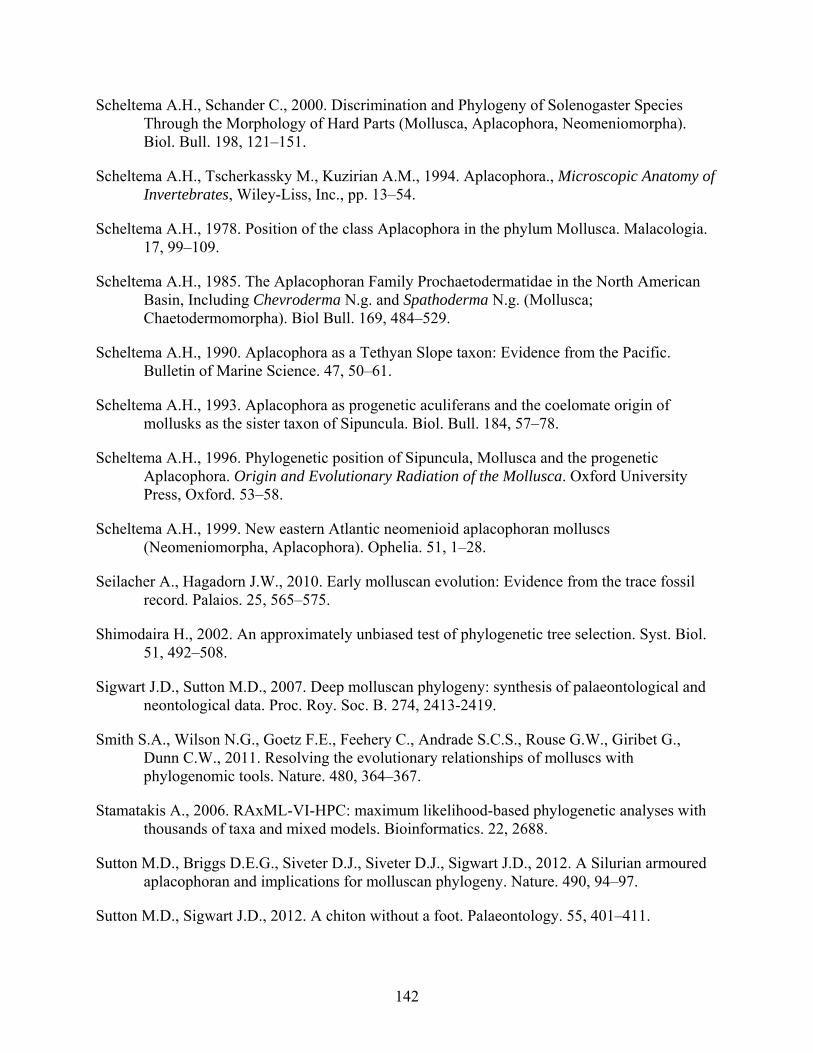
142
Scheltema A.H., Schander C., 2000. Discrimination and Phylogeny of Solenogaster Species Through the Morphology of Hard Parts (Mollusca, Aplacophora, Neomeniomorpha). Biol. Bull. 198, 121–151.
Scheltema A.H., Tscherkassky M., Kuzirian A.M., 1994. Aplacophora., Microscopic Anatomy of Invertebrates, Wiley-Liss, Inc., pp. 13–54.
Scheltema A.H., 1978. Position of the class Aplacophora in the phylum Mollusca. Malacologia. 17, 99–109.
Scheltema A.H., 1985. The Aplacophoran Family Prochaetodermatidae in the North American Basin, Including Chevroderma N.g. and Spathoderma N.g. (Mollusca; Chaetodermomorpha). Biol Bull. 169, 484–529.
Scheltema A.H., 1990. Aplacophora as a Tethyan Slope taxon: Evidence from the Pacific. Bulletin of Marine Science. 47, 50–61.
Scheltema A.H., 1993. Aplacophora as progenetic aculiferans and the coelomate origin of mollusks as the sister taxon of Sipuncula. Biol. Bull. 184, 57–78.
Scheltema A.H., 1996. Phylogenetic position of Sipuncula, Mollusca and the progenetic Aplacophora. Origin and Evolutionary Radiation of the Mollusca. Oxford University Press, Oxford. 53–58.
Scheltema A.H., 1999. New eastern Atlantic neomenioid aplacophoran molluscs (Neomeniomorpha, Aplacophora). Ophelia. 51, 1–28.
Seilacher A., Hagadorn J.W., 2010. Early molluscan evolution: Evidence from the trace fossil record. Palaios. 25, 565–575.
Shimodaira H., 2002. An approximately unbiased test of phylogenetic tree selection. Syst. Biol. 51, 492–508.
Sigwart J.D., Sutton M.D., 2007. Deep molluscan phylogeny: synthesis of palaeontological and neontological data. Proc. Roy. Soc. B. 274, 2413-2419.
Smith S.A., Wilson N.G., Goetz F.E., Feehery C., Andrade S.C.S., Rouse G.W., Giribet G., Dunn C.W., 2011. Resolving the evolutionary relationships of molluscs with phylogenomic tools. Nature. 480, 364–367.
Stamatakis A., 2006. RAxML-VI-HPC: maximum likelihood-based phylogenetic analyses with thousands of taxa and mixed models. Bioinformatics. 22, 2688.
Sutton M.D., Briggs D.E.G., Siveter D.J., Siveter D.J., Sigwart J.D., 2012. A Silurian armoured aplacophoran and implications for molluscan phylogeny. Nature. 490, 94–97.
Sutton M.D., Sigwart J.D., 2012. A chiton without a foot. Palaeontology. 55, 401–411.
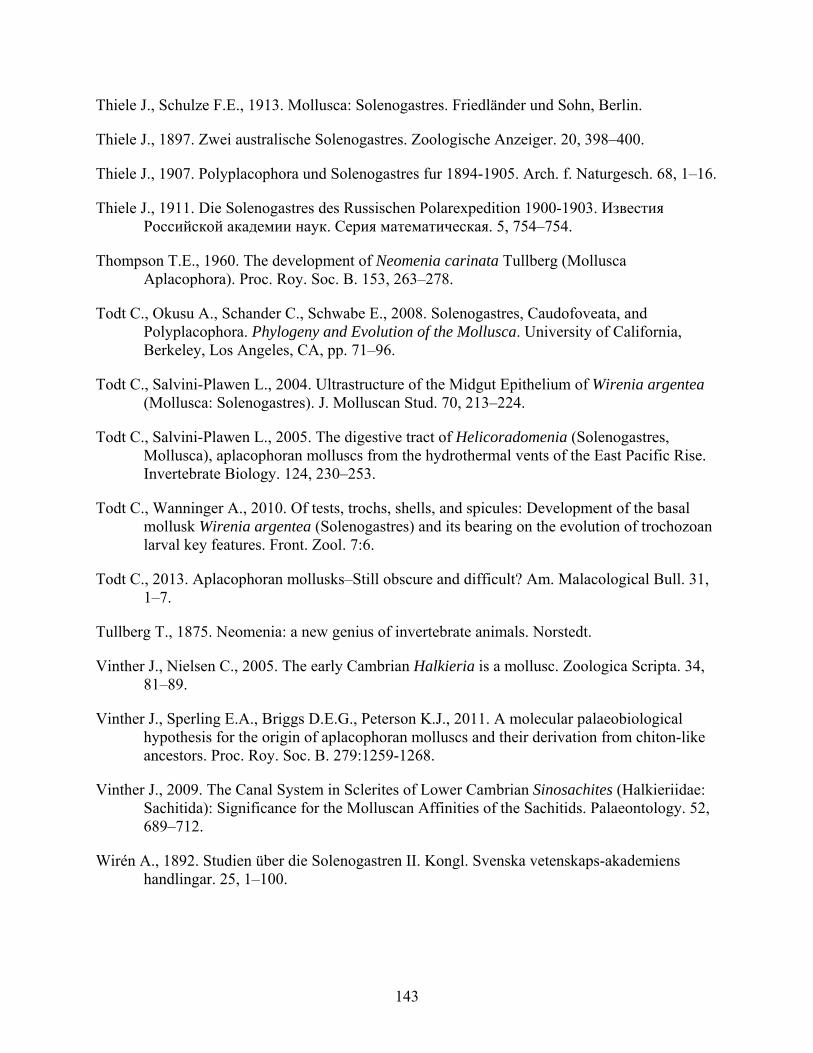
143
Thiele J., Schulze F.E., 1913. Mollusca: Solenogastres. Friedländer und Sohn, Berlin.
Thiele J., 1897. Zwei australische Solenogastres. Zoologische Anzeiger. 20, 398–400.
Thiele J., 1907. Polyplacophora und Solenogastres fur 1894-1905. Arch. f. Naturgesch. 68, 1–16.
Thiele J., 1911. Die Solenogastres des Russischen Polarexpedition 1900-1903. Известия Российской академии наук. Серия математическая. 5, 754–754.
Thompson T.E., 1960. The development of Neomenia carinata Tullberg (Mollusca Aplacophora). Proc. Roy. Soc. B. 153, 263–278.
Todt C., Okusu A., Schander C., Schwabe E., 2008. Solenogastres, Caudofoveata, and Polyplacophora. Phylogeny and Evolution of the Mollusca. University of California, Berkeley, Los Angeles, CA, pp. 71–96.
Todt C., Salvini-Plawen L., 2004. Ultrastructure of the Midgut Epithelium of Wirenia argentea (Mollusca: Solenogastres). J. Molluscan Stud. 70, 213–224.
Todt C., Salvini-Plawen L., 2005. The digestive tract of Helicoradomenia (Solenogastres, Mollusca), aplacophoran molluscs from the hydrothermal vents of the East Pacific Rise. Invertebrate Biology. 124, 230–253.
Todt C., Wanninger A., 2010. Of tests, trochs, shells, and spicules: Development of the basal mollusk Wirenia argentea (Solenogastres) and its bearing on the evolution of trochozoan larval key features. Front. Zool. 7:6.
Todt C., 2013. Aplacophoran mollusks–Still obscure and difficult? Am. Malacological Bull. 31, 1–7.
Tullberg T., 1875. Neomenia: a new genius of invertebrate animals. Norstedt.
Vinther J., Nielsen C., 2005. The early Cambrian Halkieria is a mollusc. Zoologica Scripta. 34, 81–89.
Vinther J., Sperling E.A., Briggs D.E.G., Peterson K.J., 2011. A molecular palaeobiological hypothesis for the origin of aplacophoran molluscs and their derivation from chiton-like ancestors. Proc. Roy. Soc. B. 279:1259-1268.
Vinther J., 2009. The Canal System in Sclerites of Lower Cambrian Sinosachites (Halkieriidae: Sachitida): Significance for the Molluscan Affinities of the Sachitids. Palaeontology. 52, 689–712.
Wirén A., 1892. Studien über die Solenogastren II. Kongl. Svenska vetenskaps-akademiens handlingar. 25, 1–100.
144
Figure 1. Examples of aplacophoran molluscs. A. Chaetoderma nitidulum
(Chaetodermomorpha, Chaetodermatidae). Photo by Christiane Todt. Scale bar = 1 mm. B.
Scutopus ventrolineatus (Chaetodermomorpha, Limifossoridae). Photo by Christiane Todt. Scale
bar = 0.3 mm. C. Falcidens crossotus (Chaetodermomorpha, Chaetodermatidae). Scale bar = 0.2
145
mm. Photo by Christiane Todt. D. Amphimeniidae sp. (Neomeniomorpha). Lateral view.
Specimen is approximately 8 cm in length. Photo by Christoph Held. E. Same specimen as in D
crawling on surface tension of water. Note characteristically broad foot. F. Neomenia
megatrapezata (Neomeniomorpha, Neomeniidae). Lateral view. Specimen is approximately 15
cm in length. Photo by Christoph Held. G. Same specimen as in F showing atrium and mouth
(left; atrium is smaller opening dorsal to [to the left of in photo] mouth) and mantle cavity
(right). H. Unidentified solenogaster (Neomeniomorpha) with long, spine-like sclerites. Anterior
showing part of pedal groove is to the right. Specimen is approximately 1 cm in length. I.
Phyllomenia sp. (Neomeniomorpha, Phyllomeniidae). Dorsal view with anterior to the left. -
Specimen is approximately 2 mm in length.
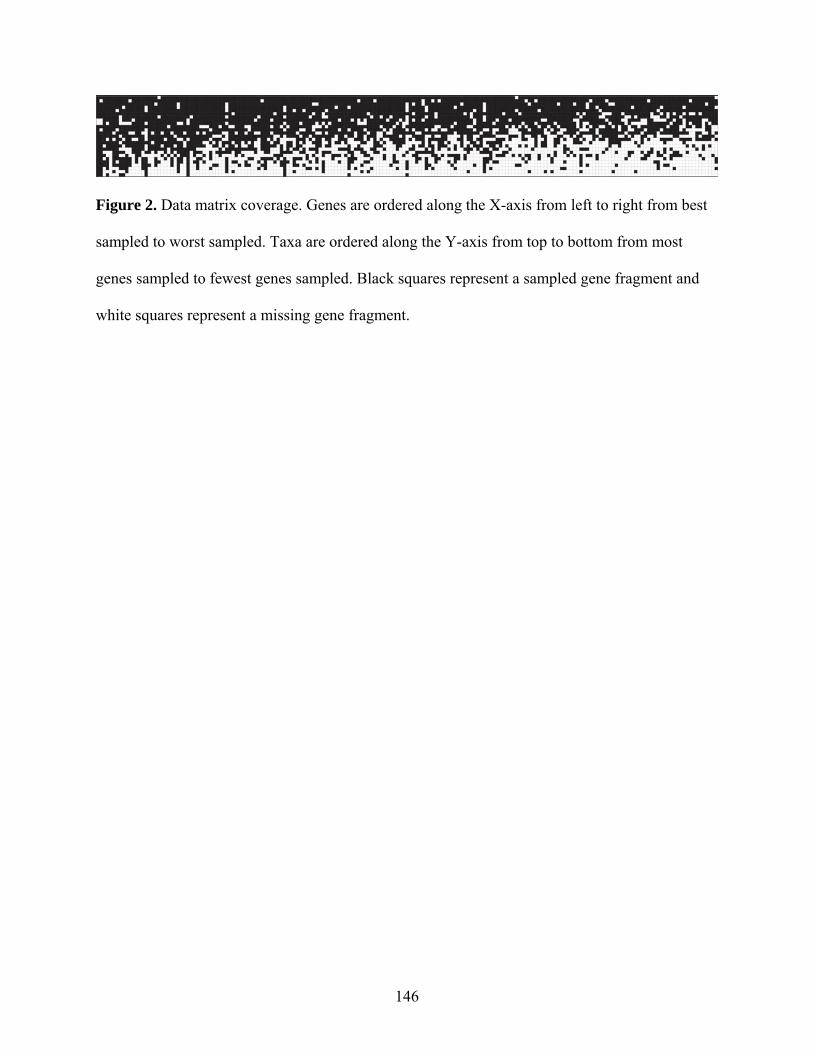
146
Figure 2. Data matrix coverage. Genes are ordered along the X-axis from left to right from best
sampled to worst sampled. Taxa are ordered along the Y-axis from top to bottom from most
genes sampled to fewest genes sampled. Black squares represent a sampled gene fragment and
white squares represent a missing gene fragment.
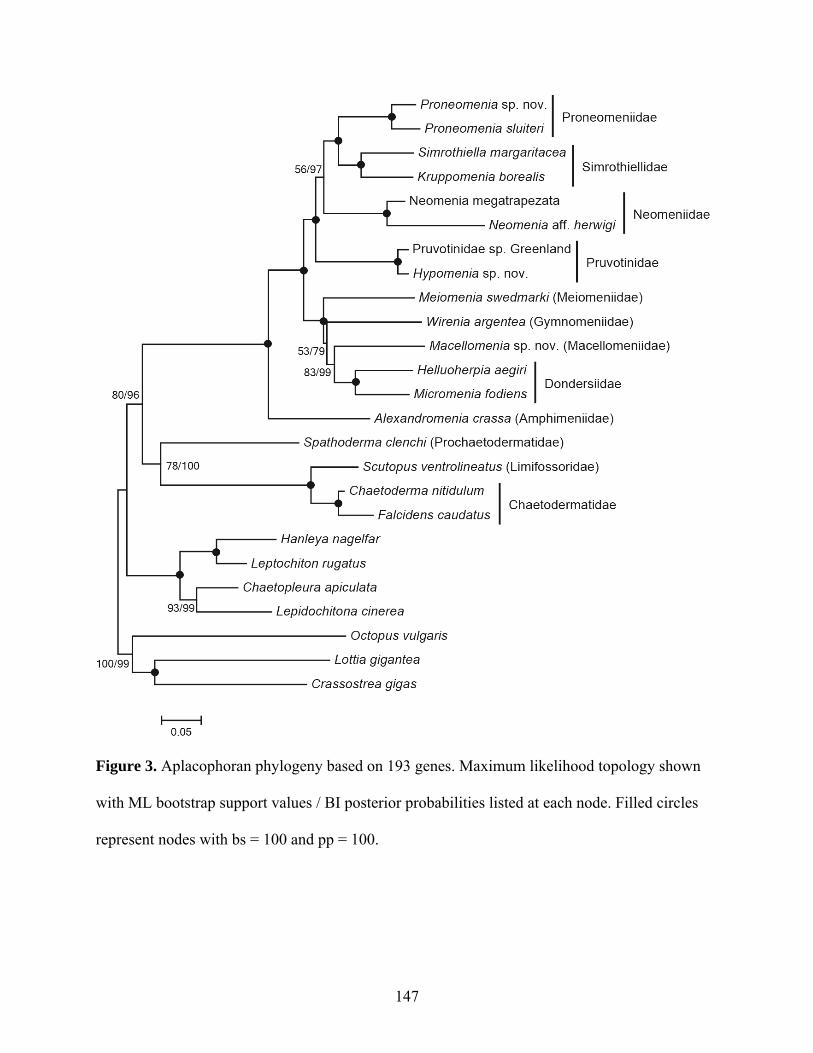
147
Figure 3. Aplacophoran phylogeny based on 193 genes. Maximum likelihood topology shown
with ML bootstrap support values / BI posterior probabilities listed at each node. Filled circles
represent nodes with bs = 100 and pp = 100.
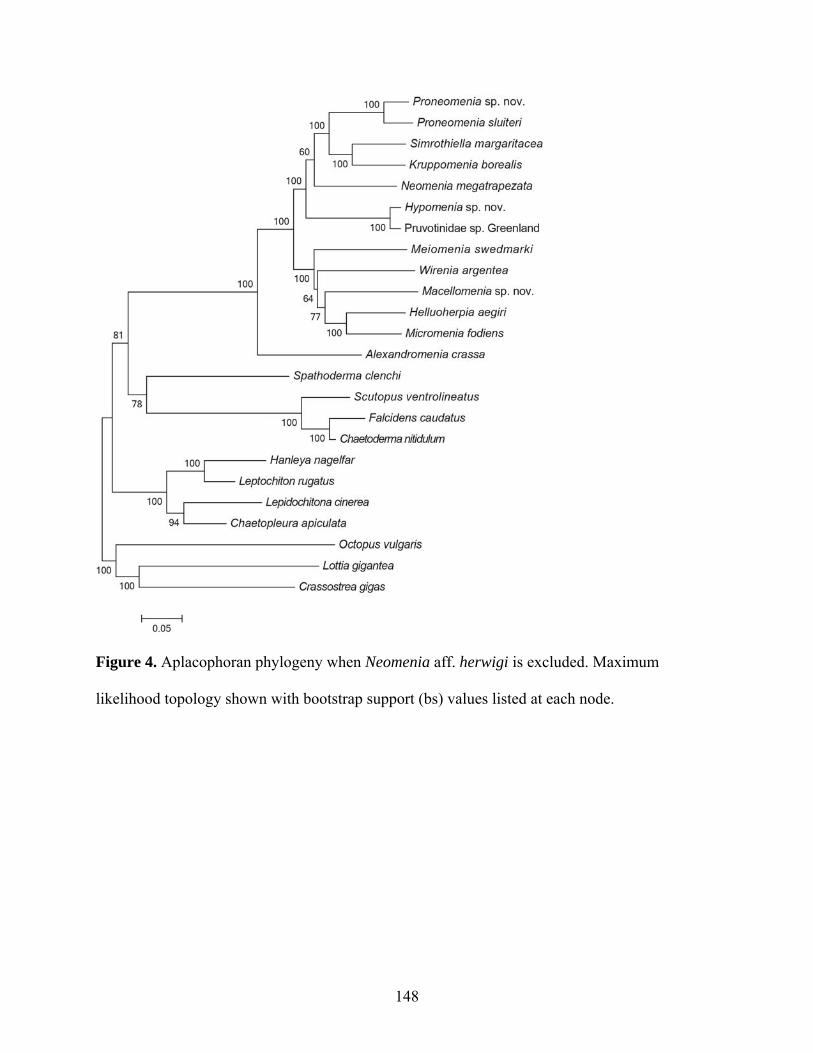
148
Figure 4. Aplacophoran phylogeny when Neomenia aff. herwigi is excluded. Maximum
likelihood topology shown with bootstrap support (bs) values listed at each node.
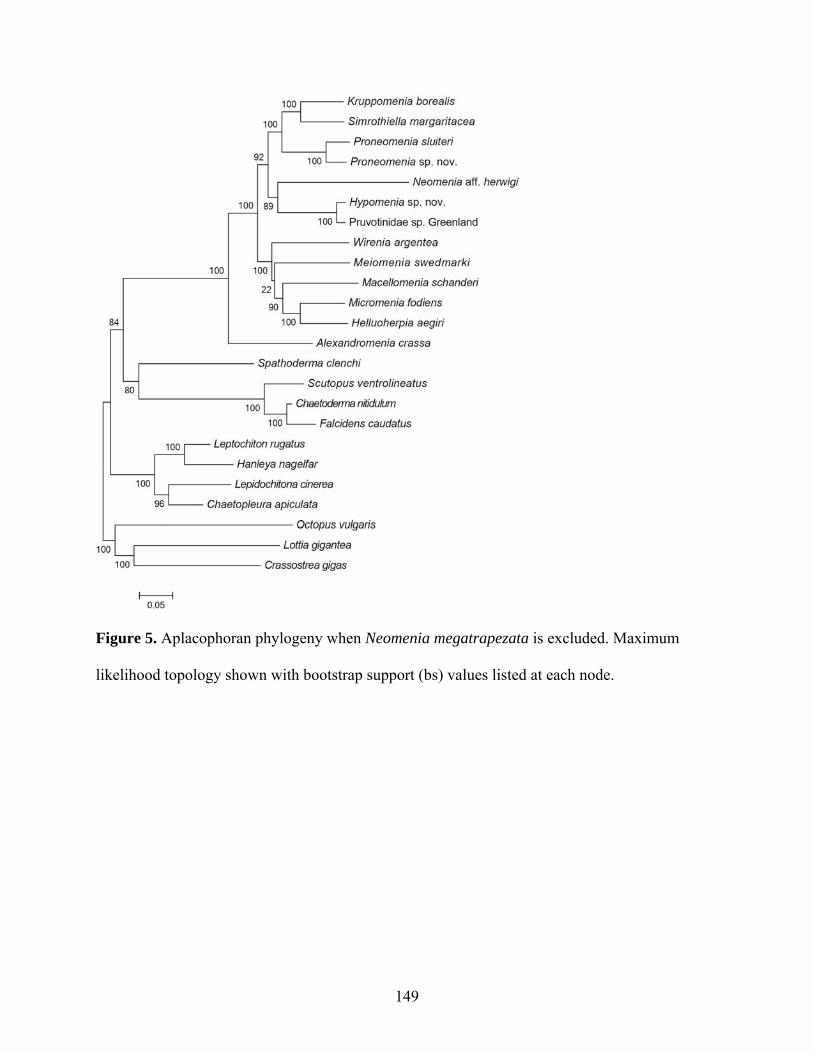
149
Figure 5. Aplacophoran phylogeny when Neomenia megatrapezata is excluded. Maximum
likelihood topology shown with bootstrap support (bs) values listed at each node.
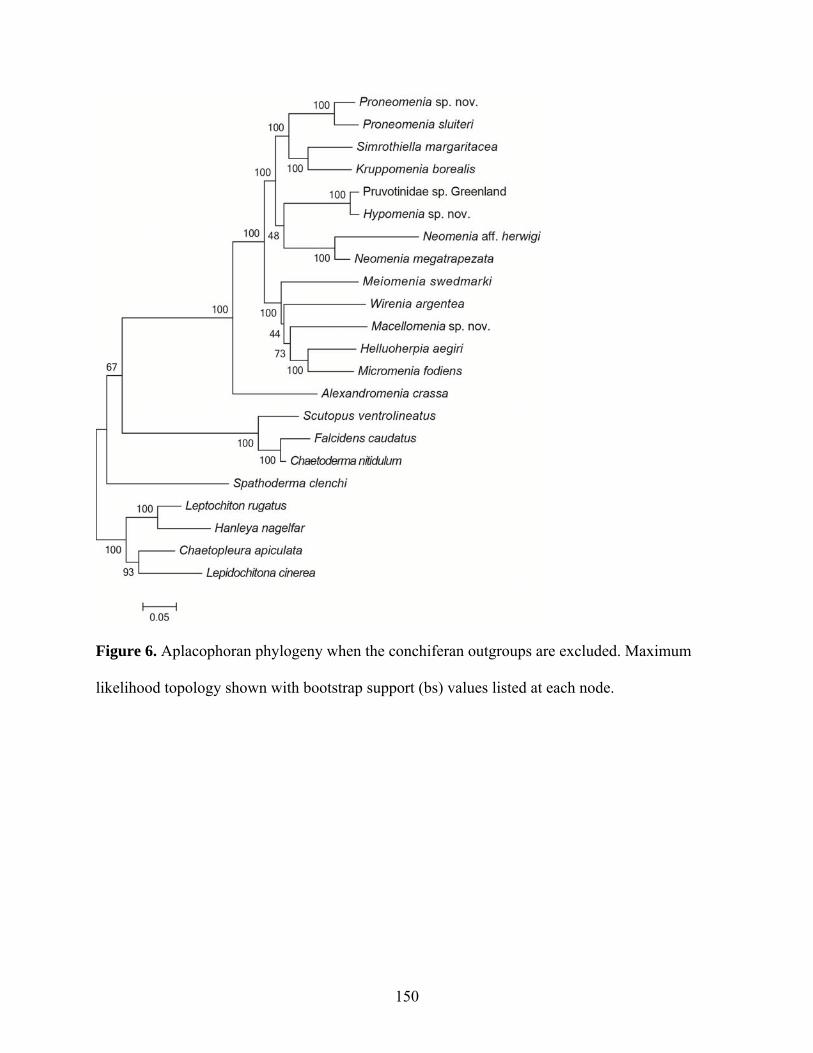
150
Figure 6. Aplacophoran phylogeny when the conchiferan outgroups are excluded. Maximum
likelihood topology shown with bootstrap support (bs) values listed at each node.
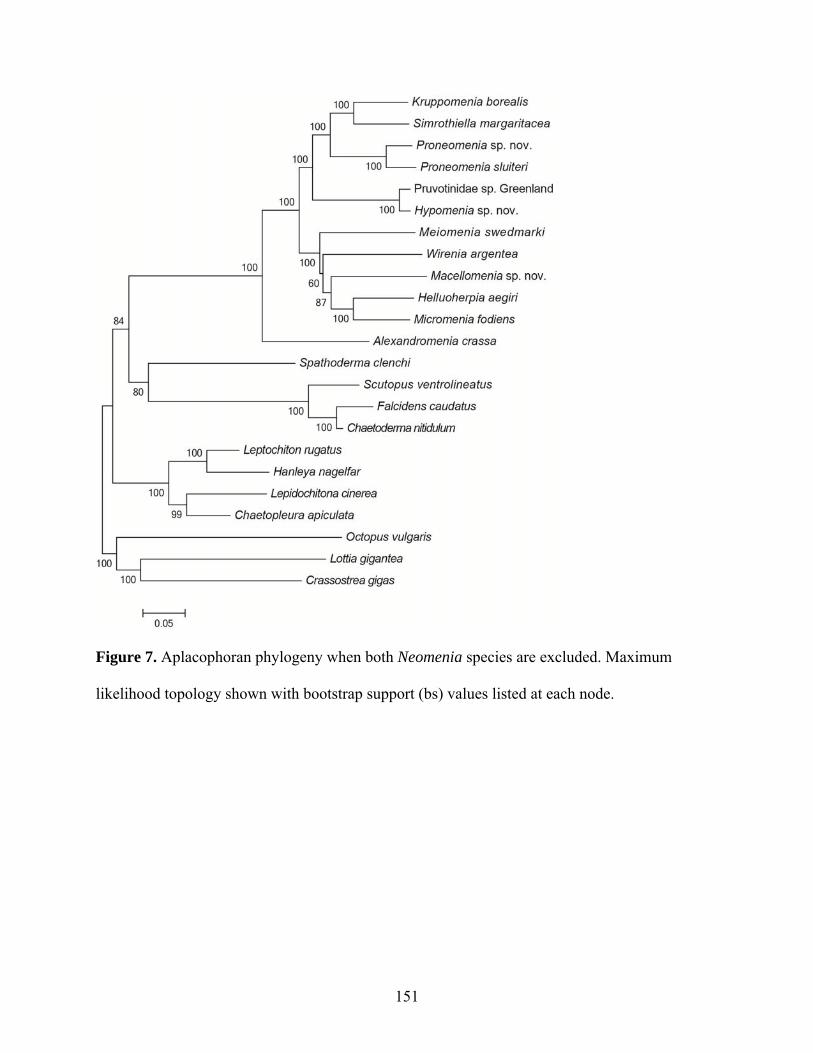
151
Figure 7. Aplacophoran phylogeny when both Neomenia species are excluded. Maximum
likelihood topology shown with bootstrap support (bs) values listed at each node.
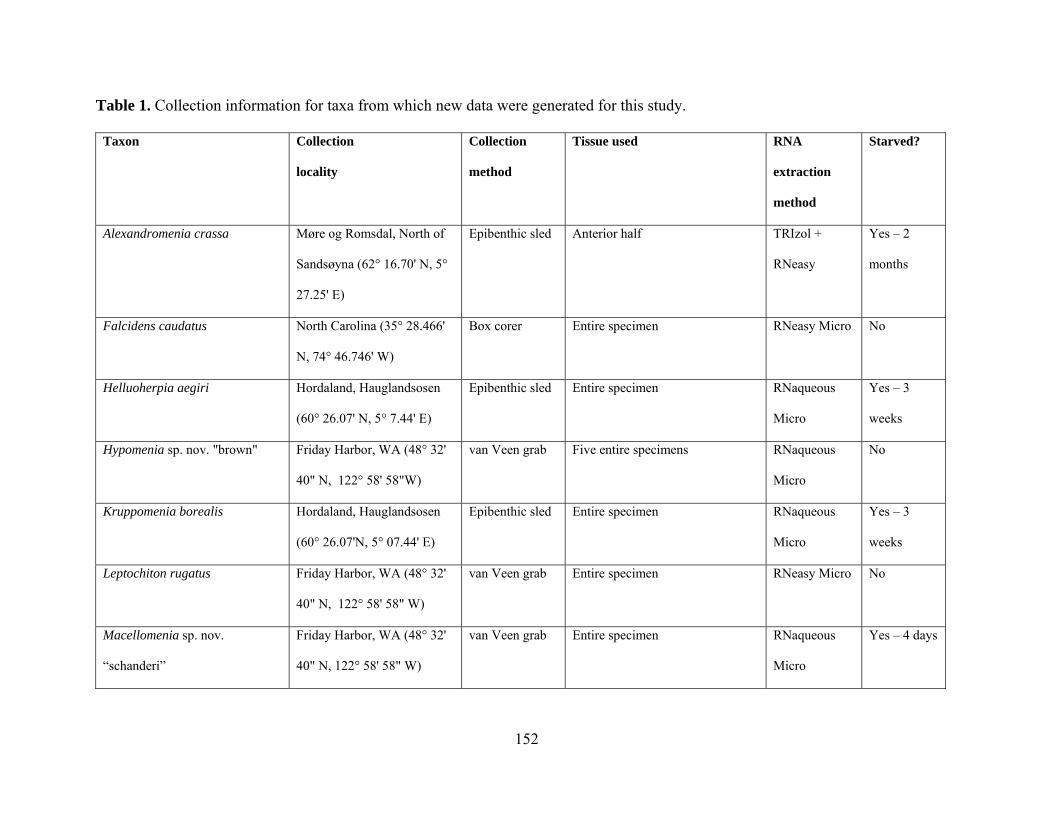
152
Table 1. Collection information for taxa from which new data were generated for this study.
Taxon Collection
locality
Collection
method
Tissue used RNA
extraction
method
Starved?
Alexandromenia crassa Møre og Romsdal, North of
Sandsøyna (62° 16.70' N, 5°
27.25' E)
Epibenthic sled Anterior half TRIzol +
RNeasy
Yes – 2
months
Falcidens caudatus North Carolina (35° 28.466'
N, 74° 46.746' W)
Box corer Entire specimen RNeasy Micro No
Helluoherpia aegiri Hordaland, Hauglandsosen
(60° 26.07' N, 5° 7.44' E)
Epibenthic sled Entire specimen RNaqueous
Micro
Yes – 3
weeks
Hypomenia sp. nov. "brown" Friday Harbor, WA (48° 32'
40" N, 122° 58' 58"W)
van Veen grab Five entire specimens RNaqueous
Micro
No
Kruppomenia borealis Hordaland, Hauglandsosen
(60° 26.07'N, 5° 07.44' E)
Epibenthic sled Entire specimen RNaqueous
Micro
Yes – 3
weeks
Leptochiton rugatus Friday Harbor, WA (48° 32'
40" N, 122° 58' 58" W)
van Veen grab Entire specimen RNeasy Micro No
Macellomenia sp. nov.
“schanderi”
Friday Harbor, WA (48° 32'
40" N, 122° 58' 58" W)
van Veen grab Entire specimen RNaqueous
Micro
Yes – 4 days
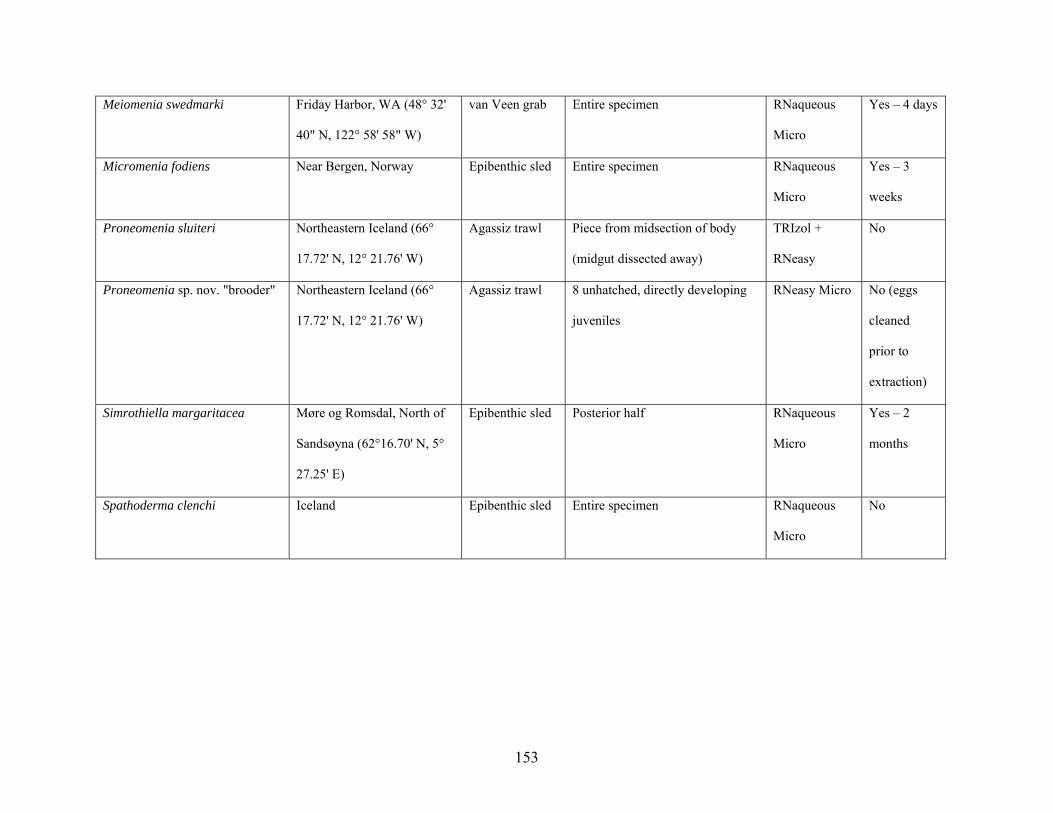
153
Meiomenia swedmarki Friday Harbor, WA (48° 32'
40" N, 122° 58' 58" W)
van Veen grab Entire specimen RNaqueous
Micro
Yes – 4 days
Micromenia fodiens Near Bergen, Norway Epibenthic sled Entire specimen RNaqueous
Micro
Yes – 3
weeks
Proneomenia sluiteri Northeastern Iceland (66°
17.72' N, 12° 21.76' W)
Agassiz trawl Piece from midsection of body
(midgut dissected away)
TRIzol +
RNeasy
No
Proneomenia sp. nov. "brooder" Northeastern Iceland (66°
17.72' N, 12° 21.76' W)
Agassiz trawl 8 unhatched, directly developing
juveniles
RNeasy Micro No (eggs
cleaned
prior to
extraction)
Simrothiella margaritacea Møre og Romsdal, North of
Sandsøyna (62°16.70' N, 5°
27.25' E)
Epibenthic sled Posterior half RNaqueous
Micro
Yes – 2
months
Spathoderma clenchi Iceland Epibenthic sled Entire specimen RNaqueous
Micro
No
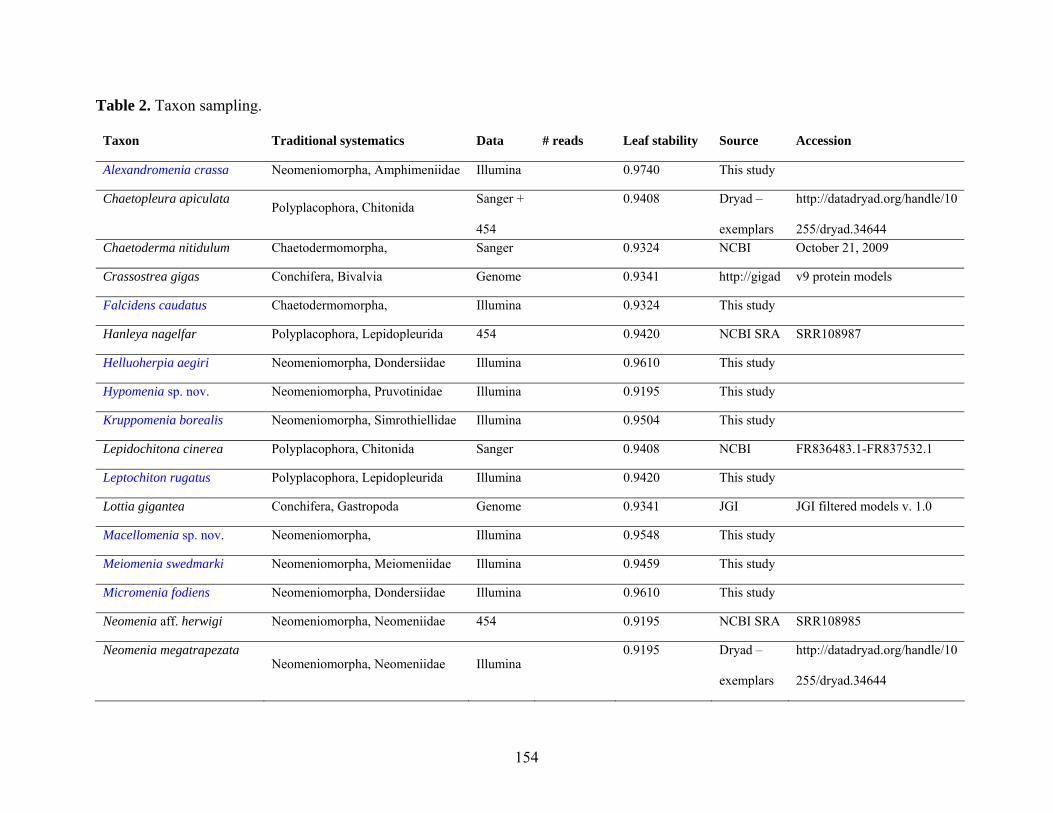
154
Table 2. Taxon sampling.
Taxon Traditional systematics Data # reads Leaf stability Source Accession
Alexandromenia crassa Neomeniomorpha, Amphimeniidae Illumina 0.9740 This study
Chaetopleura apiculata Polyplacophora, Chitonida
Sanger +
454
0.9408
Dryad –
exemplars
http://datadryad.org/handle/10
255/dryad.34644
Chaetoderma nitidulum Chaetodermomorpha, Sanger 0.9324 NCBI October 21, 2009
Crassostrea gigas Conchifera, Bivalvia Genome 0.9341 http://gigad v9 protein models
Falcidens caudatus Chaetodermomorpha, Illumina 0.9324 This study
Hanleya nagelfar Polyplacophora, Lepidopleurida 454 0.9420 NCBI SRA SRR108987
Helluoherpia aegiri Neomeniomorpha, Dondersiidae Illumina 0.9610 This study
Hypomenia sp. nov. Neomeniomorpha, Pruvotinidae Illumina 0.9195 This study
Kruppomenia borealis Neomeniomorpha, Simrothiellidae Illumina 0.9504 This study
Lepidochitona cinerea Polyplacophora, Chitonida Sanger 0.9408 NCBI FR836483.1-FR837532.1
Leptochiton rugatus Polyplacophora, Lepidopleurida Illumina 0.9420 This study
Lottia gigantea Conchifera, Gastropoda Genome 0.9341 JGI JGI filtered models v. 1.0
Macellomenia sp. nov. Neomeniomorpha, Illumina 0.9548 This study
Meiomenia swedmarki Neomeniomorpha, Meiomeniidae Illumina 0.9459 This study
Micromenia fodiens Neomeniomorpha, Dondersiidae Illumina 0.9610 This study
Neomenia aff. herwigi Neomeniomorpha, Neomeniidae 454 0.9195 NCBI SRA SRR108985
Neomenia megatrapezata Neomeniomorpha, Neomeniidae Illumina
0.9195 Dryad –
exemplars
http://datadryad.org/handle/10
255/dryad.34644
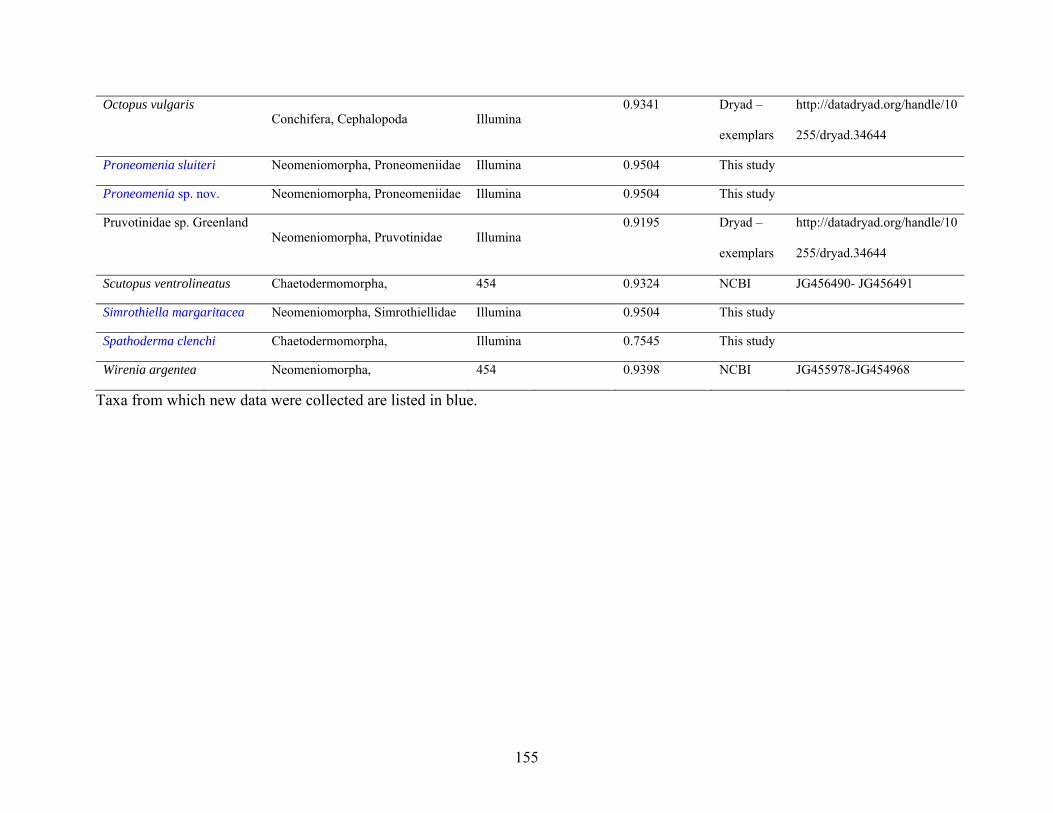
155
Octopus vulgaris Conchifera, Cephalopoda Illumina
0.9341 Dryad –
exemplars
http://datadryad.org/handle/10
255/dryad.34644
Proneomenia sluiteri Neomeniomorpha, Proneomeniidae Illumina 0.9504 This study
Proneomenia sp. nov. Neomeniomorpha, Proneomeniidae Illumina 0.9504 This study
Pruvotinidae sp. Greenland Neomeniomorpha, Pruvotinidae Illumina
0.9195 Dryad –
exemplars
http://datadryad.org/handle/10
255/dryad.34644
Scutopus ventrolineatus Chaetodermomorpha, 454 0.9324 NCBI JG456490- JG456491
Simrothiella margaritacea Neomeniomorpha, Simrothiellidae Illumina 0.9504 This study
Spathoderma clenchi Chaetodermomorpha, Illumina 0.7545 This study
Wirenia argentea Neomeniomorpha, 454 0.9398 NCBI JG455978-JG454968
Taxa from which new data were collected are listed in blue.
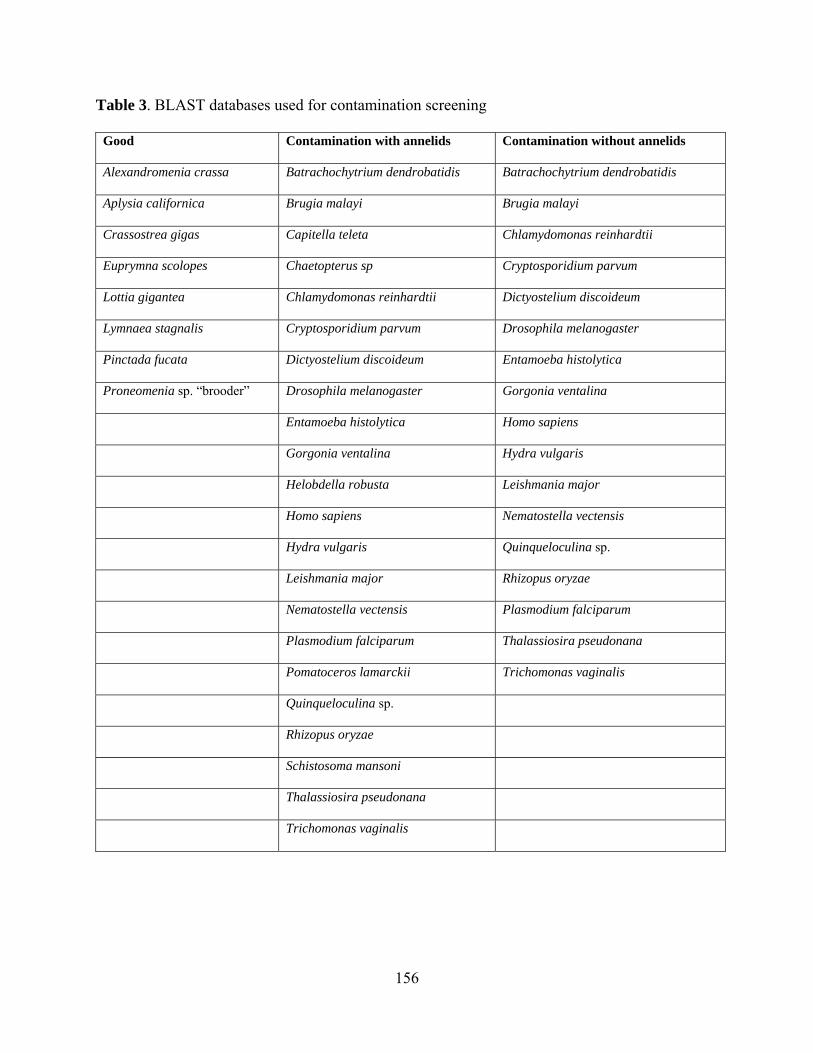
156
Table 3. BLAST databases used for contamination screening
Good Contamination with annelids Contamination without annelids
Alexandromenia crassa Batrachochytrium dendrobatidis Batrachochytrium dendrobatidis
Aplysia californica Brugia malayi Brugia malayi
Crassostrea gigas Capitella teleta Chlamydomonas reinhardtii
Euprymna scolopes Chaetopterus sp Cryptosporidium parvum
Lottia gigantea Chlamydomonas reinhardtii Dictyostelium discoideum
Lymnaea stagnalis Cryptosporidium parvum Drosophila melanogaster
Pinctada fucata Dictyostelium discoideum Entamoeba histolytica
Proneomenia sp. “brooder” Drosophila melanogaster Gorgonia ventalina
Entamoeba histolytica Homo sapiens
Gorgonia ventalina Hydra vulgaris
Helobdella robusta Leishmania major
Homo sapiens Nematostella vectensis
Hydra vulgaris Quinqueloculina sp.
Leishmania major Rhizopus oryzae
Nematostella vectensis Plasmodium falciparum
Plasmodium falciparum Thalassiosira pseudonana
Pomatoceros lamarckii Trichomonas vaginalis
Quinqueloculina sp.
Rhizopus oryzae
Schistosoma mansoni
Thalassiosira pseudonana
Trichomonas vaginalis
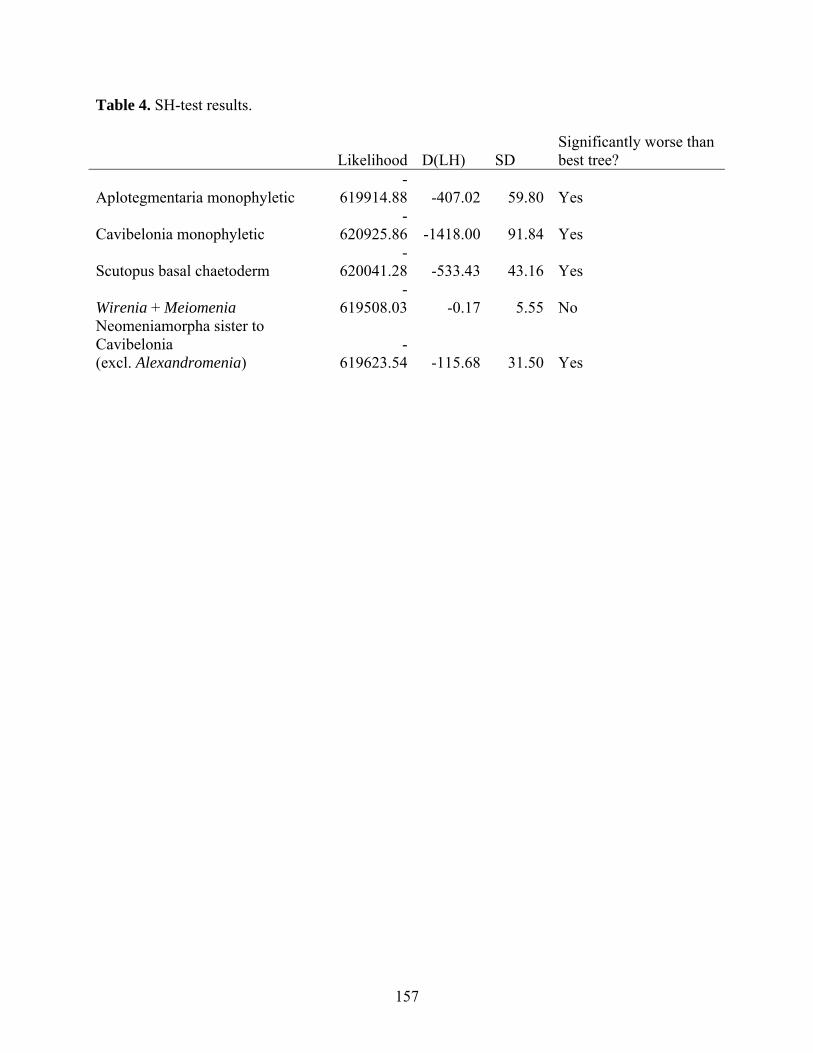
157
Table 4. SH-test results.
Likelihood D(LH) SD Significantly worse than best tree?
Aplotegmentaria monophyletic -
619914.88 -407.02 59.80 Yes
Cavibelonia monophyletic -
620925.86 -1418.00 91.84 Yes
Scutopus basal chaetoderm -
620041.28 -533.43 43.16 Yes
Wirenia + Meiomenia -
619508.03 -0.17 5.55 No Neomeniamorpha sister to Cavibelonia (excl. Alexandromenia)
-619623.54 -115.68 31.50 Yes
158
Chapter 5. Molecular phylogeny of Lophotrochozoa and the search for the molluscan sister taxon
5.1 Abstract
Recent phylogenomic studies have improved understanding of evolutionary relationships
within Lophotrochozoa, but many questions remain unanswered. Importantly, relationships
within Trochozoa (the group that includes annelids, molluscs, nemerteans, brachiopods, and
phoronids) are still poorly understood. To improve understanding of the phylogeny and evolution
of Lophotrochozoa, we supplemented available data by sequencing a total of 33 transcriptomes
from numerous diverse phyla and conducted a large-scale phylogenomic analysis. All analyses
yielded the same general topology (aside from relationships within Bryozoa) and the vast
majority of nodes were strongly supported. Our results indicate that there are three major clades
within Lophotrochozoa: 1) Platyzoa including Gastrotricha, Platyhelminthes, Rotifera, and
Gnathostomulida; 2) Polyzoa including Bryozoa, Cycliophora, and Entoprocta; and 3) Trochozoa
including Nemertea, Brachiopoda, Phoronida, Annelida, and Mollusca. Platyzoa and Polyzoa
were recovered as sister taxa with moderate support. Additionally, relationships among phyla
within each of these three clades were strongly supported in most cases. As in some previous
studies, Mollusca was placed sister to a clade comprising Brachiopoda, Phoronida, Nemertea and
Annelida. Unlike most previous studies, relationships within this clade were strongly supported.
Annelida and Nemertea were recovered as sister taxa and clade of vermiform trochozoans was
recovered sister to Brachiopoda+Phoronida. Taken together, these results have important
implications for the understanding of early animal evolution and indicate comparative studies are
needed to improve understanding of previously unrecognized relationships.
159
5.2 Introduction
5.2.1 General introduction to Lophotrochozoa
Lophotrochozoa (Halanych et al., 1995) is a well-supported monophyletic clade of
invertebrates that includes Annelida (including the former phyla Myzostomida, Pogonophora,
Echiura, and Sipuncula), Brachiopoda, Bryozoa (=Ectoprocta), Cycliophora, Entoprocta
(=Kamptozoa), Gastrotricha, Gnathostomulida, Micrognathozoa, Mollusca, Nemertea,
Phoronida, Platyhelminthes, and Rotifera (=Syndermata; includes Acanthocephala and
Seisonida). Monophyly of Lophotrochozoa has been supported by numerous investigations (e.g.,
Halanych et al. 1995, Aguinaldo et al. 1997, Anderson et al. 2004, Helfenbein and Boore 2004,
Philippe et al. 2005, Hausdorf et al. 2007, Dunn et al. 2008, Helmkampf et al. 2008a,b, Hausdorf
et al. 2010). Lophotrochozoa has the distinction of including the greatest number of animal phyla
of any of the three bilaterian “supergroups” (Lophotrochozoa, Ecdysozoa, and Deuterostomia) as
well as including the two most morphologically variable animal phyla (Annelida and Mollusca).
Of significance, there is also great variation in morphology among lophotrochozoan phyla with
taxa ranging from microscopic meiofauna to several meter-long parasitic tapeworms and giant
squid.
Numerous phylogenetic hypotheses have been proposed for relationships among the taxa
now known to compose Lophotrochozoa. The most recent reviews dealing with the phylogeny of
Lophotrochozoa are Halanych (2004), Giribet (2008), Minelli (2009), Kocot et al. (2010),
Edgecombe et al. (2011), and Nielsen (2011). Figure 1 presents the current understanding of
animal phylogeny based on Kocot et al. (2010). Within Bilateria, Lophotrochozoa is sister to
Ecdysozoa, a clade of animals such as arthropods, nematodes, and priapulids that periodically
shed their cuticle. The current leading view of Lophotrochozoan phylogeny divides the group
160
into two major clades, Platyzoa (Cavalier-Smith, 1998) and Trochozoa (Roule, 1891; see Rouse,
1999; Giribet et al., 2000; Peterson and Eernisse, 2001; and Valentine, 2004). Other taxa such as
Bryozoa (=Ectoprocta), Entoprocta, and Cycliophora have less certain placement; they may
represent one or more distinct lineage(s) or are nested within Platyzoa or Trochozoa (see below).
Systematics of taxa now known to constitute Lophotrochozoa have a long and, in many
cases, convoluted history. For example, brachiopods have been classified as members of
Deuterostomia, Lophophorata (nested within Deuterostomia or Lophotrochozoa), and most
recently considered members of Trochozoa (although they do not have a canonical trochophore
larva). Moreover, many taxonomic names (e.g., Trochozoa; reviewed by Rouse, 1999) have been
redefined multiple times by different authors making it sometimes difficult to infer what authors
mean when using a taxonomic name without giving explicit context. In the following sections, I
attempt to clearly and succinctly present the available morphological and developmental data
used to develop or support major phylogenetic hypotheses relevant to the present study.
Subsequently, insights from the most relevant molecular studies are presented. In some cases,
traditional morphology or development-based hypotheses have been upheld by molecular data.
On the other hand, molecular data have radically altered our understanding of lophotrochozoan
evolution, requiring reexamination of morphology and development within a newly discovered
phylogenetic context.
5.2.2 Trochozoa
Trochophore larvae are generally characterized by having an apical organ, preoral and
post-oral ciliated bands flanking a groove, a complete gut, and a pair of protonephridia (Figure 2;
reviewed by Rouse, 1999). Trochozoa (Roule, 1891) includes Mollusca and Annelida, most of
161
which have trochophore larva (sensu Hatschek, 1878, reviewed by Rouse, 1999), as well as
Nemertea, Brachiopoda, and Phoronida; these three taxa have other larval types. Entoprocts,
which appear to have a modified trochophore larva, are also included within Trochozoa by some
authors (e.g., Peterson and Eernisse, 2001).
Although no nemerteans are known to develop through a typical trochophore larval stage,
the planuliform larvae of the palaeonemertean Carinoma have been shown to be homologous
with trochophores on the basis of cell lineage studies showing evidence of a vestigial prototroch
(Maslakova et al., 2004). A trochozoan clade comprising Mollusca, Annelida, and Nemertea
(Eutrochozoa sensu Peterson and Eernisse, 2001) has been hypothesized. Members of all three
phyla possess lateral coelomic sacs that develop through schizocoely with the mesoderm formed
directly from the primary mesoblasts (reviewed by Nielsen, 2011). Although Roule (1891)
included Brachiopoda and Phoronida in his original definition of Trochozoa, more recent work
has questioned the homology of their larvae and trochophores (reviewed by Nielsen, 2011).
Regardless, molecular and possibly even paleontological data support their inclusion in
Trochozoa (see below).
Conway Morris and Peel (1995) interpreted halkierids, Cambrian fossil taxa with
calcareous shells and sclerites and a broad foot, as the progenitors of Mollusca, Annelida, and
Brachiopoda. Under this scenario, halkierid sclerites are homologous to annelid and brachiopod
chaetae and aculiferan mollusc sclerites. Likewise, halkierid shells are homologous to
brachiopod and mollusc shells, in particular the posterior shell of halkierids is strikingly similar
to the brachiopod ventral valve. The unsegmented fossil animal Wiwaxia, which was similar to
halkierids but lacked shells and had non biomineralized sclerites, is viewed as a stem group
annelid under this hypothesis. However, Halkieria and related forms such as Wiwaxia (which has
162
a radula) have also been interpreted as molluscs (Scheltema et al., 2003; Vinther and Nielsen,
2005; Vinther, 2009; Smith, 2012).
Regardless of disagreement over interpretation of the fossil record, brachiopods, annelids,
and molluscs are regarded as closely related because of shared morphological characters. As
indicated above, both brachiopods and annelids possess chitinous chaetae. Of significance, these
structures are very similar at the ultrastructural level (Schepotieff, 1904; Orrhage, 1971, 1973;
Gustus and Cloney, 1972; Westheide and Russell, 1992; Lüter and Bartolomaeus, 1997; Schulze,
2002), prompting the hypothesis that these two phyla are sister taxa or are at least closely related.
A close relationship of brachiopods and molluscs may be suggested by the presence of
calcareous shells with similar structure in both phyla. However, there are differences in the
mineralogies of brachiopod and molluscan shells and sclerites are composed of calcium
carbonate (Ruppert et al. 2004).
Molecular studies based on nuclear ribosomal RNA (rRNA) genes (18S and 28S) have
largely supported Trochozoa (e.g., Halanych et al., 1995; Winnepenninckx et al., 1995; Giribet et
al., 2000; Peterson and Eernisse, 2001; Passamaneck and Halanych, 2006; Paps et al., 2009b).
Halanych et al. (1995) first used molecular data to demonstrate that Brachiopoda and Phoronida
are closely related and are within the clade they named Lophotrochozoa. Trochozoa has also
been supported in most recent phylogenomic analyses. Dunn et al. (2008) recovered a clade
(“Clade C”) in which Mollusca was sister to a clade (“Clade B”) comprising Annelida,
Brachiopoda, Phoronida, and Nemertea. Within this clade Brachiopoda and Phoronida formed a
monophyletic clade (Brachiozoa sensu Caviler-Smith) that was placed sister to Nemertea. A
monophyletic clade including brachiopods and phoronids to the exclusion of bryozoans has been
strongly supported by numerous molecular phylogenetic studies including those based on rDNA
163
(e.g., Mackey et al., 1996; Cohen et al., 1998; Cohen, 2000; Mallatt and Winchell, 2002; Cohen
and Weydmann, 2005; Passamaneck and Halanych, 2006), sodium-potassium ATPase a-subunit
(Anderson et al., 2004), combined analyses of nuclear rDNA and morphology (Zrzavy´ et al.,
1998; Giribet et al., 2000; Peterson and Eernisse, 2001), and nuclear housekeeping genes
(Sperling et al., 2011). A hypothesized brachiopod/phoronid/nemertean clade (“Clade A” from
Dunn et al. 2008) has been termed Kryptrochozoa (Hejnol et al., 2009) to reflect the absence
(loss?) of a traditional trochophore larva in these phyla. Maximum likelihood analyses of nuclear
ribosomal proteins derived from ESTs by Helmkampf et al. (2008) and Hausdorf et al. (2010)
mostly yielded the same phylum-level topology for Trochozoa although support for some nodes
was weak in both studies. As in Dunn et al. (2008), Brachiopoda and Phoronida formed a well-
supported clade in both studies while support for Kryptrochozoa and other higher-level
trochozoan relationships were generally weak.
Mollusca is the second most species-rich animal phylum and exhibits a wide diversity of
body plans including meiofaunal worms, highly reduced endoparasites, and giant squid.
Identifying the sister taxon of Mollusca could have important implications for understanding the
early evolution of this important group. As detailed above, several studies have recovered a clade
including Annelida, Nemertea, Brachiopoda, and Phoronida (“Clade B” of Dunn et al., 2008) as
the sister taxon of Mollusca. Importantly, support for this grouping has been strong in several
analyses although support for relationships among annelids, brachiopods+phoronids, and
nemerteans has generally been weak or lacking. Not all studies have recovered this “Clade B” as
the sister taxon of Mollusca, however. Kocot et al. (2011) assembled a large phylogenomic
dataset for molluscs plus other lophotrochozoans and recovered Annelida sister to Mollusca with
strong support in ML analyses. Notably, Entoprocta + Cycliophora was placed sister to Mollusca
164
when Bayesian inference was used, more consistent with the Tetraneuralia hypothesis
(Wanninger, 2009; see below), although support for this relationship was exceedingly low. Smith
et al. (2011) conducted similar analyses but recovered Mollusca sister to Kryptrochozoa. Support
for this relationship and monophyly of Kryptrochozoa were relatively weak. Vinther et al. (2011)
analyzed a dataset of seven PCR-amplified fragments of nuclear protein-coding genes and
recovered Nemertea sister to Mollusca although support for this placement was moderate to
weak depending on the model used.
5.2.3 Entroprocta (=Kamptozoa), Cycliophora, and Bryozoa (=Ectoprocta)
Entoprocts and cycliophorans are sessile suspension feeding animals with a currently
ambiguous phylogenetic position. The first described entoproct was originally classified within
Bryozoa (Gervais 1837). However, entoprocts are morphologically distinct from bryozoans.
Most notably the position of the anus relative to the tentacles and the direction of water flow
generated by the tentacles differ between the two (reviewed by Nielsen, 2011). Thus, the two
groups were later differentiated as separate phyla (Nitsche 1869). Nitsche renamed Bryozoa to
Ectoprocta to reflect the exclusion of entoprocts, but the original name Bryozoa has been given
precedence by most authors and is now widely used in its original sense (referring to ectoprocts
only).
Funch and Kristensen (1995) hypothesized that cycliophorans, entoprocts, and bryozoans
are closely related, citing similarities in the development of feeding structures and asexual
budding of new individuals as evidence. Additionally, the process of larval settlement of
entoprocts and cycliophorans is very similar to that of ctenostome bryozoans, especially with
respect to remodelling of the nervous system (Nielsen, 1971, 1977; Funch and Kristensen, 1995).
165
Cavalier-Smith (1998) resurrected the term “Polyzoa” (Thompson, 1830) and applied it to the
hypothesized grouping of Entoprocta+Cycliophora+Bryozoa.
Notably, Entoprocta has been hypothesized to be within Trochozoa on the basis of studies
of the larvae of Loxosomella murmanica (Entoprocta, Solitaria, Loxosomatidae; Wanninger et
al., 2007; Haszprunar and Wanninger, 2008; Wanninger, 2009) demonstrating homologies to
trochophore larvae. Entoproct larvae are hypothesized to be trochophores adapted to a creeping
lifestyle (reviewed by Nielsen, 2011). Specifically, comparative studies of late entoproct larvae
and adult molluscs have prompted the Tetraneuralia hypothesis suggesting a close relationship
between the two phyla because of similarities in the nervous system (both have tetraneury).
There are also similarities in the musculature, cuticle, sinusal circulatory system, and “foot”
(Bartolomaeus 1993, Ax 1999, Haszprunar and Wanninger 2008, Wanninger et al. 2007,
Wanninger 2009). Despite morphological characters suggesting a close relationship of entoprocts
and molluscs, virtually no molecular studies have supported this relationship (as noted above,
Entoprocta+Cycliophora was recovered sister to Mollusca in one analysis by Kocot et al., 2011,
albeit with weak support).
Bryozoa was traditionally allied with Brachiopoda and Phoronida (and pterobranch
hemichordates [Deuterostomia]) in a clade called Tentaculata (Hatschek 1891) or Lophophorata
(Hyman, 1959). However, the lophophore of bryozoans is structurally different from that of
brachiopods and phoronids (Halanych, 1996). Bryozoans also differ from brachiopods and
phoronids in that they lack metanephridia, have multiciliated epithelial cells (a trait they share
with entoprocts), and have distinctly different embryos and larvae (reviewed by Nielsen, 2011).
Molecular data indicate that Bryozoa, Entoprocta, and Cycliophora are closely related.
Several molecular phylogenetic studies sampling Bryozoa and Entoprocta (but not Cycliophora)
166
have recovered bryozoans and entoprocts as sister taxa (Hausdorf et al., 2007, 2010; Helmkampf
et al., 2008; Bleidorn et al., 2009; Witek et al., 2009). More recently, most molecular studies
including data from cycliophorans have supported a sister taxon relationship of Entoprocta and
Cycliophora (Passamaneck and Halanych, 2006; Baguñà et al., 2008; Hejnol et al., 2009; Paps et
al., 2009b; Fuchs et al., 2010; Mallatt et al., 2012), usually placing this clade sister to Bryozoa.
5.2.4 Platyzoa
Platyzoa (Cavalier-Smith, 1998; Platyhelminthes, Gastrotrichia, Rotifera [=Syndermata],
Gnathostomulida, and Micrognathozoa) is a group of generally small, flat animals that lack a
coelom or other spacious body cavity (as is common in very small metazoans) but no uniting
synapomorphy for the group is known. Most platyzoans are direct developers (also common in
very small metazoans) with the parasitic acanthocephalans and polyclad flatworms being notable
exceptions.
Molecular support for platyzoan monophyly has generally been weak (Passamaneck and
Halanych, 2006; Dunn et al., 2008 [Myzostomida was nested within Platyzoa]; Hejnol et al.,
2009; Witek et al., 2009) or lacking (Glenner et al., 2004; Todaro et al., 2006; Paps et al., 2009a,
2009b), but relatively few molecular studies have had adequate taxon sampling to address the
issue. Notably, platyzoans tend to have long branches in molecular phylogenies; Dunn et al.
(2008) even discussed the possibility that Platyzoa could be an artefact of long-branch attraction.
Gnathifera (Ahlrichs, 1997) is a hypothesized platyzoan clade that includes Rotifera (including
Seisonida and Acanthocephala), Gnathostomulida, and Micrognathozoa (Kristensen and Funch,
2000). Gnathifera is well supported by morphological data (Kristensen and Funch 2000,
167
Sørensen 2003, Funch et al. 2005) and some molecular phylogenetic studies (Zrzavý, 2003;
Witek et al., 2009).
In order to improve understanding of the phylogeny of Lophotrochozoa with special
emphasis on identifying the sister taxon of Mollusca, we performed phylogenomic analyses on a
dataset compiled from 88 taxa including new Illumina transcriptomes from 33 taxa. We
improved upon our previous bioinformatic pipeline by employing a BLAST-based filter
designed to exclude potential contaminant sequences and requiring each gene to be sampled for a
relatively large number of taxa.
5.3 Materials and Methods
5.3.1 Taxon Sampling Considerations
Our goal was to assemble a dataset broadly spanning the extant diversity of
Lophotrochozoa while minimizing the potentially deleterious effects of missing data (Roure et
al., 2012). Taxon sampling is presented in Table 1 and details on specimen collection, tissue(s)
used, and RNA extraction for newly sequenced taxa are presented in Table 2. Predicted
transcripts derived from publicly available genomes were employed whenever possible.
However, because high-quality genomes are available from very few lophotrochozoans,
transcriptomes made up the majority of our dataset. Small Sanger EST libraries with fewer than
approximately 2,000 reads were avoided in an attempt to improve final data matrix
completeness.
We supplemented publicly available data with relatively deeply sequenced
transcriptomes from representatives of key taxa. In total, we collected new data from seven
molluscs, five brachiopods, one phoronid, six nemerteans, six annelids, four entoprocts, two
168
gastrotrichs, one gnathostomulid, one flatworm and one priapulid (outgroup). Importantly, the
amount of data sampled for several key phyla, which were represented by one to just a few
Sanger EST datasets in previous phylogenomic studies (e.g., Brachiopoda, Phoronida, Nemertea,
and Entoprocta), was greatly expanded.
Some taxa that we were unable to collect or that have been notoriously difficult to place
in other studies were not sampled in this study. These include the extremely long-branched
myzostomids (which have been convincingly shown to be nested within the annelid radiation by
other studies [Bleidorn et al., 2007, 2009; Hartmann et al., 2012; Helm et al., 2012]),
micrognathozoans (which are known only from Greenland), dicyemids (rarely collected obligate
endoparasites of octopods that may not be lophotrochozoans), and orthonectids (another rarely
collected parasitic group of unknown phylogenetic affinity).
5.3.2 Molecular Techniques
Although K.M.K. led the data analysis, this was a collaborative project that involved data
collection by several laboratories. Slightly different methods were used by the Halanych/Santos,
Struck, and Lieb labs to generate Illumina transcriptome data. For the Halanych/Santos lab taxa,
total RNA was extracted from frozen or RNAlater-fixed tissue using TRIzol (Invitrogen) and
purified using the RNeasy kit (Qiagen) with on-column DNase digestion or, in cases where only
a small amount of tissue was available and low RNA yield was expected, RNA extraction and
purification were performed using the RNeasy Micro kit (Qiagen) with on-column DNAse
digestion. RNA concentration was measured using a Qubit fluorometer (Invitrogen) and RNA
quality was evaluated on a 1% SB agarose gel. For most libraries, first-strand cDNA was
synthesized from 1 µg of total RNA. If less than 1 µg of total RNA was available, 1 µl of RNase-
169
OUT (Invitrogen) was mixed with all of the eluted RNA, this mixture was vacuum centrifuged
(centrifuge carefully cleaned with RNaseZAP [Invitrogen] and reverse osmosis-purified water)
to a volume of 3 µl, and all 3 µl were used to make cDNA.
First-strand cDNA synthesis was performed using the SMART cDNA library
construction kit (Clontech) as per the manufacturer’s instructions. Full-length cDNA was then
amplified using the Advantage 2 PCR system (Clontech) using the minimum number of PCR
cycles necessary (usually 15 to 19) and sent to The Hudson Alpha Institute for Biotechnology
(Huntsville, AL, USA) for Illumina TrueSeq library preparation and sequencing. Each library
was sequenced using one-sixth of an Illumina HiSeq 2000 lane with 2 X 100 bp paired-end
chemistry.
For the Lieb lab taxa, total RNA was extracted from RNAlater-fixed tissue using Exiqon
miRCURY RNA Isolation Kit for animal tissue and sent to Genterprise (Germany). Total RNA
quality and quantity were evaluated using an Agilent Bioanalyzer 2100 and a Nanodrop
spectrophotometer. Illumina RNASeq libraries were prepared using the TruSeq RNA sample
prep v2 protocol with minor modifications. Briefly, poly A+ RNA was isolated and fragmented
followed by first-strand cDNA synthesis, second strand synthesis, and purification of double-
stranded cDNA (ds cDNA) with the SPRI-TE Nucleic Acid Extractor using the SPRIworks
fragment library system I (Beckman Coulter). Size selection was performed to isolate fragments
approximately 200-400 bp in length. Fragments were then end-repaired, end-adenylated,
adaptor-ligated, and PCR-amplified with 14 cycles. Each library was sequenced using one-sixth
of an Illumina HiSeq 2000 or 2500 lane with 2 X 100 bp paired-end chemistry.
For the Struck Lab taxa, different methods were used for different taxa depending on
body size and expected RNA yield. For the relatively large animals (Stylochoplana, Tubulanus,
170
and Cephalothrix), total RNA was extracted using the PeqGOLD spin-column-based kit
according to the manufacturer’s protocol. Preparation of cDNA libraries was conducted using the
MINT-Universal kit from Evrogen according to the manufacturer’s protocol with 24 PCR cycles.
High molecular weight cDNA fragments were selected for by excising fragments >900 bp on an
agarose gel and purifying using the innuPREP DOUBLEpure kit. Finally, Illumina paired-end
sequencing libraries were prepared using the TrueSeq kit following the manufacturer’s protocol.
For the very small animals (Gnathostomula, Macrodasys, Megadasys), the same protocol was
followed as above except the final, purified double-stranded cDNA was then used as template for
in-vitro transcription of mRNA to increase the amount of template available for TruSeq RNA
sample prep v2 library construction. Briefly, 3 l 100 mM ATP, 3 l 100 mM CTP, 3 l 100
mM GTP, 3 l 100 mM UTP, 8 l 5x T7-Polymerase Reaction buffer, 4 l T7-Polymerase, 0.2
l 0.1 M DTT, 1 l 40u/l RNase Inhibitor were combined with 13 l of purified double-
stranded cDNA and incubated overnight at 37°C. Product mRNA was then purified using the
peqGOLD RNA purification kit and Illumina paired-end sequencing libraries were prepared
using the TrueSeq kit following the manufacturer’s protocol. Sequencing for each library was
conducted using one run of an Illumina GAIIx with 2 X 76 bp paired-end chemistry.
5.3.3 Sequence Processing
For the Halanych and Lieb lab taxa as well as publicly available data, raw PE Illumina
reads were digitally normalized using khmer (normalize-by-median.py -C 30 -k 20 -N 4 -x 2.5e9;
Brown et al., 2012) and assembled using the October 5, 2012 release of Trinity (Grabherr et al.,
2011). Sanger and 454 transcriptome data were processed and assembled using the EST2uni
pipeline (Forment et al., 2008). This software removes low-quality regions with lucy (Chou and
171
Holmes, 2001), removes vector with lucy and SeqClean
(http://compbio.dfci.harvard.edu/tgi/software), masks low complexity regions with
RepeatMasker (www.repeatmasker.org), and assembles contigs with CAP3 (Huang and Madan,
1999). Data on sequence quality were used by CAP3 when available. For Illumina data, only
contigs were retained for further analysis. For Sanger and 454 data, contigs and high-quality
singletons (unigenes) were retained. For the Struck lab taxa, assembly was conducted using CLC
Genomics Work Bench using the default settings with scaffolding, and expected insert size of
200-400 bp, and keeping only contigs larger than 200 bp. All unigenes were translated with
TransDecoder (https://sourceforge.net/p/transdecoder/) and amino acid sequences shorter than
100 AAs were deleted.
5.3.4 Dataset Assembly
In order to screen for, and exclude, exogenous contamination in our transcriptomes, we
employed a BLAST-based filter prior to orthology inference to screen all transcriptome data
used in this study for contamination. First, a BLAST database was constructed including
presumably contamination-free sequences derived from genomes and transcriptomes of close
relatives of the taxa sampled in this study. Next, a BLAST database was constructed including
sequences from likely sources of exogenous contamination (e.g., apicomplexans, ciliates,
flagellates, etc.). Some taxa sampled in this study may be parasitized by flatworms. Thus, we
wished to screen their transcriptome data for possible flatworm contamination. However, for
obvious reasons, flatworms and putative close relatives could not be screened against flatworm
data. Therefore, customized BLAST databases were constructed for different taxa. Some taxa
were screened against a “good” database without flatworm sequences (“good without
172
flatworms;” Table 3) and a “contamination” database with flatworm sequences (“contamination
with flatworms;” Table 3). Other taxa were screened against a “good” database with flatworm
sequences (“good with flatworms;” Table 3) and a “contamination” database without flatworm
sequences (“contamination without flatworms;” Table 4).
Each translated assembly was searched against the appropriate “good” and
“contamination” databases using BLASTP with an e-value cutoff of 0.0001. Any sequence with
a top BLAST hit to a sequence in the “contamination” database that had an e-value ≥2 orders of
magnitude larger than its top BLAST hit to a sequence in the “good” database was discarded and
not considered further. Manual examination of a haphazardly selected subset of the sequences
that were discarded using this method suggested that we were conservative in our approach. No
obvious contamination was detected.
For orthology inference, we employed HaMStR local 9 (Ebersberger et al., 2009), which
utilizes profile hidden Markov models (pHMMs) generated from completely sequenced
reference taxa in the InParanoid database (Ostlund et al., 2009). Translated unigenes were
searched against the 1,032 single-copy OGs of HaMStR’s “model organism” pHMMs derived
from Homo, Ciona, Drosophila, Caenorhabditis, and Saccharomyces. Translated unigenes
matching an OG’s pHMM were then compared to the proteome of each of these primer taxa
using BLASTP (-strict option). If the primer taxon amino acid sequence contributing to the
pHMM was the best BLASTP hit in each of these back-BLASTs, the unigene was then assigned
to that OG. If one of the first or last 20 characters of an amino acid sequence was an X
(corresponding to a codon with an ambiguity, gap, or missing data), all characters between the X
and that end of the sequence were deleted and treated as missing data. This step was important as
ends of singletons were occasionally, but obviously, mistranslated. Each OG was aligned with
173
MAFFT (mafft --auto --localpair --maxiterate 1000; Katoh et al., 2005). The reduced alignments
were then trimmed with Aliscore and Alicut (Kück, 2009) to remove regions with ambiguous
alignment. Lastly, any alignments less than 100 amino acids in length were discarded.
In cases where an OG contained more than one sequence from one or more OTUs,
identical sequences (probably alleles that differed at the nucleotide level) were discarded leaving
only unique sequences for each taxon. If two or more sequences still remained for any taxa
(splice variants or lineage-specific gene duplications [=inparalogs]), the sequence from each
taxon with the shortest average pairwise distance to all others was retained. Pairwise distances
were calculated using a gamma distribution with four rate categories as implemented in SCaFoS
(Roure et al., 2007). In cases where two or more sequences from the same taxon were >25%
divergent, all sequences from that taxon were discarded from that OG. To visualize the amount
of data sampled for each taxon, a gene sampling diagram (Figure 3) was created using MARE
(http://mare.zfmk.de).
5.3.5 Phylogenetic analysis
Phylogenetic analyses were conducted using ML in RAxML 7.3.8 (Stamatakis, 2006).
Previous phylogenomic studies addressing deep metazoan phylogeny including that of
Lophotrochozoa (e.g., Dunn et al., 2008, Struck et al., 2011, Kocot et al., 2011, Smith et al.,
2011) have varied in their choice of amino acid substitution model and method of accounting for
rate heterogeneity among sites in maximum likelihood analyses. Therefore, for comparative
purposes, we conducted four independent analyses using two different models and two different
methods to account for rate heterogeneity among sites. The combinations used were
PROTGAMMALGF, PROTCATLGF, and PROTGAMMAWAGF, and PROTCATWAGF (See
174
the RAxML 7.3.8 man page [-h flag] for details). For each analysis, the tree with the best
likelihood score after 10 random addition sequence replicates was retained and topological
robustness (i.e., nodal support) was assessed with 100 replicates of nonparametric bootstrapping
(the -f a command line option was used). Because of time constraits, the data matrix was not
partitioned by gene for these analyses. Stabilities of OTUs among the bootstrapped trees were
calculated for the PROTGAMMALGF analysis using the leaf stability index (ls_dif) using the
Roguenarok server (http://193.197.73.70:8080/rnr/roguenarok/about). All analyses were
performed on the Auburn University Molette Lab SkyNet server.
Given the size and complexity of the dataset, using a Bayesian inference approach (such
as PhyloBayes; Lartillot et al., 2009) proved impractical.
5.4 Results
5.4.1 Data Matrix and Overall Tree Topology
Our bioinformatic pipeline retained only genes that are single-copy in the genomes of
Homo sapiens, Ciona intestinalis, Drosophila melanogaster, Caenorhabditis elegans, and
Saccharomyces cervisiae and sampled from at least 50 of the 88 taxa. This resulted in a final
matrix comprised of 122 OGs totaling 21,639 amino acid positions in length (Table 3).
Ribosomal protein genes were the most common gene class sampled (35/122) accounting for
29% of the genes sampled or 25% of positions in the final data matrix. The remainder of the
genes employed as molecular markers were diverse and included membrane-bound proteins,
polymerases, transcription factors, ATP synthase subunits, and kinases among others. All final
Alicut/Aliscore-trimmed OGs sampled were required to be at least 100 amino acids in length.
After employing this cutoff, the average OG length was 177 AAs and the longest was 310 AAs.
175
All OGs were sampled from at least 50 taxa but some were sampled for as many as 75 taxa with
an average of 57 taxa sampled per OG). Missing data (i.e., cells in the final data matrix
represented by a gap) in the final matrix was only 40.4%. The average percent of OGs sampled
per taxon was 64.24% and the median was 66.50%.
Aside from minor differences in branch lengths and placement of Tubulipora within
Bryozoa, all four of the maximum likelihood analyses using different models yielded the same
tree topology (Figure 4, summarized in Figure 5). Support was exceedingly high with the vast
majority of nodes with >95% bootstrap support (bs) in most analyses. Consequently, leaf
stabilities were very high for most taxa including the least stable taxa (score ~0.94; see Table 1).
All analyses strongly supported the existence of three major clades within Lophotrochozoa: 1)
Platyzoa including Gastrotricha, Rotifera, Gnathostomulida, and Platyhelminthes; 2) Polyzoa
including Entoprocta, Cycliophora, and Bryozoa; and 3) Trochozoa including Mollusca,
Brachiopoda, Phoronida, Nemertea, and Annelida. Platyzoa and Polyzoa were recovered as sister
clades, although support for this relationship was moderate to relatively weak (bs
PROTGAMMALGF / PROTCATLGF / PROTGAMMAWAGF / PROTCATWAGF =
78/74/75/62).
5.4.2 Trochozoa
All analyses strongly supported the monophyly of Trochozoa including Mollusca,
Brachiopoda, Phoronida, Nemertea, and Annelida (bs = 95/99/99/100). Mollusca was placed
sister to a clade including Brachiopoda, Phoronida, Nemertea, and Annelida. This clade,
corresponding to “Clade B” of Dunn et al. (2008), was strongly supported monophyletic in all
analyses (bs = 95/99/98/97). Brachiopoda and Phoronida were sister taxa with strong support (bs
176
= 95/99/99/100). Brachiopoda + Phoronida (Brachiozoa or Phoronozoa) was placed sister to
Annelida + Nemertea, which were recovered as sister taxa with strong support (bs =
100/100/98/98).
Within Mollusca, we recovered two reciprocally monophyletic major lineages: Aculifera
and Conchifera. Within a well-supported Aculifera (bs = 91/84/97/95), Aplacophora was
recovered monophyletic with strong support in most analyses (bs = 91/82/96/95) and placed
sister to a strongly supported Polyplacophora (bs = 100/100/100/100). Each of the major lineages
of Conchifera (Gastropoda, Scaphopoda, Bivalvia, and Cephalopoda) were strongly supported
monophyletic (bs = 100/100/100/100). Cephalopoda and the monoplacophoran Laevipilina
formed a clade but support for this placement was variable among analyses (bs = 75/68/85/88).
Sister to the Cephalopoda+Monoplacophora clade was a well supported clade (bs = 97/91/96/96)
consisting of Bivalvia, Scaphopoda, and Gastropoda. Gastropoda and Scaphopoda were
recovered as sister taxa but this relationship was weakly supported in all analyses (bs = <50).
Although relationships within major molluscan lineages are outside the scope of the present
work, we note that within Bivalvia, the traditionally recognized higher level taxon Protobranchia
(represented by the nuculanids Yoldia and Nuculana, the solemyid Solemya, and the nuculid
Enucula) was recovered as a basal, paraphyletic grade with moderately strong support (bs =
93/89/91/70 for Nuculidae + Solemyidae + Lamellibranchia to the exclusion of Nuculanidae).
All analyses recovered Brachiopoda as monophyletic with relatively strong support (bs =
84). Within Brachiopoda, we recovered the inarticulate taxa Linguliformea (represented by
Lingula anatina and Glottidia pyrimadata) and Craniiformea (represented by Novocrania
anomala) as sister taxa with strong support (bs = 99/100/97/100). Sister to Inarticulata was
Rhynchonelliformea (=Articulata), which was also recovered monophyletic with strong support
177
(bs = 100/100/100/100). Likewise, the two sampled phoronids formed a clade with strong
support (bs = 100/100/100/100).
All analyses recovered Nemertea as monophyletic with strong support (bs =
100/100/100/100). Within Nemertea, we recovered Paleonemertea (Cephalothrix, Tubulanus,
and Carinoma) monophyletic with fairly strong support (bs = 89/97/89/94). Sister to
Paleonemertea was a clade (bs = 88/96/91/94) comprising Heteronemertea (Parborlasia and
Cerebratulus) and Hoplonemertea (Paranemertes and Malacobdella). Monophyly of both
Heteronemertea and Hoplonemertea were strongly supported (bs = 100/100/100/100).
Annelida (including Sipuncula and Echiura), the sister taxon of Nemertea in our analyses,
was strongly supported monophyletic (bs = 100/100/100/100). The chaetopterid Chaetopteris
and the sipunculan Phascolosoma were recovered as a monophyletic clade basal to the remaining
annelid taxa, although support for this grouping was variable among analyses (bs = 60/78/69/83).
Briefly, the remainder of relationships within Annelida were generally strongly supported with
most nodes with support values >90.
5.4.3 Polyzoa
A clade, Polyzoa, consisting of Entoprocta+Cycliophora sister to Bryozoa was recovered
with strong support (bs = 93/98/98/100) in all analyses. Within Polyzoa, Entoprocta and
Cycliophora were sister taxa with strong support (bs = 100/100/100/100). Bryozoan monophyly
was strongly supported (bs = 100/100/100/100) but relationships within Bryozoa were less clear;
placement of Tubulipora (representing Stenolaemata) as either sister to Gymnolaemata or
Cristatella (representing Phylactolaemata) was poorly supported (bs < 50) in most analyses.
178
5.4.4 Platyzoa
Within a strongly supported Platyzoa (bs = 94/100/97/99), we recovered Gastrotricha
sister to a clade consisting of a monophyletic Gnathifera (as sampled; Rotifera and
Gnathostomulida) sister to Platyhelminthes (bs = 61/82/66/77). Monophyly of the two sampled
gnathiferan phyla was strongly supported in all analyses (bs = 90/97/98/99). Monophyly of
Platyhelminthes was strongly supported (bs = 100/100/100/100).
5.5 Discussion
5.5.1 Trochozoa
One of the major goals of this study was to identify the sister taxon of Mollusca. Our
results strongly support a clade consisting of Brachopoda, Phoronida, Nemertea, and Annelida as
the molluscan sister taxon. This clade has been recovered before (e.g., as “Clade B” of Dunn et
al., 2008) but relationships within it differed from those recovered here. Specifically,
Kryptrochozoa (Brachiopoda+Phoronida+Nemertea; “Clade C” of Dunn et al., 2008) has been
recovered in several phylogenomic studies (albeit with varying degrees of support) but was not
recovered by our analyses. Instead, we recovered Annelida and Nemertea as sister taxa and this
clade of vermiform trochozoans was placed sister to Brachiopoda+Phoronida.
Shared ancestral characteristics of phyla as varied as molluscs, annelids, nemerteans,
brachiopods, and phoronids are not immediately apparent given the extreme differences in
morphology among these phyla. A clade including Mollusca, Annelida, and Nemertea
(Eutrochozoa sensu Peterson and Eernisse, 2001) has been hypothesized based on the presence
of lateral coelomic sacs that develop through schizocoely with the mesoderm formed directly
from the primary mesoblasts (reviewed by Nielsen, 2011). Our results would suggest that this is
179
a plesiomorphy of Trochozoa and that Brachiopods and Phoronids have a derived developmental
program.
Chaetae are present in most members of the annelid radiation as well as brachiopods but
they are absent in molluscs (as well as nemerteans, and phoronids). However, juvenile octopods
(Brocco et al., 1974) and at least one fossil gastropod-like mollusc (Thomas and Vinther, 2012)
possess annelid-like chaetae, suggesting that either chaetae were present in the last common
ancestor of Trochozoa and multiple losses have taken place (in most mollusc lineages,
nemerteans, and phoronids) or chaetae have evolved independently in several different
trochozoan lineages. It may be that chaetae are a plesiomorphy for “Clade B” with secondary
loss in Nemertea and Phoronida. There are subtle differences in octopod chaetae relative to those
of annelids and brachiopods (which are very similar; Brocco et al., 1974), possibly suggesting
independent derivation in octopods. Gene expression studies examining chaetogenesis in
brachiopods, annelids, and octopods may help improve understanding of this issue. Likewise,
evo-devo studies comparing the development of chaetae and aculiferan mollusc sclerites could
test the hypothesis that these structures are homologous, which was proposed on the basis of
paleontological data by Morris and Peel (1995).
Relationships within Mollusca were consistent with the results of recent studies
addressing higher-level molluscan phylogeny (Kocot et al., 2011; Smith et al., 2011; Vinther et
al., 2011). Although we added new data from scaphopods, basal gastropods, and basal bivalves,
support for the relationships among these three taxa was weak as in some other recent studies.
Our results are consistent with those of Smith et al. (2008) in recovering Monoplacophora sister
to Cephalopoda, but support for this relationship varied among analyses. Additional data from
other species of monoplacophorans are needed to help resolve this issue.
180
Brachiopoda and Phoronida were recovered as reciprocally monophyletic sister taxa with
moderate support. Our results are in contrast to some molecular studies showing Phoronida as an
ingroup of Brachiopoda (Cohen, 2000, 2013; Cohen and Weydmann, 2005; Santagata and
Cohen, 2009) but consistent with other studies that found strong support for a sister taxon
relationship between the two (e.g., Dunn et al., 2008 ; Paps et al., 2009a, 2009b; Hausdorf et al.,
2010; Sperling et al., 2011). Our results are in agreement with the growing consensus that
Lophophorata is polyphyletic (Passamaneck and Halanych 2006; reviewed by Halanych, 2004;
Kocot et al., 2010; Edgecombe et al., 2011). Morphological characters shared by brachiopods
and phoronids to the exclusion of bryozoans include metanephridia that function as gonoducts,
monociliate cells rather than multiciliate cells in epithelia, and a diffuse larval nervous system
(reviewed by Nielsen, 2011).
As noted above, our results are inconsistent with the Kryptrochozoa hypothesis. Instead
we place Nemertea sister to Annelida with maximal support in all analyses. This result has
received little support from other molecular studies although Struck and Fisse (2008) recovered
the nemertean Lineus sister to Annelida with weak support in one analysis. Morphological
evidence supporting a clade of Annelida + Nemertea is not immediately apparent although this
relationship has been hypothesized before. Cavalier-Smith (1998) viewed Annelida (including
Echiura and Pogonophora but excluding Sipuncula) and Nemertea as sister taxa in a clade he
called Vermizoa. Diagnostic characters for this grouping included their being coelomate worms,
having a circulatory system, and having either two ventrolateral nerve cords (Nemertea) or one
primitively paired ventral nerve cord (Annelida; but see Müller, 2006). Both phyla are coelomate
but so are the other trochozoans; this is clearly a plesiomorphy. Likewise both nemerteans and
annelids are vermiform, but the phylogenetic significance of this character is dubious at best.
181
Although both phyla have a circulatory system, the developmental origins and organization of
this system is quite different. Notably, nemertean blood vessels (which are technically a coelom;
Turbeville, 1983) are unusual in having a continuous epithelium of mesodermal cells lacking a
basal membrane as is found in most other animals with blood vessels including annelids
(reviewed by Ruppert and Carle, 1983). Likewise nemerteans show serially repeated gonads but
this iteration of body parts likely has nothing to do with annelid segmentation. Finally, the
nervous systems of the two phyla are different in several ways but there may be significant
similarities (not recognized by Cavalier-Smith, 1998). Specifically, in annelids, the nervous
system starts within the epidermis in early development, but some nerves may “sink” into the
musculature as the animal matures (Orrhage and Müller, 2005). The nervous system of most
nemerteans is largely within the epidermis (Beckers et al., 2011). However, the adult nervous
system of the putatively basal palaeonemertean Tubulanus is arranged more like that of most
adult annelids (directly below basal lamina of epidermis Beckers, 2011). Further comparative
studies of annelid and nemertean nervous systems will thus be of interest. Despite problems with
the logic of Cavalier-Smith (1998), it seems that he was correct in hypothesizing a close
relationship of Nemertea and Annelida.
Molecular phylogenetics has radically altered our understanding of annelid evolution. In
particular, molecular studies have demonstratd that Clitellata and is nested within “Polychaeta”
and several other taxa formerly thought to be distinct phyla (Pogonophora [now Siboglinidae],
Echiura, Myzostomida, and probably Sipuncula) are actually within the annelid radiation
(McHugh 1997, Colgan et al. 2006, Passamaneck and Halanych 2006, Rousset et al. 2007,
Struck et al. 2007, Struck et al. 2011). Most recently, employing a phylogenomic approach,
Struck et al (2011) showed that sipunculans and chaetopterids are basal annelids with most other
182
annelid taxa falling into one of two taxa, Errantia and Sedentaria (including Clitellata and several
traditionally errant families). Our results based on rather different taxon sampling than Struck et
al. (2011) are consistent with their results. Ongoing work in the Halanych and Struck labs as part
of the WormNet II annelid Tree of Life project will undoubtedly continue to refine our
understanding of annelid evolution.
The term “trochophore” was first used by Hatschek (1878) to describe the larva of the
annelid Polygordius (Figure 2). Taxa with at least some members showing a more-or-less typical
trochophore larvae include Annelida (including Echiura and Sipuncula), Mollusca, and
Entoprocta. Additionally, the larvae of at least one species of nemertean has been suggested to be
a modified trochophore that retained a vestigial prototroch (Maslakova et al., 2004). The
trochophore larva has been hypothesized to be plesiomorphic for Lophotrochozoa but the
homology of the various ciliary bands, especially within Annelida, have been questioned
(reviewed by Rouse, 1999). Given that trochophores are found in members of both Trochozoa
(Mollusca, Annelida, and Nemertea[?]) and Polyzoa (Entoprocta; which we recovered sister to
Platyzoa), our topology suggests that either a trochophore-like larva was present in the last
common ancestor of Lophotrochozoa with numerous instances of loss or modification or that
trochozoans and entoprocts independently evolved very similar larvae. In this vein, future studies
of entoproct development and gene expression studies examining homology of lophotrochozoan
larval structures are of great interest.
5.5.2 Polyzoa
Bryozoa, Entoprocta, and the relatively recently discovered phylum Cycliophora form a
monophyletic Polyzoa. As noted above, the first described species of entoproct was first placed
183
within Bryozoa due to superficial similarity (Nielsen, 2011). Both entoprocts and bryozoans are
characterized by zooids with a crown of tentacles, but they differ in the relative placement of the
anus to the tentacles, the direction of water flow generated by the tentacles, ultrastructure of the
tentacles, and several aspects of their internal anatomy (Ruppert et al., 2004). Conversely, our
results and numerous other molecular studies (Hausdorf et al., 2007, 2010; Baguñà et al., 2008;
Helmkampf et al., 2008; Bleidorn et al., 2009; Witek et al., 2009; Paps et al. 2009b; and Mallatt
et al., 2012) have recovered Bryozoa and Entoprocta as close relatives.
Within Polyzoa, the relatively recently discovered phylum Cycliophora (Funch and
Kristensen, 1995) was placed sister to Entoprocta with strong support. This grouping has been
recovered in previous molecular studies (Passamaneck and Halanych, 2006; Baguñà et al., 2008;
Hejnol et al., 2009; Paps et al., 2009b; Fuchs et al., 2010; Mallatt et al., 2012). Comparative
morphological work by Funch and Kristensen (1995) and Sørenson et al. (2000) suggested that
potential synapomorphies for this clade include protonephridia with multiciliate terminal cells
and unusual, mushroom-shaped extensions of the basal membrane that project into the
ectodermal cells.
Although bryozoans and entoprocts are well-supported as being closely related, these two
phyla are very different in a number of ways (e.g., differences in the relative position of the anus
and tentacles, retractability of the tentacles, mode of particle capture, cleavage pattern, and body
cavities). While some of these characters are known to be quite evolutionary plastic (i.e.,
cleavage pattern, body cavity organization; reviewed by Minelli, 2009), differences in their gross
anatomy are more difficult to understand. Adding the highly unusual cycliophorans to the mix
muddles the waters further. Thus, strong molecular support for Polyzoa may be received with
some scepticism. Further comparative morphological and developmental studies of bryozoans,
184
entoprocts, and cycliophorans in light of the results of molecular phylogenetics may help
improve understanding of their evolution.
5.5.3 Platyzoa
Our results strongly support the monophyly of Platyzoa, even though previous support
for this grouping has been ambiguous (Passamaneck and Halanych, 2006; Dunn et al., 2008;
Hejnol et al., 2009; Witek et al., 2009). Regardless of strong molecular support for Platyzoa, an
unequivocal morphological synapomorphy for the group is not known. The vast majority of
platyzoans are direct developers. The large-bodied polyclad flatworms and several parasitic taxa
are notable exceptions (Ruppert et al., 2004). The prevalence of direct development in the vast
majority of free-living members of this group is likely linked to their small body size and not of
phylogenetic significance. Therefore, further studies examining the development of polyclad
flatworms, one of the very few platyzoans with indirect development that are free-living and
large-bodied may be of significance.
Our placement of Gastrotricha at the base of Platyzoa is consistent with the results of
most previous molecular studies, which have generally supported a close relationship of
Gastrotricha and Platyhelminthes and/or gnathiferans (Winnepenninckx et al., 1995; Giribet et
al., 2000; Zrzavy, 2001; Baguñà et al., 2008; Paps et al., 2009a, 2009b). Placement of
Gastrotricha as sister to the remaining Platyzoa taxa is of interest because gastrotrichs exhibit a
number of characters that were previously interpreted as evidence for inclusion in the
ecdysozoan clade Cycloneuralia (Nematoda, Nematomorpha, Priapulida, Kinorhyncha, and
Loricifera). Specifically, gastrotrichs have a cuticle, a radial, myoepithelial pharynx with a
terminal mouth, and a circumpharyngeal brain (reviewed by Zrzavý, 2003; Edgecombe et al.,
185
2011). However, the cuticle of gastrotrichs is unlike that of ecdysozoans in that it is not shed
(Ruppert et al., 2004). Also, the circumesophageal brain of gastrotrichs differs from
cycloneuralians because it is composed of a ventral plus one or two dorsal commissures (Rothe
and Schmidt-Rhaesa, 2009; Hochberg and Atherton, 2011). Consequently, gastrotrich and
cycloneuralian brain homology appears unlikely in light of the current data and analyses.
Regardless, the placement of Gastrotricha requires further scrutiny of characters putatively
shared by gastrotrichs and polyzoans, trochozoans, and ecdysozoans.
Monophyly of Gnathifera has been supported by numerous morphological (e.g.,
Kristensen and Funch, 2000; Sørensen 2003, Funch et al., 2005) and some molecular studies
(Zrzavý, 2003; Witek et al., 2009). Gnathiferan jaws, protonephridia with a channel cell
completely surrounding lumen, and a non-compact acrosome are thought to be synapomorphies
for Gnathifera (Kristensen and Funch, 2000; Sørensen 2003, Funch et al., 2005). Therefore, our
recovery of a clade including Rotifera and Gnathostomulida is not surprising (although we
cannot comment on gnathiferan monophyly as we did not sample Micrognathozoa).
5.6 Conclusions
In this study we greatly expanded the amount of data available from most major lineages
of Lophotrochozoa and recovered the monophyly of three major lophotrochozoan clades:
Platyzoa, Polyzoa, and Trochozoa. Relationships among most phyla were very strongly
supported and largely consistent with the emerging view of Lophotrochozoan phylogeny
recovered in previous studies. A clade comprising Nemertea, Annelida, Brachiopoda, and
Phoronida was recovered as the sister taxon of Mollusca. Surprisingly, we found strong support
for a close relationship of annelids and nemerteans, a grouping that has received little
186
consideration from morphologists. Our results call for reinterpretation of available
morphological and developmental data, especially from annelids and nemerteans. Moreover, new
comparative studies, especially those broadly addressing homology of structures across phyla,
are needed to help shed light onto the evolution of the amazing diversity of body plans found
within Lophotrochoza.
5.7 References
Ahlrichs W.H., 1997. Epidermal ultrastructure of Seison nebaliae and Seison annulatus, and a comparison of epidermal structures within the Gnathifera. Zoomorphology. 117, 41–48.
Baguñà J., Martinez P., Paps J., Riutort M., 2008. Back in time: a new systematic proposal for the Bilateria. Phil. Trans. R. Soc. B. 363, 1481–1491.
Beckers P., Faller S., Loesel R., 2011. Lophotrochozoan neuroanatomy: An analysis of the brain and nervous system of Lineus viridis (Nemertea) using different staining techniques. Frontiers in Zoology. 8, 17.
Beckers P., 2011. Nemertean nervous system. Ph.D. Dissertation. University of Bohn.
Bleidorn C., Eeckhaut I., Podsiadlowski L., Schult N., McHugh D., Halanych K.M., Milinkovitch M.C., Tiedemann R., 2007. Mitochondrial genome and nuclear sequence data support Myzostomida as part of the annelid radiation. Mol Biol Evol. 24, 1690–1701.
Bleidorn C., Podsiadlowski L., Zhong M., Eeckhaut I., Hartmann S., Halanych K.M., Tiedemann R., 2009. On the phylogenetic position of Myzostomida: can 77 genes get it wrong? BMC Evolutionary Biology. 9, 150.
Brocco S.L., O’Clair R.M., Cloney R.A., 1974. Cephalopod integument: The ultrastructure of Kölliker’s organs and their relationship to setae. Cell Tissue Res. 151, 293–308.
Brown C.T., Howe A., Zhang Q., Pyrkosz A.B., Brom T.H., 2012. A Reference-Free Algorithm for Computational Normalization of Shotgun Sequencing Data. arXiv:1203.4802. .
Cavalier-Smith T., 1998. A revised six-kingdom system of life. Biological Reviews. 73, 203–266.
Chou H.-H., Holmes M.H., 2001. DNA sequence quality trimming and vector removal. Bioinformatics. 17, 1093 –1104.
187
Cohen B.L., Gawthrop A., Cavalier-Smith T., 1998. Molecular phylogeny of brachiopods and phoronids based on nuclear-encoded small subunit ribosomal RNA gene sequences. Philosophical Transactions of the Royal Society B: Biological Sciences. 353, 2039–2061.
Cohen B.L., Weydmann A., 2005. Molecular evidence that phoronids are a subtaxon of brachiopods (Brachiopoda: Phoronata) and that genetic divergence of metazoan phyla began long before the early Cambrian. Organisms Diversity & Evolution. 5, 253–273.
Cohen B.L., 2000. Monophyly of brachiopods and phoronids: reconciliation of molecular evidence with Linnaean classification (the subphylum Phoroniformea nov.). Proceedings of the Royal Society of London. Series B: Biological Sciences. 267, 225–231.
Cohen B.L., 2013. Rerooting the rDNA gene tree reveals phoronids to be “brachiopods without shells”; dangers of wide taxon samples in metazoan phylogenetics (Phoronida; Brachiopoda). Zoological Journal of the Linnean Society. 167, 82–92.
Dunn C.W., Hejnol A., Matus D.Q., Pang K., Browne W.E., Smith S.A., Seaver E., Rouse G.W., Obst M., Edgecombe G.D., others, 2008. Broad phylogenomic sampling improves resolution of the animal tree of life. Nature. 452, 745–749.
Ebersberger I., Strauss S., Von Haeseler A., 2009. HaMStR: Profile hidden Markov model based search for orthologs in ESTs. BMC Evolutionary Biology. 9, 157.
Edgecombe G.D., Giribet G., Dunn C.W., Hejnol A., Kristensen R.M., Neves R.C., Rouse G.W., Worsaae K., Sørensen M.V., 2011. Higher-level metazoan relationships: recent progress and remaining questions. Organisms Diversity and Evolution. 11, 151.
Forment J., Gilabert F., Robles A., Conejero V., Nuez F., Blanca J., 2008. EST2uni: an open, parallel tool for automated EST analysis and database creation, with a data mining web interface and microarray expression data integration. BMC Bioinformatics. 9, 5.
Fuchs J., Iseto T., Hirose M., Sundberg P., Obst M., 2010. The first internal molecular phylogeny of the animal phylum Entoprocta (Kamptozoa). Molecular Phylogenetics and Evolution. 56, 370–379.
Funch P., Kristensen R.M., 1995. Cycliophora is a new phylum with affinities to Entoprocta and Ectoprocta. Nature. 378, 711–714.
Funch P., Sørensen M.V., Obst M., 2005. On the Phylogenetic Position of Rotifera – Have We Come Any Further? Hydrobiologia. 546, 11–28.
Giribet G., Distel D.L., Polz M., Sterrer W., Wheeler W.C., 2000. Triploblastic Relationships with Emphasis on the Acoelomates and the Position of Gnathostomulida, Cycliophora, Plathelminthes, and Chaetognatha: A Combined Approach of 18S rDNA Sequences and Morphology. Syst Biol. 49, 539–562.
Giribet G., 2008. Assembling the lophotrochozoan (=spiralian) tree of life. Phil. Trans. R. Soc. B. 363, 1513–1522.
188
Glenner H., Hansen A.J., Sørensen M.V., Ronquist F., Huelsenbeck J.P., Willerslev E., 2004. Bayesian Inference of the Metazoan Phylogeny: A Combined Molecular and Morphological Approach. Current Biology. 14, 1644–1649.
Grabherr M.G., Haas B.J., Yassour M., Levin J.Z., Thompson D.A., Amit I., Adiconis X., Fan L., Raychowdhury R., Zeng Q., Chen Z., Mauceli E., Hacohen N., Gnirke A., Rhind N., Palma F. di, Birren B.W., Nusbaum C., Lindblad-Toh K., Friedman N., Regev A., 2011. Full-length transcriptome assembly from RNA-Seq data without a reference genome. Nature Biotechnology. 29, 644–652.
Gustus R.M., Cloney R.A., 1972. Ultrastructural similarities between setae of brachiopods and polychaetes. Acta Zoologica. 53, 229–233.
Halanych K.M., Bacheller J.D., Aguinaldo A.M.., Liva S.M., Hillis D.M., Lake J.A., 1995. Evidence from 18S ribosomal DNA that the lophophorates are protostome animals. Science(Washington). 267, 1641–1641.
Halanych K.M., 1996. Convergence in the feeding apparatuses of lophophorates and pterobranch hemichordates revealed by 18S rDNA: an interpretation. The Biological Bulletin. 190, 1–5.
Halanych K.M., 2004. The new view of animal phylogeny. Annual review of ecology, evolution, and systematics. 35, 229–256.
Hartmann S., Helm C., Nickel B., Meyer M., Struck T.H., Tiedemann R., Selbig J., Bleidorn C., 2012. Exploiting gene families for phylogenomic analysis of myzostomid transcriptome data. PLoS One. 7, e29843.
Haszprunar G., 2000. Is the Aplacophora monophyletic? A cladistic point of view. American Malacological Bulletin. 15, 115–130.
Hausdorf B., Helmkampf M., Meyer A., Witek A., Herlyn H., Bruchhaus I., Hankeln T., Struck T.H., Lieb B., 2007. Spiralian phylogenomics supports the resurrection of Bryozoa comprising Ectoprocta and Entoprocta. Molecular biology and evolution. 24, 2723.
Hausdorf B., Helmkampf M., Nesnidal M.P., Bruchhaus I., 2010. Phylogenetic relationships within the lophophorate lineages (Ectoprocta, Brachiopoda and Phoronida). Molecular Phylogenetics and Evolution. 55, 1121–1127.
Hejnol A., Obst M., Stamatakis A., Ott M., Rouse G.W., Edgecombe G.D., Martinez P., Bagunà J., Bailly X., Jondelius U., others, 2009. Assessing the root of bilaterian animals with scalable phylogenomic methods. Proceedings of the Royal Society B: Biological Sciences. 276, 4261.
Helm C., Bernhart S.H., Siederdissen C.H., Nickel B., Bleidorn C., 2012. Deep sequencing of small RNAs confirms an annelid affinity of Myzostomida. Molecular Phylogenetics and Evolution. 64(1), 198-203.
189
Helmkampf M., Bruchhaus I., Hausdorf B., 2008. Phylogenomic analyses of lophophorates (brachiopods, phoronids and bryozoans) confirm the Lophotrochozoa concept. Proceedings of the Royal Society B: Biological Sciences. 275, 1927.
Hochberg R., Atherton S., 2011. A new species of Lepidodasys (Gastrotricha, Macrodasyida) from Panama with a description of its peptidergic nervous system using CLSM, anti-FMRFamide and anti-SCPB. Zoologischer Anzeiger - A Journal of Comparative Zoology. 250, 111–122.
Huang X., Madan A., 1999. CAP3: A DNA Sequence Assembly Program. Genome Research. 9, 868 –877.
Hyman L.H., 1959. The Invertebrates: Smaller coelomate groups. McGraw-Hill.
Katoh K., Kuma K., Toh H., Miyata T., 2005. MAFFT version 5: improvement in accuracy of multiple sequence alignment. Nucleic Acids Research. 33, 511 –518.
Kocot K., Cannon J., Halanych K., 2010. Elucidating Animal Phylogeny., in: DeSalle R., Schierwater B. (Eds.), Key Transitions in Animal Evolution, Science Publishers, pp. 15–33.
Kocot K.M., Cannon J.T., Todt C., Citarella M.R., Kohn A.B., Meyer A., Santos S.R., Schander C., Moroz L.L., Lieb B., Halanych K.M., 2011. Phylogenomics reveals deep molluscan relationships. Nature. 477, 452–456.
Kristensen R.M., Funch P., 2000. Micrognathozoa: A new class with complicated jaws like those of Rotifera and Gnathostomulida. Journal of Morphology. 246, 1–49.
Kück P., 2009. ALICUT: a PerlScript which cuts ALISCORE identified RSS. Department of Bioinformatics, Zoologisches Forschungsmuseum A. Koenig (ZFMK), Bonn, Germany, version. 2, .
Lartillot N., Lepage T., Blanquart S., 2009. PhyloBayes 3: a Bayesian software package for phylogenetic reconstruction and molecular dating. Bioinformatics. 25, 2286.
Lüter C., Bartolomaeus T., 1997. The phylogenetic position of Brachiopoda—a comparison of morphological and molecular data. Zoologica Scripta. 26, 245–253.
Mackey L.Y., Winnepenninckx B., De Wachter R., Backeljau T., Emschermann P., Garey J.R., 1996. 18S rRNA suggests that Entoprocta are protostomes, unrelated to Ectoprocta. Journal of Molecular Evolution. 42, 552–559.
Mallatt J., Craig C.W., Yoder M.J., 2012. Nearly complete rRNA genes from 371 Animalia: Updated structure-based alignment and detailed phylogenetic analysis. Molecular Phylogenetics and Evolution. 64(3), 603-617.
190
Mallatt J., Winchell C.J., 2002. Testing the New Animal Phylogeny: First Use of Combined Large-Subunit and Small-Subunit rRNA Gene Sequences to Classify the Protostomes. Mol Biol Evol. 19, 289–301.
Maslakova S.A., Martindale M.Q., Norenburg J.L., 2004. Vestigial prototroch in a basal nemertean, Carinoma tremaphoros (Nemertea; Palaeonemertea). Evolution & Development. 6, 219–226.
Minelli A., 2009. Perspectives in Animal Phylogeny and Evolution. , Oxford University Press, Oxford.
Morris S.C., Peel J.S., 1995. Articulated Halkieriids from the Lower Cambrian of North Greenland and their Role in Early Protostome Evolution. Philosophical Transactions: Biological Sciences. 347, 305–358.
Müller M.C., 2006. Polychaete nervous systems: Ground pattern and variations—cLS microscopy and the importance of novel characteristics in phylogenetic analysis. Integrative and Comparative Biology. 46, 125–133.
Nielsen C., 1971. Entoproct life-cycles and the entoproct/ectoproct relationship. Ophelia. 9, 209–341.
Nielsen C., 1977. The Relationships of Entoprocta, Ectoprocta and Phoronida. Amer. Zool. 17, 149–150.
Nielsen C., 2011. Animal Evolution: Interrelationships of the Living Phyla. Oxford University Press,
Nielsen C., 2012. How to make a protostome. Invertebrate Systematics. 26, 25–40.
Orrhage L., Müller M.C., 2005. Morphology of the nervous system of Polychaeta (Annelida). Morphology, Molecules, Evolution and Phylogeny in Polychaeta and Related Taxa. 79–111.
Orrhage L., 1971. Light and electron microscope studies of some annelid setae. Acta Zoologica. 52, 157–169.
Orrhage L., 1973. Light and electron microscope studies of some brachiopod and pogonophoran setae. Zoomorphology. 74, 253–270.
Ostlund G., Schmitt T., Forslund K., Kostler T., Messina D.N., Roopra S., Frings O., Sonnhammer E.L.L., 2009. InParanoid 7: new algorithms and tools for eukaryotic orthology analysis. Nucleic Acids Research. 38, D196–D203.
Paps J., Bagunà J., Riutort M., 2009a. Bilaterian phylogeny: A broad sampling of 13 nuclear genes provides a new Lophotrochozoa phylogeny and supports a paraphyletic basal Acoelomorpha. Molecular Biology and Evolution. 26, 2397–2406.
191
Paps J., Baguñà J., Riutort M., 2009b. Lophotrochozoa internal phylogeny: new insights from an up-to-date analysis of nuclear ribosomal genes. Proceedings of the Royal Society B: Biological Sciences. 276, 1245 –1254.
Passamaneck Y., Halanych K.M., 2006. Lophotrochozoan phylogeny assessed with LSU and SSU data: evidence of lophophorate polyphyly. Molecular phylogenetics and evolution. 40, 20–28.
Peterson K.J., Eernisse D.J., 2001. Animal phylogeny and the ancestry of bilaterians: inferences from morphology and 18S rDNA gene sequences. Evolution & Development. 3, 170–205.
Rothe B.H., Schmidt-Rhaesa A., 2009. Architecture of the nervous system in two Dactylopodola species (Gastrotricha, Macrodasyida). Zoomorphology. 128, 227–246.
Roure B., Baurain D., Philippe H., 2012. Impact of missing data on phylogenies inferred from empirical phylogenomic datasets. Molecular Biology and Evolution. .
Roure B., Rodriguez-Ezpeleta N., Philippe H., 2007. SCaFoS: a tool for Selection, Concatenation and Fusion of Sequences for phylogenomics. BMC Evolutionary Biology. 7, S2.
Rouse G.W., 1999. Trochophore concepts: ciliary bands and the evolution of larvae in spiralian Metazoa. Biological Journal of the Linnean Society. 66, 411–464.
Ruppert E.E., Carle K.J., 1983. Morphology of metazoan circulatory systems. Zoomorphology. 103, 193–208.
Ruppert E.E., Fox R.S., Barnes R.D., 2004. Invertebrate Zoology. , Thomson, Belmont, CA.
Santagata S., Cohen B., 2009. Phoronid phylogenetics (Brachiopoda; Phoronata): evidence from morphological cladistics, small and large subunit rDNA sequences, and mitochondrial cox1. Zoological Journal of the Linnean Society. 157, 34–50.
Scheltema A.H., Kerth K., Kuzirian A.M., 2003. Original molluscan radula: comparisons among Aplacophora, Polyplacophora, Gastropoda, and the Cambrian fossil Wiwaxia corrugata. Journal of Morphology. 257, 219–245.
Schepotieff A., 1904. Untersuchungen über die borstentaschen einiger Polychäten. .
Schulze A., 2002. Ultrastructure of opisthosomal chaetae in Vestimentifera (Pogonophora, Obturata) and implications for phylogeny. Acta Zoologica. 82, 127–135.
Smith M.R., 2012. Mouthparts of the Burgess Shale fossils Odontogriphus and Wiwaxia: implications for the ancestral molluscan radula. Proceedings of the Royal Society B: Biological Sciences. 279, 4287–4295.
192
Smith S.A., Wilson N.G., Goetz F.E., Feehery C., Andrade S.C.S., Rouse G.W., Giribet G., Dunn C.W., 2011. Resolving the evolutionary relationships of molluscs with phylogenomic tools. Nature. 480, 364–367.
Sperling E.A., Pisani D., Peterson K.J., 2011. Molecular paleobiological insights into the origin of the Brachiopoda. Evolution & Development. 13, 290–303.
Stamatakis A., 2006. RAxML-VI-HPC: maximum likelihood-based phylogenetic analyses with thousands of taxa and mixed models. Bioinformatics. 22, 2688.
Struck T.H., Fisse F., 2008. Phylogenetic Position of nemertea derived from phylogenomic data. Molecular Biology and Evolution. 25, 728–736.
Thomas R.D.K., Vinther J., 2012. Implications of the occurrence of paired anterior chaetae in the Late Early Cambrian mollusc Pelagiella from the Kinziers Formation of Pennsylvania for Relationships among taxa and early evolution of the Mollusca. Geological Society of America Abstracts with Programs. 44, 326.
Thompson J.V., 1830. On Polyzoa, a new animal discovered as an inhabitant of some Zoophites-with a description of the newly instituted Genera of Pedicellaria and Vesicularia, and their Species. .
Todaro M.A., Telford M.J., Lockyer A.E., Littlewood D.T.J., 2006. Interrelationships of the Gastrotricha and their place among the Metazoa inferred from 18S rRNA genes. Zoologica Scripta. 35, 251–259.
Turbeville J.M., 1983. An ultrastructural analysis of coelomogenesis in the hoplonemertine Prosorhochmus americanus and the polychaete Magelona sp. Journal of Morphology. 187, 51–60.
Vinther J., Nielsen C., 2005. The early Cambrian Halkieria is a mollusc. Zoologica Scripta. 34, 81–89.
Vinther J., Sperling E.A., Briggs D.E.G., Peterson K.J., 2011. A molecular palaeobiological hypothesis for the origin of aplacophoran molluscs and their derivation from chiton-like ancestors. Proceedings of the Royal Society B: Biological Sciences. .
Vinther J., 2009. The Canal System in Sclerites of Lower Cambrian Sinosachites (Halkieriidae: Sachitida): Significance for the Molluscan Affinities of the Sachitids. Palaeontology. 52, 689–712.
Wanninger A., 2009. Shaping the Things to Come: Ontogeny of Lophotrochozoan Neuromuscular Systems and the Tetraneuralia Concept. The Biological Bulletin. 216, 293 –306.
Westheide W., Russell C.W., 1992. Ultrastructure of chrysopetalid paleal chaetae (Annelida, Polychaeta). Acta Zoologica. 73, 197–202.
193
Winnepenninckx B., Backeljau T., Mackey L.Y., Brooks J.M., De Wachter R., Kumar S., Garey J.R., 1995. 18S rRNA data indicate that Aschelminthes are polyphyletic in origin and consist of at least three distinct clades. Molecular Biology and Evolution. 12, 1132–1137.
Witek A., Herlyn H., Ebersberger I., Mark Welch D.B., Hankeln T., 2009. Support for the monophyletic origin of Gnathifera from phylogenomics. Molecular Phylogenetics and Evolution. 53, 1037–1041.
Zrzavy J., 2001. The interrelationships of metazoan parasites: a review of phylum-and higher-level hypotheses from recent morphological and molecular phylogenetic analyses. Folia Parasitologica. 48, 81–103.
Zrzavý J., 2003. Gastrotricha and metazoan phylogeny. Zoologica Scripta. 32, 61–81.
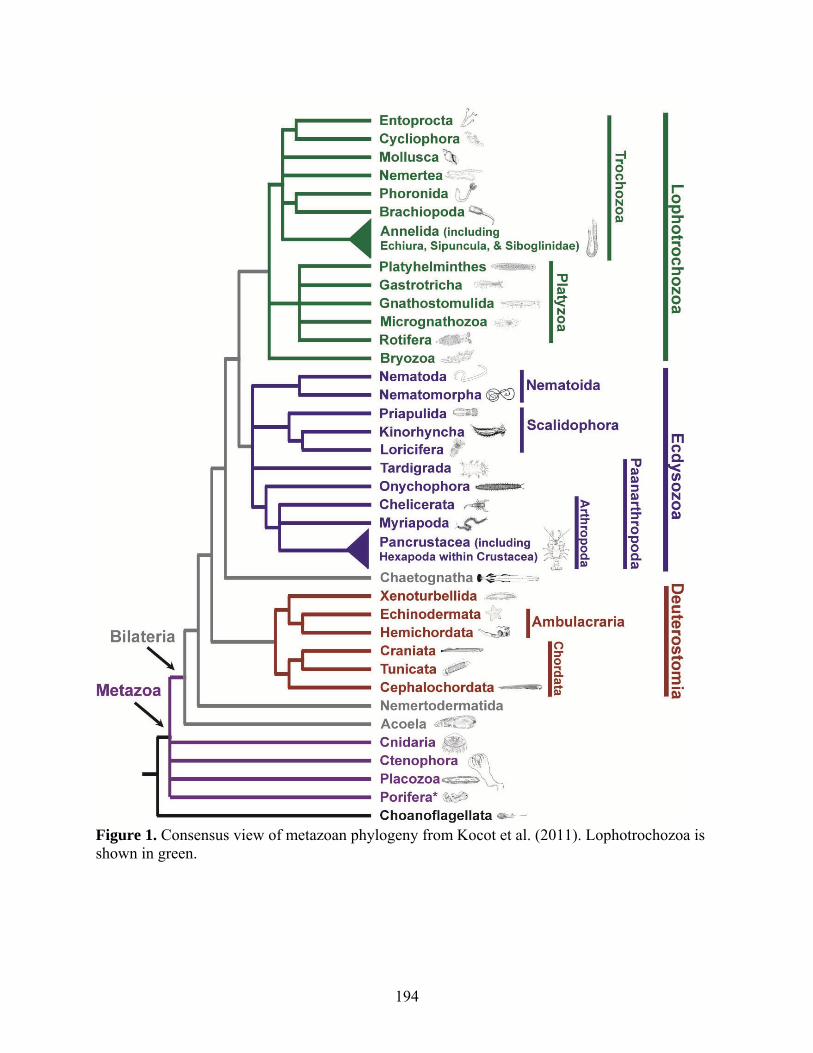
194
Figure 1. Consensus view of metazoan phylogeny from Kocot et al. (2011). Lophotrochozoa is shown in green.
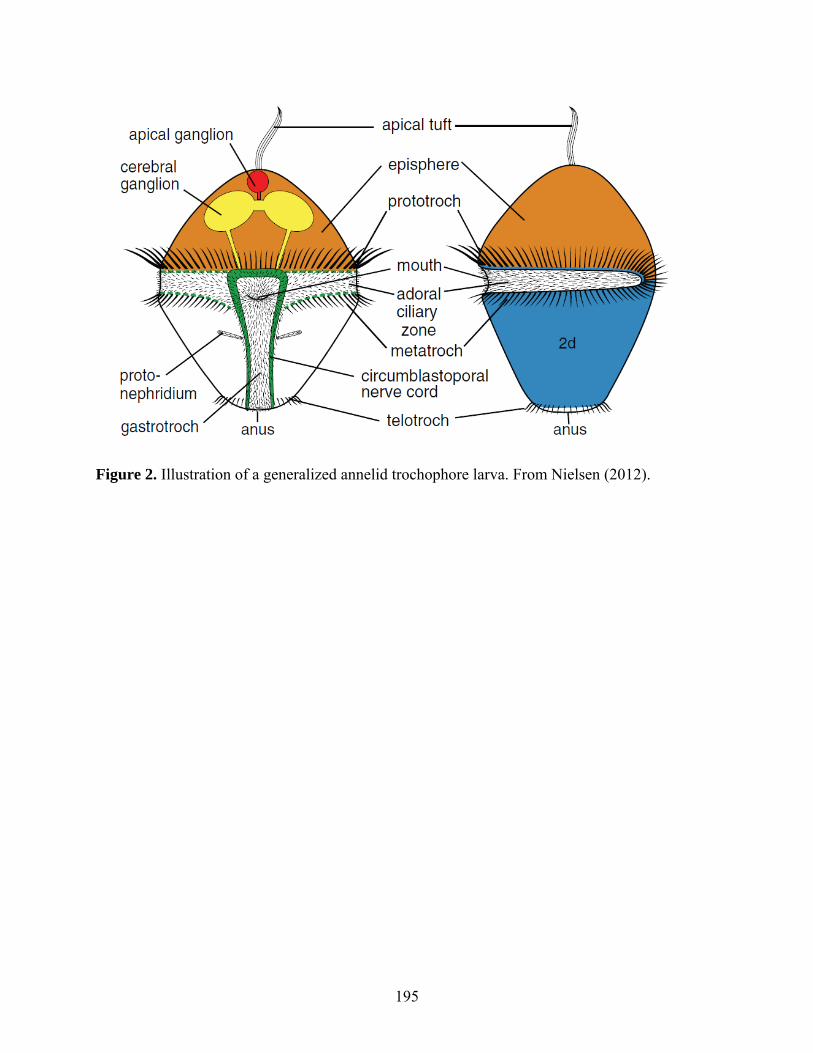
195
Figure 2. Illustration of a generalized annelid trochophore larva. From Nielsen (2012).
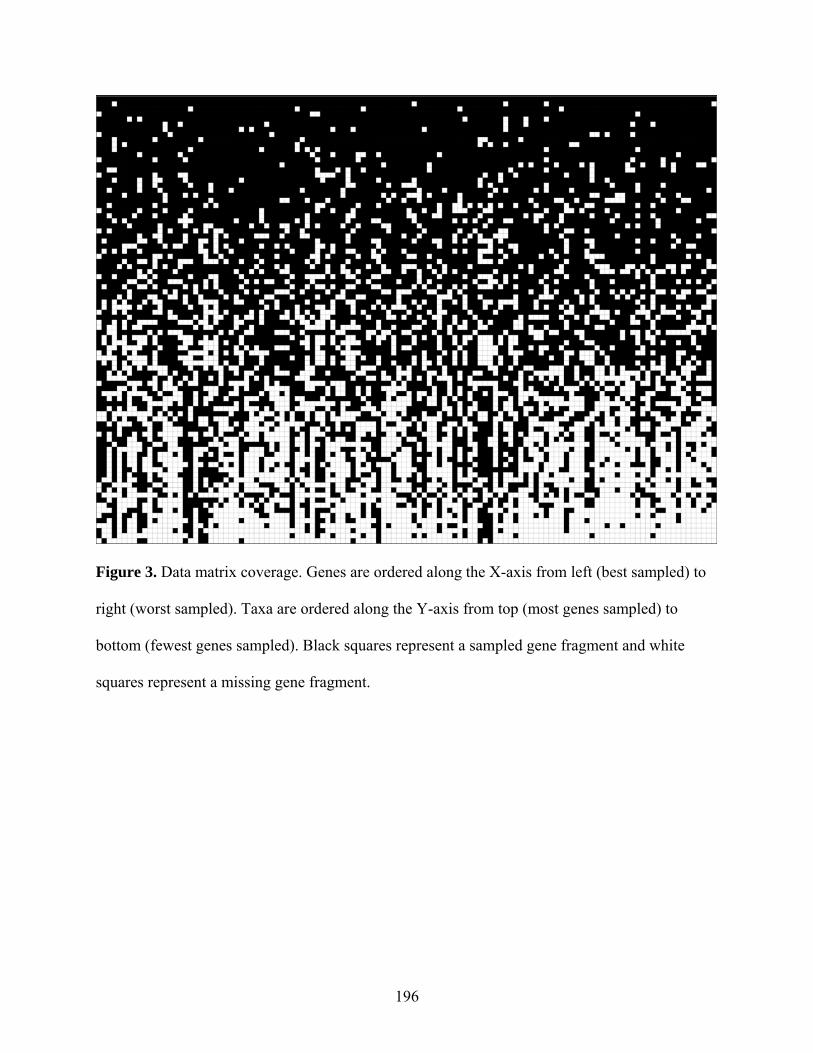
196
Figure 3. Data matrix coverage. Genes are ordered along the X-axis from left (best sampled) to
right (worst sampled). Taxa are ordered along the Y-axis from top (most genes sampled) to
bottom (fewest genes sampled). Black squares represent a sampled gene fragment and white
squares represent a missing gene fragment.
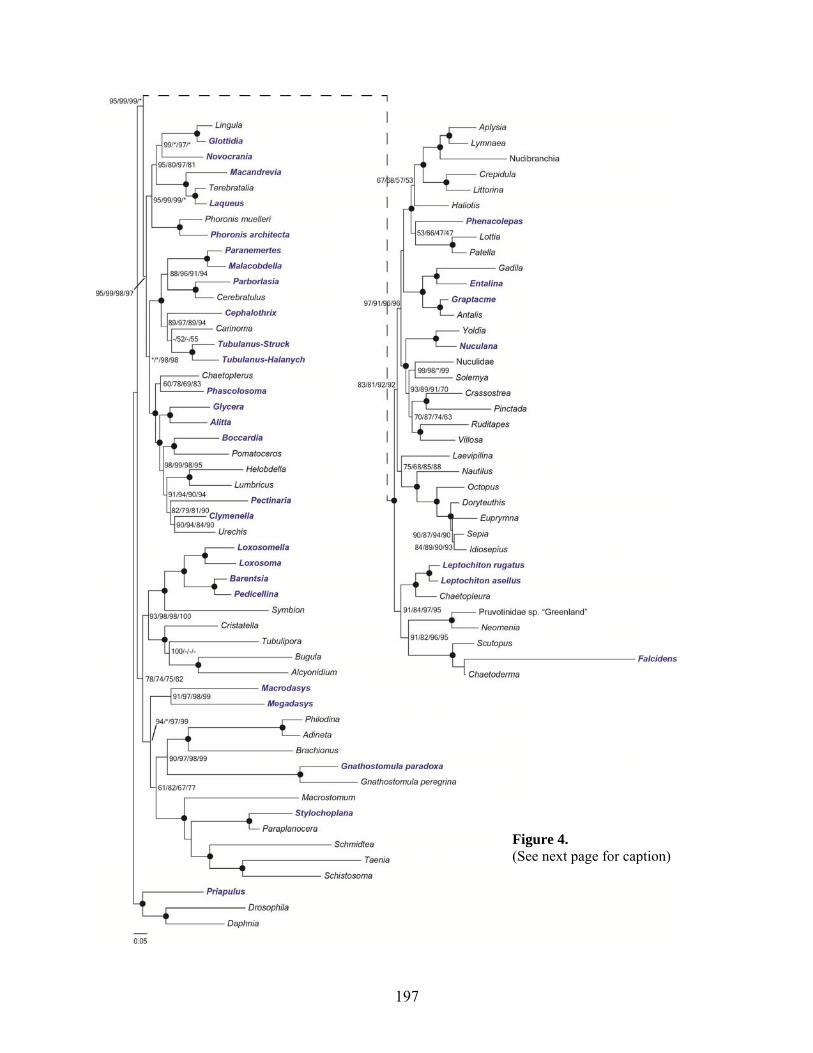
197
Figure 4. (See next page for caption)
198
Figure 4. Lophotrochozoan phylogeny based on 122 genes. Maximum likelihood topology based
on PROTGAMMALGF model shown with bs values from each of the four analyses listed as
follows: PROTGAMMALGF / PROTCATLGF / PROTGAMMAWAGF / PROTCATWAGF.
Asterisks represent bs = 100. Filled circles represent nodes with bs = 100 in all four analyses.
Support values below 50 not shown. Taxa from which new data were collected are shown in
blue. The length of the branch leading to Mollusca is 0.0410.
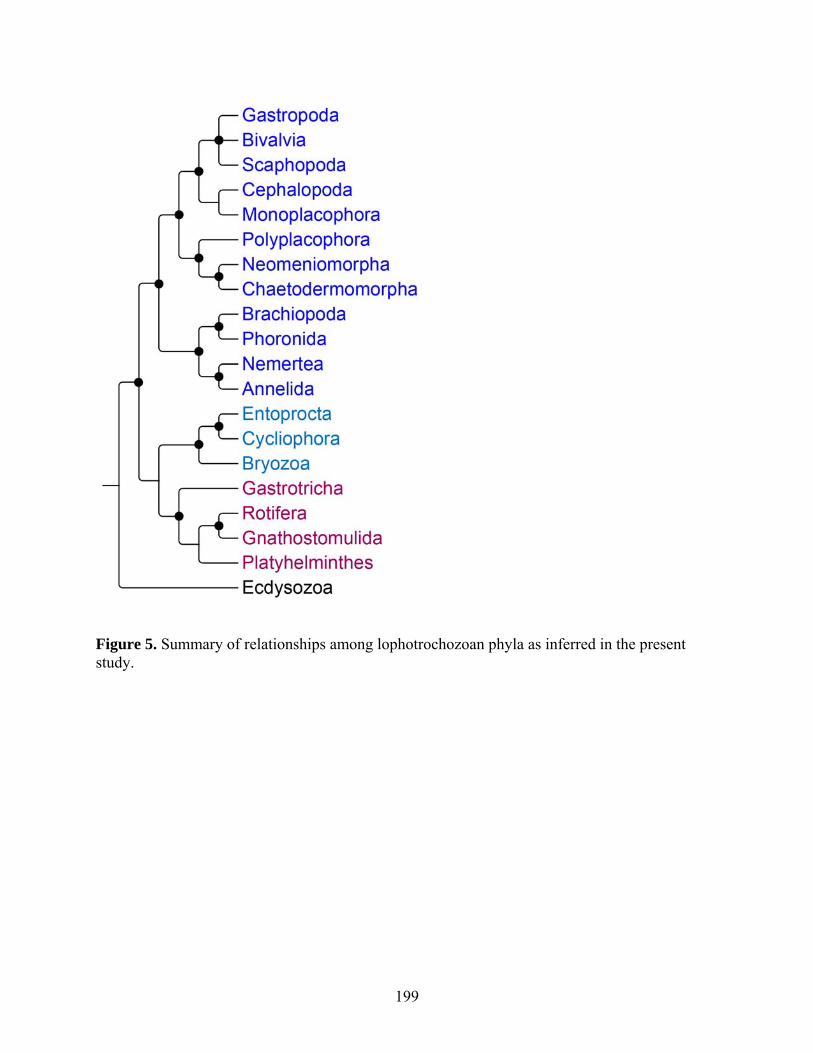
199
Figure 5. Summary of relationships among lophotrochozoan phyla as inferred in the present study.
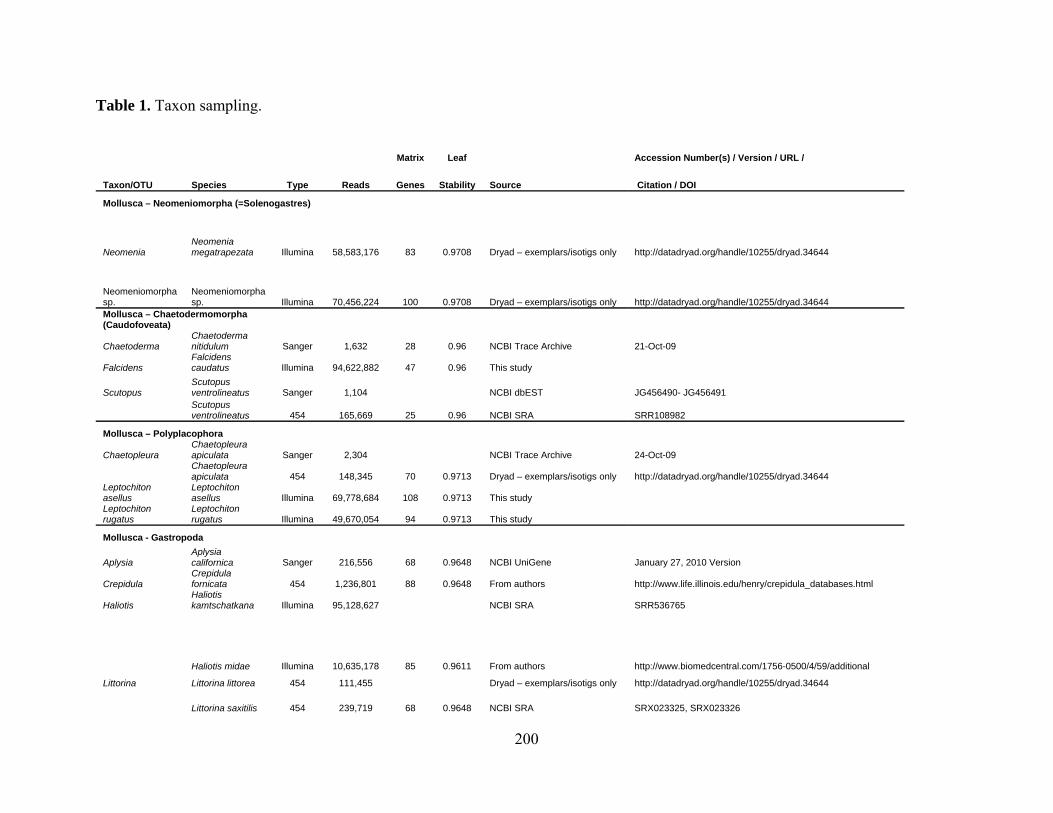
200
Table 1. Taxon sampling.
Matrix Leaf Accession Number(s) / Version / URL /
Taxon/OTU Species Type Reads Genes Stability Source Citation / DOI
Mollusca – Neomeniomorpha (=Solenogastres)
Neomenia Neomenia megatrapezata Illumina 58,583,176 83 0.9708 Dryad – exemplars/isotigs only http://datadryad.org/handle/10255/dryad.34644
Neomeniomorpha sp.
Neomeniomorpha sp. Illumina 70,456,224 100 0.9708 Dryad – exemplars/isotigs only http://datadryad.org/handle/10255/dryad.34644
Mollusca – Chaetodermomorpha (Caudofoveata)
Chaetoderma Chaetoderma nitidulum Sanger 1,632 28 0.96 NCBI Trace Archive 21-Oct-09
Falcidens Falcidens caudatus Illumina 94,622,882 47 0.96 This study
Scutopus Scutopus ventrolineatus Sanger 1,104 NCBI dbEST JG456490- JG456491
Scutopus ventrolineatus 454 165,669 25 0.96 NCBI SRA SRR108982
Mollusca – Polyplacophora
Chaetopleura Chaetopleura apiculata Sanger 2,304 NCBI Trace Archive 24-Oct-09
Chaetopleura apiculata 454 148,345 70 0.9713 Dryad – exemplars/isotigs only http://datadryad.org/handle/10255/dryad.34644
Leptochiton asellus
Leptochiton asellus Illumina 69,778,684 108 0.9713 This study
Leptochiton rugatus
Leptochiton rugatus Illumina 49,670,054 94 0.9713 This study
Mollusca - Gastropoda
Aplysia Aplysia californica Sanger 216,556 68 0.9648 NCBI UniGene January 27, 2010 Version
Crepidula Crepidula fornicata 454 1,236,801 88 0.9648 From authors http://www.life.illinois.edu/henry/crepidula_databases.html
Haliotis Haliotis kamtschatkana Illumina 95,128,627 NCBI SRA SRR536765
Haliotis midae Illumina 10,635,178 85 0.9611 From authors http://www.biomedcentral.com/1756-0500/4/59/additional
Littorina Littorina littorea 454 111,455 Dryad – exemplars/isotigs only http://datadryad.org/handle/10255/dryad.34644
Littorina saxitilis 454 239,719 68 0.9648 NCBI SRA SRX023325, SRX023326
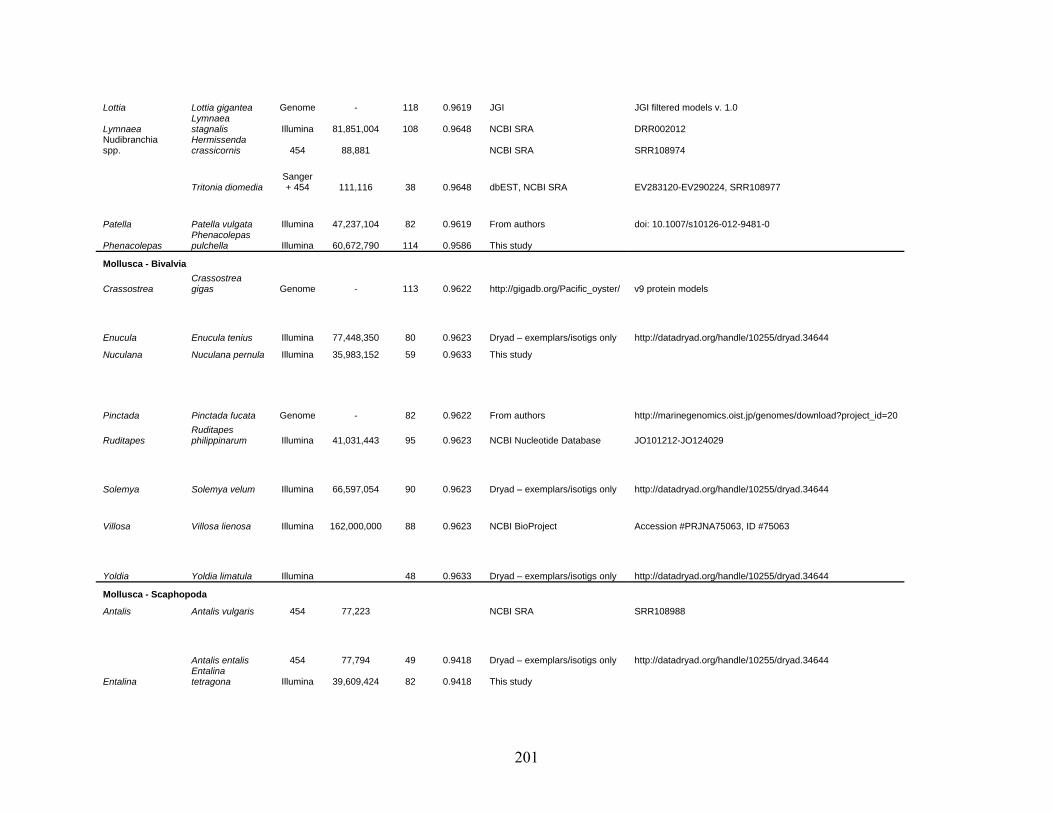
201
Lottia Lottia gigantea Genome - 118 0.9619 JGI JGI filtered models v. 1.0
Lymnaea Lymnaea stagnalis Illumina 81,851,004 108 0.9648 NCBI SRA DRR002012
Nudibranchia spp.
Hermissenda crassicornis 454 88,881 NCBI SRA SRR108974
Tritonia diomedia Sanger + 454 111,116 38 0.9648 dbEST, NCBI SRA EV283120-EV290224, SRR108977
Patella Patella vulgata Illumina 47,237,104 82 0.9619 From authors doi: 10.1007/s10126-012-9481-0
Phenacolepas Phenacolepas pulchella Illumina 60,672,790 114 0.9586 This study
Mollusca - Bivalvia
Crassostrea Crassostrea gigas Genome - 113 0.9622 http://gigadb.org/Pacific_oyster/ v9 protein models
Enucula Enucula tenius Illumina 77,448,350 80 0.9623 Dryad – exemplars/isotigs only http://datadryad.org/handle/10255/dryad.34644
Nuculana Nuculana pernula Illumina 35,983,152 59 0.9633 This study
Pinctada Pinctada fucata Genome - 82 0.9622 From authors http://marinegenomics.oist.jp/genomes/download?project_id=20
Ruditapes Ruditapes philippinarum Illumina 41,031,443 95 0.9623 NCBI Nucleotide Database JO101212-JO124029
Solemya Solemya velum Illumina 66,597,054 90 0.9623 Dryad – exemplars/isotigs only http://datadryad.org/handle/10255/dryad.34644
Villosa Villosa lienosa Illumina 162,000,000 88 0.9623 NCBI BioProject Accession #PRJNA75063, ID #75063
Yoldia Yoldia limatula Illumina 48 0.9633 Dryad – exemplars/isotigs only http://datadryad.org/handle/10255/dryad.34644
Mollusca - Scaphopoda
Antalis Antalis vulgaris 454 77,223 NCBI SRA SRR108988
Antalis entalis 454 77,794 49 0.9418 Dryad – exemplars/isotigs only http://datadryad.org/handle/10255/dryad.34644
Entalina Entalina tetragona Illumina 39,609,424 82 0.9418 This study
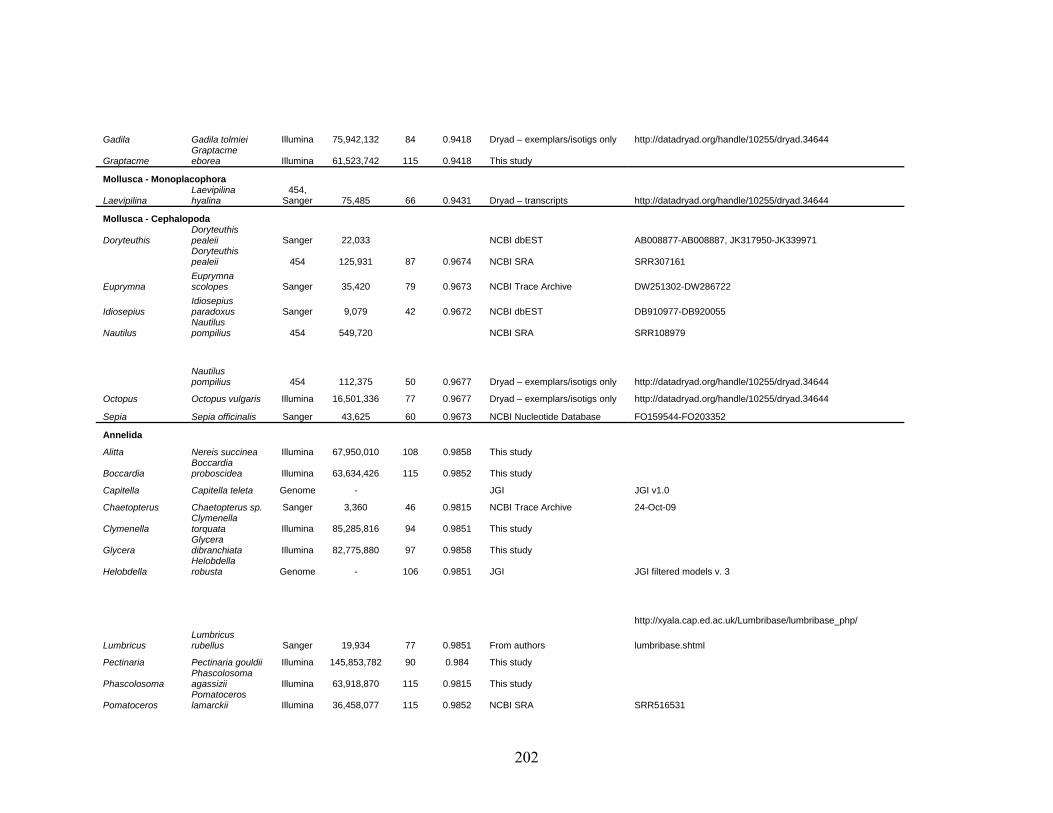
202
Gadila Gadila tolmiei Illumina 75,942,132 84 0.9418 Dryad – exemplars/isotigs only http://datadryad.org/handle/10255/dryad.34644
Graptacme Graptacme eborea Illumina 61,523,742 115 0.9418 This study
Mollusca - Monoplacophora
Laevipilina Laevipilina hyalina
454, Sanger 75,485 66 0.9431 Dryad – transcripts http://datadryad.org/handle/10255/dryad.34644
Mollusca - Cephalopoda
Doryteuthis Doryteuthis pealeii Sanger 22,033 NCBI dbEST AB008877-AB008887, JK317950-JK339971
Doryteuthis pealeii 454 125,931 87 0.9674 NCBI SRA SRR307161
Euprymna Euprymna scolopes Sanger 35,420 79 0.9673 NCBI Trace Archive DW251302-DW286722
Idiosepius Idiosepius paradoxus Sanger 9,079 42 0.9672 NCBI dbEST DB910977-DB920055
Nautilus Nautilus pompilius 454 549,720 NCBI SRA SRR108979
Nautilus pompilius 454 112,375 50 0.9677 Dryad – exemplars/isotigs only http://datadryad.org/handle/10255/dryad.34644
Octopus Octopus vulgaris Illumina 16,501,336 77 0.9677 Dryad – exemplars/isotigs only http://datadryad.org/handle/10255/dryad.34644
Sepia Sepia officinalis Sanger 43,625 60 0.9673 NCBI Nucleotide Database FO159544-FO203352
Annelida
Alitta Nereis succinea Illumina 67,950,010 108 0.9858 This study
Boccardia Boccardia proboscidea Illumina 63,634,426 115 0.9852 This study
Capitella Capitella teleta Genome - JGI JGI v1.0
Chaetopterus Chaetopterus sp. Sanger 3,360 46 0.9815 NCBI Trace Archive 24-Oct-09
Clymenella Clymenella torquata Illumina 85,285,816 94 0.9851 This study
Glycera Glycera dibranchiata Illumina 82,775,880 97 0.9858 This study
Helobdella Helobdella robusta Genome - 106 0.9851 JGI JGI filtered models v. 3
http://xyala.cap.ed.ac.uk/Lumbribase/lumbribase_php/
Lumbricus Lumbricus rubellus Sanger 19,934 77 0.9851 From authors lumbribase.shtml
Pectinaria Pectinaria gouldii Illumina 145,853,782 90 0.984 This study
Phascolosoma Phascolosoma agassizii Illumina 63,918,870 115 0.9815 This study
Pomatoceros Pomatoceros lamarckii Illumina 36,458,077 115 0.9852 NCBI SRA SRR516531
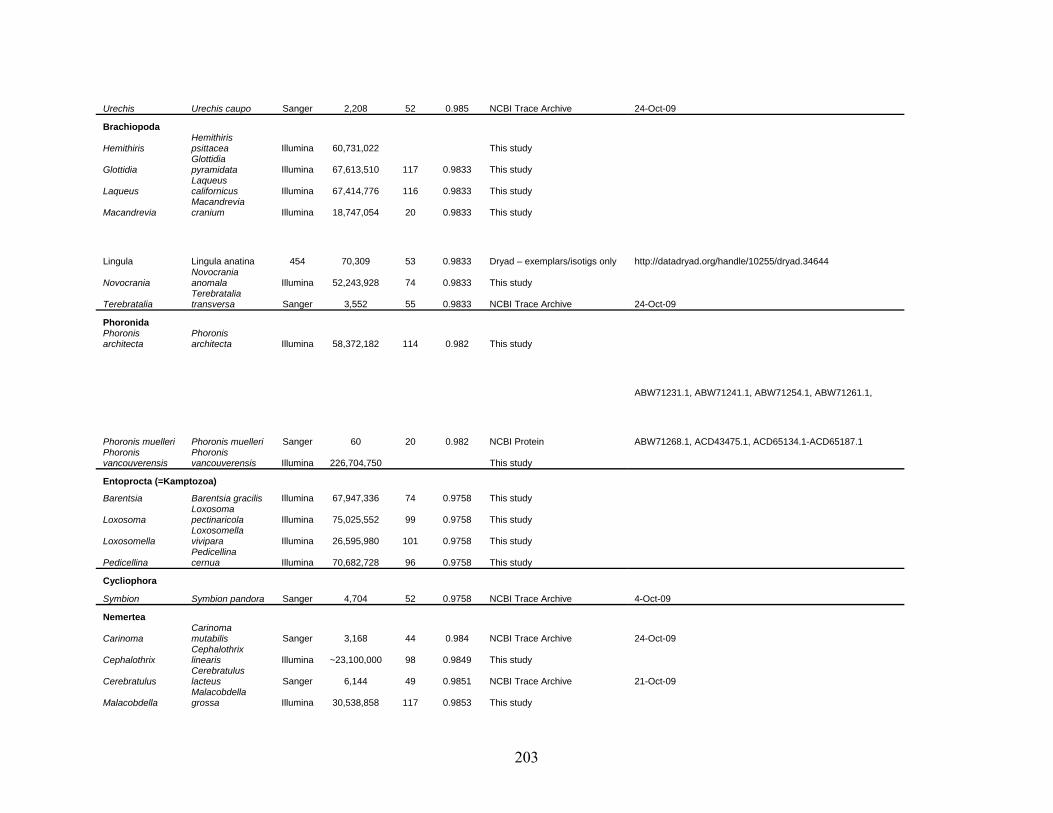
203
Urechis Urechis caupo Sanger 2,208 52 0.985 NCBI Trace Archive 24-Oct-09
Brachiopoda
Hemithiris Hemithiris psittacea Illumina 60,731,022 This study
Glottidia Glottidia pyramidata Illumina 67,613,510 117 0.9833 This study
Laqueus Laqueus californicus Illumina 67,414,776 116 0.9833 This study
Macandrevia Macandrevia cranium Illumina 18,747,054 20 0.9833 This study
Lingula Lingula anatina 454 70,309 53 0.9833 Dryad – exemplars/isotigs only http://datadryad.org/handle/10255/dryad.34644
Novocrania Novocrania anomala Illumina 52,243,928 74 0.9833 This study
Terebratalia Terebratalia transversa Sanger 3,552 55 0.9833 NCBI Trace Archive 24-Oct-09
Phoronida Phoronis architecta
Phoronis architecta Illumina 58,372,182 114 0.982 This study
ABW71231.1, ABW71241.1, ABW71254.1, ABW71261.1,
Phoronis muelleri Phoronis muelleri Sanger 60 20 0.982 NCBI Protein ABW71268.1, ACD43475.1, ACD65134.1-ACD65187.1 Phoronis vancouverensis
Phoronis vancouverensis Illumina 226,704,750 This study
Entoprocta (=Kamptozoa)
Barentsia Barentsia gracilis Illumina 67,947,336 74 0.9758 This study
Loxosoma Loxosoma pectinaricola Illumina 75,025,552 99 0.9758 This study
Loxosomella Loxosomella vivipara Illumina 26,595,980 101 0.9758 This study
Pedicellina Pedicellina cernua Illumina 70,682,728 96 0.9758 This study
Cycliophora
Symbion Symbion pandora Sanger 4,704 52 0.9758 NCBI Trace Archive 4-Oct-09
Nemertea
Carinoma Carinoma mutabilis Sanger 3,168 44 0.984 NCBI Trace Archive 24-Oct-09
Cephalothrix Cephalothrix linearis Illumina ~23,100,000 98 0.9849 This study
Cerebratulus Cerebratulus lacteus Sanger 6,144 49 0.9851 NCBI Trace Archive 21-Oct-09
Malacobdella Malacobdella grossa Illumina 30,538,858 117 0.9853 This study
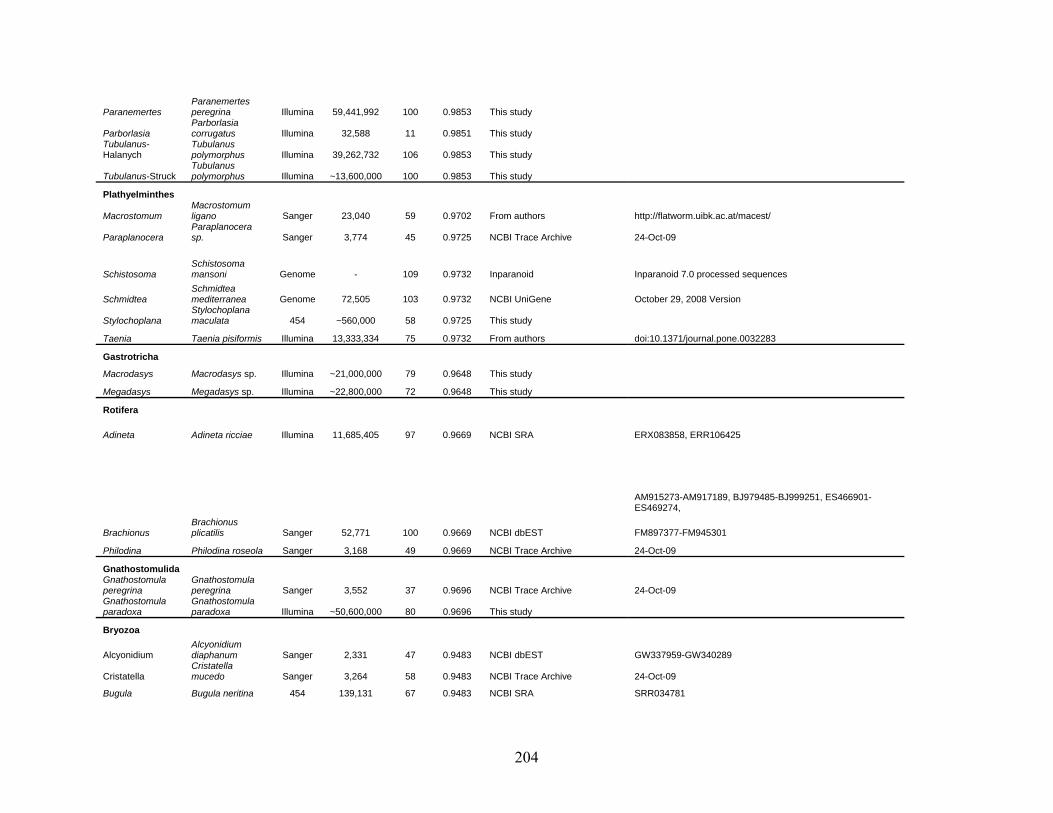
204
Paranemertes Paranemertes peregrina Illumina 59,441,992 100 0.9853 This study
Parborlasia Parborlasia corrugatus Illumina 32,588 11 0.9851 This study
Tubulanus-Halanych
Tubulanus polymorphus Illumina 39,262,732 106 0.9853 This study
Tubulanus-Struck Tubulanus polymorphus Illumina ~13,600,000 100 0.9853 This study
Plathyelminthes
Macrostomum Macrostomum ligano Sanger 23,040 59 0.9702 From authors http://flatworm.uibk.ac.at/macest/
Paraplanocera Paraplanocera sp. Sanger 3,774 45 0.9725 NCBI Trace Archive 24-Oct-09
Schistosoma Schistosoma mansoni Genome - 109 0.9732 Inparanoid Inparanoid 7.0 processed sequences
Schmidtea Schmidtea mediterranea Genome 72,505 103 0.9732 NCBI UniGene October 29, 2008 Version
Stylochoplana Stylochoplana maculata 454 ~560,000 58 0.9725 This study
Taenia Taenia pisiformis Illumina 13,333,334 75 0.9732 From authors doi:10.1371/journal.pone.0032283
Gastrotricha
Macrodasys Macrodasys sp. Illumina ~21,000,000 79 0.9648 This study
Megadasys Megadasys sp. Illumina ~22,800,000 72 0.9648 This study
Rotifera
Adineta Adineta ricciae Illumina 11,685,405 97 0.9669 NCBI SRA ERX083858, ERR106425
AM915273-AM917189, BJ979485-BJ999251, ES466901-ES469274,
Brachionus Brachionus plicatilis Sanger 52,771 100 0.9669 NCBI dbEST FM897377-FM945301
Philodina Philodina roseola Sanger 3,168 49 0.9669 NCBI Trace Archive 24-Oct-09
Gnathostomulida Gnathostomula peregrina
Gnathostomula peregrina Sanger 3,552 37 0.9696 NCBI Trace Archive 24-Oct-09
Gnathostomula paradoxa
Gnathostomula paradoxa Illumina ~50,600,000 80 0.9696 This study
Bryozoa
Alcyonidium Alcyonidium diaphanum Sanger 2,331 47 0.9483 NCBI dbEST GW337959-GW340289
Cristatella Cristatella mucedo Sanger 3,264 58 0.9483 NCBI Trace Archive 24-Oct-09
Bugula Bugula neritina 454 139,131 67 0.9483 NCBI SRA SRR034781
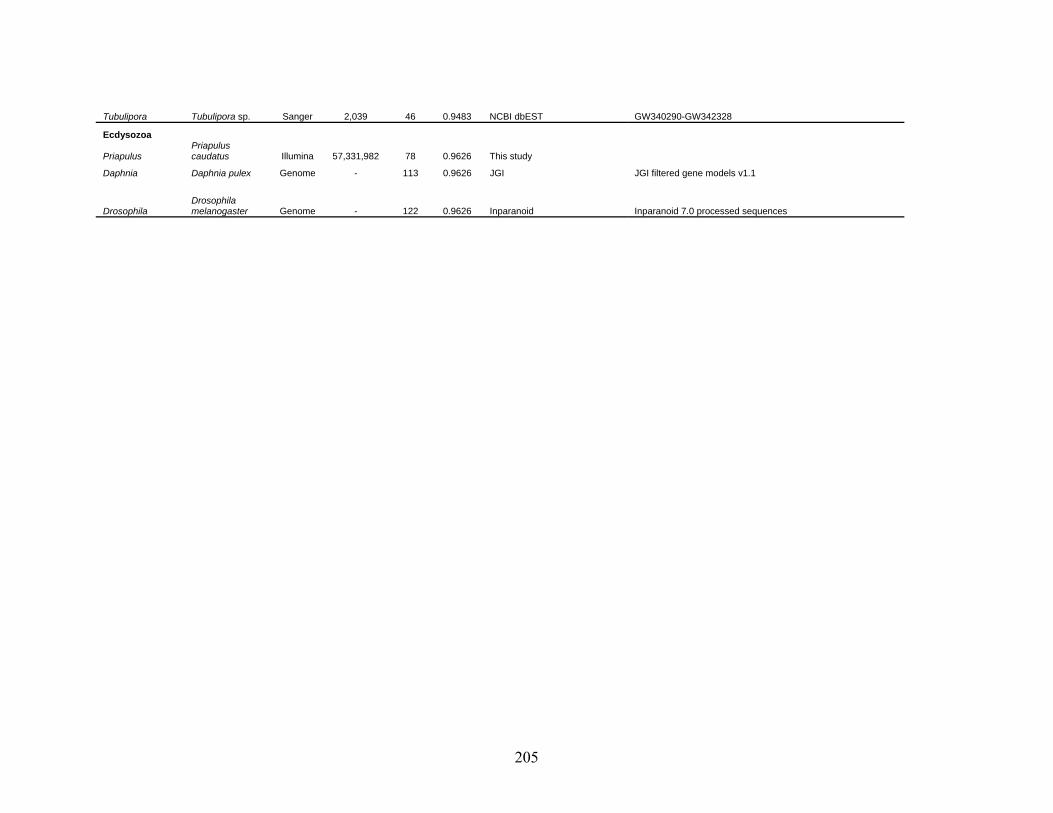
205
Tubulipora Tubulipora sp. Sanger 2,039 46 0.9483 NCBI dbEST GW340290-GW342328
Ecdysozoa
Priapulus Priapulus caudatus Illumina 57,331,982 78 0.9626 This study
Daphnia Daphnia pulex Genome - 113 0.9626 JGI JGI filtered gene models v1.1
Drosophila Drosophila melanogaster Genome - 122 0.9626 Inparanoid Inparanoid 7.0 processed sequences
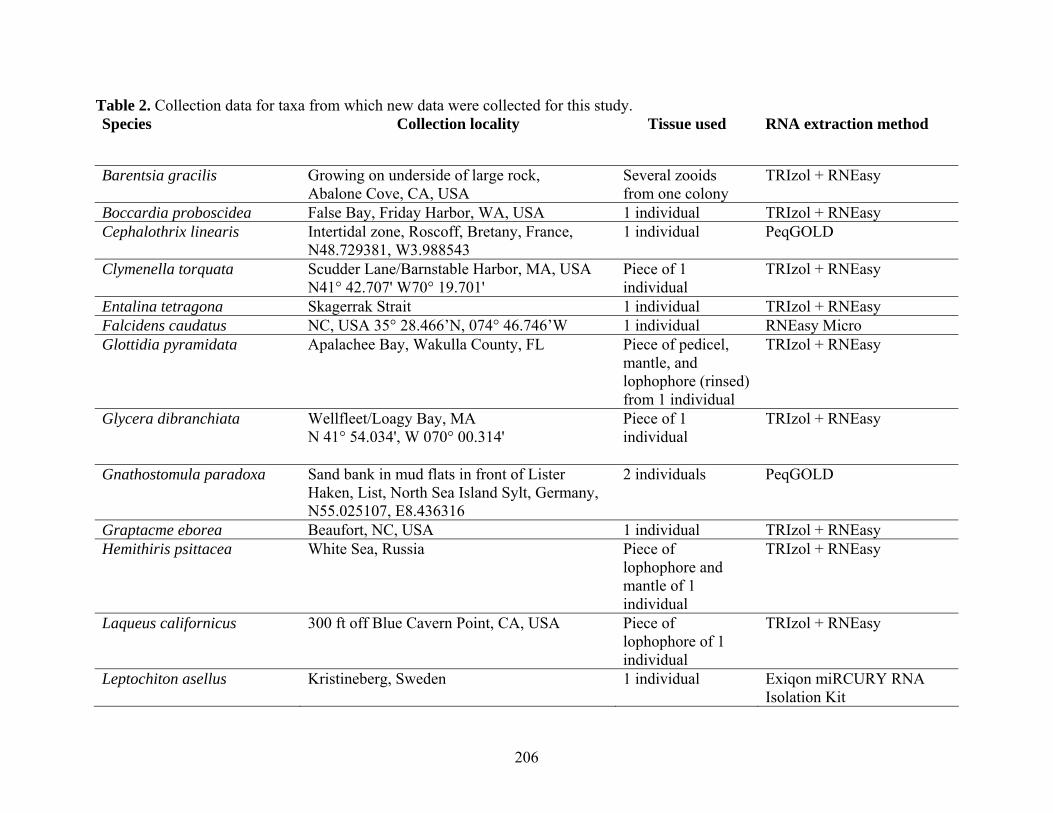
206
Table 2. Collection data for taxa from which new data were collected for this study. Species Collection locality Tissue used RNA extraction method
Barentsia gracilis Growing on underside of large rock, Abalone Cove, CA, USA
Several zooids from one colony
TRIzol + RNEasy
Boccardia proboscidea False Bay, Friday Harbor, WA, USA 1 individual TRIzol + RNEasy Cephalothrix linearis Intertidal zone, Roscoff, Bretany, France,
N48.729381, W3.988543 1 individual PeqGOLD
Clymenella torquata Scudder Lane/Barnstable Harbor, MA, USA N41° 42.707' W70° 19.701'
Piece of 1 individual
TRIzol + RNEasy
Entalina tetragona Skagerrak Strait 1 individual TRIzol + RNEasy Falcidens caudatus NC, USA 35° 28.466’N, 074° 46.746’W 1 individual RNEasy Micro Glottidia pyramidata Apalachee Bay, Wakulla County, FL
Piece of pedicel, mantle, and lophophore (rinsed) from 1 individual
TRIzol + RNEasy
Glycera dibranchiata Wellfleet/Loagy Bay, MA N 41° 54.034', W 070° 00.314'
Piece of 1 individual
TRIzol + RNEasy
Gnathostomula paradoxa Sand bank in mud flats in front of Lister Haken, List, North Sea Island Sylt, Germany, N55.025107, E8.436316
2 individuals PeqGOLD
Graptacme eborea Beaufort, NC, USA 1 individual TRIzol + RNEasy Hemithiris psittacea White Sea, Russia Piece of
lophophore and mantle of 1 individual
TRIzol + RNEasy
Laqueus californicus 300 ft off Blue Cavern Point, CA, USA Piece of lophophore of 1 individual
TRIzol + RNEasy
Leptochiton asellus Kristineberg, Sweden
1 individual Exiqon miRCURY RNA Isolation Kit
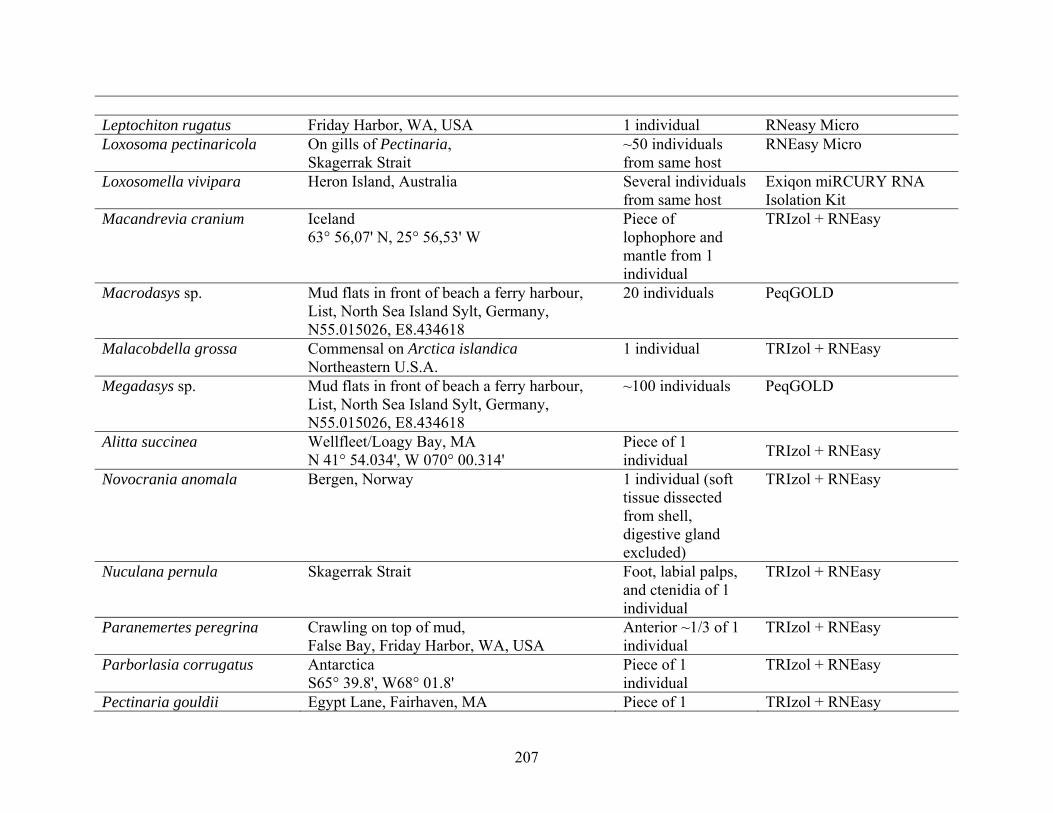
207
Leptochiton rugatus Friday Harbor, WA, USA 1 individual RNeasy Micro Loxosoma pectinaricola On gills of Pectinaria,
Skagerrak Strait ~50 individuals from same host
RNEasy Micro
Loxosomella vivipara Heron Island, Australia
Several individuals from same host
Exiqon miRCURY RNA Isolation Kit
Macandrevia cranium Iceland 63° 56,07' N, 25° 56,53' W
Piece of lophophore and mantle from 1 individual
TRIzol + RNEasy
Macrodasys sp. Mud flats in front of beach a ferry harbour, List, North Sea Island Sylt, Germany, N55.015026, E8.434618
20 individuals PeqGOLD
Malacobdella grossa Commensal on Arctica islandica Northeastern U.S.A.
1 individual TRIzol + RNEasy
Megadasys sp. Mud flats in front of beach a ferry harbour, List, North Sea Island Sylt, Germany, N55.015026, E8.434618
~100 individuals PeqGOLD
Alitta succinea Wellfleet/Loagy Bay, MA N 41° 54.034', W 070° 00.314'
Piece of 1 individual
TRIzol + RNEasy
Novocrania anomala Bergen, Norway 1 individual (soft tissue dissected from shell, digestive gland excluded)
TRIzol + RNEasy
Nuculana pernula Skagerrak Strait Foot, labial palps, and ctenidia of 1 individual
TRIzol + RNEasy
Paranemertes peregrina Crawling on top of mud, False Bay, Friday Harbor, WA, USA
Anterior ~1/3 of 1 individual
TRIzol + RNEasy
Parborlasia corrugatus Antarctica S65° 39.8', W68° 01.8'
Piece of 1 individual
TRIzol + RNEasy
Pectinaria gouldii Egypt Lane, Fairhaven, MA Piece of 1 TRIzol + RNEasy
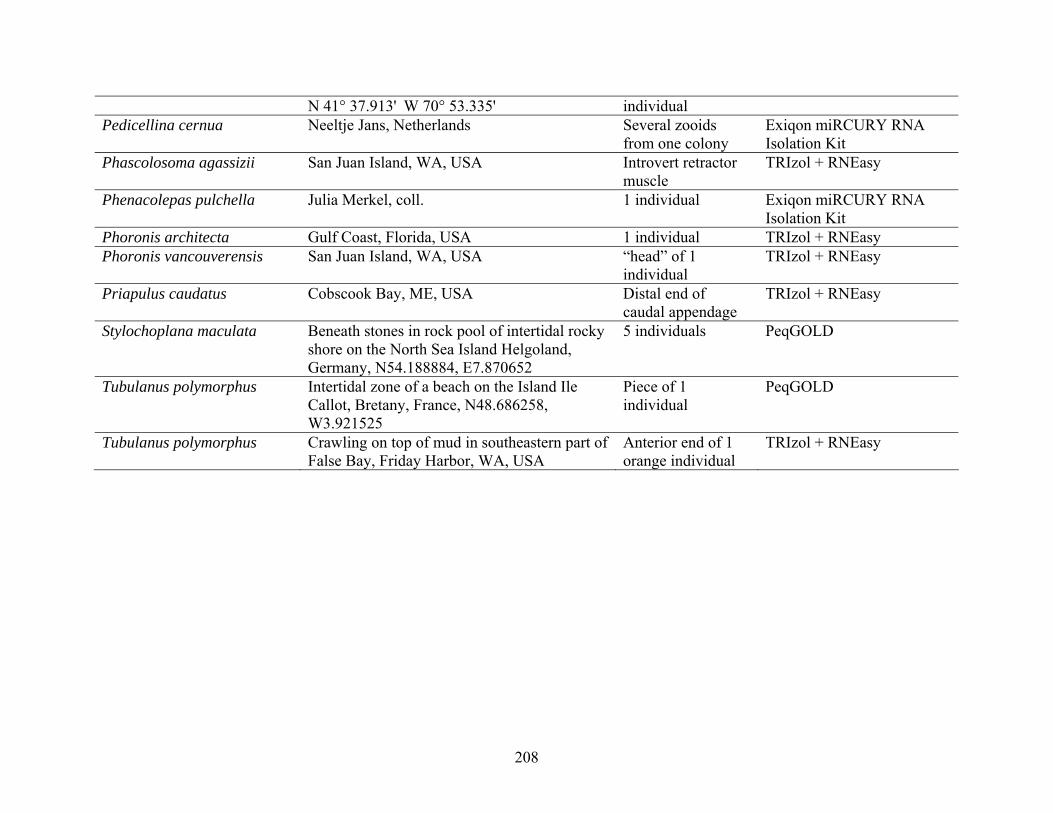
208
N 41° 37.913' W 70° 53.335' individual Pedicellina cernua Neeltje Jans, Netherlands
Several zooids from one colony
Exiqon miRCURY RNA Isolation Kit
Phascolosoma agassizii San Juan Island, WA, USA Introvert retractor muscle
TRIzol + RNEasy
Phenacolepas pulchella Julia Merkel, coll. 1 individual Exiqon miRCURY RNA Isolation Kit
Phoronis architecta Gulf Coast, Florida, USA 1 individual TRIzol + RNEasy Phoronis vancouverensis San Juan Island, WA, USA “head” of 1
individual TRIzol + RNEasy
Priapulus caudatus Cobscook Bay, ME, USA Distal end of caudal appendage
TRIzol + RNEasy
Stylochoplana maculata Beneath stones in rock pool of intertidal rocky shore on the North Sea Island Helgoland, Germany, N54.188884, E7.870652
5 individuals PeqGOLD
Tubulanus polymorphus Intertidal zone of a beach on the Island Ile Callot, Bretany, France, N48.686258, W3.921525
Piece of 1 individual
PeqGOLD
Tubulanus polymorphus Crawling on top of mud in southeastern part of False Bay, Friday Harbor, WA, USA
Anterior end of 1 orange individual
TRIzol + RNEasy
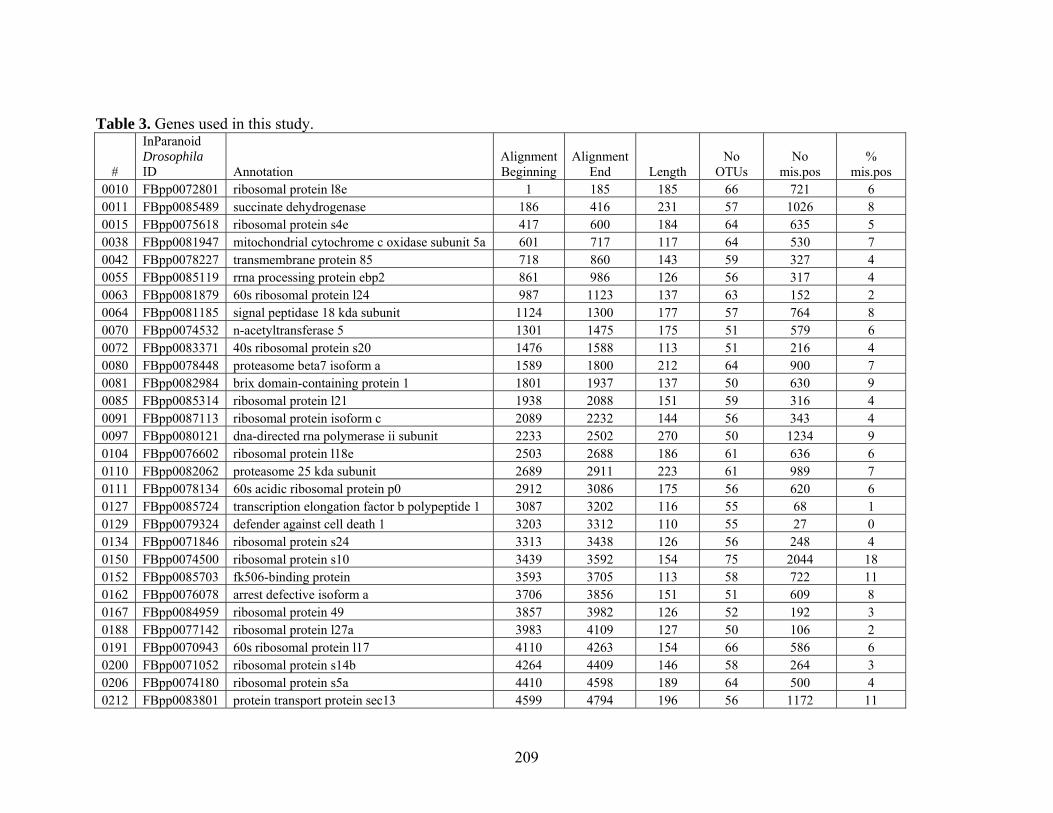
209
Table 3. Genes used in this study.
#
InParanoid Drosophila ID Annotation
Alignment Beginning
Alignment End Length
No OTUs
No mis.pos
% mis.pos
0010 FBpp0072801 ribosomal protein l8e 1 185 185 66 721 6 0011 FBpp0085489 succinate dehydrogenase 186 416 231 57 1026 8 0015 FBpp0075618 ribosomal protein s4e 417 600 184 64 635 5 0038 FBpp0081947 mitochondrial cytochrome c oxidase subunit 5a 601 717 117 64 530 7 0042 FBpp0078227 transmembrane protein 85 718 860 143 59 327 4 0055 FBpp0085119 rrna processing protein ebp2 861 986 126 56 317 4 0063 FBpp0081879 60s ribosomal protein l24 987 1123 137 63 152 2 0064 FBpp0081185 signal peptidase 18 kda subunit 1124 1300 177 57 764 8 0070 FBpp0074532 n-acetyltransferase 5 1301 1475 175 51 579 6 0072 FBpp0083371 40s ribosomal protein s20 1476 1588 113 51 216 4 0080 FBpp0078448 proteasome beta7 isoform a 1589 1800 212 64 900 7 0081 FBpp0082984 brix domain-containing protein 1 1801 1937 137 50 630 9 0085 FBpp0085314 ribosomal protein l21 1938 2088 151 59 316 4 0091 FBpp0087113 ribosomal protein isoform c 2089 2232 144 56 343 4 0097 FBpp0080121 dna-directed rna polymerase ii subunit 2233 2502 270 50 1234 9 0104 FBpp0076602 ribosomal protein l18e 2503 2688 186 61 636 6 0110 FBpp0082062 proteasome 25 kda subunit 2689 2911 223 61 989 7 0111 FBpp0078134 60s acidic ribosomal protein p0 2912 3086 175 56 620 6 0127 FBpp0085724 transcription elongation factor b polypeptide 1 3087 3202 116 55 68 1 0129 FBpp0079324 defender against cell death 1 3203 3312 110 55 27 0 0134 FBpp0071846 ribosomal protein s24 3313 3438 126 56 248 4 0150 FBpp0074500 ribosomal protein s10 3439 3592 154 75 2044 18 0152 FBpp0085703 fk506-binding protein 3593 3705 113 58 722 11 0162 FBpp0076078 arrest defective isoform a 3706 3856 151 51 609 8 0167 FBpp0084959 ribosomal protein 49 3857 3982 126 52 192 3 0188 FBpp0077142 ribosomal protein l27a 3983 4109 127 50 106 2 0191 FBpp0070943 60s ribosomal protein l17 4110 4263 154 66 586 6 0200 FBpp0071052 ribosomal protein s14b 4264 4409 146 58 264 3 0206 FBpp0074180 ribosomal protein s5a 4410 4598 189 64 500 4 0212 FBpp0083801 protein transport protein sec13 4599 4794 196 56 1172 11
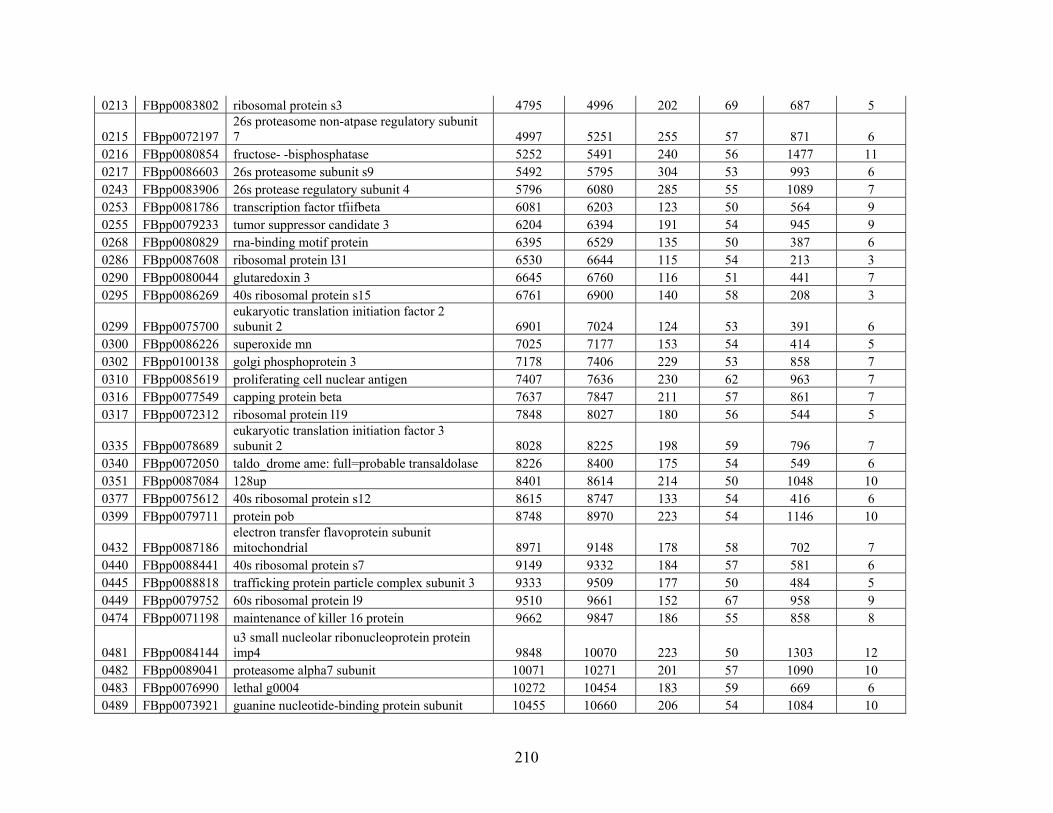
210
0213 FBpp0083802 ribosomal protein s3 4795 4996 202 69 687 5
0215 FBpp0072197 26s proteasome non-atpase regulatory subunit 7 4997 5251 255 57 871 6
0216 FBpp0080854 fructose- -bisphosphatase 5252 5491 240 56 1477 11 0217 FBpp0086603 26s proteasome subunit s9 5492 5795 304 53 993 6 0243 FBpp0083906 26s protease regulatory subunit 4 5796 6080 285 55 1089 7 0253 FBpp0081786 transcription factor tfiifbeta 6081 6203 123 50 564 9 0255 FBpp0079233 tumor suppressor candidate 3 6204 6394 191 54 945 9 0268 FBpp0080829 rna-binding motif protein 6395 6529 135 50 387 6 0286 FBpp0087608 ribosomal protein l31 6530 6644 115 54 213 3 0290 FBpp0080044 glutaredoxin 3 6645 6760 116 51 441 7 0295 FBpp0086269 40s ribosomal protein s15 6761 6900 140 58 208 3
0299 FBpp0075700 eukaryotic translation initiation factor 2 subunit 2 6901 7024 124 53 391 6
0300 FBpp0086226 superoxide mn 7025 7177 153 54 414 5 0302 FBpp0100138 golgi phosphoprotein 3 7178 7406 229 53 858 7 0310 FBpp0085619 proliferating cell nuclear antigen 7407 7636 230 62 963 7 0316 FBpp0077549 capping protein beta 7637 7847 211 57 861 7 0317 FBpp0072312 ribosomal protein l19 7848 8027 180 56 544 5
0335 FBpp0078689 eukaryotic translation initiation factor 3 subunit 2 8028 8225 198 59 796 7
0340 FBpp0072050 taldo_drome ame: full=probable transaldolase 8226 8400 175 54 549 6 0351 FBpp0087084 128up 8401 8614 214 50 1048 10 0377 FBpp0075612 40s ribosomal protein s12 8615 8747 133 54 416 6 0399 FBpp0079711 protein pob 8748 8970 223 54 1146 10
0432 FBpp0087186 electron transfer flavoprotein subunit mitochondrial 8971 9148 178 58 702 7
0440 FBpp0088441 40s ribosomal protein s7 9149 9332 184 57 581 6 0445 FBpp0088818 trafficking protein particle complex subunit 3 9333 9509 177 50 484 5 0449 FBpp0079752 60s ribosomal protein l9 9510 9661 152 67 958 9 0474 FBpp0071198 maintenance of killer 16 protein 9662 9847 186 55 858 8
0481 FBpp0084144 u3 small nucleolar ribonucleoprotein protein imp4 9848 10070 223 50 1303 12
0482 FBpp0089041 proteasome alpha7 subunit 10071 10271 201 57 1090 10 0483 FBpp0076990 lethal g0004 10272 10454 183 59 669 6 0489 FBpp0073921 guanine nucleotide-binding protein subunit 10455 10660 206 54 1084 10
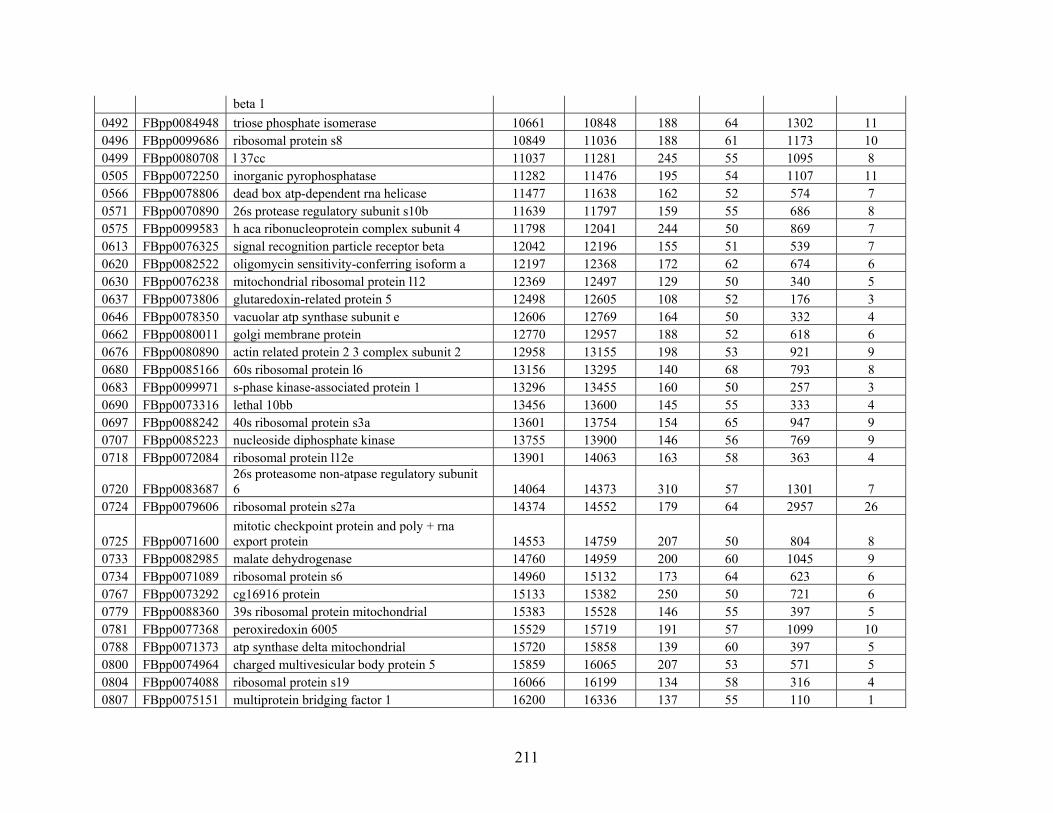
211
beta 1
0492 FBpp0084948 triose phosphate isomerase 10661 10848 188 64 1302 11 0496 FBpp0099686 ribosomal protein s8 10849 11036 188 61 1173 10 0499 FBpp0080708 l 37cc 11037 11281 245 55 1095 8 0505 FBpp0072250 inorganic pyrophosphatase 11282 11476 195 54 1107 11 0566 FBpp0078806 dead box atp-dependent rna helicase 11477 11638 162 52 574 7 0571 FBpp0070890 26s protease regulatory subunit s10b 11639 11797 159 55 686 8 0575 FBpp0099583 h aca ribonucleoprotein complex subunit 4 11798 12041 244 50 869 7 0613 FBpp0076325 signal recognition particle receptor beta 12042 12196 155 51 539 7 0620 FBpp0082522 oligomycin sensitivity-conferring isoform a 12197 12368 172 62 674 6 0630 FBpp0076238 mitochondrial ribosomal protein l12 12369 12497 129 50 340 5 0637 FBpp0073806 glutaredoxin-related protein 5 12498 12605 108 52 176 3 0646 FBpp0078350 vacuolar atp synthase subunit e 12606 12769 164 50 332 4 0662 FBpp0080011 golgi membrane protein 12770 12957 188 52 618 6 0676 FBpp0080890 actin related protein 2 3 complex subunit 2 12958 13155 198 53 921 9 0680 FBpp0085166 60s ribosomal protein l6 13156 13295 140 68 793 8 0683 FBpp0099971 s-phase kinase-associated protein 1 13296 13455 160 50 257 3 0690 FBpp0073316 lethal 10bb 13456 13600 145 55 333 4 0697 FBpp0088242 40s ribosomal protein s3a 13601 13754 154 65 947 9 0707 FBpp0085223 nucleoside diphosphate kinase 13755 13900 146 56 769 9 0718 FBpp0072084 ribosomal protein l12e 13901 14063 163 58 363 4
0720 FBpp0083687 26s proteasome non-atpase regulatory subunit 6 14064 14373 310 57 1301 7
0724 FBpp0079606 ribosomal protein s27a 14374 14552 179 64 2957 26
0725 FBpp0071600 mitotic checkpoint protein and poly + rna export protein 14553 14759 207 50 804 8
0733 FBpp0082985 malate dehydrogenase 14760 14959 200 60 1045 9 0734 FBpp0071089 ribosomal protein s6 14960 15132 173 64 623 6 0767 FBpp0073292 cg16916 protein 15133 15382 250 50 721 6 0779 FBpp0088360 39s ribosomal protein mitochondrial 15383 15528 146 55 397 5 0781 FBpp0077368 peroxiredoxin 6005 15529 15719 191 57 1099 10 0788 FBpp0071373 atp synthase delta mitochondrial 15720 15858 139 60 397 5 0800 FBpp0074964 charged multivesicular body protein 5 15859 16065 207 53 571 5 0804 FBpp0074088 ribosomal protein s19 16066 16199 134 58 316 4 0807 FBpp0075151 multiprotein bridging factor 1 16200 16336 137 55 110 1
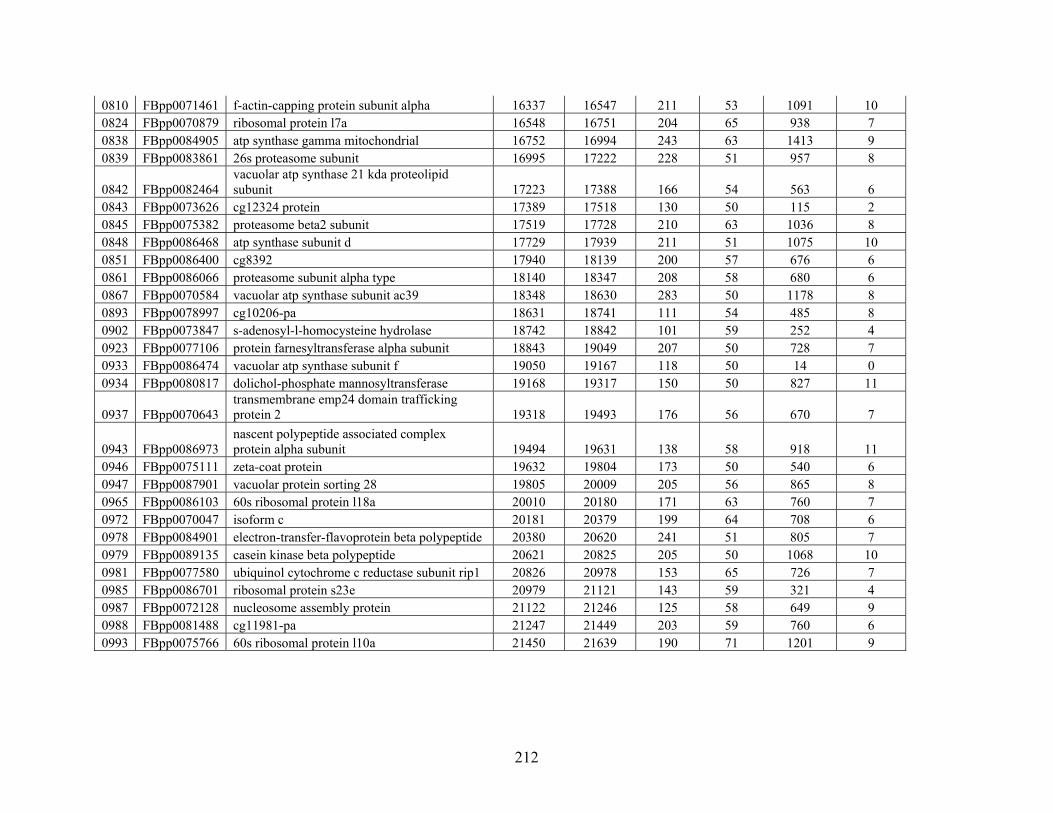
212
0810 FBpp0071461 f-actin-capping protein subunit alpha 16337 16547 211 53 1091 10 0824 FBpp0070879 ribosomal protein l7a 16548 16751 204 65 938 7 0838 FBpp0084905 atp synthase gamma mitochondrial 16752 16994 243 63 1413 9 0839 FBpp0083861 26s proteasome subunit 16995 17222 228 51 957 8
0842 FBpp0082464 vacuolar atp synthase 21 kda proteolipid subunit 17223 17388 166 54 563 6
0843 FBpp0073626 cg12324 protein 17389 17518 130 50 115 2 0845 FBpp0075382 proteasome beta2 subunit 17519 17728 210 63 1036 8 0848 FBpp0086468 atp synthase subunit d 17729 17939 211 51 1075 10 0851 FBpp0086400 cg8392 17940 18139 200 57 676 6 0861 FBpp0086066 proteasome subunit alpha type 18140 18347 208 58 680 6 0867 FBpp0070584 vacuolar atp synthase subunit ac39 18348 18630 283 50 1178 8 0893 FBpp0078997 cg10206-pa 18631 18741 111 54 485 8 0902 FBpp0073847 s-adenosyl-l-homocysteine hydrolase 18742 18842 101 59 252 4 0923 FBpp0077106 protein farnesyltransferase alpha subunit 18843 19049 207 50 728 7 0933 FBpp0086474 vacuolar atp synthase subunit f 19050 19167 118 50 14 0 0934 FBpp0080817 dolichol-phosphate mannosyltransferase 19168 19317 150 50 827 11
0937 FBpp0070643 transmembrane emp24 domain trafficking protein 2 19318 19493 176 56 670 7
0943 FBpp0086973 nascent polypeptide associated complex protein alpha subunit 19494 19631 138 58 918 11
0946 FBpp0075111 zeta-coat protein 19632 19804 173 50 540 6 0947 FBpp0087901 vacuolar protein sorting 28 19805 20009 205 56 865 8 0965 FBpp0086103 60s ribosomal protein l18a 20010 20180 171 63 760 7 0972 FBpp0070047 isoform c 20181 20379 199 64 708 6 0978 FBpp0084901 electron-transfer-flavoprotein beta polypeptide 20380 20620 241 51 805 7 0979 FBpp0089135 casein kinase beta polypeptide 20621 20825 205 50 1068 10 0981 FBpp0077580 ubiquinol cytochrome c reductase subunit rip1 20826 20978 153 65 726 7 0985 FBpp0086701 ribosomal protein s23e 20979 21121 143 59 321 4 0987 FBpp0072128 nucleosome assembly protein 21122 21246 125 58 649 9 0988 FBpp0081488 cg11981-pa 21247 21449 203 59 760 6 0993 FBpp0075766 60s ribosomal protein l10a 21450 21639 190 71 1201 9
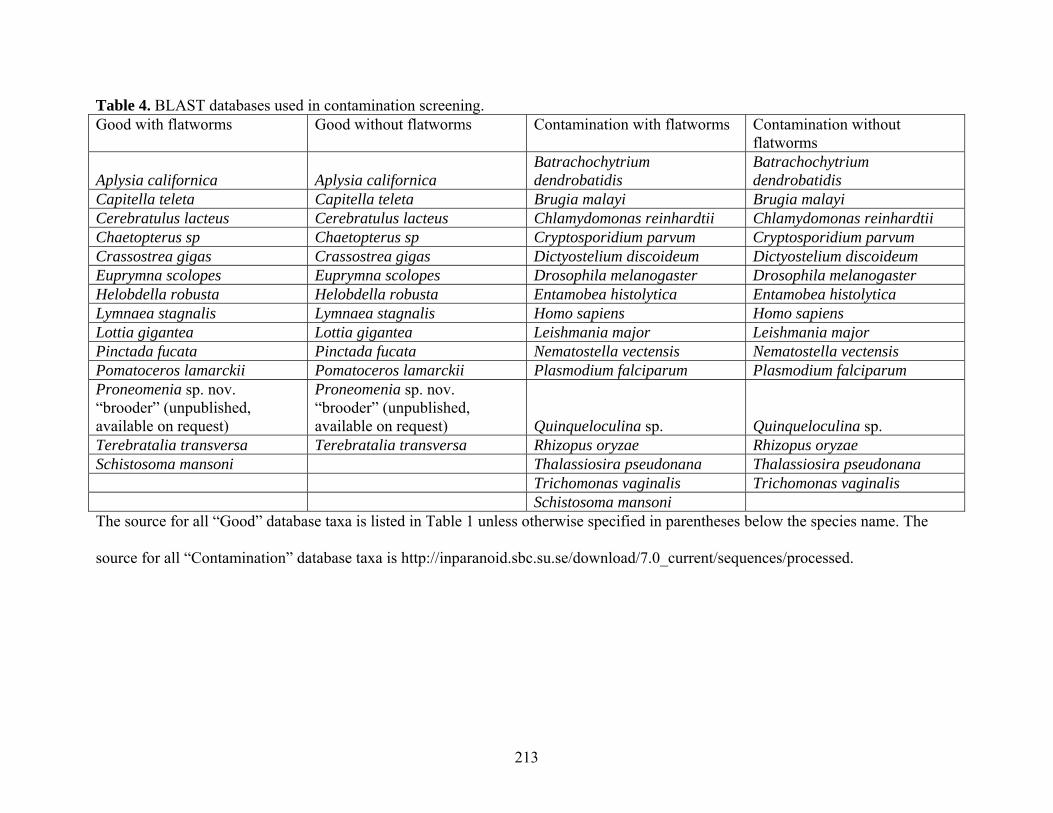
213
Table 4. BLAST databases used in contamination screening. Good with flatworms Good without flatworms Contamination with flatworms Contamination without
flatworms
Aplysia californica Aplysia californica Batrachochytrium dendrobatidis
Batrachochytrium dendrobatidis
Capitella teleta Capitella teleta Brugia malayi Brugia malayi Cerebratulus lacteus Cerebratulus lacteus Chlamydomonas reinhardtii Chlamydomonas reinhardtii Chaetopterus sp Chaetopterus sp Cryptosporidium parvum Cryptosporidium parvum Crassostrea gigas Crassostrea gigas Dictyostelium discoideum Dictyostelium discoideum Euprymna scolopes Euprymna scolopes Drosophila melanogaster Drosophila melanogaster Helobdella robusta Helobdella robusta Entamobea histolytica Entamobea histolytica Lymnaea stagnalis Lymnaea stagnalis Homo sapiens Homo sapiens Lottia gigantea Lottia gigantea Leishmania major Leishmania major Pinctada fucata Pinctada fucata Nematostella vectensis Nematostella vectensis Pomatoceros lamarckii Pomatoceros lamarckii Plasmodium falciparum Plasmodium falciparum Proneomenia sp. nov. “brooder” (unpublished, available on request)
Proneomenia sp. nov. “brooder” (unpublished, available on request) Quinqueloculina sp. Quinqueloculina sp.
Terebratalia transversa Terebratalia transversa Rhizopus oryzae Rhizopus oryzae Schistosoma mansoni Thalassiosira pseudonana Thalassiosira pseudonana Trichomonas vaginalis Trichomonas vaginalis Schistosoma mansoni The source for all “Good” database taxa is listed in Table 1 unless otherwise specified in parentheses below the species name. The
source for all “Contamination” database taxa is http://inparanoid.sbc.su.se/download/7.0_current/sequences/processed.
214
Chapter 6. Conclusions and Future Directions
6.1. Deep Molluscan Phylogeny
Recent studies (Kocot et al., 2011 (Chapter 2); Smith et al., 2011; Vinther et al., 2011)
have demonstrated that nuclear protein-coding gene sequences are extremely useful for resolving
deep molluscan phylogeny. Within Mollusca, these studies have shown that Aplacophora is a
monophyletic clade sister to Polyplacophora. Together, Aplacophora and Polyplacophora
constitute a clade called Aculifera. This result has important implications for understanding of
the early evolution of Mollusca and Lophotrochozoa as a whole (discussed below).
Within Conchifera, Cephalopoda and Gastropoda are not sister taxa as previously thought
(reviewed by Kocot, 2013). This finding will undoubtedly have important implications for
workers in the field of neurobiology who have long used gastropods and cephalopods as models
for studies of learning and memory. The presence of relatively complex nervous systems in both
euthyneuran gastropods and cephalopods suggests this condition evolved independently in both
lineages (Moroz, 2009) or (less likely) that the nervous system has been secondarily simplified
independently in basal gastropods, bivalves, and scaphopods. Instead of being closely related to
Gastropoda, Cephalopoda appears to be the sister taxon of Monoplacophora (Smith et al., 2011,
Chapter 5) although more sequence data and data from additional species would help strengthen
confidence in this somewhat surprising result.
In light of strong support for the Aculifera hypothesis (placing the aplacophorans in a
monophyletic clade sister to chitons rather than as a basal, paraphyletic grade), Kocot et al.,
(2011) performed ancestral character state reconstruction analyses in an attempt to infer the
plesiomorphic states of key characters for Mollusca. These analyses suggested that a ventral
215
muscular foot, dorsal cuticularized mantle, a mantle cavity containing ctenidia, and regionalized
gut are plesiomorphic for Mollusca. Interestingly, the fossil animal Odotogriphus omalus, which
has been hypothesized to be a stem-group mollusc, fits this description (Caron et al., 2006).
However, ancestral state reconstruction for other characters including the radula and scleritome
(shells and sclerites) was ambiguous. Phylogenomics and paleontology will undoubtedly
continue to be complimentary fields important towards understanding early animal evolutionary
history.
6.2. Phylogeny of Gastropoda and Panpulmonata
Because of the utility of phylogenomics for resolving deep molluscan evolutionary
relationships, we sought to apply this approach towards resolving a long-standing evolutionary
question within Gastropoda (Chapter 3). Sea slugs were traditionally viewed to form a
monophyletic group called Opisthobranchia but recent molecular studies have questioned this by
placing terrestrial snails and slugs (Pulmonata) within this group (reviewed by Wägele et al.,
2008). However, the exact placement of pulmonates has been variable among studies and even
pulmonate monophyly has been questioned. We analyzed available gastropod transcriptome data
and found strong support for placement of Pulmonata within “Opisthobranchia” as previously
hypothesized. Of significance, Pulmonata was placed sister to Sacoglossa, a clade of sea slugs
that feed on red and green algae and sometimes “steal” and retain functional chloroplasts. This
clade, Panpulmonata, has been hypothesized before on the basis of a combination of pulmonate
and sacoglossan characters found in the basal pulmonate Siphonaria and sacoglossans. Most
notably, Siphonaria has a one-sided plicate gill (like that of sacoglossans) but it is housed in a
“lung” similar to that of pulmonates.
216
The results of this study are of importance because they provide insight into the origin of
Pulmonata, a highly successful group of terrestrial and freshwater snails and slugs. The position
of Siphonarioidea at the base of the pulmonate radiation suggests the lung of terrestrial
pulmonates evolved from the pallial cavity in an intertidal ancestor that possessed a sacoglossan-
like gill (Ruthensteiner, 1997). After the divergence of Siphonarioidea, the gill was lost and a
contractile pneumostome evolved in the ancestor of modern pulmonates, facilitating their
successful colonization of diverse non-marine habitats. Further evidence of a marine origin for
Pulmonata is the ubiquity of planktotrophic (feeding) veliger larvae in all intertidal, estuarine or
mangrove-affiliated pulmonate lineages, including Siphonarioidea (Chambers and McQuaid,
1994).
6.3. Phylogeny of Aplacophora
Given the success of the phylogenomic approach for resolving relationships within
Gastropoda, we sought to employ this approach to address the phylogeny of Aplacophora
(Chapter 4). Importantly, understanding aplacophoran phylogeny could shed light on the
plesiomorphic conditions of several key molluscan characters, including the radula and
scleritome (sclerites and shells) which were ambiguous in the reconstructions of Kocot et al.
(2011). Earlier attempts to sequence nuclear ribosomal RNA genes from aplacophorans faced
problems with prey contamination (Okusu and Giribet, 2003; Meyer et al., 2010). We avoided
this issue by sequencing transcriptomes from starved animals (when possible) and employing a
contamination screening step. Although our taxon sampling was necessarily restricted by
specimen availability and the cost of transcriptome sequencing, we were able to sample key taxa
broadly spanning the morphological diversity of the group.
217
Our strongly supported results were very different from morphology-based
reconstructions of aplacophoran phylogeny (Salvini-Plawen, 2003). “Cavibelonia” (a
traditionally recognized aplacophoran order whose members usually have a thick cuticle and
have hollow, needle-like sclerites) was recovered polyphyletic with members of
“Aplotegmentaria” (order whose members have a thin cuticle and solid sclerites) nested within it.
This topology suggests a complex evolutionary history with multiple instances of convergent
evolution and/or loss of these characters. Unfortunately, given our topology, the plesiomorphic
states of most aplacophoran characters as well as the molluscan radula and scleritome could not
be inferred. Incidentally, the results of Kocot et al. (2011) suggested that aplacophorans arose
from a broad-footed ancestor and secondarily reduced (Neomeniomorpha) or lost
(Chaetodermomorpha) their foot. Consistent with this hypothesis, we recovered one of the few
relatively broad-footed neomenioids basal within Neomeniomorpha.
6.4. Phylogeny of Lophotrochozoa and the Sister Taxon of Mollusca
Chapter 5 of my dissertation addressed the phylogeny of Lophotrochozoa, with special
emphasis placed on identifying the sister taxon of Mollusca. Although our taxon sampling was
carefully designed to include all hypothesized molluscan sister taxa, our sampling enabled us to
broadly address the phylogeny of Lophotrochozoa. As in Chapter 4, a BLAST-based
contamination screening step was performed to help exclude exogenous contamination from gut
contents, parasites, and epibionts. Our analyses largely corroborated results of previous
phylogenomic studies, although there were some topological differences. Unlike most previous
studies, support for relationships among phyla were, for the most part, very strongly supported.
Perhaps most significantly, we found strong support for a clade comprised of Brachiopoda,
218
Phoronida, Nemertea, and Annelida as the sister taxon of Mollusca. This result provides an
important starting point for future studies interested in early animal evolution, especially those
addressing the plesiomorphic character states of Mollusca, Trochozoa, and even Lophotrochozoa
as a whole. Interestingly within this clade, nemerteans were placed sister to Annelida rather than
Brachiopoda+Phoronida as was the case in several previous studies (e.g., Dunn et al., 2008).
Potentially significant characters shared by annelids and nemerteans including coelomocytes and
serially repeated gonads.
Additional plans for this research include conducting more analyses to examine the
effects of using more or fewer genes, using different classes of genes (e.g., ribosomal genes
versus non-ribosomal genes), increasing or decreasing the amount of missing data, and excluding
long-branch and/or unstable taxa. Other ways to help strengthen our inferences include
conducting hypothesis testing to determine if alternative topologies are significantly worse than
the topology recovered in the best tree and examining the amino acid composition among taxa to
determine if taxa with deviant amino acid compositions are being artificially grouped together.
Lastly other, more specific approaches for identifying and removing contamination from
transcriptome data (T. H. Struck, unpublished) may help improve our efficiency at detecting and
removing contamination and reduce unnecessary deletion of authentic transcripts.
6.5. Future Directions
Although higher-level relationships within Mollusca are much better understood now
than they before the three most recent studies addressing the issue (Kocot et al., 2011; Smith et
al., 2011; Vinther et al., 2011), some questions remain unanswered. In particular, Scaphopoda
has proven to be a difficult group to place. Considering that deeply sequenced transcriptomes are
219
still only available from four representatives of this group, it is likely that additional data from
scaphopods as well as basal gastropods and bivalves will help improve resolution among these
three taxa (but see Chapter 5). Additionally, as few studies have examined the nervous system of
Scaphopoda (but see Wanninger and Haszprunar, 2003), work on this group could prove
interesting and important with respect to placement of Scaphooda as well as understanding the
evolution of the conchiferan nervous system.
Aplacophorans are an interesting but often overlooked group of molluscs. Despite
numerous excellent studies in relatively recent years (e.g., Okusu, 2002; Lieb and Todt, 2008;
Todt et al., 2008; Todt and Wanninger, 2010), virtually all aspects of the biology of Aplacophora
warrant further study (reviewed by Todt, 2013). For example, surprisingly few studies have
addressed aplacophoran physiology and behavior (reviewed by Todt, 2013). Also, although
aplacophorans are both common and relatively diverse, in the last twenty years, only around ten
workers have performed descriptive work on the group. Approximately 400 species are named
but many more are known and await formal description (Todt, unpublished data). Notably, the
aplacophoran fauna of many regions (e.g., Australia) has received virtually no attention.
We reconstructed the backbone of aplacophoran phylogeny by employing deeply
sequenced transcriptomes from a few representatives spanning the morphological variation
within the group. In the future, I intend to build on this work employing probe hybridization
methods to capture a large number of molecular markers from many more taxa (e.g., Lemmon et
al., 2012). Employing this method will be especially important for Aplacophora because
specimens of many important groups are available in museum collections but would not be
suitable for RNA extraction. A paleontological hypothesis has suggested that aplacophoran
sclerites are homologous to annelid and brachiopod chaetae (Conway Morris and Peel, 1995).
220
Comparative gene expression studies examining these processes are needed to test this
hypothesis. Likewise, aplacophorans may have been derived from a chiton-like ancestor (Vinther
et al., 2011), a hypothesis that is at least consistent with the fossil record. In order to evaluate this
hypothesis, I am interested in undertaking studies examining the developmental timing of
features suggested to be paedomorphic in aplacophorans relative to the adult condition of chitons
(Scheltema, 1993).
DNA sequencing technologies are rapidly decreasing in cost while simultaneously
improving in both read length and data quality. Additionally, new software has become available
to help automate the lengthy process of genome annotation and mapping. Given these tools,
molluscs and other related lophotrochozoans will undoubtedly begin to catch up with
ecdysozoans (e.g., Drosophila melanogaster and Caenorhabditis elegans) in the field of
genomics. High-quality, annotated genomes from more molluscs will undoubtedly help improve
our understanding of molluscan evolutionary relationships while allowing for detection of
phenomena such as horizontal gene transfer (e.g., Pierce et al., 2012) and partial genome
duplications. Moreover, comparative genomic studies armed with a well-resolved phylogeny of
Mollusca will provide insight into the genetics and molecular mechanisms involved in many
aspects of molluscan biology. Of course, the same argument is true for Lophotrochozoa as a
whole. Currently, genome projects are underway for several conchiferan molluscs and hopefully
Aculifera, the other major clade of Mollusca, will soon begin to receive genome-scale attention
as well.
Phylogenomics has substantially advanced our understanding of the relationships among
the major lineages of Mollusca and Lophotrochozoa and will likely continue to do so. However,
phylogenomics has been unable to answer some questions, such as placement of Scaphopoda.
221
Therefore, an independent source of molecular characters to formulate and test phylogenetic
hypotheses is desirable (Rokas and Holland, 2000). As more mollusc genomes become available,
other sources of molecular characters will hopefully be identified. Rare genomic changes, such
as indels, retrotransposon integrations, signature sequences, gene order differences, gene/genome
duplications, and codon code differences are one such source of molecular characters. Likewise,
non-coding ultraconserved genomic elements (UCEs) provide another source of genomic data
useful for phylogeny reconstruction (Faircloth et al., 2012). Studies of rare genomic changes and
UCEs will likely be important in continuing to resolve and validate our current understanding of
lophotrochozoan phylogeny in the future.
Although we don’t have complete genomes yet, in the course of my dissertation research,
my collaborators and I have generated a large amount of transcriptome for several molluscs and
other lophotrochozoans. These data are a proverbial goldmine waiting to be tapped for a plethora
of additional studies. For example, molluscs have been used as models for the study of learning
and memory. A number of elegant studies have demonstrated the function of gene products (e.g.,
neuropeptides) in models such as the sea slugs Aplysia and Tritona (reviewed by Moroz, 2009),
but few studies have taken a comparative or phylogenetic approach to identify and characterize
these transcripts and study their evolution in other molluscs or other phyla. More broadly, the
evolution of the vast majority of gene families have received little to no attention in
lophotrochozoans. A comparative genomic approach tracing the evolution of gene families
related to particular processes could prove extremely interesting. Aside from genes related to
learning and memory (mentioned above), interesting examples include genes involved in overall
body patterning, vision/light detection, production of chemical defences and venom, and
reproduction.
222
In particular, the process of biomineralization is an interesting and important aspect of
molluscan biology both to the molluscs (i.e., for protection) and to humans (i.e., for pearls and
mollusc fisheries facing ocean acidification; Rudd et al., 2013). Biomineralization has received
attention in conchiferan molluscs such as Haliotis (Gastropoda) and Pinctada (Bivalvia) (e.g.,
Werner et al.; Jackson et al., 2006, 2010; Gardner et al., 2011) but no studies have examined the
process from either a genomic or functional perspective in aculiferan molluscs. Preliminary
BLAST screenings have recovered genes associated with biomineralization in many of our
transcriptomes. In my postdoctoral work, I intend to address this issue by conducting
comparative genomic and phylogenetic studies of molluscan biomineralization genes coupled
with gene expression and proteomic studies aimed at improving understanding of
biomineralization from both genomic and evolutionary developmental points of view.
6.6. References
Caron J.B., Scheltema A., Schander C., Rudkin D., 2006. A soft-bodied mollusc with radula from the Middle Cambrian Burgess Shale. Nature. 442, 159–163.
Chambers R.J., McQuaid C.D., 1994. A review of larval development in the intertidal limpet genus Siphonaria (Gastropoda: Pulmonata). Journal of Molluscan Studies. 60, 415–423.
Faircloth B.C., McCormack J.E., Crawford N.G., Harvey M.G., Brumfield R.T., Glenn T.C., 2012. Ultraconserved Elements Anchor Thousands of Genetic Markers Spanning Multiple Evolutionary Timescales. Systematic Biology. .
Gardner L., Mills D., Wiegand A., Leavesley D., Elizur A., 2011. Spatial analysis of biomineralization associated gene expression from the mantle organ of the pearl oyster Pinctada maxima. BMC Genomics. 12, 455.
Jackson D., McDougall C., Green K., Simpson F., Wörheide G., Degnan B., 2006. A rapidly evolving secretome builds and patterns a sea shell. BMC Biology. 4, 40.
Jackson D.J., McDougall C., Woodcroft B., Moase P., Rose R.A., Kube M., Reinhardt R., Rokhsar D.S., Montagnani C., Joubert C., Piquemal D., Degnan B.M., 2010. Parallel Evolution of Nacre Building Gene Sets in Molluscs. Mol Biol Evol. 27, 591–608.
223
Kocot K.M., Cannon J.T., Todt C., Citarella M.R., Kohn A.B., Meyer A., Santos S.R., Schander C., Moroz L.L., Lieb B., Halanych K.M., 2011. Phylogenomics reveals deep molluscan relationships. Nature. 477, 452–456.
Kocot K.M., 2013. Recent advances and unanswered questions in deep molluscan phylogenetics. American Malacological Bulletin. 31, 1–14.
Lemmon A.R., Emme S.A., Lemmon E.M., 2012. Anchored Hybrid Enrichment for Massively High-Throughput Phylogenomics. Syst Biol. 61, 727–744.
Lieb B., Todt C., 2008. Hemocyanin in mollusks–a molecular survey and new data on hemocyanin genes in Solenogastres and Caudofoveata. Molecular phylogenetics and evolution. 49, 382–385.
Meyer A., Todt C., Mikkelsen N., Lieb B., 2010. Fast evolving 18S rRNA sequences from Solenogastres (Mollusca) resist standard PCR amplification and give new insights into mollusk substitution rate heterogeneity. BMC Evolutionary Biology. 10, 70.
Moroz L.L., 2009. On the Independent Origins of Complex Brains and Neurons. Brain Behav Evol. 74, 177–190.
Morris S.C., Peel J.S., 1995. Articulated Halkieriids from the Lower Cambrian of North Greenland and their Role in Early Protostome Evolution. Philosophical Transactions: Biological Sciences. 347, 305–358.
Okusu A., Giribet G., 2003. New 18S rRNA sequences from neomenioid aplacophorans and the possible origin of persistent exogenous contamination. Journal of Molluscan Studies. 69, 385.
Okusu A., 2002. Embryogenesis and development of Epimenia babai (Mollusca Neomeniomorpha). The Biological Bulletin. 203, 87–103.
Pierce S.K., Fang X., Schwartz J.A., Jiang X., Zhao W., Curtis N.E., Kocot K.M., Yang B., Wang J., 2012. Transcriptomic evidence for the expression of horizontally transferred algal nuclear genes in the photosynthetic sea slug, Elysia chlorotica. Molecular biology and evolution. 29, 1545–1556.
Rokas A., Holland P.W.H., 2000. Rare genomic changes as a tool for phylogenetics. Trends in Ecology & Evolution. 15, 454–459.
Rudd M., Jennette K., Duey B., Selman A., Seron T.J., 2013. The Effects of Increased Acidity on the Shell Integrity and Body Size of C. virginica: A Comparison of Oyster Populations in Northeast Florida. .
Ruthensteiner B., 1997. Homology of the pallial and pulmonary cavity of gastropods. Journal of Molluscan Studies. 63, 353–367.
224
Salvini-Plawen L., 2003. On the phylogenetic significance of the aplacophoran Mollusca. Iberus. 21, 67–97.
Smith S.A., Wilson N.G., Goetz F.E., Feehery C., Andrade S.C.S., Rouse G.W., Giribet G., Dunn C.W., 2011. Resolving the evolutionary relationships of molluscs with phylogenomic tools. Nature. 480, 364–367.
Todt C., B\üchinger T., Wanninger A., 2008. The nervous system of the basal mollusk Wirenia argentea (Solenogastres): a study employing immunocytochemical and 3D reconstruction techniques. Marine Biology Research. 4, 290–303.
Todt C., Wanninger A., 2010. Of tests, trochs, shells, and spicules: Development of the basal mollusk Wirenia argentea (Solenogastres) and its bearing on the evolution of trochozoan larval key features. Frontiers in Zoology. 7, .
Todt C., 2013. Aplacophoran mollusks–Still obscure and difficult? American Malacological Bulletin. 31, 1–7.
Vinther J., Sperling E.A., Briggs D.E.G., Peterson K.J., 2011. A molecular palaeobiological hypothesis for the origin of aplacophoran molluscs and their derivation from chiton-like ancestors. Proceedings of the Royal Society B: Biological Sciences. .
Wägele H., Klussmann-Kolb A., Vonnemann V., Medina M., 2008. Heterobranchia I: The Opisthobranchia., Phylogeny and Evolution of the Mollusca, University of California Press, Berkeley and Los Angeles, CA, pp. 385–408.
Wanninger A., Haszprunar G., 2003. The development of the serotonergic and FMRF-amidergic nervous system in Antalis entalis (Mollusca, Scaphopoda). Zoomorphology. 122, 77–85.
Werner G., Gemmell P., Grosser S., Hamer R., Shimeld S., Analysis of a deep transcriptome from the mantle tissue of Patella vulgata Linnaeus (Mollusca: Gastropoda: Patellidae) reveals candidate biomineralising genes. Marine Biotechnology. 1–14.
225
Appendix 1. Three new meiofaunal solenogasters (Mollusca: Aplacophora)
KEVIN M. KOCOT1 and CHRISTIANE TODT2 1Department of Biological Sciences, Auburn University, 101 Rouse Life Sciences, Auburn,
Alabama 36849, USA. [email protected]. 2University Museum of Bergen DNS, Postboks 7800 N-5020 Bergen, Norway.
Abstract
Many species of Solenogastres (Mollusca: Aplacophora) have been described from relatively
remote locations or the deep sea. However, knowledge of the diversity of this group of
carnivorous molluscs, even in relatively accessible, shallow localities remains incomplete. Here,
we describe three new species of meiofaunal solenogasters from a well-studied site virtually
right off the dock of Friday Harbor Laboratories (WA, USA). Two new species of
Macellomenia, M. schanderi and M. morseae, are described, greatly expanding the geographic
range of this genus previously only known from the Atlantic. Interestingly, M. schanderi appears
to be more similar to the Atlantic M. adenota than the co-occuring M. morseae. However, the
one specimen of M. morseae we were able to examine by histology was a juvenile, so the adult
condition of some characters (mostly dealing with the reproductive system) are unknown.
Additionally, a new species of Hypomenia, H. sanjuanensis, is described also extending the
geographic range of this previously monotypic genus known only from the Red Sea. DNA
barcode sequences are provided to aid in the identification of these species as well as the
sympatric species Meiomenia swedmarki Morse.
Key Words
Macellomenia, Hypomenia, Solenogastres, Neomeniomorpha, Friday Harbor Laboratories
Introduction
Solenogastres (=Neomeniomorpha) is a group of vermiform molluscs characterized by a body
covered with a chitinous cuticle and calcareous sclerites, a narrow ventral foot that lacks intrinsic
musculature, and a posterior mantle cavity lacking true ctenidia (Salvini-Plawen 1978, 1985,
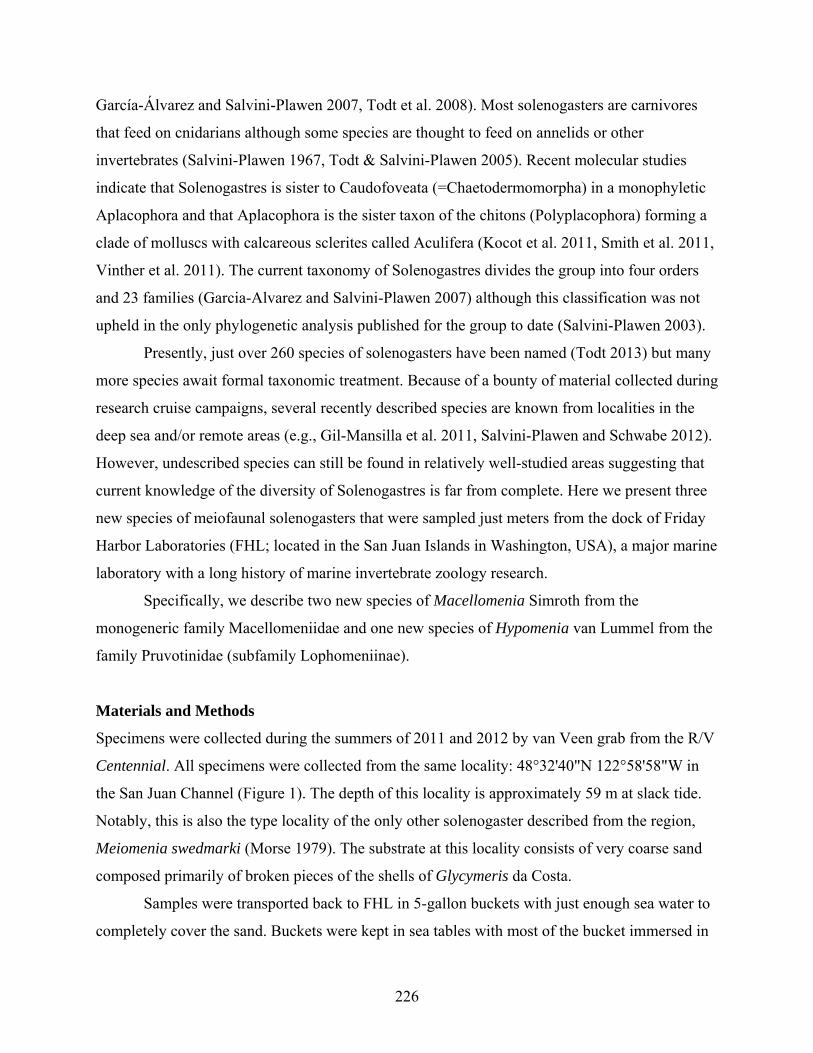
226
García-Álvarez and Salvini-Plawen 2007, Todt et al. 2008). Most solenogasters are carnivores
that feed on cnidarians although some species are thought to feed on annelids or other
invertebrates (Salvini-Plawen 1967, Todt & Salvini-Plawen 2005). Recent molecular studies
indicate that Solenogastres is sister to Caudofoveata (=Chaetodermomorpha) in a monophyletic
Aplacophora and that Aplacophora is the sister taxon of the chitons (Polyplacophora) forming a
clade of molluscs with calcareous sclerites called Aculifera (Kocot et al. 2011, Smith et al. 2011,
Vinther et al. 2011). The current taxonomy of Solenogastres divides the group into four orders
and 23 families (Garcia-Alvarez and Salvini-Plawen 2007) although this classification was not
upheld in the only phylogenetic analysis published for the group to date (Salvini-Plawen 2003).
Presently, just over 260 species of solenogasters have been named (Todt 2013) but many
more species await formal taxonomic treatment. Because of a bounty of material collected during
research cruise campaigns, several recently described species are known from localities in the
deep sea and/or remote areas (e.g., Gil-Mansilla et al. 2011, Salvini-Plawen and Schwabe 2012).
However, undescribed species can still be found in relatively well-studied areas suggesting that
current knowledge of the diversity of Solenogastres is far from complete. Here we present three
new species of meiofaunal solenogasters that were sampled just meters from the dock of Friday
Harbor Laboratories (FHL; located in the San Juan Islands in Washington, USA), a major marine
laboratory with a long history of marine invertebrate zoology research.
Specifically, we describe two new species of Macellomenia Simroth from the
monogeneric family Macellomeniidae and one new species of Hypomenia van Lummel from the
family Pruvotinidae (subfamily Lophomeniinae).
Materials and Methods
Specimens were collected during the summers of 2011 and 2012 by van Veen grab from the R/V
Centennial. All specimens were collected from the same locality: 48°32'40"N 122°58'58"W in
the San Juan Channel (Figure 1). The depth of this locality is approximately 59 m at slack tide.
Notably, this is also the type locality of the only other solenogaster described from the region,
Meiomenia swedmarki (Morse 1979). The substrate at this locality consists of very coarse sand
composed primarily of broken pieces of the shells of Glycymeris da Costa.
Samples were transported back to FHL in 5-gallon buckets with just enough sea water to
completely cover the sand. Buckets were kept in sea tables with most of the bucket immersed in
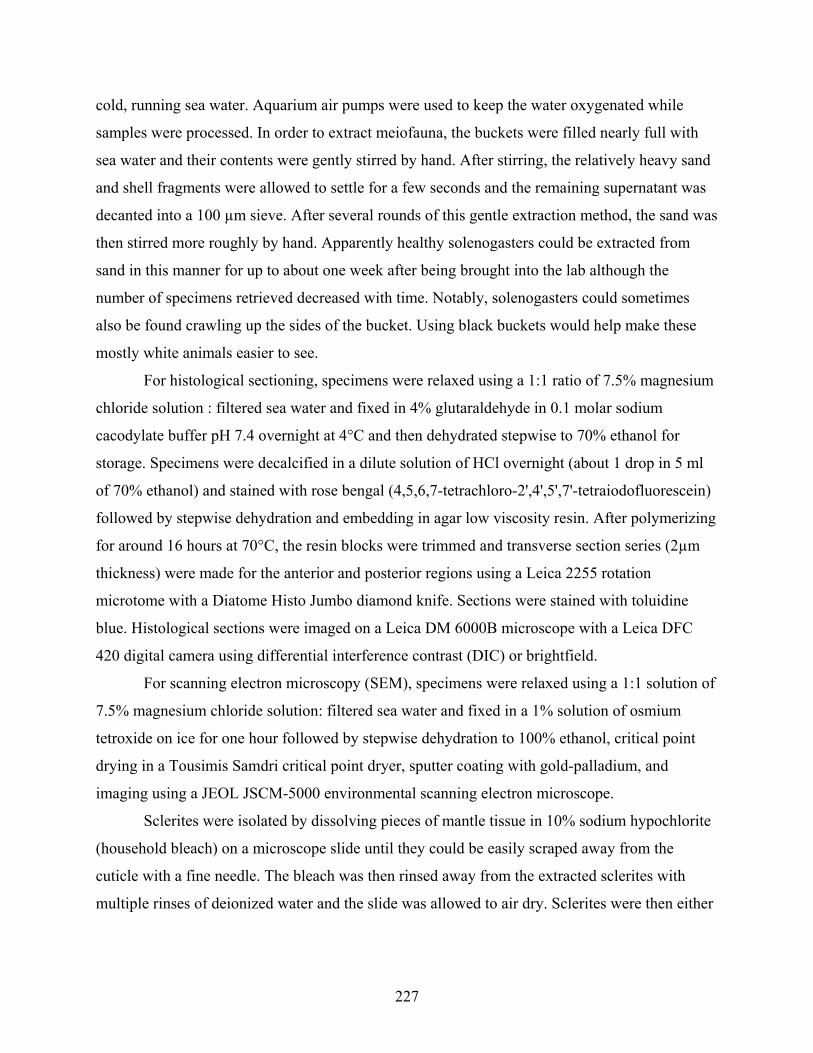
227
cold, running sea water. Aquarium air pumps were used to keep the water oxygenated while
samples were processed. In order to extract meiofauna, the buckets were filled nearly full with
sea water and their contents were gently stirred by hand. After stirring, the relatively heavy sand
and shell fragments were allowed to settle for a few seconds and the remaining supernatant was
decanted into a 100 µm sieve. After several rounds of this gentle extraction method, the sand was
then stirred more roughly by hand. Apparently healthy solenogasters could be extracted from
sand in this manner for up to about one week after being brought into the lab although the
number of specimens retrieved decreased with time. Notably, solenogasters could sometimes
also be found crawling up the sides of the bucket. Using black buckets would help make these
mostly white animals easier to see.
For histological sectioning, specimens were relaxed using a 1:1 ratio of 7.5% magnesium
chloride solution : filtered sea water and fixed in 4% glutaraldehyde in 0.1 molar sodium
cacodylate buffer pH 7.4 overnight at 4°C and then dehydrated stepwise to 70% ethanol for
storage. Specimens were decalcified in a dilute solution of HCl overnight (about 1 drop in 5 ml
of 70% ethanol) and stained with rose bengal (4,5,6,7-tetrachloro-2',4',5',7'-tetraiodofluorescein)
followed by stepwise dehydration and embedding in agar low viscosity resin. After polymerizing
for around 16 hours at 70°C, the resin blocks were trimmed and transverse section series (2µm
thickness) were made for the anterior and posterior regions using a Leica 2255 rotation
microtome with a Diatome Histo Jumbo diamond knife. Sections were stained with toluidine
blue. Histological sections were imaged on a Leica DM 6000B microscope with a Leica DFC
420 digital camera using differential interference contrast (DIC) or brightfield.
For scanning electron microscopy (SEM), specimens were relaxed using a 1:1 solution of
7.5% magnesium chloride solution: filtered sea water and fixed in a 1% solution of osmium
tetroxide on ice for one hour followed by stepwise dehydration to 100% ethanol, critical point
drying in a Tousimis Samdri critical point dryer, sputter coating with gold-palladium, and
imaging using a JEOL JSCM-5000 environmental scanning electron microscope.
Sclerites were isolated by dissolving pieces of mantle tissue in 10% sodium hypochlorite
(household bleach) on a microscope slide until they could be easily scraped away from the
cuticle with a fine needle. The bleach was then rinsed away from the extracted sclerites with
multiple rinses of deionized water and the slide was allowed to air dry. Sclerites were then either
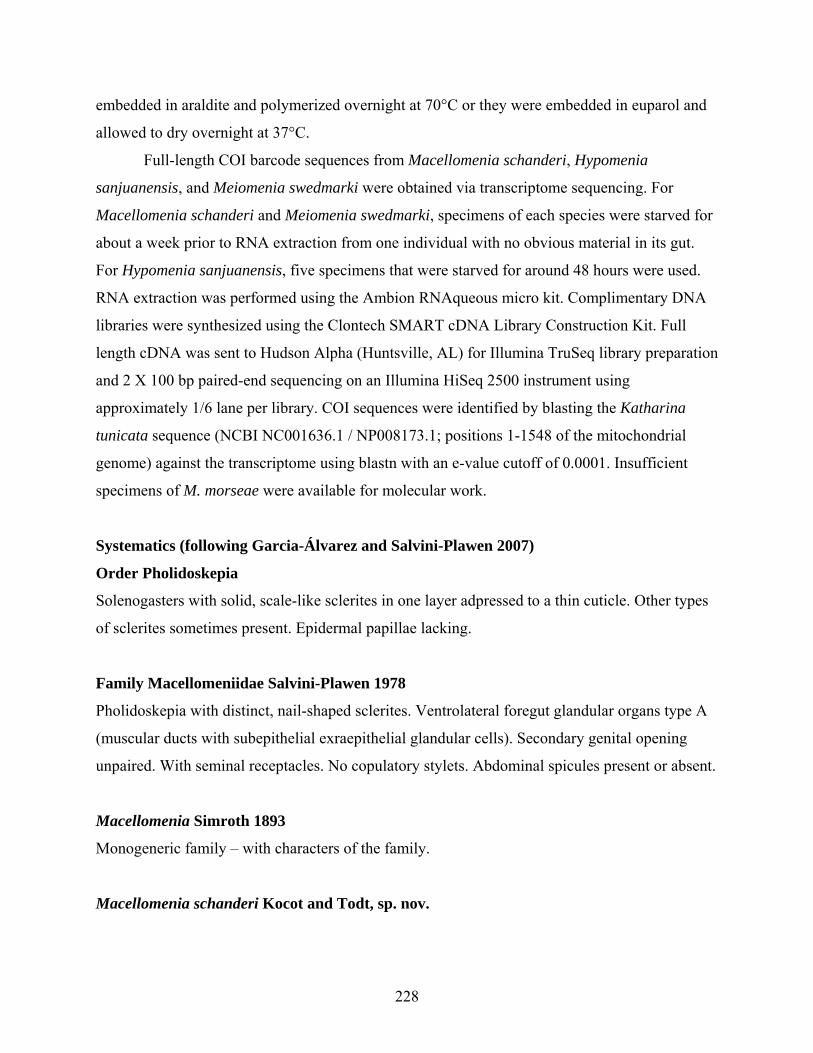
228
embedded in araldite and polymerized overnight at 70°C or they were embedded in euparol and
allowed to dry overnight at 37°C.
Full-length COI barcode sequences from Macellomenia schanderi, Hypomenia
sanjuanensis, and Meiomenia swedmarki were obtained via transcriptome sequencing. For
Macellomenia schanderi and Meiomenia swedmarki, specimens of each species were starved for
about a week prior to RNA extraction from one individual with no obvious material in its gut.
For Hypomenia sanjuanensis, five specimens that were starved for around 48 hours were used.
RNA extraction was performed using the Ambion RNAqueous micro kit. Complimentary DNA
libraries were synthesized using the Clontech SMART cDNA Library Construction Kit. Full
length cDNA was sent to Hudson Alpha (Huntsville, AL) for Illumina TruSeq library preparation
and 2 X 100 bp paired-end sequencing on an Illumina HiSeq 2500 instrument using
approximately 1/6 lane per library. COI sequences were identified by blasting the Katharina
tunicata sequence (NCBI NC001636.1 / NP008173.1; positions 1-1548 of the mitochondrial
genome) against the transcriptome using blastn with an e-value cutoff of 0.0001. Insufficient
specimens of M. morseae were available for molecular work.
Systematics (following Garcia-Álvarez and Salvini-Plawen 2007)
Order Pholidoskepia
Solenogasters with solid, scale-like sclerites in one layer adpressed to a thin cuticle. Other types
of sclerites sometimes present. Epidermal papillae lacking.
Family Macellomeniidae Salvini-Plawen 1978
Pholidoskepia with distinct, nail-shaped sclerites. Ventrolateral foregut glandular organs type A
(muscular ducts with subepithelial exraepithelial glandular cells). Secondary genital opening
unpaired. With seminal receptacles. No copulatory stylets. Abdominal spicules present or absent.
Macellomenia Simroth 1893
Monogeneric family – with characters of the family.
Macellomenia schanderi Kocot and Todt, sp. nov.
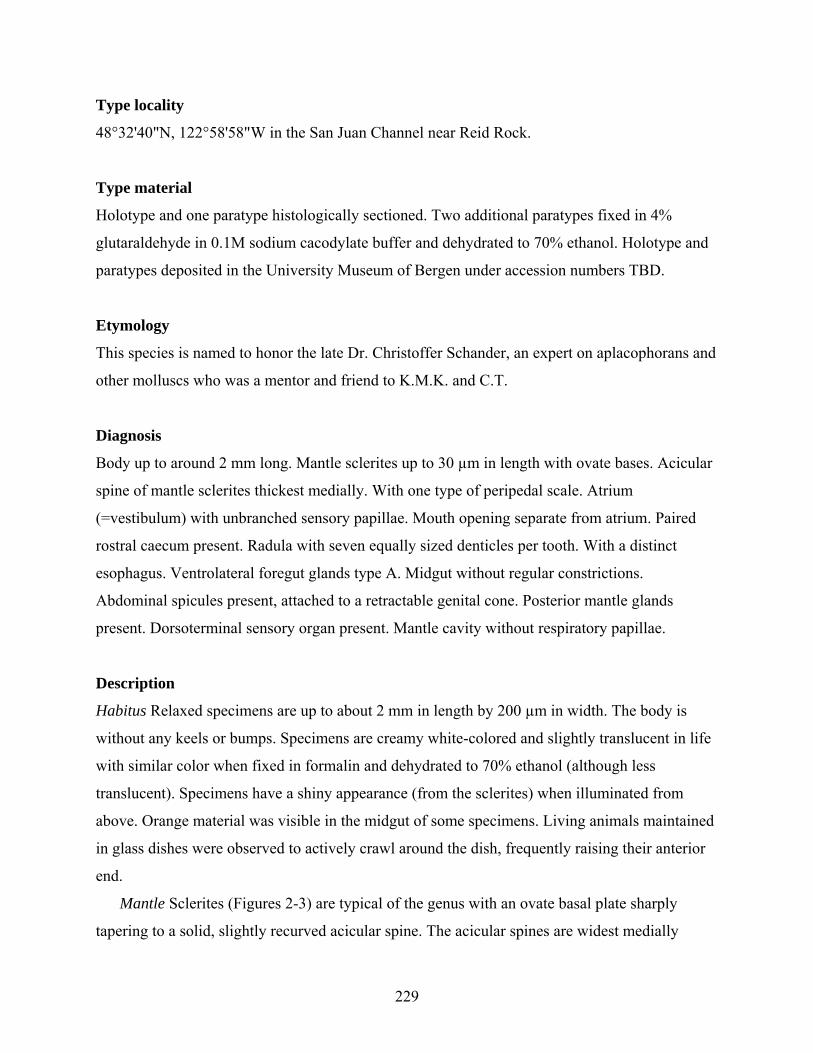
229
Type locality
48°32'40"N, 122°58'58"W in the San Juan Channel near Reid Rock.
Type material
Holotype and one paratype histologically sectioned. Two additional paratypes fixed in 4%
glutaraldehyde in 0.1M sodium cacodylate buffer and dehydrated to 70% ethanol. Holotype and
paratypes deposited in the University Museum of Bergen under accession numbers TBD.
Etymology
This species is named to honor the late Dr. Christoffer Schander, an expert on aplacophorans and
other molluscs who was a mentor and friend to K.M.K. and C.T.
Diagnosis
Body up to around 2 mm long. Mantle sclerites up to 30 µm in length with ovate bases. Acicular
spine of mantle sclerites thickest medially. With one type of peripedal scale. Atrium
(=vestibulum) with unbranched sensory papillae. Mouth opening separate from atrium. Paired
rostral caecum present. Radula with seven equally sized denticles per tooth. With a distinct
esophagus. Ventrolateral foregut glands type A. Midgut without regular constrictions.
Abdominal spicules present, attached to a retractable genital cone. Posterior mantle glands
present. Dorsoterminal sensory organ present. Mantle cavity without respiratory papillae.
Description
Habitus Relaxed specimens are up to about 2 mm in length by 200 µm in width. The body is
without any keels or bumps. Specimens are creamy white-colored and slightly translucent in life
with similar color when fixed in formalin and dehydrated to 70% ethanol (although less
translucent). Specimens have a shiny appearance (from the sclerites) when illuminated from
above. Orange material was visible in the midgut of some specimens. Living animals maintained
in glass dishes were observed to actively crawl around the dish, frequently raising their anterior
end.
Mantle Sclerites (Figures 2-3) are typical of the genus with an ovate basal plate sharply
tapering to a solid, slightly recurved acicular spine. The acicular spines are widest medially
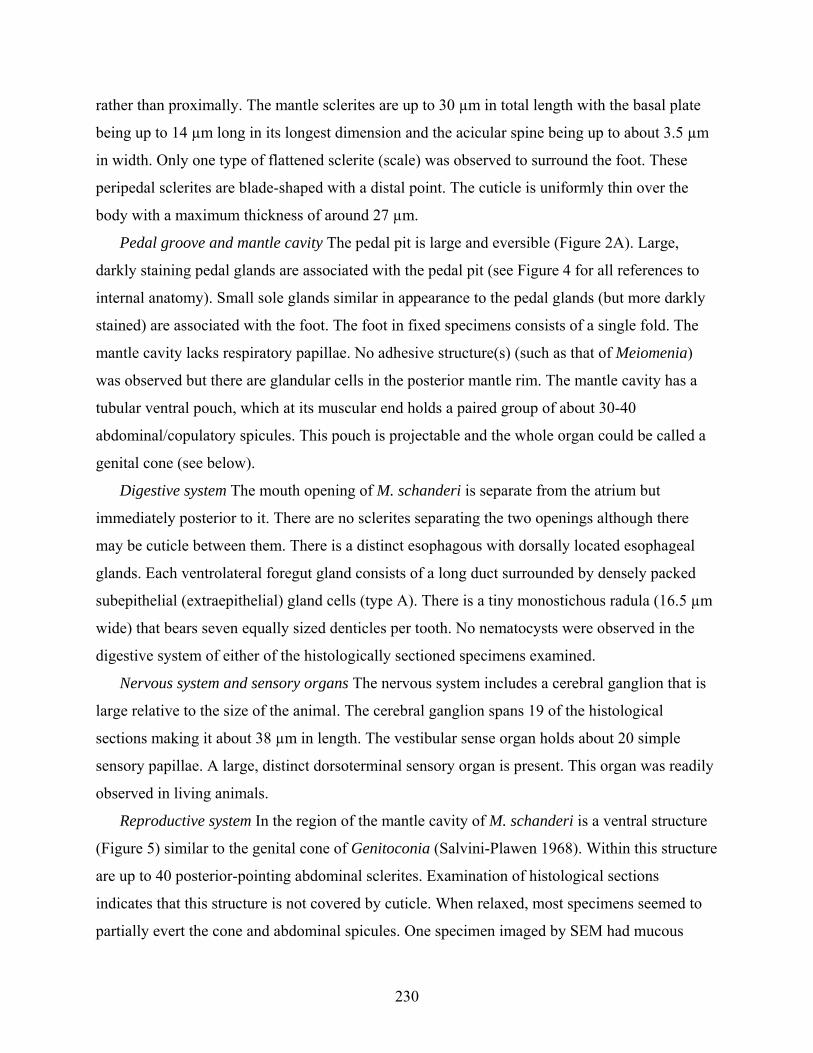
230
rather than proximally. The mantle sclerites are up to 30 µm in total length with the basal plate
being up to 14 µm long in its longest dimension and the acicular spine being up to about 3.5 µm
in width. Only one type of flattened sclerite (scale) was observed to surround the foot. These
peripedal sclerites are blade-shaped with a distal point. The cuticle is uniformly thin over the
body with a maximum thickness of around 27 µm.
Pedal groove and mantle cavity The pedal pit is large and eversible (Figure 2A). Large,
darkly staining pedal glands are associated with the pedal pit (see Figure 4 for all references to
internal anatomy). Small sole glands similar in appearance to the pedal glands (but more darkly
stained) are associated with the foot. The foot in fixed specimens consists of a single fold. The
mantle cavity lacks respiratory papillae. No adhesive structure(s) (such as that of Meiomenia)
was observed but there are glandular cells in the posterior mantle rim. The mantle cavity has a
tubular ventral pouch, which at its muscular end holds a paired group of about 30-40
abdominal/copulatory spicules. This pouch is projectable and the whole organ could be called a
genital cone (see below).
Digestive system The mouth opening of M. schanderi is separate from the atrium but
immediately posterior to it. There are no sclerites separating the two openings although there
may be cuticle between them. There is a distinct esophagous with dorsally located esophageal
glands. Each ventrolateral foregut gland consists of a long duct surrounded by densely packed
subepithelial (extraepithelial) gland cells (type A). There is a tiny monostichous radula (16.5 µm
wide) that bears seven equally sized denticles per tooth. No nematocysts were observed in the
digestive system of either of the histologically sectioned specimens examined.
Nervous system and sensory organs The nervous system includes a cerebral ganglion that is
large relative to the size of the animal. The cerebral ganglion spans 19 of the histological
sections making it about 38 µm in length. The vestibular sense organ holds about 20 simple
sensory papillae. A large, distinct dorsoterminal sensory organ is present. This organ was readily
observed in living animals.
Reproductive system In the region of the mantle cavity of M. schanderi is a ventral structure
(Figure 5) similar to the genital cone of Genitoconia (Salvini-Plawen 1968). Within this structure
are up to 40 posterior-pointing abdominal sclerites. Examination of histological sections
indicates that this structure is not covered by cuticle. When relaxed, most specimens seemed to
partially evert the cone and abdominal spicules. One specimen imaged by SEM had mucous
231
covering up part of its posterior end including the based of the “genital cone” but it appeared that
this specimen had either completely “ejected” the abdominal/copulatory sclerites or they had
broken off near their point of attachment to the body and were stuck in this mucous. The
unpaired portion of the spawning duct is very large filling the ventral half of the posterior portion
of the body. There are darkly stained vesicles in the cells of the spawning duct. The gonad is
distinctly divided laterally with each half up against the body wall on either side of the midgut.
Macellomenia morseae Kocot and Todt sp. nov.
Type locality
48°32'40"N 122°58'58"W in the San Juan Channel near Reid Rock.
Type material
Holotype histologically sectioned. Two paratypes mounted on SEM stub. Holotype and paratype
deposited in the University Museum of Bergen under accession numbers TBD.
Etymology
This species is named to honor Dr. Patricia Morse, an expert on meiofaunal animals and
molluscs who described the first meiofaunal solenogaster from the area and alerted us to the
presence of the species described herein.
Diagnosis
Body to at least 2 mm long. Mantle sclerites up to 90 µm in length with ovate bases. Acicular
spines of sclerites thickest proximally. With two types of peripedal scales. Atrium (=vestibulum)
with sensory papillae. Mouth opening within atrium. Radula with eight equally sized denticles
per tooth. Abdominal spicules absent (?). Rostral caecum of the midgut present. Without distinct
esophagus. Midgut without regular constrictions. Dorsoterminal sensory organ not observed.
Mantle cavity without respiratory papillae.
Description
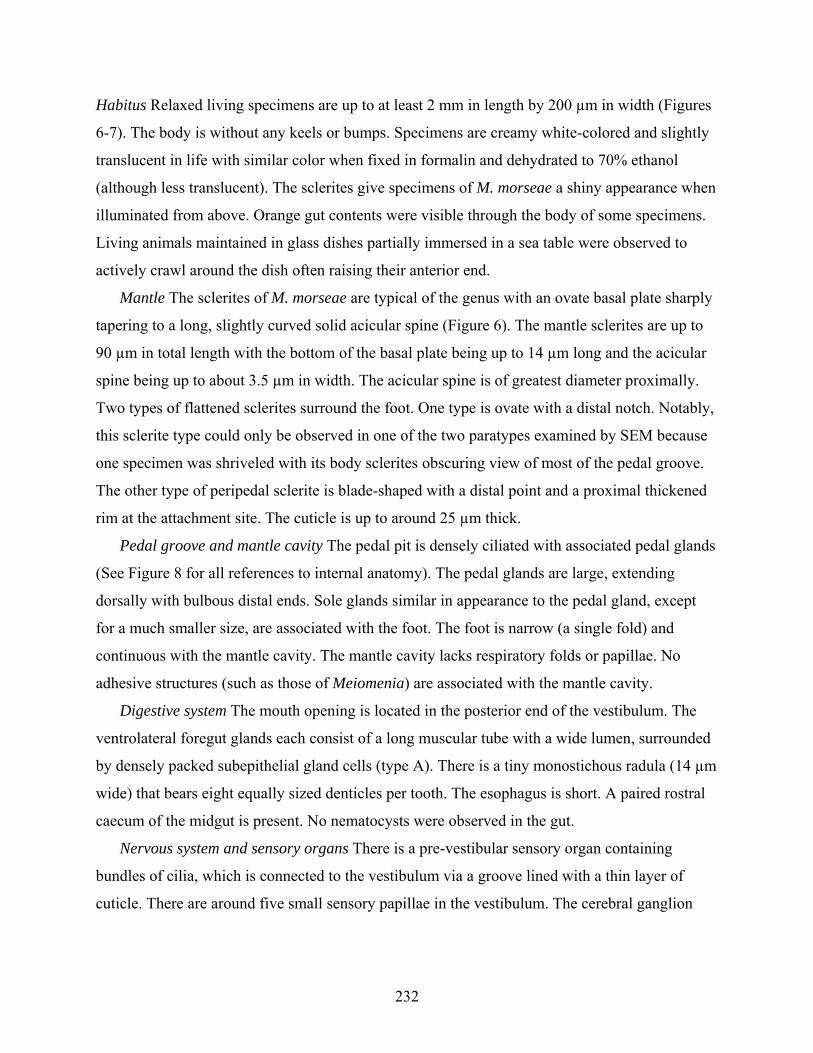
232
Habitus Relaxed living specimens are up to at least 2 mm in length by 200 µm in width (Figures
6-7). The body is without any keels or bumps. Specimens are creamy white-colored and slightly
translucent in life with similar color when fixed in formalin and dehydrated to 70% ethanol
(although less translucent). The sclerites give specimens of M. morseae a shiny appearance when
illuminated from above. Orange gut contents were visible through the body of some specimens.
Living animals maintained in glass dishes partially immersed in a sea table were observed to
actively crawl around the dish often raising their anterior end.
Mantle The sclerites of M. morseae are typical of the genus with an ovate basal plate sharply
tapering to a long, slightly curved solid acicular spine (Figure 6). The mantle sclerites are up to
90 µm in total length with the bottom of the basal plate being up to 14 µm long and the acicular
spine being up to about 3.5 µm in width. The acicular spine is of greatest diameter proximally.
Two types of flattened sclerites surround the foot. One type is ovate with a distal notch. Notably,
this sclerite type could only be observed in one of the two paratypes examined by SEM because
one specimen was shriveled with its body sclerites obscuring view of most of the pedal groove.
The other type of peripedal sclerite is blade-shaped with a distal point and a proximal thickened
rim at the attachment site. The cuticle is up to around 25 µm thick.
Pedal groove and mantle cavity The pedal pit is densely ciliated with associated pedal glands
(See Figure 8 for all references to internal anatomy). The pedal glands are large, extending
dorsally with bulbous distal ends. Sole glands similar in appearance to the pedal gland, except
for a much smaller size, are associated with the foot. The foot is narrow (a single fold) and
continuous with the mantle cavity. The mantle cavity lacks respiratory folds or papillae. No
adhesive structures (such as those of Meiomenia) are associated with the mantle cavity.
Digestive system The mouth opening is located in the posterior end of the vestibulum. The
ventrolateral foregut glands each consist of a long muscular tube with a wide lumen, surrounded
by densely packed subepithelial gland cells (type A). There is a tiny monostichous radula (14 µm
wide) that bears eight equally sized denticles per tooth. The esophagus is short. A paired rostral
caecum of the midgut is present. No nematocysts were observed in the gut.
Nervous system and sensory organs There is a pre-vestibular sensory organ containing
bundles of cilia, which is connected to the vestibulum via a groove lined with a thin layer of
cuticle. There are around five small sensory papillae in the vestibulum. The cerebral ganglion
233
spans approximately 20 sections making it around 40 µm long. In the region of the radula, the
cerebral ganglion is about 22 µm by 50 µm. A dorsoterminal sense organ is lacking.
Reproductive system The gonad of the single animal examined by histology is small, with
few undeveloped oocytes arranged on both sides of the central septum; no spermatocytes could
be detected. The remaining genital tract is not fully developed. The spawning duct is unpaired
where it joins the mantle cavity.
Taxonomic Remarks
Macellomeniidae is a monogeneric family including only the genus Macellomenia. This family
is placed in the order Pholidoskepia on the basis of the presence of solid sclerites arranged in one
layer, the presence of a thin cuticle, and the lack of epidermal papillae. Members of this family
have unique sclerites easily distinguishing them from the other families of the order. The two
species of Macellomenia described herein increase the number of recognized species of the
family from three to five. Additionally, our collection of this genus in the Pacific greatly expands
the known range of this previously exclusively European family.
M. schanderi and M. morseae can easily be distinguished from each other and all of the
previously described species of Macellomenia on the basis of the characters outlined in Table 1.
A large dorsoterminal sensory organ was easily observed in living specimens and histological
sections of M. schanderi whereas no trace of this organ was observed in living specimens or
histological sections of M. morseae. Sclerites can also be used to easily distinguish between
these two cogeners. The solid, acicular portion of the body sclerites of M. morseae is usually
quite elongate, thickest proximally tapering to its thinnest distally, and slightly if at all recurved.
M. schanderi, on the other hand, has body sclerites with a much shorter acicular portion that is
thickest medially and more recurved than that of M. morseae. The longer, straighter sclerites
give M. morseae a much “spikier” appearance than M. schanderi and this is readily apparent
when directly comparing specimens using a stereomicroscope. Notably, the acicular portion of
the body sclerites of both species are covered with bumpy protuberances that are not readily
apparent unless examined using scanning electron microscopy.
M. schanderi and M. morseae can also apparently be distinguished by the number of
denticles per radular tooth: M. schanderi has 7 denticles per tooth whereas M. morseae has 8
denticles per tooth (although this character is not easily observed unless histological sectioning is
234
conducted). Aside from M. palifera and M. adenota who both have seven denticles per radular
tooth, all described species of Macellomenia differ in the number of denticles per tooth.
However, we caution that this character could change with age and note that we were able to
examine this character in only a limited number of specimens (two for M. schanderi and just one
for M. morseae).
Interestingly, M. schanderi appears to be more closely related to an Atlantic species M.
adenota, rather than the sympatrically occurring M. morseae. M. schanderi and M. adenota both
possess abdominal spicules presumably involved in copulation. In M. adenota, abdominal glands
analagous to those of Squamatoherpia tricuspidata are associated with these abdominal spicules
(Salvini-Plawen 2003). M. schanderi does not have abdominal glands and the arrangement of
abdominal spicules is somewhat similar to the genital cone in Genitoconia spp. (Salvini-Plawen
1967), where they are called copulatory stylets. In the latter case, however, the stylets are
embedded into the ventral musculature of the spawning duct, while in M. schanderi they are
derivatives of a ventral pallial pouch. Therefore, we here keep to Salvini-Plawen’s (2003)
interpretation as abdominal spicules in Macellomenia. However, it should be noted that the
specimen of M. morseae examined by histology was a juvenile and it is possible that this species
develops abdominal spicules as it matures. Additionally, M. schanderi and M. adenota are the
only described Macellomenia species with the mouth opening separate from the atrium. Lastly,
M. morseae apparently has a predilection to crawling on the surface tension of water in the
dishes it is kept in. This behavior was observed but to a noticeably more limited extent in M.
schander. It is in part because of this behavior that so few specimens of M. morseae were
examined for the present study – two additional specimens of this already rarely collected
species were unintentionally lost during a water change of the dish.
Order Cavibelonia Salvini-Plawen 1978
Hollow acicular sclerites in one or more layers within a thick cuticle, or if with solid sclerites,
with a biserial radula and ventrolateral foregut glandular organs not of type A. Radula of
different types or absent. Ventrolateral foregut glandular organs of different types.
Family Pruvotinidae Heath 1911
235
Hollow acicular sclerites. With or without hook-shaped sclerites. With or without dorsal
pharyngeal papillary gland. With our without respiratory folds. Radula distichous or absent.
Ventrolateral forgut glandular organs of clustered type, type A, or type C.
Subfamily Lophomeniinae Salvini-Plawen 1978
Without hook-shaped sclerites. With dorsal pharyngeal papillary gland. Ventrolateral foregut
glandular organs type A.
Hypomenia van Lummel 1930
Cuticle thick. Mouth opening separated from the atrium. Distichous radula present. Mouth
separate from atrium. Midgut without regular constrictions. Secondary genital opening unpaired.
Without copulatory stylets. Without dorsoterminal sensory organ. Without respiratory organs.
Hypomenia sanjuanensis Kocot and Todt sp. nov.
Type locality
48°32'40"N 122°58'58"W in the San Juan Channel near Reid Rock.
Type material
Holotype histologically sectioned. Two paratypes histologically sectioned. Two additional
paratypes fixed in 4% glutaraldehyde in 0.1M sodium cacodylate buffer and dehydrated to 70%
ethanol. Holotype and paratypes deposited in the University Museum of Bergen under accession
numbers TBD.
Etymology
The species is named for the San Juan Islands.
Diagnosis
Body to about 3.5 mm long in life, usually covered with detritus. Mantle sclerites up to about 90
µm in length and with partially or sometimes completely reduced cavity. With scale-like
236
peripedal sclerites. With dorsal papillary gland and paired rostral midgut caecum. Radula with
four denticles per tooth. One pair of seminal vesicles.
Description
Habitus Relaxed specimens up to about 3.5 mm in length and 300 µm in diameter (Figure 9).
Virtually all specimens were completely covered in detritus and had a light tan color at the time
of collection. It is possible that this is an artifact of how the specimens were collected and
handled in the lab. Because of the detritus sticking to their body, specimens of this species do not
appear as shiny as Macellomenia when illuminated from above. Additionally, because of the
detritus that is stuck to their body, specimens of this species are well camouflaged when dishes
of detritus are being screened for meiofauna. Preserved specimens look similar to living
specimens except that they tend to contract and curl ventrally forming a crescent shape.
Mantle The mantle is covered with elongate, usually recurved sclerites up to about 90 µm
long (Figure 10-11). Most of these sclerites are serrations at their tip although some are distally
rounded. Most of the elongate-type sclerites have a distinct hollow cavity typical of the order
Cavibelonia. However, in most sclerites, this cavity is reduced to the proximal half to two-thirds
of the sclerite. Some sclerites have a very reduced cavity or lack one altogether. Rounded,
distally pointed, flat sclerites up to around 50 µm long by 20 µm wide form a row along either
side of the foot. The cuticle is up to about 60 µm thick. No epidermal papillae are present (see
Figure 12 for all references to internal anatomy).
Pedal groove and mantle cavity The pedal pit is densely ciliated with associated pedal
glands. The foot is continuous with the mantle cavity. The mantle cavity is small and without
respiratory papillae. No adhesive structures (such as that of Meiomenia) are associated with the
mantle cavity.
Digestive system The foregut is distinctly trilobed at and just posterior to the region of the
cerebral ganglion. A paired digestive caecum extends anteriorly above the foregut terminating in
blind-ended sacs just posterior to the cerebral ganglion. The ventrolateral foregut glands consist
of muscular ducts with subepithelial gland cells (type A).
A dorsal pharyngeal papilla gland is present. This structure generally appears as a dorsal branch
of the pharynx surrounded by long-necked glandular cells filled with darkly staining vesicles.
The radula is distichous with four denticles per tooth (including the terminally hooked tip of the
237
tooth). The distal two teeth are similar in size and larger in size than the proximal two.
Approximately thirteen pairs of teeth were observed in the radula of one individual that was
squash-mounted. There are no constrictions in the midgut.
Nervous system and sensory organs The atrial sensory organ (atrium or vestibulum) lacks
papillae. The cerebral ganglion is large relative to the body size of the animal: approximately 74
µm from anterior to posterior. Posteriorly, the cerebral ganglion bifurcates and connects to the
lateral nerve cords. There is no dorsoterminal sensory organ.
Reproductive system All three specimens examined by histological sectioning were in a
reproductive state. Relatively large, well-developed eggs were observed in the pericardium. The
glands of the spawning duct are well developed and stain intensely with toluidine blue. Notably,
the upper half of the spawning duct stains much more strongly than the lower half. There is a
small, tubular seminal vesicle attached to each of the pericardioducts close to where it fuses with
the spawning duct.
Taxonomic Remarks
Similar to the situation for Macellomenia, our findings greatly expand the geographic range for
the genus Hypomenia. The only other described species in the genus, H. nierstraszi, is from the
Red Sea.
There is a seminal vesicle attached to each of the pericardioducts in H. sanjuanensis. This
is in contrast to H. nierstraszi – van Lummel (1930) wrote that there is no seminal vesicle in this
species. Therefore, this character appears to be diagnostic between the two species of
Hypomenia. However, van Lummel only examined one specimen and it may have been a
juvenile.
Discussion
Meiofaunal animals tend to have adaptations for living in a dynamic environment where they
could be swept up and suspended in the water column (Higgins and Thiel 1988). None of the
three species of solenogasters described herein have an adhesive structure like that of Meiomenia
swedmarki which it uses skillfully to adhere to the substratum when disturbed. Specimens of M.
schanderi and H. sanjuanensis that were observed in the laboratory tended to burrow downwards
whenever possible. As solenogasters lack eyes, this is presumably a response to gravity (positive
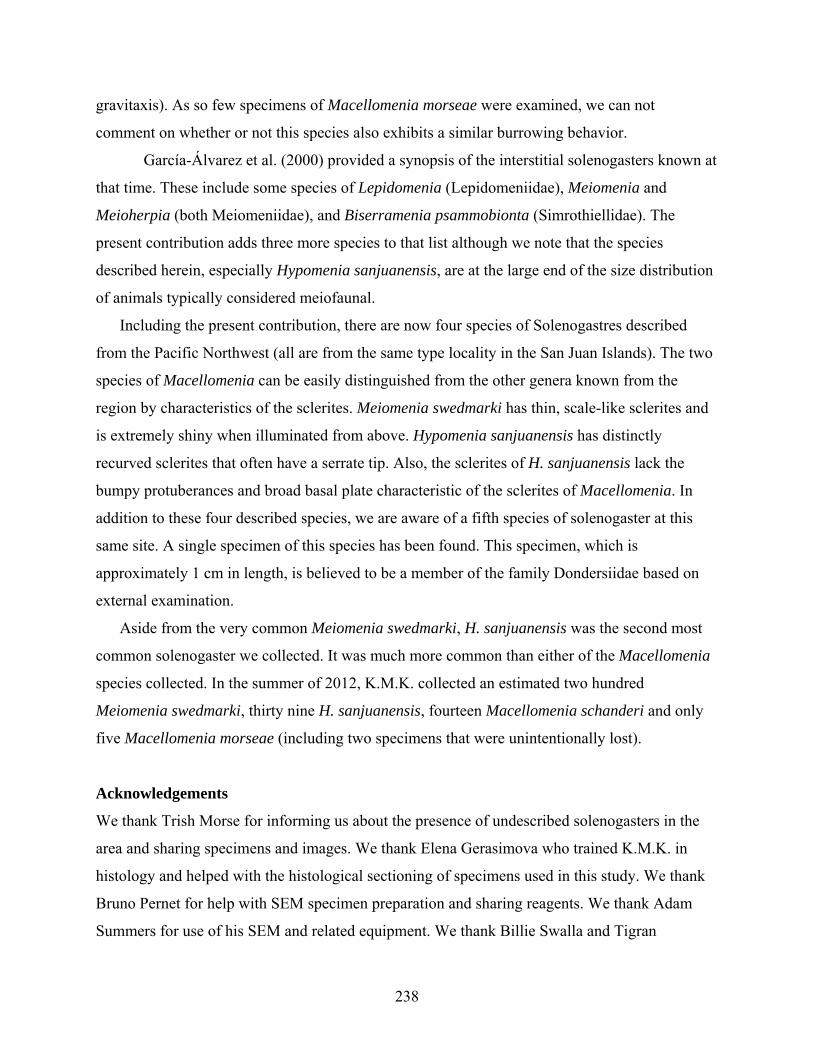
238
gravitaxis). As so few specimens of Macellomenia morseae were examined, we can not
comment on whether or not this species also exhibits a similar burrowing behavior.
García-Álvarez et al. (2000) provided a synopsis of the interstitial solenogasters known at
that time. These include some species of Lepidomenia (Lepidomeniidae), Meiomenia and
Meioherpia (both Meiomeniidae), and Biserramenia psammobionta (Simrothiellidae). The
present contribution adds three more species to that list although we note that the species
described herein, especially Hypomenia sanjuanensis, are at the large end of the size distribution
of animals typically considered meiofaunal.
Including the present contribution, there are now four species of Solenogastres described
from the Pacific Northwest (all are from the same type locality in the San Juan Islands). The two
species of Macellomenia can be easily distinguished from the other genera known from the
region by characteristics of the sclerites. Meiomenia swedmarki has thin, scale-like sclerites and
is extremely shiny when illuminated from above. Hypomenia sanjuanensis has distinctly
recurved sclerites that often have a serrate tip. Also, the sclerites of H. sanjuanensis lack the
bumpy protuberances and broad basal plate characteristic of the sclerites of Macellomenia. In
addition to these four described species, we are aware of a fifth species of solenogaster at this
same site. A single specimen of this species has been found. This specimen, which is
approximately 1 cm in length, is believed to be a member of the family Dondersiidae based on
external examination.
Aside from the very common Meiomenia swedmarki, H. sanjuanensis was the second most
common solenogaster we collected. It was much more common than either of the Macellomenia
species collected. In the summer of 2012, K.M.K. collected an estimated two hundred
Meiomenia swedmarki, thirty nine H. sanjuanensis, fourteen Macellomenia schanderi and only
five Macellomenia morseae (including two specimens that were unintentionally lost).
Acknowledgements
We thank Trish Morse for informing us about the presence of undescribed solenogasters in the
area and sharing specimens and images. We thank Elena Gerasimova who trained K.M.K. in
histology and helped with the histological sectioning of specimens used in this study. We thank
Bruno Pernet for help with SEM specimen preparation and sharing reagents. We thank Adam
Summers for use of his SEM and related equipment. We thank Billie Swalla and Tigran
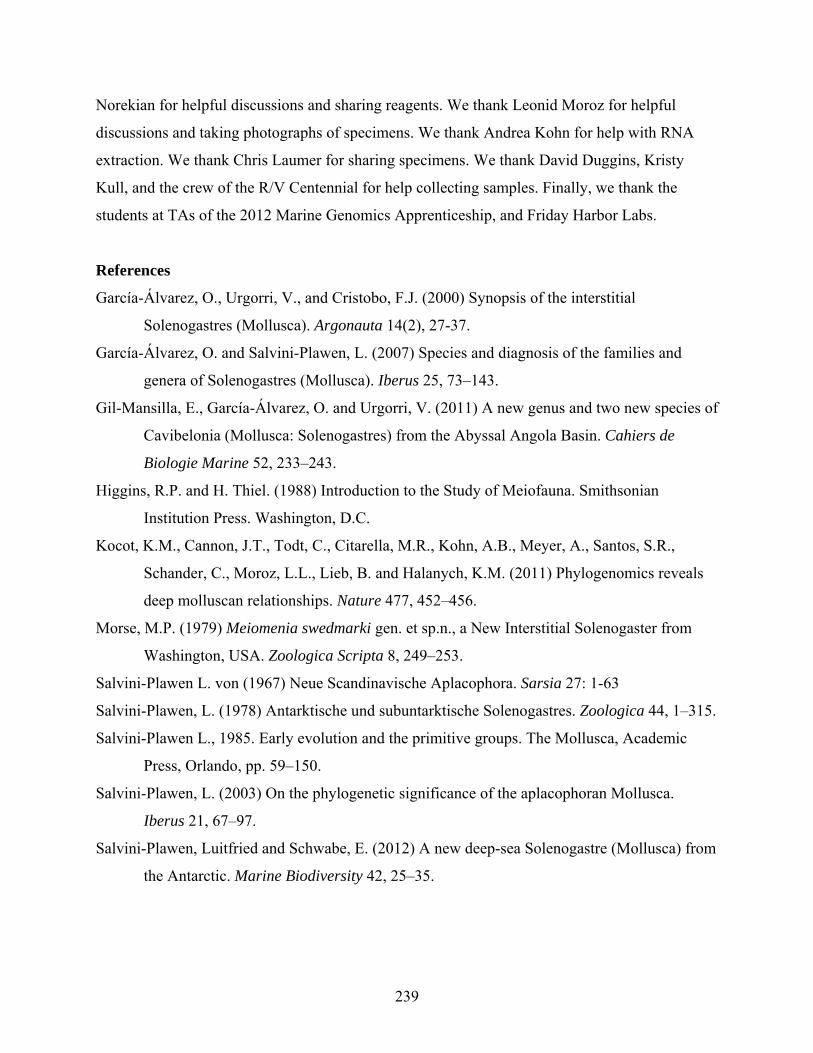
239
Norekian for helpful discussions and sharing reagents. We thank Leonid Moroz for helpful
discussions and taking photographs of specimens. We thank Andrea Kohn for help with RNA
extraction. We thank Chris Laumer for sharing specimens. We thank David Duggins, Kristy
Kull, and the crew of the R/V Centennial for help collecting samples. Finally, we thank the
students at TAs of the 2012 Marine Genomics Apprenticeship, and Friday Harbor Labs.
References
García-Álvarez, O., Urgorri, V., and Cristobo, F.J. (2000) Synopsis of the interstitial
Solenogastres (Mollusca). Argonauta 14(2), 27-37.
García-Álvarez, O. and Salvini-Plawen, L. (2007) Species and diagnosis of the families and
genera of Solenogastres (Mollusca). Iberus 25, 73–143.
Gil-Mansilla, E., García-Álvarez, O. and Urgorri, V. (2011) A new genus and two new species of
Cavibelonia (Mollusca: Solenogastres) from the Abyssal Angola Basin. Cahiers de
Biologie Marine 52, 233–243.
Higgins, R.P. and H. Thiel. (1988) Introduction to the Study of Meiofauna. Smithsonian
Institution Press. Washington, D.C.
Kocot, K.M., Cannon, J.T., Todt, C., Citarella, M.R., Kohn, A.B., Meyer, A., Santos, S.R.,
Schander, C., Moroz, L.L., Lieb, B. and Halanych, K.M. (2011) Phylogenomics reveals
deep molluscan relationships. Nature 477, 452–456.
Morse, M.P. (1979) Meiomenia swedmarki gen. et sp.n., a New Interstitial Solenogaster from
Washington, USA. Zoologica Scripta 8, 249–253.
Salvini-Plawen L. von (1967) Neue Scandinavische Aplacophora. Sarsia 27: 1-63
Salvini-Plawen, L. (1978) Antarktische und subuntarktische Solenogastres. Zoologica 44, 1–315.
Salvini-Plawen L., 1985. Early evolution and the primitive groups. The Mollusca, Academic
Press, Orlando, pp. 59–150.
Salvini-Plawen, L. (2003) On the phylogenetic significance of the aplacophoran Mollusca.
Iberus 21, 67–97.
Salvini-Plawen, Luitfried and Schwabe, E. (2012) A new deep-sea Solenogastre (Mollusca) from
the Antarctic. Marine Biodiversity 42, 25–35.
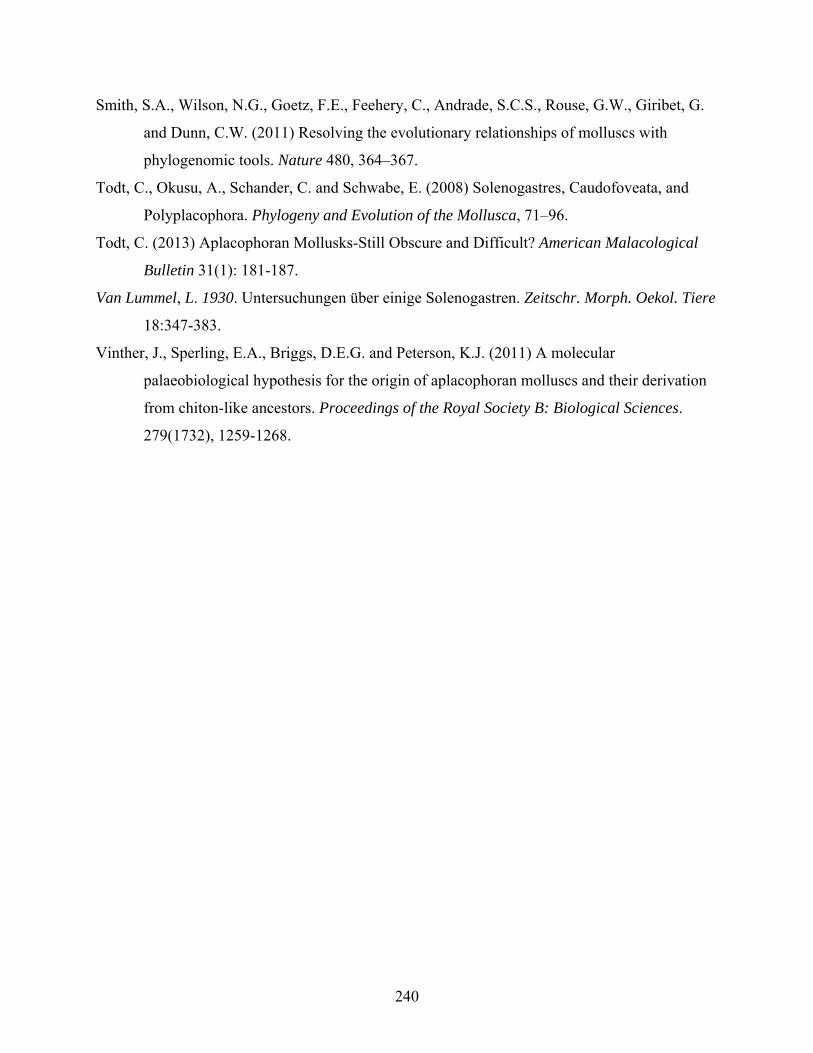
240
Smith, S.A., Wilson, N.G., Goetz, F.E., Feehery, C., Andrade, S.C.S., Rouse, G.W., Giribet, G.
and Dunn, C.W. (2011) Resolving the evolutionary relationships of molluscs with
phylogenomic tools. Nature 480, 364–367.
Todt, C., Okusu, A., Schander, C. and Schwabe, E. (2008) Solenogastres, Caudofoveata, and
Polyplacophora. Phylogeny and Evolution of the Mollusca, 71–96.
Todt, C. (2013) Aplacophoran Mollusks-Still Obscure and Difficult? American Malacological
Bulletin 31(1): 181-187.
Van Lummel, L. 1930. Untersuchungen über einige Solenogastren. Zeitschr. Morph. Oekol. Tiere
18:347-383.
Vinther, J., Sperling, E.A., Briggs, D.E.G. and Peterson, K.J. (2011) A molecular
palaeobiological hypothesis for the origin of aplacophoran molluscs and their derivation
from chiton-like ancestors. Proceedings of the Royal Society B: Biological Sciences.
279(1732), 1259-1268.
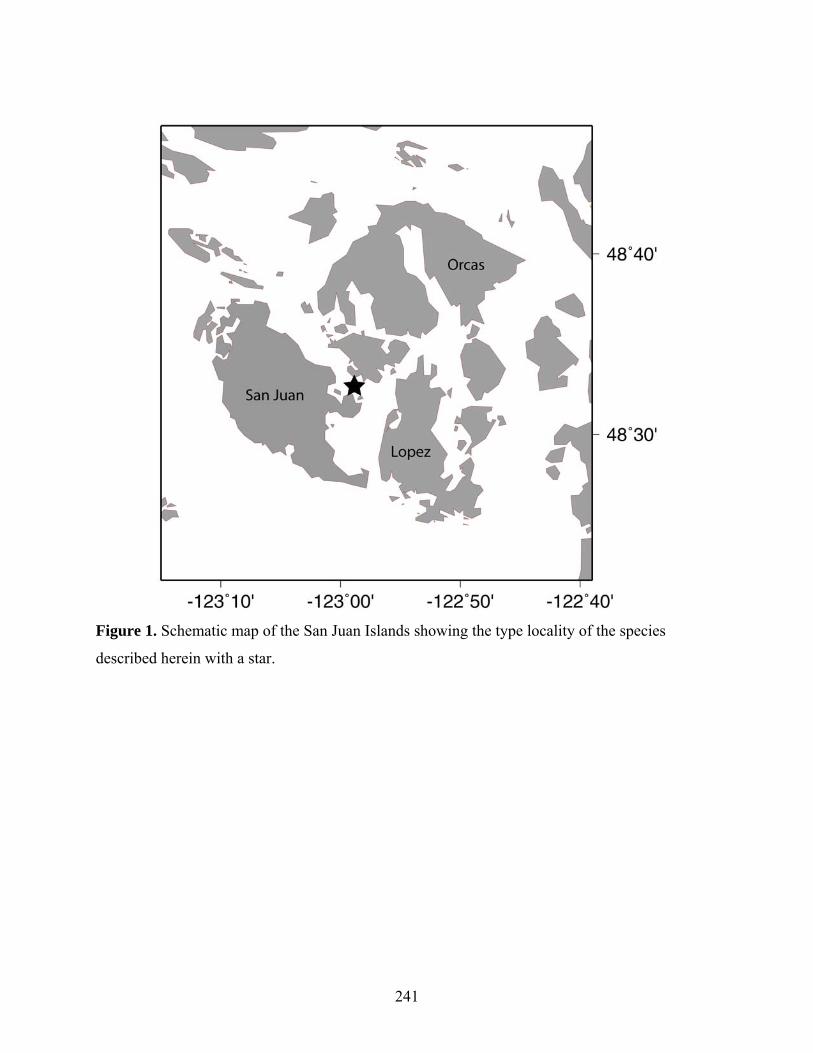
241
Figure 1. Schematic map of the San Juan Islands showing the type locality of the species
described herein with a star.
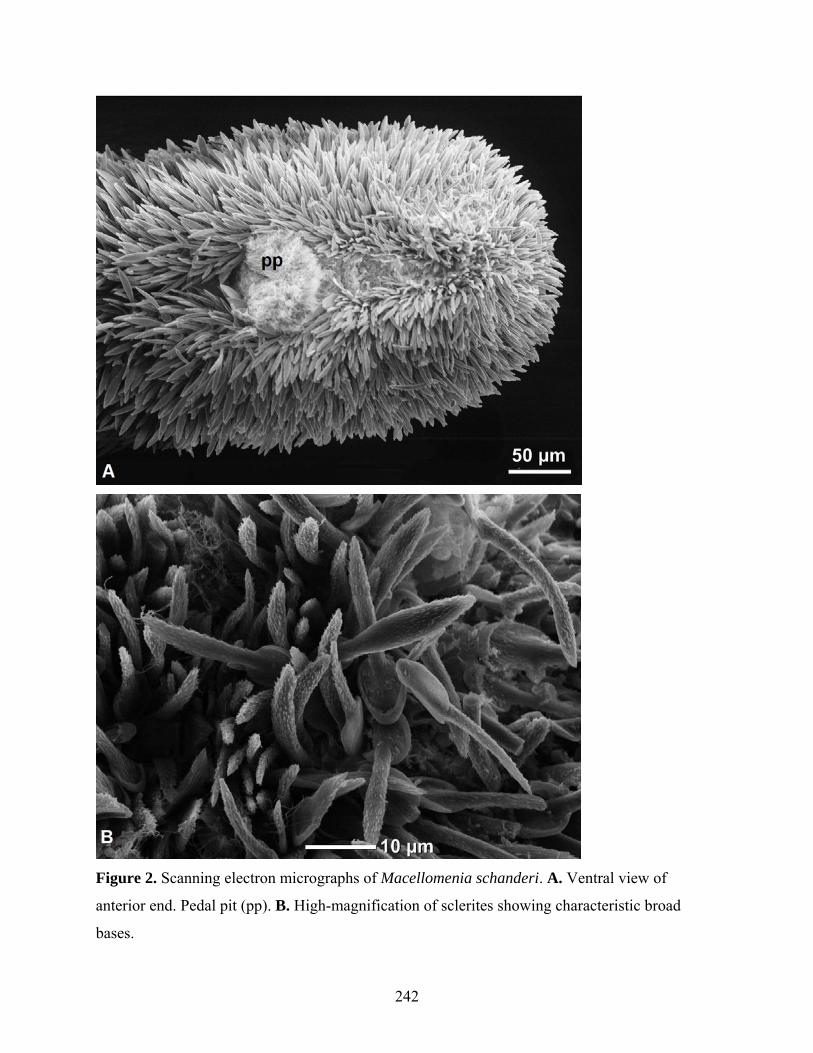
242
Figure 2. Scanning electron micrographs of Macellomenia schanderi. A. Ventral view of
anterior end. Pedal pit (pp). B. High-magnification of sclerites showing characteristic broad
bases.
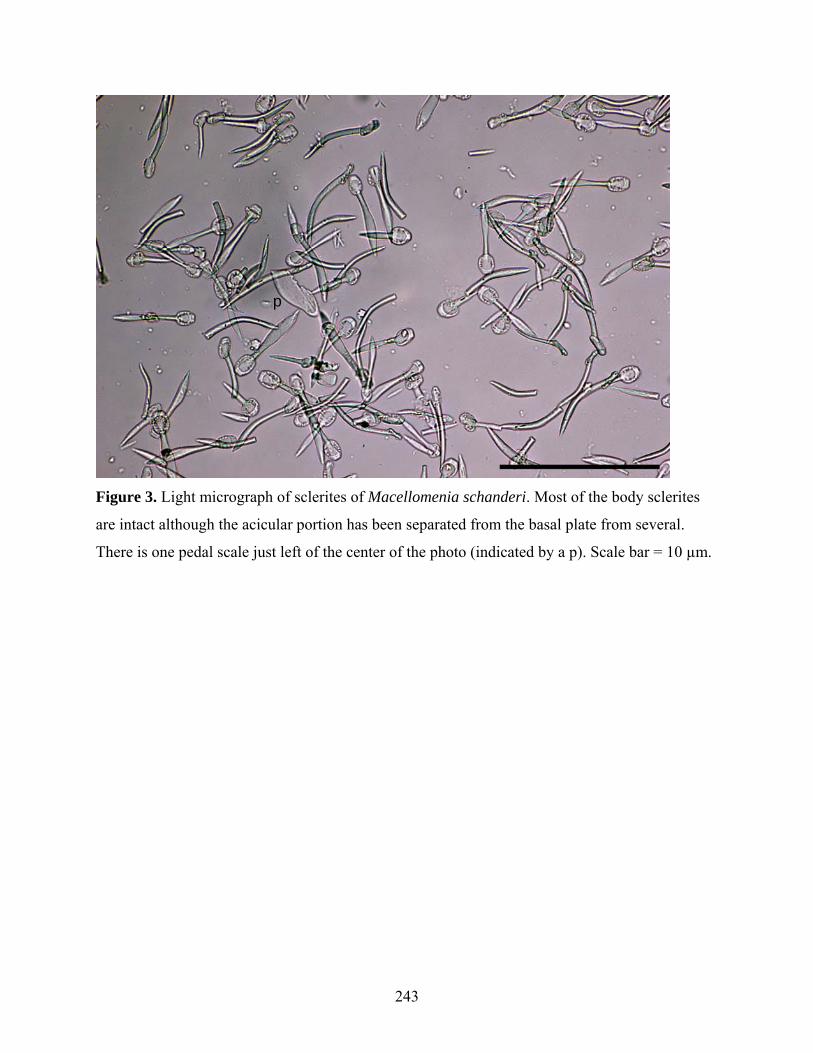
243
Figure 3. Light micrograph of sclerites of Macellomenia schanderi. Most of the body sclerites
are intact although the acicular portion has been separated from the basal plate from several.
There is one pedal scale just left of the center of the photo (indicated by a p). Scale bar = 10 µm.
p
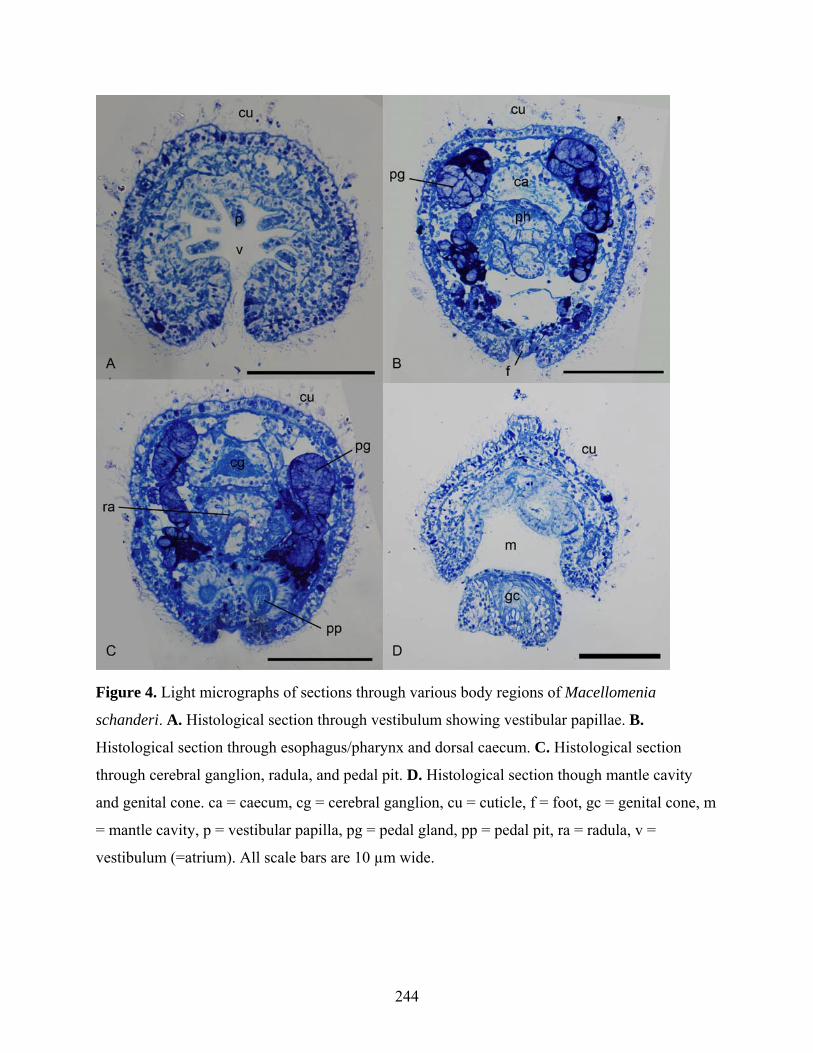
244
Figure 4. Light micrographs of sections through various body regions of Macellomenia
schanderi. A. Histological section through vestibulum showing vestibular papillae. B.
Histological section through esophagus/pharynx and dorsal caecum. C. Histological section
through cerebral ganglion, radula, and pedal pit. D. Histological section though mantle cavity
and genital cone. ca = caecum, cg = cerebral ganglion, cu = cuticle, f = foot, gc = genital cone, m
= mantle cavity, p = vestibular papilla, pg = pedal gland, pp = pedal pit, ra = radula, v =
vestibulum (=atrium). All scale bars are 10 µm wide.
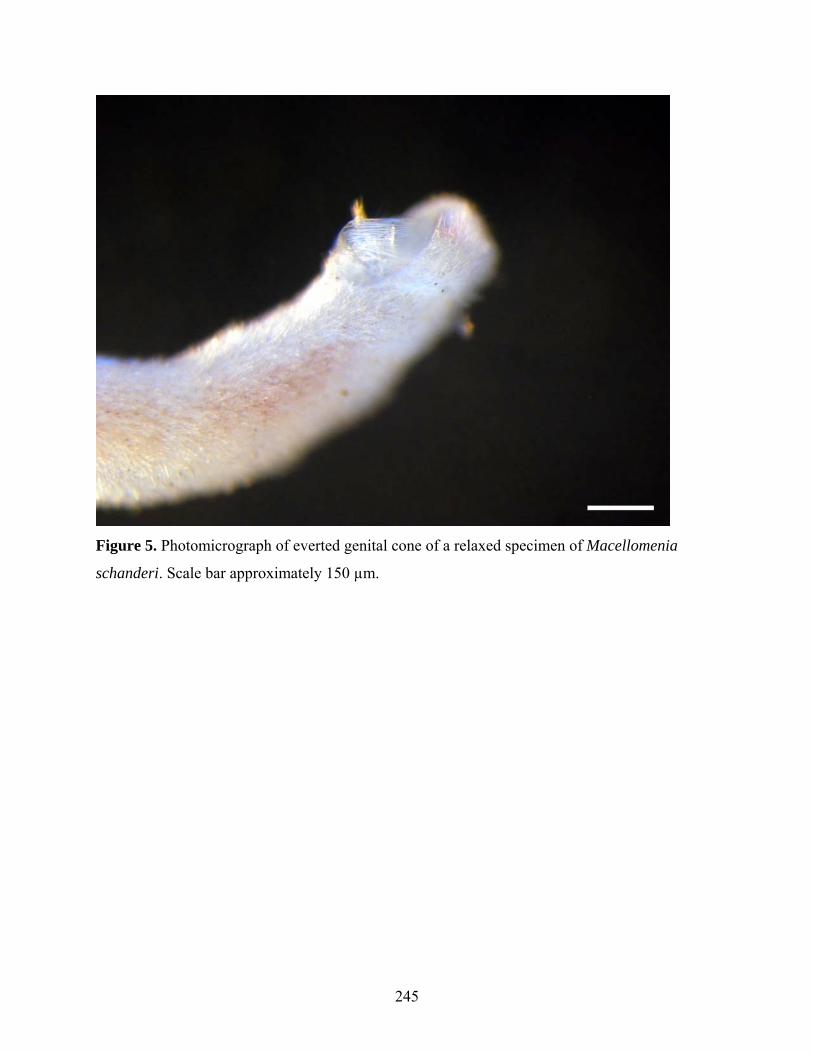
245
Figure 5. Photomicrograph of everted genital cone of a relaxed specimen of Macellomenia
schanderi. Scale bar approximately 150 µm.
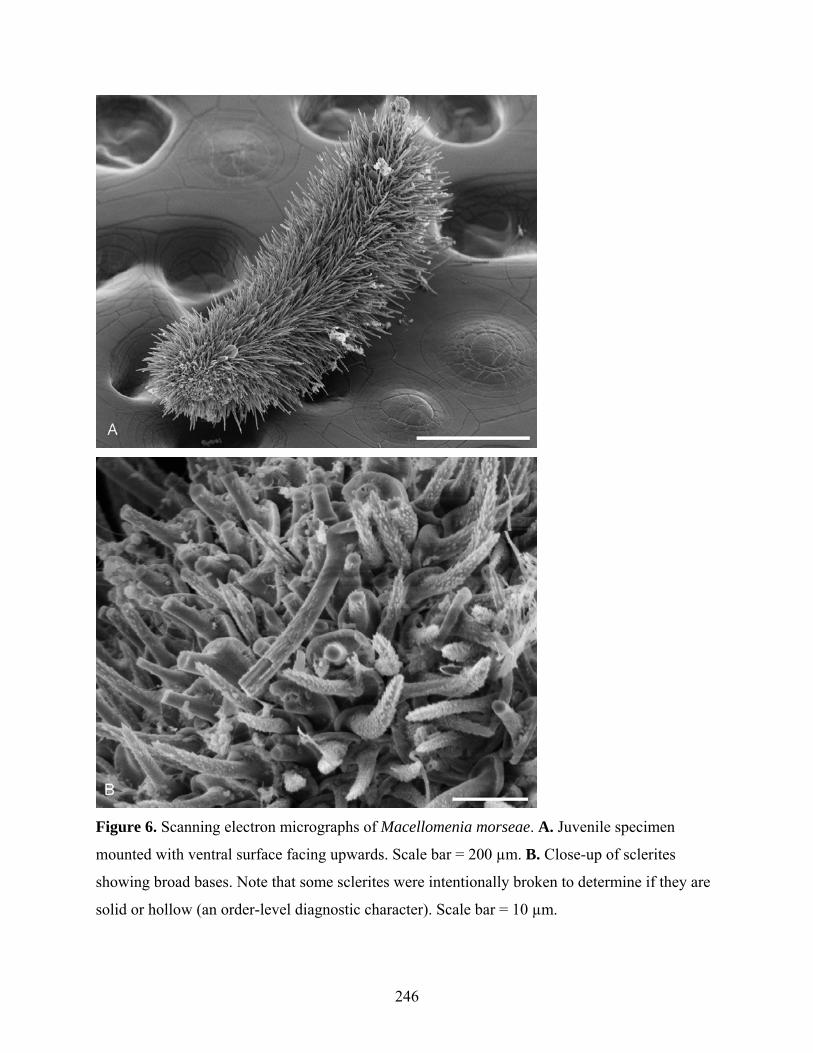
246
Figure 6. Scanning electron micrographs of Macellomenia morseae. A. Juvenile specimen
mounted with ventral surface facing upwards. Scale bar = 200 µm. B. Close-up of sclerites
showing broad bases. Note that some sclerites were intentionally broken to determine if they are
solid or hollow (an order-level diagnostic character). Scale bar = 10 µm.
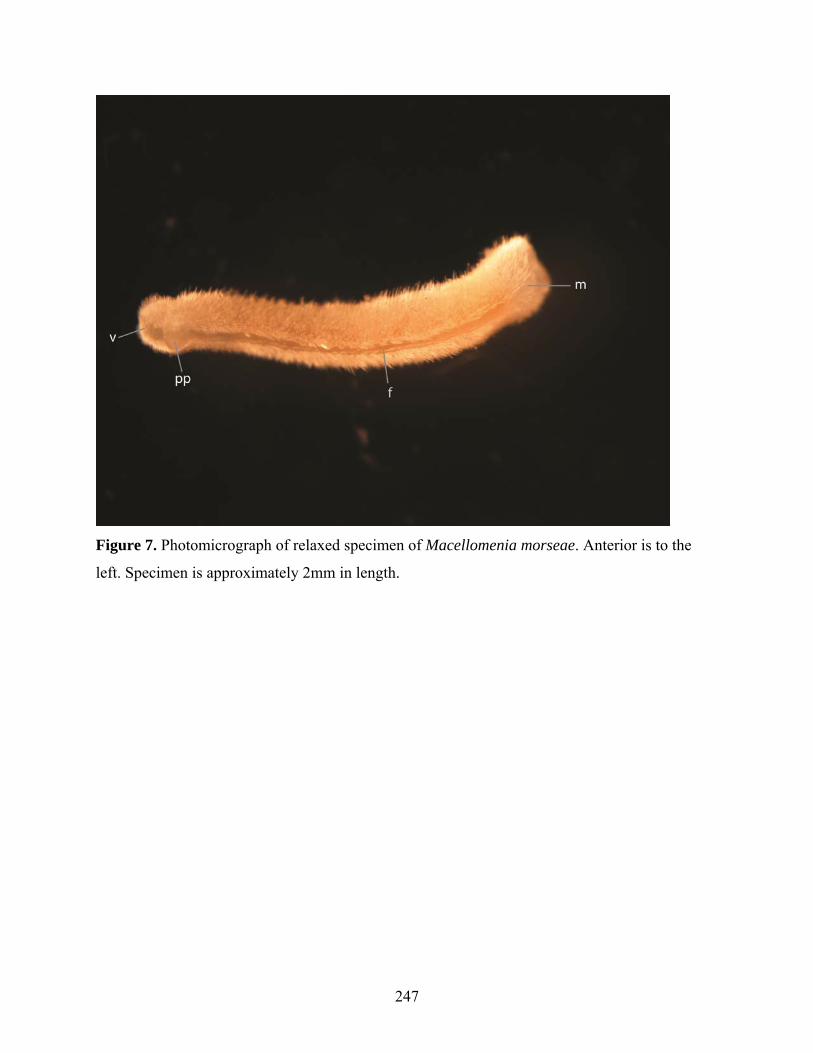
247
Figure 7. Photomicrograph of relaxed specimen of Macellomenia morseae. Anterior is to the
left. Specimen is approximately 2mm in length.
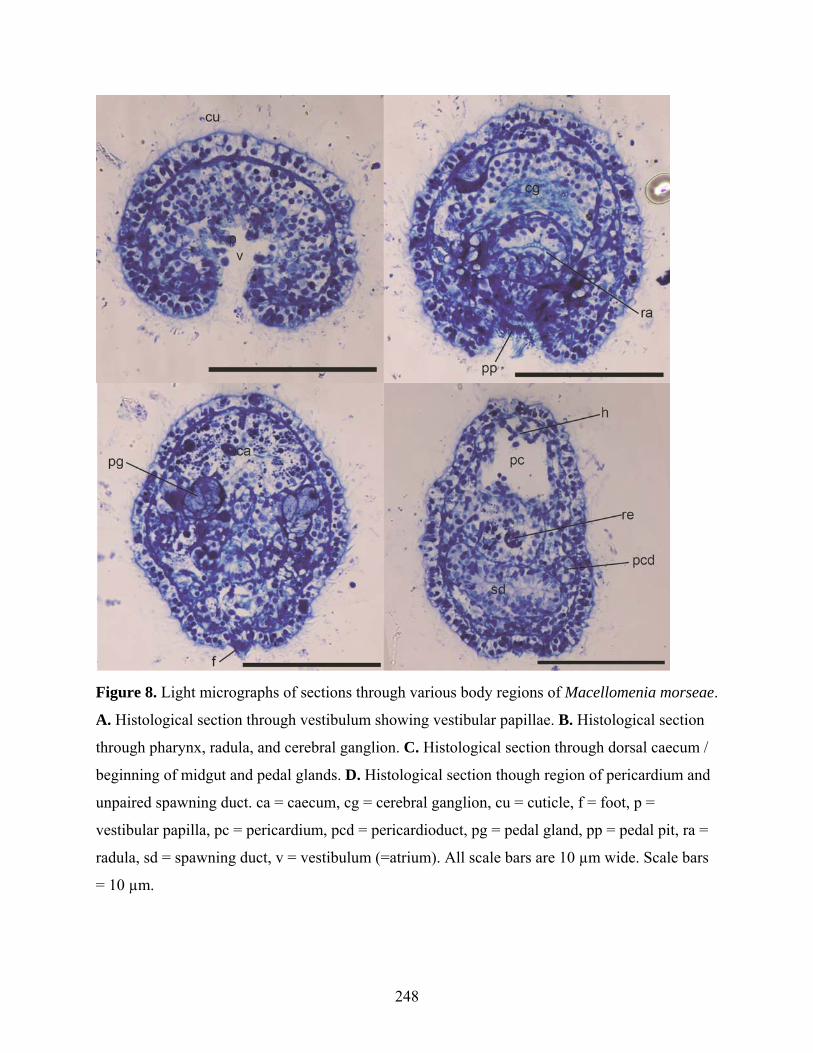
248
Figure 8. Light micrographs of sections through various body regions of Macellomenia morseae.
A. Histological section through vestibulum showing vestibular papillae. B. Histological section
through pharynx, radula, and cerebral ganglion. C. Histological section through dorsal caecum /
beginning of midgut and pedal glands. D. Histological section though region of pericardium and
unpaired spawning duct. ca = caecum, cg = cerebral ganglion, cu = cuticle, f = foot, p =
vestibular papilla, pc = pericardium, pcd = pericardioduct, pg = pedal gland, pp = pedal pit, ra =
radula, sd = spawning duct, v = vestibulum (=atrium). All scale bars are 10 µm wide. Scale bars
= 10 µm.
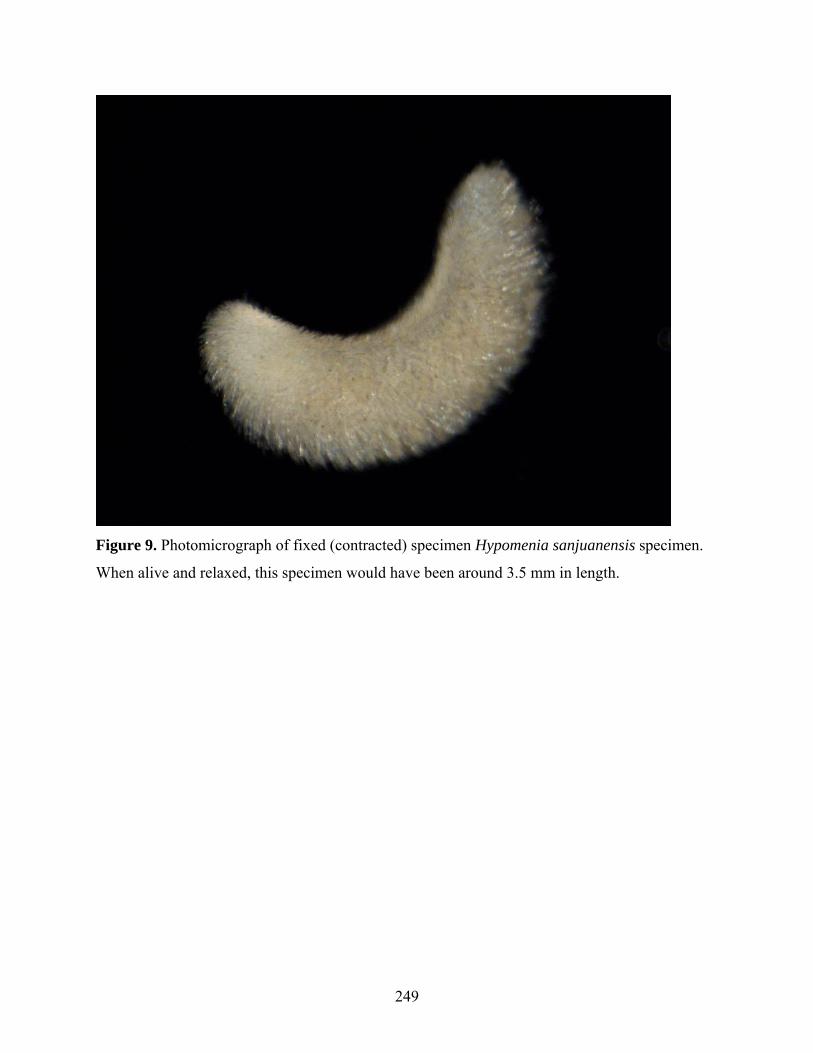
249
Figure 9. Photomicrograph of fixed (contracted) specimen Hypomenia sanjuanensis specimen.
When alive and relaxed, this specimen would have been around 3.5 mm in length.
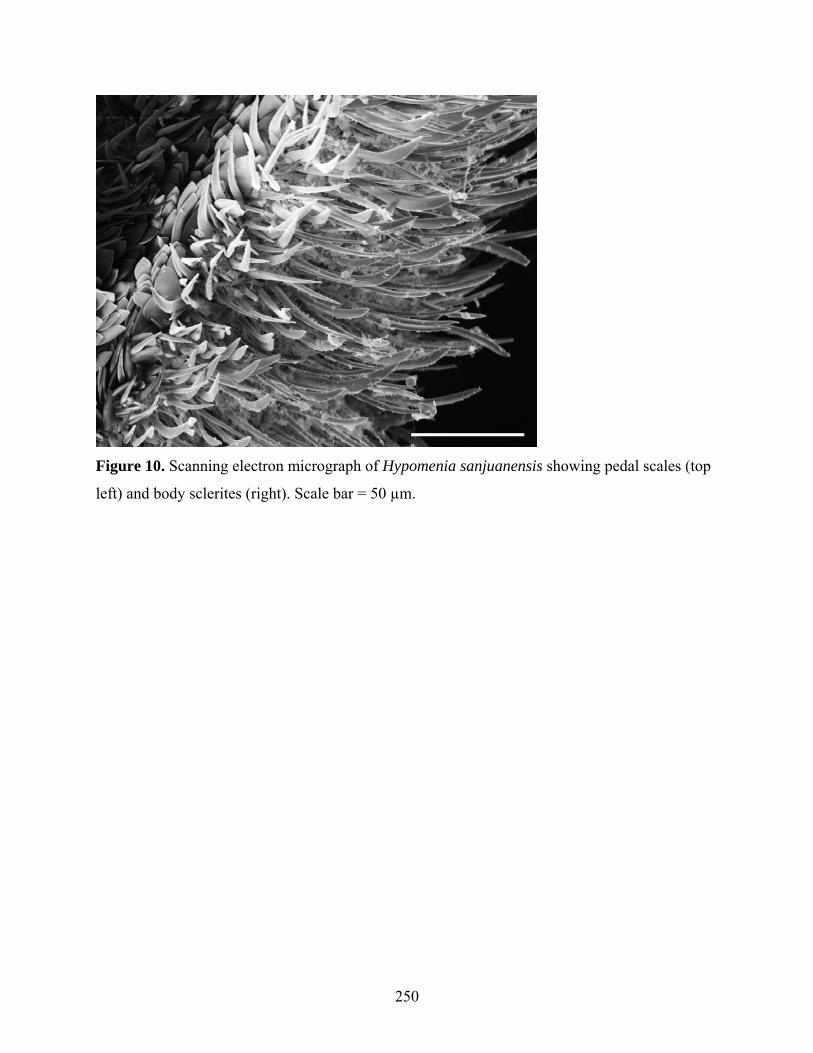
250
Figure 10. Scanning electron micrograph of Hypomenia sanjuanensis showing pedal scales (top
left) and body sclerites (right). Scale bar = 50 µm.
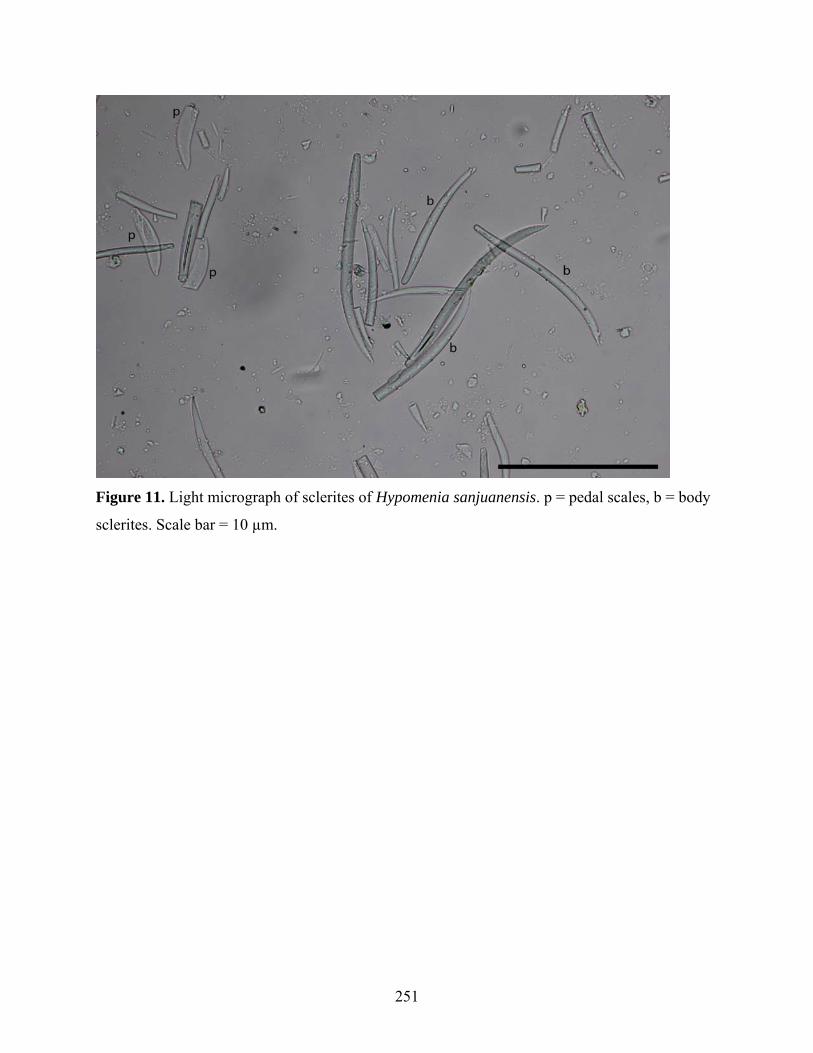
251
Figure 11. Light micrograph of sclerites of Hypomenia sanjuanensis. p = pedal scales, b = body
sclerites. Scale bar = 10 µm.
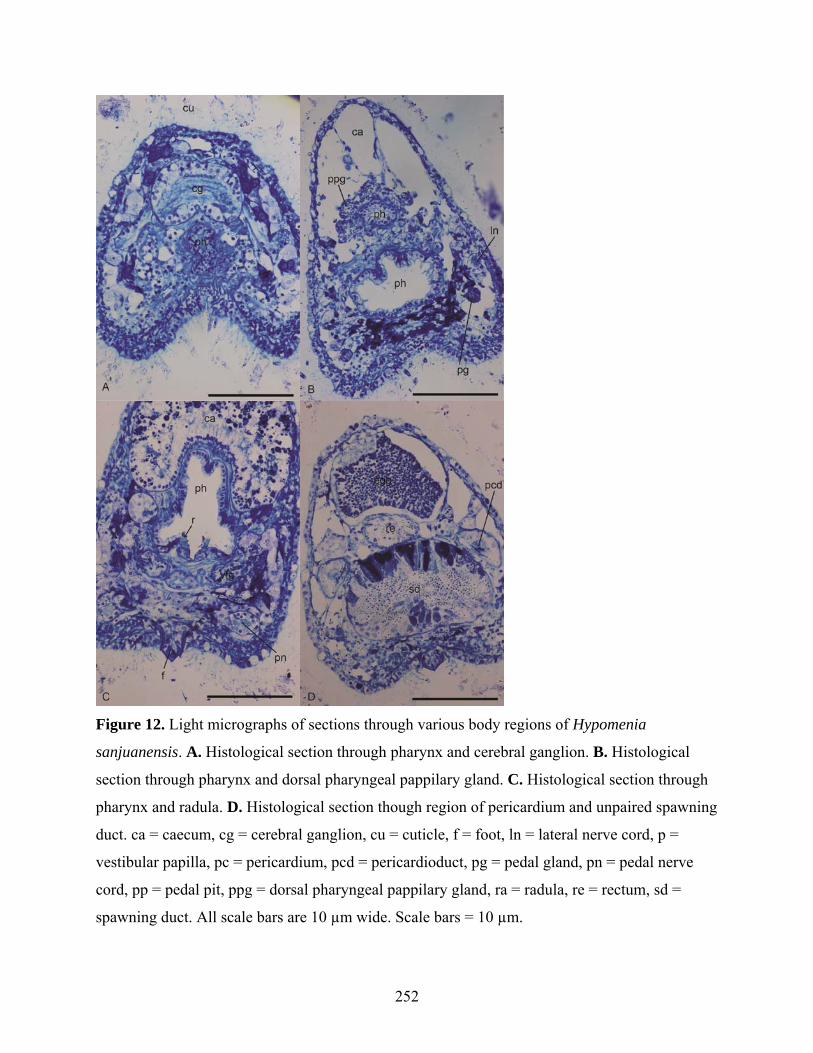
252
Figure 12. Light micrographs of sections through various body regions of Hypomenia
sanjuanensis. A. Histological section through pharynx and cerebral ganglion. B. Histological
section through pharynx and dorsal pharyngeal pappilary gland. C. Histological section through
pharynx and radula. D. Histological section though region of pericardium and unpaired spawning
duct. ca = caecum, cg = cerebral ganglion, cu = cuticle, f = foot, ln = lateral nerve cord, p =
vestibular papilla, pc = pericardium, pcd = pericardioduct, pg = pedal gland, pn = pedal nerve
cord, pp = pedal pit, ppg = dorsal pharyngeal pappilary gland, ra = radula, re = rectum, sd =
spawning duct. All scale bars are 10 µm wide. Scale bars = 10 µm.
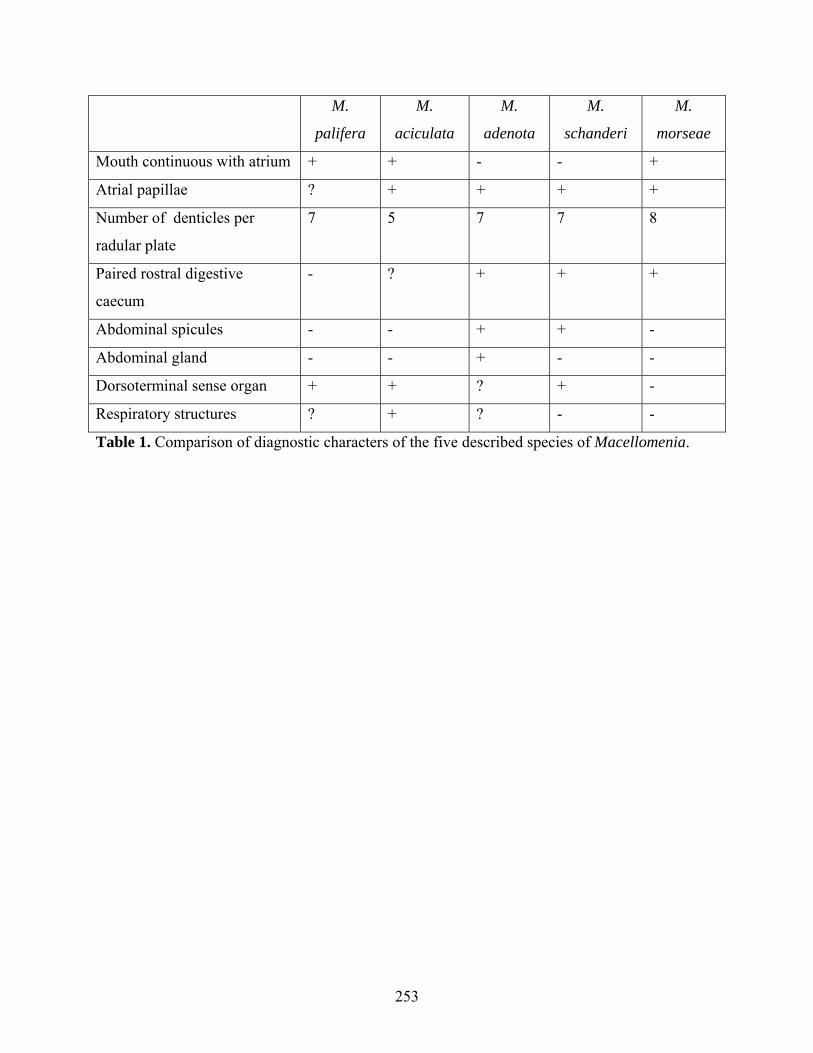
253
M.
palifera
M.
aciculata
M.
adenota
M.
schanderi
M.
morseae
Mouth continuous with atrium + + - - +
Atrial papillae ? + + + +
Number of denticles per
radular plate
7 5 7 7 8
Paired rostral digestive
caecum
- ? + + +
Abdominal spicules - - + + -
Abdominal gland - - + - -
Dorsoterminal sense organ + + ? + -
Respiratory structures ? + ? - -
Table 1. Comparison of diagnostic characters of the five described species of Macellomenia.


![A mitogenomic phylogeny of chitons (Mollusca: Polyplacophora)uu.diva-portal.org/smash/get/diva2:1417109/FULLTEXT01.pdf(Serialia hypothesis; [15, 16]; but see [17]). The phylogen-etic](https://img.pdfslide.us/doc/110x75/5f6cf13cab5fc579824e7115/a-mitogenomic-phylogeny-of-chitons-mollusca-polyplacophorauudiva-1417109fulltext01pdf.jpg)