Embed Size (px)
Citation preview
A Cold Event in Asia during January–February 2012 and Its Possible Association withArctic Sea Ice Loss
BINGYI WU
Institute of Atmospheric Sciences, Fudan University, Shanghai, and Chinese Academy of Meteorological Sciences, Beijing, China
KUN YANG
National Meteorological Center, Beijing, China
JENNIFER A. FRANCIS
Department of Marine and Coastal Sciences, Rutgers, The State University of New Jersey, New Brunswick, New Jersey
(Manuscript received 5 February 2016, in final form 22 June 2017)
ABSTRACT
Through both observational analyses and simulation experiments, this study investigates the intraseasonal
evolution of atmospheric circulation anomalies associated with a persistent cold event in the Asian continent
during late January–early February 2012, and the possible association with Arctic sea ice loss and Arctic
atmospheric circulation during the preceding summer. The results suggest that the northeastern Pacific–
Aleutian region and central Eurasia are two critical areas where the atmospheric circulation evolution
contributed to the development of this cold event. A persistent increase in sea level pressure (SLP) over the
Aleutian region was a predominant feature prior to the cold event, and then decreasing SLP over this region
was concurrent with both occurrence of a polar blocking high aloft and rapid strengthening of the Siberian
high, triggering outbreaks of Arctic air over the Asian continent. Consequently, the influence of the Aleutian
region on this cold event (i.e., the downstream effect of the atmospheric circulation) played a critical role.
Simulation experiments demonstrate that Arctic atmospheric circulation conditions in the summer of 2011
significantly enhanced a negative feedback of Arctic sea ice loss on atmospheric circulation over the Aleutian
region and central Eurasia during the ensuing wintertime, which could have led to the favorable atmospheric
circulation that facilitated the occurrence of cold events resembling the one in 2012. This study also implies
that the Aleutian low and disturbances in the midlatitudes over the northeastern Pacific may provide pre-
cursors that could increase skill in predicting the intraseasonal evolution of extreme cold events over Eurasia.
1. Introduction
During the past decade, Eurasia has suffered frequent
cold winters and extreme weather events. For example,
Japan experienced extreme snowfalls in December
2005; China suffered rare persistent cold and freezing
rain events in January–February 2008; Eurasia was ex-
tremely cold during January–February 2012, along with
temperatures below the 2nd percentile in Belgrade and
Siberia (WMO Regional Climate Centres 2012). Ac-
cording tomedia reports, more than 700 Europeans died
from the extreme cold winter of 2011/12. The recent cold
winters and extremeweather events over EastAsia were
related to the reamplification of the East Asian winter
monsoon (Wang and Chen 2014). North America also
suffered extreme cold and heavy snowfalls in the two
consecutive winters of 2013/14 and 2014/15. In 2013/14
the Great Lakes were almost completely frozen for the
first time over the previous 35 years (Van Oldenborgh
et al. 2015), and in 2014/15 Boston broke its winter
snowfall record, with a total of 2.7m. These extreme
events were covered extensively by the media.
Extreme cold and heavy precipitation events affect
not only social and economic activities in the populous
region of the world, but they also influence convection
patterns in the low latitudes of East Asia, which further
induce atmospheric circulation anomalies across a broad
region (Chang and Lau 1980, 1982; Ding and
Krishnamurti 1987; Ding 1990; Zhang and Wang 1997;
Gong and Ho 2002; Takaya and Nakamura 2005a,b;Corresponding author: Bingyi Wu, [email protected]
1 OCTOBER 2017 WU ET AL . 7971
DOI: 10.1175/JCLI-D-16-0115.1
� 2017 American Meteorological Society. For information regarding reuse of this content and general copyright information, consult the AMS CopyrightPolicy (www.ametsoc.org/PUBSReuseLicenses).
Jeong et al. 2006). Some studies suggest that natural
variability is the primary cause of cold events in East
Asia. For example, Takaya and Nakamura (2005a,b)
identified two typical types of anomalous circulation
patterns that enhance the Siberian high and cause cold-
air outbreaks in East Asia. The first is the ‘‘wave train
(Atlantic origin)’’ type, which arises from the propaga-
tion of a quasi-stationary Rossby wave packet over
Eurasia, along with the corresponding anticyclonic
center that progresses slowly eastward. The second so-
called ‘‘Pacific origin’’ type describes a slow retrogres-
sion of the main anticyclonic center from the northern
North Pacific. A study by Park et al. (2008) investigated
the atmospheric circulation associated with two cold
surges during the 2005/06 winter, finding that the first
cold surge was induced by the Pacific-origin type, and
the second by the wave train type. Song et al. (2016)
analyzed the intraseasonal variation of the strength of
the East Asian trough. They found that prior to the
peaks of strong East Asian trough events, an upper-level
Rossby wave train propagated across northern Eurasia
into East Asia and the northwestern Pacific.
Further studies suggest that cold events in East Asia
may also be intensified by large-scale circulation
anomalies (Jeong and Ho 2005; Park et al. 2011) as well
as by remote forcing, such as sea surface temperatures
(SSTs) (Zhang and Wang 1997; Chen et al. 2004) and
Arctic sea ice loss (Wu et al. 2013; Tang et al. 2013;
Zhang et al. 2016). For example, Park et al. (2011) in-
vestigated the relationship between East Asian cold
surges and the Arctic Oscillation (AO) index. They di-
vided East Asian cold surges into those associated with
wave trains and those caused by anticyclonic blocks.
While the blocking type generally occurs during the
negative phase of the AO, the wave train type occurs
during both phases of the AO. Chen et al. (2004) found
that the North Pacific ENSO short wave train influences
cold surges, while Tang et al. (2013) linkedArctic sea ice
loss with the occurrence of extreme cold events in the
northern continents. It has also been suggested that
autumn Arctic sea ice loss promotes the occurrence of
extreme negative phases of the tripole wind pattern
during winter over Eurasia, which leads to cold-air
outbreaks in East Asia (Wu et al. 2013).
The main goal of this study is to improve un-
derstanding of the causes and evolution of extreme cold
spells in East Asia. We take two approaches: the first is a
case study, in which we investigate dominant features of
the intraseasonal evolution of winter atmospheric cir-
culation anomalies associated with a cold event over the
Asian continent from 17 January to 1 February 2012.
This event lasted more than two weeks, distinguishing it
from a short-lived synoptic cold surge process (Chang
and Lau 1980, 1982). Second, we explore possible causes
of similar cold events using model simulations forced by
observed Arctic sea ice concentrations combined with
different atmospheric initial conditions. Our results in-
dicate that 1) the impact of atmospheric circulation
anomalies over the northeastern Pacific–Aleutian re-
gion on Asian cold events (i.e., the downstream effect)
plays a critical role; and 2) the combined impacts of both
Arctic sea ice loss from August 2011 to February 2012
and the Arctic atmospheric circulation condition in the
summer of 2011 were the main causes of this particular
cold event.
2. Data and methods
The following datasets were used in this study:
1) monthly Arctic sea ice concentrations (SICs) and
SSTs from 1979 to 2013 on a 18 3 18 grid, obtained from
the British Atmospheric Data Centre (BADC; Hadley
Centre for Climate Prediction and Research 2006);
2) the daily sea level pressure (SLP), surface air tem-
peratures (SATs), 10-m surface winds, and 1000- and
500-hPa geopotential heights from 1 January 1979 to
31 December 2012, obtained from the NCEP–NCAR
reanalysis (http://iridl.ldeo.columbia.edu/SOURCES/
NOAA/NCEP-NCAR/CDAS-1/DAILY/).
In this study, three indices are calculated by using
winter (1 December–28 February of the next year; e.g.,
the winter of 2011/12 refers toDecember 2011–February
2012) daily SLP and SAT data: the Siberian high index
(SHI), the SAT index (SATI), and the Aleutian low
index (ALI). The SHI (SATI) is defined as the re-
gionally averaged daily SLP (SAT) in the region boun-
ded by 408–608N, 808–1208E. The ALI is the regionally
averaged daily SLP in the region 508–708N, 1808–1508W.
To explore a possible reason for the Asian cold event
in January–February 2012, simulation experiments
forced by observed Arctic SICs were conducted using
the ECHAM5 (Roeckner et al. 2003) model (T63
spectral resolution and 19 pressure levels).
3. Atmospheric circulation anomalies associatedwith the 2012 cold event
In the winter of 2011/12, the seasonal-mean SHI was
1033.5 hPa, the highest value of 33 winters from 1979 to
2012. Persistent low temperatures over the Asian con-
tinent occurred from 17 January to 1 February, with a
consecutive daily SATI below minus one standard de-
viation (21s; Fig. 1a). During 11–16 January the ALI
rapidly weakened from 1005 to 1040hPa, then quickly
returned to 1005 hPa during 17–21 January, corre-
sponding to the rapid strengthening of the Siberian high
7972 JOURNAL OF CL IMATE VOLUME 30
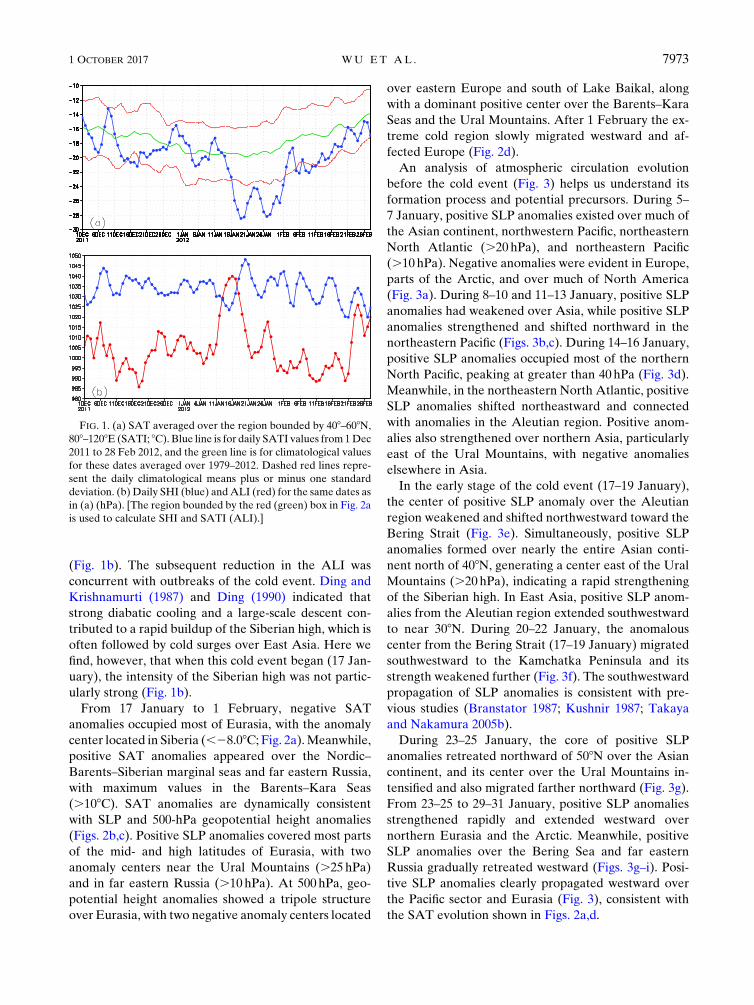
(Fig. 1b). The subsequent reduction in the ALI was
concurrent with outbreaks of the cold event. Ding and
Krishnamurti (1987) and Ding (1990) indicated that
strong diabatic cooling and a large-scale descent con-
tributed to a rapid buildup of the Siberian high, which is
often followed by cold surges over East Asia. Here we
find, however, that when this cold event began (17 Jan-
uary), the intensity of the Siberian high was not partic-
ularly strong (Fig. 1b).
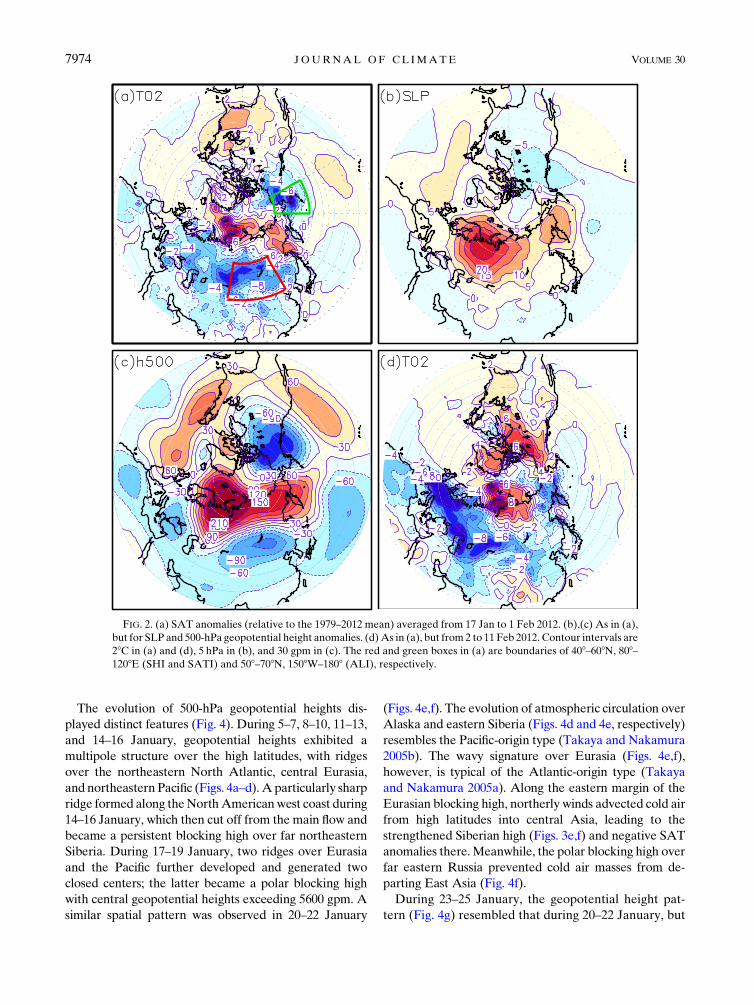
From 17 January to 1 February, negative SAT
anomalies occupied most of Eurasia, with the anomaly
center located in Siberia (,28.08C; Fig. 2a).Meanwhile,
positive SAT anomalies appeared over the Nordic–
Barents–Siberian marginal seas and far eastern Russia,
with maximum values in the Barents–Kara Seas
(.108C). SAT anomalies are dynamically consistent
with SLP and 500-hPa geopotential height anomalies
(Figs. 2b,c). Positive SLP anomalies covered most parts
of the mid- and high latitudes of Eurasia, with two
anomaly centers near the Ural Mountains (.25hPa)
and in far eastern Russia (.10hPa). At 500hPa, geo-
potential height anomalies showed a tripole structure
over Eurasia, with two negative anomaly centers located
over eastern Europe and south of Lake Baikal, along
with a dominant positive center over the Barents–Kara
Seas and the Ural Mountains. After 1 February the ex-
treme cold region slowly migrated westward and af-
fected Europe (Fig. 2d).
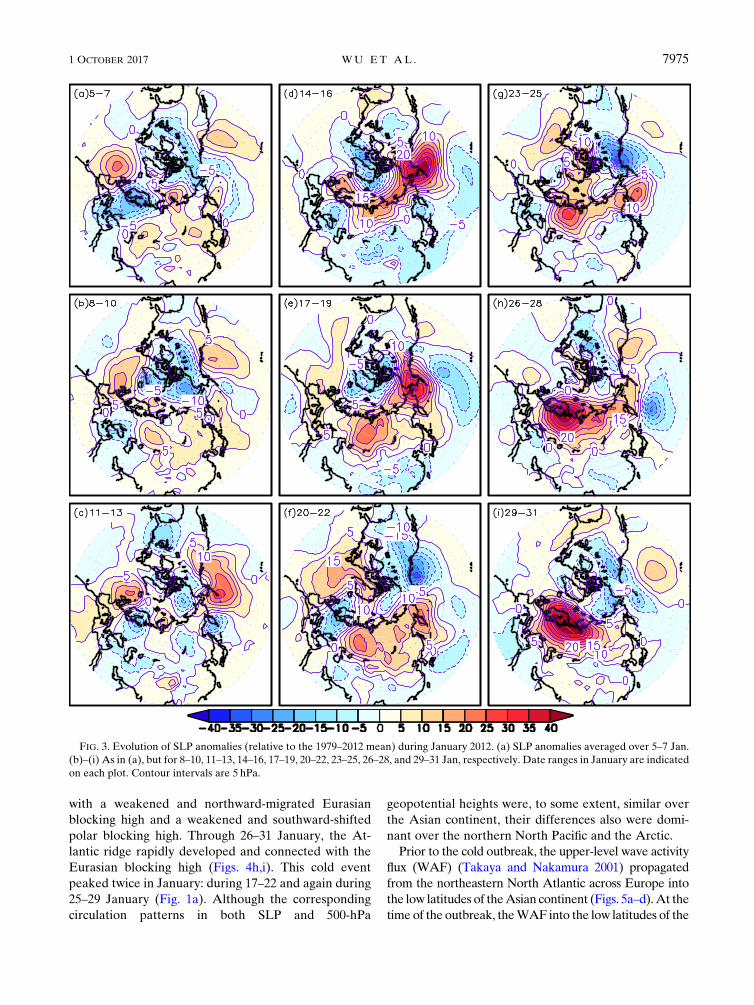
An analysis of atmospheric circulation evolution
before the cold event (Fig. 3) helps us understand its
formation process and potential precursors. During 5–
7 January, positive SLP anomalies existed over much of
the Asian continent, northwestern Pacific, northeastern
North Atlantic (.20 hPa), and northeastern Pacific
(.10hPa). Negative anomalies were evident in Europe,
parts of the Arctic, and over much of North America
(Fig. 3a). During 8–10 and 11–13 January, positive SLP
anomalies had weakened over Asia, while positive SLP
anomalies strengthened and shifted northward in the
northeastern Pacific (Figs. 3b,c). During 14–16 January,
positive SLP anomalies occupied most of the northern
North Pacific, peaking at greater than 40hPa (Fig. 3d).
Meanwhile, in the northeastern North Atlantic, positive
SLP anomalies shifted northeastward and connected
with anomalies in the Aleutian region. Positive anom-
alies also strengthened over northern Asia, particularly
east of the Ural Mountains, with negative anomalies
elsewhere in Asia.
In the early stage of the cold event (17–19 January),
the center of positive SLP anomaly over the Aleutian
region weakened and shifted northwestward toward the
Bering Strait (Fig. 3e). Simultaneously, positive SLP
anomalies formed over nearly the entire Asian conti-
nent north of 408N, generating a center east of the Ural
Mountains (.20hPa), indicating a rapid strengthening
of the Siberian high. In East Asia, positive SLP anom-
alies from the Aleutian region extended southwestward
to near 308N. During 20–22 January, the anomalous
center from the Bering Strait (17–19 January) migrated
southwestward to the Kamchatka Peninsula and its
strength weakened further (Fig. 3f). The southwestward
propagation of SLP anomalies is consistent with pre-
vious studies (Branstator 1987; Kushnir 1987; Takaya
and Nakamura 2005b).
During 23–25 January, the core of positive SLP
anomalies retreated northward of 508N over the Asian
continent, and its center over the Ural Mountains in-
tensified and also migrated farther northward (Fig. 3g).
From 23–25 to 29–31 January, positive SLP anomalies
strengthened rapidly and extended westward over
northern Eurasia and the Arctic. Meanwhile, positive
SLP anomalies over the Bering Sea and far eastern
Russia gradually retreated westward (Figs. 3g–i). Posi-
tive SLP anomalies clearly propagated westward over
the Pacific sector and Eurasia (Fig. 3), consistent with
the SAT evolution shown in Figs. 2a,d.
FIG. 1. (a) SAT averaged over the region bounded by 408–608N,
808–1208E (SATI; 8C). Blue line is for daily SATI values from 1Dec
2011 to 28 Feb 2012, and the green line is for climatological values
for these dates averaged over 1979–2012. Dashed red lines repre-
sent the daily climatological means plus or minus one standard
deviation. (b) Daily SHI (blue) andALI (red) for the same dates as
in (a) (hPa). [The region bounded by the red (green) box in Fig. 2a
is used to calculate SHI and SATI (ALI).]
1 OCTOBER 2017 WU ET AL . 7973
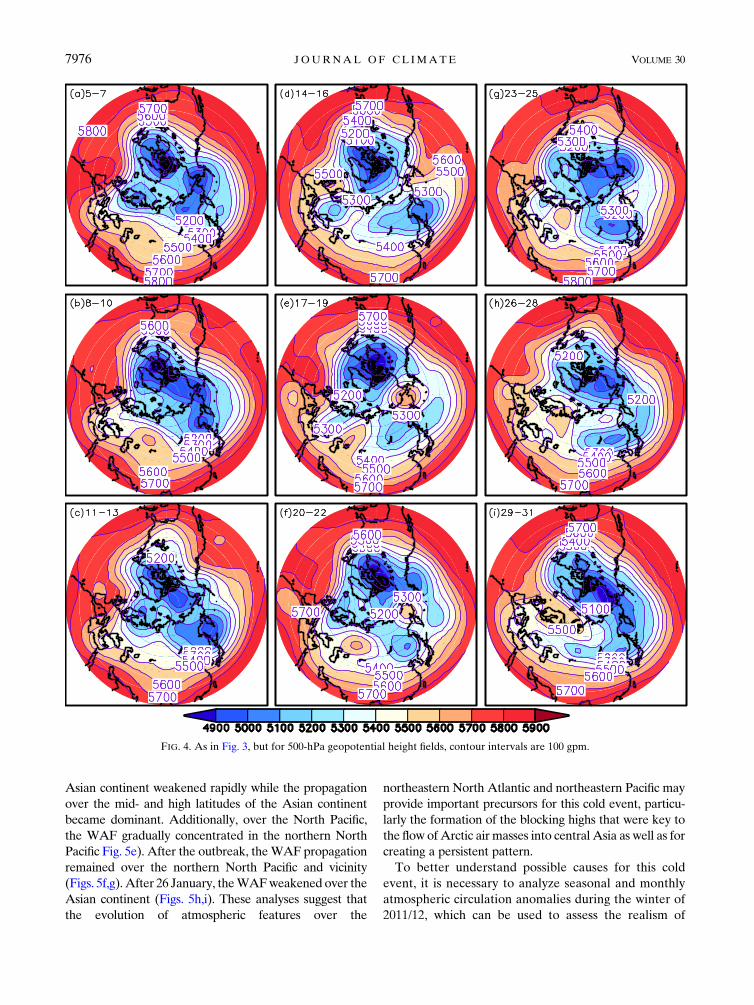
The evolution of 500-hPa geopotential heights dis-
played distinct features (Fig. 4). During 5–7, 8–10, 11–13,
and 14–16 January, geopotential heights exhibited a
multipole structure over the high latitudes, with ridges
over the northeastern North Atlantic, central Eurasia,
and northeastern Pacific (Figs. 4a–d). A particularly sharp
ridge formed along theNorthAmericanwest coast during
14–16 January, which then cut off from the main flow and
became a persistent blocking high over far northeastern
Siberia. During 17–19 January, two ridges over Eurasia
and the Pacific further developed and generated two
closed centers; the latter became a polar blocking high
with central geopotential heights exceeding 5600 gpm. A
similar spatial pattern was observed in 20–22 January
(Figs. 4e,f). The evolution of atmospheric circulation over
Alaska and eastern Siberia (Figs. 4d and 4e, respectively)
resembles the Pacific-origin type (Takaya and Nakamura
2005b). The wavy signature over Eurasia (Figs. 4e,f),
however, is typical of the Atlantic-origin type (Takaya
and Nakamura 2005a). Along the eastern margin of the
Eurasian blocking high, northerly winds advected cold air
from high latitudes into central Asia, leading to the
strengthened Siberian high (Figs. 3e,f) and negative SAT
anomalies there.Meanwhile, the polar blocking high over
far eastern Russia prevented cold air masses from de-
parting East Asia (Fig. 4f).
During 23–25 January, the geopotential height pat-
tern (Fig. 4g) resembled that during 20–22 January, but
FIG. 2. (a) SAT anomalies (relative to the 1979–2012 mean) averaged from 17 Jan to 1 Feb 2012. (b),(c) As in (a),
but for SLP and 500-hPa geopotential height anomalies. (d)As in (a), but from 2 to 11 Feb 2012. Contour intervals are
28C in (a) and (d), 5 hPa in (b), and 30 gpm in (c). The red and green boxes in (a) are boundaries of 408–608N, 808–1208E (SHI and SATI) and 508–708N, 1508W–1808 (ALI), respectively.
7974 JOURNAL OF CL IMATE VOLUME 30
with a weakened and northward-migrated Eurasian
blocking high and a weakened and southward-shifted
polar blocking high. Through 26–31 January, the At-
lantic ridge rapidly developed and connected with the
Eurasian blocking high (Figs. 4h,i). This cold event
peaked twice in January: during 17–22 and again during
25–29 January (Fig. 1a). Although the corresponding
circulation patterns in both SLP and 500-hPa
geopotential heights were, to some extent, similar over
the Asian continent, their differences also were domi-
nant over the northern North Pacific and the Arctic.
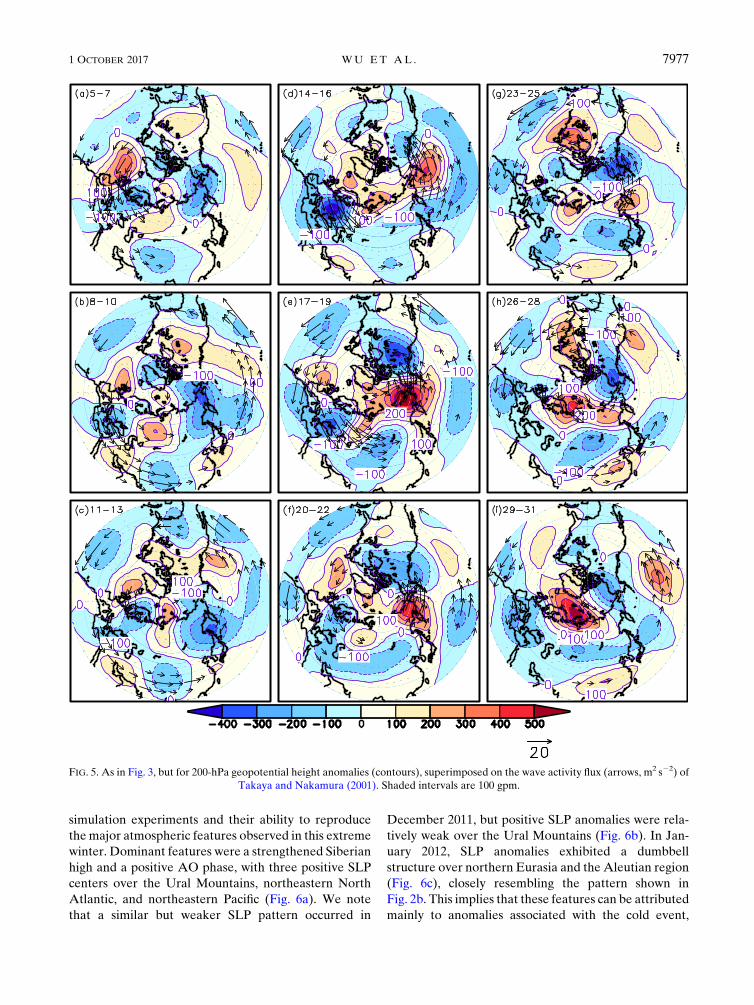
Prior to the cold outbreak, the upper-level wave activity
flux (WAF) (Takaya and Nakamura 2001) propagated
from the northeastern North Atlantic across Europe into
the low latitudes of theAsian continent (Figs. 5a–d).At the
time of the outbreak, theWAF into the low latitudes of the
FIG. 3. Evolution of SLP anomalies (relative to the 1979–2012 mean) during January 2012. (a) SLP anomalies averaged over 5–7 Jan.
(b)–(i) As in (a), but for 8–10, 11–13, 14–16, 17–19, 20–22, 23–25, 26–28, and 29–31 Jan, respectively. Date ranges in January are indicated
on each plot. Contour intervals are 5 hPa.
1 OCTOBER 2017 WU ET AL . 7975
Asian continent weakened rapidly while the propagation
over the mid- and high latitudes of the Asian continent
became dominant. Additionally, over the North Pacific,
the WAF gradually concentrated in the northern North
Pacific Fig. 5e). After the outbreak, theWAF propagation
remained over the northern North Pacific and vicinity
(Figs. 5f,g). After 26 January, theWAFweakened over the
Asian continent (Figs. 5h,i). These analyses suggest that
the evolution of atmospheric features over the
northeastern North Atlantic and northeastern Pacific may
provide important precursors for this cold event, particu-
larly the formation of the blocking highs that were key to
the flow ofArctic air masses into central Asia as well as for
creating a persistent pattern.
To better understand possible causes for this cold
event, it is necessary to analyze seasonal and monthly
atmospheric circulation anomalies during the winter of
2011/12, which can be used to assess the realism of
FIG. 4. As in Fig. 3, but for 500-hPa geopotential height fields, contour intervals are 100 gpm.
7976 JOURNAL OF CL IMATE VOLUME 30
simulation experiments and their ability to reproduce
themajor atmospheric features observed in this extreme
winter. Dominant features were a strengthened Siberian
high and a positive AO phase, with three positive SLP
centers over the Ural Mountains, northeastern North
Atlantic, and northeastern Pacific (Fig. 6a). We note
that a similar but weaker SLP pattern occurred in
December 2011, but positive SLP anomalies were rela-
tively weak over the Ural Mountains (Fig. 6b). In Jan-
uary 2012, SLP anomalies exhibited a dumbbell
structure over northern Eurasia and the Aleutian region
(Fig. 6c), closely resembling the pattern shown in
Fig. 2b. This implies that these features can be attributed
mainly to anomalies associated with the cold event,
FIG. 5. As in Fig. 3, but for 200-hPa geopotential height anomalies (contours), superimposed on the wave activity flux (arrows, m2 s22) of
Takaya and Nakamura (2001). Shaded intervals are 100 gpm.
1 OCTOBER 2017 WU ET AL . 7977
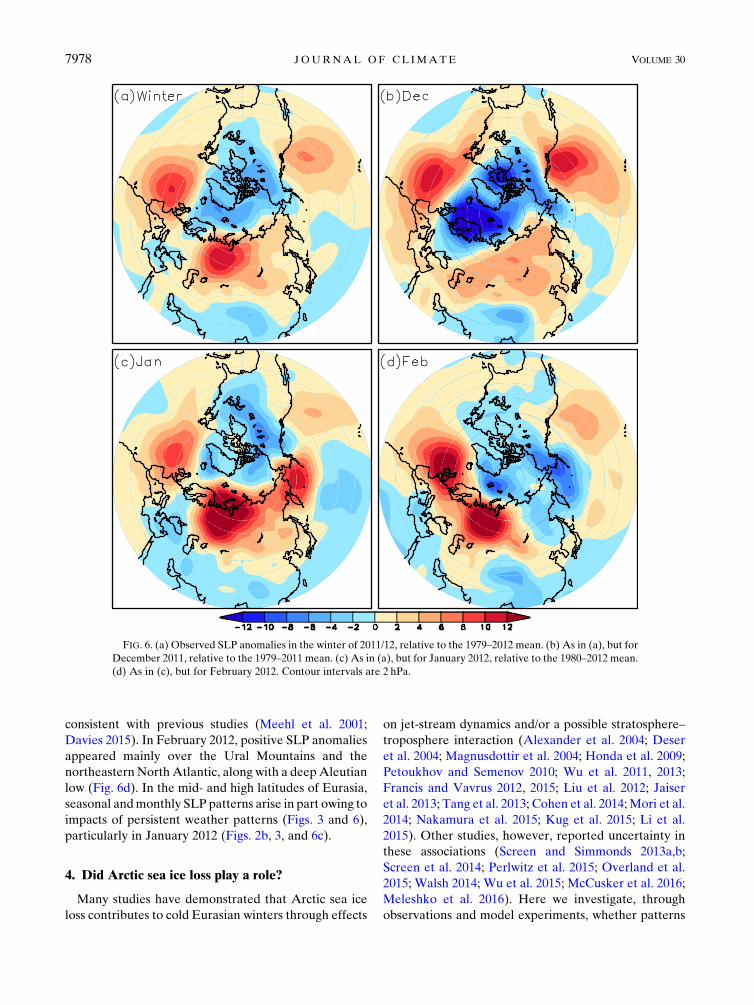
consistent with previous studies (Meehl et al. 2001;
Davies 2015). In February 2012, positive SLP anomalies
appeared mainly over the Ural Mountains and the
northeastern NorthAtlantic, along with a deepAleutian
low (Fig. 6d). In the mid- and high latitudes of Eurasia,
seasonal andmonthly SLP patterns arise in part owing to
impacts of persistent weather patterns (Figs. 3 and 6),
particularly in January 2012 (Figs. 2b, 3, and 6c).
4. Did Arctic sea ice loss play a role?
Many studies have demonstrated that Arctic sea ice
loss contributes to cold Eurasian winters through effects
on jet-stream dynamics and/or a possible stratosphere–
troposphere interaction (Alexander et al. 2004; Deser
et al. 2004; Magnusdottir et al. 2004; Honda et al. 2009;
Petoukhov and Semenov 2010; Wu et al. 2011, 2013;
Francis and Vavrus 2012, 2015; Liu et al. 2012; Jaiser
et al. 2013; Tang et al. 2013; Cohen et al. 2014; Mori et al.
2014; Nakamura et al. 2015; Kug et al. 2015; Li et al.
2015). Other studies, however, reported uncertainty in
these associations (Screen and Simmonds 2013a,b;
Screen et al. 2014; Perlwitz et al. 2015; Overland et al.
2015; Walsh 2014; Wu et al. 2015; McCusker et al. 2016;
Meleshko et al. 2016). Here we investigate, through
observations and model experiments, whether patterns
FIG. 6. (a) Observed SLP anomalies in the winter of 2011/12, relative to the 1979–2012 mean. (b) As in (a), but for
December 2011, relative to the 1979–2011 mean. (c) As in (a), but for January 2012, relative to the 1980–2012 mean.
(d) As in (c), but for February 2012. Contour intervals are 2 hPa.
7978 JOURNAL OF CL IMATE VOLUME 30
of sea ice loss from summer to the following winter may
have contributed to the atmospheric evolution that led
to the 2012 cold event. Consequently, it is necessary to
understand the main features of the summer atmo-
spheric circulation in 2011 over the Arctic.
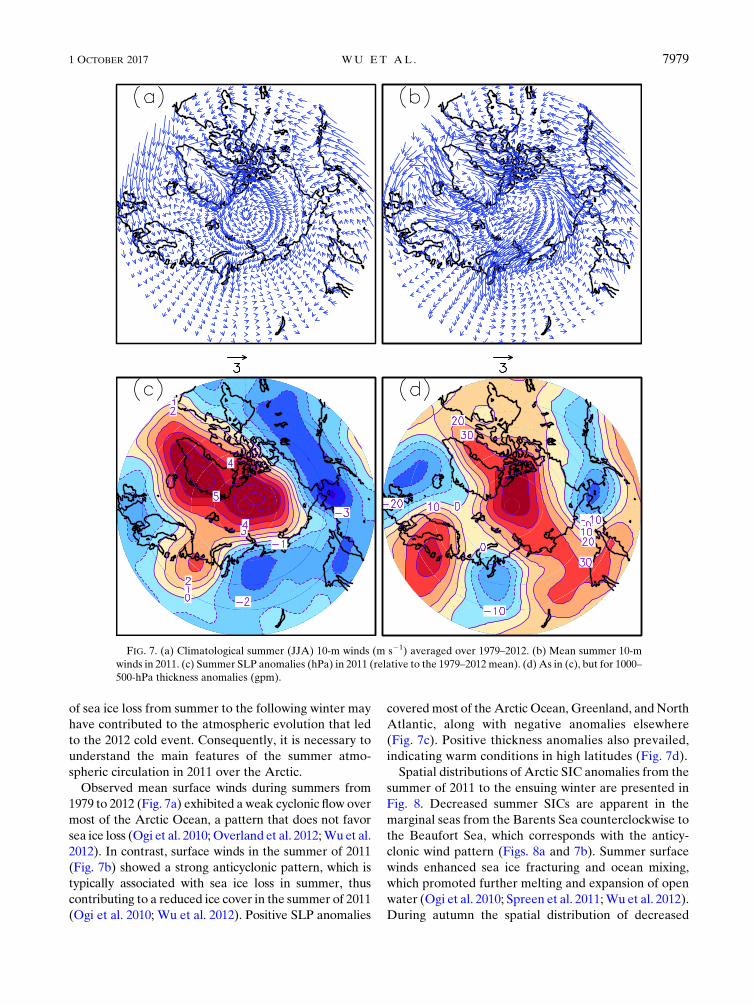
Observed mean surface winds during summers from
1979 to 2012 (Fig. 7a) exhibited a weak cyclonic flow over
most of the Arctic Ocean, a pattern that does not favor
sea ice loss (Ogi et al. 2010; Overland et al. 2012;Wu et al.
2012). In contrast, surface winds in the summer of 2011
(Fig. 7b) showed a strong anticyclonic pattern, which is
typically associated with sea ice loss in summer, thus
contributing to a reduced ice cover in the summer of 2011
(Ogi et al. 2010; Wu et al. 2012). Positive SLP anomalies
covered most of the Arctic Ocean, Greenland, andNorth
Atlantic, along with negative anomalies elsewhere
(Fig. 7c). Positive thickness anomalies also prevailed,
indicating warm conditions in high latitudes (Fig. 7d).
Spatial distributions of Arctic SIC anomalies from the
summer of 2011 to the ensuing winter are presented in
Fig. 8. Decreased summer SICs are apparent in the
marginal seas from the Barents Sea counterclockwise to
the Beaufort Sea, which corresponds with the anticy-
clonic wind pattern (Figs. 8a and 7b). Summer surface
winds enhanced sea ice fracturing and ocean mixing,
which promoted further melting and expansion of open
water (Ogi et al. 2010; Spreen et al. 2011;Wu et al. 2012).
During autumn the spatial distribution of decreased
FIG. 7. (a) Climatological summer (JJA) 10-m winds (m s21) averaged over 1979–2012. (b) Mean summer 10-m
winds in 2011. (c) Summer SLP anomalies (hPa) in 2011 (relative to the 1979–2012 mean). (d) As in (c), but for 1000–
500-hPa thickness anomalies (gpm).
1 OCTOBER 2017 WU ET AL . 7979
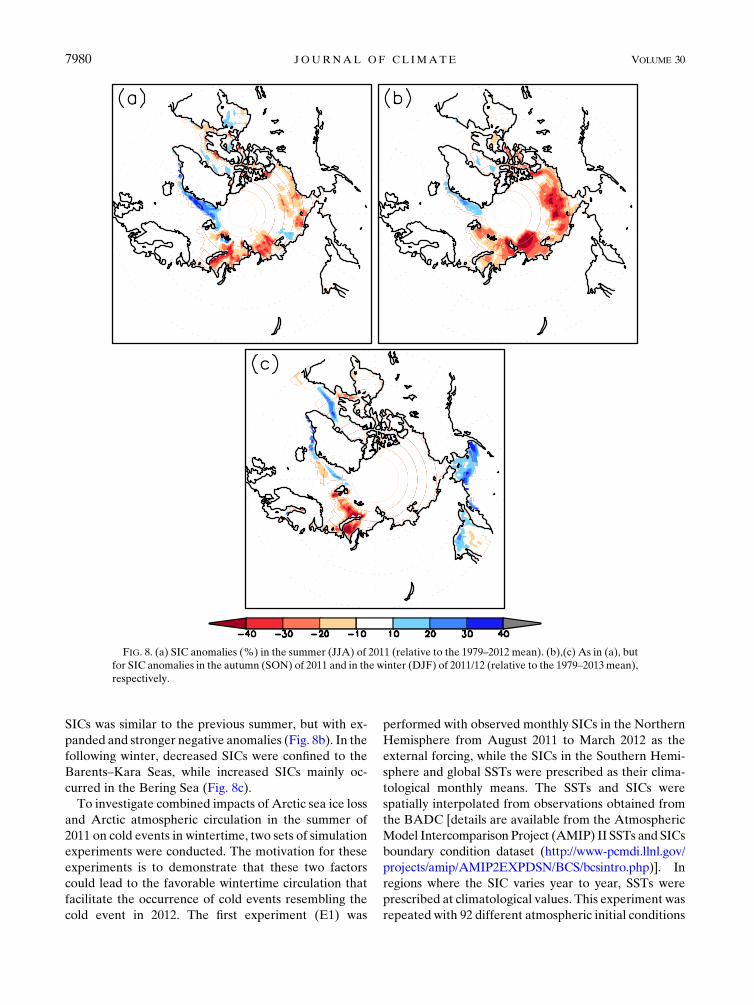
SICs was similar to the previous summer, but with ex-
panded and stronger negative anomalies (Fig. 8b). In the
following winter, decreased SICs were confined to the
Barents–Kara Seas, while increased SICs mainly oc-
curred in the Bering Sea (Fig. 8c).
To investigate combined impacts of Arctic sea ice loss
and Arctic atmospheric circulation in the summer of
2011 on cold events in wintertime, two sets of simulation
experiments were conducted. The motivation for these
experiments is to demonstrate that these two factors
could lead to the favorable wintertime circulation that
facilitate the occurrence of cold events resembling the
cold event in 2012. The first experiment (E1) was
performed with observed monthly SICs in the Northern
Hemisphere from August 2011 to March 2012 as the
external forcing, while the SICs in the Southern Hemi-
sphere and global SSTs were prescribed as their clima-
tological monthly means. The SSTs and SICs were
spatially interpolated from observations obtained from
the BADC [details are available from the Atmospheric
Model Intercomparison Project (AMIP) II SSTs and SICs
boundary condition dataset (http://www-pcmdi.llnl.gov/
projects/amip/AMIP2EXPDSN/BCS/bcsintro.php)]. In
regions where the SIC varies year to year, SSTs were
prescribed at climatological values. This experiment was
repeated with 92 different atmospheric initial conditions
FIG. 8. (a) SIC anomalies (%) in the summer (JJA) of 2011 (relative to the 1979–2012 mean). (b),(c) As in (a), but
for SIC anomalies in the autumn (SON) of 2011 and in the winter (DJF) of 2011/12 (relative to the 1979–2013mean),
respectively.
7980 JOURNAL OF CL IMATE VOLUME 30
during summer (JJA) 2011 obtained from spatially in-
terpolated daily NCEP–NCAR reanalysis values. Vari-
ables include surface pressure, air temperature,
divergence, vorticity, and specific humidity.
The second experiment (E2) was carried out by pre-
scribing observed monthly SICs in the Northern Hemi-
sphere from January 1978 to December 2013 as the
external forcing. The SICs in the Southern Hemisphere
and global SSTs were the same as in E1. This experiment
was repeated with 10 different atmospheric initial con-
ditions that were derived from a control run, which
contained 60 years of simulations with SICs and SSTs
prescribed as their climatological monthly means. Thus,
the model output in E2 contained 350 winters
(31 500 days). Differences between these two experi-
ments will illuminate roles of different initial atmo-
spheric conditions in influencing the atmosphere’s
response to sea ice conditions during winter 2011/12.
Can the model capture the major seasonal and
monthly atmospheric features observed in the winter of
2011/12? This question is critical for determining
whether Arctic sea ice loss contributed to the cold event.
Our analysis focuses on SLP responses during winter-
time because the southward outbreak of polar air masses
is closely associated with winter SLP anomalies. Simu-
lated (E1) SLP anomalies during winter (Fig. 9a) feature
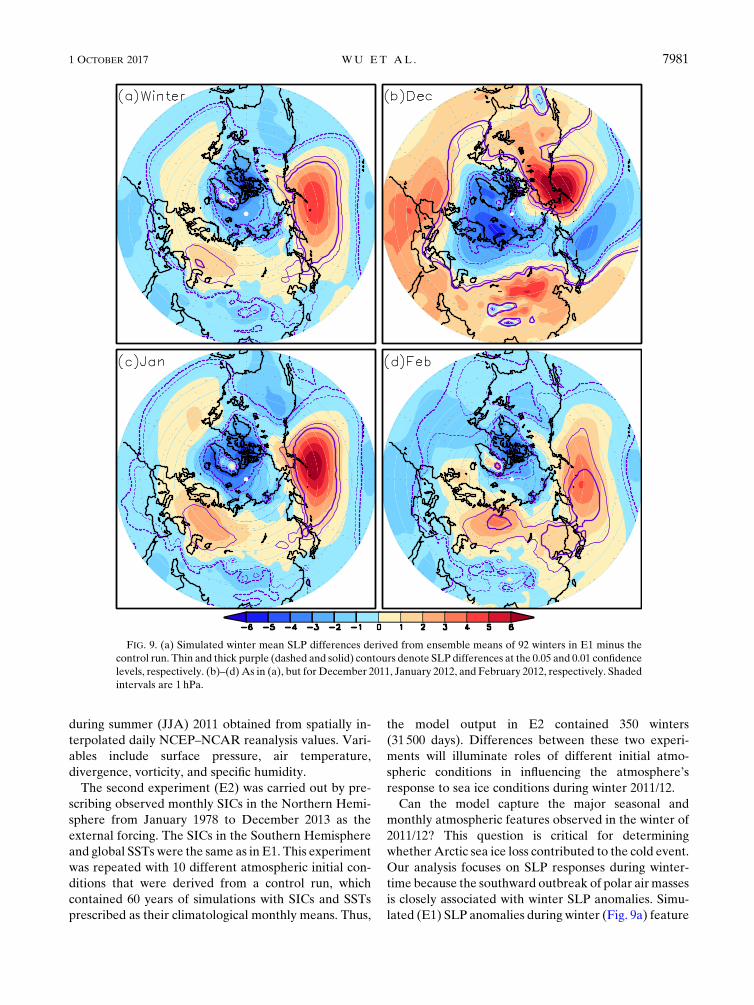
FIG. 9. (a) Simulated winter mean SLP differences derived from ensemble means of 92 winters in E1 minus the
control run. Thin and thick purple (dashed and solid) contours denote SLP differences at the 0.05 and 0.01 confidence
levels, respectively. (b)–(d) As in (a), but for December 2011, January 2012, and February 2012, respectively. Shaded
intervals are 1 hPa.
1 OCTOBER 2017 WU ET AL . 7981
positive values in a belt from the east coast of North
America across the northern North Atlantic and
Eurasia to the northern North Pacific, with centers
over the Aleutian region (.4 hPa) and central Eurasia
north of the Caspian Sea (.1 hPa). Meanwhile, neg-
ative SLP anomalies prevail over the Arctic, North
America, and south of the positive belt. This pattern is
somewhat reminiscent of the positive phase of the
AO, and is consistent with observed SLP anomalies
during winter 2011/12 (Fig. 6a). Simulated positive
SLP anomalies over central Eurasia and the northern
North Atlantic are weaker than in observations, while
anomalies over the North Pacific are stronger. During
the month of December 2011, simulated SLP anoma-
lies closely resemble observations (Figs. 9b vs 6b).
SLP responses in January 2012 closely resemble
winter-mean responses spatially, but feature large
amplitudes (Fig. 9c), consistent with observations
(Figs. 6a,c). In February 2012, simulated positive SLP
anomalies exhibit a ‘‘V’’ structure extending across
northern Eurasia, along the East Asian coast, and
across the North Pacific, somewhat similar to obser-
vations (Figs. 9d vs 6d). The E1 simulations, therefore,
capture most major features in the observed winter
SLP patterns, implying that Arctic SIC anomalies
from August 2011 to February 2012, together with
specific atmospheric initial conditions in the pre-
ceding summer, contributed to the SLP anomalies
observed during the winter of 2011/12. In particular,
the E1 clearly indicates that a persistently weakened
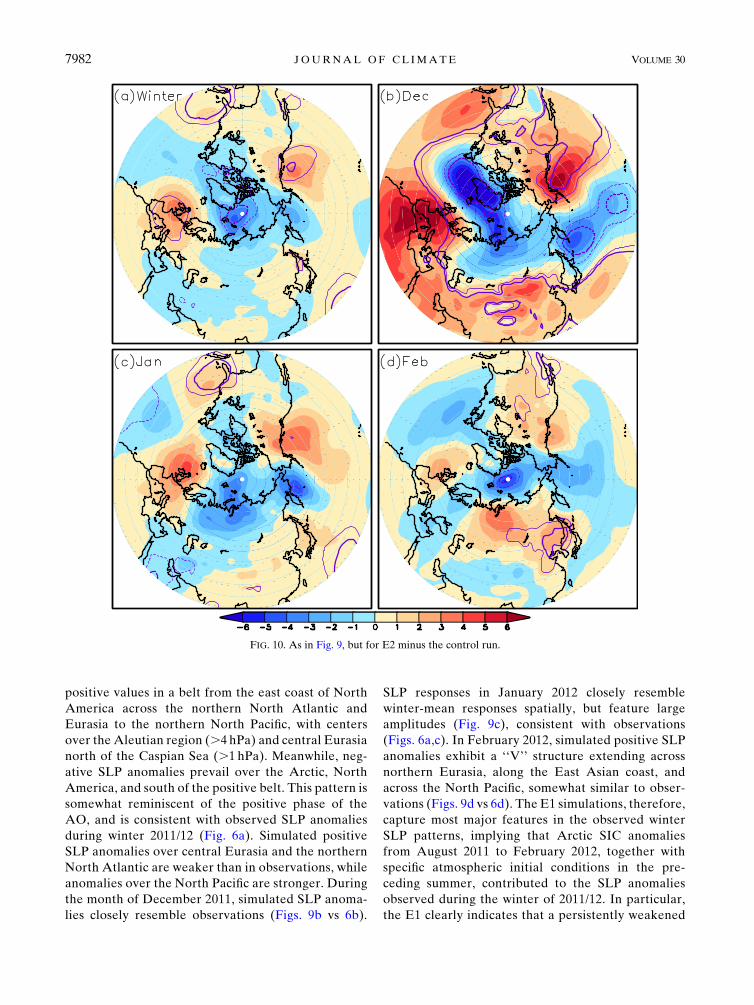
FIG. 10. As in Fig. 9, but for E2 minus the control run.
7982 JOURNAL OF CL IMATE VOLUME 30
Aleutian low is a dominant feature in winter SLP re-
sponses to sea ice loss, which is likely due to the ac-
cumulated impact of individual weather systems.
SLP anomalies from the E2 simulations for winter
2011/12 clearly differ from those in E1 because of the
different summer atmospheric conditions (Figs. 10 vs 9). In
contrast to E1, the E2 response does not exhibit a signifi-
cantly weakened Aleutian low in any winter month. The
different response suggests that ice conditions fromAugust
2011 to February 2012 and initial conditions of the atmo-
sphere led to a response that favors a strengthened Sibe-
rian high and weakened Aleutian low, which favor the
occurrence of cold-air outbreaks over East Asia.
We now focus on simulations of the ALI. Output
from the E1 includes 92 winters from 1 December to
28 February. The winter daily ALI was calculated and
then ranked in order from the maximum to the mini-
mum (i.e., from anomalously weak to strong Aleutian
low). An ALI $ 1032.71 hPa corresponds to patterns
with the probability of occurrence less than 10% (i.e.,
an extremely weakened Aleutian low). This analysis
was repeated for the E2, with the result that the
probability of occurrence less than 10% corresponds
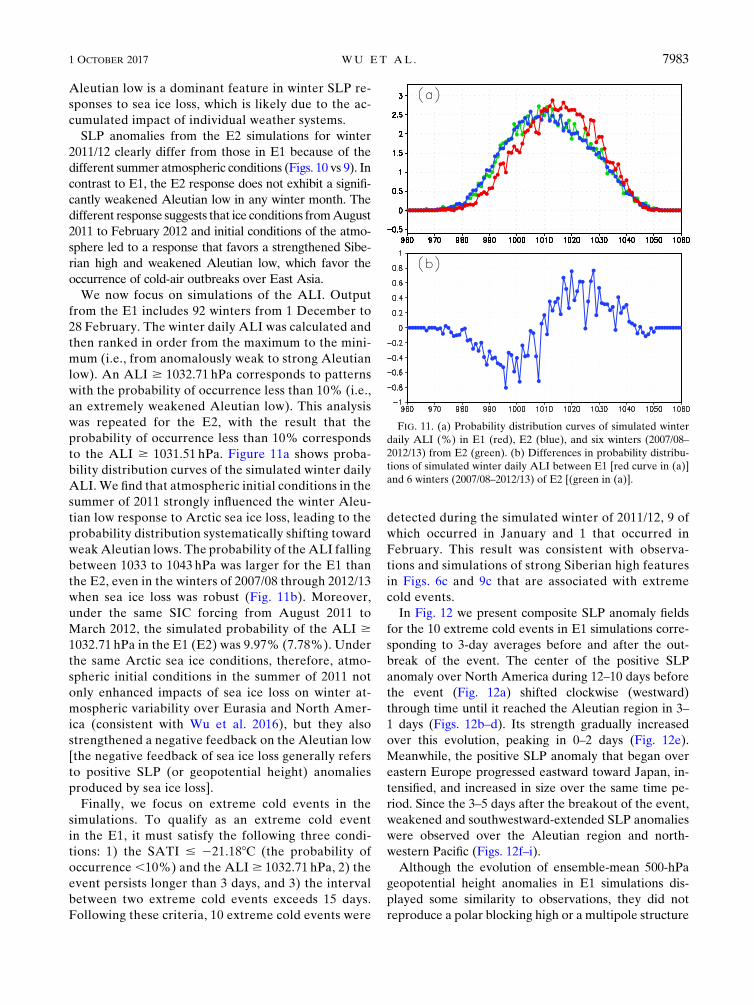
to the ALI $ 1031.51 hPa. Figure 11a shows proba-
bility distribution curves of the simulated winter daily
ALI. We find that atmospheric initial conditions in the
summer of 2011 strongly influenced the winter Aleu-
tian low response to Arctic sea ice loss, leading to the
probability distribution systematically shifting toward
weakAleutian lows. The probability of the ALI falling
between 1033 to 1043 hPa was larger for the E1 than
the E2, even in the winters of 2007/08 through 2012/13
when sea ice loss was robust (Fig. 11b). Moreover,
under the same SIC forcing from August 2011 to
March 2012, the simulated probability of the ALI $
1032.71 hPa in the E1 (E2) was 9.97% (7.78%). Under
the same Arctic sea ice conditions, therefore, atmo-
spheric initial conditions in the summer of 2011 not
only enhanced impacts of sea ice loss on winter at-
mospheric variability over Eurasia and North Amer-
ica (consistent with Wu et al. 2016), but they also
strengthened a negative feedback on the Aleutian low
[the negative feedback of sea ice loss generally refers
to positive SLP (or geopotential height) anomalies
produced by sea ice loss].
Finally, we focus on extreme cold events in the
simulations. To qualify as an extreme cold event
in the E1, it must satisfy the following three condi-
tions: 1) the SATI # 221.188C (the probability of
occurrence ,10%) and the ALI$ 1032.71 hPa, 2) the
event persists longer than 3 days, and 3) the interval
between two extreme cold events exceeds 15 days.
Following these criteria, 10 extreme cold events were
detected during the simulated winter of 2011/12, 9 of
which occurred in January and 1 that occurred in
February. This result was consistent with observa-
tions and simulations of strong Siberian high features
in Figs. 6c and 9c that are associated with extreme
cold events.
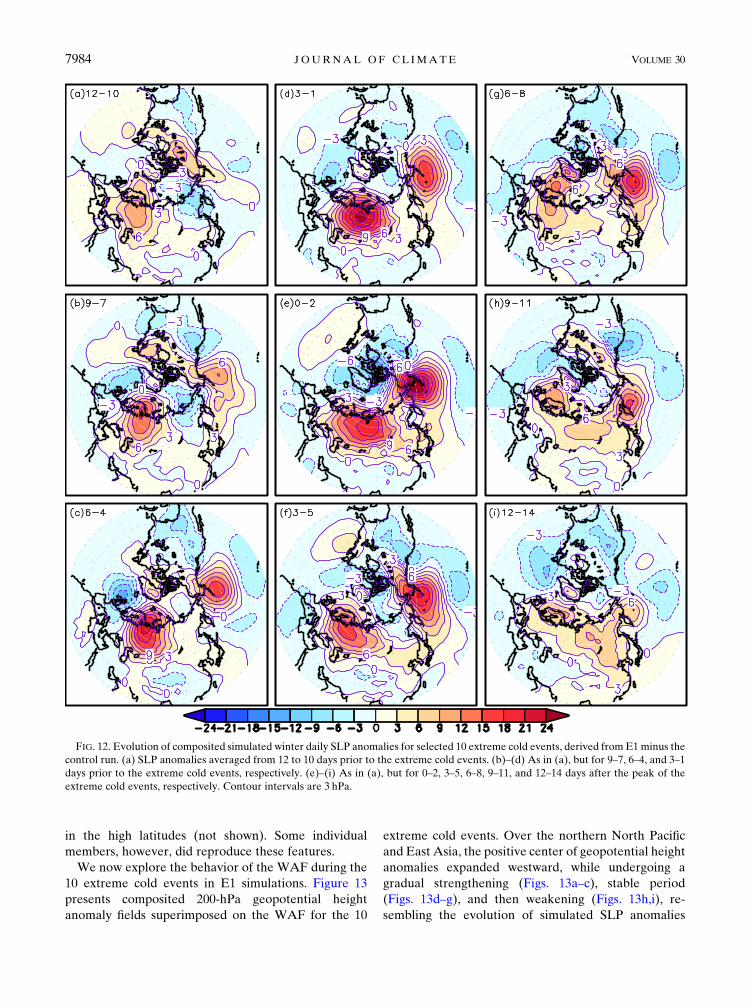
In Fig. 12 we present composite SLP anomaly fields
for the 10 extreme cold events in E1 simulations corre-
sponding to 3-day averages before and after the out-
break of the event. The center of the positive SLP
anomaly over North America during 12–10 days before
the event (Fig. 12a) shifted clockwise (westward)
through time until it reached the Aleutian region in 3–
1 days (Figs. 12b–d). Its strength gradually increased
over this evolution, peaking in 0–2 days (Fig. 12e).
Meanwhile, the positive SLP anomaly that began over
eastern Europe progressed eastward toward Japan, in-
tensified, and increased in size over the same time pe-
riod. Since the 3–5 days after the breakout of the event,
weakened and southwestward-extended SLP anomalies
were observed over the Aleutian region and north-
western Pacific (Figs. 12f–i).
Although the evolution of ensemble-mean 500-hPa
geopotential height anomalies in E1 simulations dis-
played some similarity to observations, they did not
reproduce a polar blocking high or a multipole structure
FIG. 11. (a) Probability distribution curves of simulated winter
daily ALI (%) in E1 (red), E2 (blue), and six winters (2007/08–
2012/13) from E2 (green). (b) Differences in probability distribu-
tions of simulated winter daily ALI between E1 [red curve in (a)]
and 6 winters (2007/08–2012/13) of E2 [(green in (a)].
1 OCTOBER 2017 WU ET AL . 7983
in the high latitudes (not shown). Some individual
members, however, did reproduce these features.
We now explore the behavior of the WAF during the
10 extreme cold events in E1 simulations. Figure 13
presents composited 200-hPa geopotential height
anomaly fields superimposed on the WAF for the 10
extreme cold events. Over the northern North Pacific
and East Asia, the positive center of geopotential height
anomalies expanded westward, while undergoing a
gradual strengthening (Figs. 13a–c), stable period
(Figs. 13d–g), and then weakening (Figs. 13h,i), re-
sembling the evolution of simulated SLP anomalies
FIG. 12. Evolution of composited simulated winter daily SLP anomalies for selected 10 extreme cold events, derived from E1minus the
control run. (a) SLP anomalies averaged from 12 to 10 days prior to the extreme cold events. (b)–(d) As in (a), but for 9–7, 6–4, and 3–1
days prior to the extreme cold events, respectively. (e)–(i) As in (a), but for 0–2, 3–5, 6–8, 9–11, and 12–14 days after the peak of the
extreme cold events, respectively. Contour intervals are 3 hPa.
7984 JOURNAL OF CL IMATE VOLUME 30
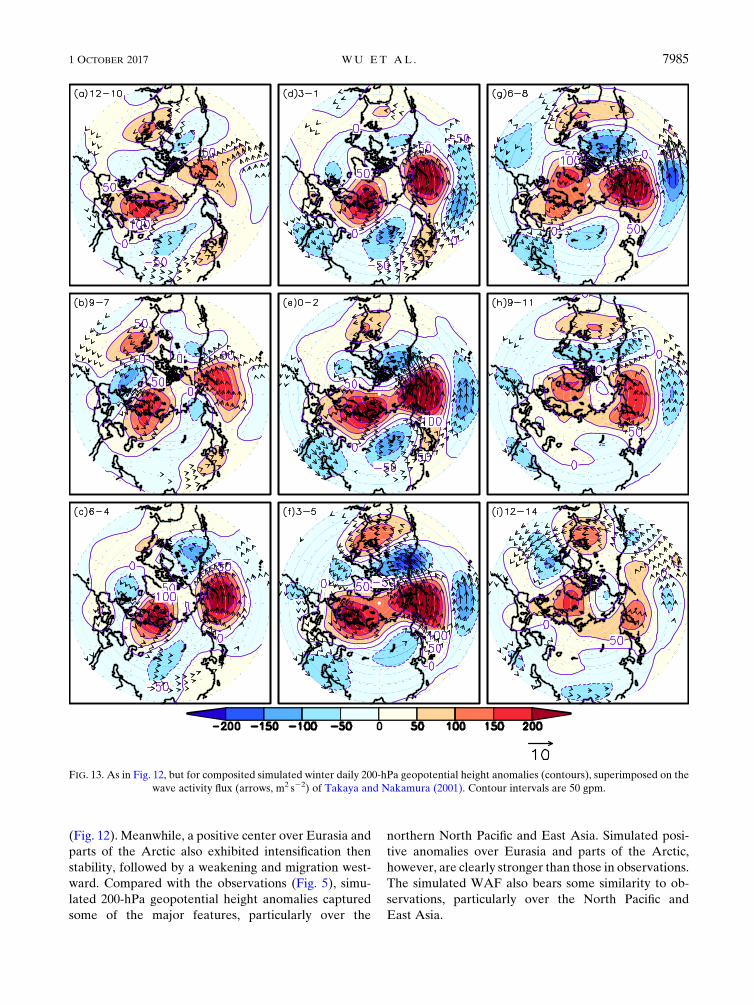
(Fig. 12). Meanwhile, a positive center over Eurasia and
parts of the Arctic also exhibited intensification then
stability, followed by a weakening and migration west-
ward. Compared with the observations (Fig. 5), simu-
lated 200-hPa geopotential height anomalies captured
some of the major features, particularly over the
northern North Pacific and East Asia. Simulated posi-
tive anomalies over Eurasia and parts of the Arctic,
however, are clearly stronger than those in observations.
The simulated WAF also bears some similarity to ob-
servations, particularly over the North Pacific and
East Asia.
FIG. 13. As in Fig. 12, but for composited simulated winter daily 200-hPa geopotential height anomalies (contours), superimposed on the
wave activity flux (arrows, m2 s22) of Takaya and Nakamura (2001). Contour intervals are 50 gpm.
1 OCTOBER 2017 WU ET AL . 7985
5. Conclusions and discussion
This study investigates dominant features of the at-
mospheric circulation evolution associated with an
extreme cold event in Asia during 17 January–1 Feb-
ruary 2012 and its possible association with Arctic sea
ice loss. Results highlight the northeastern Pacific–
Aleutian region and central Eurasia as two critical
precursor areas for the cold event. A steady rise in SLP
over the Aleutian region occurred prior to the cold-air
outbreak, and then falling SLP over this region co-
incided with the formation of a polar blocking high
aloft coupled with rapid strengthening of the Siberian
high, which ushered cold advection over the Asian
continent.
Model simulation experiments demonstrate that the
combined impacts of both Arctic sea ice loss and atmo-
spheric initial conditions in the summer of 2011 favored
the circulation pattern that developed during the ensuing
cold winter period, with the initial conditions playing the
dominant role. This study also implies that the Aleutian
low and disturbances in the midlatitudes over the north-
eastern Pacific may provide precursors to predict intra-
seasonal atmospheric evolution over Eurasia.
Although simulation experiments support that the
cold event of winter 2011/12 could be largely attributed
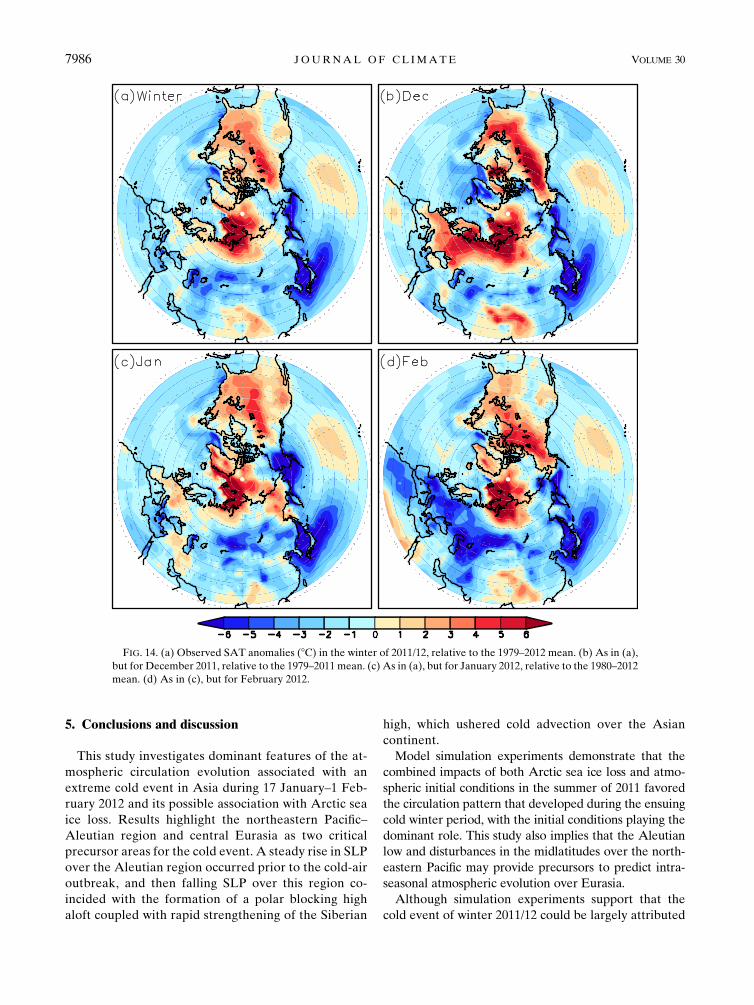
FIG. 14. (a) Observed SAT anomalies (8C) in the winter of 2011/12, relative to the 1979–2012 mean. (b) As in (a),
but for December 2011, relative to the 1979–2011 mean. (c) As in (a), but for January 2012, relative to the 1980–2012
mean. (d) As in (c), but for February 2012.
7986 JOURNAL OF CL IMATE VOLUME 30
to the combined impacts of sea ice loss and atmospheric
circulation conditions in the summer of 2011, some
questions remain. For example, cold air masses gener-
ally move southeastward over Asia, yet observations
and simulation experiments exhibited a westward
propagation in this case. A possible explanation is that
summer atmospheric conditions in the Arctic enhance
the feedback of sea ice loss on winter atmospheric var-
iability, which frequently produces a favorable spatial
pattern of themid- and upper-tropospheric steering flow
(warm ridges and blocking highs) that promote the oc-
currence of extremely cold events, leading to a westward
propagation of SLP anomalies. Indeed, many details of
the mechanism are not yet clear.
A crucial question in understanding this mechanism is
how does Arctic sea ice loss affect SLP over the Pacific–
Aleutian region and the polar blocking high? Winter
Arctic warm anomalies (Fig. 14) precede positive SLP
anomalies over the Pacific–Aleutian region and the oc-
currence of the polar blocking high (Figs. 3 and 4). The
spatial patterns of SAT anomalies are similar for the
entire winter of 2011/12 and for the three individual
winter months, with warm anomalies located mainly
over North America, northern Eurasia, Siberian mar-
ginal seas, and the Barents–Kara Seas. Positive SAT
anomalies for January 2012 closely resemble those av-
eraged over the period of the extremely cold event
(Figs. 14c and 2a). Arctic sea ice loss would contribute to
Arctic warm anomalies (Screen and Simmonds 2010).
The combined impacts of both Arctic sea ice loss and
atmospheric circulation conditions in the previous
summer season were the primary causes of observed
SLP anomalies in the winter of 2011/12 and January
2012, leading to strengthened SLP over the Siberia and
the northern Pacific region (Figs. 9a,c, 6c, and 2b). This
pattern of SLP anomalies over the mid- and high lati-
tudes in the winter of 2011/12 closely resembles an at-
mospheric circulation anomaly associated with recent
Arctic winter warm anomalies and sea ice loss (Wu
2017). The intensity of this atmospheric circulation
anomaly reached the maximum in both of the winter of
2011/12 and January 2012 over the period from 1979 to
2016 (not shown), which was the precondition for posi-
tive SLP anomalies over the northern Pacific.
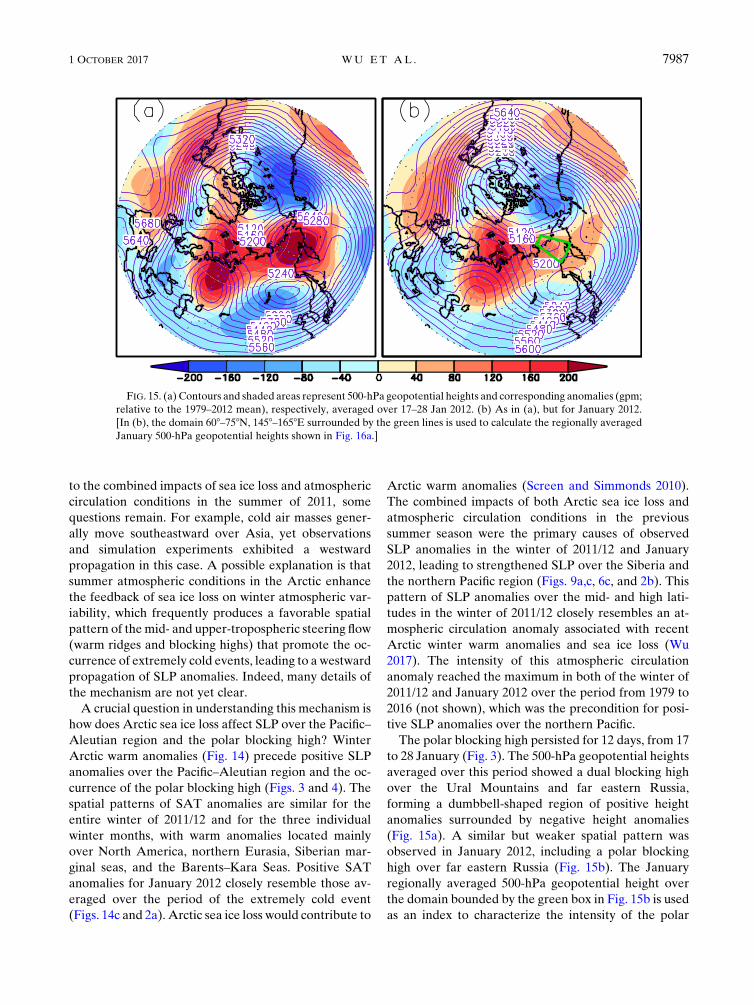
The polar blocking high persisted for 12 days, from 17
to 28 January (Fig. 3). The 500-hPa geopotential heights
averaged over this period showed a dual blocking high
over the Ural Mountains and far eastern Russia,
forming a dumbbell-shaped region of positive height
anomalies surrounded by negative height anomalies
(Fig. 15a). A similar but weaker spatial pattern was
observed in January 2012, including a polar blocking
high over far eastern Russia (Fig. 15b). The January
regionally averaged 500-hPa geopotential height over
the domain bounded by the green box in Fig. 15b is used
as an index to characterize the intensity of the polar
FIG. 15. (a) Contours and shaded areas represent 500-hPa geopotential heights and corresponding anomalies (gpm;
relative to the 1979–2012 mean), respectively, averaged over 17–28 Jan 2012. (b) As in (a), but for January 2012.
[In (b), the domain 608–758N, 1458–1658E surrounded by the green lines is used to calculate the regionally averaged
January 500-hPa geopotential heights shown in Fig. 16a.]
1 OCTOBER 2017 WU ET AL . 7987
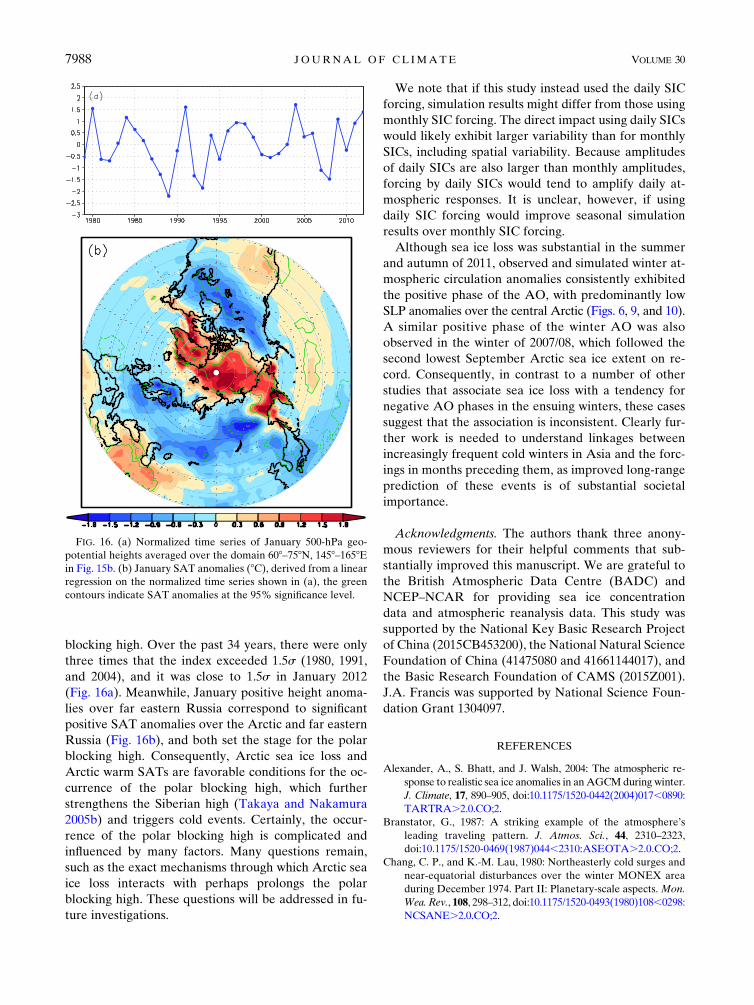
blocking high. Over the past 34 years, there were only
three times that the index exceeded 1.5s (1980, 1991,
and 2004), and it was close to 1.5s in January 2012
(Fig. 16a). Meanwhile, January positive height anoma-
lies over far eastern Russia correspond to significant
positive SAT anomalies over the Arctic and far eastern
Russia (Fig. 16b), and both set the stage for the polar
blocking high. Consequently, Arctic sea ice loss and
Arctic warm SATs are favorable conditions for the oc-
currence of the polar blocking high, which further
strengthens the Siberian high (Takaya and Nakamura
2005b) and triggers cold events. Certainly, the occur-
rence of the polar blocking high is complicated and
influenced by many factors. Many questions remain,
such as the exact mechanisms through which Arctic sea
ice loss interacts with perhaps prolongs the polar
blocking high. These questions will be addressed in fu-
ture investigations.
We note that if this study instead used the daily SIC
forcing, simulation results might differ from those using
monthly SIC forcing. The direct impact using daily SICs
would likely exhibit larger variability than for monthly
SICs, including spatial variability. Because amplitudes
of daily SICs are also larger than monthly amplitudes,
forcing by daily SICs would tend to amplify daily at-
mospheric responses. It is unclear, however, if using
daily SIC forcing would improve seasonal simulation
results over monthly SIC forcing.
Although sea ice loss was substantial in the summer
and autumn of 2011, observed and simulated winter at-
mospheric circulation anomalies consistently exhibited
the positive phase of the AO, with predominantly low
SLP anomalies over the central Arctic (Figs. 6, 9, and 10).
A similar positive phase of the winter AO was also
observed in the winter of 2007/08, which followed the
second lowest September Arctic sea ice extent on re-
cord. Consequently, in contrast to a number of other
studies that associate sea ice loss with a tendency for
negative AO phases in the ensuing winters, these cases
suggest that the association is inconsistent. Clearly fur-
ther work is needed to understand linkages between
increasingly frequent cold winters in Asia and the forc-
ings in months preceding them, as improved long-range
prediction of these events is of substantial societal
importance.
Acknowledgments. The authors thank three anony-
mous reviewers for their helpful comments that sub-
stantially improved this manuscript. We are grateful to
the British Atmospheric Data Centre (BADC) and
NCEP–NCAR for providing sea ice concentration
data and atmospheric reanalysis data. This study was
supported by the National Key Basic Research Project
of China (2015CB453200), the National Natural Science
Foundation of China (41475080 and 41661144017), and
the Basic Research Foundation of CAMS (2015Z001).
J.A. Francis was supported by National Science Foun-
dation Grant 1304097.
REFERENCES
Alexander, A., S. Bhatt, and J. Walsh, 2004: The atmospheric re-
sponse to realistic sea ice anomalies in anAGCMduring winter.
J. Climate, 17, 890–905, doi:10.1175/1520-0442(2004)017,0890:
TARTRA.2.0.CO;2.
Branstator, G., 1987: A striking example of the atmosphere’s
leading traveling pattern. J. Atmos. Sci., 44, 2310–2323,
doi:10.1175/1520-0469(1987)044,2310:ASEOTA.2.0.CO;2.
Chang, C. P., and K.-M. Lau, 1980: Northeasterly cold surges and
near-equatorial disturbances over the winter MONEX area
during December 1974. Part II: Planetary-scale aspects. Mon.
Wea. Rev., 108, 298–312, doi:10.1175/1520-0493(1980)108,0298:
NCSANE.2.0.CO;2.
FIG. 16. (a) Normalized time series of January 500-hPa geo-
potential heights averaged over the domain 608–758N, 1458–1658Ein Fig. 15b. (b) January SAT anomalies (8C), derived from a linear
regression on the normalized time series shown in (a), the green
contours indicate SAT anomalies at the 95% significance level.
7988 JOURNAL OF CL IMATE VOLUME 30
——, and ——, 1982: Short-term planetary-scale interaction over
the tropics and midlatitudes during northern winter. Part I:
Contrasts between active and inactive periods. Mon. Wea.
Rev., 110, 933–946, doi:10.1175/1520-0493(1982)110,0933:
STPSIO.2.0.CO;2.
Chen, T.-C., W.-R. Huang, and J.-H. Yoon, 2004: Inter-
annual variation of the east Asian cold surge activity.
J. Climate, 17, 401–413, doi:10.1175/1520-0442(2004)017,0401:
IVOTEA.2.0.CO;2.
Cohen, J., and Coauthors, 2014: Recent Arctic amplification and
extreme mid-latitude weather. Nat. Geosci., 7, 627–637,
doi:10.1038/ngeo2234.
Davies, H. C., 2015: Weather chains during the 2013/2014 winter
and their significance for seasonal prediction. Nat. Geosci., 8,
833–837, doi:10.1038/ngeo2561.
Deser, C., G. Magnusdottir, R. Saravanan, and A. Phillips, 2004:
The effects of NorthAtlantic SST and sea ice anomalies on the
winter circulation in CCM3. Part II: Direct and indirect
components of the response. J. Climate, 17, 877–889,
doi:10.1175/1520-0442(2004)017,0877:TEONAS.2.0.CO;2.
Ding, Y.-H., 1990: Build-up, air mass transformation and propa-
gation of Siberian high and its relation to cold surge in east
Asia. Meteor. Atmos. Phys., 44, 281–292, doi:10.1007/
BF01026822.
——, and T. N. Krishnamurti, 1987: Heat budget of Siberian high
and winter monsoon. Mon. Wea. Rev., 115, 2428–2449,
doi:10.1175/1520-0493(1987)115,2428:HBOTSH.2.0.CO;2.
Francis, J., and S. Vavrus, 2012: Evidence linking Arctic amplifi-
cation to extreme weather in mid-latitudes. Geophys. Res.
Lett., 39, L06801, doi:10.1029/2012GL051000.
——, and ——, 2015: Evidence for a wavier jet stream in response
to rapid Arctic warming. Environ. Res. Lett., 10, 014005,
doi:10.1088/1748-9326/10/1/014005.
Gong, D.-Y., and C.-H. Ho, 2002: The Siberian high and climate
change over middle to high latitude Asia. Theor. Appl. Cli-
matol., 72, 1–9, doi:10.1007/s007040200008.
Hadley Centre for Climate Prediction andResearch, 2006: Met Office
HadISST 1.1—Global sea-Ice coverage and Sea Surface Tem-
perature (1870-2015). NCAS British Atmospheric Data Centre,
accessed 5 January 2016. [Available online at http://catalogue.
ceda.ac.uk/uuid/facafa2ae494597166217a9121a62d3c.]
Honda, M., J. Inous, and S. Yamane, 2009: Influence of low Arctic
sea-ice minima on anomalously cold Eurasian winters. Geo-
phys. Res. Lett., 36, L08707, doi:10.1029/2008GL037079.
Jaiser, R., K. Dethloff, and D. Handorf, 2013: Stratospheric
response to Arctic sea ice retreat and associated planetary
wave propagation changes. Tellus, 65A, 19375, doi:10.3402/
tellusa.v65i0.19375.
Jeong, J.-H., and C.-H. Ho, 2005: Changes in occurrence of
cold surges over east Asia in association with Arctic Os-
cillation. Geophys. Res. Lett., 32, L14704, doi:10.1029/
2005GL023024.
——, B.-M. Kim, C.-H. Ho, D. Chen, and G.-H. Lim, 2006:
Stratospheric origin of cold surge occurrence in east Asia.
Geophys. Res. Lett., 33, L14710, doi:10.1029/2006GL026607.
Kug, J., J. Jeong, Y. Jang, B. Kim, C. Folland, S. Min, and S. Son,
2015: Two distinct influences of Arctic warming on cold win-
ters over North America and East Asia. Nat. Geosci., 8, 759–
762, doi:10.1038/ngeo2517.
Kushnir, Y., 1987: Retrograding wintertime low-frequency
disturbances over the North Pacific Ocean. J. Atmos. Sci.,
44, 2727–2742, doi:10.1175/1520-0469(1987)044,2727:
RWLFDO.2.0.CO;2.
Li, C., B. Stevens, and J. Marotzke, 2015: Eurasian winter cooling
in the warming hiatus of 1998–2012. Geophys. Res. Lett., 42,
8131–8139, doi:10.1002/2015GL065327.
Liu, J., J. Curry, H.Wang,M. Song, andR. Horton, 2012: Impact of
declining Arctic sea ice on winter snowfall. Proc. Natl. Acad.
Sci. USA, 109, 4074–4079, doi:10.1073/pnas.1114910109.
Magnusdottir, G., C. Deser, and R. Saravanan, 2004: The effects of
North Atlantic SST and sea ice anomalies in the winter cir-
culation in CCM3. Part I: Main features and storm track
characteristics of the response. J. Climate, 17, 857–876,
doi:10.1175/1520-0442(2004)017,0857:TEONAS.2.0.CO;2.
McCusker, K. E., J. C. Fyfe, and M. Sigmond, 2016: Twenty-five
winters of unexpected Eurasian cooling unlikely due to Arctic
sea-ice loss. Nat. Geosci., 9, 838–842, doi:10.1038/ngeo2820.
Meehl, G. A., R. Lukas, G. N. Kiladis, K. M. Weickmann, A. J.
Matthews, and M. Wheeler, 2001: A conceptual framework
for time and space scale interactions in the climate system.
Climate Dyn., 17, 753–775, doi:10.1007/s003820000143.
Meleshko, V., O. M. Johannessen, A. V. Baidin, T. V. Pavlova,
and V. A. Govorkova, 2016: Arctic amplification: Does it
impact the polar jet stream?Tellus, 68A, 32330, doi:10.3402/
tellusa.v68.32330.
Mori, M., M. Watanabe, H. Shiogama, J. Inoue, and M. Kimoto,
2014: RobustArctic sea-ice influence on the frequent Eurasian
cold winters in past decades. Nat. Geosci., 7, 869–873,
doi:10.1038/ngeo2277.
Nakamura, T., K. Yamazaki, K. Iwamoto, M. Honda, Y. Miyoshi,
Y. Ogawa, and J. Ukita, 2015: A negative phase shift of the
winter AO/NAO due to the recent Arctic sea-ice reduction in
late autumn. J. Geophys. Res. Atmos., 120, 3209–3227,
doi:10.1002/2014JD022848.
Ogi, M., K. Yamazaki, and J. Wallace, 2010: Influence of winter and
summer surface wind anomalies on summerArctic sea ice extent.
Geophys. Res. Lett., 37, L07701, doi:10.1029/2009GL042356.
Overland, J., J. Francis, E. Hanna, and M. Wang, 2012: The recent
shift in early summer Arctic atmospheric circulation. Geo-
phys. Res. Lett., 39, L19804, doi:10.1029/2012GL053268.
——, ——, R. Hall, E. Hanna, S. Kim, and T. Vihma, 2015:
The melting Arctic and midlatitude weather patterns: Are
they connected? J. Climate, 28, 7917–7932, doi:10.1175/
JCLI-D-14-00822.1.
Park, T.-W., J.-H. Jeong, C.-H. Ho, and S.-J. Kim, 2008: Charac-
teristics of atmospheric circulation associated with cold surge
occurrences in east Asia: A case study during 2005/06 winter.
Adv. Atmos. Sci., 25, 791–804, doi:10.1007/s00376-008-0791-0.
——, C.-H. Ho, and S. Yang, 2011: Relationship between the
Arctic Oscillation and cold surges over East Asia. J. Climate,
24, 68–83, doi:10.1175/2010JCLI3529.1.
Perlwitz, J., M. Hoerling, and R. Dole, 2015: Arctic tropospheric
warming: Causes and linkages to lower latitudes. J. Climate,
28, 2154–2167, doi:10.1175/JCLI-D-14-00095.1.
Petoukhov, V., and V. Semenov, 2010: A link between reduced
Barents-Kara sea ice and cold winter extremes over northern
continents. J. Geophys. Res., 115, D21111, doi:10.1029/
2009JD013568.
Roeckner, E., and Coauthors, 2003: The atmospheric general cir-
culation model ECHAM5. Part I: Model description. Max
Planck Institute for Meteorology Rep. 349, 127 pp. [Available
online at http://www.mpimet.mpg.de/fileadmin/models/echam/
mpi_report_349.pdf.]
Screen, J. A., and I. Simmonds, 2010: The central role of dimin-
ishing sea ice in recent Arctic temperature amplification.
Nature, 464, 1334–1337, doi:10.1038/nature09051.
1 OCTOBER 2017 WU ET AL . 7989
——, and ——, 2013a: Exploring links between Arctic amplifica-
tion and mid-latitude weather. Geophys. Res. Lett., 40, 959–
964, doi:10.1002/grl.50174.
——, and ——, 2013b: Caution needed when linking weather ex-
tremes to amplified planetary waves. Proc. Natl. Acad. Sci.
USA, 110, E2327, doi:10.1073/pnas.1304867110.
——, C. Deser, I. Simmonds, and R. Tomas, 2014: Atmospheric
impacts of Arctic sea-ice loss, 1979–2009: Separating forced
change from atmospheric internal variability. Climate Dyn.,
43, 333–344, doi:10.1007/s00382-013-1830-9.
Song, L., L. Wang, W. Chen, and Y. Zhang, 2016: Intraseasonal
variation of the strength of the East Asian trough and its
climatic impacts in boreal winter. J. Climate, 29, 2557–2577,
doi:10.1175/JCLI-D-14-00834.1.
Spreen, G., R. Kwok, and D. Menemenlis, 2011: Trend in Arctic
sea ice drift and role of wind forcing: 1992–2009.Geophys. Res.
Lett., 38, L19501, doi:10.1029/2011GL048970.
Takaya, K., and H. Nakamura, 2001: A formulation of a phase-
independent wave-activity flux for stationary and migratory
quasigeostrophic eddies on a zonally varying basic flow.
J. Atmos. Sci., 58, 608–627, doi:10.1175/1520-0469(2001)058,0608:
AFOAPI.2.0.CO;2.
——, and ——, 2005a: Mechanisms of intraseasonal amplification
of the cold Siberian high. J. Atmos. Sci., 62, 4423–4440,
doi:10.1175/JAS3629.1.
——, and ——, 2005b: Geographical dependence of upper-level
blocking formation associated with intraseasonal amplifica-
tion of the Siberian high. J. Atmos. Sci., 62, 4441–4449,
doi:10.1175/JAS3628.1.
Tang, Q., X. Zhang, X. Yang, and J. Francis, 2013: Cold winter
extremes in northern continents linked to Arctic sea ice loss.
Environ. Res. Lett., 8, 014036, doi:10.1088/1748-9326/8/1/
014036.
Van Oldenborgh, G., R. Haarsma, H. Vries, and M. Allen, 2015:
Cold extremes in North America vs. mild weather in Europe:
The winter of 2013–14 in the context of a warming world. Bull.
Amer.Meteor. Soc., 96, 707–714, doi:10.1175/BAMS-D-14-00036.1.
Walsh, J., 2014: Intensified warming of the Arctic: Causes and
impacts on middle latitudes. Global Planet. Change, 117, 52–
63, doi:10.1016/j.gloplacha.2014.03.003.
Wang, L., andW. Chen, 2014: The EastAsian wintermonsoon: Re-
amplification in the mid-2000s. Chin. Sci. Bull., 59, 430–436,
doi:10.1007/s11434-013-0029-0.
WMORegional Climate Centres, 2012: Cold spell in Europe andAsia
in late winter 2011/2012. WMO Regional Climate Centres,
20 pp. [Available online at http://reliefweb.int/sites/reliefweb.
int/files/resources/dwd_2012_report.pdf.]
Wu, B., 2017: Winter atmospheric circulation anomaly associated
with recent Arctic winter warm anomalies. J. Climate,
doi:10.1175/JCLI-D-17-0175.1, in press.
——, J. Su, andR. Zhang, 2011: Effects of autumn-winter arctic sea
ice on winter Siberian high. Chin. Sci. Bull., 56, 3220–3228,doi:10.1007/s11434-011-4696-4.
——, J. Overland, and R. D’Arrigo, 2012: Anomalous Arctic surface
wind patterns and their impacts on September sea iceminima and
trend. Tellus, 64, 18590, doi:10.3402/tellusa.v64i0.18590.——, D. Handorf, K. Dethloff, A. Rinke, and A. Hu, 2013:
Winter weather patterns over northern Eurasia and Arctic
sea ice loss. Mon. Wea. Rev., 141, 3786–3800, doi:10.1175/
MWR-D-13-00046.1.
——, J. Su, andR.D’Arrigo, 2015: Patterns ofAsian winter climate
variability and links to Arctic sea ice. J. Climate, 28, 6841–
6858, doi:10.1175/JCLI-D-14-00274.1.
——, K. Yang, and J. Francis, 2016: Summer Arctic dipole wind
pattern affects the winter Siberian high. Int. J. Climatol., 36,
4187–4201, doi:10.1002/joc.4623.
Zhang, J., W. Tian, M. P. Chipperfield, F. Xie, and J. Huang, 2016:
Persistent shift of theArctic polar vortex towards theEurasian
continent in recent decades. Nat. Climate Change, 6, 1094–
1099, doi:10.1038/nclimate3136.
Zhang, Y., and W.-C. Wang, 1997: Model-simulated northern
winter cyclone and anticyclone activity under a greenhouse
warming scenario. J. Climate, 10, 1616–1634, doi:10.1175/
1520-0442(1997)010,1616:MSNWCA.2.0.CO;2.
7990 JOURNAL OF CL IMATE VOLUME 30