Embed Size (px)
Citation preview
A CO-ORDINATED PROJECT FOR PARTICIPATORY DEVELOPMENT OF MINI & MICRO HYDEL RESOURCES
IN THE WESTERN GHATS
FINAL REPORTFINAL REPORT Vol. I & IIVol. I & II
Prepared by: INTEGRATED
RURAL TECHNOLOGY CENTRE Mundur, Palakkad, Kerala
Funded by:
KERALA RESEARCH PROGRAMME ON LOCAL LEVEL DEVELOPMENT
CDS, Thiruvananthapuram, Kerala

PROJECT TEAM
Resy George (Principal Investigator) P.V. Anilkumar Anish Chandran
Anuroop Gopinath P.V. Aravind
P.K. Arunkumar A.R. Girishkumar
P. Jayaprakash K.P. Prasad
G. Praveen Lal C. Raje sh
E.M. Santhoshkumar K. N. Shaji
M.A. Suresh

CONTENTS
VOLUME I: GENERAL DETAILS
Chapter I
ENERGY AND POWER: The Critical Infrastructure .................................... 1-7 1.1 Introduction.......................................................................................................... 1 1.2 World Scenario of Power Consumption................................................................. 3 1.3 National Scenario...................................................................................................5 I.4 State Scenario........................................................................................................6
Chapter II
SMALL HYDRO PROJECTS: Concepts and Status ....................................... 8-10 2.1 Classification......................................................................................................... 8 2.2 Advantages of Small Hydro Projects ..................................................................... 8 2.3 Factors of Shp Development ................................................................................. 9 2.4 Basic Philosophy................................................................................................... 9 2.5 Shp Scenario ...................................................................................................... 10
Chapter III
SHP DEVELOPMENT: A Cost Reduction Approach..................................... 11-23 3.1 Objectives .......................................................................................................... 11 3.2 Project Methodology .......................................................................................... 12 3.3 Power Potential....................................................................................................17 3.4 Selection of Unit Size ...........................................................................................17 3.5 Standardisation As A Means for Cost Reduction..................................................20 3.6 Civil Works.........................................................................................................21 3.7 Design Considerations for Civil Works ................................................................ 21
Chapter IV
CONCLUSIONS AND RECOMMENDATIONS .......................................... 24-28 4.1 Results.................................................................................................................24 4.2 Conclusions .........................................................................................................27 4.3 Recommendations ................................................................................................27
Annexure -A: Contour Maps of the Sites at the proposed Diversion Structure. Annexure -B: List of Identified Small Hydel Sites of our State.

Chapter I
ENERGY AND POWER: The Critical Infrastructure
1.1 INTRODUCTION
Energy has always been a deciding factor in the progress of mankind. Economic status of countries
is often assessed in terms of their per capita energy consumption. Of all forms of energy, electricity
has the highest versatility and convenience of use. Per capita electricity consumption in India is 334
kWh/year.This is very small compared to industrialised countries which amounts to nearly 10000
kWh/year. The figure for Kerala is only 278 kWh/year which is even lower than the national
average. (Source: Economic Review 1999). Shortage of electricity has been a major constraint
for the industrial advancement and hence the overall development of Kerala.
Power is the rate of flow of energy. In common parlance, the term energy is used to denote all
forms of energy. The term power is usually used in the context of generation and consumption of
electric power (eg. power cut, power shortage, etc.). Electricity can be generated from various
sources. So far we have been successful in generating electric power from the following sources:
1. Fuels (Fossil fuels as well as biomass)
2. Flowing or falling stream of water
3. Ocean tides
4. Ocean Waves
5. Ocean Temperature Differences (between the surface and the bottom)
6. Winds
7. Solar radiation
8. Geothermal energy
9. Atomic nuclei
These energy resources have been broadly classified into:
a. Conventional
b. Non conventional

A Co-ordinated Project for Participatory Development of Small & Mini Hydel Resources in the Western Ghat s vol.I
:6:
Conventional technologies to tap energy include fossil fuelled thermal plants, atomic reactor and
large hydro electric projects. All others, including small hydro schemes and biomass based
systems, are usually termed non conventional.
Fossil fuels meet a greater proportion of global energy requirement than any other source.
Principal fossil fuels are coal, natural gas, petroleum and its derivatives. However, all these are
finite and non renewable.
Biomass (including firewood and agroresidue) are more difficult to handle and process, but they are
renewable.
Energy contained in flowing or falling streams can be tapped either by storing water in high level
reservoirs using large dams, or by run of the river projects. The latter is more eco-friendly since it
does not result in large scale deforestation or inundation. However, this technique will not help to
tap all the energy available during flood seasons.
Ocean tides and waves have enormous power within them. The OTEC (Ocean Temperature
Energy Conversion) also have enormous potential. They are quite clean and highly promising. But
these technologies are not yet mature.
Another resource with a good deal of potential for generating electricity is wind power. Wind
machines with hundreds or even thousands of kilowatt capacities are readily available, almost off
the shelf. India has more than 1000MW of installed capacity in wind farms, mostly in Tamil Nadu.
Hot water and steam escape from surface vents at many places on earth due to geothermal
phenomena. Such natural sources are being used to generate power in favourably endowed
places.
In nuclear power plants, the heat energy produced by controlled atomic fission is used for
producing steam. The energy of steam is used for rotating turbines to generate power.
Solar energy can be directly converted into electricity using photovoltaic cells. Alternatively, solar
thermal energy can be harnessed directly to power Rankine Cycle Power Plants to generate
electricity.

A Co-ordinated Project for Participatory Development of Small & Mini Hydel Resources in the Western Ghat s vol.I
:7:
All these sources have their own advantages and disadvantages.
Fossil fuels are the most widely used sources. Its technology is the best developed one.
Ecological hazards and non-renewability are the main drawbacks. Even if air and water pollution
can be brought within reasonable limits, nothing can be done to reduce the emission of CO2, which
is a Green House Gas.
Hydro energy has so many advantages like cleanliness, easy availability, abundance etc. But large
hydro power plants could be problematic owing to inundation of huge areas of land/forest.
Wave and Tidal, as well as OTEC energy sources have very low accessibility. They are site
specific. The technology is too young and expensive.
Wind power is a fast emerging technology. In favourable locations, it is quite economical. But the
locations are to be carefully chosen. Isolated units may not be profitable. In large numbers, they
are often cheaper than conventional power plants. Even though the initial cost is rather high, the
recurring cost is negligible. Their major limitations are their low dependability and high site
specificity.
Solar energy, though geographically and climatically conditioned, is the most abundant source of
energy. The total amount of solar energy falling on the surface of the earth is 16,000 times the total
energy used by the humans. However, the harnessing of solar energy still poses several problems.
More technological developments are needed to reduce the cost, especially for photovoltaic
systems. In the final analysis, the Sun is the only source of truly renewable energy.
Geothermal stations are highly location specific. But wherever geothermal energy is available in
plenty, they are very economical.
There was a time when nuclear energy was expected to provide the answer to all our future energy
needs. But today only a few believe so. They are now bogged down with almost unsolvable
problems like ecological hazards, safety, waste management and cost. Only very few countries are
actively pursuing that option. It seems to be a dead-end now.
A Co-ordinated Project for Participatory Development of Small & Mini Hydel Resources in the Western Ghat s vol.I
:8:
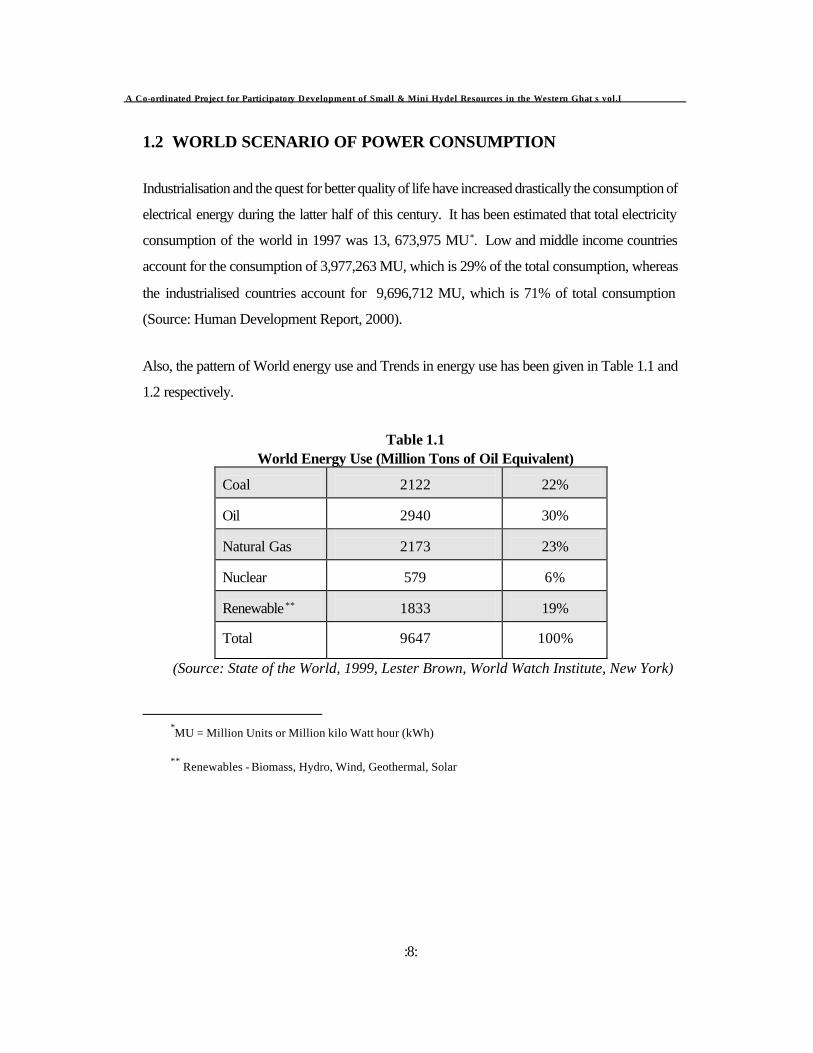
1.2 WORLD SCENARIO OF POWER CONSUMPTION
Industrialisation and the quest for better quality of life have increased drastically the consumption of
electrical energy during the latter half of this century. It has been estimated that total electricity
consumption of the world in 1997 was 13, 673,975 MU*. Low and middle income countries
account for the consumption of 3,977,263 MU, which is 29% of the total consumption, whereas
the industrialised countries account for 9,696,712 MU, which is 71% of total consumption
(Source: Human Development Report, 2000).
Also, the pattern of World energy use and Trends in energy use has been given in Table 1.1 and
1.2 respectively.
Table 1.1 World Energy Use (Million Tons of Oil Equivalent)
Coal
2122
22%
Oil
2940
30%
Natural Gas
2173
23%
Nuclear
579
6%
Renewable **
1833
19%
Total
9647
100%
(Source: State of the World, 1999, Lester Brown, World Watch Institute, New York)
*MU = Million Units or Million kilo Watt hour (kWh)
** Renewables - Biomass, Hydro, Wind, Geothermal, Solar

A Co-ordinated Project for Participatory Development of Small & Mini Hydel Resources in the Western Ghat s vol.I
:9:
Table 1.2 Trends in World Wide Energy Use
Source
Average Annual growth rate
Wind Power (90-97)
25.7%
Solar Photovoltaic (90-97)
16.8%
Geothermal Power (90-96)
3%
Natural Gas (90-97)
2.1%
Hydro electric Power (90-96)
1.6%
Oil (90-97)
1.4%
Coal (90-97)
1.2% Nuclear Power (90-97)
0.6%
(Source: State of the World, 1999, Lester Brown, World Watch Institute, New York)
1.3 NATIONAL SCENARIO
India consumes only 3.25% of world=s total energy production even though we have one sixth of
the world population. Our per capita consumption is only 19.36% of world per capita
consumption of electricity.
As pointed out earlier, every available source that is eco-friendly and economically viable has to
be tapped to meet the growing energy needs. In this context the renewable sources have an
important role to play, especially in the long run. The estimated potential of various non
conventional energy resources in India are given in Table 1.3.
Table 1.3 Estimated Renewable Energy Potential of India (MW)
SHP (up to 3 MW) 10,000 MW
Energy form waste-1700 MW
Bio mass power 19,000 MW
Ocean Energy Power -50,000 MW
Wind Power 20,000 MW
Solar Power - 20 MW/km2

A Co-ordinated Project for Participatory Development of Small & Mini Hydel Resources in the Western Ghat s vol.I
:10:
(Source: Citizen=s Fifth Report and TERI Data Book 2000)
Power generation in India from various sources as per Citizen=s Fifth Report (1998-99) are
given in Table 1.4. Also, identified reserves of different energy resources in our country is given
in Table 1.5 (TERI Data Book -2000, Citizen=s Fifth Report- 99). Total energy demand was
413,490 MU and supply account for only 365,900 MU. This shows a deficit of 47,590 MU
which is 8.8% of the demand. In India, 42.37% of total population is able to access electricity.
While the percentage of accessibility of rural areas is only 30.4%, the urban accessibility is
75.78%. Our annual growth rate in electricity consumption is 8.35%.(TERI Data Book, >99).
The power consumption pattern of our nation is given in detail in Table 1.6 (TERY Data Book-
2000).
Table 1.4 Existing Power Production in India as on 31 March 1999
Thermal
67,560 MW
Nuclear
2,225 MW
Hydro
22,443 MW
Wind
1,025 MW
Total
93,253 MW
(Source: Citizen=s Fifth Report -1999)
Table 1.5 Identified re serves of different energy resources in India
Untapped Hydro
84,000 MW @ 60% PLF
Coal Reserve
79,106.19 million tonnes
Lignite
29,355 million tonnes
Crude oil
746 million tonnes
Natural gas
692 billion cum.
Uranium
6700 tonnes

A Co-ordinated Project for Participatory Development of Small & Mini Hydel Resources in the Western Ghat s vol.I
:11:
Thorium 3,63,000 tonnes
(Source: TERI Data Book 2000, Citizen=s Fifth Report - 1999)

A Co-ordinated Project for Participatory Development of Small & Mini Hydel Resources in the Western Ghat s vol.I
:12:
Table 1.6 Power Consumption Pattern in India (connected load, MW)
Domestic
55,600,0MW
31.73%
Industrial (LT & MT)
25,400 MW
14.5%
Industrial (HT, EHT)
32,000 MW
18.23% Commercial
13,000 MW
7.4%
Irrigation
42,200 MW
24% Public Lighting & Water Supply
3,060 MW
1.75%
Railway traction
2,150 MW
1.22%
Miscellaneous
1,950 MW
1.11%
Total
1,75,000 MW
100% (Source: TERI Data Book 2000)
I.4 STATE SCENARIO
The supply and demand for electricity in Kerala have been estimated variously. According to the
Fifteenth Power Survey, the requirement as on 1999-2000, is for a peak demand of 2,763 MW
of power and 13617 MU of energy. The present installed capacity is only 2343 MW, which
causes a deficit of 420 MW. The effective availability is still less. There are 21 generating
stations; hydro(16), thermal (3) and wind farm (1). Total per capita consumption of electricity in
Kerala is 278 kWh per year. The detailed power consumption pattern of our state is given in
Table 1.7 (Economic Review-99).
Table 1.7 Power Consumption Pattern in Kerala
Domestic
45.09%
Industrial (HT, EHT)
30.44% Industrial (LT)
6.3%
Commercial
8.55% Irrigation
3.85%
Public lighting
1.52% Water supply
2.27%
Bulk Supply
1.85%

A Co-ordinated Project for Participatory Development of Small & Mini Hydel Resources in the Western Ghat s vol.I
:13:
(Source: Economic Review >99)
It has been established provisionally that, by 2002 AD, Kerala will be able to generate only
1938.8 MW from large and medium Hydel sources. The balance will have to come from
thermal, small hydel or other renewable sources. In view of the environmental impact of thermal
power plants, as well as their high costs, as large as possible a share has to come from renewable
sources.It is a fact that small hydel schemes being the most developed and proven technology,
represents the best bet, to the extent that it is available.
Fortunately, Kerala has a significant potential for small hydro power generation in the 41 west
flowing and 3 east flowing rivers. ANERT has identified and published a list of 182 possible sites
located at various river basins of our state. Some of the sites identified under this programme
(WGSHP) are also included in the list. The list is given as Annexure 2 along with this report.
-��-

Chapter II
SMALL HYDRO PROJECTS: Concepts and Status
2.1 CLASSIFICATION
The Central Electricity Authority has issued guidelines on how various hydro power stations
should be classified (see Table 2.1).
Table 2.1 Classification of Small Hydro
Small Hydro Projects
Has individual units with capacity from 1000/ 2000kW and total capacity limited to 15000 kW.
Mini Hydro Projects
Has individual units with capacity from 100 kW to 1000 kW and total capacity less than 2000 kW
Micro Hydro Projects
Has individual units with capacity upto100 kW and scheme itself has total capacity of 100 kW
2.2 ADVANTAGES OF SMALL HYDRO PROJECTS (SHP)
< Suitability for de-centralised development and hence multiple initiatives.
< Utilization of local technology and local applications
< Development of local economy. Can improve material and cultural life of local residents.
< Low cost, easy maintenance and better reliability.
< Reduced transmission loss.
< Mature technology and small investment risk compared to other renewable energy sources.
< Little environmental impact during construction, probably some positive impact on environment.
< Short gestation period, practically no resettlement, submergence or deforestation problems.

A Co-ordinated Project for Participatory Development of Small & Mini Hydel Resources in the Western Ghat s vol.I
:15:
Above all, they are usually located in rural areas, hence can be considered an important rural
energy source. They could play a significant role in rural economic development.
2.3 FACTORS FOR SHP DEVELOPMENT
Based on the experiences from various countries, the basic requirement for SHP development
can be summarised as:
< Sustainable SHP sites, with reasonable access.
< Nearness to load centres or the grid.
< Necessary funds and support.
< Local Expertise to appropriate the technology as per local requirements.
< Preferential policies from central and local government.
It has been observed that policy, funding and expertise are decisive factors to stimulate SHP
development.
2.4 BASIC PHILOSOPHY
The small/mini hydro stations don=t envisage large reservoir storage. They use run off water for
generating power. Only a small diversion weir and an intake pond are usually required. The
maximum size of the pond need not be more than one day=s inflow during lean period. The pond
normally occupies the river bed and a very small area from banks. The average requirement of
pond area is about 0.2-0.4 ha. per MW as compared to 10-15 ha. per MW in case of large
storage stations.
The SHPs run as base load stations during monsoon period, with suitable pondage design, they
can be made to run as peak load stations during summer season. So they always contribute to
peak load. The large capacity utilisation during monsoon period, in fact, helps us to preserve
water in the existing large dams, for summer. In effect, they are indirect tools for interbasin
water transfer through the process of local conservation.

A Co-ordinated Project for Participatory Development of Small & Mini Hydel Resources in the Western Ghat s vol.I
:16:
Treatment of catchment area which leads to increased subsoil retention of monsoon precipitation
has a direct impact on its economics.
Planning for large number of units simultaneously, offers the possibility of standardization and
Αmass production≅, which could lead to substantial reduction in project costs.
2.5 SHP SCENARIO
The world=s first small hydro plant was installed in USA in 1882. The first station in India, with a
capacity 139 kW, was installed at Darjeeling in 1897. This was followed by two 200 kW plants
in Simla in 1908 and later by several other installations. In India, the estimated total capacity of
small hydro projects is about 10,000 MW from 5000 to 6000 potential sites. At present, 216
plants with an installed capacity of 155.38 MW (as on 31-3-98) are under operation and 208
schemes are under construction with installed capacity of 230.4 MW. According to estimates, it
has been provisionally found that, Kerala has a maximum potential of 1000 MW. The first Hydel
system in Kerala was a mini hydel station of 450 kW capacity which was installed and operated
in Munnar in 1905. It was in the private sector and later on it was closed down. At present,
there is a private station with a capacity 2x250 kW at Vaguvarai in Munnar. ANERT has
installed 2x10 kW plants one each at Sugandhagiri and Pookkott in Wayanad district. Recently,
a power station of 5 MW has been commissioned in Maniyar, under private sector. According
to the latest reports, 4 plants with 3.5 MW have been installed and 30 plants with a total
capacity of 156.35 MW are under construction. This includes 18 projects (installed capacity
102.35 MW) being undertaken with Chineese collaboration. A few stand alone micro hydel
stations of very small capacity (kiloWatt range) have been recently commissioned in Kannur and
Idukki districts.
-��-

Chapter III
SHP DEVELOPMENT: A Cost Reduction Approach
It is a fact that the SHP potential of Kerala has been barely touched so far. Different estimates
have been made about the total potential of various small hydel locations in Kerala. Hydel
engineers with a conventional outlook have always been arguing that the small hydro is far more
costly than the large schemes. There is only potentially true in this argument. Presently, we don=t
take into account the social cost of big dams. Also we have not fully explored the possibilities of
cost reduction in the case of SHPs. Considerable scope exists for reducing the cost of the SHPs.
One method is to achieve cost reduction through standardisation.
As per the Panchayati Raj legislation, the Panchayats have been granted the power to pursue
small hydel projects. This opens up a major possibility for the Local Self Government (LSG)
institutions to take the initiative and to conduct studies on the feasibility of small hydel projects
and also to implement them. However, if such efforts are scattered and unco-ordinated, no gain
can be made from the economics of scale or number. It was felt that there is a distinct possibility
for cost reduction if a fairly large number of similar units could be planned simultaneously.
Therefore, IRTC prepared a project proposal for studying this in depth, which was approved and
funded under the Kerala Research Programme on Local Level Development (KRPLLD) scheme
of the Centre for Development Studies (CDS).
3.1 OBJECTIVES
The objectives of the study are;
< To assess the technical and economical feasibility of 30-40 sites in the western ghats.
< To carry out preliminary optimization studies to assess the energy potential and the optimal
economic level exploitation.
< To standardize turbo generator units for various heads and sizes.
< To prepare a preliminary report which would define fundamental technical concepts. Also to
propose a methodology which can be used for studying the small hydel potential along with
the relative benefits and cost for proposed programmes.
3.2 PROJECT METHODOLOGY

A Co-ordinated Project for Participatory Development of Small & Mini Hydel Resources in the Western Ghat s vol.I
:18:
To begin with, enquiries were made with all the 14 district panchayaths of our state regarding
their interest for participating in a preliminary survey to identify the small hydel sites in their
districts as part of the Western Ghats Small Hydel Programme (WGSHP). Only five district
panchayaths viz., Malappuram, Palakkad, Trissur, Idukki and Pathanamthitta responded, in spite
of personal follow up. A detailed plan was worked out for the identification of potential sites with
the help of local residents. Maximum people=s participation was ensured by involving the local
panchayats at every stage. Initially 156 sites were identified. After a preliminary screening 108
sites were short listed. All the sites were visited by the project team and 31 sites were finalised
for detailed study.
The sites were selected based on the following factors:
< availability of flow for maximum period,
< accessibility to the site,
< nearness to power grid,
< less ecological impact, and
< ease of civil construction and penstock erection
The preliminary data collection with the help of local volunteers started from March 1997
onwards. This mainly included measurement of flow and collection of physical and topographical
information. This study lasted for 52 weeks. Detailed investigations were made during 1997-99
for the preparation of drawings, design and estimate of the engineering structures proposed in the
scheme, and for the preparation of feasibility report. These are detailed below.
3.2.1 Reconnaissance survey
Before starting the topographical survey the project area was thoroughly explored, which gave an
overall idea of the site and its principal features. Possible instrument stations were located for
theodolite surveying and a topograhical survey was conducted for obtaining topographical details
of the site. The possible locations for diversion structure and power house were identified and
the details were taken using tacheometric survey.

A Co-ordinated Project for Participatory Development of Small & Mini Hydel Resources in the Western Ghat s vol.I
:19:
3.2.2 Catchment area
Topographical survey sheets to a scale of 1:50,000 are available from the Survey of India. The
catchment of each site was located using the toposheet. The total area covered under each site
was measured. The topography of each catchment area was studied in detail. Maximum flood
discharge at each site during the period 1997-99 was measured.
3.2.3 Topographical Survey
Tacheometric survey was conducted at all project sites for the preparation of contour map. A
transit theodolite having a stadia telescope was used for the purpose. The reduced levels of the
temporary bench mark was fixed to be +500.000 metres. The instrument was fixed at a station
and sighted to the levelling staff held at suitable points .The horizontal angles, vertical angle and
stadia readings were noted. A number of instrument stations were located such that enough data
were collected to prepare the contour map. We entered these collected data into a computer for
computerised calculation. These data and computed reduced levels of located points were used
for the preparation of contour map.
3.2.4 Contour map
Contour map is a drawing which shows the elevational details of a place. The data collected by
survey were used to calculate the horizontal distance, vertical distance and the reduced level of
various points on the ground. The survey details were plotted on a sheet of paper at a scale of
1:500. The undulations on the site, the location of the falls and other topographical features were
identified from the map. The location of the weir, the alignment of penstock and the location of
power house were also determined using this contour map prepared.
3.2.5 River flow data
Observations were made continuously for a period of 12 months within the time span of March
1997 to March 1999. The water level observations were taken every week. A suitable location
for guaging station was identified such that the flow at that point was identical to that at the
waterfall. The cross sectional details of the point were noted for calculating stream discharge. A

A Co-ordinated Project for Participatory Development of Small & Mini Hydel Resources in the Western Ghat s vol.I
:20:
measuring gauge was fixed at this point to measure the flow level. The peak flow was also
recorded. Using the collected data, the weekly discharge hydrograph of each site was prepared.
The services of local volunteers were utilised to the maximum possible extent for this activity.
3.2.6 Flow duration curves
The flow duration curve was obtained by plotting discharge against percentage flow of
exceedance. The power corresponding to 40% flow of exceedence has been noted for each site.
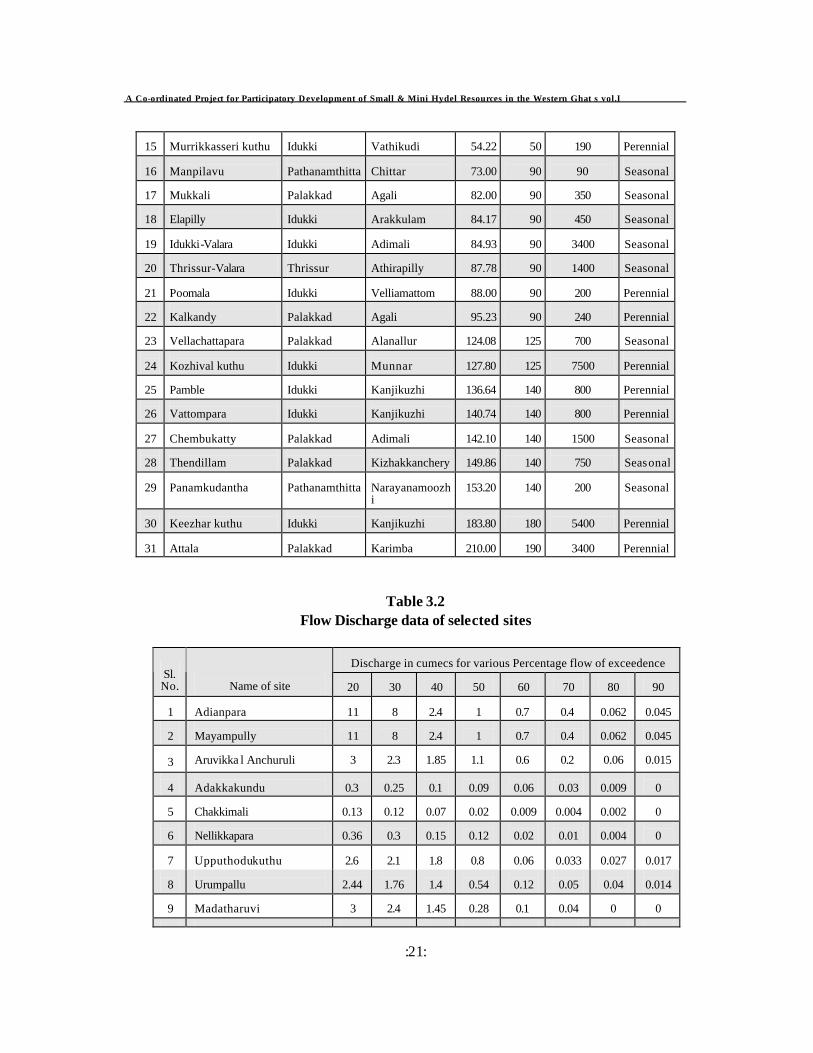
It is given in Table 3.1 as an indicator of the power potential of the site. This table also gives a
clear picture regarding location, head, type of flow and standardised head of various sites.
Discharges corresponding to various percentages of exceedence (from 20% to 90%) are
reproduced in Table 3.2. The determination of two crucial parameters, the economic potential
and choice of installed capacity is a much more complex task. This is discussed in sections 3.4
and 3.7 below.
Table 3.1 The physical features of the selected sites
Sl. No.
Name of site
District
Location
(Panchayat)
Act.
Head
Standardised Head
Power at
40% flow of exceedance
(kW)
Nature of
flow
1 Adianpara
Malappuram
Chaliar
17.62
20
360
Perennial
2
Mayampully
Malappuram
Chaliar
23.46
20
360
Perennial
3
Aruvikkal Anchuruli
Idukki
Kanchiar
21.31
20
300
Seasonal
4
Adakka kundu
Malappuram
Kalikavu
29.39
33
25
Seasonal
5
Chakkimali
Idukki
Arakkulam
32.54
33
20
Seasonal
6
Nellikkappara
Pathanamthitta
Aruvappulam
32.54
33
40
Seasonal
7
Upputhodu kuthu
Idukki
Mariyapuram
33.13
33
450
Perenial
8
Urumpallu
Idukki
Arakkulam
36.48
33
350
Seasonal
9
Madatharuvi
Pathanamthitta
Ranni
41.38
43
550
Seasonal
10
Kallimali kuthu
Idukki
Rajakkad
42.39
43
80
Seasonal
11
Gandhismarakapadi
Idukki
Kanjikuzhi
42.98
43
80
Seasonal
12
Pathinaramkandam
Idukki
Vathikkudi
45.13
43
160
Perennial
13
Thekkum thoni
Idukki
kanjikuzhi
49.00
50
525
Perennial
14
Chengara
Pathanamthitta
Konni
50.96
50
60
Seasonal
A Co-ordinated Project for Participatory Development of Small & Mini Hydel Resources in the Western Ghat s vol.I
:21:
15
Murrikkasseri kuthu
Idukki
Vathikudi
54.22
50
190
Perennial
16
Manpilavu
Pathanamthitta
Chittar
73.00
90
90
Seasonal
17
Mukkali
Palakkad
Agali
82.00
90
350
Seasonal
18
Elapilly
Idukki
Arakkulam
84.17
90
450
Seasonal
19
Idukki-Valara
Idukki
Adimali
84.93
90
3400
Seasonal
20
Thrissur-Valara
Thrissur
Athirapilly
87.78
90
1400
Seasonal
21
Poomala
Idukki
Velliamattom
88.00
90
200
Perennial
22
Kalkandy
Palakkad
Agali
95.23
90
240
Perennial
23
Vellachattapara
Palakkad
Alanallur
124.08
125
700
Seasonal
24
Kozhival kuthu
Idukki
Munnar
127.80
125
7500
Perennial
25
Pamble
Idukki
Kanjikuzhi
136.64
140
800
Perennial
26
Vattompara
Idukki
Kanjikuzhi
140.74
140
800
Perennial
27
Chembukatty
Palakkad
Adimali
142.10
140
1500
Seasonal
28
Thendillam
Palakkad
Kizhakkanchery
149.86
140
750
Seasonal
29
Panamkudantha
Pathanamthitta
Narayanamoozhi
153.20
140
200
Seasonal
30
Keezhar kuthu
Idukki
Kanjikuzhi
183.80
180
5400
Perennial
31
Attala
Palakkad
Karimba
210.00
190
3400
Perennial
Table 3.2 Flow Discharge data of selected sites
Discharge in cumecs for various Percentage flow of exceedence Sl. No.
Name of site
20
30
40
50
60
70
80
90
1
Adianpara
11
8
2.4
1
0.7
0.4
0.062
0.045
2
Mayampully
11
8
2.4
1
0.7
0.4
0.062
0.045
3
Aruvikka l Anchuruli
3
2.3
1.85
1.1
0.6
0.2
0.06
0.015
4
Adakkakundu
0.3
0.25
0.1
0.09
0.06
0.03
0.009
0
5
Chakkimali
0.13
0.12
0.07
0.02
0.009
0.004
0.002
0
6
Nellikkapara
0.36
0.3
0.15
0.12
0.02
0.01
0.004
0
7
Upputhodukuthu
2.6
2.1
1.8
0.8
0.06
0.033
0.027
0.017
8
Urumpallu
2.44
1.76
1.4
0.54
0.12
0.05
0.04
0.014
9
Madatharuvi
3
2.4
1.45
0.28
0.1
0.04
0
0

A Co-ordinated Project for Participatory Development of Small & Mini Hydel Resources in the Western Ghat s vol.I
:22:
10 Kallimalikuthu 1.4 0.72 0.24 0.07 0.04 0.03 0.015 0 11
Gandhismarapadi
0.45
0.32
0.26
0.14
0.095
0.011
0.004
0
12
Pathinaramkandam
0.6
0.53
0.5
0.44
0.38
0.25
0.16
0.15
13
Thekkumthoni
2.44
1.76
1.4
0.53
0,08
0.012
0.002
0
14
Chengara
0.21
0.19
0.15
0.065
0.008
0
0
0
15
Murrikkasserikuthu
0.6
0.53
0.5
0.44
0.38
0.25
0.16
0.15
16
Manpilavu
0.96
0.36
0.24
0.16
0.055
0.02
0
0
17
Mukkali
0.71
0.65
0.52
0.42
0.15
0.099
0.04
0
18
Elapilly
1.13
0.99
0.66
0.22
0.064
0.027
0.012
0
19
Idukki-Valara
10.7
7.52
5.02
1.18
0.69
0.13
0.004
0
20
Thrissur-Valara
2.54
2.27
2.04
1.5
0.2
0.1
0.02
0
21
Poomala
1.41
1.29
0.3
0.18
0.063
0.035
0.022
0.012
22
Kalkandy
1.6
0.78
0.35
0.29
0.23
0.16
0.12
0.001
23
Vellachattapara
2.25
1.5
0.73
0.5
0.09
0.06
0.009
0
24
Kozhival kuthu
13
10
8
3
1.2
0.75
0.6
0.35
25
Pamble
3.58
2.45
0.76
0.43
0.25
0.07
0.04
0.024
26
Vattompara
3.58
2.45
0.76
0.43
0.25
0.07
0.04
3.58
27
Chembukatty
5
3
1.47
0.5
0.2
0.02
0.01
0.009
28
Thendillam
2.4
1.4
0.7
0.33
0.11
0.04
0
0
29
Panamkudantha
0.62
0.524
0.2
0.11
0.04
0.009
0
0
30
Keezhar kuthu
7
6
4
1
0.48
0.36
0.1
0.02
31
Attala
3.65
3.05
2.5
1
0.6
0.18
0.14
0.1
3.2.7 Flood flow determination
There are various empirical methods for calculating maximum flood discharge. The calculations
were done using Dicken=s formula, Inglis Formula, Ryve=s formula and also the Nowab Jung
Bahadur Formula. Out of these the Dicken=s Formula is said to be the most suitable for Wetern
Ghat region and has been used in this project for the structural design.
3.2.8 Use of pondage to meet peak load
In smaller streams the flow is highly variable. In several cases, the flow thins out considerably

A Co-ordinated Project for Participatory Development of Small & Mini Hydel Resources in the Western Ghat s vol.I
:23:
during the lean season. A pondage system which stores the inflow during off peak hours and
helps to generate useful power during peak hours suggested. But a few of the streams run dry in
summer and hence cannot contribute even to peak capacity during the lean season. Still they can
be used for energy contribution during monsoon period. As the monsoon fades out, the inflow
decreases, and the machines will not be able to work continuously. But still they can work either
at part load, or at full load for reduced periods, taking advantage of the pondage. If we follow
the latter mode, each unit will be delivering full load whenever it is working. When the pond level
falls below the draw down level, the machine can be shut down until the pond fills up again.
3.3 POWER POTENTIAL
The power potential P of a site in Watts is given by the formula
P = η γ Q H
where, η = Efficiency of turbogenerator system
γ = ρ (density of water in kg/m3) x g (acceleration due to gravity in m/sec2)
Q = Discharge in cumecs (m3/sec)
H = Head in meters.
η - can be taken to be, say 75% or 0.75
γ = 1000 kg/m3 x 9.81m/sec2 = 9810 kg/m2/sec2 � 10,000 kg/m2/sec2
Therefore, power P (W) = 0.75 x 10,000 (kg/m2/sec2) x Q (m3/sec) x H (m)
Or P = 7.5 Q H (kW)
3.4 SELECTION OF UNIT SIZE
For optimization of unit size, the following parameters were assumed.
Rate of return on investment - 15%

A Co-ordinated Project for Participatory Development of Small & Mini Hydel Resources in the Western Ghat s vol.I
:24:
Loan repayment period - 10 years
Average O&M cost - 2.5% of capital cost
Resulting standard annual cost - 25%
(This consists of 2.5% O & M costs, 15% return on 25% equity, 15% interest on 75% loan and
repayment of loan in 10 annual instalments)
Tariff (per Unit) - Rs. 2.5 and 3.0 (Two cases)
Investment cost (Rs.in Crores per MW) - 3.0, 3.5 (Two cases)
Since manufacturers were not in a position to quote exact figures, no attempt was made to fine
tune the cost in relation to site specific conditions. Only ranges could be indicated. Each
combination of tariff and capital cost selected above, will demand a minimum annual generation
per kW installed if the proposal is to be profitable. This can be taken to be the break even plant
capacity factor (PCF) for the site under the specified conditions.
Lower the cost/MW and higher the price for energy, the larger will be the economically viable
installed capacity and the quantity of energy that can be economically extracted from a given site.
As an example, let the capital cost of Pamble (Site No.25) be Rs. 3.5 crores/MW. The annual
rate is 25%. Let the unit rate of tariff offered by K.S.E.B be Rs. 2.5/kWh.
If X be the number of hours of operation at full load capacity,
per Mega Watt annual cost, at the rate of 25% on investment = Rs. 3.5 Crores x 0.25
per Mega Watt revenue = 1000 kW x Rs. 2.5 x X
Equating the two, we get 3,50,00,000 x 0.2.5 = X x 1000 x 2.5
X = 3,500 hrs.
It follows that, any combination of machines, that can work at full capacity for over 3500 hours,

A Co-ordinated Project for Participatory Development of Small & Mini Hydel Resources in the Western Ghat s vol.I
:25:
can deliver a profit, if the overall project cost is below Rs. 3.5 crores/MW and tariff is Rs. 2.5
per kilo Watt hour.
This can be explained better in terms of Plant Capacity Factor, which is defined as the ratio of
the actual amount of energy obtained, to the maximum energy that can be obtained from the given
installed capacity, during an year.
ie, PCF = Installed capacity x Actual working hours/Installed capacity x 365x24.
In this case, for the value of X = 3500 hours, PCF = (3500 / 8760) x 100 = 40%
That is, a maximum capacity, which yields a PCF of 40% under the given flow conditions, is
economically viable for this site.
From the Flow Duration Curve and Chart for the Pamble Site (reproduced as Fig 3.1 and Table
3.1 respectively), it is seen that a capacity of about 750 kW can be maintained for almost 40% of
the time. The corresponding discharge in 0.714 m3/s.
The yield from this machine will consist of two parts;
1. When the machine is working at full capacity continuously, during the flood season, when the
flow exceeds 0.714 m3/s. From the graph and chart, this occours for about 39.35% of the
time, or for about 3447 hours. The energy output for this duration is 2.585 MU.
2. Energy can also be generated at full capacity, by making use of the pondage, for a few hours
a day, even when the inflow is less than 0.714m3/s. The total contribution from this mode of
operation is equal to the energy potential of the total discharge below the 0.714 cumec limit.
This is calculated and indicated in the flow data chart (Table 3.3) and is seen to be 0.870 MU.
Thus the total energy yield from the 750 kW machine will be 3.455 MU. This works out to a
PCF of 3.455 x 10⁶ / (750 x 8760) = 0.525 or 52.5%.
Since this PCF is higher than the break even value, we can check the feasibility for still higher
capacities, following a similar procedure.

A Co-ordinated Project for Participatory Development of Small & Mini Hydel Resources in the Western Ghat s vol.I
:26:
For an installed capacity of 1000 kW, which corresponds to about 37.5% flow of exceedence
from the chart, the total energy yield is the sum of:
(1) 1000 kW x (0.375 x 8760) = 3.285 MU at continuous operation, and (2) 1.085 MU, which
is the cumulative energy potential, as obtained from the Chart (Table 3.3)
Total Yield = 3.285 + 1.085 = 4.37 MU.
The plant capacity factor, corresponding to this yield is given by :
PCF = 4.37 x 10⁶ / (1000 x 8760) =0. 5 or 50%.
Similarly, For 2.5 MW, (for 30% flow of exceedence)
PCF = (8610000/ 2500 x 8760) x 100 = 39.3%
This PCF is approximately equal to the break even value of 40%.
So 2.5 MW will be the optimum choice for the site, if the overall project cost is below Rs. 3.5
crores/MW and tariff is Rs. 2.5 per kilo Watt hour.
The units selected can be one of the following combinations:
(1MW x 2 + 0.5 MW x 1) or (2MW x 1 + 0.5 MW x 1) or (1MW x 1 + 0.5 MW x 3) or even
(0.5MW x 5).
The last is very unlikely as the cost per MW will go up significantly as the number of units
increases too much. The second option has limited manoeuvrability to take advantage of the
pondage, when the inflow falls. The choice between 1st or 3rd options will depend on the total
picture that emerges from the entire family of sites.
Similarly, maximum possible capacities for four different combinations of tariffs and investment
costs can be calculated as indicated below:
The combinations considered are;
Tariffs (per Unit) - Rs. 2.5 and 3.0 (Two cases)

A Co-ordinated Project for Participatory Development of Small & Mini Hydel Resources in the Western Ghat s vol.I
:27:
Investment cost (Rs.in Crores per MW) - 3.0, 3.5 (Two cases)
Break even PCF for Rs. 2.5/unit and Rs. 3 Crores
per maga watt is - 34%
Break even PCF for Rs. 3 / unit and Rs. 3 Crores
per mega watt is - 28.5%
Break even PCF for Rs. 3 / unit and Rs. 3.5 Crores
per mega watt is - 33.3%
The maximum possible economically viable capacity for all these four cases are shown in Table
3.4
Table 3.4 Economically Viable Maximum Capacity at Different Costs and Tariff
Rs.3.0 Crores/MW
Rs.3.5 Crores/MW
Rs.2.5/Unit
4 MW
2.5 MW
Rs.3.00/ Unit
5.5. MW
4 MW
3.5 STANDARDISATION AS A MEANS FOR COST REDUCTION
3.5.1. The case for standardisation
One reason for the comparatively high cost of small hydro equipment is that the turbines, usually
one of a kind, require a high cost for design and development. If we can choose a large number
of turbines of identical specifications (head and discharge), the development cost as well as
fabrication cost can be reduced considerably. Naturally, we may not get exactly identical sites.
So some deviation in head and flow rate may have to be conceded by making a compromise
between the saving in cost as a result of standardisation and the loss in revenue as a result of
lower energy generation.
In this project, we have tried to strike a balance between these two and to evolve a new
approach to cost reduction through standardisation.

A Co-ordinated Project for Participatory Development of Small & Mini Hydel Resources in the Western Ghat s vol.I
:28:
3.5.2. Categorisation of sites according to head
The effective head available at these 31 sites varied from 17.62m at Adianpara to 210m at Attila.
Tentatively, these 31 sites are clubbed into 9 head groups: 20m (3), 33m (5), 43m (4), 50m (3),
90m (7), 125m (2), 140m (5), 180m (2).This is indicated in Table 3.1. Using the concept of
economic return, the minimum number of hours that a unit should run in an year (or the break
even plant capacity factor) was worked out for every site (page no.19). On the basis of this
criterion, the maximum installed capacity of each site was finalised. The turbine sizes were
selected judiciously. For every site, a combination of given turbine unit sizes. - 0.25MW,
0.5MW, 1MW, 1.5MW, 2MW, 5MW were chosen to satisfy capacity requirement.
From budgetary quotations obtained, it is clear that a cost reduction of at leat 15% or above is
possible if we order for multiple units (ie, say 4 units of the same turbine, at a time). We can
make use of this favourable situation by selection of convenient sized units which add up to the
total requirement for each site. Needless to say, this methodology has to be carefully applied by
treating the entire family of sites as part of a single system.
3.6 CIVIL WORKS
Each site requires a diversion weir and an intake structure. The height of the weir is so adjusted
as to create a pond with a capacity to hold, as far as possible, one full day=s inflow during lean
months. This stored water will be fully utilized to operate the turbine at full load for about 3 to 4
hours, during the peak load time. The machine is shut down for the rest of the day. When the
inflow is larger during monsoon and at times during occasional showers between monsoons, the
machines can be operated in two or more spells of three to four hours each, or even continuously.
Thus, through a judicious mix of continuous and intermittent operation, one can extract maximum
energy from any given site. Feasible dam height, area of submergence etc., too will have to be
considered while finalising the pondage.
3.7 DESIGN CONSIDERATIONS FOR CIVIL WORKS
The important civil engineering works required for the project are a weir, intake structure,
penstock and a power house. A weir is constructed to have a small storage and to divert the

A Co-ordinated Project for Participatory Development of Small & Mini Hydel Resources in the Western Ghat s vol.I
:29:
water from stream to the intake. The intake structure takes water from the weir and leads it to
the penstock. The penstock is a pressure pipe which carries water to the turbine. It can be
made of steel, cast iron, plastics (Poly Vinyl Chloride, High Density Poly Ethylene) and concrete.
A power house is required for the purpose of housing the electro mechanical equipment. It can
very well be a small building of one or two rooms.
3.7.1 Design of Weir
Stability Analysis: A gravity dam is a structure which is designed in such a way that its own
weight resists the external forces. The preliminary analysis of all gravity dams can be made easily
by isolating a typical cross section of the dam of unit width. This section is assumed to behave
independently of the adjoining sections. In other words, the dam is considered to be made up of
a number of cantilevers of unit width each, which act independently of each other. This
assumption of independent functioning of each section disregards the beam action in the dam as a
whole.
The stability of dam can be analysed in the following steps.
1. Consider unit length of dam.
2. Work out the magnitude and direction of all vertical forces acting on the dam and their
algebraic sum i.e., Σ V.
3. Similarly work out all the horizontal forces and their algebraic sum i.e, ΣH.
4. Determine the leverarm of all these forces about the toe.
5. Determine the moments of all these forces about the toe and find out the algebraic sum of all
these moments i.e., Σ M.
6. Find out the location of the resultant force by determining its distance from toe.
x=ΣM/Σ V.
7. Find out the eccentricity (E) of the resultant (R) using E=B/2-x. It must be less than B/6
inorder to ensure that no tens ion is developed anywhere in the dam.
8. Determine the vertical stress at the toe and the heel using p=(Σ V/B) x (1∀6e/B).
A Co-ordinated Project for Participatory Development of Small & Mini Hydel Resources in the Western Ghat s vol.I
:30:
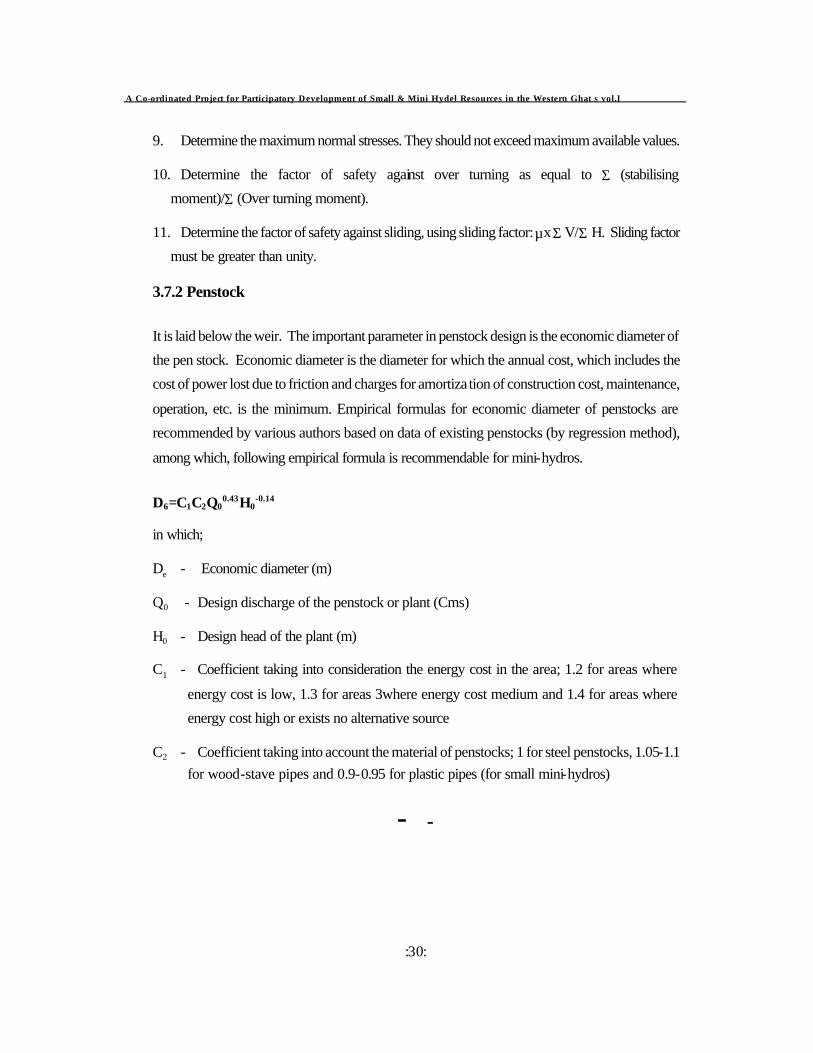
9. Determine the maximum normal stresses. They should not exceed maximum available values.
10. Determine the factor of safety against over turning as equal to Σ (stabilising
moment)/Σ (Over turning moment).
11. Determine the factor of safety against sliding, using sliding factor: µx Σ V/Σ H. Sliding factor
must be greater than unity.
3.7.2 Penstock
It is laid below the weir. The important parameter in penstock design is the economic diameter of
the pen stock. Economic diameter is the diameter for which the annual cost, which includes the
cost of power lost due to friction and charges for amortization of construction cost, maintenance,
operation, etc. is the minimum. Empirical formulas for economic diameter of penstocks are
recommended by various authors based on data of existing penstocks (by regression method),
among which, following empirical formula is recommendable for mini-hydros.
D6=C1C2Q00.43H0
-0.14
in which;
De - Economic diameter (m)
Q0 - Design discharge of the penstock or plant (Cms)
H0 - Design head of the plant (m)
C1 - Coefficient taking into consideration the energy cost in the area; 1.2 for areas where
energy cost is low, 1.3 for areas 3where energy cost medium and 1.4 for areas where
energy cost high or exists no alternative source
C2 - Coefficient taking into account the material of penstocks; 1 for steel penstocks, 1.05-1.1
for wood-stave pipes and 0.9-0.95 for plastic pipes (for small mini-hydros)
-��-

Chapter IV
CONCLUSIONS AND RECOMMENDATIONS
4.1 RESULTS
The results pertaining to the 31st sites are presented in Part II of the this report. Table 4.1 and
Table 4.2 show the summary of results and the results of standardisation. The following
conclusions are based on those results.
Table 4.1 Economically viable proposed unit size
Sl. No.
Name of site
Tariff
(Rs./Unit)
Installed Capacity
for Rs.3.5 crores/MW
Proposed Unit size
2.50
1 MW
0.5 MW x 2
1
Adianpara
3.00
1.75 MW
1MW x 1+ 0.5MWx1+ 0.25MWx1
2.50
1 MW
0.5 MW x 2
2
Mayampully
3.00
1.75 MW
1MW x 1+ 0.5MWx1+ 0.25MWx1
2.50
550 kW
500 kW x 1+ 50 kW x 1
3
Aruvikkal Anchuruli
3.00
650 kW
500 kW x1+100 kW x 1+ 50 kWx1
2.50
100 kW
100 kW x 1
4
Adakkukundu
3.00
125 kW
100 kW x 1 + 25 kW x 1
2.50
40 kW
50 kW x 1
5
Chakkimali
3.00
50 kW
50 kW x 1
2.50
100 kW
100 kW x 1
6
Nellikkappara
3.00
125 kW
100 kW x 1 + 25 kW x 1
2.50
750 kW
500 kW x 1+ 250 kWx1
7
Upputhodukuthu
3.00
1 MW
500 kW x 2
2.50
450 kW
250 kW x 2
8
Urumpallu
3.00
750 kW
500 kW x 1+ 250 kWx1

2.50
75 kW
50 kW x 1 + 25 kWx1
9
Madatharuvi
3.00
150 kW
100 kW x1 + 50 kW x 1
2.50
200 kW
100 kW x 2
10
Kallimalikuthu
3.00
450 kW
250 kW x 2
2.50
150 kW
100 kW x 1 + 50 kW x 1
11
Gandhismarakappadi
3.00
250 kW
100 kW x 2 + 50 kW x 1
2.50
350 kW
250 kW x 1+ 100 kW x 1
12
Pathinaramkandam
3.00
450 kW
250 kW x 2
2.50
1 MW
500 kW x 2
13
Thekkumthoni
3.00
1.5 MW
1 MW x 1 + 0.5MW x 1
2.50
90 kW
50 kW x 2
14
Chengara
3.00
100 kW
50 kW x 2
2.50
550 kW
500 kW x 1+ 50 kW x 1
15
Murikkasseri kuthu
3.00
650 kW
500 kW x 1+ 100 kW x 1 + 50kWx1
2.50
250 kW
250 kW x 1
16
Manpilavu
3.00
400 kW
250 kW x 1+ 100 kW x 1
2.50
650 kW
500 kW x 1 + 100 kW x 1 + 50kWx1
17
Mukkali
3.00
750 k W
500 kW x 1 + 250 kW x 1
2.50
850 kW
500 kW x1 + 250 kW x1 + 100kWx 1
18
Elappilly
3.00
1 MW
500 kW x 1 + 250 kW x 2
2.50
7 MW
5 MW x 1 + 1 MW x 2
19
Idukki - Valara
3.00
10 MW
5 MW x 1 + 2 MW x 2 + 1MWx1
2.50
2.5 MW
1 MW x 2 + 0.5 MW x 1
20
Thrissur - Valara
3.00
3 MW
1 MW x 3
2.50
850 kW
500 kWx1 + 250 kWx1 + 100 kWx 1
21
Poomala - Njandirukki
3.50
1.1 MW
500 kW x 2 + 100 kW x 1
2.50.
950 kW
500 kW x 1 + 250 kW x 2
22
Kalkandi
3.50
1.25 MW
500 kW x 2 + 250 kW x 1
2.50
2 MW
1 MW x 1 + 500 kW x 2
23
Vellachattappara
3.50
2.75 MW
2 MW x 1 + 500 kW x 1 + 250kW x 1

2.50
13 MW
5 MW x 2 + 1 MW x 3
24
Kozhivalkuthu
3.50
16 MW
5 MW x 3 + 1 MW x 1
2.50
2.5 MW
1 MW x 2 + 0.5MW x 1
25
Pamble
3.50
4 MW
2 MW x 1 + 1 MW x 2
2.50
2.5 MW
1 MW x 2 + 0.5MW x 1
26
Vattompara
3.50
4 MW
2 MW x 1 + 1 MW x 2
2.50
4MW
2 MW x 1 + 1 MW x 2
27
Chembukatty
3.50
6 MW
2 MW x 3
2.50
2 MW
1 MW x 1 + 500 kW x 2
28
Thendillam
3.50
3 MW
2 MW x 1 + 1 MW x 1
2.50
450 kW
250 kW x 2
29
Panamkudantha
3.50
650 kW
500 kW x 1 + 100 kW x 1+ 50kW x 1
2.50
10.5 MW
5 MW x 2 + 500 kW x 1
30
Keezharkuthu
3.50
13 MW
5 MW x 2 + 1 MW x3
2.50
6 MW
2 MW x 3
31
Attala
3.50
7.5 MW
5 MW x 1 + 2 MW x1 +500kW x 1
Table 4.2 Total number of units for the combination of Rs. 2.5 / Unit and Rs. 3.5 Cr / MW
Head in meters
No. of units size MW
20
33
43
50
90
125 140
180
0.025
1
0.05
1
1
2
3
1
0.10
2
4
3
0.25
3
1
1
4
2
0.50
5
1
3
5
2
4
1
1
5
4
7
2
1
3
5
1
2
2
4.2 CONCLUSIONS
< The present project is an attempt to use standardisation as a method of cost reduction in
Small Hydel Projects. This has been brought out by examining a limited sample of 31 sites.
These sites have been identified with the help of local residents after inspecting 156 possible
locations in 5 districts. The results show that a sufficiently large number of units are required
so as to warrant attempts at standardisation. This demands that a large number of sites are
taken up for implementation in a co-ordinated manner.
< A most important finding of the study is that the economical size and yield from a given site
could go up significantly (by as much as 50% or even more) if the permissible tariff is
increased from Rs.2.50/kWh to Rs.3.0/kWh. This shows the importance of having an
enlightened policy in this regard.
< This sample is by no means exhaustive, even within the chosen districts. We are sure that
many more sites can be identified by conducting an exhaustive search of all the 14 districts.
However, such an investigation was outside the scope of the present work, and has not
been attempted. Yet this is something which has to be done. The district panchayaths
should take this up on a priority basis.
< The implementation of these projects should be undertaken on a co-ordinated basis. Only
then can we take advantage of the possibilities of standardisation. Projects involving units of
a given size should be taken up together, or in sequence, so that orders can be placed for
equipment of identical specifications, in a large number.
< This naturally precludes assigning possible project sites to Independent Power Producers
(IPP) on a first come first served basis. On the other hand, there should be a concerted and
co-ordinated effort on the part of a designated Nodal Agency, which should prepare the
Detailed Project Reports (DPRs) and assign specific projects according to a predetermined
schedule of implementation. Too many members contesting among themselves, often
working at cross purposes, and competing for the most promising sites, is a situation to be

A Co-ordinated Project for Participatory Development of Small & Mini Hydel Resources in the Western Ghat s vol.I
:35:
avoided, at all costs.
4.3 RECOMMENDATIONS
Even though the study did not address the specific issue of management, in view of the experience
we gained through the interaction with various agencies and stake holders, the following
recommendations have been formulated.
< Grama Panchayat should be encouraged to conduct/commission feasibility studies of
potential SHP sites within their area.
< Projects up to 100 kW could be undertaken by the grama panchayats for implementation.
Bigger projects may be taken up by Jilla Panchayats.
< The procedure for granting clearances should be simplified and decentralised.
< The Power Plant and Distribution System for stand alone systems should be managed by a
local beneficiary committee. Grid connected systems should be managed by Small Hydel
Companies formed at the district level.
< For grid connected systems, the power has to be sold to the State Electricity Board at an
agreed tariff rate. The guidelines on pricing, prescribed by MNES can be followed. For
the stand alone system, the power is distributed according to the needs of the locality and
the tariff for power consumption can be fixed on a Αcost plus≅ basis.
< The capital for the project may be raised from Bank Loans, Shares, Donation , etc. Equity
can be collected from beneficiaries, including Local Self Government Institutions (LSGIs).
< SHP development offers an excellent industrial opportunity. This can be usefully integrated
with the planning for the industrial sector. It is desirable and viable to form a consortium of
already existing public sector technical units in the state, that have so far shown initiative in
such projects. Turbine, electrical equipment including alternators and transformers and even

A Co-ordinated Project for Participatory Development of Small & Mini Hydel Resources in the Western Ghat s vol.I
:30:
penstocks can be locally manufactured. This will have a salutary effect on our economy.
< The formulation of a master plan for harnessing the Small Hydro Potential of the state is
necessary, if advantage is to be taken of the benefits of standardization. A sequential
programme to take up the various sites can then be worked out. This should be the
responsbility of the designated nodal agency. Implementation can be done by NGOs - in
the case of micro hydro projects, or district power companies in the case of mini and small
hydro projects. Local Self Government Institutions (LSGIs)can extend financial support.
< The role of the government and the KSEB should be that of facilitators. The KSEB should
be obliged to purchase any power produced by any enterprise at a pre-fixed price. This
price can be fixed by state government and revised from time to time in accordance with the
guidelines of the MNES. The importance of offering a reasonable purchase price, and its
impact on enhancing the economically exploitable potential is clearly brought out by the
study. It is seen that even within this limited sample, if the purchase price is raised by 20%
(from Rs.2.50 to Rs.3.00 per kWh), the economic potential goes up by 35% (from 62.405
MW to 84.15 MW)
-��-

A Co-ordinated Project for Participatory Development of Small & Mini Hydel Resources in the Western Ghat s vol.I
:32:
VOLUME II: SITE SPECIFIC DETAILS
1. Adianpara 2. Aruvikkal Anchuruli 3. Mayampilly 4. Adakkakundu 5. Chakkimali 6. Nellikkapara 7. Upputhodukuthu 8. Urumpallu 9. Madatharuvi 10. Kallimali 11. Gandhi Smarakappady 12. Pathinaramkandam 13. Thekkumthoni 14. Chengara 15. Murikkasseri 16. Manpilavu 17. Mukkali 18. Elappilly 19. Valara (Idukki) 20. Valara (Thrissur) 21. Poomala 22. Kalkandy 23. Vellachattapara 24. Kozhivalkuthu 25. Pamble 26. Vattompara 27. Chembukatty 28. Thendillam 29. Panamkudantha 30. Keezharkuthu 31. Attala
Annexure-B

A Co-ordinated Project for Participatory Development of Small & Mini Hydel Resources in the Western Ghat s vol.I
:33:
List of Identified Small Hydel Sites of Our State
Category
Sl. No.
District
Rivers
No. of
sites
Capa-
city (MW)
Small
Mini
Micro
Energy (MU)
1
Kasaragod
Chandragiri, Kariangode
7
5.15
1
6
0
17.93
2
Kannur
Kariangode, Kuppam, Valapattanam
31
47.05
9
22
0
136.28
3
Kozhikkode
Chaliyar, Mahe, Kuttiadi
34
154.00
17
17
0
386.15
4
Wynad
Chaliyar, Kabani
13
20.65
4
9
0
68.37
5
Malappuram
Chaliyar
27
27.86
4
22
1
81.42
6
Palakkad
Bharatapuzha, Chalakudi
24
39.12
9
10
5
100.21
7
Thrissur
Chalakudi, Keecheri
12
42.30
6
6
0
120.65
8
Eranakulam
Periyar
4
12.60
3
1
0
117.74
9
Kottayam
Manimala, Pamba, Meenachal
4
11.65
2
2
0
35.54
10
Idukki
Muvattupuzha, Periyar
84
163.89
35
48
1
631.14
11
Pathanamthitta
Pamba, Pallickalaar
28
48.55
14
14
0
243.95
12
Alappuzha
-
0
0.00
0
0
0
0.00
13
Kollam
Kallada, Ailarakode
7
5.80
3
4
0
69.33
14
Thiruvananthapuram
Karamana, Neyyar, Vamanapuram
10
7.33
2
7
1
39.63
Total
285
585.95
109
168
8
2048.34
1. Just identified 128
4. Detailed Investigation Done 32
7. Chinese Co-op. Schemes 18

A Co-ordinated Project for Participatory Development of Small & Mini Hydel Resources in the Western Ghat s vol.I
:34:
18 2. Preliminary Investigation Done 39
5. Allotted/Agreement Signed 12
8. Under Construction 7
3. Feasibility Survey Done
39
6. To be Done by KSEB
6
9. Commissioned 4
Total - 285
1. ADIANPARA
District : Malappuram
Panchayath : Chaliyar
Head : 20 m.
Flow : Perennial
Suggested Capacity : 1000kW/1750kW

WGSHP - Final Report (Vol.II) Adianpara
Integrated Rural Technology Centre, Palakkad 1.1
1.1 GENERAL
1.1.1 The site
Adianpara is a scenic water fall located in the Ist ward of Chaliyar Grama Panchayath in
Malappuram district. The site is at a distance of 10 km from Nilambur. There is bus route from
Nilambur to Namboorippady which is motorable through out the year. From there also buses are
available to Muttiel except in monsoon season. Jeep services are available through out the year.
From Muttiel there is only 1 km to the site and a motorable road reaches very near the site. The
nearest 11 KV line is about 1.75 km away from site.
The water fall is located at 76o 12' 15"E longitude and 11o 21' 5" N latitude. The catchment area
measured from toposheet is 28.50 sq.km. The fall is situated at an elevation of 360m from MSL,
in Kanjirappuzha stream which begins at an elevation of 1442m from MSL. It is flowing almost
in a moderate slope after the fall and joins the Chaliyar river which drains into the Arabian sea.
There is another fall on the upstream side of this fall which is called Mayampilly. The location map
of the site is shown in Fig.No. 1.1.
1.1.2 Topography
The site is situated in the Nilambur forest which is very dense. The land is having moderate slope
in this area. There is no possibility of land slide. The chances for soil erosion are very less. Both
sides of the stream and its upstream have sheet rocky surface. There is a gorge of 2.5 m wide on
the upstream side of the fall. The site is perennial. Number of rainy days exceeds 50% in its
catchment.
1.2 FIELD INVESTIGATION
1.2.1 Reconnaissance survey
A topographical survey was conducted for obtaining topographical details of the site. There is
one main fall which gives a total head of 20m. The possible location for diversion structure and
power house were identified and the details were taken using tacheometric method of surveying.

WGSHP - Final Report (Vol.II) Adianpara
Integrated Rural Technology Centre, Palakkad 1.2
1.2.2 Catchment area
Topographical survey sheets to a scale of 1:50,000 are available from the Survey of India. The
catchment of Adianpara site was located using the toposheet. It is shown in Fig.No.1.2. The
total area of catchment is measured and it comes to nearly 28.50 sq km. The catchment area is
having almost moderate slope but some portions are very steep. Maximum flood discharge
measured at this site during 1998 is about 20 cumec
1.2.3 Contour map
The survey details were plotted on a sheet of paper at a scale of 1:200 (Annexure A.1). The
undulations of the site, the location of the falls and other topographical features were identified
from the contour map. The location of the weir, the alignment of the penstock and location of the
power house were also determined using this and marked in the above map, along with the
contours of the area.
1.2.4 River flow data
For a period of 12 months (December 97 to December 98) the water level observations were
taken every week. A suitable location was identified on the upstream of the fall, where the whole
water is flowing through that point, and the cross sectional details of that point were noted for
calculating the stream discharge. A measuring gauge was fixed at that point to measure the peak
flow. Using the collected data (Table 1.1) the weekly discharge hydrograph of the site was
plotted. It is given in Fig. No. 1.3.
1.2.5 Flow duration curve
Using weekly discharge hydro graph, percentage flow of exceedence was calculated. From this,
the flow duration curve was plotted (Fig. No. 1.4). The same curve also functions as percentage
flow of exceedence graph. This river flow data is recalculated in tabular form, giving the
corresponding energy potential in weekly and cumulative mode is given in Table 1.2. These data
are used for calculating energy potential and selection of unit sizes in section 1.4.
1.2.6 Peak flow determination
There are various empirical methods for calculating the maximum flood discharge. The different
values obtained are shown in Table 1.3. The value obtained from Dicken=s formula, which is

WGSHP - Final Report (Vol.II) Adianpara
Integrated Rural Technology Centre, Palakkad 1.3
commonly used for Western Ghats region has been used for the structural design of diversion
structure.
Table 1.3
Peak Flow Determination
Parameters
Dicken=s method
Ingli=s formula
Ryve=s formula
Nawab Jung
Bahadur formula
Peak flow in cumecs
307.96
543.04
90.90
826.45
1.3 SALIENT DESIGN FEATURES
A detailed design of Civil, Electrical and Mechanical work has not been carried out in this report
as it does not come under the purview of the project. But a typical section of the proposed
diversion structure is given here. The stability analysis of the section and economic diameter of
the penstock was carried out as part of preliminary design. The capability and number of units,
type and specification of turbine and generator and it=s cost have been estimated after consulting
various agencies.
1.3.1 Power potential of the project
From the flow duration curve the discharge corresponding to 98% is only 0.02 cubic metre per
second. A discharge of 0.02 cubic metre per second can produce only about 3 kW. However it
seen that much higher flows are available during 50% of the time. In order to tap the full potential
of the site, with a head of 20 metre, the project is designed to generate higher output with lower
dependability. This site can be designed as a run of the river project to produce 150 kW with a
dependability of 50%, or 360 kW with a dependability of 40%.
The output power was computed using the formula, P = 10 x Q x H x η
Where; P = Power output in kW
Q = Discharge in cumec
H = Head in metres

WGSHP - Final Report (Vol.II) Adianpara
Integrated Rural Technology Centre, Palakkad 1.4
Referring to table 1.2, η = Overall efficiency (Here it is assumed as 0.75).
For 50% exceedence, Q=1m3/s, P = 10 x 1.00 x 20 x 0.75 = 150 kW.
For 40% exceedence, Q=2.4m3/s, P = 10 x 2.4 x 20 x 0.75 = 360 kW.
For 30% exceedence, Q=7m3/s, P = 10 x 7x 20 x 0.75 = 1110 kW.
1.3.2 Energy potential
At this site, sufficient flow is there so that we can obtain 1000kW power output for about 30% of
the time. The output reduces to 360kW if we take the percentage flow of exceedence as 40%.
The energy input corresponding to 30% exceedence will be (30/100 * 1000 * 365 * 24) =
2.69 MU. The flow after 30% time can be utilized by providing a small pondage. The quantity
of water available from 30% to 100% time is calculated to be 22848135m3. Energy obtained
from this water is calculated to be 0.952 MU.
Total amount of energy produced = 2.69 MU + 0.952 MU = 3.64 MU.
It may be noted that, this much amount of energy can be generated for the particular year of
measurement. If higher flows are available during any year, it will enable higher production and
vice versa.
1.3.3 Pondage requirement
A plot of surface area Vs. elevation is given in Fig.No.1.5. The areas corresponding to each
elevation is used to find the volume of water that can be stored in each elevation and the details
are shown in Table 1.4.. From this information, a capacity elevation curve of the pondage is
prepared and is given in Fig.No. 1.6.

WGSHP - Final Report (Vol.II) Adianpara
Integrated Rural Technology Centre, Palakkad 1.5
Table 1.4
Pondage Area Details Sl. No.
Elevation (m)
Area (m2)
Capacity (m3)
Energy ( kWh)
1
295.5
0
0
0
2
296
259.6
103.84
4
3
298
786.4
1149.84
48
4
299
2220.6
2653.34
111
5
300
3345.4
5436.34
227
As the terrain is suitable for storing only 5400 m3, it follows that, at full storage, the energy
capacity is only about 227 kWh. If a single 250 kW machine is installed, it can be operated for
only one hour at full capacity (during peak time). Fortunately, since pondage becomes critical
only during lean months, this kind of operation practice is acceptable. Hence, a weir height of
4.5m, to create a pondage of 5400 m3 is suggested.
1.4 SELECTION PLANT CAPACITY AND UNIT SIZES
For optimization of plant capacity, the following parameters were assumed.
Rate of return on investment - 15%
Loan Repayment period - 10 years
Average O/M cost - 2.5% of capital cost
Resulting standard annual cost - 25%
(This consists of 2.5% O & M costs, 15% return on 25% equity, 15% interest on 75% loan and repayment of loan in 10 annual instalments)
Tariff (per Unit) - Rs. 2.5 and 3.0 (Two cases)
Investment cost (Rs.in Crores per MW) - Rs. 3.5 (Two cases)
Since manufacturers were not in a position to quote exact figures, no attempt was made to fine
tune the cost in relation to site specific conditions. Only ranges could be indicated. If the project
is to be economically viable, each combination of tariff and capital cost selected above will

WGSHP - Final Report (Vol.II) Adianpara
Integrated Rural Technology Centre, Palakkad 1.6
demand a minimum annual generation per kW installed. This can be taken to be the break even
Plant Capacity Factor (PCF) for the site under the specified conditions.
Lower the cost/MW and higher the price for energy, the larger will be the economically
viable installed capacity and the quantity of energy that can be economically extracted
from a given site.
Let the capital cost of Adianpara be Rs.3.5 crores/MW. The annual rate is 25%. Let the unit
rate of tariff offered by K.S.E.B be Rs. 2.5/kWh.
If X be the number of hours of operation at full load capacity,
per Mega Watt annual cost, at the rate of 25% on investment = Rs. 3.5 Crores x 0.25
per Mega Watt revenue = 1000 kW x Rs. 2.5 x X
Equating the two, we get 3,50,00,000 x 0.2.5 = X x 1000 x 2.5
X = 3,500 hrs.
This means that, any combination of machines, that can work at full capacity for over 3500 hours
can deliver a profit, if the overall project cost is below Rs. 3.5 crores/MW and tariff is Rs. 2.5
per kilo Watt hour.
This can be explained better in terms of Plant Capacity Factor, which is defined as the ratio of
actual amount of energy obtained during an year to the maximum energy that can be obtained
from the given installed capacity during the same year, to the actual amount of energy obtained.
In this case, for the value of X = 3500 hours, PCF = (3500 / 8760) x 100 = 40%
That is, a maximum capacity, which yields a PCF of 40% is economically viable for this site.
Similarly, break even PCF for Rs.3.00 per kWh and Rs. 3.5 Crores per Mega Watt where
X=2916 hours is 33.3%.
Now we shall check various capacities of turbine size which are suitable for these two conditions.

WGSHP - Final Report (Vol.II) Adianpara
Integrated Rural Technology Centre, Palakkad 1.7
a.Tariff: Rs.2.50/KWh and break even PCF of 40%
For an installed capacity of 1000 kW, which corresponds to about 30.7% flow of exceedence
from the chart, the total energy yield is the sum of:
1000 kW x (0.307 x 8760) = 2.69 MU at continuous operation for 30.7% time of an year, and
0.952 MU, which is the cumulative energy potential from 30.7% to 100% time as obtained from
the Chart (Table 1.2).
So total yield = 2.69 MU + 0.952 MU = 3.642 MU.
The Plant Capacity Factor, corresponding to this yield is given by :
PCF = 3.642 x 10⁸ / (1000 x 8760) = 41.5%
This PCF is very near to the break even value of 40%. Hence installed capacity of
1000kW is acceptable.
b. Tariff: Rs.3.00/kWh and break even PCF of 33.3%
Corresponding to an installed capacity of 1.75 MW (for 19 % flow of exceedence)
PCF = (5310000 / 1750 x 8760) x 100 = 34.6%
This PCF is very near to the break even value of 33.3%.
Therefore, 1.75 MW will be the optimum choice for the site, if the overall project cost is
below Rs. 3.5 crores/MW and tariff is Rs. 3.0 per kilo Watt hour.
Table 1.5
Economically Viable Maximum Capacity at Different Costs and Tariff
Tariff
Installed Capacity for Rs.3.5 Crores/MW
Rs.2.5/Unit
1 MW
Rs.3.00/ Unit
1.75 MW
The units selected can be one of the following combinations:

WGSHP - Final Report (Vol.II) Adianpara
Integrated Rural Technology Centre, Palakkad 1.8
For Rs.3.5 Crores/MW and Rs.2.5/Unit we can opt (1MW x 1) or (0.5 MW x 2)
For Rs.3.5 Crores/MW and Rs.3.0/Unit we can opt ( 1MWx1 + 0.5 MWx 1+0.25MWx1) or
(1.5 MW x 1 + 0.25 MW x 1)
We have restricted ourselves to the more realistic combination of Rs. 3.5 Crores/MW of
investment cost and two tariff choices of Rs. 2.5/Unit and Rs. 3.0/Unit.
1.5 CIVIL ENGINEERING WORKS
The important Civil Engineering Works required for the project are a diversion weir, an intake
structure, a penstock and a power house. A weir is constructed to have a small storage and to
divert the water from stream to the intake. For this project only a diversion weir is proposed,
which allows the excess water to flow over the weir to the downstream. The intake structure
takes water from the weir and leads it to the penstock. The penstock made of steel is proposed
in this site. A power house is constructed for the purpose of housing the electro mechanical
equipment. A small building of one or two rooms will suffice.
1.5.1 Weir
A Gabion weir has been proposed on the Kanjirappuzha stream, at a bed level of +495.500
metres. The base width of the weir at bed level is 7.5 m. The structure is 4.50 m high having a
length of 60 m at the top with a central broad crested free over fall type spill way. The cross
sectional details of the proposed diversion site is shown in Fig. No. 1.7.
1.5.2 Intake Structure, Penstock and Power house
A simple box type, direct intake structure of reinforced cement concrete is provided on the
stream bed. A trash rack is provided at the intake mouth, the penstock entrance starts from the
wall of intake box near the gabion. The economic diameter of the steel penstock for 1000kW
installed capacity, is calculated as 1.9 m and the penstock can carry a maximum flow of
6.67cumec. The possible alignment for the penstock is located on the left bank of the stream.
The longitudinal section of the proposed penstock line was drawn from the contour map and
calculated the length, which comes to 147m (Fig. No. 1.8).

WGSHP - Final Report (Vol.II) Adianpara
Integrated Rural Technology Centre, Palakkad 1.9
A surface power house is proposed on the left bank of the stream. The slope at the proposed site
is moderate but increases up the hill towards north east direction. The power house is of size 9 m
x 8m to accommodate 1000 kW, generator and standardised turbine.
1.6 ELECTRICAL AND MECHANICAL EQUIPMENTS
The electricity generated would be connected to the existing power grid system at Nilambur by a
300m transmission line. A standardised turbine for 20m gross head is proposed for this particular
site. The turbine shall be complete with governor, control equipment and safety devices. The
generator would be synchronous with a brushless excitation system shall be rated to generate
11kV, with three phases, 50 cycles per second and shall be suitable for coupling with turbine
described above. The generator shall have voltage regulation equipment, parallel operation
equipment etc.
1.7 ENVIRONMENTAL IMPACTS
A small hydro project has been proposed at Adianpara. The project could generate either 1000
kW or 1750 kW of hydro power depending on the permitted tariff. Some preliminary
environmental impact analysis have been carried out. They are land, water and socio-economical
environmental impacts.
1.7.1. Environmental impact on land
Total area of catchment is about 28.5 square kilometres of land in Kanjirappuzha. The upper
catchment is rocky and with little vegetation cover. The forest in this sector is semi ever green and
deciduous. The land at left bank of stream is owned by private persons and the right bank is
forest land. Stream sections are mostly rocky large sized boulders are plenty.
The most significant thing is that, due to impoundment, no forest land will be submerged. The
construction of weir, penstock, power house, tailrace and temporary road will not take away any
forest land.
1.7.2 Environmental impact on water

WGSHP - Final Report (Vol.II) Adianpara
Integrated Rural Technology Centre, Palakkad 1.10
The Kanjirappuzha, which drains to Chaliyar river is the stream of this fall. It is a 3rd order, structurally
controlled stream. The diversion structure will create a pond of area 0.3345ha. No forest land will be
submerged. Above all, this accounts for only 0.3345 ha/MW. This diversion structure which also
acts as a check dam can increase the height of water table level at the site. The impounded water will
also change soil moisture regime in adjacent forest land.
1.7.3 Socio-economic impact
The construction phase would create employment opportunities for a period of 18 months. The peak
labour strength is 100 skilled and 100 unskilled labour. It requires only minimum land acquisition for
construction. The acquisition does not need any rehabilitation.
1.8 CONCLUSION
The environmental impact of this small hydel project is negligible. No serious adverse impact is
anticipated. Moreover, deforestation owing to the inundation will be a meagre area.
The economic size of installed capacity depends upon the permissible tariff as well as the capital cost.
It was found that the project is financially viable for an installed capacity of 1000kW at a project cost
of Rs. 3.5 Crores per MW and a tariff rate of Rs.2.5 per unit of electricity. Alternatively, if the tariff is
raised to Rs.3.00 per unit, an installed capacity of 1750kW would become economically viable.
Cost effective methods of construction, like the use of gabion weirs, can be used to reduce the capital
costs. A methodology for implementing the project with a maximum of peoples= participation should
also be devised. The role of the Grama Panchayath in this effort is crucial.
-�-

WGSHP - Final Report (Vol.II) Adianpara
Integrated Rural Technology Centre, Palakkad 1.11
2. ARUVIKKAL ANCHURULI
District : Idukki
Panchayath : Kanjiar
Head : 20 m.
Flow : Seasonal
Suggested Capacity : 550 kW / 650kW

WGSHP - Final Report (Vol. II) Aruvikkal Anchuruli
Integrated Rural Technology Centre, Palakkad 2.1
2.1 GENERAL
2.1.1 The site
The Aruvikkal Anchuruli water fall is located in the 3rd ward of Kanjiyar Grama Panchayath in
Idukki district. The site is at a distance of 7 km. from Kattappana. There is bus route from
Kattappana to Kakkattukkada. From Kakkattukkada junction, it is possible to reach the site by
travelling a distance of 2km through the Anchuruli reservoir road. The nearest 11 KV line is
about 500m away from the site.
The water fall is located at 77o 4' 17" E longitude and 9o 45' 29" N latitude. The catchment area
measured from topo sheet is 0.625 sq.km. The falls are situated at an elevation of 300m from
MSL in Kanjiyar stream which begins at an elevation of 860m from MSL. The stream is flowing
through moderate slopes. After the fall, the stream joins to Kattappanayar which is draining to
the Idukki reservoir. Location of the site is shown in Fig.No.2.1.
2.1.2 Topography
The site is situated outside the forest area. Both sides of the site are owned by private persons.
There is no possibility of land slide and the chances for soil erosion are negligible. The bed of the
stream is hard rock. The site is perennial and number of rainy days exceeds 50% in its
catchment.
2.2 FIELD INVESTIGATION
2.2.1 Reconnaissance survey
A topographical survey was conducted for obtaining topographical details of the site. There is
one main fall which gives a total head of 20m. The possible location for diversion structure and
power house were identified and the details were taken using tacheometric method of surveying.
2.2.2 Catchment area

WGSHP - Final Report (Vol. II) Aruvikkal Anchuruli
Integrated Rural Technology Centre, Palakkad 2.2
Topographical survey sheets to a scale of 1:50,000 are available from the Survey of India. The
catchment of Aruvikkal Anchuruli was located using the toposheet. It is shown in the Fig.No.
2.2. The total area of catchment is measured from the toposheet and it comes to nearly 0.625
sq.km. The catchment area is having almost moderate slope but some portions are very steep.
Maximum flood discharge measured at this site during 1998 is about 5 cumec.
2.2.3 Contour map
The survey details were plotted on a sheet of paper at a scale of 1:250. Undulations of the site,
the location of the falls and other topographical features were identified from the contour map.
Location of the weir, alignment of the penstock and location of the power house were also
determined using this and the prepared contour map has been shown in Annexure A.2.
2.2.4 River flow data
For a period of 12 months (December 97 to December 98) the water level observations were
taken every week. A suitable location was located on the upstream of the fall, where the whole
water is flowing through that point, cross sectional details of that point were noted for calculating
the stream discharge. We fixed a measuring gauge at that point to measure the peak flow. Using
the collected data (Table 2.1) the weekly discharge hydrograph of the site is prepared. The
graph is shown in Fig. No. 2.3.
2.2.5 Flow duration curve
Using weekly discharge hydrograph, percentage flow of exceedence was calculated. From this
flow duration curve was calculated (Fig.2.4.). The same curve also functions as percentage flow
of exceedence graph. The river flow data is recalculated in tabular form, giving the corresponding
energy potential in weekly and cumulative mode is given in Table 2.2. These data are used for
calculating energy potential and selection of unit sizes in section 2.4.
2.2.6 Peak flow determination
There are various empirical methods for calculating the maximum flood discharge. The different
values obtained are shown in Table 2.3 The value obtained by Dicken=s formula, which is

WGSHP - Final Report (Vol. II) Aruvikkal Anchuruli
Integrated Rural Technology Centre, Palakkad 2.3
commonly used in western ghats region has been used for the structural design of diversion
structure.
Table 2.3
Peak Flow Determination
Parameters
Dicken=s method
Ingli=s formula
Ryve=s formula
Nawab Jung
Bahadur formula Peak flow in cumecs
18.28
23.15
7.38
34.64
2.3 SALIENT DESIGN FEATURES
A detailed design of Civil, Electrical & Mechanical work has not been carried out in this report as
it does not come under the purview of the project. But a typical section of the proposed diversion
structure is given here. The stability analysis of the section and economic diameter of the
penstock was carried out as part of preliminary design. The capability and number of units, type
and specification of turbine, generator and it=s cost have been estimated, after consulting various
agencies.
2.3.1 Power potential of the project
From the flow duration curve the discharge corresponding to 98% is only 0.01 cubic metre per
second. A discharge of 0.01 cubic metre per second can produce only about 1.5 kW. However
it seen that much higher flows are available during 50% of the time. In order to tap the full
potential of the site, with a head of 20 metre, the project is designed to generate higher output
with lower dependability. This site can be designed as a run of the river project which can
produce 275 kW with a dependability of 40%.
The output power was computed using the formula, P = 10 x Q x H x ηη
Where; P = Power output in kW
Q = Discharge in cumec

WGSHP - Final Report (Vol. II) Aruvikkal Anchuruli
Integrated Rural Technology Centre, Palakkad 2.4
H = Head in metres
η = Overall efficiency (Here it is assumed as 0.75)
For 50% exceedence P = 10 x 1.3 x 20 x 0.75 = 195.00 kW.
For 40% exceedence P = 10 x 1.85 x 20 x 0.75 = 275.00 kW.
For 30% exceedence P = 10 x 2.3 x 20 x 0.75 = 355.00 kW.
2.3.2 Energy potential
At this site, sufficient flow is there so that we can obtain 275kW power output for 40% of the
time (146 days). The output reduces to 90kW if we take the percentage flow of exceedance as
60% (219 days). The energy input corresponding to 40% flow of exceedance will be (40/100
* 275 * 365 * 24) = 0.9636 MU. The flow after 40% time can be utilized by providing a small
pondage. The quantity of water available from 40% to 100% time is calculated to be 10371715
m3. Energy obtained from this water is 0.432 MU.
So, total amount of energy produced = 0.432 MU + 0.9636 MU = 1.4 MU.
It may be noted that , this much amount of energy can be generated for the particular year of
measurement. If higher flows are available during any year, it will enable higher production and
vice versa.
2.3.3 Pondage requirement
A plot of surface area Vs. elevation is given in Fig.No.2.5. The areas corresponding to each
elevation is used to find the volume of water that can be stored in each elevation and the details
are shown in Table 2.4. From this information a capacity-elevation curve of the pondage is
prepared and is shown in Fig.No.2.6.

WGSHP - Final Report (Vol. II) Aruvikkal Anchuruli
Integrated Rural Technology Centre, Palakkad 2.5
Table 2.4
Pondage Area Details Sl. No.
Elevation (m)
Area (m2)
Capacity (m3)
Energy (kWh)
1
497.50
0.000
0.000
0
2
498.00
145.313
36.330
2
3
499.00
439.063
328.518
14
4
500.00
698.438
897.270
37
5
501.00
810.938
1651.958
69
6
502.00
1281.25
2698.050
112
As the terrain is not suitable for storage the structure proposed at this site is only for diverting
water. The terrain is suitable for storing only 1280 m3, it follows that, at full storage, the energy
capacity is only about 112 kWh. If a single 100 kW machine is installed, it can be operated for
only one hour at full capacity (during peak time). Fortunately, pondage becomes critical only
during lean months, this kind of operation practice is acceptable. Hence, a weir height of 4m, to
create a pondage of 1280 m3 is suggested.
2.4 SELECTION OF PLANT CAPACITY AND UNIT SIZES
For optimization of plant capacity, the following parameters were assumed.
Rate of return on investment - 15%
Loan Repayment period - 10 years
Average O/M cost - 2.5% of capital cost
Resulting standard annual cost - 25%
(This consists of 2.5% O & M costs, 15% return on 25% equity, 15% interest on 75% loan and repayment of loan in 10 annual instalments)
Tariff (per Unit) - Rs. 2.5 and 3.0 (Two cases)
Investment cost (Rs.in Crores per MW) - Rs. 3.5 (Two cases)
Since manufacturers were not in a position to quote exact figures, no attempt was made to fine

WGSHP - Final Report (Vol. II) Aruvikkal Anchuruli
Integrated Rural Technology Centre, Palakkad 2.6
tune the cost in relation to site specific conditions. Only ranges could be indicated if the project
has to be economically viable. Each combination of tariff and capital cost selected above will
demand a minimum annual generation per kW installed. This can be taken to be the break even
Plant Capacity Factor (PCF) for the site under the specified conditions.
Lower the cost/MW and higher the price for energy, the larger will be the economically
viable installed capacity and the quantity of energy that can be economically extracted
from a given site.
Let the capital cost of Aruvikkal Anchuruli be Rs.3.5 crores/MW. The annual rate is 25%. Let
the unit rate of tariff offered by K.S.E.B be Rs. 2.5/kWh.
If X be the number of hours of operation at full load capacity,
per Mega Watt annual cost, at the rate of 25% on investment = Rs. 3.5 Crores x 0.25
per Mega Watt revenue = 1000 kW x Rs. 2.5 x X
Equating the two, we get 3,50,00,000 x 0.2.5 = X x 1000 x 2.5
X = 3,500 hrs.
This means, any combination of machines, that can work at full capacity for over 3500 hours can
deliver a profit, if the overall project cost is below Rs. 3.5 crores/MW and tariff is Rs. 2.5 per
kilo Watt hour.
This can be explained better in terms of Plant Capacity Factor, which is defined as the ratio of
actual amount of energy obtained during an year to the maximum energy that can be obtained
from the given installed capacity during the same year, to the actual amount of energy obtained.
In this case, for the value of X = 3500 hours, PCF = (3500 / 8760) x 100 = 40%
That is, a maximum capacity, which yields a PCF of 40% is economically viable for this site.
Similarly, break even PCF for Rs.3 per unit and Rs. 3.5 Crores per Mega Watt for X=2916 hours is 33.3%.
Now we shall check various capacities of turbine size which are suitable for this two conditions.
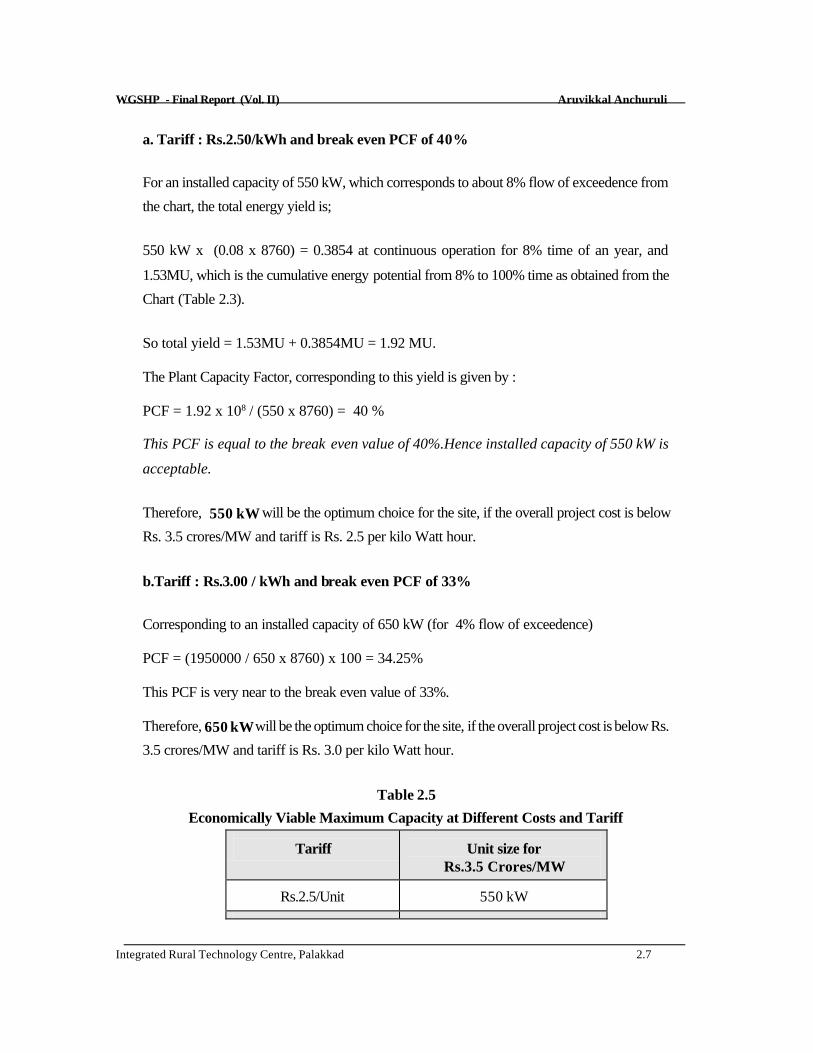
WGSHP - Final Report (Vol. II) Aruvikkal Anchuruli
Integrated Rural Technology Centre, Palakkad 2.7
a. Tariff : Rs.2.50/kWh and break even PCF of 40%
For an installed capacity of 550 kW, which corresponds to about 8% flow of exceedence from
the chart, the total energy yield is;
550 kW x (0.08 x 8760) = 0.3854 at continuous operation for 8% time of an year, and
1.53MU, which is the cumulative energy potential from 8% to 100% time as obtained from the
Chart (Table 2.3).
So total yield = 1.53MU + 0.3854MU = 1.92 MU.
The Plant Capacity Factor, corresponding to this yield is given by :
PCF = 1.92 x 10⁸ / (550 x 8760) = 40 %
This PCF is equal to the break even value of 40%.Hence installed capacity of 550 kW is
acceptable.
Therefore, 550 kW will be the optimum choice for the site, if the overall project cost is below
Rs. 3.5 crores/MW and tariff is Rs. 2.5 per kilo Watt hour.
b.Tariff : Rs.3.00 / kWh and break even PCF of 33%
Corresponding to an installed capacity of 650 kW (for 4% flow of exceedence)
PCF = (1950000 / 650 x 8760) x 100 = 34.25%
This PCF is very near to the break even value of 33%.
Therefore, 650 kW will be the optimum choice for the site, if the overall project cost is below Rs.
3.5 crores/MW and tariff is Rs. 3.0 per kilo Watt hour.
Table 2.5
Economically Viable Maximum Capacity at Different Costs and Tariff
Tariff
Unit size for Rs.3.5 Crores/MW
Rs.2.5/Unit
550 kW

WGSHP - Final Report (Vol. II) Aruvikkal Anchuruli
Integrated Rural Technology Centre, Palakkad 2.8
Rs.3.00/ Unit 650 kW
The units selected can be one of the following combinations:
For Rs.3.5 Crores/MW and Rs.2.5/Unit; we can opt: (0.5MW x 1 + 0.05 MW x 1)
For Rs.3.5 Crores/MW and Rs.3.0/Unit we can opt: (0.5 MW x 1 + 0.1MW x 1 + 0.05MW x 1).
We have restricted ourselves to the more realistic combination of Rs. 3.5 Crores/MW of
investment cost and two tariff choices of Rs. 2.5/Unit and Rs. 3.0/Unit.
2.5 CIVIL ENGINEERING WORKS
The important Civil Engineering Works required for the project are a diversion weir, an intake
structure, a penstock and a power house. A weir is constructed to have a small storage and to
divert the water from stream to the intake. For this project only a diversion weir is proposed,
which allows the excess water to flow over the weir to the downstream. The intake structure
takes water from the weir and leads it to the penstock. The penstock made of steel is proposed
in this site. A power house is constructed for the purpose of housing the electro mechanical
equipment. It is usually a small building of size 7.5m x 10m.
2.5.1 Weir
A concrete weir has been proposed on the Kattappanayar, at a bed level of +296.000m. The
base width of the weir at bed level is 2.5m. The diversion structure is 4m high having a length of
18m at the top with a central broad crested free over fall type spill way. The cross sectional
details of the existing ground and typical section of the proposed diversion site are shown in
Fig.No.2.7.
2.5.2 Intake Structure, Penstock and Power house
A simple box type, direct intake structure of reinforced cement concrete is provided on the
stream bed. A trash rack is provided at the intake mouth, The penstock entrance starts from the
wall of intake box near the structure. The economic diameter of the penstock is calculated as
1.5m. The penstock can carry a maximum flow of 3.67 cumec with a velocity of 2.0 metre per
second. The possible alignment for the penstock is located on the right bank of the stream. The
longitudinal section of the proposed penstock line was drawn from the contour map and the
WGSHP - Final Report (Vol. II) Aruvikkal Anchuruli
Integrated Rural Technology Centre, Palakkad 2.9
length was calculated, which comes to 158m (Fig.No.2.8).
A surface power house is proposed on the right bank of the stream. The slope at the proposed
site is gentle but increases up the hill towards south direction. The power house is of size 10m x
7.5m, to accommodate 550 kW generator and standardised turbine.
2.6 ELECTRICAL AND MECHANICAL EQUIPMENTS
The power house proposed in the scheme will have an installed capacity of 550 kW. The
electricity generated would be connected to the existing power grid system by a 500m
transmission line. A standardised turbine for 20m gross head is proposed for this particular site.
The turbine shall be complete with governor, control equipment and safety devices. The
generator would be synchronous with a brush less excitation system and rated to generate 11kV,
three phases, 50 Hz. It is a suitable for coupling with turbine described above. The generator shall
have voltage regulation equipment, parallel operation equipment etc.
2.7 ENVIRONMENTAL IMPACTS
A small hydro project has been proposed at Aruvikkal Anchuruli (Idukki Dist). The project aims
to generates about 550 kW or 650kW of hydro power from a fall having a head of 20m. Some
preliminary environmental impact analysis have been carried out. They are land, water and
socio-economical environmental impacts.

WGSHP - Final Report (Vol. II) Aruvikkal Anchuruli
Integrated Rural Technology Centre, Palakkad 2.10
2.7.1 Environmental impact on land
Total area of catchment is about 0.625 sq. kilometres of land in Kaanchiyar stream. The upper
catchment is rocky and with little vegetation cover. The site is situated out of forest. The area on both
the banks of the stream is owned by private persons. There is no possibility of land slide and the
chances for soil erosion is negligible. The bed of the stream is hard rock. The most significant thing is
that, due to impoundment, no forest land will be submerged. The construction of weir, penstock,
power house, tailrace and temporary road will not take away any forest land. So no forest clearance
is required for the project.
2.7.2 Environmental impact on water
The Aruvikkal Anchuruli, which drains to Idukki reservoir is the basins of this fall. It is a 3rd order,
structurally controlled stream. The diversion structure will create a pond of area 0.128 hectare. No
forest land will be submerged. Above all, this accounts for only 0.2327 ha/MW. This diversion
structure which also acts as a check dam can increase the height of water table level at the site. The
impounded water will also change soil moisture regime in adjacent forest land.
2.7.3 Socio-economic impact
The construction phase would create employment opportunities for a period of 18 months. The peak
labour strength is 100 skilled and 100 unskilled labour. It require only minimum land acquisition for
construction. The acquisition does not need any rehabilitation.
2.8 CONCLUSION
The environmental impact of this small hydel project is negligible. No serious adverse impact is
anticipated. Moreover, deforestation owing to the inundation will be a meagre area.
The economic size of installed capacity depends upon the permissible tariff as well as the capital cost.
It was found that the project is financially viable for an installed capacity of 550kW at a project cost
of Rs. 3.5 Crores per MW and a tariff rate of Rs.2.5 per unit of electricity. Alternatively, if the tariff is
raised to Rs.3.00 per unit, an installed capacity of 650kW would become economically viable.
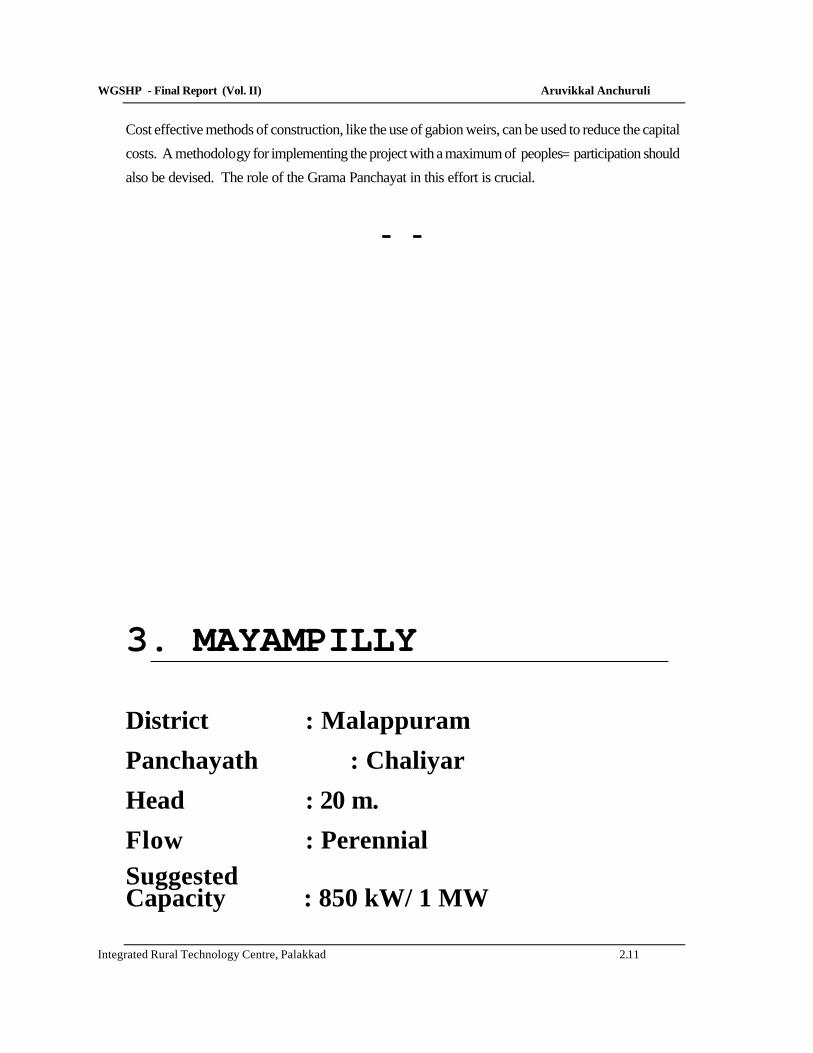
WGSHP - Final Report (Vol. II) Aruvikkal Anchuruli
Integrated Rural Technology Centre, Palakkad 2.11
Cost effective methods of construction, like the use of gabion weirs, can be used to reduce the capital
costs. A methodology for implementing the project with a maximum of peoples= participation should
also be devised. The role of the Grama Panchayat in this effort is crucial.
-��-
3. MAYAMPILLY
District : Malappuram
Panchayath : Chaliyar
Head : 20 m.
Flow : Perennial
Suggested Capacity : 850 kW/ 1 MW

WGSHP - Final Repor t (Vol. II) Mayampilly
Integrated Rural Technology Centre, Palakkad .1
3.1 GENERAL
3.1.1 The site
Mayampilly is a scenic water fall located in the Ist ward of Chaliyar Grama Panchayath in
Malappuram district. The site at a distance of 15 km from Nilambur. There is bus route from
Nilambur to Namboorippady which is motorable through out the year. From there also buses
are available to Muttiyel except in monsoon season. Jeep service are available through out the
year. From Muttiyel there is only 1 km to site and a motorable road exists near to the site. The
nearest 11 KV line is about 3 km away from site.
The water fall is located at 76o 11' 30" E longitude and 11o 21' 39" N latitude. The catchment
area measured from toposheet is 27 sq.km. The falls are situated at an elevation of 400m. from
MSL, in Kanjirappuzha stream which is begins at an elevation of 2000m. from MSL. It is
flowing almost in a moderate slope after the fall and joins the Chaaliyar river which drains in to
the Arabian sea. There is another fall on the downstream side of the fall which is called
Adianpara. Location map of the site is shown in Fig. No.3.1
3.1.2 Topography
The site is situated in the Nilambur forest which is very dense. The land is having moderate
slope in this area. There is no possibility of land slide and the chances for soil erosion is very
less. Both sides of the stream and its upstream have sheet rocky surface. Upstream side of the
fall is almost in a elevated terrain and lot of boulders are available at site. The site is perennial
and has good rainfall in the catchment. The site is perennial and number of rainy days exceeds
50% in its catchment.
3.2 FIELD INVESTIGATION
3.2.1 Reconnaissance survey
A topographical survey was conducted for obtaining topographical details of the site. The total
head of the site was found to be 20 m. A possible location for diversion structure and power
house are identified and the details were taken using tacheometric method of surveying.

WGSHP - Final Repor t (Vol. II) Mayampilly
Integrated Rural Technology Centre, Palakkad .2
3.2.2 Catchment area
Topographical survey sheets to a scale of 1:50,000 are available from the Survey of India. The
catchment of Mayampilly site was located using the toposheet. It is shown in Fig.No.3.2. The
area is measured and its comes to 27 sq. km. The catchment area having almost moderate
slope but some portions are very steep. Maximum flood discharge measured at this site during
1998 is about 20 cumec.
3.2.3 Contour map
The survey details were plotted on a sheet of paper at a scale of 1:200. The undulations of the
site, the location of the falls and other topographical features were identified from the contour
map. The location of the weir, the alignment of the penstock and location of the power house
were also determined using this and the prepared contour map has been shown in Annexure
A.3.
3.2.4 River flow data
For a period of 12 months (December 97 to December 98) the water level observations were
taken every week. A suitable location was located on the downstream of the fall, where the
whole water is flowing through that point, cross sectional details of that point were noted for
calculating the stream discharge. A measuring gauge was fixed at that point to measure the peak
flow. Using the collected data (Table 3.1) the weekly discharge hydrograph of the site is
prepared. The graph is shown in Fig.No. 3.3.
3.2.5 Flow duration curve
Using weekly discharge hydro graph, percentage flow of exceedence was calculated. From
this, the flow duration curve was plotted (Fig. No. 3.4). The same curve also functions as
percentage flow of exceedence graph. This river flow data is recalculated in tabular form, giving
the corrosponding energy potential in weekly and cumulative mode is given in Table 3.2. These
data are used for calculating energy potential and selection of unit sizes in section 3.4.
3.2.6 Peak flow determination
There are various empirical methods for calculating the maximum flood discharge. The different
values obtained are shown in Table 3.3 The value obtained by Dicken=s formula, which is

WGSHP - Final Repor t (Vol. II) Mayampilly
Integrated Rural Technology Centre, Palakkad .3
commonly used in western ghats region has been used for the structural design of diversion
structure.
Table 3.3
Peak Flow Determination
Parameters
Dicken=s method
Ingli=s formula
Ryve=s formula
Nawab Jung
Bahadur formula Peak flow in cumecs
307.96
543.04
90.90
826.45
3.3 SALIENT DESIGN FEATURES
A detailed design of Civil, Electrical and Mechanical work has not been carried out in this
report as it does not come under the purview of the project. But, a typical section of the
proposed diversion structure is given here. The stability analysis of the section and economic
diameter of the penstock was carried out as part of preliminary design. The capability and
number of units, type and specification of turbine, generator and it=s cost have been estimated
after consulting various agencies.
3.3.1 Power potential of the project
From the flow duration curve the discharge corresponding to 98% exceedence is only 0.02
cubic metre per second. A discharge of 0.02 cubic metre per second can produce only about 3
kW. However it seen that much higher flows are available during 50% of the time. In order to
tap the full potential of the site, with a head of 20 metre, the project is designed to generate
higher output with lower dependability. This site can be designed as a run of the river project
which can produce 150 kW with a dependability of 50%.
The output power was computed using the formula, P = 10 x Q x H x ηη
Where; P = Power output in kW
Q = Discharge in cumec
H = Head in metres
η = Overall efficiency (Here it is assumed as 0.75)
For 50% exceedence, Q=1m3/s, P = 10 x 1.00 x 20 x 0.75 = 150 kW.
For 40% exceedence, Q=2.4m3/s, P = 10 x 2.4 x 20 x 0.75 = 360 kW.

WGSHP - Final Repor t (Vol. II) Mayampilly
Integrated Rural Technology Centre, Palakkad .5
For 30% exceedence, Q=7m3/s, P = 10 x 7x 20 x 0.75 = 1110 kW.
3.3.2 Energy potential
At this site, sufficient flow is there so that we can obtain 1000kW power output for 30.7% of
the time (112 days). The output reduces to 360kW if we take the percentage flow of
exceedence as 40% (183 days). The energy input corresponding to 30.7% time will be
(30.7/100 * 1000 * 365 * 24) = 2.69 MU. The flow after 50% time can be utilized by
providing a small pondage. The quantity of water available from 30% to 100% time is
calculated to be 22848135m3. Energy obtained from this water is calculated to be 0.952 MU.
Total amount of energy produced = 2.69 MU + 0.952 MU = 3.64 MU.
It may be noted that, this much amount of energy can be generated for the particular year. If
higher flows are available during any year, it will enable higher production and vice versa.
3.3.3 Pondage requirement
From the contour map a plot of surface area Vs. elevation is drawn in Fig.No.3.5. The areas
corresponding to each elevation is used to find the volume of water that can be stored in each
elevation and the details is shown in Table 3.4. From this information capacity elevation curve
of the pondage is prepared and is shown in Fig.No.3.6.
Table 3.4 Pondage Area Details
Sl. No.
Elevation (m)
Area (m2)
Capacity (m3)
Energy (kWh)
1
497
0
0
2
498
238.00
119.00
5
3
499
283.80
379.90
16

WGSHP - Final Repor t (Vol. II) Mayampilly
Integrated Rural Technology Centre, Palakkad .6
As the terrain is suitable for storing only 380 m3, it follows that, at full storage, the energy
capacity is only about 280 kWh. If a single 250 kW machine is installed, it can be operated for
only one hour at full capacity during peak time. Fortunately, pondage becomes critical only
during lean months, this kid of operation practice is acceptable. Hence, a weir height of 2m, to
create a pondage of 380 m3 is suggested.
As the terrain is not suitable for storage the structure proposed at this site is only for diverting
water.
3.4 SELECTION OF PLANT CAPACITY AND UNIT SIZES
For optimization of plant capacity, the following parameters were assumed.
Rate of return on investment - 15%
Loan repayment period - 10 years
Average O/M cost - 2.5% of capital cost
Resulting standard annual cost - 25%
(This consists of 2.5% O & M costs, 15% return on 25% equity, 15% interest on 75% loan and repayment of loan in 10 annual instalments)
Tariff (per Unit) - Rs. 2.5 and 3.0 (Two cases)
Investment cost (Rs.in Crores per MW) - Rs. 3.5 (Two cases)
Since manufacturers were not in a position to quote exact figures, no attempt was made to fine
tune the cost in relation to site specific conditions. Only ranges could be indicated. Each
combination of tariff and capital cost selected above, will demand a minimum annual generation
per kW installed. This can be taken to be the break even Plant Capacity Factor (PCF) for the
site under the specified conditions.
Lower the cost/MW and higher the price for energy, the larger will be the economically
viable installed capacity and the quantity of energy that can be economically extracted
from a given site.
Let the capital cost of Mayampilly be Rs.3.5 crores/MW. The annual rate is 25%. Let the unit
rate of tariff offered by K.S.E.B be Rs. 2.5/kWh.
If X be the number of hours of operation at full load capacity,

WGSHP - Final Repor t (Vol. II) Mayampilly
Integrated Rural Technology Centre, Palakkad .7
per Mega Watt annual cost, at the rate of 25% on investment = Rs. 3.5 Crores x 0.25
per Mega Watt revenue = 1000 kW x Rs. 2.5 x X
Equating the two, we get 3,50,00,000 x 0.2.5 = X x 1000 x 2.5
X = 3,500 hrs.
This means that, any combination of machines, that can work at full capacity for over 3500
hours can deliver a profit, if the overall project cost is below Rs. 3.5 crores/MW and tariff is
Rs. 2.5 per kilo Watt hour.
This can be explained better in terms of Plant Capacity Factor, which is defined as the ratio
of actual amount of energy obtained to the maximum energy that can be obtained from the given
installed capacity during an year, to the actual amount of energy obtained.
In this case, for the value of X = 3500 hours, PCF = (3500 / 8760) x 100 = 40%
That is, a maximum capacity, which yields a PCF of 40% is economically viable for this site.
Similarly, break even PCF for Rs.3.0 per unit and Rs. 3.5 Crores per Mega Watt where
X=2916 hours is 33.3%.
Now we shall check various capacities of turbine size which are suitable for this two conditions.
a. Tariff: Rs.2.50/kWh and break even PCF of 40%
For an installed capacity of 1000 kW, which corresponds to about 30.7% flow of exceedence
from the chart, the total energy yield is the sum of:
1000 kW x (0.307 x 8760) = 2.69 MU at continuous operation for 30.7% time of an year,
and 0.952 MU, which is the cumulative energy potential from 30.7% to 100% time as obtained
from the Chart (Table 3.3).
Total yield = 2.69 MU + 0.952 MU = 3.642 MU.
The Plant Capacity Factor, corresponding to this yield is given by :
PCF = 3.642 x 10⁸ / (1000 x 8760) = 41.5%
This PCF is very near to the break even value of 40%.

WGSHP - Final Repor t (Vol. II) Mayampilly
Integrated Rural Technology Centre, Palakkad .8
This PCF is very near to the break even value of 40%.Hence installed capacity of
1000kW is acceptable.
So 1 MW will be the optimum choice for the site, if the overall project cost is below
Rs.3.5 crores/MW and tariff is Rs. 2.5 per kilo Watt hour.
b. Tariff: Rs.3.00/kWh and break even PCF of 33%
Corresponding to an installed capacity 1.75 MW, (for 19 % flow of exceedence)
PCF = (5310000 / 1750 x 8760) x 100 = 34.6%
This PCF is very near to the break even value of 33.3%. Hence installed capacity of
1000kW is acceptable.
Therefore, 1.75 MW will be the optimum choice for the site, if the overall project cost is
below Rs. 3.5 crores/MW and tariff is Rs. 3.0 per kilo Watt hour.
Table 3.5
Economically Viable Maximum Capacity at Different Costs and Tariff
Tariff
Unit size for Rs.3.5 Crores/MW
Rs.2.5/Unit
1 MW
Rs.3.00/ Unit
1.75 MW
The units selected can be one of the following combinations:
For Rs.3.5 Crores/MW and Rs.2.5/Unit we can opt (1MW x 1) or (0.5 MW x 2)
For Rs.3.5 Crores/MW and Rs.3.0/Unit we can opt ( 1MW + 0.25 MW x 3) or (1.5 MW x
1 + 0.25 MW x 1)
We have restricted ourselves to the more realistic combination of Rs. 3.5 Crores/MW of
investment cost and two tariff choices of Rs. 2.5/Unit and Rs. 3.0/Unit.
3.5 CIVIL ENGINEERING WORKS
The important Civil Engineering Works required for the project are a diversion weir, an intake

WGSHP - Final Repor t (Vol. II) Mayampilly
Integrated Rural Technology Centre, Palakkad .9
structure, a penstock and a power house. A weir is constructed to have a small storage and to
divert the water from stream to the intake. For this project only a diversion weir is proposed,
which allows the excess water to flow over the weir to the downstream. The intake structure
takes water from the weir and lead it to the penstock. The penstock made of steel is proposed
in this site. A power house is constructed for the purpose of housing the electro mechanical
equipment. It is usually a small building of size 9mx 7m.
3.5.1 Weir at Mayampilly
A concrete weir has been proposed on the Kanjirappuzha stream, at a bed level of +597.000
metres. The base width of the weir at bed level is 2m. The concrete structure is 2m high having
a length of 8.2m at the top with a central broad crested free over fall type spill way. The cross
sectional details of the proposed diversion site and a typical section of the structure are shown
in Fig.No. 3.7.
3.5.2 Intake Structure, Penstock and Power house
A simple box type, direct intake structure of reinforced cement concrete is provided on the
stream bed. A trash rack is provided at the intake mouth, the penstock entrance starts from the
wall of intake box near the structure. The economic diameter of the penstock is calculated as
1.9m. The penstock is designed for a maximum flow of 6.67 cumec with a velocity of 2.35
metre per second. The possible alignment for the penstock is located on the left bank of the
stream. The longitudinal section of the proposed penstock line was drawn from contour map
and calculated the length, which comes to 71m (Fig. No. 3.8).
A surface power house is proposed on the left bank of the stream. The slope at the proposed
site is moderate but increases up the hill towards north direction. The power house is of size 9m
x 7m, to accommodate 1000kW, generator and standardised turbine.
3.6 ELECTRICAL AND MECHANICAL EQUIPMENTS
The power house proposed in the scheme will have an installed capacity of 1000 kW. The
electricity generated would be connected to the existing power grid system at Mayampilli by a
2km transmission line. A standardised turbine for 20m gross head is proposed for this
particular site. The turbine shall be complete with governor, control equipment and safety
devices. The generator would be synchronous with a brushless excitation system shall be rated
WGSHP - Final Repor t (Vol. II) Mayampilly
Integrated Rural Technology Centre, Palakkad .10
to generate 1000kW, 11kV three phases, and 50 Hz . It will be suitable for coupling with
turbine described above. The generator shall have voltage regulation equipment, parallel
operation equipment etc.
3.7 ENVIRONMENTAL IMPACTS
A small hydro project has been proposed at Mayampilly (Malappuram Dist.). The project aims
to generates about 1000 kW of hydro power from a fall having a head of 20 m. Some
preliminary environmental impact analysis have been carried out. They are land, water and
socio-economical environmental impacts.
3.7.1 Environmental impact on land
Total area of catchment is about 27 square kilometres of land in Kanjirappuzha. The upper
catchment is rocky and with little vegetation cover. The forest in this sector is semi evergreen
and deciduous. The land on left bank of s tream is owned by private persons and the right bank
is forest land. Stream sections are mostly rocky and large sized boulders are plenty.
The most significant thing is that, due to impoundment, no forest land will be submerged. The
construction of weir, penstock, power house, tailrace and temporary road will not take away
any forest land.
3.7.2 Environmental impact on water

WGSHP - Final Repor t (Vol. II) Mayampilly
Integrated Rural Technology Centre, Palakkad .11
The Kanjirappuzha, which drains to Chaliyar river is the stream of this fall. It is a 3rd order, structurally
controlled stream. The diversion structure will create a pond of area 0.0283 hectare. No forest land
will be submerged. Above all, this accounts for only 0.0283ha/MW. This diversion structure which
also acts as a check dam can increase the height of water table level at the site. The impounded water
will also change soil moisture regime in adjacent forest land.
3.7.3 Socio-economic impact
The construction phase would create employment opportunities for a period of 18 months. The peak
labour strength is 100 skilled and 100 unskilled labour. It requires only minimum land acquisition for
construction. The acquisition does not need any rehabilitation.
3.8 CONCLUSION
The environmental impact of the small hydel project is negligible. No serious adverse impact is
anticipated. Moreover, deforestation owing to the inundation will be a meagre area.
The economic size of installed capacity depends upon the permissible tariff as well as the capital cost.
It was found that the project is financially viable for an installed capacity of 850kW at a project cost
of Rs. 3.5 Crores per MW and a tariff rate of Rs.2.5 per unit of electricity. Alternatively, if the tariff is
raised to Rs.3.00 per unit, an installed capacity of 1000kW would become economically viable.
Cost effective methods of construction, like the use of gabion weirs, can be used to reduce the capital
costs. A methodology for implementing the project with a maximum of peoples= participation should
also be devised. The role of the Grama Panchayat in this effort is crucial.
-��-

WGSHP - Final Repor t (Vol. II) Mayampilly
Integrated Rural Technology Centre, Palakkad .12
4. ADAKKAKUNDU
District : Malappuram
Panchayath : Kalikavu
Head : 33 m.
Flow : Seasonal
Suggested Capacity : 100 kW / 125 kW

WGSHP - Final Report (Vol. II) Adakkakundu
Integrated Rural Technology Centre, Palakkad 4.1
4.1 GENERAL
4.1.1 The site
Adakkakundu water fall is situated in the 7th ward of Kalikavu Grama Panchayath in
Malappuram district. The site is at a distance of 25 km. from Nilambur. There is bus route from
Nilambur to Kalikavu. From there, Jeep services are available to Adakkakundu. The road ends
nearly 500m before the site. The nearest 11 KV line is about 3 km away from site.
The water fall is located at 76o 21'20" E longitude and 11o 10' 33" N latitude. The catchment area
measured from topo sheet is 6.78 sq.km. The fall is situated at an elevation of 100m from MSL
in Adakkakundu stream which begins at an elevation of 1000m from MSL. After the fall, the
stream joins to the Kottapuzha and finally drains to Chaliyar. The location map of the site is
shown in Fig.No.4.1
4.1.2 Topography
Topography of any site means the description of geographic details of the site. The site is situated
in private land. The land is having moderate slope in this area. There is no possibility of land slide
and the chances for soil erosion are negligible. The bed of the stream is rocky and boulders are
available at the site. The site is a seasonal one while the number of rainy days exceeds 50% in its
catchment.
4.2 FIELD INVESTIGATION
4.2.1 Reconnaissance survey
A topographical survey was conducted for obtaining topographical details of the site. The total
head of the site was found to be 33 m. A possible location for diversion structure and power
house are identified and the details were taken using tacheometric method of surveying.
4.2.2 Catchment area
The catchment of Adakkakundu fall (Chempuzha) was located using the toposheet. It is shown in
Fig.No. 4.2. The area is measured and it comes to 6.78 sq km. The catchment area having
almost moderate slope but some portions are very steep. The upstream portion of the catchment
area is the part of western ghats and the area nearby the site is mainly cultivated lands. The

WGSHP - Final Report (Vol. II) Adakkakundu
Integrated Rural Technology Centre, Palakkad 4.2
possibility of land slide exists at the upstream side of the catchment.
4.2.3 Contour map
The tacheometric survey details were plotted on a sheet of paper at a scale of 1:200. The
undulations on the site, the location of the falls and other topographical features were identified
from the contour map. The location of the weir, the alignment of the penstock and location of the
power house were also determined using this and the prepared contour map has been shown in
Annexure A.4.
4.2.4 River flow data
For a period of 12 months (November 97 to November 98) the water level observations were
taken every week. A suitable location was located on the upstream of the fall, where the whole
water is flowing through that point, cross sectional details of that point were noted for calculating
the stream discharge. A measuring gauge was fixed at that point to measure the peak flow. Using
the collected data (Table 4.1) the weekly discharge hydrograph of the site is prepared. The
graph is shown in Fig. No. 4.3.
4.2.5 Flow duration curve
Using weekly discharge hydro graph, percentage flow of exceedence was calculated. From this,
the flow duration curve was plotted (Fig. No. 4.4). The same curve also functions as percentage
flow of exceedence graph. This river flow data is recalculated in tabular form, giving the
corresponding energy potential in weekly and cumulative mode is given in Table 4.2. These data
are used for calculating energy potential and Selection of unit sizes in section 4.4.
The flow duration curve for the year 1998 is shown in Fig.4.4. The curve was obtained by
plotting discharge against percentage exceedence. The details are given in Table 4.2.
4.2.6 Peak flow determination
There are various empirical methods for calculating the maximum flood discharge. The different
values obtained are shown in Table 4.3 The value obtained by Dicken=s formula, which is
commonly used in western ghats region has been used for the structural design of diversion
structure.

WGSHP - Final Report (Vol. II) Adakkakundu
Integrated Rural Technology Centre, Palakkad 4.3
Table 4.3
Peak Flow Determination
Parameters
Dicken=s method
Ingli=s formula
Ryve=s formula
Nawab Jung
Bahadur formula
Peak flow in cumecs
108.12
198.99
35.85
282.65
4.3 SALIENT DESIGN FEATURES
A detailed design of Civil, Electrical and Mechanical work has not been carried out in this report
as it does not come under the purview of the project. But a typical section of the proposed
diversion structure is given here. The stability analysis of the section and economic diameter of
the penstock was carried out as part of preliminary design. The capability and number of units,
type and specification of turbine, generator and it=s cost have been estimated, after consulting
various agencies.
4.3.1 Power potential of the project
From the flow duration curve the discharge corresponding to 86% exceedence is only 0.005
cubic metre per second. A discharge of 0.02 cubic metre per second can produce only about
1.25 kW. However it seen that much higher flows are available during 50% of the time. In
order to tap the full potential of the site, with a head of 33 metre, the project is designed to
generate higher output with lower dependability. This site can be designed as a run of the river
project which can produce 25 kW with a dependability of 40%.
The output power was computed using the formula, P = 10 x Q x H x ηη
Where; P = Power output in kW
Q = Discharge in cumec
H = Head in metres
η = Efficiency taken as 0.75
For 50% exceedence P = 10 x 0.01 x 33 x 0.75 = 25.00 kW.
For 40% exceedence P = 10 x 0.14 x 33 x 0.75 = 35.00 kW.

WGSHP - Final Report (Vol. II) Adakkakundu
Integrated Rural Technology Centre, Palakkad 4.5
For 30% exceedence P = 10 x 0.26 x 33 x 0.75 = 65.00 kW.
4.3.2 Energy potential
At this site, sufficient flow is there so that we can obtain 25kW power output for 50% of the time
(182 days). Power input corresponding to 50% time will be (50/100 * 25 * 365 * 24) =
0.11MU. The flow after 50% time can be utilized by providing a small pondage.
The quantity of water available from 50% to 100% time is calculated to be 500774 m3. Energy
obtained from this water is calculated to be 0.034 MU.
Total amount of energy produced = 0.11 MU + 0.03 MU = 0.14MU.
It may be noted that, this much amount of energy can be generated for the particular year. If
higher flows are available during any year, it will enable higher production and vice versa.
4.3.3 Pondage requirement
From the contour map a plot of surface area Vs. elevation is drawn in Fig.No.4.5. The areas
corresponding to each elevation is used to find the volume of water that can be stored in each
elevation and the details is shown in Table 4.4. From this information capacity elevation curve of
the pondage is prepared and is shown in Fig.No.4.6.

WGSHP - Final Report (Vol. II) Adakkakundu
Integrated Rural Technology Centre, Palakkad 4.6
Table 4.4 Pondage Area Details
Sl. No.
Elevation (m)
Area (m2)
Capacity (m3)
Energy (kWh)
1
496.5
0
0
0
2
497
33.20
16.60
1
3
498
116.40
91.40
6
4
499
252.40
275.80
19
5
500
473.80
638.90
44
6
501
687.20
1219.40
84
7
502
909.00
2017.50
139
8
503
1163.80
3053.90
210
As the terrain is suitable for storing 3050 m3, it follows that, at full storage, the energy capacity is
only about 200 kWh. If a single 200 kW machine is installed, it can be operated for only one
hour at full capacity (during peak time). Fortunately, pondage becomes critical only during lean
months, this kid of operation practice is acceptable. Hence, a weir height of 6.5 m, to create a
storage of 3050 m3 is suggested. As the terrain is not suitable for storage the structure proposed
at this site is only for diverting water.
4.4 SELECTION OF PLANT CAPACITY AND UNIT SIZES For optimization of plant capacity, the following parameters were assumed.
Rate of return on investment - 15%
Loan repayment period - 10 years
Average O/M cost - 2.5% of capital cost
Resulting standard annual cost - 25%
(This consists of 2.5% O & M costs, 15% return on 25% equity, 15% interest on 75% loan and
repayment of loan in 10 annual instalments)
Tariff (per Unit) - Rs. 2.5 and 3.0 (Two cases)
Investment cost (Rs.in Crores per MW) - Rs. 3.5 (Two cases)
Since manufacturers were not in a position to quote exact figures, no attempt was made to fine

WGSHP - Final Report (Vol. II) Adakkakundu
Integrated Rural Technology Centre, Palakkad 4.7
tune the cost in relation to site specific conditions. Only ranges could be indicated. Each
combination of tariff and capital cost selected above, will demand a minimum annual generation
per kW installed. This can be taken to be the break even Plant Capacity Factor (PCF) for the
site under the specified conditions.
Lower the cost/MW and higher the price for energy, the larger will be the economically
viable installed capacity and the quantity of energy that can be economically extracted
from a given site.
Let the capital cost of Adakkakundu be Rs.3.5 crores/MW. The annual rate is 25%. Let the
unit rate of tariff offered by K.S.E.B be Rs. 2.5/kWh.
If X be the number of hours of operation at full load capacity,
per Mega Watt annual cost, at the rate of 25% on investment = Rs. 3.5 Crores x 0.25
per Mega Watt revenue = 1000 kW x Rs. 2.5 x X
Equating the two, we get 3,50,00,000 x 0.2.5 = X x 1000 x 2.5
X = 3,500 hrs.
It means that, any combination of machines, that can work at full capacity for over 3500 hours
can deliver a profit, if the overall project cost is below Rs. 3.5 crores/MW and tariff is Rs. 2.5
per kilo Watt hour.
This can be explained better in terms of Plant Capacity Factor, which is defined as the ratio of
actual amount of energy obtained during an year to the maximum energy that can be obtained
from the given installed capacity during an year.
In this case, for the value of X = 3500 hours, PCF = (3500 / 8760) x 100 = 40%
That is, a maximum capacity, which yields a PCF of 40% is economically viable for this site.
Similarly, break even PCF for Rs.3.0 per unit and Rs. 3.5 Crores per Mega Watt for X=2916
hours is 33.3%
Now we shall check various capacities of turbine size which are suitable for these two conditions.
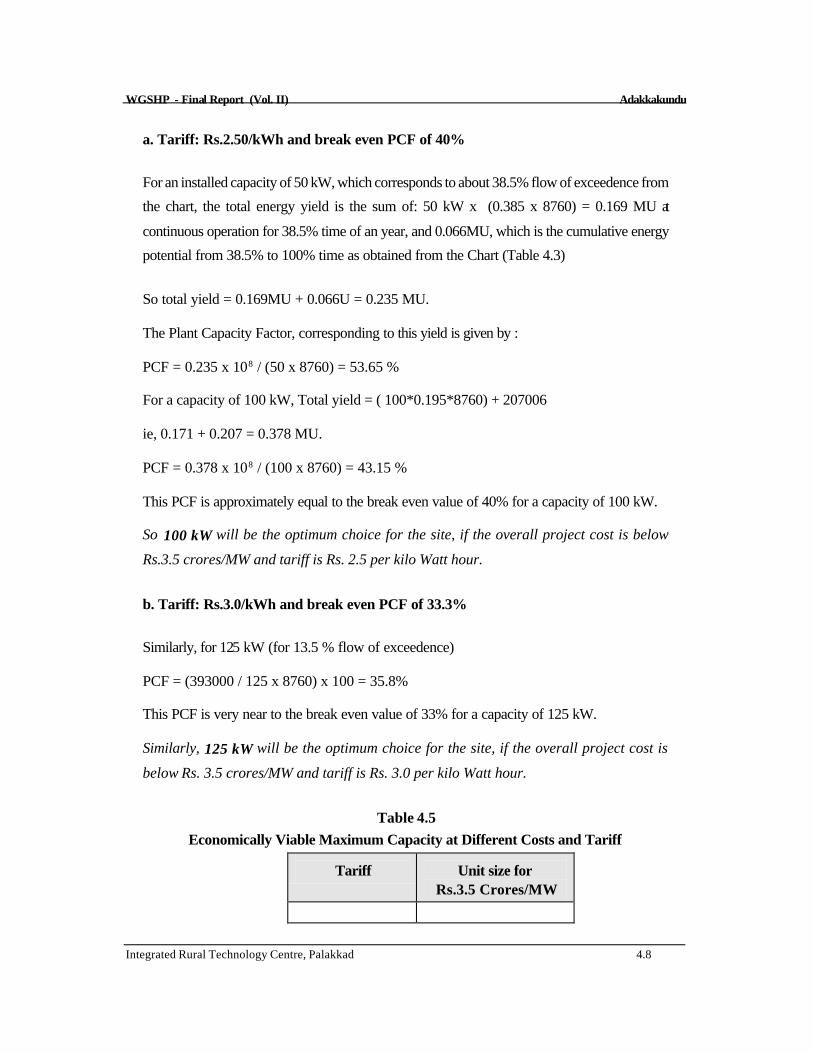
WGSHP - Final Report (Vol. II) Adakkakundu
Integrated Rural Technology Centre, Palakkad 4.8
a. Tariff: Rs.2.50/kWh and break even PCF of 40%
For an installed capacity of 50 kW, which corresponds to about 38.5% flow of exceedence from
the chart, the total energy yield is the sum of: 50 kW x (0.385 x 8760) = 0.169 MU at
continuous operation for 38.5% time of an year, and 0.066MU, which is the cumulative energy
potential from 38.5% to 100% time as obtained from the Chart (Table 4.3)
So total yield = 0.169MU + 0.066U = 0.235 MU.
The Plant Capacity Factor, corresponding to this yield is given by :
PCF = 0.235 x 10⁸ / (50 x 8760) = 53.65 %
For a capacity of 100 kW, Total yield = ( 100*0.195*8760) + 207006
ie, 0.171 + 0.207 = 0.378 MU.
PCF = 0.378 x 10⁸ / (100 x 8760) = 43.15 %
This PCF is approximately equal to the break even value of 40% for a capacity of 100 kW.
So 100 kW will be the optimum choice for the site, if the overall project cost is below
Rs.3.5 crores/MW and tariff is Rs. 2.5 per kilo Watt hour.
b. Tariff: Rs.3.0/kWh and break even PCF of 33.3%
Similarly, for 125 kW (for 13.5 % flow of exceedence)
PCF = (393000 / 125 x 8760) x 100 = 35.8%
This PCF is very near to the break even value of 33% for a capacity of 125 kW.
Similarly, 125 kW will be the optimum choice for the site, if the overall project cost is
below Rs. 3.5 crores/MW and tariff is Rs. 3.0 per kilo Watt hour.
Table 4.5
Economically Viable Maximum Capacity at Different Costs and Tariff
Tariff
Unit size for Rs.3.5 Crores/MW

WGSHP - Final Report (Vol. II) Adakkakundu
Integrated Rural Technology Centre, Palakkad 4.9
Rs.2.5/Unit 100 kW
Rs.3.00/ Unit
125 kW
The units selected can be one of the following combinations:
For Rs.3.5 Crores/MW and Rs.2.5/Unit we can opt (0.1MW x 1)
For Rs.3.5 Crores/MW and Rs.3.0/Unit we can opt ( 0.1 MW x 1 + 0.025MW x 1).
Among these two categories, the second one seems to be less viable since it is bulky with units.
We have restricted ourselves to the more realistic combination of Rs. 3.5 Crores/MW of
investment cost and two tariff choices of Rs. 2.5/Unit and Rs. 3.0/Unit.
4.5 CIVIL ENGINEERING WORKS
The important Civil Engineering Works required for the project are a diversion weir, an intake
structure, a penstock and a power house. A weir is constructed to have a small storage and to
divert the water from stream to the intake. For this project, only a diversion weir is proposed,
which allows the excess water to flow over the weir to the downstream. The intake structure
takes water from the weir and lead it to the penstock. The penstock made of steel is proposed in
this site. A power house is constructed for the purpose of housing the electro mechanical
equipment. A small building of one or two rooms will suffice.
4.5.1 Weir at Adakkakundu
A Gabion weir has been proposed at the site at a bed level of +495.500 metres. The base width
of the weir at bed level is 6.5m. The diversion structure is 6.50 m high having a length of 29 m. at
the top with a central broad crested free over fall type spill way. The cross sectional details of
the proposed diversion site and a typical section of the proposed weir structure is shown in
Fig.No. 4.7.
4.5.2 Intake Structure, Penstock and Power house
A simple box type, direct intake structure of reinforced cement concrete is provided on the
stream bed. A trash rack is provided at the intake mouth, the penstock entrance starts from the
wall of intake box near the structure. The economic diameter of the penstock is calculated as
0.2m. The penstock can carry a maximum flow of .0404 cumec with a velocity of 1.3 metre per
second. The possible alignment for the penstock is located on the left bank of the stream. The

WGSHP - Final Report (Vol. II) Adakkakundu
Integrated Rural Technology Centre, Palakkad 4.10
longitudinal section of the proposed penstock line was drawn from contour map and calculated
the length, which comes to 147m (Fig. No. 4.8).
A surface power house is proposed on the left bank of the stream. The slope at the proposed site
is moderate but increases up the hill towards north east direction. The power house is of size 8m
x 4.5m, to accommodate a 100 kW generator and standardised turbine.
4.6 ELECTRICAL AND MECHANICAL EQUIPMENTS
The power house proposed in the scheme will have an installed capacity of 100 kW. The
electricity generated would be connected to the existing power grid system at Adakkakundu by a
3 km. transmission line. A standardised turbine for 33m gross head is proposed for this particular
site. The turbine shall be complete with governor, control equipment and safety devices. The
generator would be synchronous with a brushless excitation system shall be rated to generate 100
kW, 11kV three phases, 50Hz and shall be suitable for coupling with turbine described above.
The generator shall have voltage regulation equipment, parallel operation equipment etc.
4.7 ENVIRONMENTAL IMPACTS
A micro hydel project has been proposed at Adakkakundu (Malappuram Dist.). The project
aims to generates about 100 kW of hydro power from a fall having a head of 33 m. Some
preliminary environmental impact analysis have been carried out. They are land, water, socio-
economic environmental impacts
4.7.1 Environmental impact on land

WGSHP - Final Report (Vol. II) Adakkakundu
Integrated Rural Technology Centre, Palakkad 4.11
Total area of catchment is about 6.78 square kilometres of land in Chempuzha which joins to
Valiyapuzha then Kottapuzha and finally drains in to Chaliar. The site is situated in private land. The
land is having moderate slope in this area. There is no possibility of land slide and the chances for soil
erosion is exists. The bed of the stream is rocky and boulders are available at nearby the site. The
most significant thing is that, due to impoundment, no forest land will be submerged. The construction
of weir, penstock, power house, tailrace and temporary road will not take away any forest land.
4.7.2 Environmental impact on water
The Chempuzha which drains to Valiyapuzha is the stream of this fall. It is a 3rd order, structurally
controlled stream. The storage structure will create a pond of area 0.116 hectare. No forest land will
be submerged. Above all, this accounts for only 1.16 ha/MW. This diversion structure which also
acts as a check dam can increase the height of water table level at the site. The impounded water will
also change soil moisture regime in adjacent forest land.
4.7.3 Socio-economic impact
The construction phase would create employment opportunities for a period of 12 months. It require
only minimum land acquisition for construction. The acquisition does not need any rehabilitation.
4.8 CONCLUSION
The environmental impact of small hydel project is negligible. No serious adverse impact is
anticipated. Moreover, deforestation owing to the inundation will be a meagre area. The economic
size of installed capacity depends upon the permissible tariff as well as the capital cost. It was found
that the project is financially viable for an installed capacity of 100kW at a project cost of Rs. 3.5
Crores per MW and a tariff rate of Rs.2.5 per unit of electricity. Alternatively, if the tariff is raised to
Rs.3.00 per unit, an installed capacity of 125kW would become economically viable.
Cost effective methods of construction, like the use of gabion weirs, can be used to reduce the capital
costs. A methodology for implementing the project with a maximum of peoples= participation should
also be devised. The role of the Grama Panchayat in this effort is crucial.
-��-

WGSHP - Final Report (Vol. II) Adakkakundu
Integrated Rural Technology Centre, Palakkad 4.12
5. CHAKKIMALI
District : Idukki
Panchayath : Arakkulam
Head : 33 m.
Flow : Seasonal
Suggested Capacity : 40 kW / 50 kW
WGSHP - Final Report (Vol. II) Chakkimali
Integrated Rural Technology Centre, Palakkad 5.1
5.1 GENERAL
5.1.1 The site
Chakkimali water fall is situated in IXth ward of Arakkulam Grama Panchayath in Idukki district.
To reach this site, we have to travel nearly 18km distance from Moolamattom to Kulamavu.
Two kilometre away from Kulamavu there is a boat station. After 20 minutes journey from
Nellikkappara boat station, we will reach Peranikkadavu. From Peranikkadavu a forest footpath
of one kilometre stretch exists which leads to the site. From Moolamattom to Urumpallu, there is
another route to reach the site. That jeepable route is too long as compared to the early said
route.
The water fall is located at 760 56' 45" E longitude and 90 47' 13" N latitude. The catchment
area measured from topo sheet is 1.5 sq. km. The falls are situated at an elevation of 720m from
MSL in Chakkimali thodu which begins at an elevation of 940m from MSL. After the fall the
stream drains to Idukki reservoir. The fall situated just 150m away from reservoir. No existing
supply lines are available near by this site. The location map of the site is shown in Fig.No.5.1
5.1.2 Topography
Topography of any site means the description of the geographical details of the site. The land is
having steep slopes in this area. There is no possibility of land slide and the possibility of soil
erosion is negligible. The stream bed is rocky and availability of boulders are less. The number
of rainy days exceeds 50% in its catchment.
5.2 FIELD INVESTIGATION
5.2.1 Reconnaissance survey
Before starting the topographical survey we walked through the project area, which gave an
overall idea of the site and its principal features. Possible instrument stations were located for the
theodolite surveying and conducted a topographical survey for obtaining topographical details of
the site. There is one main fall which gives a total head of 33m. The possible location for
diversion structure and power house are identified and the details are taken using tacheometric
method of surveying.

WGSHP - Final Report (Vol. II) Chakkimali
Integrated Rural Technology Centre, Palakkad 5.2
5.2.2 Catchment area
Topographical survey sheets to a scale of 1:50,000 are available from the Survey of India. The
catchment of Chakkimali water fall was located using the toposheet. It is shown in the
Fig.No.5.2 and it is measured the area which comes to nearly 1.5 sq.km. The catchment area
having almost moderate slope but some portions are very steep. Maximum flood discharge
measured at this site during 1998 is about 1 cumec.
5.2.3 Contour map
The tacheometric survey details were plotted on a sheet of paper at a scale of 1:200. The
undulations of the site, the location of the falls and other topographical features were identified
from the contour map. The location of the weir, the alignment of the penstock and location of the
power house were also determined using this and the prepared contour map has been shown in
Annexure A.5.
5.2.4 River flow data
For a period of 12 months (January 98 to January 99) the water level observations were taken
every week. A suitable location was located on the upstream side of the fall, where the whole
water is flowing through that point, cross sectional details of that point were noted for calculating
the stream discharge. We fixed a measuring gauge at that point to measure the peak flow. Using
the collected data (Table 5.1) the weekly discharge hydrograph of the site is prepared. The
graph is shown in Fig. No. 5.3.
5.2.5 Flow duration curve
Using weekly discharge hydro graph, percentage flow of exceedence was calculated. From this,
the flow duration curve was plotted (Fig. No. 5.4). The same curve also functions as percentage
flow of exceedence graph. This river flow data is recalculated in tabular form, giving the
corresponding energy potential in weekly and cumulative mode is given in Table 5.2. These data
are used for calculating energy potential and selection of unit sizes in section 5.4.
5.2.6 Peak flow determination
There are various empirical methods for calculating the maximum flood discharge. The different

WGSHP - Final Report (Vol. II) Chakkimali
Integrated Rural Technology Centre, Palakkad 5.3
values obtained are shown in Table 5.3 The value obtained by Dicken=s formula, which is
commonly used in western ghats region has been used for the structural design of diversion
structure.
Table 5.3
Peak Flow Determination
Parameters
Dicken=s method
Ingli=s formula
Ryve=s formula
Nawab Jung
Bahadur formula Peak flow in cumec
35.24
53.48
13.23
113.15
5.3 SALIENT DESIGN FEATURES
A detailed design of Civil, Electrical and Mechanical work has not been carried out in this report
as it does not come under the purview of the project. But, a typical section of the proposed
diversion structure is given here. The stability analysis of the section and economic diameter of
the penstock was carried out as part of preliminary design. The capability and number of units,
type and specification of turbine, generator and it=s cost have been estimated, after consulting
various agencies.
5.3.1 Power potential of the project
From the flow duration curve, the discharge corresponding to 80% of exceedence is only
0.002cubic metre per second. A discharge of 0.002 cubic metre per second can produce only
about 0.5W. In order to tap the full potential of the site, with a head of 33 metre, the project is
designed to generate higher output with lower dependability. This site can be designed as a run
of the river project which can produce 15 kW with a dependability of 40%.
The output power was computed using the formula, P = 10 x Q x H x η
Where; P = Power output in kW
Q = Discharge in cumec
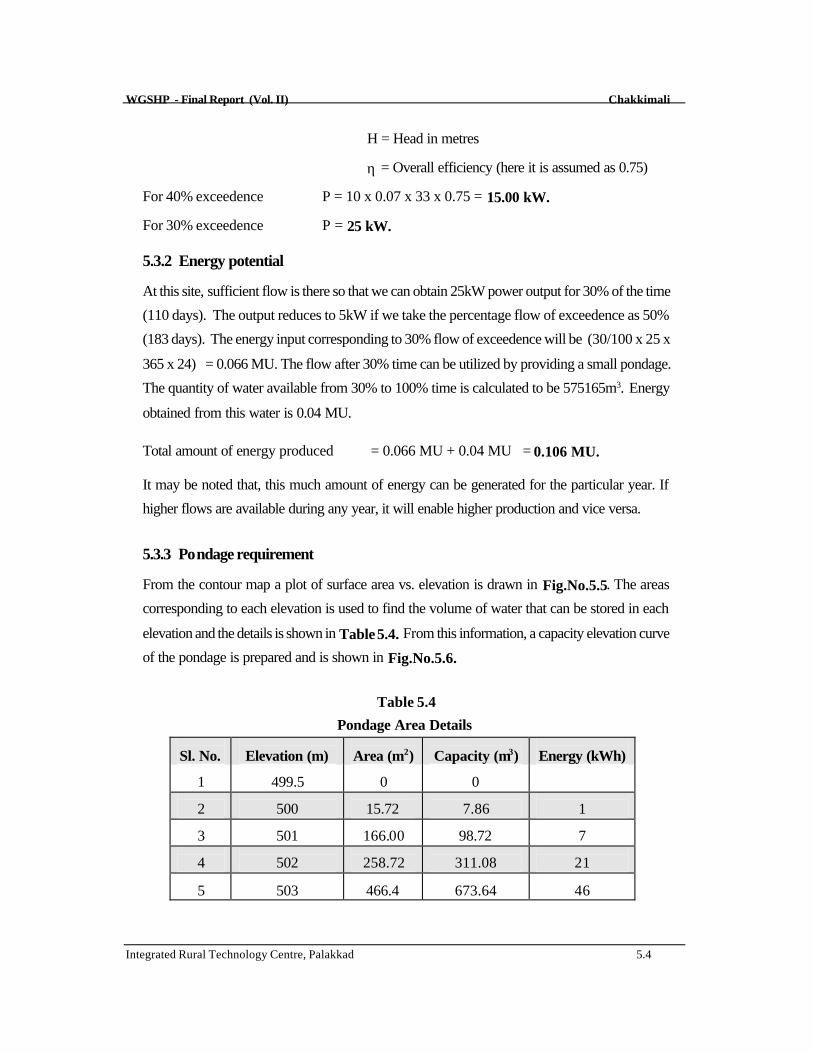
WGSHP - Final Report (Vol. II) Chakkimali
Integrated Rural Technology Centre, Palakkad 5.4
H = Head in metres
η = Overall efficiency (here it is assumed as 0.75)
For 40% exceedence P = 10 x 0.07 x 33 x 0.75 = 15.00 kW.
For 30% exceedence P = 25 kW.
5.3.2 Energy potential
At this site, sufficient flow is there so that we can obtain 25kW power output for 30% of the time
(110 days). The output reduces to 5kW if we take the percentage flow of exceedence as 50%
(183 days). The energy input corresponding to 30% flow of exceedence will be (30/100 x 25 x
365 x 24) = 0.066 MU. The flow after 30% time can be utilized by providing a small pondage.
The quantity of water available from 30% to 100% time is calculated to be 575165m3. Energy
obtained from this water is 0.04 MU.
Total amount of energy produced = 0.066 MU + 0.04 MU = 0.106 MU.
It may be noted that, this much amount of energy can be generated for the particular year. If
higher flows are available during any year, it will enable higher production and vice versa.
5.3.3 Pondage requirement
From the contour map a plot of surface area vs. elevation is drawn in Fig.No.5.5. The areas
corresponding to each elevation is used to find the volume of water that can be stored in each
elevation and the details is shown in Table 5.4. From this information, a capacity elevation curve
of the pondage is prepared and is shown in Fig.No.5.6.
Table 5.4
Pondage Area Details Sl. No.
Elevation (m)
Area (m2)
Capacity (m3)
Energy (kWh)
1
499.5
0
0
2
500
15.72
7.86
1
3
501
166.00
98.72
7
4
502
258.72
311.08
21
5
503
466.4
673.64
46

WGSHP - Final Report (Vol. II) Chakkimali
Integrated Rural Technology Centre, Palakkad 5.5
6
504
891.44
1352.53
100
7
505
1306.8
2451.68
169
As the terrain is suitable for storing 2450 m3, it follows that, at full storage, the energy capacity is
only about 169 kWh. If a single 150 kW machine is installed, it can be operated for only one
hour at full capacity during peak time. Fortunately, pondage becomes critical only during lean
months, this kid of operation practice is acceptable. Hence, a weir height of 5.5 m, to create a
storage of 2450 m3 is suggested.
As the terrain is not suitable for storage the structure proposed at this site is only for diverting
water.
5.4 SELECTION OF PLANT CAPACITY AND UNIT SIZES
For optimization of plant capacity, the following parameters were assumed.
Rate of return on investment - 15%
Loan repayment period - 10 years
Average O/M cost - 2.5% of capital cost
Resulting standard annual cost - 25%
(This consists of 2.5% O & M costs, 15% return on 25% equity, 15% interest on 75% loan and
repayment of loan in 10 annual instalments)
Tariff (per Unit) - Rs. 2.5 and 3.0 (Two cases)
Investment cost (Rs.in Crores per MW) - Rs. 3.5 (Two cases)
Since manufacturers were not in a position to quote exact figures, no attempt was made to fine
tune the cost in relation to site specific conditions. Only ranges could be indicated. Each
combination of tariff and capital cost selected above, will demand a minimum annual generation
per kW installed. This can be taken to be the break even Plant Capacity Factor (PCF) for the
site under the specified conditions.
Lower the cost/MW and higher the price for energy, the larger will be the economically
viable installed capacity and the quantity of energy that can be economically extracted

WGSHP - Final Report (Vol. II) Chakkimali
Integrated Rural Technology Centre, Palakkad 5.6
from a given site.
Let the capital cost of Chakkimali be Rs.3.5 crores/MW. The annual rate is 25%. Let the unit
rate of tariff offered by K.S.E.B be Rs. 2.5/kWh.
If X be the number of hours of operation at full load capacity,
per Mega Watt annual cost, at the rate of 25% on investment = Rs. 3.5 Crores x 0.25
per Mega Watt revenue = 1000 kW x Rs. 2.5 x X
Equating the two, we get 3,50,00,000 x 0.2.5 = X x 1000 x 2.5
X = 3,500 hrs.
This means that, any combination of machines, that can work at full capacity for over 3500 hours
can deliver a profit, if the overall project cost is below Rs. 3.5 crores/MW and tariff is Rs. 2.5
per kilo Watt hour.
This can be explained better in terms of Plant Capacity Factor, which is defined as the ratio of
actual amount of energy obtained to the maximum energy that can be obtained from the given
installed capacity during an year, to the actual amount of energy obtained.
In this case, for the value of X = 3500 hours, PCF = (3500 / 8760) x 100 = 40%
That is, a maximum capacity, which yields a PCF of 40% is economically viable for this site.
Similarly, break even PCF for Rs.3.0 per unit and Rs. 3.5 Crores per Mega Watt where
X=2916 hours is 33.3%
Now we shall check various capacities of turbine size which are suitable for this two conditions.
a. Tariff: Rs.2.50/kWh and break even PCF of 40%
For an installed capacity of 40 kW, which corresponds to about 19.23% flow of exceedence
from the chart, the total energy yield is the sum of;

WGSHP - Final Report (Vol. II) Chakkimali
Integrated Rural Technology Centre, Palakkad 5.7
40 kW x (0.19 x 8760) = 0.067 at continuous operation for 19.23% time of an year, and
0.073MU, which is the cumulative energy potential from 19.23% to 100% time as obtained from
the Chart (Table 5.3).
Total yield = 0.067MU + 0.073MU = 0.14 MU.
The Plant Capacity Factor, corresponding to this yield is given by :
PCF = 0.14 x 10⁸ / (40 x 8760) = 39.9 %
This PCF is equal to the break even value of 40%.
So 40 kW will be the optimum choice for the site, if the overall project cost is below
Rs. 3.5 crores/MW and tariff is Rs. 2.5 per kilo Watt hour.
b. Tariff: Rs.3.0/kWh and break even PCF of 33.3%
Similarly, For 50 kW (for 4% flow of exceedence)
PCF = (156000 / 50 x 8760) x 100 = 35.6%
This PCF is very near to the break even value of 33%.
Similarly, 50 kW will be the optimum choice for the site, if the overall project cost is below
Rs. 3.5 crores/MW and tariff is Rs. 3.0 per kilo Watt hour.
Table 5.5
Economically Viable Maximum Capacity at Different Costs and Tariff
Tariff
Unit size for Rs.3.5 Crores/MW
Rs.2.5/Unit
40 kW
Rs.3.00/ Unit
50 kW
The units selected can be one of the following combinations:
For Rs.3.5 Crores/MW and Rs.2.5/Unit we can opt (0.025MW x 1 + 0.015 MW x 1)
For Rs.3.5 Crores/MW and Rs.3.0/Unit we can opt ( 0.05MW x 1).
Among these two categories, the second one seems to be less viable since it is bulky with units.
We have restricted ourselves to the more realistic combination of Rs.3.5 Crores/MW of

WGSHP - Final Report (Vol. II) Chakkimali
Integrated Rural Technology Centre, Palakkad 5.8
investment cost and two tariff choices of Rs.2.5/Unit and Rs.3.0/Unit.
5.5 CIVIL ENGINEERING WORKS The important Civil Engineering Works required for the project are a storage structure, a
penstock and a power house. A weir is constructed to have a small storage and to divert the
water from stream to the intake. The excess water during monsoon is allows to flow over the
weir to the downstream. The intake structure takes water from the weir and leads it to the
penstock. The penstock made of steel is proposed in this site. A power house is constructed for
the purpose of housing the electro mechanical equipment. It is usually a small building of 3.5m x
5m.
5.5.1 Weir at Chakkimali
A concrete overflow weir has been proposed on the Chakkimali stream, at a bed level of
+499.000 metres. The base width of the weir at bed level is 4.25m. The diversion structure is
5.5m high having a length of 33.25m at the top with a central broad crested free over fall type
spill way. The cross sectional details of the proposed diversion site and typical section of the
storage structure are shown in Fig.No. 5.7.
5.5.2 Intake Structure, Penstock and Power house
A simple box type, direct intake structure of reinforced cement concrete is provided on the
stream bed. A trash rack is provided at the intake mouth, the penstock entrance starts from the
wall of intake box near the structure. The economic diameter of the penstock is calculated as
0.36m . The penstock is designed for a maximum flow of 0.1616 cumec with a velocity of 1.6
metre per second. The possible alignment for the penstock is located on the left bank of the
stream. The longitudinal section of the proposed penstock line was drawn from contour map and
calculated the length, which comes to 105m (Fig. No. 5.8).
A surface power house is proposed on the left bank of the stream. The slope at the proposed site
is moderate but increases up the hill towards left bank of the stream. The power house is of size
3.5m x 5m to accommodate 40 kW generator and standardised turbine.

WGSHP - Final Report (Vol. II) Chakkimali
Integrated Rural Technology Centre, Palakkad 5.9
5.6 ELECTRICAL AND MECHANICAL EQUIPMENTS The power house proposed in the scheme will have an installed capacity of 40kW. The system is
designed as stand alone system and the energy generated shall be given to the near by houses by
a separate transmission line. A standardised turbine for 33m gross head is proposed for this
particular site. The turbine shall be complete with governor, control equipment and safety
devices. The generator would be synchronous with a brushless excitation system shall be rated to
generate 40kW 11kV three phases, 50Hz and shall be suitable for coupling with turbine
described above. The generator shall have voltage regulation equipment, parallel operation
equipment etc.
5.7 ENVIRONMENTAL IMPACTS A micro hydel project has been proposed at Chakkimali (Idukki Dist.). The project aims to
generates about 40 kW of hydro power from a fall having a head of 33 m. Some preliminary
environmental impact analysis have been carried out. They are land, water and socio-
economical environmental impacts.
5.7.1. Environmental impact on land
The catchment area measured from topo sheet comes to be 1.5 sq. km. After the fall the stream
drains to Idukki reservoir. The fall is just 150m. away from reservoir. This area is an isolated
one because of reservoir. No gridlines are available in this site. The most significant thing is that,
due to impoundment, no forest land will be submerged. The construction of weir, penstock,
power house, tailrace and temporary road will not take away any forest land.
WGSHP - Final Report (Vol. II) Chakkimali
Integrated Rural Technology Centre, Palakkad 5.10
5.7.2 Water environmental impact on water
The Chakkimalithodu, which drains to Idukki reservoir is the basin of this fall. The diversion structure
will create a pond of area 0.1307 hectare. No forest land will be submerged. Above all, this accounts
for only 3.27 ha/MW. This diversion structure which also acts as a check dam can increase the height
of water table level at the site. The impounded water will also change soil moisture regime in adjacent
forest land.
5.7.3 Socio-economic impact
The construction phase would create employment opportunities for a period of 6 months. It requires
only minimum land acquisition for construction. The acquisition does not need any rehabilitation.
5.8 CONCLUSION
The environmental impact of small hydel project is negligible. No serious adverse impact is
anticipated. Moreover, deforestation owing to the inundation will be a merge area.
The economic size of installed capacity depends upon the permissible tariff as well as the capital cost.
It was found that the project is financially viable for an installed capacity of 40kW at a project cost of
Rs. 3.5 Crores per MW and a tariff rate of Rs.2.5 per unit of electricity. Alternatively, if the tariff is
raised to Rs.3.00 per unit, an installed capacity of 50kW would become economically viable.
Cost effective methods of construction, like the use of gabion weirs, can be used to reduce the capital
costs. A methodology for implementing the project with a maximum of peoples= participation should
also be devised. The role of the Grama Panchayat in this effort is crucial.
-��-

WGSHP - Final Report (Vol. II) Chakkimali
Integrated Rural Technology Centre, Palakkad 5.11
6. NELLIKKAPPARA
District : Pathanamthitta
Panchayath : Aruvappulam
Head : 33 m.
Flow : Seasonal
Suggested Capacity : 100 kW/ 125 kW

WGSHP - Final Report (Vol. II) Nellikkappara
Integrated Rural Technology Centre , Palakkad .1
6.1 GENERAL
6.1.1 The Site
The Nellikkappara water fall is located in the Xth ward of Aruvappulam Grama Panchayath in
Pathanamthitta district. The site is at a distance of 17 km from Konni. Bus services are not
available to the site. There is an unmetalled road to the site. Jeep services are available from
Konni town except monsoon season. During rainy season there is another route to reach the
site. From Konni to Kummannore, bus services are available. From there, jeep services are
available to the site. The nearest 11KV transformer is about 12 km. away from the site.
The water fall is located at 760 59' 3" E longitude and 90 12' 21" N latitude. The catchment area
measured from topo sheet is 0.50 sq.km. The falls are situated at an elevation of 260m from
MSL in Kokkathodu stream which is beginning at an elevation of 940m from MSL. The
stream flows through steep slopes. After the fall, the stream joins to the Achankovil Aar near
Konni. The location map of the site is shown in Fig.No.6.1.
6.1.2 Topography
The site is situated outside of the forest. Both sides of the stream is owned by private persons.
The land is having medium slope in this area. There is no possibility of land slide and the chance
of soil erosion is also negligible. The stream bed is rocky and boulders are available near to
site. The number of rainy days exceeds 50% in its catchment.
6.2 FIELD INVESTIGATION
6.2.1 Reconnaissance Survey
A topographical survey was conducted for obtaining topographical details of the site. There is
two falls which gives a total head of 33m. The possible location for diversion structure and
power house were identified and the details are taken using tacheometric method of surveying.
6.2.2 Catchment Area

WGSHP - Final Report (Vol. II) Nellikkappara
Integrated Rural Technology Centre , Palakkad .2
The catchment of Nellikkappara site was located using the toposheet. It is shown in
Fig.No.6.2. The total area of catchment is measured and it comes to 0.5 sq. km. The
catchment area having almost moderate slope but some portions are very steep.
6.2.3 Contour Map
The survey details were plotted on a sheet of paper at a scale of 1:200. The undulations of the
site, the location of the falls and other topographical features were identified from the contour
map. The location of the weir, the alignment of the penstock and location of the power house
were also determined using this and the prepared contour map has been shown in Annexure
A.6.
6.2.4 River Flow Data
For a period of 12 months (January 1998 to January 1999) the water level observations were
taken every week. A suitable location was identified near the upstream side of the fall, where
the whole water is flowing through that point, cross sectional details of the point was noted for
calculating the stream discharge. We fixed a measuring gauge at that point to measure the peak
flow. Using the collected data (Table 6.1) the weekly discharge hydrograph of the site was
prepared. The graph is shown in Fig. No. 6.3.
6.2.5 Flow Duration Curve
Using weekly discharge hydro graph, percentage flow of exceedence was calculated. From
this, the flow duration curve was plotted (Fig. No. 6.4). The same curve also functions as
percentage flow of exceedence graph. This river flow data is recalculated in tabular form, giving
the corresponding energy potential in weekly and cumulative mode is given in Table 6.2. These
data are used for calculating energy potential and selection of unit sizes in section 6.4.
6.2.6 Peak Flow Determination
There are various empirical methods for calculating the maximum flood discharge. The different
values obtained are shown in Table 6.3 The value obtained by Dicken=s formula, which is
commonly used in western ghats region has been used for the structural design of diversion
structure.
Table 6.3
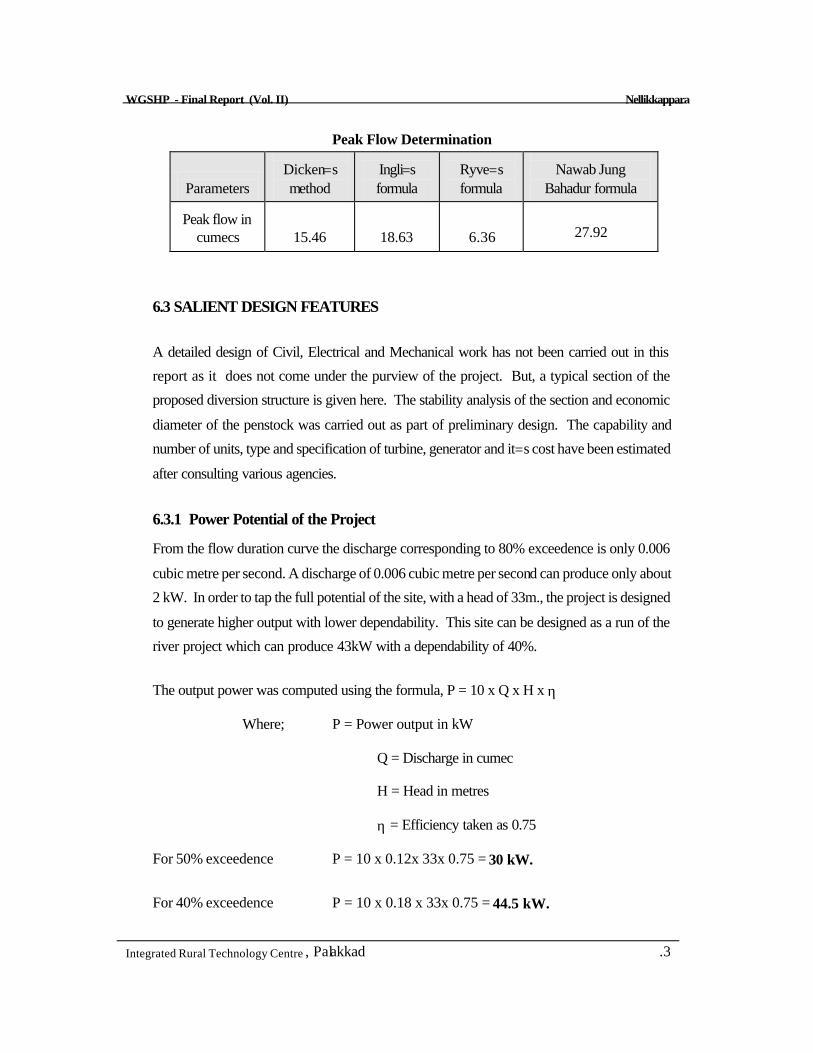
WGSHP - Final Report (Vol. II) Nellikkappara
Integrated Rural Technology Centre , Palakkad .3
Peak Flow Determination
Parameters
Dicken=s method
Ingli=s formula
Ryve=s formula
Nawab Jung
Bahadur formula Peak flow in
cumecs
15.46
18.63
6.36
27.92
6.3 SALIENT DESIGN FEATURES
A detailed design of Civil, Electrical and Mechanical work has not been carried out in this
report as it does not come under the purview of the project. But, a typical section of the
proposed diversion structure is given here. The stability analysis of the section and economic
diameter of the penstock was carried out as part of preliminary design. The capability and
number of units, type and specification of turbine, generator and it=s cost have been estimated
after consulting various agencies.
6.3.1 Power Potential of the Project
From the flow duration curve the discharge corresponding to 80% exceedence is only 0.006
cubic metre per second. A discharge of 0.006 cubic metre per second can produce only about
2 kW. In order to tap the full potential of the site, with a head of 33m., the project is designed
to generate higher output with lower dependability. This site can be designed as a run of the
river project which can produce 43kW with a dependability of 40%.
The output power was computed using the formula, P = 10 x Q x H x η
Where; P = Power output in kW
Q = Discharge in cumec
H = Head in metres
η = Efficiency taken as 0.75
For 50% exceedence P = 10 x 0.12x 33x 0.75 = 30 kW.
For 40% exceedence P = 10 x 0.18 x 33x 0.75 = 44.5 kW.

WGSHP - Final Report (Vol. II) Nellikkappara
Integrated Rural Technology Centre , Palakkad .5
For 30% exceedence P = 10 x 0.3 x 33x 0.75 = 75 kW.
6.3.2 Energy Potential
At this site, sufficient flow is there so that we can obtain 75 kW power output for 30% of the
time (110 days). The output reduces to 25kW if we take the prcentage flow of exceedence as
60%. The energy input corresponding to 30% flow of exceedence will be (30/100 x 75 x 365
x 24) = 0.197 MU. The flow after 30% time can be utilised by providing a small pondage. The
quantity of water available from 30% to 100% time is calculated to be 1634170m3. Energy
obtained from this water is 0.112 MU.
Total amount of energy produced = 0.197 MU + 0.112 MU = 0.309 MU.
It may be noted that , this much amount of energy can be generated for the particular year. If
higher flows are available during any year, it will enable higher production and vice versa.
6.3.3 Pondage Requirement
From the contour map a plot of surface area Vs. elevation is drawn in Fig . No. 6.5. The areas
corresponding to each elevation is used to find the volume of water that can be stored in each
elevation and the details is shown in Table 6.4. From this information capacity elevation curve
of the pondage is prepared and is shown in Fig.No. 6.6
Table 6.4 Pondage area details
Sl. No.
Elevation (m)
Area (m2)
Capacity (m3)
Energy (kWh)
1
147.50
0
0
2
148
8.00
2.00
0.1
3
149
52.00
32.00
2
4
150
133.00
124.50
9
5
151
330.00
353.00
24
6
152
562.00
802.00
55
As the terrain is suitable for storing 802m3, it follows that, at full storage, the energy capacity is
only about 55kWh. If a single 50 kW machine is installed, it can be operated for only one hour

WGSHP - Final Report (Vol. II) Nellikkappara
Integrated Rural Technology Centre , Palakkad .6
at full capacity (during peak time). Fortunately, pondage becomes critical only during lean
months, this kind of operation practice is acceptable. Hence, a weir height of 4.5 m, to create
a storage of 802 m3 is suggested.
As the terrain is not suitable for storage the structure proposed at this site is only for diverting
water.
6.4 SELECTION OF PLANT CAPACITY AND UNIT SIZES
For optimization of plant capacity, the following parameters were assumed.
Rate of return on investment - 15%
Loan repayment period - 10 years
Average O/M cost - 2.5% of capital cost
Resulting standard annual cost - 25%
(This consists of 2.5% O & M costs, 15% return on 25% equity, 15% interest on 75% loan and repayment of loan in 10 annual instalments)
Tariff (per Unit) - Rs. 2.5 and 3.0 (Two cases)
Investment cost (Rs.in Crores per MW) - Rs. 3.5 (Two cases)
Since manufacturers were not in a position to quote exact figures, no attempt was made to fine
tune the cost in relation to site specific conditions. Only ranges could be indicated. Each
combination of tariff and capital cost selected above, will demand a minimum annual generation
per kW installed. This can be taken to be the break even plant capacity factor (PCF) for the
site under the specified conditions.
Lower the cost/MW and higher the price for energy, the larger will be the economically
viable installed capacity and the quantity of energy that can be economically extracted
from a given site.
Let the capital cost of Nellikkappara be Rs.3.5 crores/MW. The annual rate is 25%. Let the
unit rate of tariff offered by K.S.E.B be Rs. 2.5/kWh.

WGSHP - Final Report (Vol. II) Nellikkappara
Integrated Rural Technology Centre , Palakkad .7
If X be the number of hours of operation at full load capacity,
per Mega Watt annual cost, at the rate of 25% on investment = Rs. 3.5 Crores x 0.25
per Mega Watt revenue = 1000 kW x Rs. 2.5 x X
Equating the two, we get 3,50,00,000 x 0.2.5 = X x 1000 x 2.5
X = 3,500 hrs.
It follows that, any combination of machines, that can work at full capacity for over 3500 hours
can deliver a profit, if the overall project cost is below Rs. 3.5 crores/MW and tariff is Rs. 2.5
per kilo Watt hour.
This can be explained better in terms of Plant Capacity Factor, which is defined as the ratio
of actual amount of energy obtained to the maximum energy that can be obtained from the given
installed capacity during an year, to the actual amount of energy obtained.
In this case, for the value of X = 3500 hours, PCF = (3500 / 8760) x 100 = 40%.
That is, a maximum capacity, which yields a PCF of 40% is economically viable for this site.
Similarly, break even PCF for Rs.3.0 per unit and Rs. 3.5 Crores per Mega Watt where
X=2916 hours is 33.3%.
Now we shall check various capacities of turbine size which are suitable for this two conditions.
a. Tariff: Rs.2.50/kWh and break even PCF of 40%
For an installed capacity of 100kW, which corresponds to about 11.5% flow of exceedence
from the chart, the total energy yield is the sum of:
100 kW x (0.115 x 8760) = 0.10MU at continuous operation for 11.5% time of an year, and
0.26MU, which is the cumulative energy potential from 11.5% to 100% time as obtained from
the Chart (Table 6.3).
Total yield = 0.1MU + 0.26MU = 0.36MU.
The Plant Capacity Factor, corresponding to this yield is given by :
PCF = 0.36 x 10⁸ / (550 x 8760) = 41 %
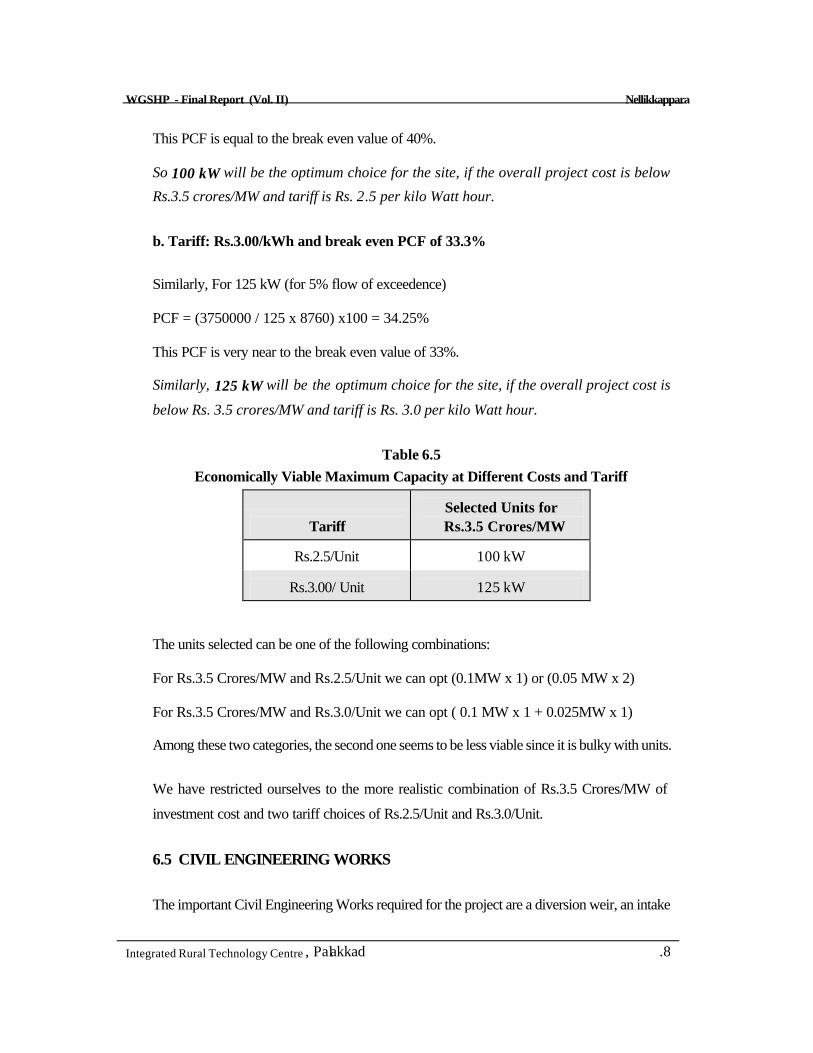
WGSHP - Final Report (Vol. II) Nellikkappara
Integrated Rural Technology Centre , Palakkad .8
This PCF is equal to the break even value of 40%.
So 100 kW will be the optimum choice for the site, if the overall project cost is below
Rs.3.5 crores/MW and tariff is Rs. 2.5 per kilo Watt hour.
b. Tariff: Rs.3.00/kWh and break even PCF of 33.3%
Similarly, For 125 kW (for 5% flow of exceedence)
PCF = (3750000 / 125 x 8760) x100 = 34.25%
This PCF is very near to the break even value of 33%.
Similarly, 125 kW will be the optimum choice for the site, if the overall project cost is
below Rs. 3.5 crores/MW and tariff is Rs. 3.0 per kilo Watt hour.
Table 6.5
Economically Viable Maximum Capacity at Different Costs and Tariff
Tariff
Selected Units for
Rs.3.5 Crores/MW
Rs.2.5/Unit
100 kW
Rs.3.00/ Unit
125 kW
The units selected can be one of the following combinations:
For Rs.3.5 Crores/MW and Rs.2.5/Unit we can opt (0.1MW x 1) or (0.05 MW x 2)
For Rs.3.5 Crores/MW and Rs.3.0/Unit we can opt ( 0.1 MW x 1 + 0.025MW x 1)
Among these two categories, the second one seems to be less viable since it is bulky with units.
We have restricted ourselves to the more realistic combination of Rs.3.5 Crores/MW of
investment cost and two tariff choices of Rs.2.5/Unit and Rs.3.0/Unit.
6.5 CIVIL ENGINEERING WORKS
The important Civil Engineering Works required for the project are a diversion weir, an intake

WGSHP - Final Report (Vol. II) Nellikkappara
Integrated Rural Technology Centre , Palakkad .9
structure, a penstock and a power house. A weir is constructed to have a small storage and to
divert the water from stream to the intake. For this project only a diversion weir is proposed,
which allows the excess water to flow over the weir to the downstream. The intake structure
takes water from the weir and leads it to the penstock. The penstock made of steel is proposed
in this site. A power house is constructed for the purpose of housing the electro mechanical
equipment. It is usually a small building of dimensions 10m x 5.5m.
6.5.1 Weir at Nellikkappara
A concrete weir has been proposed on the Kokkathodu stream, at a bed level of +147.50
metres. The base width of the weir at bed level is 3.7m. The diversion structure is 2.8m high
having a length of 19.75m at the top with a central broad crested free over fall type spill way.
The cross sectional details of the proposed diversion site and typical section of diversion
structure are shown in Fig.No. 6.7.
6.5.2 Intake Structure, Penstock and Power House
A simple box type, direct intake structure of reinforced cement concrete is provided on the
stream bed. A trash rack is provided at the intake mouth, the penstock entrance starts from the
wall of intake box near the structure. The economic diameter of the penstock is calculated as
0.54m. The penstock can carry a maximum flow of 0.404 cumec with a velocity of 1.76 metre
per second. The possible alignment for the penstock is located on the right bank of the stream.
The longitudinal section of the proposed penstock line was drawn from contour map and
calculated the length, which comes to 141m (Fig. No. 6.8).
A surface power house is proposed on the right bank of the stream. The slope at the proposed
site is moderate. The power house proposed at this site is 10m x 5.5m, to accommodate 100
kW generator and standardised turbine.

WGSHP - Final Report (Vol. II) Nellikkappara
Integrated Rural Technology Centre , Palakkad .10
6.6 ELECTRICAL AND MECHANICAL EQUIPMENTS
The power house proposed in the scheme will have an installed capacity of 100 kW. The electricity
generated would be supplied to the near by houses by a separate distribution system A standardised
turbine for 33m gross head is proposed for this particular site. The turbine shall be complete with
governor, control equipment and safety devices. The generator would be synchronous with a
brushless excitation system shall be rated to generate a 11kV, three phases, 50Hz shall be suitable for
coupling with turbine described above. The generator shall have voltage regulation equipment, parallel
operation equipment etc.
6.7 ENVIRONMENTAL IMPACTS
A small hydro project has been proposed at Nellikkappara (Pathanamthitta Dist.) The project aims to
generates about 100kW of hydro power from a fall having a head of 33m. Some preliminary
environmental impact analysis have been carried out. They are land, water and socio-economical
environmental impacts.
6.7.1 Environmental Impact on Land
Total area of catchment is about 0.5 square kilometres of land at Kokkathodu. The stream flows
through steep slopes. After the fall, the stream joins to the Achankovil Aar near to Konni.
The site is situated out side of forest. Both the banks of the stream are private land. One side is
rubber plantation and other is habitation. The land is having medium slopes in this area. There is no
possibility of land slide and the chances of soil erosion are also negligible. The stream bed is rocky
and boulders are available near to site. The number of rainy days exceeds more than 50 % of the time.
The most significant thing is that, due to impoundment, no forest land will be submerged. The
construction of weir, penstock, power house, tailrace and temporary road will not take away any
forest land.
6.7.2 Environmental Impact on Water
The Kokkathodu which joins Achankovil Aar is the stream of this fall. It is a 3rd order, structurally
controlled stream. The diversion structure will create a pond of area 0.056 hectare. No forest land
will be submerged. Above all, this accounts for only 0.56 ha/MW. This diversion structure which also

WGSHP - Final Report (Vol. II) Nellikkappara
Integrated Rural Technology Centre , Palakkad .11
acts as a check dam can increase the height of water table level at the site. The impounded water will
also change soil moisture regime in adjacent forest land.
6.7.3 Socio-economic Impact
The construction phase would create employment opportunities for a period of twelve months. It
requires only minimum land acquisition for construction. The acquisition does not need any
rehabilitation.
6.8 CONCLUSION
The environmental impact of small hydel project is negligible. No serious adverse effect is anticipated.
Moreover, deforestation owing to the inundation will be a merge area.
The economic size of installed capacity depends upon the permissible tariff as well as the capital cost.
It was found that the project is financially viable for an installed capacity of 100kW at a project cost
of Rs. 3.5 Crores per MW and a tariff rate of Rs.2.5 per unit of electricity. Alternatively, if the tariff is
raised to Rs.3.00 per unit, an installed capacity of 125kW would become economically viable.
Cost effective methods of construction, like the use of gabion weirs, can be used to reduce the capital
costs. A methodology for implementing the project with a maximum of peoples= participation should
also be devised. The role of the Grama Panchayat in this effort is crucial.
-��-

WGSHP - Final Report (Vol. II) Nellikkappara
Integrated Rural Technology Centre , Palakkad .12
7. UPPUTHODU KUTHU
District : Idukki
Panchayath : Mariyapuram
Head : 33 m.
Flow : Perennial
Suggested Capacity : 750 kW/ 1 MW

WGSHP - Final Report (Vol. II) Upputhodu kuthu
Integrated Rural Technology Centre , Palakkad .1
7.1 GENERAL
7.1.1 The Site
Upputhodukuthu water fall is situated in the IInd ward of Mariyapuram Grama Panchayath in
Idukki district. The site is at a distance of nearly 6km. from Karimban which is one of the main
junction in Kothamangalam-Kumali route. There is bus route from Karimban to Murikkassery.
To reach the site we have to get down at Chali city in this route. From there we have to travel
nearly 1km distance to reach the site through a motorable unmetalled road going to
Koomankandam. The nearest 11KV transformer is just 100 m. away from the site.
The water fall is located at 770 0' 10" E longitude and 90 53' 0" N latitude. The catchment area
measured from topo sheet is 15 sq. km. The falls are situated at an elevation of 560m from MSL
in Upputhodu stream which begins at an elevation of 900m from MSL. It is flowing almost
straight through the fern shaped catchment area. After the fall, the stream joins to the
Ponnazhikuthu which then drains into Periyar river. The location map of the site is shown in
Fig.No.7.1.
7.1.2 Topography
The site is situated out side the forest. Both banks of this stream is rubber plantation. The land
is having moderate slopes in this area. There is no possibility of land slide in this area and
possibility of soil erosion is negligible. The site gets heavy rainfall more than half of the year. The
sides of the stream is mainly of loose earth.
7.2 FIELD INVESTIGATION
7.2.1 Reconnaissance Survey
A topographical survey was conducted for obtaining topographical details of the site. There is
one main fall which gives a total head of 33m. The possible location for diversion structure and
power house were identified and the details were taken using tacheometric method of surveying.
7.2.2 Catchment Area
Topographical survey sheets to a scale of 1:50,000 are available from the Survey of India. The
catchment of Upputhodukuthu was located using the toposheet. It is shown in the Fig.No. 7.2

WGSHP - Final Report (Vol. II) Upputhodu kuthu
Integrated Rural Technology Centre , Palakkad .2
and measured the area which comes nearly 15 sq.km. The catchment area having almost
moderate slopes but some portions are very steep.
7.2.3 Contour Map
The survey details were plotted on a sheet of paper at a scale of 1:200. The undulations of the
site, the location of the falls and other topographical features were identified from the contour
map. The location of the weir, the alignment of the penstock and location of the power house
were also determined using this and the prepared contour map has been shown in Annexure
A.7.
7.2.4 River Flow Data
For a period of 12 months (April 1998 to April 1999) the water level observations were taken
every week. A suitable location was identified on the upstream side of the fall, where the whole
water is flowing through that point, cross sectional details of the point were noted for calculating
the stream discharge . We fixed a measuring gauge at that point to measure the peak flow. Using
the collected data (Table 7.1) the weekly discharge hydrograph of the site was prepared. The
graph is shown in Fig. No. 7.3.
7.2.5 Flow Duration Curve
Using weekly discharge hydro graph, percentage flow of exceedence was calculated. From this,
the flow duration curve was plotted (Fig. No. 7.4). The same curve also functions as percentage
flow of exceedence graph. This river flow data is recalculated in tabular form, giving the
corresponding energy potential in weekly and cumulative mode is given in Table 7.2. These data
are used for calculating energy potential and selection of unit sizes in section 7.4.
7.2.6 Peak Flow Determination
There are various empirical methods for calculating the maximum flood discharge. The different
values obtained are shown in Table 7.3. The value obtained by Dicken=s formula, which is
commonly used in western ghats region has been used for the structural design.

WGSHP - Final Report (Vol. II) Upputhodu kuthu
Integrated Rural Technology Centre , Palakkad .3
Table 7.3
Peak Flow Determination
Parameters
Dicken=s method
Ingli=s formula
Ryve=s formula
Nawab Jung
Bahadur formula
Peak flow in cumecs
198.17
366.08
61.43
533.78
7.3 SALIENT DESIGN FEATURES
A detailed design of Civil, Electrical and Mechanical work has not been carried out in this report
as it does not come under the purview of the project. But a typical section of the proposed
diversion structure is given here. The stability analysis of the section and economic diameter of
the penstock was carried out as part of preliminary design. The capability and number of units,
type and specification of turbine, generator and its cost have been estimated after consulting
various agencies.
7.3.1 Power Potential of the Project
From the flow duration curve the discharge corresponding to 90% exceedence is only 0.02 cubic
metre per second. A discharge of 0.02 cubic metre per second can produce only about 5kW. In
order to tap the full potential of the site, with a head of 33 metre, the project is designed to
generate higher output with lower dependability. This site can be designed as a run of the river
project which can produce 450 kW with a dependability of 40%.This is done because by 60%
time, the power drastically reduces to 15kW.
The output power was computed using the formula, P = 10 x Q x H x ηη
Where; P = Power output in kW
Q = Discharge in cumec
H = Head in metres
η = Overall efficiency (Here it is assumed as 0.75)
For 50% exceedence P = 10 x 1 x 33 x 0.75 = 250 kW.

WGSHP - Final Report (Vol. II) Upputhodu kuthu
Integrated Rural Technology Centre , Palakkad .4
For 40% exceedence P = 10 x 1.82 x 33 x 0.75 = 450 kW.
For 30% exceedence P = 10 x 2.16 x 33 x 0.75 = 535 kW.
7.3.2 Energy Potential
At this site, sufficient flow is there so that we can obtain 500kW power output for 30% time (110
days) which drastically reduces to 20 kW by 60% time. The energy input corresponding to 30%
time will be (30/100 x 500 x 365 x 24) = 1.314 MU. The flow after 30% time can be utilized
by providing a small pondage. The quantity of water available from 30% to 100% time is
calculated to be 11998022 m3. Energy obtained from this water is calculated to be 0.825 MU.
Total amount of energy produced = 1.314 MU + 0.825 MU = 2.139 MU.
It may be noted that, this much amount of energy can be generated for the particular year. If
higher flows are available during any year, it will enable higher production and vice versa.
7.3.3 Pondage Requirement
From the contour map a plot of surface area Vs. elevation is drawn in Fig.No.7.5. The areas
corresponding to each elevation is used to find the volume of water that can be stored in each
elevation and the details are shown in Table 7.4. From this information capacity elevation curve
of the pondage is prepared and is shown in Fig.No. 7.6.
Table 7.4
Pondage Area Details Sl. No.
Elevation(m)
Area (m2)
Capacity (m3)
Energy (kWh)
1
497.50
0
0
0
2
498
28.00
7.00
0.48
3
499
203.00
122.50
8
4
500
390.00
419.10
29
5
501
662.00
945.00
65
6
502
796.00
1674.00
115
As the terrain is suitable for storing 1674m3, it follows that, at full storage, the energy capacity is

WGSHP - Final Report (Vol. II) Upputhodu kuthu
Integrated Rural Technology Centre , Palakkad .5
only about 115kWh. If a single 100 kW machine is installed, it can be operated for only one hour
at full capacity (during peak time). Fortunately, pondage becomes critical only during lean
months, this kid of operation practice is acceptable. Hence, a weir height of 4.5 m, to create a
storage of 1674m3 is suggested.
As the terrain is not suitable for storage the structure proposed at this site is only for diverting
water.
7.4 SELECTION OF PLANT CAPACITY UNIT SIZES
For optimization of plant capacity, the following parameters were assumed.
Rate of return on investment - 15%
Loan repayment period - 10 years
Average O/M cost - 2.5% of capital cost
Resulting standard annual cost - 25%
(This consists of 2.5% O & M costs, 15% return on 25% equity, 15% interest on 75% loan and
repayment of loan in 10 annual instalments)
Tariff (per Unit) - Rs. 2.5 and 3.0 (Two cases)
Investment cost (Rs. in Crores per MW) - Rs. 3.5 (Two cases)
Since manufacturers were not in a position to quote exact figures, no attempt was made to fine
tune the cost in relation to site specific conditions. Only ranges could be indicated. Each
combination of tariff and capital cost selected above, will demand a minimum annual generation
per kW installed. This can be taken to be the break even Plant Capacity Factor (PCF) for the
site under the specified conditions.
Lower the cost/MW and higher the price for energy, the larger will be the economically
viable installed capacity and the quantity of energy that can be economically extracted
from a given site.

WGSHP - Final Report (Vol. II) Upputhodu kuthu
Integrated Rural Technology Centre , Palakkad .6
Let the capital cost of Upputhodukuthu be Rs.3.5 crores/MW. The annual rate is 25%. Let the
unit rate of tariff offered by K.S.E.B be Rs. 2.5/kWh.
If X be the number of hours of operation at full load capacity,
per Mega Watt annual cost, at the rate of 25% on investment = Rs. 3.5 Crores x 0.25
per Mega Watt revenue = 1000 kW x Rs. 2.5 x X
Equating the two, we get 3,50,00,000 x 0.2.5 = X x 1000 x 2.5
X = 3,500 hrs.
This means that, any combination of machines, that can work at full capacity for over 3500 hours
can deliver a profit, if the overall project cost is below Rs. 3.5 crores/MW and tariff is Rs. 2.5
per kilo Watt hour.
This can be explained better in terms of Plant Capacity Factor , which is defined as the ratio of
actual amount of energy obtained to the maximum energy that can be obtained from the given
installed capacity during the same year, to the actual amount of energy obtained.
In this case, for the value of X = 3500 hours, PCF = (3500 / 8760) x 100 = 40%
That is, a maximum capacity, which yields a PCF of 40% is economically viable for this site.
Similarly, break even PCF for Rs.3.0 per unit and Rs. 3.5 Crores per Mega Watt where
X=2916 hours is 33.3%.
Now we shall check various capacities of turbine size which are suitable for this two conditions.
a. Tariff: Rs.2.50/kWh and break even PCF of 40%
For an installed capacity of 750 kW, which corresponds to about 15% flow of exceedence from
the chart, the total energy yield is the sum of: 750 kW x (0.15 x 8760) = 0.986 at continuous
operation for 15% time of an year, and 1.67MU, which is the cumulative energy potential from
15% to 100% time as obtained from the Chart (Table7.3).

WGSHP - Final Report (Vol. II) Upputhodu kuthu
Integrated Rural Technology Centre , Palakkad .7
Total yield = 0.986MU + 1.67 MU = 2.67 MU.
The plant capacity factor, corresponding to this yield is given by :
PCF = 2.67 x 10⁸ / (550 x 8760) = 40.6 %
This PCF is equal to the break even value of 40%.
So 750 kW will be the optimum choice for the site, if the overall project cost is below
Rs.3.5 crores/MW and tariff is Rs. 2.5 per kilo Watt hour.
b. Tariff: Rs.3.00/kWh and break even PCF of 33.3%
Similarly, For 1000 kW (for 5% flow of exceedence)
PCF = (2860000 / 1000 x 8760) x 100 = 32.6%
This PCF is very near to the break even value of 33%.
Similarly, 1000 kW will be the optimum choice for the site, if the overall project cost is
below Rs. 3.5 crores/MW and tariff is Rs. 3.0 per kilo Watt hour.
Table 7.5
Economically Viable Maximum Capacity at Different Costs and Tariff
Tariff
Units size for Rs.3.5 Crores/MW
Rs.2.5/Unit
750 kW
Rs.3.00/ Unit
1000 kW
The units selected can be one of the following combinations:
For Rs.3.5 Crores/MW and Rs.2.5/Unit we can opt (0.5MW x 1 + 0.25MW x 1)
For Rs.3.5 Crores/MW and Rs.3.0/Unit we can opt (0.5MWx2) or (0.5MWx1+0.25 x 2).

WGSHP - Final Report (Vol. II) Upputhodu kuthu
Integrated Rural Technology Centre , Palakkad .8
Among these two categories, the second one seems to be less viable since it is bulky with units.
We have restricted ourselves to the more realistic combination of Rs. 3.5 Crores/MW of
investment cost and two tariff choices of Rs. 2.5/Unit and Rs. 3.0/Unit.
7.5 CIVIL ENGINEERING WORKS
The important Civil Engineering Works required for the project are a diversion weir, intake
structure, penstock and a power house. A weir is constructed to have a small storage and to
divert the water from stream to the intake. For this project only a diversion weir is proposed,
which allows the excess water to flow over the weir to the downstream. The intake structure
takes water from the weir and leads it to the penstock. The penstock made of steel is proposed
in this site. A power house is constructed for the purpose of housing the electro mechanical
equipment. It is usually a small building of 7m x 5m.
7.5.1 Weir at Upputhodukuthu
A concrete weir has been proposed on the Upputhodu stream, at a bed level of +497.75metres.
The base width of the weir at bed level is 6.2 m. The diversion structure is 2.00m high having a
length of 15.50m at the top with a central board crested free over fall type spill way. The cross
sectional details of the proposed diversion site and typical section of the diversion structures are
shown in Fig.No.7.7.
7.5.2 Intake Structure, Penstock and Power House
A simple box type, direct intake structure of reinforced cement concrete is provided on the
stream bed. A trash rack is provided on the intake mouth, the penstock entrance starts from the
wall of intake box near the structure. The economic diameter of the penstock is calculated as
1.3m. The penstock can carry a maximum flow of 3.03 cumec with a velocity of 2.28 metre per
second. The possible alignment for the penstock is located on the right bank of the stream. The
longitudinal section of the proposed penstock line was drawn from contour map and calculated
the length, which comes to 147m (Fig.No.7.8).

WGSHP - Final Report (Vol. II) Upputhodu kuthu
Integrated Rural Technology Centre , Palakkad .9
A surface power house is proposed on the right bank of the stream. The slope at the proposed site is
moderate. The power house is of size 7m x 5m, to accommodate 750 kW generator and
standardised turbine.
7.6 ELECTRICAL AND MECHANICAL EQUIPMENTS
The power house proposed in the scheme will have an installed capacity of 750 kW. The electricity
generated would be connected to the existing power grid system at Chalicity by a 1km transmission
line. A standardised turbine for 33m gross head is proposed for this particular site. The turbine shall
be complete with governor, control equipment and safety devices. The generator would be
synchronous with a brushless excitation system shall be rated to generate 750kW,11kV three phases,
50Hz and shall be suitable for coupling with turbine described above. The generator shall have voltage
regulation equipment, parallel operation equipment etc.
7.7 ENVIRONMENTAL IMPACTS
A small hydro project has been proposed at Upputhodukuthu (Idukki Dist). The project aims to
generates about 750 kW of hydro power from a fall having a head of 33m. Some preliminary
environmental impact analysis have been carried out. They are land, water and socio-economical
environmental impacts.
7.7.1 Environmental Impact on Land
Total area of catchment is about 15 square kilometres of land at Upputhodu. After the fall, the stream
joins to the Ponnazhikuthu then drains into Periyar river. The site is situated out of forest. Both banks
of this stream is rubber plantation. The land is having moderate slope in this area. There is no
possibility of land slide in this area and chances of soil erosion is also negligible. The site gets heavy
rainfall more than half of the year. The sides of the stream is mainly of loose soil. The most significant
thing is that, due to impoundment, no forest land will be submerged. The construction of weir,
penstock, power house, tailrace and temporary road will not take away any forest land.
7.7.2 Environmental Impact on Water
The Upputhodu kuthu which finally drains to Periyar river is the stream of this fall. The diversion
structure will create a pond of area 0.0796 hectare. No forest land will be submerged. Above all, this
WGSHP - Final Report (Vol. II) Upputhodu kuthu
Integrated Rural Technology Centre , Palakkad .10
accounts for only 0.105 ha/MW. This diversion structure which also acts as a check dam can
increase the height of water table level at the site. The impounded water will also change soil moisture
regime in adjacent forest land.
7.7.3 Socio-economic Impact
The construction phase would create employment opportunities for a period of eighteen months. It
require only minimum land acquisition for construction. The acquisition does not need any
rehabilitation.
7.8 CONCLUSION
The environmental impact of small hydel project is negligible. No serious adverse impacts anticipated.
Moreover, deforestation owing to the inundation will be a meagre area.
The economic size of installed capacity depends upon the permissible tariff as well as the capital cost.
It was found that the project is financially viable for an installed capacity of 750kW at a project cost
of Rs. 3.5 Crores per MW and a tariff rate of Rs.2.5 per unit of electricity. Alternatively, if the tariff is
raised to Rs.3.00 per unit, an installed capacity of 1000kW would become economically viable.
Cost effective methods of construction, like the use of gabion weirs, can be used to reduce the capital
costs. A methodology for implementing the project with a maximum of peoples= participation should
also be devised. The role of the Grama Panchayat in this effort is crucial.
-��-

WGSHP - Final Report (Vol. II) Upputhodu kuthu
Integrated Rural Technology Centre , Palakkad .11
8. URUMPALLU
District : Idukki
Panchayath : Arakkulam
Head : 33 m.
Flow : Seasonal
Suggested Capacity : 450 kW/ 750 kW

WGSHP - Final Report (Vol. II) Urumpallu
Integrated Rural Technology Centre, Palakkad 8.1
8.1 GENERAL
8.1.1 The Site
Urumpallu water fall is situated in the IXth ward of Aarakkulam Grama Panchayath in Idukki
district. To reach this site we have to travel 18km from Moolamattom to Kulamavu. Two
kilometres away from Kulamavu there is a boat station. This route is a motorable, unmetalled
road. After 20 minutes journey from Nellikkappara boat station we will reach Peraanikkadavu.
From Peraanikkadavu there exists a three kilometre long forest footpath which leads to the site.
Also there is another route to reach the site. That is from Moolamattom to Urumpallu which is a
lengthy jeepable route.
The water fall is located at 760 56' 17" E longitude and 90 46' 27" N latitude. The catchment area
measured from topo sheet is 0.75 sq. km. The falls are situated at an elevation of 760m from
MSL, in Urumpallu stream which begins at an elevation of 1100m from MSL. After the fall the
stream drains to Idukki reservoir. The location map of the site is shown in Fig.No. 8.1
8.1.2 Topography
The left bank of the stream is owned by private person and the right bank is forest. The land is
having steep slopes in this area. There is no possibilities of land slide at this site but the chances of
soil erosion exists. The site is perennial and number of rainy days exceeds 50% in its catchment.
8.2 FIELD INVESTIGATION
8.2.1 Reconnaissance Survey
A topographical survey was conducted for obtaining topographical details of the site. There are
two falls which gives a total head of 33m. The possible location for diversion structure and
power house were identified and the details were taken using tacheometric method of surveying.
8.2.2 Catchment Area
Topographical survey sheets to a scale of 1:50,000 are available from the Survey of India. The
catchment of Urumpallu site was located using the toposheet. It is shown in Fig.No.8.2. The
total area of catchment is measured and it comes to nearly 0.75 sq.km. The catchment area is

WGSHP - Final Report (Vol. II) Urumpallu
Integrated Rural Technology Centre, Palakkad 8.2
having almost moderate slope but some portions are very steep.
8.2.3 Contour Map
The survey details were plotted on a sheet of paper at a scale of 1:200. The undulations of the
site, the location of the falls and other topographical features were identified from the contour
map. The location of the weir, the alignment of the penstock and location of the power house
were also determined using this and the prepared contour map has been shown in Annexure A.
8.
8.2.4 River Flow Data
For a period of 12 months (January 1998 to January 1999) the water level observations were
taken every week. A suitable location was identified on the upstream of the fall, where the whole
water is flowing through that point, cross sectional details of the point were noted for calculating
the stream discharge. We fixed a measuring gauge at this point to measure the peak flow. Using
the collected data (Table 8.1) the weekly discharge hydrograph of the site is prepared. The
graph is shown in Fig. No. 8.3.
8.2.5 Flow Duration Curve
Using weekly discharge hydro graph, percentage flow of exceedence was calculated. From this,
the flow duration curve was plotted (Fig. No. 8.4). The same curve also functions as percentage
flow of exceedence graph. This river flow data is recalculated in tabular form, giving the
corresponding energy potential in weekly and cumulative mode is given in Table 8.2. These data
are used for calculating energy potential and selection of unit sizes in section 8.4.
8.2.6 Peak Flow Determination
There are various empirical methods for calculating the maximum flood discharge. The different
values obtained are shown in Table 8.3 The value obtained by Dicken=s formula, which is
commonly used in western ghats region has been used for the structural design of diversion
structure.
Table 8.3
Peak Flow Determination
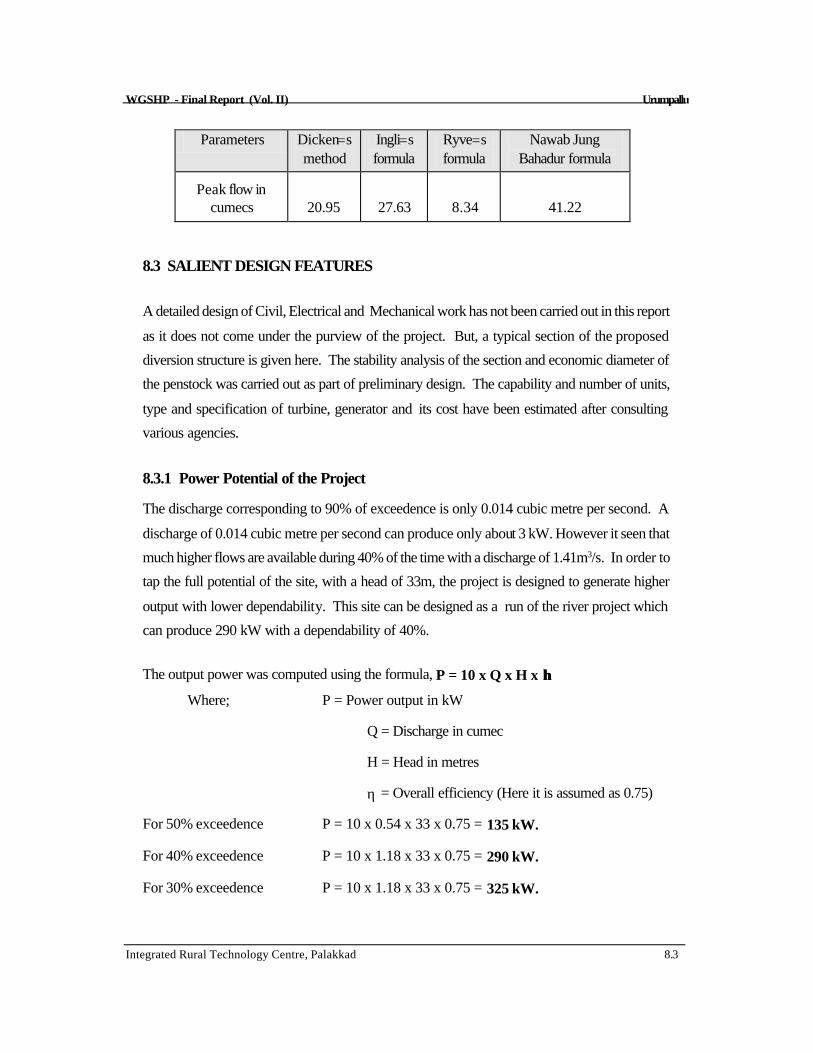
WGSHP - Final Report (Vol. II) Urumpallu
Integrated Rural Technology Centre, Palakkad 8.3
Parameters Dicken=s method
Ingli=s formula
Ryve=s formula
Nawab Jung Bahadur formula
Peak flow in
cumecs
20.95
27.63
8.34
41.22
8.3 SALIENT DESIGN FEATURES
A detailed design of Civil, Electrical and Mechanical work has not been carried out in this report
as it does not come under the purview of the project. But, a typical section of the proposed
diversion structure is given here. The stability analysis of the section and economic diameter of
the penstock was carried out as part of preliminary design. The capability and number of units,
type and specification of turbine, generator and its cost have been estimated after consulting
various agencies.
8.3.1 Power Potential of the Project
The discharge corresponding to 90% of exceedence is only 0.014 cubic metre per second. A
discharge of 0.014 cubic metre per second can produce only about 3 kW. However it seen that
much higher flows are available during 40% of the time with a discharge of 1.41m3/s. In order to
tap the full potential of the site, with a head of 33m, the project is designed to generate higher
output with lower dependability. This site can be designed as a run of the river project which
can produce 290 kW with a dependability of 40%.
The output power was computed using the formula, P = 10 x Q x H x ηη
Where; P = Power output in kW
Q = Discharge in cumec
H = Head in metres
η = Overall efficiency (Here it is assumed as 0.75)
For 50% exceedence P = 10 x 0.54 x 33 x 0.75 = 135 kW.
For 40% exceedence P = 10 x 1.18 x 33 x 0.75 = 290 kW.
For 30% exceedence P = 10 x 1.18 x 33 x 0.75 = 325 kW.

WGSHP - Final Report (Vol. II) Urumpallu
Integrated Rural Technology Centre, Palakkad 8.5
8.3.2 Energy Potential
At this site, sufficient flow is there so that we can obtain 350kW power output for 25% of the
time (92days). The output reduces to 30kW if we take the percentage flow of exceedence as
60% (219 days). The energy input corresponding to 25% time will be (25/100 * 350 * 365 *
24) = 0.767 MU. The flow after 25% time can be utilized by providing a small pondage. The
quantity of water available from 25% to 100% time is calculated to be 10265270 m3. Energy
obtained from this water is 0.71 MU.
Total amount of energy produced = 0.767 MU + 0.71 MU = 1.48 MU.
It may be noted that, this much amount of energy can be generated for the particular year. If
higher flows are available during any year, it will enable higher production and vice versa.
8.3.3 Pondage Requirement
From the contour map a plot of surface area Vs. elevation is drawn in Fig . No. 8.5. The areas
corresponding to each elevation is used to find the volume of water that can be stored in each
elevation and the details is shown in Table 8.4. From this information capacity elevation curve of
the pondage is prepared and is shown in Fig.No.8.6.
Table 8.4 Pondage area details
Sl. No.
Elevation (m)
Area (m2)
Capacity (m3)
Energy (kWh)
1
132.5
0
0
0
2
133
38.52
9.63
0.66
3
134
150.20
103.99
7
4
135
410.60
384.39
26
5
136
580.00
879.99
61
6
137
728.72
1534.35
105
As the terrain is suitable for storing 1500m3, it follows that, at full storage, the energy capacity is
only about 105kWh. If a single 100 kW machine is installed, it can be operated for only one hour
at full capacity (during peak time). Fortunately, pondage becomes critical only during lean
months, this kid of operation practice is acceptable. Hence, a weir height of 4.5 m, to create a
storage of 1500m3 is suggested.

WGSHP - Final Report (Vol. II) Urumpallu
Integrated Rural Technology Centre, Palakkad 8.6
As the terrain is not suitable for storage the structure proposed at this site is only for diverting
water.
8.4 SELECTION OF PLANT CAPACITY AND UNIT SIZES
For optimization of plant capacity, the following parameters were assumed.
Rate of return on investment - 15%
Loan Repayment period - 10 years
Average O/M cost - 2.5% of capital cost
Resulting standard annual cost - 25%
(This consists of 2.5% O & M costs, 15% return on 25% equity, 15% interest on 75% loan and
repayment of loan in 10 annual instalments)
Tariff (per Unit) - Rs. 2.5 and 3.0 (Two cases)
Investment cost (Rs.in Crores per MW) - Rs. 3.5 (Two cases)
Since manufacturers were not in a position to quote exact figures, no attempt was made to fine
tune the cost in relation to site specific conditions. Only ranges could be indicated. Each
combination of tariff and capital cost selected above, will demand a minimum annual generation
per kW installed. This can be taken to be the break even Plant Capacity Factor (PCF) for the
site under the specified conditions.
Lower the cost/MW and higher the price for energy, the larger will be the economically
viable installed capacity and the quantity of energy that can be economically extracted
from a given site.
Let the capital cost of Urumpallu be Rs.3.5 crores/MW. The annual rate is 25%. Let the unit
rate of tariff offered by K.S.E.B be Rs. 2.5/kWh.
If X be the number of hours of operation at full load capacity,
per Mega Watt annual cost, at the rate of 25% on investment = Rs. 3.5 Crores x 0.25

WGSHP - Final Report (Vol. II) Urumpallu
Integrated Rural Technology Centre, Palakkad 8.7
per Mega Watt revenue = 1000 kW x Rs. 2.5 x X
Equating the two, we get 3,50,00,000 x 0.2.5 = X x 1000 x 2.5
X = 3,500 hrs.
This means that, any combination of machines, that can work at full capacity for over 3500 hours
can deliver a profit, if the overall project cost is below Rs. 3.5 crores/MW and tariff is Rs. 2.5
per kilo Watt hour.
This can be explained better in terms of Plant Capacity Factor, which is defined as the ratio of
actual amount of energy obtained to the maximum energy that can be obtained from the given
installed capacity during the same year, to the actual amount of energy obtained.
In this case, for the value of X = 3500 hours, PCF = (3500 / 8760) x 100 = 40%
That is, a maximum capacity, which yields a PCF of 40% is economically viable for this site.
Similarly, break even PCF for Rs.3.0 per unit and Rs. 3.5 Crores per Mega Watt where
X=2916 hours is 33.3%
Now we shall check various capacities of turbine size which are suitable for this two conditions.
a. Tariff: Rs.2.50/kWh and break even PCF of 40%
For an installed capacity of 450 kW, which corresponds to about 23% flow of exceedence from
the chart, the total energy yield is the sum of:
450 kW x (0.23 x 8760) = 0.91MU at continuous operation for 23% time of an year, and
0.77MU, which is the cumulative energy potential from 23% to 100% time as obtained from the
Chart (Table 8.3).
Total yield = 1.53MU + 0.77MU = 1.68 MU.
The Plant Capacity Factor, corresponding to this yield is given by :

WGSHP - Final Report (Vol. II) Urumpallu
Integrated Rural Technology Centre, Palakkad 8.8
PCF = 1.68 x 10⁸ / (550 x 8760) = 42.6 %
This PCF is equal to the break even value of 40%.
So 450 kW will be the optimum choice for the site, if the overall project cost is below
Rs.3.5 crores/MW and tariff is Rs. 2.5 per kilo Watt hour.
b. Tariff: Rs.3.00/kWh and break even PCF of 33.3%
Similarly, For 750 kW (for 16% flow of exceedence)
PCF = (2150000 / 750 x 8760) x 100 = 32.7%
This PCF is very near to the break even value of 33%.
Similarly, 750 kW will be the optimum choice for the site, if the overall project cost is
below Rs. 3.5 crores/MW and tariff is Rs. 3.0 per kilo Watt hour.
Table 8.5
Economically Viable Maximum Capacity at Different Costs and Tariff
Tariff
Unit size for Rs.3.5 Crores/MW
Rs.2.5/Unit
450 kW
Rs.3.00/ Unit
750 kW
The units selected can be one of the following combinations:
For Rs.3.5 Crores/MW and Rs.2.5/Unit we can opt ( 0.25 MW x 2)
For Rs.3.5 Crores/MW and Rs.3.0/Unit we can opt ( 0.50 MW x 1 + 0.25 x 1)
Among these two categories, the second one seems to be less viable since it is bulky with units.
We have restricted ourselves to the more realistic combination of Rs. 3.5 Crores/MW of
investment cost and two tariff choices of Rs.2.5/Unit and Rs.3.0/Unit.
8.5 CIVIL ENGINEERING WORKS

WGSHP - Final Report (Vol. II) Urumpallu
Integrated Rural Technology Centre, Palakkad 8.9
The important Civil Engineering Works required for the project are a diversion weir, an intake
structure, a penstock and a power house. A weir is constructed to have a small storage and to
divert the water from stream to the intake. For this project only a diversion weir is proposed,
which allows the excess water to flow over the weir to the downstream. The intake structure
takes water from the weir and leads it to the penstock. The penstock made of steel is proposed
in this site. A power house is constructed for the purpose of housing the electro mechanical
equipment.
8.5.1 Weir at Urumpallu
A gabion weir has been proposed on the Urumpallu stream, at a bed level of +132.5 metres.
The base width of the weir at bed level is 5m. The gabion structure is 4.10m high having a length
of 14.50m at the top with a central board crested free over fall type spill way. The cross
sectional details of the proposed diversion site and typical section of diversion structure are
shown in Fig.No. 8.7..
8.5.2 Intake Structure, Penstock and Power House
A simple box type, direct intake structure of reinforced cement concrete is provided on the
stream bed. A trash rack is provided at the intake mouth, the penstock entrance starts from the
wall of intake box near the gabion. The economic diameter of the penstock is calculated as
1.03m . The penstock can carry a maximum flow of 1.818 cumec with a velocity of 2.20 metre
per second. The possible alignment for the penstock is located on the right bank of the stream.
The longitudinal section of the proposed penstock line was drawn from the contour map and was
calculated the length, which came to be 110m (Fig.No.8.8).
A surface power house is proposed on the right bank of the stream. The slope at the proposed
site is moderate but increases up the hill towards south. The power house is of size 10m x 6.5m
to accommodate 450 kW generator and standardised turbine.
8.6 ELECTRICAL AND MECHANICAL EQUIPMENTS
The power house proposed in the scheme will have an installed capacity of 450 kW. The system
is designed as stand alone system and the energy generated would be given to the near by houses
by a separate transmission line. A standardised turbine for 33m gross head is proposed for this
particular site. The turbine shall be complete with governor, control equipment and safety
WGSHP - Final Report (Vol. II) Urumpallu
Integrated Rural Technology Centre, Palakkad 8.10
devices. The generator would be synchronous with a brushless excitation system shall be rated to
generate 450kW, 11kV three phases, 50Hz and shall be suitable for coupling with turbine
described above. The generator shall have voltage regulation equipment, parallel operation
equipment etc.
8.7 Environmental Impacts
A small hydro project has been proposed at Urumpallu (Idukki Dist.) The project aims to
generates about 450 kW of hydro power from a fall having a head of 33m. Some preliminary
environmental impact analysis have been carried out. They are land, water and socio-
economical environmental impacts.
8.7.1. Environmental Impact on Land
The catchment area measured from topo sheet comes to be 0.75 sq. km. After the fall the
Urumpallu stream drains to Idukki reservoir. The land is having steep slopes in this area. There is
no possibilities of land slide but chances of soil erosion exists a little. The sides of the stream has
loose earth. The site is perennial and number of rainy days exceeds 50% in its catchment. The
most significant thing is that, due to impoundment, no forest land will be submerged. The
construction of weir, penstock, power house, tailrace and temporary road will not take away any
forest land. So no forest clearance is required for this project.
8.7.2 Environmental Impact on Water
The Urumpallu stream, which drains to Idukki reservoir is the stream of this fall. The diversion
structure will create a pond of area 0.073 hectare. No forest land will be submerged. Above all,
this accounts for only 0.162 ha/MW. This diversion structure which also acts as a check dam
can increase the height of water table level at the site. The impounded water will also change soil
moisture regime in adjacent forest land.

WGSHP - Final Report (Vol. II) Urumpallu
Integrated Rural Technology Centre, Palakkad 8.11
8.7.3 Socio-economic impact
The construction phase would create employment opportunities for a period of one year. It require
only minimum land acquisition for construction. The acquisition does not need any rehabilitation.
8.8 CONCLUSION
The environmental impact of small hydel project is negligible. No serious adverse impact is
anticipated. Moreover, deforestation owing to the inundation will be a merge area.
The economic size of installed capacity depends upon the permissible tariff as well as the capital cost.
It was found that the project is financially viable for an installed capacity of 450kW at a project cost
of Rs. 3.5 Crores per MW and a tariff rate of Rs.2.5 per unit of electricity. Alternatively, if the tariff is
raised to Rs.3.00 per unit, an installed capacity of 750kW would become economically viable.
Cost effective methods of construction, like the use of gabion weirs, can be used to reduce the capital
costs. A methodology for implementing the project with a maximum of peoples= participation should
also be devised. The role of the Grama Panchayat in this effort is crucial.
-��-

WGSHP - Final Report (Vol. II) Urumpallu
Integrated Rural Technology Centre, Palakkad 8.12
9. MADATHARUVI
District : Pathanamthitta
Panchayath : Ranni
Head : 50 m.
Flow : Seasonal
Suggested Capacity : 75 kW/ 150 kW
WGSHP - Final Report (Vol. II) Madatharuvi
Integrated Rural Technology Centre, Palakkad 9.1
9.1 GENERAL
9.1.1 The site
Madatharuvi water fall is situated in 9th ward of Ranni Grama Panchayath in Pathanamthitta
District. The site is a distance of 7 km from Ranni. There is a bus route from Ranni to
Mandamaruthy. From Mandamaruthy, there is no bus service to the site. There is a road leading
to a private rubber plantation through the upstream side of the fall. There is another way to
reach the down stream side of the site. From Ranni to Chellakkad, bus services are available.
From there jeep services are available to Madatharuvi. The stream is seasonal and the head
comes near to 50m. The nearest 11kV transformer is about 0.5km from the site.
The water fall is located at 760 48' 53" E longitude and 90 25' 30" N latitude. The catchment area
measured from topo sheet is 4.31sq. km. The falls are situated at an elevation of 80m from MSL
in Madatharuvi stream which is begins at an elevation of 287 m. from MSL. The stream falls
through moderate slope on the upstream side and gentle after the fall. The site contains two small
falls and one moderate. After the fall, the stream joins the Pampa river. The upstream of the fall
is rubber plantation.(Fig. 9.1).
9.1.2 Topography
The site is situated in private land. One side is owned by Rubber Board and other side by private
persons. The land is having moderate slope in this area. There is no land slide occurred in this
area on past time and the possibility also very less. The chances of soil erosion are negligible.
The bed of the stream is rocky and the boulders are available in plenty at the site. The number of
rainy days exceeds 50% in its catchment.
9.2 FIELD INVESTIGATION
9.2.1 Reconnaissance survey
A topographical survey was conducted for obtaining topographical details of the site. The
possible location for diversion structure and power house were identified and the details were
taken using tacheometric method of surveying. There is 3 main falls which gives a total head of

WGSHP - Final Report (Vol. II) Madatharuvi
Integrated Rural Technology Centre, Palakkad 9.2
50m.
9.2.2 Catchment area
Topographical survey sheets to a scale of 1:50,000 are available from the Survey of India. The
catchment of Madatharuvi site was located using the toposheet. It is shown in Fig.No.9.2. The
total area of catchment is measured and it comes to nearly 4.31sq.km. The catchment area is
having almost moderate slope but some portions are very steep.
9.2.3 Contour map
The survey details were plotted on a sheet of paper at a scale of 1:400. The undulations of the
site, the location of the falls and other topographical features were identified from the contour
map. The location of the weir, the alignment of the penstock and location of the power house
were also determined using this and the prepared contour map has been shown in Annexure
A.9.
9.2.4 River flow data
For a period of 12 months (January 1998 to January 1999) the water level observations were
taken every week. A suitable location was identified on the downstream of the fall, where the
whole water is flowing through that point, cross sectional details of the point were noted for the
calculating stream discharge. We fixed a measuring gauge at that point to measure the peak flow.
Using the collected data (Table 9.1) the weekly discharge hydrograph of the site was prepared.
The graph is shown in Fig. 9.3.
9.2.5 Flow duration curve
Using weekly discharge hydro graph, percentage flow of exceedence was calculated. From this,
the flow duration curve was plotted (Fig. No. 9.4). The same curve also functions as percentage
flow of exceedence graph. This river flow data is recalculated in tabular form, giving the
corresponding energy potential in weekly and cumulative mode is given in Table 9.2. These data
are used for calculating energy potential and selection of unit sizes in section 9.4.
9.2.6 Peak flow determination

WGSHP - Final Report (Vol. II) Madatharuvi
Integrated Rural Technology Centre, Palakkad 9.3
There are various empirical methods for calculating the maximum flood discharge. The different
values obtained are shown in Table 9.3 The value obtained by Dicken=s formula, which is
commonly used in western ghats region has been used for the structural design of diversion
structure.
Table 9.3
Peak Flow Determination
Parameters
Dicken=s method
Ingli=s formula
Ryve=s formula
Nawab Jung
Bahadur formula Peak flow in
cumecs
77.81 138.29
26.76
196.75
9.3 SALIENT DESIGN FEATURES
A detailed design of Civil, Electrical, and Mechanical work has not been carried out in this report
as it does not come under the purview of the project. But, a typical section of the proposed
diversion structure is given here. The stability analysis of the section and economic diameter of
the penstock was carried out as part of preliminary design. The capability and number of units,
type and specification of turbine, generator and it=s cost have been estimated, after consulting
various agencies.
9.3.1 Power potential of the project
From the flow duration curve the discharge corresponding to 70% is only 0.001 cubic metre per
second. A discharge of 0.001cubic metre per second can produce only about 0.325 kW.
However it seen that much higher flows are available during 50% of the time. In order to tap the
full potential of the site, with a head of 43 metre, the project is designed to generate higher output
with lower dependabili ty. This site can be designed as a run of the river project which can
produce 75 kW with a dependability of 24% (88 days).
The output power was computed using the formula, P = 10 x Q x H x ηη
Where; P = Power output in kW
Q = Discharge in cumec

WGSHP - Final Report (Vol. II) Madatharuvi
Integrated Rural Technology Centre, Palakkad 9.4
H = Head in metres
η = Efficiency taken as 0.75
For 24% exceedence P = 10 x 0.215 x 43 x 0.75 = 75 kW.
For 50% exceedence P = 10 x 0.054 x 43 x 0.75 = 17 kW.
For 40% exceedence P = 10 x 0.102 x 43 x 0.75 = 35 kW.
For 30% exceedence P = 10 x 0.192 x 43 x 0.75 = 60 kW.
9.3.2 Energy potential
At this site, sufficient flow is there so that we can obtain 75 kW power output for 24% of the time
(88days) which drastically reduces to 15kW by 60% time. The energy input corresponding to
24% time will be (24/100 x 75 x 365 x 24) = 0.1577 MU. The flow after 24% time will be
efficiently utilized by providing a small pondage. The quantity of water available from 24% to
100% time is calculated to be 1335701m3. Energy obtained from this water is calculated to be
0.12 MU
Total amount of energy produced = 0.1577 MU + 0.12 MU = 0.277 MU.
It may be noted that, this much amount of energy can generated for the particular year. If higher
flows are available during any year, it will enable higher production and vice versa.
9.3.3 Pondage requirement
From the contour map a plot of surface area Vs. elevation is drawn in Fig.No.9.5. The areas
corresponding to each elevation is used to find the volume of water that can be stored in each
elevation and the details are shown in Table 9.4. From this information a capacity elevation
curve of the pondage is prepared and is shown in Fig.No.9.6.

WGSHP - Final Report (Vol. II) Madatharuvi
Integrated Rural Technology Centre, Palakkad 9.5
Table 9.4 Pondage Area Details
Sl. No.
Elevation (m)
Area (m2)
Capacity (m3)
Energy (kWh)
1
98.50
0
0
0
2
99
4.0625
2.60
0.27
3
100
141.875
189.40
20
As the terrain is suitable for storing 190m3, it follows that, at full storage, the energy capacity is
only about 140kWh. If a single 100 kW machine is installed, it can be operated for only one hour
at full capacity (during peak time). Fortunately, pondage becomes critical only during lean
months, this kid of operation practice is acceptable. Hence, a weir height of 1.5 m, to create a
storage of 190m3 is suggested.
As the terrain is not suitable for storage the structure proposed at this site is only for diverting
water.
9.4 SELECTION OF PLANT CAPACITY AND UNIT SIZES
For optimization of plant capacity, the following parameters were assumed.
Rate of return on investment - 15%
Loan repayment period - 10 years
Average O/M cost - 2.5% of capital cost
Resulting standard annual cost - 25%
(This consists of 2.5% O & M costs, 15% return on 25% equity, 15% interest on 75% loan and repayment of loan in 10 annual instalments)
Tariff (per Unit) - Rs. 2.5 and 3.0 (Two cases)
Investment cost (Rs.in Crores per MW) - Rs. 3.5 (Two cases)
Since manufacturers were not in a position to quote exact figures, no attempt was made to fine
tune the cost in relation to site specific conditions. Only ranges could be indicated. Each
combination of tariff and capital cost selected above, will demand a minimum annual generation

WGSHP - Final Report (Vol. II) Madatharuvi
Integrated Rural Technology Centre, Palakkad 9.6
per kW installed. This can be taken to be the break even Plant Capacity Factor (PCF) for the
site under the specified conditions.
Lower the cost/MW and higher the price for energy, the larger will be the economically
viable installed capacity and the quantity of energy that can be economically extracted
from a given site.
Let the capital cost of Madatharuvi be Rs.3.5 crores/MW. The annual rate is 25%. Let the unit
rate of tariff offered by K.S.E.B be Rs.2.5/kWh.
If X be the number of hours of operation at full load capacity,
per Mega Watt annual cost, at the rate of 25% on investment = Rs. 3.5 Crores x 0.25
per Mega Watt revenue = 1000 kW x Rs. 2.5 x X
Equating the two, we get 3,50,00,000 x 0.2.5 = X x 1000 x 2.5
X = 3,500 hrs.
It follows that, any combination of machines, that can work at full capacity for over 3500 hours
can deliver a profit, if the overall project cost is below Rs.3.5 crores/MW and tariff is Rs. 2.5 per
kilo Watt hour.
This can be explained better in terms of Plant Capacity Factor, which is defined as the ratio of
actual amount of energy obtained to the maximum energy that can be obtained from the given
installed capacity during an year, to the actual amount of energy obtained.
In this case, for the value of X = 3500 hours, PCF = (3500 / 8760) x 100 = 40%
That is, a maximum capacity, which yields a PCF of 40% is economically viable for this site.
Similarly, break even PCF for Rs.3.0 per unit and Rs. 3.5 Crores per Mega Watt where
X=2916 hours is 33.3%.
Now we shall check various capacities of turbine size which are suitable for this two conditions.
a. Tariff: Rs.2.50/kWh and break even PCF of 40%.

WGSHP - Final Report (Vol. II) Madatharuvi
Integrated Rural Technology Centre, Palakkad 9.7
For an installed capacity of 75 kW, which corresponds to about 24% flow of exceedence from
the chart, the total energy yield is the sum of:
75kW x (0.24 x 8760) = 0.1577 at continuous operation for 24% time of an year, and
0.12MU, which is the cumulative energy potential from 24% to 100% time as obtained from the
Chart (Table 3.3).
Total yield = 0.1577MU + 0.12MU = 0.278 MU.
The Plant Capacity Factor, corresponding to this yield is given by :
PCF = 0.278 x 10⁸ / (75 x 8760) = 42.3 %
This PCF is equal to the break even value of 40%.
So 75 kW will be the optimum choice for the site, if the overall project cost is below Rs.3.5 crores/MW and tariff is Rs. 2.5 per kilo Watt hour.
b. Tariff: Rs.3.00/kWh and break even PCF of 33.3%
Similarly, For 150 kW (for 19% flow of exceedence)
PCF = (430000 / 150 x 8760) x 100 = 32.72%
This PCF is very near to the break even value of 33%.
Similarly, 150 kW will be the optimum choice for the site, if the overall project cost is below Rs. 3.5 crores/MW and tariff is Rs. 3.0 per kilo Watt hour.
Table 9.5 Economically Viable Maximum Capacity at Different Costs and Tariff
Tariff
Unit sizes for
Rs.3.5 Crores/MW
Rs.2.5/Unit
75 kW
Rs.3.00/ Unit
150 kW
The units selected can be one of the following combinations:
For Rs.3.5 Crores/MW and Rs.2.5/Unit we can opt (0.025 MW x 3) or (0.05 MW x 1 + 0.025 MW x 1)

WGSHP - Final Report (Vol. II) Madatharuvi
Integrated Rural Technology Centre, Palakkad 9.8
For Rs.3.5 Crores/MW and Rs.3.0/Unit we can opt ( 0.025 MW x 2 + 0.05MW x 2) or
(0.1MW x 1 + 0.05 MW x 1).
Among these two categories, the second one seems to be less viable since it is bulky with units.
We have restricted ourselves to the more realistic combination of Rs.3.5 Crores/MW of
investment cost and two tariff choices of Rs. 2.5/Unit and Rs. 3.0/Unit.
9.5 CIVIL ENGINEERING WORKS
The important Civil Engineering Works required for the project are a diversion weir, an intake
structure, a penstock and a power house. A weir is constructed to have a small storage and to
divert the water from stream to the intake. For this project only a diversion weir is proposed,
which allows the excess water to flow over the weir to the downstream. The intake structure
takes water from the weir and leads it to the penstock. The penstock made of steel is proposed
in this site. A power house is constructed for the purpose of housing the electro mechanical
equipment. It is usually a small building of 6m x 5m.
9.5.1 Weir at Madatharuvi
A gabion has been proposed on the Madatharuvi stream, at a bed level of +98.000metres. The
base width of the weir at bed level is 5.2 m. The diversion structure is 1.5m high having a length
of 10m at the top with a central broad crested free over fall type spill way. The cross sectional
details of the proposed diversion site is shown in Fig. 9.7.
9.5.2 Intake Structure, Penstock and Power house
A simple box type, direct intake structure of reinforced cement concrete is provided on the
stream bed. A trash rack is provided on the intake mouth, the penstock entrance starts from the
wall of intake box near the gabion. The economic diameter of the penstock is calculated as
0.41m and the thickness of the penstock is found as 6mm. The penstock is designed for a
maximum flow of 0.233 cumec with a velocity of 1.77 metre per second. The possible alignment
for the penstock is located on the left bank of the stream. The longitudinal section of the
proposed penstock line was drawn from the contour map and the length was calculated, which
comes to 249m (Fig. No. 9.8).
A surface power house is proposed on the left bank of the stream. The slope at the proposed site

WGSHP - Final Report (Vol. II) Madatharuvi
Integrated Rural Technology Centre, Palakkad 9.9
is moderate but increases up the hill towards north east direction. The power house is of size 6m
x 5m, to accommodate 75kW, generator and standardised turbine.
9.6 ELECTRICAL AND MECHANICAL EQUIPMENTS
The power house proposed in the scheme will have an installed capacity of 75 kW. The
electricity generated would be connected to the existing power grid system at Mandamaruthi by a
500m transmission line. A standardised turbine for 50m gross head is proposed for this particular
site. The turbine shall be complete with governor, control equipment and safety devices. The
generator would be synchronous with a brushless excitation system shall be rated to generate
75kW, 11kV three phases, 50 Hz and shall be suitable for coupling with turbine described
above. The generator shall have voltage regulation equipment, parallel operation equipment etc.
9.7 ENVIRONMENTAL IMPACTS
A small hydro project has been proposed at Madatharuvi (Pathanamthitta Dist.). The project
aims to generates about 75 kW of hydro power from a fall having a head of 43 m. Some
preliminary environmental impact analysis have been carried out. They are land, water and
socio-economical environmental impacts.
9.7.1 Environmental impact on land
The catchment area measured from toposheet comes to be 4.31sq. km. The stream falls through
moderate slope on the upstream side and gentle after the fall. The site contains two small falls
and one moderate fall. After the fall, the stream joins to the Pampa river. The upstream side of
the fall is rubber plantation. The site is situated in private land One side is owned by Rubber
Board and other side by private persons. The land is having moderate slope in this area. There
is no land slide occurred in this area on past time and the possibility also very less. The chances
of soil erosion is negligible. The bed of the stream is rocky and the boulders are available in
plenty at the site. The number of rainy days exceeds 50% in its catchment.

WGSHP - Final Report (Vol. II) Madatharuvi
Integrated Rural Technology Centre, Palakkad 9.10
The most significant thing is that, due to impoundment, no forest land will be submerged. The
construction of weir, penstock, power house, tailrace and temporary road will not take away any
forest land. So no forest clearance is required for the project.
9.7.2 Environmental impact on water
The Kanjirappuzha, which drains to Pampa river is the stream of this fall. The diversion structure will
create a pond of area 0.0142ha. No forest land will be submerged. Above all, this accounts for only
0.19 ha/MW. This diversion structure which also acts as a check dam can increase the height of
water table level at the site. The impounded water will also change soil moisture regime in adjacent
forest land.
9.7.3 Socio-economic impact
The construction phase would create employment opportunities for a period of 18 months. The peak
labour strength is 100 skilled and 100 unskilled labour. It requires only minimum land acquisition for
construction. The acquisition does not need any rehabilitation.
9.8 CONCLUSION The environmental impact of that small hydel project is negligible. No serious adverse impact is
anticipated. Moreover, deforestation owing to the inundation will be a meagre area. The economic
size of installed capacity depends upon the permissible tariff as well as the capital cost. It was found
that the project is financially viable for an installed capacity of 75 kW at a project cost of Rs. 3.5
Crores per MW and a tariff rate of Rs.2.5 per unit of electricity. Alternatively, if the tariff is raised to
Rs.3.00 per unit, an installed capacity of 150kW would become economically viable.
Cost effective methods of construction, like the use of gabion weirs, can be used to reduce the capital
costs. A methodology for implementing the project with a maximum of peoples= participation should
also be devised. The role of the Grama Panchayat in this effort is crucial.
-��-

WGSHP - Final Report (Vol. II) Madatharuvi
Integrated Rural Technology Centre, Palakkad 9.11
10. KALLIMALI
District : Idukki
Panchayath : Rajakkad
Head : 43 m.
Flow : Seasonal
Suggested Capacity : 200 kW/ 450 kW

WGSHP - Final Report (Vol. II) Kallimali
Integrated Rural Technology Centre, Palakkad 1.1
10.1 GENERAL
10.1.1 The site
Kallimali water fall is situated in the 3rd ward of Rajakkad Grama Panchayath in Idukki district.
The site is at a distance of 3.5 km from Rajakkad. There is a bus route from Rajakkad to
Ambalakkavala stop (2km from Rajakkad) on the Rajakkad-Adimali main road. From
Ambalakavala 1.5km motorable road exists up to the upstream of the fall. 11kV transformer is at
1.5km. away from the site.
The water fall is located at 770 5' 26" E longitude and 90 6' 42" N latitude. The catchment area
measured from topo sheet is 4.75 sq.km. The falls are situated at an elevation of 920m from
MSL in Kallimali stream which is beginning at an elevation of 1060 from MSL. The upstream
side of the fall is paddy field. The stream falls vertically and flows through steep sloped terrain
and drains to the Ponmudi reservoir. The location map of the site is shown in Fig .10.1.
10.1.2 Topography
The site is situated outside the forest area. The land is having gentle slope at the upstream side
and steep slopes towards downstream. Possibility for land slide and soil erosion is negligible.
The bed of the stream is rocky on the upstream side of the fall. The number of rainy days
exceeds 50% in its catchment.
10.2 FIELD INVESTIGATION
10.2.1 Reconnaissance survey
A topographical survey was conducted for obtaining topographical details of the site. There is
one main fall which gives a total head of 50m. The possible location for diversion structure and
power house were identified and the details were taken using tacheometric method of surveying.
10.2.2 Catchment area
Topographical survey sheets to a scale of 1:50,000 are available from the Survey of India. The
catchment of Kallimali was located using the toposheet. It is shown in the Fig.No.10.2. The
WGSHP - Final Report (Vol. II) Kallimali
Integrated Rural Technology Centre, Palakkad 1.2
total area of catchment is having almost moderate slope but some portions are very steep and its
area found to be 4.75 sq.km.
10.2.3 Contour map
The survey details were plotted on a sheet of paper at a scale of 1:200. The undulations of the
site, the location of the falls and other topographical features were identified from the contour
map. The location of the weir, the alignment of the penstock and location of the power house
were also determined using this and the prepared contour map has been shown in Annexure A
10.
10.2.4 River flow data
For a period of 12 months (March 1997 to April 1998) the water level observations were taken
every week. A suitable location was identified on the downstream of the fall, where the whole
water is flowing through that point, cross sectional details of the point were noted for the
calculating stream discharge. We fixed a measuring gauge at that point to measure the peak flow.
Using the collected data (Table 10.1) the weekly discharge hydrograph of the site was
prepared. The graph is shown in Fig. 10.3.
10.2.5 Flow duration curve
Using weekly discharge hydro graph, percentage flow of exceedence was calculated. From this,
the flow duration curve was plotted (Fig. No. 10.4). The same curve also functions as
percentage flow of exceedence graph. This river flow data is recalculated in tabular form, giving
the corresponding energy potential in weekly and cumulative mode is given in Table 10.2. These
data are used for calculating energy potential and selection of unit sizes in section 10.4.
10.2.6 Peak flow determination
There are various empirical methods for calculating the maximum flood discharge. The different
values obtained are shown in Table 10.3 The value obtained by Dicken=s formula, which is
commonly used in western ghats region has been used for the structural design of diversion
structure.
Table 10.3
Peak Flow Determination

WGSHP - Final Report (Vol. II) Kallimali
Integrated Rural Technology Centre, Palakkad 1.3
Parameters
Dicken=s method
Ingli=s formula
Ryve=s formula
Nawab Jung
Bahadur formula
Peak flow in cumecs
83.6
150.1
28.54
213.32
10.3 SALIENT DESIGN FEATURES A detailed design of Civil, Electrical, and Mechanical work has not been carried out in this report
as it does not come under the purview of the project. But a typical section of the proposed
diversion structure is given here. The stability analysis of the section and economic diameter of
the penstock was carried out as part of preliminary design. The capability and number of units,
type and specification of turbine, generator and it=s cost have been estimated, after consulting
various agencies.
10.3.1 Power potential of the project
The discharge corresponding to 80% exceedence is only 0.015 cubic metre per second. A
discharge of 0.015 cubic metre per second can produce only about 5 kW. In order to tap the
full potential of the site, with a head of 43 metre, the project is designed to generate higher output
with lower dependability. The site can be designed as a run of the river project, which can
produce 300 kW for with a dependability of 25%.
The output power was computed using the formula, P = 10 x Q x H x ηη
Where; P = Power output in kW
Q = Discharge in cumec
H = Head in metres
η = Efficiency taken as 0.75
For 50% exceedence P = 10 x 0.075 x 43 x 0.75 = 24 kW
For 40% exceedence P = 10 x 0.245 x 43 x 0.75 = 75 kW
For 30% exceedence P = 10 x 0.73 x 43 x 0.75 = 235 kW
10.3.2 Energy potential

WGSHP - Final Report (Vol. II) Kallimali
Integrated Rural Technology Centre, Palakkad 1.5
At this site, sufficient flow is there so that we can obtain 300kW power output for 25% of the
time (91days). The output reduces to 16kW if we take the percentage flow of exceedence as
60% (219 days). The energy input corresponding to 25% flow of exceedence will be
(25/100*300*365*24) = 0.657 MU. The flow after 25% time can be utilized by providing a
small pondage. The quantity of water available from 25% to 100% time is calculated to be
3734640 m3. Energy obtained from this water is calculated to be 0.334 MU.
Total amount of energy produced = 0.657 MU + 0.334 MU = 0.991 MU.
It may be noted that, this much amount of energy can be generated for the particular year. If
higher flows are available during any year, it will enable higher production and vice versa.
10.3.3 Pondage requirement
From the contour map a plot of surface area Vs. elevation is drawn in Fig.No. 10.5. The areas
corresponding to each elevation is used to find the volume of water that can be stored in each
elevation and the details are shown in Table 10.4. From this information capacity elevation curve
of the pondage is prepared and is shown in Fig.No.10.6.
Table 10.4
Pondage Area Details Sl. No.
Elevation (m)
Area (m2)
Capacity (m3)
Energy (kWh)
1
495.50
0
0
0
2
496
3.48
0.87
0.07
3
497
13.00
9.11
1
4
498
44.00
37.61
3
5
499
259.92
189.57
17

WGSHP - Final Report (Vol. II) Kallimali
Integrated Rural Technology Centre, Palakkad 1.6
As the terrain is suitable for storing 190m3, it follows that, at full storage, the energy capacity is
only about 15kWh. If a single 15 kW machine is installed, it can be operated for only one hour at
full capacity (during peak time). Fortunately, pondage becomes critical only during lean months,
this kid of operation practice is acceptable. Hence, a weir height of 3.5 m, to create a storage of
190m3 is suggested.
10.4 SELECTION OF PLANT CAPACITY AND UNIT SIZES For optimization of plant capacity, the following parameters were assumed.
Rate of return on investment - 15%
Loan repayment period - 10 years
Average O/M cost - 2.5% of capital cost
Resulting standard annual cost - 25%
(This consists of 2.5% O & M costs, 15% return on 25% equity, 15% interest on 75% loan and repayment of loan in 10 annual instalments)
Tariff (per Unit) - Rs. 2.5 and 3.0 (Two cases)
Investment cost (Rs.in Crores per MW) - Rs. 3.5 (Two cases)
Since manufacturers were not in a position to quote exact figures, no attempt was made to fine
tune the cost in relation to site specific conditions. Only ranges could be indicated. Each
combination of tariff and capital cost selected above, will demand a minimum annual generation
per kW installed. This can be taken to be the break even Plant Capacity Factor (PCF) for the
site under the specified conditions.
Lower the cost/MW and higher the price for energy, the larger will be the economically
viable installed capacity and the quantity of energy that can be economically extracted
from a given site.
Let the capital cost of Kallimali kuthu be Rs.3.5 crores/MW. The annual rate is 25%. Let the
unit rate of tariff offered by K.S.E.B be Rs. 2.5/kWh.
If X be the number of hours of operation at full load capacity,
per Mega Watt annual cost, at the rate of 25% on investment = Rs. 3.5 Crores x 0.25

WGSHP - Final Report (Vol. II) Kallimali
Integrated Rural Technology Centre, Palakkad 1.7
per Mega Watt revenue = 1000 kW x Rs. 2.5 x X
Equating the two, we get 3,50,00,000 x 0.2.5 = X x 1000 x 2.5
X = 3,500 hrs.
It follows that, any combination of machines, that can work at full capacity for over 3500 hours
can deliver a profit, if the overall project cost is below Rs. 3.5 crores/MW and tariff is Rs. 2.5
per kilo Watt hour.
This can be explained better in terms of Plant Capacity Factor, which is defined as the ratio of
actual amount of energy obtained to the maximum energy that can be obtained from the given
installed capacity during an year, to the actual amount of energy obtained.
In this case, for the value of X = 3500 hours, PCF = (3500 / 8760) x 100 = 40%
That is, a maximum capacity, which yields a PCF of 40% is economically viable for this site.
Similarly, break even PCF for Rs.3.0 per unit and Rs. 3.5 Crores per Mega Watt where
X=2916 hours is 33.3%
Now we shall check various capacities of turbine size which are suitable for this two conditions.
a. Tariff: Rs.2.50/kWh and break even PCF of 40%.
For an installed capacity of 300 kW, which corresponds to about 24% flow of exceedence from
the chart, the total energy yield is the sum of:
200 kW x (0.3x 8760) = 0.526 at continuous operation for 30% time of an year, and
0.203MU, which is the cumulative energy potential from 30% to 100% time as obtained from the
Chart (Table 10.3).
Total yield = 0.526MU + 0.203MU = 0.73 MU.
The Plant Capacity Factor, corresponding to this yield is given by :
PCF = 0.73 x 10⁸ / (200 x 8760) = 41.7 %
This PCF is equal to the break even value of 40%.

WGSHP - Final Report (Vol. II) Kallimali
Integrated Rural Technology Centre, Palakkad 1.8
So 200 kW will be the optimum choice for the site, if the overall project cost is below
Rs.3.5crores/MW and tariff is Rs. 2.5 per kilo Watt hour.
b. Tariff: Rs.3.0/kWh and break even PCF of 33.3%
Similarly, For 450 kW (for 21% flow of exceedence)
PCF = (1300000 / 450 x 8760) x 100 = 32.9%
This PCF is very near to the break even value of 33%.
Similarly, 450 kW will be the optimum choice for the site, if the overall project cost is
below Rs. 3.5 crores/MW and tariff is Rs. 3.0 per kilo Watt hour.
Table 10.5
Economically Viable Maximum Capacity at Different Costs and Tariff
Tariff
Unit size for Rs.3.5 Crores/MW
Rs.2.5/Unit
200 kW
Rs.3.00/ Unit
450 kW
The units selected can be one of the following combinations:
For Rs.3.5 C rores/MW and Rs.2.5/Unit we can opt (0.05MW x 4) or ( 0.1 MW x 2)
For Rs.3.5 Crores/MW and Rs.3.0/Unit we can opt ( 0.20 MW x 2 + 0.05MW x 1) or
(0.250MW x 2)
Among these two categories, the second one seems to be less viable since it is bulky with units.
We have restricted ourselves to the more realistic combination of Rs.3.5 Crores/MW of
investment cost and two tariff choices of Rs. 2.5/Unit and Rs. 3.0/Unit.

WGSHP - Final Report (Vol. II) Kallimali
Integrated Rural Technology Centre, Palakkad 1.9
10.5 CIVIL ENGINEERING WORKS
The important Civil Engineering Works required for the project are a diversion weir, an intake
structure, a penstock and a power house. A weir is constructed to have a small storage and to
divert the water from stream to the intake. For this project only a diversion weir is proposed,
which allows the excess water to flow over the weir to the downstream. The intake structure
takes water from the weir and lead it to the penstock. The penstock made of steel is proposed in
this site. A power house is constructed for the purpose of housing the electro mechanical
equipment. It is usually a small building of 6m x 3.5m.
10.5.1 Weir at Kallimali
A concrete weir has been proposed on the Kallimali stream, at a bed level of +496.000metres.
The base width of the weir at bed level is 3.5m. The structure is 1.5m high having a length of
11.25m at the top with a central broad crested free over fall type spill way. The cross sectional
details of the proposed diversion site and a typical section of the structure are shown in Fig. No.
10.7.
10.5.2 Intake Structure, Penstock and Power house
A simple box type, direct intake structure of reinforced cement concrete is provided on the
stream bed. A trash rack is provided at the intake mouth, the penstock entrance starts from the
wall of intake box near the structure. The economic diameter of the penstock is calculated as
0.63 m. The penstock can carry a maximum flow of 0.62 cumec with a velocity of 2 metre per
second. The possible alignment for the penstock is located on the left bank of the stream. The
longitudinal section of the proposed penstock line was drawn from the contour map and the
length was calculated, which comes to 127.5m (Fig.No.10.10). A surface power house is
proposed on the left bank of the stream. The slope at the proposed site is moderate but increases
up the hill towards north east direction. The power house is of size 6 m x 3.5 m, to
accommodate 200 kW, generator and standardised turbine.
10.6 ELECTRICAL AND MECHANICAL EQUIPMENTS
The power house proposed in the scheme will have an installed capacity of 200kW. A
standardised turbine for 50m gross head is proposed for this particular site. The turbine shall be
complete with governor, control equipment and safety devices. The generator would be
synchronous with a brushless excitation system shall be rated to generate 200kW, 11kV three
WGSHP - Final Report (Vol. II) Kallimali
Integrated Rural Technology Centre, Palakkad 1.10
phases, 50 Hz and shall be suitable for coupling with turbine described above. The generator
shall have voltage regulation equipment, parallel operation equipment etc.
10.7 ENVIRONMENTAL IMPACTS
A small hydro project has been proposed at Kallimalikkuthu (Idukki Dist.). The project aims to
generates about 200 kW of hydro power from a fall having a head of 43 m. Some preliminary
environmental impact analysis have been carried out. They are land, water and socio-
economical environmental impacts.
10.7.1 Environmental impact on land
The catchment area measured from topo sheet comes to be 4.75 sq. km. The upstream side of
the fall is paddy field. The stream falls vertically and flows through steep slopes. After the fall,
the stream joins to the Ponmudi reservoir. The site is situated out side the forest. The land is
having gentle slope at the upstream side and steep slopes towards down stream. Possibility for
land slide and soil erosion is negligible. The bed of the stream is rocky on the upstream side of
the fall. The number of rainy days exceeds 50% in its catchment.
The most significant thing is that, due to impoundment, no forest land will be submerged. The
construction of weir, penstock, power house will not take away any forest land. So no forest
clearance is required for the project.
10.7.2 Environmental impact on water
The Kallimali, which drains to Ponmudi Reservoir is the stream of this fall. The diversion
structure will create a pond of area 0.026 hectare. No forest land will be submerged. Above all,
this accounts for only 0.13 ha/MW.

WGSHP - Final Report (Vol. II) Kallimali
Integrated Rural Technology Centre, Palakkad 1.11
10.7.3 Socio-economic impact
The construction phase would create employment opportunities for a period of 12 months. It requires
only minimum land acquisition for construction. The acquisition does not need any rehabilitation.
10.8 CONCLUSION
The environmental impact of the small hydel project is negligible. No serious adverse impact is
anticipated. Moreover, deforestation owing to the inundation will be a merge area.
The economic size of installed capacity depends upon the permissible tariff as well as the capital cost.
It was found that the project is financially viable for an installed capacity of 200kW at a project cost
of Rs. 3.5 Crores per MW and a tariff rate of Rs.2.5 per unit of electricity. Alternatively, if the tariff is
raised to Rs.3.00 per unit, an installed capacity of 450kW would become economically viable.
Cost effective methods of construction, like the use of gabion weirs, can be used to reduce the capital
costs. A methodology for implementing the project with a maximum of peoples= participation should
also be devised. The role of the Grama Panchayat in this effort is crucial.
-��-

WGSHP - Final Report (Vol. II) Kallimali
Integrated Rural Technology Centre, Palakkad 1.12
11.GANDHI SMARAKAPPADY
District : Idukki
Panchayath : Kanjikkuzhy
Head : 43 m.
Flow : Seasonal
Suggested Capacity : 150 kW/ 250 kW

WGSHP - Final Report (Vol. II) Gandhi Smarakappady
Integrated Rural Technology Centre, Palakkad 1.1
11.1 GENERAL
11.1.1 The site
Idukki district is blessed with a member of water falls. Most of them are potential sites for small
hydropower generation. The Gandhi Smarakappady water fall is in the 4th ward of Kanjikkuzhy
Grama Panchayath in Idukki district. The site is at a distance of nearly 1.5 km from
Chelachuvadu which is nearly 16 km. away from Cheruthony in Kumali-Kothamangalam route.
The nearest 11KV line is just 1km from the site.
The water fall is located at 760 57' 37" E longitude and 90 55' 0" N latitude. The catchment area
measured from toposheet is 1.13 sq.km. The falls are situated at an elevation of 480m from
mean sea level (MSL) in Gandhi Smarakppady stream which begins at an elevation of 700m
from MSL. After the fall, the stream joins to the Churulythodu and then draining to the Periyar
river. The location map of the site is shown in Fig.No.11.1.
11.1.2 Topography
The site is situated out side the forest. The land is having steep slopes in this area. From the
previous history of site, it is clear that there is no possibility of land slide and the chances for soil
erosion is negligible. The bed of the stream is rocky, there is a gross head of 43m. The number
of rainy days exceeds 50% in its catchment.
11.2 FIELD INVESTIGATION
11.2.1 Reconnaissance survey
A topographical survey was conducted for obtaining topographical details of the site. There is
one main fall which gives a total head of 50m. The possible location for diversion structure and
power house were identified and the details were taken using tacheometric method of surveying.
11.2.2 Catchment area
Topographical survey sheets to a scale of 1:50,000 are available from the Survey of India The
catchment of Gandhi Smarakappady was located using the toposheet. It is shown in the Fig No.
11.2 and the area measured comes to nearly 1.13 sq.km. The catchment area is having almost

WGSHP - Final Report (Vol. II) Gandhi Smarakappady
Integrated Rural Technology Centre, Palakkad 1.2
moderate slopes but some portions are very steep. Maximum flood discharge measured at this
site during 1998 is about 3.10 cumec.
11.2.3 Contour map
The survey details were plotted on a sheet of paper at a scale of 1:200. The undulations of the
site, the location of the falls and other topographical features were identified from the contour
map. The prepared contour map is shown in Annexure A.11. The location of the weir,
alignment of the penstock and location of the power house were determined using this contour
map.
11.2.4 River flow data
For a period of 12 months (December 1997 - December 1998) the water level observations
were taken in every week. A suitable location was identified on the upstream side of the fall,
where the whole water is flowing through that point, cross sectional details of the point were
noted for calculating the stream discharge. We fixed a measuring gauge at this point to measure
the peak flow. Using the collected data (Table 11.1) the weekly discharge hydrograph of the
site is prepared by plotting number of weeks against discharge. The graph is shown in Fig. No.
11.3.
11.2.5 Flow duration curve
Using weekly discharge hydro graph, percentage flow of exceedence was calculated. From this,
the flow duration curve was plotted (Fig. No.11.4). The same curve also functions as
percentage flow of exceedence graph. This river flow data is recalculated in tabular form, giving
the corresponding energy potential in weekly and cumulative mode is given in Table 11.2. These
data are used for calculating energy potential and selection of unit sizes in section 11.4.
11.2.6 Peak flow determination
There are various empirical methods for calculating the maximum flood discharge. The different
values obtained are shown in Table 11.3 The value obtained by Dicken=s formula, which is
commonly used in western ghats region has been used for the structural design of diversion

WGSHP - Final Report (Vol. II) Gandhi Smarakappady
Integrated Rural Technology Centre, Palakkad 1.3
structure.
Table 11.3
Peak Flow Determination
Parameters
Dicken=s method
Ingli=s formula
Ryve=s formula
Nawab Jung
Bahadur formula Peak flow in
cumecs
28.40
40.76
10.93
60.23
11.3 SALIENT DESIGN FEATURES Design of any hydel projects means a detailed design of Civil works along with Electrical and
Mechanical installation works. Usually for a small hydro scheme, the design is less complicated
and easy. A detailed design of Civil, Electrical, and Mechanical work has not been carried out in
this report as it does not come under the purview of the project. A typical section of the
proposed diversion structure is given here. The stability analysis of the section and economic
diameter of the penstock was carried out as part of preliminary design. The capability and
number of units, type and specification of turbine, generator and its cost have been estimated,
after consulting various agencies.
11.3.1 Power potential of the project
The discharge corresponding to 80% exceedence is only 0.005 cubic metre per second. A
discharge of 0.005 cubic metre per second can produce only about 2 kW. In order to tap the
full potential of the site, with a head of 43 metre, the project is designed to generate higher out put
with lower dependability. This site can be designed as a run of the river project which can
produce 50 kW with a dependability of 50 % and 100 kW with a dependability of 30 %. So we
can use two 50kW machines for the site.
The output power was computed using the formula, P = 10 x Q x H x ηη
Where; P = Power output in kW
Q = Discharge in cumec

WGSHP - Final Report (Vol. II) Gandhi Smarakappady
Integrated Rural Technology Centre, Palakkad 1.5
H = Head in metres
η = Efficiency taken as 0.75
For 50% exceedence P = 10 x 0.144 x 50 x 0.75 = 50.00 kW.
For 40% exceedence P = 10 x 0.257 x 50 x 0.75 = 80 kW.
For 30% exceedence P = 10 x 0.373 x 50 x 0.75 = 120 kW.
11.3.2 Energy potential
At this site, sufficient flow is there so that we can obtain 100kW power output for 30% of the
time (110 days) which reduces to 50kW by 50% time (183 days). The energy input
corresponding to 30% time will be (30/100 x 100 x 365 x 24) = 0.263 MU. The energy input
corresponding to 50% time will be ((50-30)/100 x 50 x 365 x 24) = 0.088MU. The flow after
50% time can be utilized by providing a small pondage. The quantity of water available from 40%
to 100% time is calculated to be 796547m3. Energy obtained from this water is calculated to be
0.0714 MU.
Total amount of energy produced =0.263 MU + 0.088 MU + 0.0714MU= 0.4224 MU.
It may be noted that , this much amount of energy can be generated for the particular year. If
higher flows are available during any year, it will enable higher production and vice versa.
11.3.3 Pondage requirement
From the contour map a plot of surface area Vs. elevation is drawn in Fig.No. 11.5. The areas
corresponding to each elevation is used to find the volume of water that can be stored in each
elevation and the details are shown in Table 11.4. From this information a capacity elevation
curve of the pondage is prepared and is shown in Fig.No.11.6.

WGSHP - Final Report (Vol. II) Gandhi Smarakappady
Integrated Rural Technology Centre, Palakkad 1.6
Table 11.4
Pondage Area Details Sl. No.
Elevation(m)
Area (m2)
Capacity(m3)
Energy (kWh)
1
499
0
0
2
500
57.00
28.60
3
3
501
140.00
127.80
11
4
502
223.00
308.50
28
5
503
329.00
384.30
34
As the terrain is suitable for storing 385m3, it follows that, at full storage, the energy capacity is
only about 34kWh. If a single 34 kW machine is installed, it can be operated for only one hour at
full capacity (during peak time). Fortunately, pondage becomes critical only during lean months,
this kid of operation practice is acceptable. Hence, a weir height of 4m, to create a storage of
385 m3 is suggested.
11.4 SELECTION OF PLANT CAPACITY AND UNIT SIZE
For optimization of plant capacity, the following parameters were assumed.
Rate of return on investment - 15%
Loan repayment period - 10 years
Average O/M cost - 2.5% of capital cost
Resulting standard annual cost - 25%
(This consists of 2.5% O & M costs, 15% return on 25% equity, 15% interest on 75% loan and
repayment of loan in 10 annual instalments)
Tariff (per Unit) - Rs. 2.5 and 3.0 (Two cases)
Investment cost (Rs. in Crores per MW) - Rs. 3.5 (Two cases)
Since manufacturers were not in a position to quote exact figures, no attempt was made to fine

WGSHP - Final Report (Vol. II) Gandhi Smarakappady
Integrated Rural Technology Centre, Palakkad 1.7
tune the cost in relation to site specific conditions. Only ranges could be indicated. Each
combination of tariff and capital cost selected above, will demand a minimum annual generation
per kW installed. This can be taken to be the break even Plant Capacity Factor (PCF) for the
site under the specified conditions.
Lower the cost/MW and higher the price for energy, the larger will be the economically
viable installed capacity and the quantity of energy that can be economically extracted
from a given site.
Let the capital cost of Gandhi Smarakappadi be Rs.3.5 crores/MW. The annual rate is 25%.
Let the unit rate of tariff offered by K.S.E.B be Rs. 2.5/kWh.
If X be the number of hours of operation at full load capacity,
per Mega Watt annual cost, at the rate of 25% on investment = Rs. 3.5 Crores x 0.25
per Mega Watt revenue = 1000 kW x Rs. 2.5 x X
Equating the two, we get 3,50,00,000 x 0.2.5 = X x 1000 x 2.5
X = 3,500 hrs.
It follows that, any combination of machines, that can work at full capacity for over 3500 hours
can deliver a profit, if the overall project cost is below Rs. 3.5 crores/MW and tariff is Rs. 2.5
per kilo Watt hour.
This can be explained better in terms of Plant Capacity Factor, which is defined as the ratio of
actual amount of energy obtained to the maximum energy that can be obtained from the given
installed capacity during an year, to the actual amount of energy obtained.
In this case, for the value of X = 3500 hours, PCF = (3500 / 8760) x 100 = 40%
That is, a maximum capacity, which yields a PCF of 40% is economically viable for this site.
Similarly, break even PCF for Rs.3.0 per unit and Rs. 3.5 Crores per Mega Watt where
X=2916 hours is 33.3%.
Now we shall check various capacities of turbine size which are suitable for this two conditions.

WGSHP - Final Report (Vol. II) Gandhi Smarakappady
Integrated Rural Technology Centre, Palakkad 1.8
a. Tariff: Rs.2.50/kWh and break even PCF of 40%
For an installed capacity of 550 kW, which corresponds to about 8% flow of exceedence from
the chart, the total energy yield is the sum of:
150 kW x (0.2 x 8760) = 0.263 MU at continuous operation for 20% time of an year, and
0.28MU, which is the cumulative energy potential from 20% to 100% time as obtained from the
Chart (Table 11.3).
Total yield = 0.263MU + 0.28MU = 0.543 MU.
The Plant Capacity Factor, corresponding to this yield is given by :
PCF = 0.543 x 10⁸ / (150 x 8760) = 41.3 %
This PCF is equal to the break even value of 40%.
So 150 kW will be the optimum choice for the site, if the overall project cost is below
Rs.3.5 crores/MW and tariff is Rs. 2.5 per kilo Watt hour.
b. Tariff: Rs.3.0/kWh and break even PCF of 40%
Similarly, For 250 kW (for 15% flow of exceedence)
PCF = (700000/250 x 8760) x 100 = 32%
This PCF is very near to the break even value of 33%.
Similarly, 250 kW will be the optimum choice for the site, if the overall project cost is
below Rs. 3.5 crores/MW and tariff is Rs. 3.0 per kilo Watt hour.
Table 11.5
Economically Viable Maximum Capacity at Different Costs and Tariff
Tariff
Unit size for Rs.3.5 Crores/MW
Rs.2.5/Unit
150 kW
Rs.3.00/ Unit
250 kW

WGSHP - Final Report (Vol. II) Gandhi Smarakappady
Integrated Rural Technology Centre, Palakkad 1.9
The units selected can be one of the following combinations:
For Rs.3.5 Crores/MW and Rs.2.5/Unit we can opt (0.1MW x 1 + .05MW x 1)
For Rs.3.5 Crores/MW and Rs.3.0/Unit we can opt ( 0.1MW x 2+ 0.05 MW x 1)
Among these two categories, the second one seems to be less viable since it is bulky with units.
We have restricted ourselves to the more realistic combination of Rs. 3.5 Crores/MW of
investment cost and two tariff choices of Rs. 2.5/Unit and Rs. 3.0/Unit.
11.5 CIVIL ENGINEERING WORKS
The important Civil Engineering structures required for the project are a diversion weir, an intake
structure, a penstock and a power house. For this project which is designed as a run off the river
system, only a diversion weir is proposed. This allows the excess water to flow over the weir to
the downstream. The intake structure takes water from the weir and leads it to the penstock. A
penstock made of steel is proposed for this site. A power house is constructed for the purpose of
housing the electro mechanical equipment. It is usually a small building of one or two rooms.
11.5.1 Weir at Gandhi Smarakappady
A concrete weir has been proposed on the Gandhi Smarakappady stream, at a bed level of
+499.000 metres. The diversion structure is 2m high having a length of 9.70m at the top with a
central broad crested free over fall type spill way. The cross sectional details of the proposed
diversion site and a typical section of the structure is shown in Fig.No. 11.7.
11.5.2 Intake Structure, Penstock and Power house
A simple box type, direct intake structure of reinforced cement concrete is provided on the
stream bed. A trash rack is provided on the intake mouth, the penstock entrance starts from the
wall of intake box near the structure. The economic diameter of the penstock is calculated as
0.55m. The penstock can with stand a maximum flow of 0.465 cumec with a velocity of 1.95
metre per second. The possible alignment for the penstock is decided to be on the right bank of
the stream. The longitudinal section of the proposed penstock line was drawn from the contour
map and the length was calculated, which cames to 113m. It is shown in Fig. No. 11.8.

WGSHP - Final Report (Vol. II) Gandhi Smarakappady
Integrated Rural Technology Centre, Palakkad 1.10
A surface power house is proposed on the right bank of the stream. The slope at the proposed
site is gentle. The power house of size 10m x 6m is proposed to accommodate two numbers of
150 kW generator and standardised turbine.
11.6 ELECTRICAL AND MECHANICAL EQUIPMENTS
The power house proposed in the scheme will have an installed capacity of 150 kW. The
electricity generated would be connected to the existing power grid system at Chelachuvadu by a
300m transmission line. A standardised turbine for 43m gross head is proposed for this particular
site. The turbine shall be complete with governor, control equipment and safety devices. The
generator would be synchronous with a brushless excitation system shall be rated to generate 150
kW, 11 kV three phases having a frequency of 50 Hz and will be suitable for coupling with
turbine described above. The generator shall have voltage regulation equipment along with
parallel operation equipment .
11.7 ENVIRONMENTAL IMPACTS
A small hydro project has been proposed at Gandhi Smarakappadi (Idukki Dist). The project
aims to generates about 150 kW of hydro power from a fall having a head of 43m. Some
preliminary environmental impact analysis have been carried out. They are land, water and
socio-economical environmental impacts.
11.7.1 Environmental impact on land
Total area of catchment is about 1.13 square kilometres of land in Gandhi Smarakppady stream.
The falls are situated in Gandhi Smarakppady stream which is beginning at an elevation of 700m
from MSL. After the fall, the stream joins to the Churulythodu and finally draining to the Periyar
river.
The site is situated out side of forest. The land is having steep slope in this area. From the
previous history of site, it is clear that there is no possibility of land slide and the chances for soil
erosion is negligible. The bed of the stream is rocky. There is an overall head of 43m. The
number of rainy days exceeds 50% in its catchment.

WGSHP - Final Report (Vol. II) Gandhi Smarakappady
Integrated Rural Technology Centre, Palakkad 1.11
The most significant thing is that, due to impoundment, no forest land will be submerged. The
construction of weir, penstock, power house, tailrace and temporary road will not take away any
forest land. So no forest clearance is required for the project.
11.7.2 Environmental impact on water
The Gandhi Smarakppady stream, which drains to Periyar river is the stream of this fall. It is a 3rd
order, structurally controlled stream. The diversion structure will create a pond of area 0.033 hectare.
No forest land will be submerged. Above all, this accounts for only 0.22 ha/MW. This diversion
structure which also acts as a check dam can increase the height of water table level at the site. The
impounded water will also change soil moisture regime in adjacent forest land.
11.7.3 Socio-economic impact
The construction phase would create employment opportunities for a period of 12 months. It requires
only minimum land acquisition for construction. The acquisition does not need any rehabilitation.
11.8 CONCLUSION
The environmental impact of the small hydel project is negligible. No serious adverse impact is
anticipated. Moreover, deforestation owing to the inundation will be a meagre area. The economic
size of installed capacity depends upon the permissible tariff as well as the capital cost. It was found
that the project is financially viable for an installed capacity of 150kW at a project cost of Rs. 3.5
Crores per MW and a tariff rate of Rs.2.5 per unit of electricity. Alternatively, if the tariff is raised to
Rs.3.00 per unit, an installed capacity of 250kW would become economically viable.
Cost effective methods of construction, like the use of gabion weirs, can be used to reduce the capital
costs. A methodology for implementing the project with a maximum of peoples= participation should
also be devised. The role of the Grama Panchayat in this effort is crucial.
-��-

WGSHP - Final Report (Vol. II) Gandhi Smarakappady
Integrated Rural Technology Centre, Palakkad 1.12
12. PATHINARAMKANDAM
District :Idukki
Panchayath :Vathikudi
Head : 43 m.
Flow : Perennial
Suggested Capacity : 350 kW/ 450 kW

WGSHP - Final Report (Vol. II) Pathinaramkandam
Integrated Rural Technology Centre, Palakkad 1.1
12.1 GENERAL
12.1.1 The Site
Idukki district is blessed with a number of water falls. Most of them are potential sites for small
hydro power generation. The Pathinaramkandam water fall is situated in the Ist ward of
Vathikudi Grama Panchayath in Idukki district. The site is at a distance of 2.50 km from
Murikkassery. Bus services as well as jeep services are available to Murikkassery from
Karimban. From Murikkassery, there is a jeepable road to Pathinaramkandom. The stream is
perennial and it is sit uated outside of forest. The head available is about 43 m.
The water fall is located at 760 59' 33" E longitude and 9054' 30" N latitude. The catchment area
measured from topo sheet is 15.56 sq. km. The falls are situated at an elevation of 560 m from
MSL in Murikkassery thodu which is beginning at an elevation of 900 m from MSL. This is only
one main fall in the stream. The upstream side of fall has moderate slope and it continues after the
fall also. There is another fall on the upstream side of the stream which is known as
Murikkasserikuthu. After the fall, the stream joins the Periyar river. The location map of the site
is shown in Fig.No.12.1.
12.1.2 Topography
Topography of any site means the description of the geographical details of the site. The site is
situated outside the forest area. The land is having moderate slope in this area. There is no
possibility of land slide in this area and the possibility of soil erosion is negligible. The bed of the
stream is rocky and boulders are available near the site. The number of rainy days exceeds 50%
in its catchment.
12.2 FIELD INVESTIGATION
12.2.1 Reconnaissance Survey
A topographical survey was conducted for obtaining topographical details of the site. There is
one main fall which gives a total head of 43m. The possible location for diversion structure and
power house were identified and the details were taken using tacheometric method of surveying.

WGSHP - Final Report (Vol. II) Pathinaramkandam
Integrated Rural Technology Centre, Palakkad 1.2
12.2.2 Catchment Area
Topographical survey sheets to a scale of 1:50,000 are available from the Survey of India The
catchment of Pathinaramkandom was located using the toposheet. It is shown in Fig.No. 12.2
and its area was found to be 15.56 sq.km. The catchment area has moderate slopes.
12.2.3 Contour Map
The survey details were plotted on a sheet of paper to a scale of 1:500. The undulations of the
site, the location of the falls and other topographical features were identified from the contour
map. The location of the weir, the alignment of the penstock and location of the power house
were also determined using this contour map. The prepared contour map has been shown in
Annexure A.12.
12.2.4 River Flow Data
For a period of 12 months (January 1998 to January 1999) the water level observations were
taken in every week. A suitable location was identified on the upstream side of the fall, where
the whole water is flowing through that point. Cross sectional details of the area were measured
for calculating the stream discharge. We fixed a measuring gauge at that point to measure the
peak flow. Using the collected data (Table 12.1) the weekly discharge hydrograph of the site
was prepared. The graph is shown in Fig. No. 12.3.
12.2.5 Flow Duration Curve
Using weekly discharge hydro graph, percentage flow of exceedence was calculated. From this,
the flow duration curve was plotted (Fig. No. 12.4). The same curve also functions as
percentage flow of exceedence graph. This river flow data is recalculated in tabular form, giving
the corresponding energy potential in weekly and cumulative mode is given in Table 12.2. These
data are used for calculating energy potential and selection of unit sizes in section 12.4.
12.2.6 Peak Flow Determination
There are various empirical methods for calculating the maximum flood discharge. The different
values obtained are shown in Table 12.3 The value obtained by Dicken=s formula, which is
commonly used in western ghats region has been used for the structural design.

WGSHP - Final Report (Vol. II) Pathinaramkandam
Integrated Rural Technology Centre, Palakkad 1.3
Table 12.3
Peak Flow Determination
Parameters
Dicken=s method
Ingli=s formula
Ryve=s formula
Nawab Jung
Bahadur formula
Peak flow in cumecs
203.72
375.67
62.96
548.94
12.3 DESIGN OF SMALL HYDEL PROJECT A detailed design of Civil, Electrical, and Mechanical work has not been carried out in this report
as it does not come under the purview of the project, but a typical section of the proposed
diversion structure is given here. The stability analysis of the section and economic diameter of
the penstock was carried out as part of preliminary design. The capability and number of units,
type and specification of turbine, generator and it=s cost have been estimated, after consulting
various agencies.
12.3.1 Power Potential of the Project
From the flow duration curve the discharge corresponding to 100% is only 0.10 cubic metre per
second. A discharge of 0.10 cubic metre per second can produce only about 35 kW. However
it seen that much higher flows are available during 50% of the time. In order to tap the full
potential of the site, with a head of 43 metre, the project is designed to generate higher output
with lower dependability. This site can be designed as a run of the river project which can
produce 150 kW with a dependability of 48%.
The output power was computed using the formula, P = 10 x Q x H x e
Where; P = Power output in kW
Q = Discharge in cumec
H = Head in metres
e = Efficiency taken as 0.75
For 50% exceedence P = 10 x 0.44 x 43 x 0.75 ~ 150 kW.
For 40% exceedence P = 10 x 0.51 x 43 x 0.75 ~ 165 kW.

WGSHP - Final Report (Vol. II) Pathinaramkandam
Integrated Rural Technology Centre, Palakkad 1.4
For 30% exceedence P = 10 x 0.54 x 43 x 0.75 ~ 175 kW.
12.3.2 Energy Potential
At this site, sufficient flow is there so that we can obtain 150kW power output for 48% of the
time (175 days). The energy input corresponding to 48% time can be calculated to be (48/100 x
150 x 365 x 24) = 0.631 MU. The flow after 50% time can be utilized by providing a small
pondage. The quantity of water available from 50% to 100% time is calculated to be
3878928m3. Energy obtained from this water is calculated to be 0.35 MU.
Total amount of energy produced = 0.631 MU +0.35 MU = 0.981 MU.
It may be noted that , this much amount of energy can be generated for the particular year. If
higher flows are available during any year, it will enable higher production and vice versa.
12.3.3 Pondage Requirement
From the contour map a plot of surface area Vs. elevation is drawn in Fig.No. 12.5. The areas
corresponding to each elevation is used to find the volume of water that can be stored in each
elevation and the details are shown in Table 12.4. From this information a capacity elevation
curve of the pondage is prepared and is shown in Fig.No.12.6.
Table 12.4
Pondage Area Details Sl. No.
Elevation (m)
Area (m2)
Capacity (m3)
Energy (kWh)
1
600.25
0
0
0
2
601
183.60
68.85
6
3
602
388.80
355.05
32
4
603
718.60
908.75
81
As the terrain is suitable for storing 900m3, it follows that, at full storage, the energy capacity is
only about 80 kWh. If a single 80 kW machine is installed, it can be operated for only one hour
at full capacity (during peak time). Fortunately, pondage becomes critical only during lean
months, this kid of operation practice is acceptable. Hence, a weir height of 3m, to create a
storage of 900m3 is suggested.

WGSHP - Final Report (Vol. II) Pathinaramkandam
Integrated Rural Technology Centre, Palakkad 1.5
12.4 SELECTION OF PLANT CAPACITY AND UNIT SIZE
For optimization of plant capacity, the following parameters were assumed.
Rate of return on investment - 15%
Loan repayment period - 10 years
Average O/M cost - 2.5% of capital cost
Resulting standard annual cost - 25%
(This consists of 2.5% O & M costs, 15% return on 25% equity, 15% interest on 75% loan and
repayment of loan in 10 annual instalments)
Tariff (per Unit) - Rs. 2.5 and 3.0 (Two cases)
Investment cost (Rs.in Crores per MW) - Rs. 3.5 (Two cases)
Since manufacturers were not in a position to quote exact figures, no attempt was made to fine
tune the cost in relation to site specific conditions. Only ranges could be indicated. Each
combination of tariff and capital cost selected above, will demand a minimum annual generation
per kW installed. This can be taken to be the break even Plant Capacity Factor (PCF) for the
site under the specified conditions.
Lower the cost/MW and higher the price for energy, the larger will be the economically
viable installed capacity and the quantity of energy that can be economically extracted
from a given site.
Let the capital cost of Pathinaramkandam be Rs.3.5 crores/MW. The annual rate is 25%. Let
the unit rate of tariff offered by K.S.E.B be Rs. 2.5/kWh.
If X be the number of hours of operation at full load capacity,
per Mega Watt annual cost, at the rate of 25% on investment = Rs. 3.5 Crores x 0.25
per Mega Watt revenue = 1000 kW x Rs. 2.5 x X
Equating the two, we get 3,50,00,000 x 0.2.5 = X x 1000 x 2.5
X = 3,500 hrs.
It follows that, any combination of machines, that can work at full capacity for over 3500 hours

WGSHP - Final Report (Vol. II) Pathinaramkandam
Integrated Rural Technology Centre, Palakkad 1.6
can deliver a profit, if the overall project cost is below Rs. 3.5 crores/MW and tariff is Rs. 2.5
per kilo Watt hour.
This can be explained better in terms of Plant Capacity Factor, which is defined as the ratio of
actual amount of energy obtained to the maximum energy that can be obtained from the given
installed capacity during an year, to the actual amount of energy obtained.
In this case, for the value of X = 3500 hours, PCF = (3500 / 8760) x 100 = 40%
That is, a maximum capacity, which yields a PCF of 40% is economically viable for this site.
Similarly, break even PCF for Rs.3.0 per unit and Rs.3.5 Crores per Mega Watt where X=2916
hours is 33.3%.
Now we shall check various capacities of turbine size which are suitable for this two conditions.
a. Tariff: Rs.2.50/kWh and break even PCF of 40%
For an installed capacity of 350 kW, which corresponds to about 5% flow of exceedence from
the chart, the total energy yield is the sum of 350 kW x (0.05 x 8760) = 0.153MU at continuous
operation for 5% time of an year, and 1.16MU, which is the cumulative energy potential from 5%
to 100% time as obtained from the Chart (Table 12.3).
Total yield = 0.153MU + 1.16MU = 1.313 MU.
The Pant Cpacity Fctor, corresponding to this yield is given by :
PCF = 1.313 x 10⁸ / (350 x 8760) = 42.8 %
This PCF is equal to the break even value of 40%.
So 350 kW will be the optimum choice for the site, if the overall project cost is below Rs.3.5 crores/MW and tariff is Rs. 2.5 per kilo Watt hour.
b. Tariff: Rs.3.0/kWh and break even PCF of 40%
Similarly, For 450 kW (for 4% flow of exceedence)
PCF = (1388000 / 450 x 8760) x 100 = 35.2%

WGSHP - Final Report (Vol. II) Pathinaramkandam
Integrated Rural Technology Centre, Palakkad 1.7
This PCF is very near to the break even value of 33%.
Similarly, 450 kW will be the optimum choice for the site, if the overall project cost is
below Rs. 3.5 crores/MW and tariff is Rs. 3.0 per kilo Watt hour.
Table 12.5
Economically Viable Maximum Capacity at Different Costs and Tariff
Tariff
Unit size for Rs.3.5 Crores/MW
Rs.2.5/Unit
350 kW
Rs.3.00/ Unit
450 kW
The units selected can be one of the following combinations:
For Rs.3.5 Crores/MW and Rs.2.5/Unit we can opt (0.25MW x 1 + 0.1 MW x 1)
For Rs.3.5 Crores/MW and Rs.3.0/Unit we can opt (0.25 MW x 2)
Among these two categories, the second one seems to be less viable since it is bulky with units.
We have restricted ourselves to the more realistic combination of Rs.3.5 Crores/MW of
investment cost and two tariff choices of Rs. 2.5/Unit and Rs. 3.0/Unit.
12.5 CIVIL ENGINEERING WORKS
The important Civil Engineering Works required for the project are a diversion weir, an intake
structure, a penstock and a power house. A weir is constructed to have a small storage and to
divert the water from stream to the intake. For this project only a diversion weir is proposed,
which allows the excess water to flow over the weir to the downstream. The intake structure
takes water from the weir and leads it to the penstock. The penstock made of steel is proposed
in this site. A power house is constructed for the purpose of housing the electro mechanical
equipment. It is usually a small building of 9m x 6m.
12.5.1 Weir at Pathinaramkandam
A gabion weir has been proposed on the Murikkasseri thodu, at a bed level of +600.000 metres.
The diversion structure is 1.20 m high having a length of 6.40 m at the top with a central broad
crested free over fall type spill way. The typical section of proposed structure is shown in Fig.

WGSHP - Final Report (Vol. II) Pathinaramkandam
Integrated Rural Technology Centre, Palakkad 1.8
No. 12.7.
12.5.2 Intake Structure, Penstock and Power House
A simple box type, direct intake structure of reinforced cement concrete is provided on the
stream bed. A trash rack is provided at the intake mouth, the penstock entrance starts from the
wall of intake box near the gabion. The economic diameter of the penstock is calculated as 0.80
m. It is designed for a flow of 1.08 cumec with a velocity of 2.15 metre per second. The
possible alignment for the penstock is located on the left bank of the stream. The longitudinal
section of the proposed penstock line was drawn from the contour map and the length was
calculated, which cames to 188 m (Fig. No. 12.8).
A surface power house is proposed on the left bank of stream. The slope at the proposed site is
moderate but it increases in the south-east direction.
12.6 ELECTRICAL AND MECHANICAL EQUIPMENTS
The power house proposed in the scheme will have an installed capacity of 350 kW. The
electricity generated would be connected to the existing power grid system at Pathinaramkandam
by an 1 km transmission line. A standardised turbine for 50 m gross head is proposed for this
particular site. The turbine shall be complete with governor, control equipment and safety
devices. The generator would be synchronous with a brushless excitation system shall be rated to
generate 350kW, 11kV three phases, 50Hz and shall be suitable for coupling with turbine
described above. The generator shall have voltage regulation equipment, parallel operation
equipment etc.
12.7 ENVIRONMENTAL IMPACTS
A small hydro Project has been proposed at Pathinaramkandam (Idukki Dist). The project aims
to generate about 350 kW of hydro power from a fall having a head of 43 m. Some preliminary
environmental impact analysis have been carried out. They are land, water and socio-economical
environmental impacts.
12.7.1. Environmental Impact on Land

WGSHP - Final Report (Vol. II) Pathinaramkandam
Integrated Rural Technology Centre, Palakkad 1.9
Total area of catchment is about 15.56 square kilometres of land in Murikkasserythodu. The site is
situated out side the forest. The land is having a moderate slope in this area. There is no possibility of
land slide in this area and the possibility of soil erosion also negligible. Both banks of the land is
owned by private persons. Stream sections are mostly rocky, large sized boulders are available. The
most significant thing is that, due to impoundment, no forest land will be submerged. The construction
of weir, penstock, power house, tailrace and temporary road will not take away any forest land. So no
forest clearance is required for the project.
12.7.2 Environmental Impact on Water
The Murikkasserythodu which drains to Periyar river is the stream of this fall. The diversion structure
will create a pond of area 0.0718 hectare. No forest land will be submerged. Above all, this accounts
for only 0.205 ha/MW. So no forest clearance is required.
12.7.3 Socio-economic Impact
The construction phase would create employment opportunities for a period of 12 months. It requires
only minimum land acquisition for construction. The acquisition does not need any rehabilitation.
12.8 CONCLUSION
The environmental impact of this small hydel project is negligible. No serious adverse impact is
anticipated. Moreover, deforestation owing to the inundation will be a merge area.
The economic size of installed capacity depends upon the permissible tariff as well as the capital cost.
It was found that the project is financially viable for an installed capacity of 350kW at a project cost
of Rs. 3.5 Crores per MW and a tariff rate of Rs.2.5 per unit of electricity. Alternatively, if the tariff is
raised to Rs.3.00 per unit, an installed capacity of 450kW would become economically viable.
Cost effective methods of construction, like the use of gabion weirs, can be used to reduce the capital
costs. A methodology for implementing the project with a maximum of peoples= participation should
also be devised. The role of the Grama Panchayat in this effort is crucial.
-��-

WGSHP - Final Report (Vol. II) Pathinaramkandam
Integrated Rural Technology Centre, Palakkad 1.10
13. THEKKUMTHONI
District : Idukki
Panchayath : Kanjikuzhi
Head : 50 m.
Flow : Perennial
Suggested Capacity : 1MW/ 1.5MW
WGSHP - Final Report (Vol. II) Thekkumthoni
Integrated Rural Technology Centre, Palakkad 1.1
13.1 GENERAL
13.1.1 The Site
Thekkumthoni water fall is situated in the 9th ward of Kanjikkuzhi Grama Panchayath in Idukki
District. The site is a distance of 3 km from Venmani. There is a bus route from Chelachuvadu to
Venmani. Jeep services are also available in the Chelachuvadu- Venmani route from Kanjikkuzhi.
The Chelachuvadu is a main junction in Kothamangalam- Idukki route. From Venmani there is a
motorable road to Thekkumthoni site. The stream is perennial and the head available is about
50m. There is no power supply to the site. The nearest 11kV line is about 7 km from the site.
The water fall is located at 760 51' 55" E longitude and 90 57' 26" N latitude. The catchment area
measured from topo sheet is 22.25 sq. km. The falls are situated at an elevation of 360m fro
MSL, in Thekkuthoni stream which is begins at an elevation of 1192m from MSL. There is two
falls which gives a total head of 50m. The upstream side of the fall is moderate slope and it
continuous after fall also. After the fall, the stream joins the Kaliar puzha which drains to
Moovattupuzha.
13.1.2 Topography
The site is situated outside the forest area. But one side are the stream is owned by private
persons The forest is very thick. The land is having steep slope in this area. There is no
possibility of land slides in this area and the possibility of soil erosion are negligible. The bed of
the stream is rocky and boulders are available in plenty at site. The site is perennial and number
of rainy days exceeds 50% in its catchment.
13.2 FIELD INVESTIGATION
13.2.1 Reconnaissance Survey
Before starting the topographical survey we walked through the project area, which gave an
overall idea of the site and its principal features. Possible instrument stations were located for the
theodolite surveying and a topographical survey was conducted for obtaining topographical
details of the site. There is two main falls which gives a total head of 50m. The possible location
for diversion structure and power house were identified and the details were taken using
tacheometric method of surveying.
WGSHP - Final Report (Vol. II) Thekkumthoni
Integrated Rural Technology Centre, Palakkad 1.2
13.2.2 Catchment Area
Topographical survey sheets to a scale of 1:50,000 are available from the Survey of India. The
catchment of Thekkuthoni was located using the toposheet. It is shown in the Fig.No. 13.2.
From the shape it is identified as a fan shaped catchment and its area is found to be 22 25 sq.km.
The catchment area having almost moderate slope but some portions are very steep.
13.2.3 Contour Map
The survey details were plotted on a sheet of paper at a scale of 1:500. The undulations of the
site, the location of the falls and other topographical features were identified from the contour
map. The location of the weir, the alignment of the penstock and location of the power house
were also determined using this and the prepared contour map has been shown in Annexure
A.13.
13.2.4 River Flow Data
For a period of 12 months (December 97 to December 98) the water level observations were
taken in every week. A suitable location was identified on the upstream of the fall, where the
whole water is flowing through that point, cross sectional details of the point were noted for
calculating the stream discharge. We fixed a measuring gauge at this point to measure the peak
flow. Using the collected data (Table 13.1) the weekly discharge hydrograph of the site is
prepared. The graph is shown in Fig. No. 13.3.
13.2.5 Flow Duration Curve
Using weekly discharge hydro graph, percentage flow of exceedence was calculated. From this,
the flow duration curve was plotted (Fig. No. 13.4). The same curve also functions as
percentage flow of exceedence graph. This river flow data is recalculated in tabular form, giving
the corresponding energy potential in weekly and cumulative mode is given in Table 13.2. These
data are used for calculating energy potential and selection of unit sizes in section 13.4.
13.2.6 Peak Flow Determination
There are various empirical methods for calculating the maximum flood discharge. The different

WGSHP - Final Report (Vol. II) Thekkumthoni
Integrated Rural Technology Centre, Palakkad 1.3
values obtained are shown in Table 13.3 The value obtained by Dicken=s formula, which is
commonly used in western ghats region has been used for the structural design of diversion
structure.
Table 13.3
Peak Flow Determination
Parameters
Dicken=s method
Ingli=s formula
Ryve=s formula
Nawab Jung
Bahadur formula Peak flow in cumecs
266.36
478.95
79.9
717.38
13.3 SALIENT DESIGN FEATURES A detailed design of Civil, Electrical & Mechanical work has not been carried out in this report as
it does not come under the purview of the project, but a typical section of the proposed diversion
structure is given here. The stability analysis of the section and economic diameter of the
penstock was carried out as part of preliminary design. The capability and number of units, type
and specification of turbine, generator and it=s cost have been estimated, after consulting various
agencies.
13.3.1 Power Potential of the Project
The discharge corresponding to 70% exceedence is only 0.017 cubic metre per second. A
discharge of 0.017 cubic metre per second can produce only about 6 kW. However it seen that
much higher flows are available during 50% of the time. In order to tap the full potential of the
site, with a head of 50metre, the project is designed to generate higher output with lower
dependability. Moreover, hydroelectric scheme are usually used as peak load station as the
Thermal and other types of power plants are not easily shut down or start up. This site can be
designed as a peak load station which can produce 500 kW for 3 hours duration of peak load
with a dependability of 40%.

WGSHP - Final Report (Vol. II) Thekkumthoni
Integrated Rural Technology Centre, Palakkad 1.4
The output power was computed using the formula, P = 10 x Q x H x ηη
Where; P = Power output in kW
Q = Discharge in cumec
H = Head in metres
η = Efficiency taken as 0.75
For 50% exceedence P = 10 x 0.53 x 50 x 0.75 = 200 kW.
For 40% exceedence P = 10 x 1.4 x 50 x 0.75 = 525 kW
For 30% exceedence P = 10 x 1.77 x 50 x 0.75 = 665 kW
13.3.2 Energy Potential
At this site, sufficient flow is there so that we can obtain 500kW power output for 40% of the
time (146 days) which reduces to 8kW by 70% time (256 days). The energy input corresponding
to 40% time will be (40/100 * 500 * 365 * 24) = 1.75 MU. The flow after 50% time can be
utilized by providing a small pondage. The quantity of water available from 40% to 100% time is
calculated to be 4632410 m3. Energy obtained from this water is calculated to be 0.484MU MU.
Total amount of energy produced = 1.75 MU + 0.484 MU = 2.236 MU.
It may be noted that, this much amount of energy can be generated for the particular year. If
higher flows are available during any year, it will enable higher production and vice versa.
13.3.3 Pondage Requirement
From the contour map a plot of surface area Vs. elevation is drawn in Fig.No. 13.5. The areas
corresponding to each elevation is used to find the volume of water that can be stored in each
elevation and the details is shown in Table 13.4. From this information capacity elevation curve
of the pondage is prepared and is shown in Fig.No.13.6.

WGSHP - Final Report (Vol. II) Thekkumthoni
Integrated Rural Technology Centre, Palakkad 1.5
Table 13.4
Pondage Area Details Sl. No.
Elevation (m)
Area (m2)
Capacity (m3)
Energy (kWh)
1
476.50
0
0
0
2
477
97.50
24.375
3
3
478
385.00
265.625
28
4
479
1968.75
1442.50
150
5
480
3061.25
3957.60
412
6
481
3836.25
7406.25
771
7
482
4797.5
11723.00
1221
8
483
6647.50
17445.75
1817
As the terrain is suitable for storing 17450m3, it follows that, at full storage, the energy capacity
is only about 1800 kWh. If a single 1800 kW machine is installed, it can be operated for only one
hour at full capacity (during peak time). Fortunately, pondage becomes critical only during lean
months, this kid of operation practice is acceptable. Hence, a weir height of 6.5m, to create a
storage of 17450m3 is suggested.
13.4 SELECTION OF PLANT CAPACITY AND UNIT SIZE
For optimization of plant capacity, the following parameters were assumed.
Rate of return on investment - 15%
Loan repayment period - 10 years
Average O/M cost - 2.5% of capital cost
Resulting standard annual cost - 25%
(This consists of 2.5% O & M costs, 15% return on 25% equity, 15% interest on 75% loan and repayment of loan in 10 annual instalments)
Tariff (per Unit) - Rs. 2.5 and 3.0 (Two cases)
Investment cost (Rs.in Crores per MW) - Rs. 3.5 (Two cases)

WGSHP - Final Report (Vol. II) Thekkumthoni
Integrated Rural Technology Centre, Palakkad 1.6
Since manufacturers were not in a position to quote exact figures, no attempt was made to fine
tune the cost in relation to site specific conditions. Only ranges could be indicated. Each
combination of tariff and capital cost selected above, will demand a minimum annual generation
per kW installed. This can be taken to be the break even Plant Capacity Factor (PCF) for the
site under the specified conditions.
Lower the cost/MW and higher the price for energy, the larger will be the economically
viable installed capacity and the quantity of energy that can be economically extracted
from a given site.
Let the capital cost of Thekkumthoni be Rs.3.5 crores/MW. The annual rate is 25%. Let the
unit rate of tariff offered by K.S.E.B be Rs. 2.5/kWh.
If X be the number of hours of operation at full load capacity,
per Mega Watt annual cost, at the rate of 25% on investment = Rs. 3.5 Crores x 0.25
per Mega Watt revenue = 1000 kW x Rs. 2.5 x X
Equating the two, we get 3,50,00,000 x 0.2.5 = X x 1000 x 2.5
X = 3,500 hrs.
It follows that, any combination of machines, that can work at full capacity for over 3500 hours
can deliver a profit, if the overall project cost is below Rs. 3.5 crores/MW and tariff is Rs. 2.5
per kilo Watt hour.
This can be explained better in terms of Plant Capacity Factor, which is defined as the ratio of
actual amount of energy obtained to the maximum energy that can be obtained from the given
installed capacity during an year, to the actual amount of energy obtained.
In this case, for the value of X = 3500 hours, PCF = (3500 / 8760) x 100 = 40%
That is, a maximum capacity, which yields a PCF of 40% is economically viable for this site.
Similarly, break even PCF for Rs.3.0 per unit and Rs. 3.5 Crores per Mega Watt where
X=2916 hours is 33.3%

WGSHP - Final Report (Vol. II) Thekkumthoni
Integrated Rural Technology Centre, Palakkad 1.7
Now we shall check various capacities of turbine size which are suitable for this two conditions.
a. Tariff: Rs.2.5/kWh and break even PCF of 40%
For an installed capacity of 1000 kW, which corresponds to about 20% flow of exceedence
from the chart, the total energy yield is the sum of:
1000 kW x (0.20 x 8760) = 1.75 at continuous operation for 20% time of an year, and 1.8MU,
which is the cumulative energy potential from 20% to 100% time as obtained from the Chart
(Table 13.3).
Total yield = 1.75MU + 1.88MU = 3.55 MU.
The Plant Capacity Factor, corresponding to this yield is given by :
PCF = 3.55 x 10⁸ / (1000 x 8760) = 40.5 %
This PCF is equal to the break even value of 40%.
So 1000 kW will be the optimum choice for the site, if the overall project cost is below
Rs.3.5 crores/MW and tariff is Rs. 2.5 per kilo Watt hour.
b. Tariff: Rs.3.00/kWh and break even PCF of 33.3%
Similarly, for 1500 kW (for 15% flow of exceedence)
PCF = (4240000/1500 x 8760) x 100 = 32.25%
This PCF is very near to the break even value of 33%.
Similarly, 1500 kW will be the optimum choice for the site, if the overall project cost is
below Rs. 3.5 crores/MW and tariff is Rs. 3.0 per kilo Watt hour.

WGSHP - Final Report (Vol. II) Thekkumthoni
Integrated Rural Technology Centre, Palakkad 1.8
Table 13.5
Economically Viable Maximum Capacity at Different Costs and Tariff
Tariff
Unit size for
Rs.3.5 Crores/MW
Rs.2.5/Unit
1000 kW
Rs.3.00/ Unit
1500 kW
The units selected can be one of the following combinations:
For Rs.3.5 Crores/MW and Rs.2.5/Unit we can opt (0.5MW x 2)
For Rs.3.5 Crores/MW and Rs.3.0/Unit we can opt (1MW x 1 + 0.5 MW x 1).
Among these two categories, the second one seems to be less viable since it is bulky with units.
We have restricted ourselves to the more realistic combination of Rs.3.5 Crores/MW of
investment cost and two tariff choices of Rs. 2.5/Unit and Rs. 3.0/Unit.
13.5 CIVIL ENGINEERING WORKS
The important Civil Engineering Works required for the project are a weir, an intake structure, a
penstock and a power house. A weir is constructed to have a small storage and to divert the
water from stream to the intake. For this project an overflow weir is to be constructed, which
allows the excess water to flow over the weir to the downstream. The intake structure takes
water from the weir and leads it to the penstock. The penstock is a pressure pipe which carries
water to the turbine. The penstock made of steel is proposed in this site. A power house is
constructed for the purpose of housing the electro mechanical equipment. It is usually a small
building of 7mx 4.5m.
13.5.1 Weir at Thekkumthoni
A concrete weir has been proposed on the Thekkuthoni stream, at a bed level of +476.500
metres. The base width of the weir at bed level is 5.55m. The structure is 2m high having a
length of 1.50m at the top with a central broad crested free over fall type spil l way. The cross
sectional details of the proposed diversion site is shown in Fig. No. 13.7.

WGSHP - Final Report (Vol. II) Thekkumthoni
Integrated Rural Technology Centre, Palakkad 1.9
13.5.2 Intake Structure, Penstock and Power House
A simple box type, direct intake structure of reinforced cement concrete is provided on the
stream bed. A trash rack is provided at the intake mouth, the penstock entrance starts from the
wall of intake box near the structure. The economic diameter of the penstock is calculated as
1.14m. The penstock is designed for a maximum flow of 2.67 cumec with a velocity of 1.38
metre per second. The possible alignment for the penstock is located on the right bank of the
stream. The longitudinal section of the proposed penstock line was drawn from the contour map
and the length was calculated, which came to 216m (Fig. No. 13.8).
13.6 ELECTRICAL AND MECHANICAL EQUIPMENTS
The power house proposed in the scheme will have an installed capacity of 1000kW. The
electricity generated would be connected to the existing power grid system at Kanjikkuzhi by a
300m transmission line. A standardised turbine for 50m gross head is proposed for this particular
site. The turbine shall be complete with governor, control equipment and safety devices. The
generator would be synchronous with a brushless excitation system shall be rated to generate
1000kW, 11kV three phases, 50Hz and shall be suitable for coupling with turbine described
above. The generator shall have voltage regulation equipment, parallel operation equipment etc.
13.7 ENVIRONMENTAL IMPACTS
A small hydro project has been proposed at Thekkumthoni (Idukki Dist). The project aims to
generates about 1000 kW of hydro power from a fall having a head of 50 m. Some preliminary
environmental impact analysis have been carried out. They are land, water and socio-economical
environmental impacts.
13.7.1 Environmental Impact on Land
The catchment area measured from topo sheet comes to be 22.25 sq. km. The falls are situated
in Thekkuthoni stream. There is two falls which gives a total head of 50m. The upstream side of
the fall is moderate slope and it continuous after fall also. After the fall, the stream joins to the
Kaliar puzha which drains to Moovattupuzha.

WGSHP - Final Report (Vol. II) Thekkumthoni
Integrated Rural Technology Centre, Palakkad 1.10
The site is situated in forest. But one side of the stream is owned by private persons The forest is very
thick. The land is having steeply sloping in this area. There is no possibility of land slides in this area
and the possibility of soil erosion is also very less and is negligible. The bed of the stream is rocky and
boulders are available in plenty at site. The site is perennial and number of rainy days exceeds 50% in
its catchment.
The most significant thing is that, due to impoundment, no forest land will be submerged. The
construction of weir, penstock, power house, tailrace and temporary road will not take away any
forest land. So no forest clearance is required for the project.
13.7.2 Environmental Impact on Water
The Thekkumthoni stream which drains to Moovattupuzha is the stream of this fall. It is a 3rd order,
structurally controlled stream. The diversion structure will create a pond of area 0.6647ha. No forest
land will be submerged. Above all, this accounts for only 0.6647ha/MW this diversion structure which
also acts as a check dam can increase the height of water table level at the site. The impounded water
will also change soil moisture regime in adjacent forest land.
13.7.3 Socio-economic Impact
The construction phase would create employment opportunities for a period of 18 months. The peak
labour strength is 100 skilled and 50 unskilled labour. It requires only minimum land acquisition for
construction. The acquisition does not need any rehabilitation.
13.8 CONCLUSION
The environmental impact of the small hydel project is negligible. No serious adverse impact is
anticipated. Moreover, deforestation owing to the inundation will be a meagre area.
The economic size of installed capacity depends upon the permissible tariff as well as the capital cost.
It was found that the project is financially viable for an installed capacity of 1000kW at a project cost
of Rs. 3.5 Crores per MW and a tariff rate of Rs.2.5 per unit of electricity. Alternatively, if the tariff is
raised to Rs.3.00 per unit, an installed capacity of 1500kW would become economically viable.
Cost effective methods of construction, like the use of gabion weirs, can be used to reduce the capital
costs. A methodology for implementing the project with a maximum of peoples= participation should
also be devised. The role of the Grama Panchayat in this effort is crucial.
-��-

WGSHP - Final Report (Vol. II) Thekkumthoni
Integrated Rural Technology Centre, Palakkad 1.11
14. CHENGARA
District : Pathanamthitta
Panchayath : Konni
Head : 50 m.
Flow : Seasonal
Suggested Capacity : 90 kW/ 100 kW

WGSHP - Final Report (Vol. II) Chengara
Integrated Rural Technology Centre, Palakkad 1.1
14.1 GENERAL
14.1.1 The site
The Chengara water fall is situated in the 10th ward of Konni Grama Panchayath in
Pathanamthitta district. The site is at a distance of 10 km from Pathanamthitta. There is bus
service from Pathanamthitta to Chengara occasionally. The site is only about 400m from
Chengara junction. We can reach there by walking 400 m. through a rubber plantation. The
plantation is owned by R.P.G. Enterprises, Harrisons Malayalam Ltd. The nearest 11kV
transformer is about 0.50km from the site.
The water fall is located at 760 40' 47" E longitude and 90 16' 18" N latitude. The catchment
area measured from topo sheet is 0.88 sq. km. The falls are situated at an elevation of 60 m
above MSL in Chengarathodu which is beginning at an elevation of 160m. above MSL. After
the fall, the stream joins the Achankovil Aar. The location map of the site is shown in Fig
No.14.1.
14.1.2 Topography
The site is situated in private land is having medium slopes in this area. The possibility for land
slide and chances of soil erosion are negligible. The bed of the stream is rocky in this area and
the boulders are available near the site. The number of rainy days exceeds 50% on its
catchment.
14.2 FIELD INVESTIGATION
14.2.1 Reconnaissance survey
A topographical survey was conducted for obtaining topographical details of the site. There is
one main fall which gives a total head of 50m. The possible location for diversion structure and
power house were identified and the details were taken using tacheometric method of surveying.
14.2.2 Catchment area
Topographical survey sheets to a scale of 1:50,000 are available from the Survey of India. The
WGSHP - Final Report (Vol. II) Chengara
Integrated Rural Technology Centre, Palakkad 1.2
catchment of Chengara was located using the toposheet. It is shown in the Fig.No.14.2 and the area found to be 0.88 sq.km. The catchment area is having almost moderate slope but some portions are very steep.
14.2.3 Contour map
The survey details were plotted on a sheet of paper at a scale of 1:200. The undulations of the site, the location of the falls and other topographical features were identified from the contour map. The location of the weir, the alignment of the penstock and location of the power house were also determined using this and the prepared contour map has been shown in Annexure A.14.
14.2.4 River flow data
For a period of 12 months (February 1998 to February 1999) the water level observations
were taken in every week. A suitable location was identified on the upstream of the fall, where
the whole water is flowing through that point, cross sectional details of the point were noted for
calculating the stream discharge . We fixed a measuring gauge at that point to measure the peak
flow. Using the collected data (Table 14.1) the weekly discharge hydrograph of the site was
prepared. The graph is shown in Fig. No. 14.3.
14.2.5 Flow duration curve
Using weekly discharge hydro graph, percentage flow of exceedence was calculated. From
this, the flow duration curve was plotted (Fig. No. 14.4). The same curve also functions as
percentage flow of exceedence graph. This river flow data is recalculated in tabular form, giving
the corresponding energy potential in weekly and cumulative mode is given in Table 14.2.
These data are used for calculating energy potential and selection of unit sizes in section 14.4.
14.2.6 Peak flow determination
There are various empirical methods for calculating the maximum flood discharge. The different
values obtained are shown in Table 14.3 The value obtained by Dicken=s formula, which is
commonly used in western ghats region has bee used for the structural design.
Table 14.3
Peak Flow Determination Parameters
Dicken=s
Ingli=s
Ryve=s
Nawab Jung

WGSHP - Final Report (Vol. II) Chengara
Integrated Rural Technology Centre, Palakkad 1.3
method formula formula Bahadur formula Peak flow in
cumecs
23.52
32.05
9.24
47.67
14.3 SALIENT DESIGN FEATURES
A detailed design of Civil, Electrical, and Mechanical work has not been carried out in this report as it does not come under the purview of the project, but a typical section of the proposed diversion structure is given here. The stability analysis of the section and economic diameter of the penstock was carried out as part of preliminary design. The capability and number of units, type and specification of turbine, generator and it=s cost have been estimated, after consulting various agencies.
14.3.1 Power potential of the project
The discharge corresponding to 60% exceedence is only 0.008cubic metre per second. A
discharge of 0.008 cubic metre per second can produce only about 3kW. In order to tap the
full potential of the site, with a head of 50metre, the project can be designed to generate higher
output with lower dependability. This site is designed as a peak load station which can produce
50kW with a dependability of 40%.
The output power was computed using the formula, P = 10 x Q x H x ηη
Where; P = Power output in kW
Q = Discharge in cumec
H = Head in metres
η = Efficiency taken as 0.75
For 50% exceedence P = 10 x 0.07 x 50 x 0.75 = 26 kW.
For 40% exceedence P = 10 x 0.16 x 50 x 0.75 = 60 kW.
For 30% exceedence P = 10 x 0.2 x 50 x 0.75 = 75 kW.
14.3.2 Energy potential
At this site, sufficient flow is there so that we can obtain 50kW power output for 40% of the

WGSHP - Final Report (Vol. II) Chengara
Integrated Rural Technology Centre, Palakkad 1.5
time (146 days) which reduces to 3kW by 60% time (219 days). The energy input
corresponding to 40% time will be (40/100 * 50 * 365 * 24) = 0.175 MU. The flow after
50% time can be utilized by providing a small pondage. The quantity of water available from
40% to 100% time is calculated to be 414015m3. Energy obtained from this water is calculated
to be 0.0858 MU.
Total amount of energy produced = 0.175 MU + 0.0858 MU = 0.261 MU.
It may be noted that, this much amount of energy can generated for the particular year. If higher
flows are available during any year, it will enable higher production and vice versa.
14.3.3 Pondage requirement
From the contour map a plot of surface area Vs. elevation is drawn in Fig.No. 14.5. The areas
corresponding to each elevation is used to find the volume of water that can be stored in each
elevation and the details are shown in Table 14.4. From this information a capacity elevation
curve of the pondage is prepared and is shown in Fig.No.14.6.
Table 14.4
Pondage Area Details Sl. No.
Elevation (m)
Area (m2)
Capacity (m3)
Energy (kWh)
1
199
0
0
2
200
58.20
29.10
3
3
201
330.48
484.44
50
4
202
586.64
943.00
98
5
203
963.38
1718.01
179
6
204
1464.80
2832.10
295

WGSHP - Final Report (Vol. II) Chengara
Integrated Rural Technology Centre, Palakkad 1.6
As the terrain is suitable for storing 2830m3, it follows that, at full storage, the energy capacity is
only about 300 kWh. If a single 300 kW machine is installed, it can be operated for only one
hour at full capacity (during peak time). Fortunately, pondage becomes critical only during lean
months, this kid of operation practice is acceptable. Hence, a weir height of 5m, to create a
storage of 2830m3 is suggested.
14.4 SELECTION OF PLANT CAPACITY AND UNIT SIZE
For optimization of plant capacity, the following parameters were assumed.
Rate of return on investment - 15%
Loan repayment period - 10 years
Average O/M cost - 2.5% of capital cost
Resulting standard annual cost - 25%
(This consists of 2.5% O & M costs, 15% return on 25% equity, 15% interest on 75% loan and
repayment of loan in 10 annual instalments)
Tariff (per Unit) - Rs. 2.5 and 3.0 (Two cases)
Investment cost (Rs.in Crores per MW) - Rs. 3.5 (Two cases)
Since manufacturers were not in a position to quote exact figures, no attempt was made to fine tune
the cost in relation to site specific conditions. Only ranges could be indicated. Each combination
of tariff and capital cost selected above, will demand a minimum annual generation per kW
installed. This can be taken to be the break even plant capacity factor (PCF) for the site under the
specified conditions.
Lower the cost/MW and higher the price for energy, the larger will be the economically
viable installed capacity and the quantity of energy that can be economically extracted from
a given site.
Let the capital cost of Chengara be Rs.3.5 crores/MW. The annual rate is 25%. Let the unit rate
of tariff offered by K.S.E.B be Rs. 2.5/kWh.

WGSHP - Final Report (Vol. II) Chengara
Integrated Rural Technology Centre, Palakkad 1.7
If X be the number of hours of operation at full load capacity,
per Mega Watt annual cost, at the rate of 25% on investment = Rs. 3.5 Crores x 0.25
per Mega Watt revenue = 1000 kW x Rs. 2.5 x X
Equating the two, we get 3,50,00,000 x 0.2.5 = X x 1000 x 2.5
X = 3,500 hrs.
It follows that, any combination of machines, that can work at full capacity for over 3500 hours
can deliver a profit, if the overall project cost is below Rs. 3.5 crores/MW and tariff is Rs. 2.5
per kilo Watt hour.
This can be explained better in terms of Plant Capacity Factor, which is defined as the ratio of
actual amount of energy obtained to the maximum energy that can be obtained from the given
installed capacity during an year, to the actual amount of energy obtained.
In this case, for the value of X = 3500 hours, PCF = (3500 / 8760) x 100 = 40%
That is, a maximum capacity, which yields a PCF of 40% is economically viable for this site.
Similarly, break even PCF for Rs.3/ unit and Rs. 3.5 Crores per Mega Watt where X=2916
hours is 33.3%
Now we shall check various capacities of turbine size which are suitable for this two conditions.
a. Tariff: Rs.2.50/kWh and break even PCF of 40%
For an installed capacity of 90 kW, which corresponds to about 11% flow of exceedence from
the chart, the total energy yield is the sum of:
90 kW x (0.11 x 8760) = 0.0867 at continuous operation for 11% time of an year, and
0.25MU, which is the cumulative energy potential from 11% to 100% time as obtained from the
Chart (Table 14.3).
Total yield = 0.087MU + 0.25MU = 0.332 MU.

WGSHP - Final Report (Vol. II) Chengara
Integrated Rural Technology Centre, Palakkad 1.8
The Plant Capacity Factor, corresponding to this yield is given by :
PCF = 0.332 x 10⁸/(90 x 8760) = 42.11 %
This PCF is equal to the break even value of 40%.
So 90 kW will be the optimum choice for the site, if the overall project cost is below
Rs.3.5 crores/MW and tariff is Rs. 2.5 per kilo Watt hour.
b. Tariff: Rs.3.0/kWh and break even PCF of 33.3%
Similarly, for 100kW (for 2% flow of exceedence)
PCF = (340000 / 100 x 8760) x 100 = 36.96%
This PCF is not near to the break even value of 33%.
Similarly, 100 kW will be the optimum choice for the site, if the overall project cost is
below Rs. 3.5 crores/MW and tariff is Rs. 3.0 per kilo Watt hour.
Table 14.5
Economically Viable Maximum Capacity at Different Costs and Tariff
Tariff
Unit size for
Rs.3.5 Crores/MW
Rs.2.5/Unit
90 kW
Rs.3.00/ Unit
100 kW
The units selected can be one of the following combinations:
For Rs.3.5 Crores/MW and Rs.2.5/Unit we can opt (0.05MW x 2 )
For Rs.3.5 Crores/MW and Rs.3.0/Unit we can opt ( 0.05 MW x 2)
Among these two categories, the second one seems to be less viable since it is bulky with units.
We have restricted ourselves to the more realistic combination of Rs.3.5 Crores/MW of
investment cost and two tariff choices of Rs. 2.5/Unit and Rs. 3.0/Unit.

WGSHP - Final Report (Vol. II) Chengara
Integrated Rural Technology Centre, Palakkad 1.9
14.5 CIVIL ENGINEERING WORKS
The important Civil Engineering Works required for the project are a weir, an intake structure, a
penstock and a power house. A weir is constructed to have a small storage and to divert the
water from stream to the intake. For this project an overflow weir is to be constructed, which
allows the excess water to flow over the weir to the downstream. The intake structure takes
water from the weir and leads it to the penstock. The penstock made of steel is proposed in this
site. A power house is constructed for the purpose of housing the electro mechanical
equipment. It is usually a small building of one or two rooms.
14.5.1 Weir at Chengara
A gabion weir has been proposed on the Chengara stream, at a bed level of +199.100
metres. The base width of the weir at bed level is 2.65 m. The structure is 5m high having a
length of 22.50m at the top with a central broad crested free over fall type spill way. The
cross sectional details of the proposed diversion site and typical section are shown in Fig.No.
14.7.
14.5.2 Intake Structure, Penstock and Power house
A simple box type, direct intake structure of reinforced cement concrete is provided on the
stream bed. A trash rack is provided at the intake mouth, the penstock entrance starts from
the wall of intake box near the structure. The economic diameter of the penstock is calculated
as 0.41m. The penstock is designed for a maximum flow of 0.24 cumec with a velocity of
1.82 metre per second. The possible alignment for the penstock is located on the left bank of
the stream. The longitudinal section of the proposed penstock line was drawn from the
contour map and the length was calculated which came to 154m (Fig. No. 14.8). A surface
power house is proposed on the left bank of the stream. The slope at the proposed site is
moderate but increases up the hill towards north east direction. The power house is of size
5m*4m, to accommodate 90kW, generator and standardised turbine.
14.6 ELECTRICAL AND MECHANICAL EQUIPMENTS The power house proposed in the scheme will have an installed capacity of 90 kW. A
standardised turbine for 50m gross head is proposed for this particular site. The turbine shall be
complete with governor, control equipment and safety devices. The generator would be
synchronous with a brushless excitation system shall be rated to generate 90 kW, 11kV three

WGSHP - Final Report (Vol. II) Chengara
Integrated Rural Technology Centre, Palakkad 1.10
phases, 50Hz and shall be suitable for coupling with turbine described above. The generator
shall have voltage regulation equipment, parallel operation equipment etc.
14.7 ENVIRONMENTAL IMPACTS A small hydro project has been proposed at Chengara (Pathanamthitta Dist). The project aims to
generates about 90kW of hydro power from a fall having a gross head of 50 m. Some
preliminary environmental impact analysis have been carried out. They are land, water and socio-
economical environmental impacts.
14.7.1 Environmental impact on land
Total area of catchment is about 0.88 square kilometres of land at Chengarathodu. The site is
situated in private land owned by Harrison Malayalam Ltd. and is having medium slopes in this
area. The possibility for land slide and chances of soil erosion are negligible. The bed of the
stream is rocky in this area and the boulders are l available near the site. The number of rainy
days exceeds 50% on its catchment. After the fall, the stream joins to the Achankovil Aar near
to Konni.
The most significant thing is that, due to impoundment, no forest land will be submerged. The
construction of weir, penstock, power house, tailrace and temporary road will not take away
any forest land. So no forest clearance is required for the project.
14.7.2 Environmental impact on water

WGSHP - Final Report (Vol. II) Chengara
Integrated Rural Technology Centre, Palakkad 1.11
The Chengarathodu which joins Achankovil Aar is the stream of this fall. It is a 3rd order, structurally
controlled stream. The diversion structure will create a water spread area of 0.1465 hectare. No
forest land will be submerged. Above all, this accounts for only 1.63ha/MW. This diversion structure
which also acts as a check dam can increase the height of water table level at the site. The impounded
water will also change soil moisture regime in adjacent forest land.
14.7.3 Socio-economic impact
The construction phase would create employment opportunities for a period of nearly 12 months. It
requires only minimum land acquisition for construction. The acquisition does not need any
rehabilitation.
14.8 CONCLUSION
The environmental impact of the small hydel project is negligible. No serious adverse impact is
anticipated. Moreover, deforestation owing to the inundation will be a merge area.
The economic size of installed capacity depends upon the permissible tariff as well as the capital cost.
It was found that the project is financially viable for an installed capacity of 90kW at a project cost of
Rs. 3.5 Crores per MW and a tariff rate of Rs.2.5 per unit of electricity. Alternatively, if the tariff is
raised to Rs.3.00 per unit, an installed capacity of 100kW would become economically viable.
Cost effective methods of construction, like the use of gabion weirs, can be used to reduce the capital
costs. A methodology for implementing the project with a maximum of peoples= participation should
also be devised. The role of the Grama Panchayath in this effort is crucial
-��-

WGSHP - Final Report (Vol. II) Chengara
Integrated Rural Technology Centre, Palakkad 1.12
15. MURIKKASSERI
District :Idukki
Panchayath :Vathikkudi
Head : 50 m.
Flow : Perennial
Suggested Capacity : 550 kW/ 650 kW
WGSHP - Final Report (Vol. II) Murikkasseri
Integrated Rural Technology Centre, Palakkad 1.1
15.1 GENERAL
15.1.1 The Site
Idukki District is blessed with a number of waterfalls. Most of them are promising sites for small
hydel programme. Murikkassery water fall is a good one in 3rd ward of Vathikkudi Grama
Panchayath in Idukki District. The site is at a distance of 1 km before Murikkassery town in the
Murikkassery - Karimban route. Bus service as well as jeep services are available from
Karimban to Murikkassery. The stream is perennial and it is situated outside the forest. The
head available is about 50m.
The water fall is located at 770 0' 13" E longitude and 9 0 54' 19" N latitude. The catchment area
measured from toposheet is 12 sq. km. . The falls are situated at an elevation of 680m from Mean
Sea Level (MSL) in Murikkasseri stream which is beginning at an elevation of 900m. This is one
of the main falls in the stream. The upstream side of fall has gentle slope and it continues after
t`he fall also. There is another fall on the downstream side which is known as
Pathinaramkandom. There is a culvert on the upstream side of the fall. After the fall, the stream
joins the Periyar river (Fig.15.1)
15.1.2 Topography of the Site
From the topography it is inferred that the site is s ituated in private land. The land is having gentle
slope in this area. The possibility of soil erosion are negligible. The bed of the stream is rocky
and boulders are available in plenty at the site. The flow get through out the year. The site is
perennial and number of rainy days exceeds 50% in its catchment.
15.2 FIELD INVESTIGATION
15.2.1 Reconnaissance Survey
A topographical survey was conducted for obtaining topographical details of the site. There is
one main fall which gives a total head of 50m. The possible location for diversion structure and
power house were identified. The details were taken using tacheometric method of surveying.
15.2.2 Catchment Area
Topographical survey sheets to a scale of 1:50,000 are available from the Survey of India . The
WGSHP - Final Report (Vol. II) Murikkasseri
Integrated Rural Technology Centre, Palakkad 1.2
catchment of Murikkasseri was located using the toposheet. It is shown in the Fig.No.15.2.
From the shape its catchment is identified as fan shaped and its area was found to be 12 sq.km.
The catchment area is having an almost moderate slope but some portions are very steep.
15.2.3 Contour Map
The survey details were plotted on a sheet of paper at a scale of 1:200. The undulations of the
site, the location of the falls and other topographical features were identified from the contour
map. The location of the weir, the alignment of the penstock and location of the power house
were also determined using this and the prepared contour map has been shown in Annexure
A.15.
15.2.4 River Flow Data
The water level observations were taken every week for a period of 12 months (January 98 to
January 99). A suitable location was identified on the upstream of the fall, where the whole water
is flowing through that point. Cross sectional details of the point were noted for calculating the
stream discharge. We fixed a measuring gauge at that point to measure the peak flow. Using the
collected data (Table 15.1) the weekly discharge hydrograph of the site was prepared. The
graph is shown in Fig. No. 15.3.
15.2.5 Flow Duration Curve
Using weekly discharge hydro graph, percentage flow of exceedence was calculated. From this,
the flow duration curve was plotted (Fig. No. 15.4). The same curve also functions as
percentage flow of exceedence graph. This river flow data is recalculated in tabular form, giving
the corresponding energy potential in weekly and cumulative mode is given in Table 15.2. These
data are used for calculating energy potential and selection of unit sizes in section 15.4.
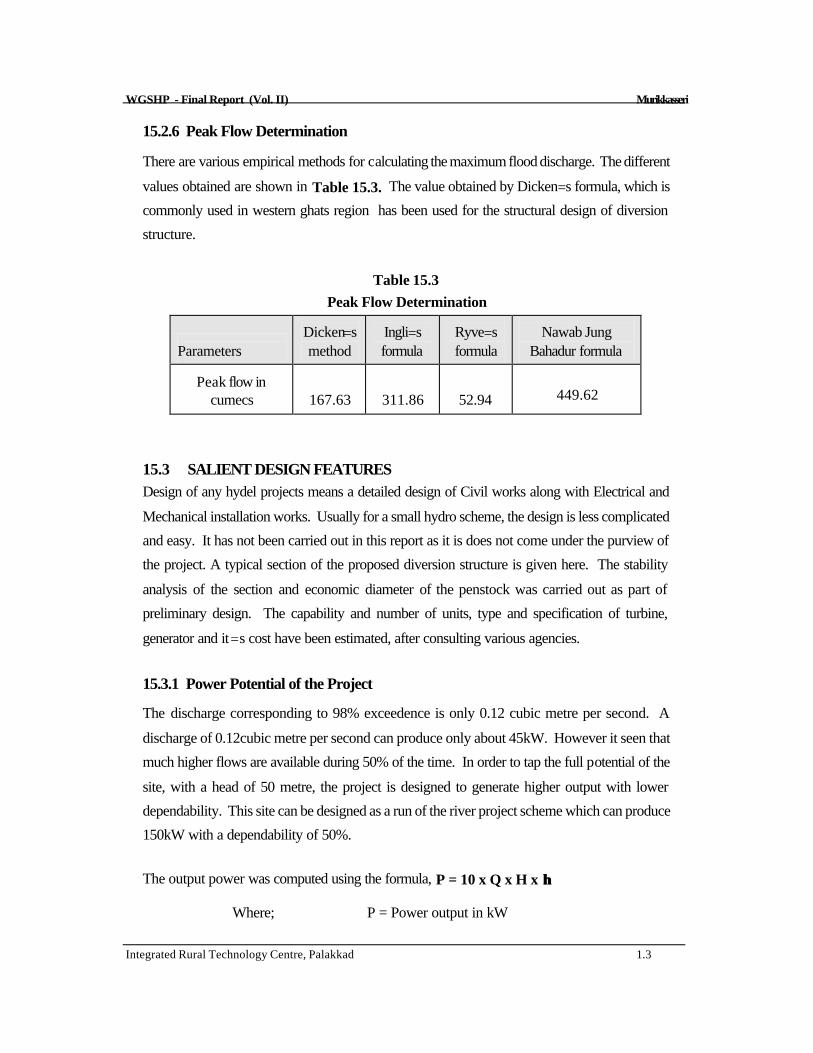
WGSHP - Final Report (Vol. II) Murikkasseri
Integrated Rural Technology Centre, Palakkad 1.3
15.2.6 Peak Flow Determination
There are various empirical methods for calculating the maximum flood discharge. The different
values obtained are shown in Table 15.3. The value obtained by Dicken=s formula, which is
commonly used in western ghats region has been used for the structural design of diversion
structure.
Table 15.3
Peak Flow Determination
Parameters
Dicken=s method
Ingli=s formula
Ryve=s formula
Nawab Jung
Bahadur formula
Peak flow in cumecs
167.63
311.86
52.94
449.62
15.3 SALIENT DESIGN FEATURES Design of any hydel projects means a detailed design of Civil works along with Electrical and
Mechanical installation works. Usually for a small hydro scheme, the design is less complicated
and easy. It has not been carried out in this report as it is does not come under the purview of
the project. A typical section of the proposed diversion structure is given here. The stability
analysis of the section and economic diameter of the penstock was carried out as part of
preliminary design. The capability and number of units, type and specification of turbine,
generator and it=s cost have been estimated, after consulting various agencies.
15.3.1 Power Potential of the Project
The discharge corresponding to 98% exceedence is only 0.12 cubic metre per second. A
discharge of 0.12cubic metre per second can produce only about 45kW. However it seen that
much higher flows are available during 50% of the time. In order to tap the full potential of the
site, with a head of 50 metre, the project is designed to generate higher output with lower
dependability. This site can be designed as a run of the river project scheme which can produce
150kW with a dependability of 50%.
The output power was computed using the formula, P = 10 x Q x H x ηη
Where; P = Power output in kW

WGSHP - Final Report (Vol. II) Murikkasseri
Integrated Rural Technology Centre, Palakkad 1.4
Q = Discharge in cumec
H = Head in metres
η = Efficiency taken as 0.75
For 50% exceedence P = 10 x 0.45 x 50 x 0.75 = 150 kW.
For 40% exceedence P = 10 x 0.51 x 50 x 0.75 = 190 kW.
For 30% exceedence P = 10 x 0.54 x 50 x 0.75 = 200 kW.
15.3.2 Energy Potential
At this site, sufficient flow is there so that we can obtain 150kW power output for 50% of the
time (183 days) which drastically reduces to 60kW by 80% time (292 days). The energy input
corresponding to 50% time will be (50/100 * 150 * 365 * 24) / = 0.723 MU. The flow after
50% time can be utilized by providing a small pondage. The quantity of water available from 50%
to 100% time is calculated to be 3130474 m3. Energy obtained from this water is calculated to
be 0.33 MU.
Total amount of energy produced = 0.723 MU + 0.33 MU = 1.05 MU.
It may be noted that, this much amount of energy can be generated for the particular year. If
higher flows are available during any year, it will enable higher production and vice versa.
15.3.3 Pondage Requirement
The site is very near to the main road. So the storage is not feasible for the site. As the terrain is
not suitable for storage the structure proposed at this site is only for diverting water. Here we are
proposing a run of the river system without any pondage.
15.4 SELECTION OF PLANT CAPACITY AND UNIT SIZE For optimization of plant capacity, the following parameters were assumed.
Rate of return on investment - 15%
Loan repayment period - 10 years
Average O/M cost - 2.5% of capital cost
Resulting standard annual cost - 25%

WGSHP - Final Report (Vol. II) Murikkasseri
Integrated Rural Technology Centre, Palakkad 1.5
(This consists of 2.5% O & M costs, 15% return on 25% equity, 15% interest on 75% loan and repayment of loan in 10 annual instalments)
Tariff (per Unit) - Rs. 2.5 and 3.0 (Two cases)
Investment cost (Rs.in Crores per MW) - Rs. 3.5 (Two cases)
Since manufacturers were not in a position to quote exact figures, no attempt was made to fine
tune the cost in relation to site specific conditions. Only ranges could be indicated. Each
combination of tariff and capital cost selected above, will demand a minimum annual generation
per kW installed. This can be taken to be the break even Plant Capacity Factor (PCF) for the
site under the specified conditions.
Lower the cost/MW and higher the price for energy, the larger will be the economically
viable installed capacity and the quantity of energy that can be economically extracted
from a given site.
Let the capital cost of Murikkasseri be Rs.3.5 crores/MW. The annual rate is 25%. Let the unit
rate of tariff offered by K.S.E.B be Rs. 2.5/kWh.
If X be the number of hours of operation at full load capacity,
per Mega Watt annual cost, at the rate of 25% on investment = Rs. 3.5 Crores x 0.25
per Mega Watt revenue = 1000 kW x Rs. 2.5 x X
Equating the two, we get 3,50,00,000 x 0.2.5 = X x 1000 x 2.5
X = 3,500 hrs.
It follows that, any combination of machines, that can work at full capacity for over 3500 hours
can deliver a profit, if the overall project cost is below Rs. 3.5 crores/MW and tariff is Rs. 2.5
per kilo Watt hour.
This can be explained better in terms of Plant Capacity Factor, which is defined as the ratio of
actual amount of energy obtained to the maximum energy that can be obtained from the given
installed capacity during an year, to the actual amount of energy obtained.
In this case, for the value of X = 3500 hours, PCF = (3500 / 8760) x 100 = 40%

WGSHP - Final Report (Vol. II) Murikkasseri
Integrated Rural Technology Centre, Palakkad 1.6
That is, a maximum capacity, which yields a PCF of 40% is economically viable for this site.
Similarly, break even PCF for Rs.3.0 per unit and Rs. 3.5 Crores per Mega Watt where
X=2916 hours is 33.3%
Now we shall check various capacities of turbine size which are suitable for this two conditions.
a. Tariff: Rs.2.50/kWh and break even PCF of 40%
For an installed capacity of 550 kW, which corresponds to about 8% flow of exceedence from
the chart, the total energy yield is the sum of:
550 kW x (0.08 x 8760) = 0.3854 at continuous operation for 8% time of an year, and
1.53MU, which is the cumulative energy potential from 8% to 100% time as obtained from the
Chart (Table 15.3).
Total yield = 1.53MU + 0.3854MU = 1.92 MU.
The Plant Capacity Factor, corresponding to this yield is given by :
PCF = 1.92 x 10⁸ / (550 x 8760) = 40 %
This PCF is equal to the break even value of 40%.
So 550 kW will be the optimum choice for the site, if the overall project cost is below
Rs.3.5 crores/MW and tariff is Rs. 2.5 per kilo Watt hour.
b. Tariff: Rs.3.0/kWh and break even PCF of 33.3%
Similarly, for 650 kW (for 4% flow of exceedence)
PCF = (1950000/650 x 8760) x 100 = 34.25%
This PCF is very near to the break even value of 33%.
Similarly, 650 kW will be the optimum choice for the site, if the overall project cost is
below Rs. 3.5 crores/MW and tariff is Rs. 3.0 per kilo Watt hour.

WGSHP - Final Report (Vol. II) Murikkasseri
Integrated Rural Technology Centre, Palakkad 1.7
Table 15.5
Economically Viable Maximum Capacity at Different Costs and Tariff
Tariff
Unit size for Rs.3.5
Crores/MW
Rs.2.5/Unit
550 kW
Rs.3.00/ Unit
650 kW
The units selected can be one of the following combinations:
For Rs.3.5 Crores/MW and Rs.2.5/Unit we can opt (0.5MW x 1 + 0.05 MW x 1)
For Rs.3.5 Crores/MW and Rs.3.0/Unit we can opt ( 0.5 MW x 1 + 0.1MW x 1 + 0.05 x1)
Among these two categories, the second one seems to be less viable since it is bulky with units.
We have restricted ourselves to the more realistic combination of Rs. 3.5 Crores/MW of
investment cost and two tariff choices of Rs.2.5/Unit and Rs. 3.0/Unit.
15.5 CIVIL ENGINEERING WORKS
The important structures required for the project are a diversion weir, an intake structure, a
penstock and a power house. A weir is constructed to have a small storage and to divert the
water from stream to the intake. For this project only a diversion weir is proposed, which allows
the excess water to flow over the weir to the downstream. The intake structure takes water from
the weir and leads it to the penstock. A penstock made of steel is proposed in this site. A power
house is constructed for the purpose of housing the electro mechanical equipment. It is usually a
small building of 12.5m x 6.5m.
15.5.1 Weir at Murikkasseri
A concrete weir has been proposed at the Murikkasseri stream, at a bed level of +697.500
metres. The base width of the weir at bed level is 5.55m. The structure is 2.00m high having a
length of 5m at the top with a central broad crested free over fall type spill way. The cross
sectional details of the proposed diversion site is shown in Fig.No. 15.6.
15.5.2 Intake Structure, Penstock and Power House

WGSHP - Final Report (Vol. II) Murikkasseri
Integrated Rural Technology Centre, Palakkad 1.8
A simple box type, direct intake structure of reinforced cement concrete is provided on the
stream bed. A trash rack is provided at the intake mouth, the penstock entrance starts from the
wall of intake box near the gabion. The economic diameter of the penstock is calculated as
0.65m and the thickness of the penstock is found as 6 mm. The penstock can withstand a
maximum flow of 0.46 cumec with a velocity of 1.39 metres per second. The possible alignment
for the penstock can be made on the left bank of the stream. The longitudinal section of the
proposed penstock line was drawn from the contour map and the length was calculated, which
came to around 147m (Fig. No. 15.7).
A surface power house is proposed on the left bank of stream. The slope at the proposed site is
moderate increasing upwards in the east direction. The power house is of size 12.5m* 6.5 m to
accommodate one 550 kW generator and standardised turbine.
15.6 ELECTRICAL AND MECHANICAL EQUIPMENTS The power house proposed in the scheme will have an installed capacity of 550 kW. The
electricity generated would be connected to the existing power grid system at Murikkassery by a
500m transmission line. A standardised turbine for 50m gross head is proposed for this particular
site. The turbine shall be complete with governor, control equipment and safety devices. The
generator would be synchronous with a brushless excitation system and shall be rated to generate
550kW, 11kV three phases with a frequency of 50Hz and shall be suitable for coupling with
turbine as described above. The generator shall have voltage regulation equipment, parallel
operation equipment etc.

WGSHP - Final Report (Vol. II) Murikkasseri
Integrated Rural Technology Centre, Palakkad 1.9
15.7 ENVIRONMENTAL IMPACTS A small hydro project has been proposed at Murikkasseri (Idukki Dist). The project aims to
generates about 550 kW of hydro power from a fall having a head of 50 m. Some preliminary
environmental impact analysis have been carried out. They are land, water and socio-economical
environmental impacts.
15.7.1 Environmental Impact on Land
The catchment area measured from toposheet comes to be 12 sq. km. . The falls are situated in
Murikkasseri stream. This is one of the main falls in the stream. The upstream side of fall has gentle
slope and it continues after t`he fall also. There is another fall on the downstream side which is known
as Pathinaramkandom. There is a culvert on the upstream side of the fall. After the fall, the stream
joins to the Periyar river.
The most significant thing is that, due to impoundment, no forest land will be submerged. The
construction of weir, penstock, power house, tailrace and temporary road will not take away any
forest land. So no forest clearance is required for the project.
15.7.2 Environmental Impact on Water
The Murikkasseri stream which drains to Periyar river is the stream of this fall. It is a 3rd order,
structurally controlled stream. The diversion structure will create a pond of area 1.0125 hectare. No
forest land will be submerged. Above all, this accounts for only 0.34ha/MW. This diversion structure
which also acts as a check dam can increase the height of water table level at the site. The impounded
water will also change soil moisture regime in adjacent forest land.
15.7.3 Socio-economic Impact
The construction phase would create employment opportunities for a period of 18 months. The peak
labour strength is 50 skilled and 25 unskilled labour. It require only minimum land acquisition for
construction. The acquisition does not need any rehabilitation.
15.8 CONCLUSION The environmental impact of small hydel project is negligible. No serious adverse impact is

WGSHP - Final Report (Vol. II) Murikkasseri
Integrated Rural Technology Centre, Palakkad 1.10
anticipated. Moreover, deforestation owing to the inundation will be a meagre area.
The economic size of installed capacity depends upon the permissible tariff as well as the capital cost.
It was found that the project is financially viable for an installed capacity of 550kW at a project cost
of Rs. 3.5 Crores per MW and a tariff rate of Rs.2.5 per unit of electricity. Alternatively, if the tariff is
raised to Rs.3.00 per unit, an installed capacity of 650kW would become economically viable.
Cost effective methods of construction, like the use of gabion weirs, can be used to reduce the capital
costs. A methodology for implementing the project with a maximum of peoples= participation should
also be devised. The role of the Grama Panchayat in this effort is crucial.
-��-
16. MANPILAVU
District : Pathanamthitta
Panchayath : Chittar

WGSHP - Final Report (Vol. II) Murikkasseri
Integrated Rural Technology Centre, Palakkad 1.11
Head : 50 m.
Flow : Seasonal
Suggested Capacity : 250 kW/ 400 kW

WGSHP - Final Report (Vol. II) Manpilavu
Integrated Rural Technology Centre, Palakkad 1.1
16.1 GENERAL
16.1.1 The site
Monpilavu water fall is situated in the 6th ward of Chittar Grama Panchayath in Pathanamthitta
District. The site is at a distance of 10km from Chittar. There is a bus route from Chittar to
Vyattupuzha. From there jeep service are available to Monpilavu. Jeep service will get from
Chittar also. The fall is 100m away from main road. The 11 kV transformer is about 1 km from
site.
The water fall is located at 760 56' 47" E longitude and 90 17' 57" N latitude. The catchment area
measured from toposheet is 3.25 sq. km. The falls are situated at an elevation of 200m from
MSL, in Meenthalaruvi stream which is begins at an elevation of 700m from MSL. The stream
flows through steeply sloping on the upstream side of the fall and it contains two falls. After that
the stream is flowing through gentle slope. After the fall, the stream joins the Pampa river
(Fig.16.1)
16.1.2 Topography
The site is situated in Chittar reserved forest. But one side of the fall is owned by private
persons. The forest is very thick. The land is having moderate slope in this area. There is no
possibility of land slide is very less. The chances of soil erosion are negligible. The bed of the
stream is rocky in this area. Boulders are available in plenty at site. The number of rainy days
exceeds 50% in its catchment.
16.2 FIELD INVESTIGATION
16.2.1 Reconnaissance survey
A topographical survey was conducted for obtaining topographical details of the site. There is
two straight fall which gives a total head of 50m. The possible location for diversion structure and
power house were identified and the details were taken using tacheometric method of surveying.
16.2.2 Catchment area
The survey details were plotted on a sheet of paper at a scale of 1:200. The catchment of
Manpilavu was located using the toposheet. It is shown in the Fig.No. 16.2. From the shape it
is identified as a fern shaped catchment and its area was found to be 3.50 sq. km. The catchment

WGSHP - Final Report (Vol. II) Manpilavu
Integrated Rural Technology Centre, Palakkad 1.2
area is having almost moderate slope but some portions are very steep.
16.2.3 Contour map
The survey details were plotted on a sheet of paper at a scale of 1:200. The undulations of the
site, the location of the falls and other topographical features were identified from the contour
map. The location of the weir, the alignment of the penstock and location of the power house
were also determined using this and the prepared contour map has been shown in Annexure
A.16.
16.2.4 River flow data
For a period of 12 months (March 98 to March 99) the water level observations were taken
every week. A suitable location was identified on the upstream of the fall, where the whole water
is flowing through that point, cross sectional details of the point were noted for calculating the
stream discharge. We fixed a measuring gauge at that point to measure the peak flow. Using the
collected data (Table 16.1) the weekly discharge hydrograph of the site is prepared. The graph
is shown in Fig. No. 16.3.
16.2.5 Flow duration curve
Using weekly discharge hydro graph, percentage flow of exceedence was calculated. From this,
the flow duration curve was plotted (Fig. No. 16.4). The same curve also functions as
percentage flow of exceedence graph. This river flow data is recalculated in tabular form, giving
the corrosponding energy potential in weekly and cumulative mode is given in Table 16.2. These
data are used for calculating energy potential and selection of unit sizes in section 16.4.
16.2.6 Peak flow determination
There are various empirical methods for calculating the maximum flood discharge. The different
values obtained are shown in Table 16.3. The value obtained by Dicken=s formula, which is
commonly used in western ghats region has been used for the structural design of diversion
structure.
Table 16.3

WGSHP - Final Report (Vol. II) Manpilavu
Integrated Rural Technology Centre, Palakkad 1.3
Peak Flow Determination
Parameters
Dicken=s method
Ingli=s formula
Ryve=s formula
Nawab Jung
Bahadur formula Peak flow in
cumecs
62.93
108.20
22.16
154.79
16.3 SALIENT DESIGN FEATURES A detailed design of Civil, Electrical, and Mechanical work has not been carried out in this report
as it does not come under the purview of the project, but a typical section of the proposed
diversion structure is given here. The stability analysis of the section and economic diameter of
the penstock was carried out as part of preliminary design. The capability and number of units,
type and specification of turbine, generator and it=s cost have been estimated, after consulting
various agencies.
16.3.1 Power potential of the project
The discharge corresponding to 76% exceedence is only 0.002 cubic metre per second. A
discharge of 0.002cubic metre per second can produce only about 2 kW. However it seen that
much higher flows are available during 50% of the time. In order to tap the full potential of the
site, with a head of 50metre, the project is designed to generate higher output with lower
dependability. This site can be designed as a peak load station which can produce 60 kW with
a dependability of 50%.
The output power was computed using the formula, P = 10 x Q x H x ηη
Where; P = Power output in kW
Q = Discharge in cumec
H = Head in metres
η = Efficiency taken as 0.75
For 50% exceedence P = 10 x 0.167 x 50 x 0.75 = 60 kW.
For 40% exceedence P = 10 x 0.24 x 50 x 0.75 = 90 kW.
For 30% exceedence P = 10 x 0.39 x 50 x 0.75 = 145 kW.

WGSHP - Final Report (Vol. II) Manpilavu
Integrated Rural Technology Centre, Palakkad 1.5
16.3.2 Energy potential
At this site, sufficient flow is there so that we can obtain 100kW power output for 35% of the
time (128 days) which reduces to 8kW by 70% time (256 days). The energy input corresponding
to 35% time will be (35/100 x 100 x 365 x 24) = 0.307 MU. The flow after 35% time can be
utilized by providing a small pondage. The quantity of water available from 35% to 100% time is
calculated to be 1629936 m3. Energy obtained from this water is calculated to be 0.17MU.
Total amount of energy produced = 0.307 MU + 0.17 MU = 0.477 MU.
It may be noted that, this much amount of energy can be generated for the particular year. If
higher flows are available during any year, it will enable higher production and vice versa.
16.3.3 Pondage requirement
From the contour map a plot of surface area Vs. elevation is drawn in Fig.No. 16.5. The areas
corresponding to each elevation is used to find the volume of water that can be stored in each
elevation and the details is shown in Table 16.4. From this information capacity elevation curve
of the pondage is prepared and is shown in Fig.No.16.6.
Table 16.4
Pondage Area Details Sl. No.
Elevation (m)
Area (m2)
Capacity (m3)
Energy (kWh)
1
294.5
0
0
0
2
295
3.08
0.77
0.08
3
296
15.8
10.21
1
4
297
86.4
196.01
20
5
298
183.00
196.01
20
As the terrain is suitable for storing 196m3, it follows that, at full storage, the energy capacity is
only about 20 kWh. If a single 20 kW machine is installed, it can be operated for only one hour
at full capacity (during peak time). Fortunately, pondage becomes critical only during lean

WGSHP - Final Report (Vol. II) Manpilavu
Integrated Rural Technology Centre, Palakkad 1.6
months, this kid of operation practice is acceptable. Hence, a weir height of 3.5m, to create a
storage of 196m3 is suggested.
16.4 SELECTION OF PLANT CAPACITY AND UNIT SIZES For optimization of plant capacity, the following parameters were assumed.
Rate of return on investment - 15%
Loan repayment period - 10 years
Average O/M cost - 2.5% of capital cost
Resulting standard annual cost - 25%
(This consists of 2.5% O & M costs, 15% return on 25% equity, 15% interest on 75% loan and repayment of loan in 10 annual instalments)
Tariff (per Unit) - Rs. 2.5 and 3.0 (Two cases)
Investment cost (Rs. in Crores per MW) - Rs. 3.5 (Two cases)
Since manufacturers were not in a position to quote exact figures, no attempt was made to fine
tune the cost in relation to site specific conditions. Only ranges could be indicated. Each
combination of tariff and capital cost selected above, will demand a minimum annual generation
per kW installed. This can be taken to be the break even Plant Capacity Factor (PCF) for the
site under the specified conditions.
Lower the cost/MW and higher the price for energy, the larger will be the economically
viable installed capacity and the quantity of energy that can be economically extracted
from a given site.
Let the capital cost of Manpilavu be Rs.3.5 crores/MW. The annual rate is 25%. Let the unit
rate of tariff offered by K.S.E.B be Rs. 2.5/kWh.
If X be the number of hours of operation at full load capacity,
per Mega Watt annual cost, at the rate of 25% on investment = Rs. 3.5 Crores x 0.25
per Mega Watt revenue = 1000 kW x Rs. 2.5 x X

WGSHP - Final Report (Vol. II) Manpilavu
Integrated Rural Technology Centre, Palakkad 1.7
Equating the two, we get 3,50,00,000 x 0.2.5 = X x 1000 x 2.5
X = 3,500 hrs.
It follows that, any combination of machines, that can work at full capacity for over 3500 hours
can deliver a profit, if the overall project cost is below Rs. 3.5 crores/MW and tariff is Rs. 2.5
per kilo Watt hour.
This can be explained better in terms of Plant Capacity Factor, which is defined as the ratio of
actual amount of energy obtained to the maximum energy that can be obtained from the given
installed capacity during an year, to the actual amount of energy obtained.
In this case, for the value of X = 3500 hours, PCF = (3500 / 8760) x 100 = 40%
That is, a maximum capacity, which yields a PCF of 40% is economically viable for this site.
Similarly, break even PCF for Rs.3.0 per unit and Rs. 3.5 Crores per Mega Watt where
X=2916 hours is 33.3%
Now we shall check various capacities of turbine size which are suitable for this two conditions.
a. Tariff: Rs.2.50/kWh and break even PCF of 40%
For an installed capacity of 250 kW, which corresponds to about 25% flow of exceedence from
the chart, the total energy yield is the sum of:
250 kW x (0.25 x 8760) = 0.5475 at continuous operation for 25% time of an year, and
0.314MU, which is the cumulative energy potential from 25% to 100% time as obtained from the
Chart (Table 16.3).
Total yield = 0.5475MU + 0.314MU = 0.8615MU.
The Plant Capacity Factor, corresponding to this yield is given by :
PCF = 0.8615 x 10⁸ / (250 x 8760) = 39.33 %

WGSHP - Final Report (Vol. II) Manpilavu
Integrated Rural Technology Centre, Palakkad 1.8
This PCF is equal to the break even value of 40%.
So 250 kW will be the optimum choice for the site, if the overall project cost is below
Rs.3.5 crores/MW and tariff is Rs. 2.5 per kilo Watt hour.
b. Tariff: Rs.3.0/kWh and break even PCF of 33.3%
Similarly, for 400 kW (for 19.5% flow of exceedence)
PCF = (1168000 / 400 x 8760) x 100 = 33.3%
This PCF is very near to the break even value of 33%.
Similarly, 400 kW will be the optimum choice for the site, if the overall project cost is
below Rs. 3.5 crores/MW and tariff is Rs. 3.0 per kilo Watt hour.
Table 16.5
Economically Viable Maximum Capacity at Different Costs and Tariff
Tariff
Unit size for
Rs.3.5 Crores/MW
Rs.2.5/Unit
250 kW
Rs.3.00/ Unit
400 kW
The units selected can be one of the following combinations:
For Rs.3.5 Crores/MW and Rs.2.5/Unit we can opt (0.25MW x 1)
For Rs.3.5 Crores/MW and Rs.3.0/Unit we can opt ( 0.1 MW x 1 + 0.25MW x 1)
Among these two categories, the second one seems to be less viable since it is bulky with units.
We have restricted ourselves to the more realistic combination of Rs. 3.5 Crores / MW of
investment cost and two tariff choices of Rs. 2.5/Unit and Rs. 3.0/Unit.
16.5 CIVIL ENGINEERING WORKS

WGSHP - Final Report (Vol. II) Manpilavu
Integrated Rural Technology Centre, Palakkad 1.9
The important Civil Engineering Works required for the project are a diversion weir, an intake
structure, a penstock and a power house. A weir is constructed to have a small storage and to
divert the water from stream to the intake. For this project only a diversion weir is proposed,
which allows the excess water to flow over the weir to the downstream. The intake structure
takes water from the weir and leads it to the penstock. The penstock made of steel is proposed
in this site. A power house is constructed for the purpose of housing the electro mechanical
equipment. It is usually a small building of 10m x 6.5m..
16.5.1 Weir at Manpilavu
A concrete weir has been proposed on the Meenthalaruvi stream, at a bed level of +294.750
metres. The structure is 3.5m high having a length of 2.95m at the top with a central broad
crested free over fall type spill way. The cross sectional details of the proposed diversion site is
shown in Fig. No. 16.7.
16.5.2 Intake Structure, Penstock and Power House
A simple box type, direct intake structure of reinforced cement concrete is provided on the
stream bed. A trash rack is provided at the intake mouth, the penstock entrance starts from the
wall of intake box near the gabion. The economic diameter of the penstock is calculated as 0.63
m. The penstock is designed for a maximum flow of 0.667 cumec with a velocity of 0.85 metre
per second. The possible alignment for the penstock is located on the right bank of the stream.
The longitudinal section of the proposed penstock line was drawn from contour map and the
length was calculated, which came to 216m (Fig. No. 16.8).
A surface power house is proposed on the right bank of the stream. The slope at the proposed
site is gentle. The power house is of size 10m x 6.5m, to accommodate 250 kW, generator and
standardised turbine.
WGSHP - Final Report (Vol. II) Manpilavu
Integrated Rural Technology Centre, Palakkad 1.10
16.6 ELECTRICAL AND MECHANICAL EQUIPMENTS The power house proposed in the scheme will have an installed capacity of 250 kW. The electricity
generated would be connected to the existing power grid system at Manpilavu by a 300m transmission
line. A standardised turbine for 50m gross head is proposed for this particular site. The turbine shall
be complete with governor, control equipment and safety devices. The generator would be
synchronous with a brushless excitation system shall be rated to generate 250kW, 11kV three phases,
50Hz and shall be suitable for coupling with turbine described above. The generator shall have voltage
regulation equipment, parallel operation equipment etc.
16.7 ENVIRONMENTAL IMPACTS A small hydro project has been proposed at Manpilavu (Pathanamthitta Dist.). The project aims to
generates about 250 kW of hydro power from a fall having a head of 50 m. Some preliminary
environmental impact analysis have been carried out. They are land, water and socio-economical
environmental impacts.
16.7.1 Environmental impact on land
The catchment area measured from toposheet comes to be 3.25 sq. km. The stream flows through
steep slopes on the upstream side of the fall and it contains two falls. After that the stream is flowing
through gentle slope. After the fall, the stream joins to the Pampa river. The site is situated in Chittar
reserved forest. But one side of the fall is owned by private persons. The forest is very thick. The
land is having moderate slope in this area. There is no possibility of land slide is very less. the chances
for soil erosion is very less and it is negligible. The bed of the stream is rocky in this area. Boulders
are available in plenty at site. The number of rainy days exceeds 50% in its catchment.
The most significant thing is that, due to impoundment, no forest land will be submerged. The
construction of weir, penstock, power house, tailrace and temporary road will not take away any
forest land. So no forest clearance is required for the project.
16.7.2 Environmental impact on water
The Meenthalaruvi stream which drains to Pampa river is the stream of this fall. It is a 3rd order,
structurally controlled stream. The diversion structure will create a pond of area 0.0183hectare. No
forest land will be submerged. Above all, this accounts for only 0.073 ha/MW. This diversion
structure which also acts as a check dam can increase the height of water table level at the site. The
impounded water will also change soil moisture regime in adjacent forest land.
WGSHP - Final Report (Vol. II) Manpilavu
Integrated Rural Technology Centre, Palakkad 1.11
16.7.3 Socio-economic impact
The construction phase would create employment opportunities for a period of nearly 10 months. The
peak labour strength is 25 skilled and 50 unskilled labour. It requires only minimum land acquisition
for construction. The acquisition does not need any rehabilitation.
16.8 CONCLUSION The environmental impact of this small hydel project is negligible. No regions adverse impact is
anticipated. Moreover, deforestation owing to the inundation will be a meagre area.
The economic size of installed capacity depends upon the permissible tariff as well as the capital cost.
It was found that the project is financially viable for an installed capacity of 250kW at a project cost
of Rs. 3.5 Crores per MW and a tariff rate of Rs.2.5 per unit of electricity. Alternatively, if the tariff is
raised to Rs.3.00 per unit, an installed capacity of 400kW would become economically viable.
Cost effective methods of construction, like the use of gabion weirs, can be used to reduce the capital
costs. A methodology for implementing the project with a maximum of peoples= participation should
also be devised. The role of the Grama Panchayat in this effort is crucial.
-�-

WGSHP - Final Report (Vol. II) Manpilavu
Integrated Rural Technology Centre, Palakkad 1.12
17. MUKKALI
District : Palakkad
Panchayath : Agali
Head : 90 m.
Flow : Seasonal
Suggested Capacity : 650 kW/ 750 kW

WGSHP - Final Report (Vol. II) Mukkali
Integrated Rural Technology Centre, Palakkad 1.1
17.1 GENERAL
17.1.1 The Site
Palakkad district has quite a number of water falls. Most of them are potential sites for small
hydro power generation. Mukkaali water fall is situated in the 13th ward of Agali Grama
Panchayath in Palakkad District. The site is a distance of 2 km before Mukkali on the way to
Mannarkkad-Mukkaali road. There is a bus route from Mannarkkad to Aanakkatti through
Mukkaali. The site is about 16 km away from Mannarkkad. The site is owned by forest
department and it can be seen from the main road.
The water fall is located at 750 32' 26" E longitude and 110 2' 36" N latitude. The catchment area
measured from topo sheet is 2.75 sq. km. The falls are situated at an elevation of 320m from
MSL, in mukkali stream which is beginning at an elevation 700m. After the fall the stream flows
through steeply sloping terrain and joins the Nellipuzha river which is drains to the Bharathapuzha
(Fig 17.1).
17.1.2 Topography
The site is situated in Mannarkkad reserved forest. The forest is very thick. The land is having
moderate slope in this area. There is no possibilities for land slides in this area and the chances of
soil erosion are negligible. The bed of stream is rocky and boulders are available in plenty at site.
The site is perennial and number of rainy days exceeds 50% in its catchment.
17.2 FIELD INVESTIGATION
17.2.1 Reconnaissance Survey
A topographical survey was conducted for obtaining topographical details of the site. Total head
of the fall is 90m. The possible location for diversion structure and power house were identified
and the details were taken using tacheometric method of surveying.

WGSHP - Final Report (Vol. II) Mukkali
Integrated Rural Technology Centre, Palakkad 1.4
17.2.2 Catchment Area
Topographical survey sheets to a scale of 1: 50,000 are available from the Survey of India. The
catchment of Mukkali was located using the toposheet. It is shown in the Fig.No. 17.2. From
the shape it is identified as a fan shaped catchment and it is measured which comes to nearly
2.75sq.km. The catchment area is having almost moderate slope but some portio ns are very
steep. Maximum flood discharge measured at this site during 1998 is about 2 cumec.
17.2.3 Contour Map
The survey details were plotted on a sheet of paper at a scale of 1:250. The undulations of the
site, the location of the falls and other topographical features were identified from the contour
map. The location of the weir, the alignment of the penstock and location of the power house
were also determined using this and the prepared contour map has been shown in Annexure
A.17.
17.2.4 River Flow Data
For a period of 12 months (December 97 to December 98) the water level observations were
taken every week. A suitable location was identified on the upstream of the fall, where the whole
water is flowing through that point, cross sectional details of the point were noted for calculating
the stream discharge. We fixed a measuring gauge at this point to measure the peak flow. Using
the collected data (Table 17.1) the weekly discharge hydrograph of the site is prepared. The
graph is shown in Fig. No. 17.3.
17.2.5 Flow Duration Curve
Using weekly discharge hydro graph, percentage flow of exceedence was calculated. From this,
the flow duration curve was plotted (Fig. No. 17.4). The same curve also functions as
percentage flow of exceedence graph. This river flow data is recalculated in tabular form, giving
the corresponding energy potential in weekly and cumulative mode is given in Table 17.2. These
data are used for calculating energy potential and selection of unit sizes in section 17.4.
17.2.6 Peak Flow Determination
There are various empirical methods for calculating the maximum flood discharge. The different
values obtained are shown in Table 17.3. The value obtained by Dicken=s formula, which is

WGSHP - Final Report (Vol. II) Mukkali
Integrated Rural Technology Centre, Palakkad 1.5
commonly used in western ghats region has been used for the structural design of diversion
structure.
Table 17.3
Peak Flow Determination
Parameters
Dicken=s method
Ingli=s formula
Ryve=s formula
Nawab Jung
Bahadur formula
Peak flow in cumecs
55.52 93.28
19.82
134.03
17.3 SALIENT DESIGN FEATURES A detailed design of Civil, Electrical & Mechanical work has not been carried out in this report as
it does not come under the purview of the project, but a typical section of the proposed diversion
structure is given here. The stability analysis of the section and economic diameter of the
penstock was carried out as part of preliminary design. The capability and number of units, type
and specification of turbine, generator and it=s cost have been estimated, after consulting various
agencies.
17.3.1 Power Potential of the Project
The discharge corresponding to 80% exceedence is only 0.05 cubic metre per second. A
discharge of 0 .05 cubic metre per second can produce only about 35 kW. However it seen that
much higher flows are available during 40% of the time. In order to tap the full potential of the
site, with a head of 90 metre, the project is designed to generate higher output with lower
dependability. This site can be designed as a run of the river project, which can produce 350
kW with a dependability of 40%.
The output power was computed using the formula, P = 10 x Q x H x ηη
Where; P = Power output in kW
Q = Discharge in cumec
H = Head in metres
η = Efficiency taken as 0.75

WGSHP - Final Report (Vol. II) Mukkali
Integrated Rural Technology Centre, Palakkad 1.6
For 50% exceedence P = 10 x 0.42 x 90 x 0.75 = 285 kW.
For 40% exceedence P = 10 x 0.52 x 90 x 0.75 = 350 kW.
For 30% exceedence P = 10 x 0.65 x 90 x 0.75 = 445 kW.
17.3.2 Energy Potential
At this site, sufficient flow is there so that we can obtain 350kW power output for 40% of the
time (146 days) which reduces to 27kW by 80% time (292 days). The energy input
corresponding to 40% time will be (40/100 * 350 * 365 * 24) = 1.226 MU. The flow after
50% time can be utilized by providing a small pondage. The quantity of water available from
40% to 100% time is calculated to be 1349900 m3. Energy obtained from this water is
calculated to be 0.256 MU.
Total amount of energy produced = 1.226 MU + 0.256 MU = 1.48 MU.
It may be noted that, this much amount of energy can be generated for the particular year. If
higher flows are available during any year, it will enable higher production and vice versa.
17.3.3 Pondage Requirement
From the contour map a plot of surface area Vs. elevation is drawn in Fig.No. 17.5. The areas
corresponding to each elevation is used to find the volume of water that can be stored in each
elevation and the details are shown in Table 17.4. From this information, a capacity Vs elevation
curve of the pondage is prepared and is shown in Fig.No.17.6.
Table 17.4
Pondage Area Details Sl. No.
Elevation (m)
Area (m2)
Capacity (m3)
Energy (kWh)
1
499.50
0
0
0
2
500
86.80
21.70
4 3
501
192.40
161.30
30
4
502
294.00
404.50
76
5
503
365.60
734.25
138 6
504
433.00
1133.55
213
7
505
499.80
1599.95
300

WGSHP - Final Report (Vol. II) Mukkali
Integrated Rural Technology Centre, Palakkad 1.7
As the terrain is suitable for storing 1600m3, it follows that, at full storage, the energy capacity is
only about 300 kWh. If a single 300 kW machine is installed, it can be operated for only one
hour at full capacity (during peak time). Fortunately, pondage becomes critical only during lean
months, this kid of operation practice is acceptable. Hence, a weir height of 5.5m, to create a
storage of 1600m3 is suggested.
17.4 SELECTION OF PLANT CAPACITY AND UNIT SIZES
For optimization of plant capacity, the following parameters were assumed.
Rate of return on investment - 15%
Loan repayment period - 10 years
Average O/M cost - 2.5% of capital cost
Resulting standard annual cost - 25%
(This consists of 2.5% O & M costs, 15% return on 25% equity, 15% interest on 75% loan and repayment of loan in 10 annual instalments)
Tariff (per Unit) - Rs. 2.5 and 3.0 (Two cases)
Investment cost (Rs.in Crores per MW) - Rs. 3.5 (Two cases)
Since manufacturers were not in a position to quote exact figures, no attempt was made to fine
tune the cost in relation to site specific conditions. Only ranges could be indicated. Each
combination of tariff and capital cost selected above, will demand a minimum annual generation
per kW installed. This can be taken to be the break even Plant Capacity Factor (PCF) for the
site under the specified conditions.

WGSHP - Final Report (Vol. II) Mukkali
Integrated Rural Technology Centre, Palakkad 1.8
Lower the cost/MW and higher the price for energy, the larger will be the economically
viable installed capacity and the quantity of energy that can be economically extracted
from a given site.
Let the capital cost of Mukkali be Rs.3.5 crores/MW. The annual rate is 25%. Let the unit rate
of tariff offered by K.S.E.B be Rs. 2.5/kWh.
If X be the number of hours of operation at full load capacity,
per Mega Watt annual cost, at the rate of 25% on investment = Rs. 3.5 Crores x 0.25
per Mega Watt revenue = 1000 kW x Rs. 2.5 x X
Equating the two, we get 3,50,00,000 x 0.2.5 = X x 1000 x 2.5
X = 3,500 hrs.
It follows that, any combination of machines, that can work at full capacity for over 3500 hours
can deliver a profit, if the overall project cost is below Rs. 3.5 crores/MW and tariff is Rs. 2.5
per kilo Watt hour.
This can be explained better in terms of Plant Capacity Factor, which is defined as the ratio of
actual amount of energy obtained to the maximum energy that can be obtained from the given
installed capacity during an year, to the actual amount of energy obtained.
In this case, for the value of X = 3500 hours, PCF = (3500 / 8760) x 100 = 40%
That is, a maximum capacity, which yields a PCF of 40% is economically viable for this site.
Similarly, break even PCF for Rs.3.0 per unit and Rs. 3.5 Crores per Mega Watt where
X=2916 hours is 33.3%
Now we shall check various capacities of turbine size which are suitable for this two conditions.
a. Tariff: Rs.2.50/kWh and break even PCF of 40%
For an installed capacity of 650 kW, which corresponds to about 8% flow of exceedence from
the chart, the total energy yield is the sum of.
650 kW x (0.09 x 8760) = 0.512 at continuous operation for 8% time of an year, and 1.76MU,
which is the cumulative energy potential from 9% to 100% time as obtained from the Chart
(Table 17.3).
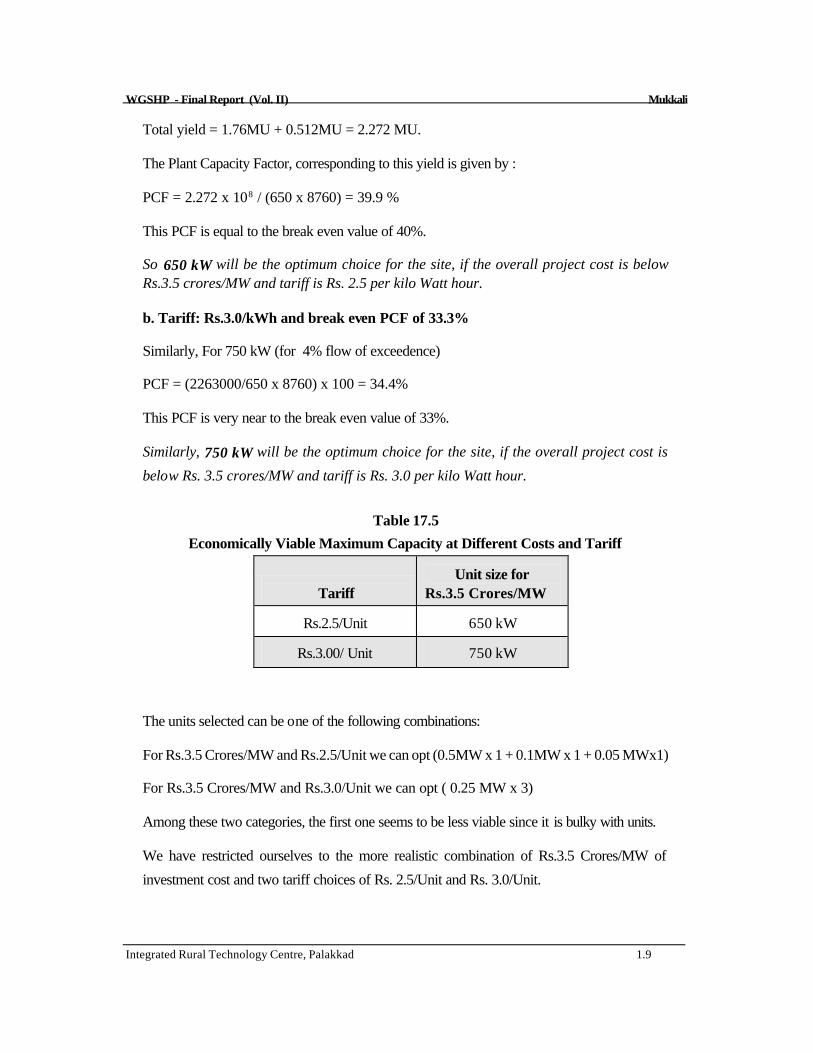
WGSHP - Final Report (Vol. II) Mukkali
Integrated Rural Technology Centre, Palakkad 1.9
Total yield = 1.76MU + 0.512MU = 2.272 MU.
The Plant Capacity Factor, corresponding to this yield is given by :
PCF = 2.272 x 10⁸ / (650 x 8760) = 39.9 %
This PCF is equal to the break even value of 40%.
So 650 kW will be the optimum choice for the site, if the overall project cost is below Rs.3.5 crores/MW and tariff is Rs. 2.5 per kilo Watt hour.
b. Tariff: Rs.3.0/kWh and break even PCF of 33.3%
Similarly, For 750 kW (for 4% flow of exceedence)
PCF = (2263000/650 x 8760) x 100 = 34.4%
This PCF is very near to the break even value of 33%.
Similarly, 750 kW will be the optimum choice for the site, if the overall project cost is
below Rs. 3.5 crores/MW and tariff is Rs. 3.0 per kilo Watt hour.
Table 17.5
Economically Viable Maximum Capacity at Different Costs and Tariff
Tariff
Unit size for
Rs.3.5 Crores/MW
Rs.2.5/Unit
650 kW
Rs.3.00/ Unit
750 kW
The units selected can be one of the following combinations:
For Rs.3.5 Crores/MW and Rs.2.5/Unit we can opt (0.5MW x 1 + 0.1MW x 1 + 0.05 MWx1)
For Rs.3.5 Crores/MW and Rs.3.0/Unit we can opt ( 0.25 MW x 3)
Among these two categories, the first one seems to be less viable since it is bulky with units.
We have restricted ourselves to the more realistic combination of Rs.3.5 Crores/MW of
investment cost and two tariff choices of Rs. 2.5/Unit and Rs. 3.0/Unit.

WGSHP - Final Report (Vol. II) Mukkali
Integrated Rural Technology Centre, Palakkad 1.10
17.5 CIVIL ENGINEERING WORKS The important Civil Engineering Works required for the project are a diversion weir, intake
structure, penstock and a power house. A weir is constructed to have a small storage and to
divert the water from stream to the intake. For this project only a diversion weir is proposed,
which allows the excess water to flow over the weir to the downstream. The intake structure
takes water from the weir and leads it to the penstock. The penstock made of steel is proposed
in this site. A power house is constructed for the purpose of housing the electro mechanical
equipment. It is usually a small building of 15m x 8m
17.5.1 Weir at Mukkali
A concrete weir has been proposed on the Mukkali stream, at a bed level of +500.000 metres.
The base width of the weir at bed level is 3.05m. The structure is 2.50m high having a length of
18.25m at the top with a central broad crested free over fall type spill way. The cross sectional
details of the proposed diversion site is shown in Fig.No. 17.7.
17.5.2 Intake Structure, Penstock and Power House
A simple box type, direct intake structure of reinforced cement concrete is provided on the
stream bed. A trash rack is provided at the intake mouth, the penstock entrance starts from the
wall of intake box near the gabion. The economic diameter of the penstock is calculated as
0.68m. The penstock can carry a maximum flow of 0.963 cumec with a velocity of 2.7 metre
per second. The possible alignment for the penstock is located on the left bank of the stream.
The longitudinal section of the proposed penstock line was drawn from the contour map and the
length was calculated, which came to 315m (Fig. No. 17.8).
A surface power house is proposed on the bank of the stream The slope at the proposed site is
gentle but increased upwards in the east direction. The power house is of size 15m*8m, to
accommodate 650kW generator and standardised turbine.
17.6 ELECTRICAL AND MECHANICAL EQUIPMENTS The power house proposed in the scheme will have an installed capacity of 650 kW. The
electricity generated would be connected to the existing power grid system at Mukkali by a 500m
transmission line. A standardised turbine for 90m gross head is proposed for this particular site.
WGSHP - Final Report (Vol. II) Mukkali
Integrated Rural Technology Centre, Palakkad 1.11
The turbine shall be complete with governor, control equipment and safety devices. The
generator would be synchronous with a brushless excitation system shall be rated to generate 650
kW, 11 kV three phases, 50Hz and shall be suitable for coupling with turbine described above.
The generator shall have voltage regulation equipment, parallel operation equipment etc.
17.7 ENVIRONMENTAL IMPACTS A small hydro project has been proposed at Mukkali (Palakkad Dist). The project aims to
generates about 650 kW of hydro power from a fall having a head of 90 m. Some preliminary
environmental impact analysis have been carried out. They are land, water and socio-economical
environmental impacts.
17.7.1 Environmental Impact on Land
The catchment area measured from topo sheet comes to be 2.75 square km. The falls are
situated in Mukkali stream. After the fall the stream flows through steep sloped terrain and joins
to the Nellipuzha river which is drains to the Bharathapuzha.
The site is situated in Mannarkkad reserved forest. The forest is very thick. The land is having
moderate slope in this area. There is no possibilities for land slides in this area and the chances
for soil erosion is very less and it is negligible. The bed of stream is rocky and boulders are
available in plenty at site. The site is perennial and number of rainy days exceeds 50% in its
catchment.
The most significant thing is that, due to impoundment, no forest land will be submerged. The
construction of weir, penstock, power house, tailrace and temporary road will not take away any
forest land. So o forest clearance is required for the project.

WGSHP - Final Report (Vol. II) Mukkali
Integrated Rural Technology Centre, Palakkad 1.12
17.7.2 Environmental Impact on Water
The Mukkali stream which joins to the Nellipuzha river which is drains to the Bharathapuzha is the
stream of this fall. The diversion structure will create a pond of area 0.05 hectare. No forest land will
be submerged. Above all, this accounts for only 0.077 ha/MW. This diversion structure which also
acts as a check dam can increase the height of water table level at the site. The impounded water will
also change soil moisture regime in adjacent forest land.
17.7.3 Socio-economic Impact
The construction phase would create employment opportunities s for a period of nearly 18 months
.The peak labour strength is 100 skilled and 100 unskilled labour. It. requires only minimum land
acquisition for construction. The acquisition does not need any rehabilitation.
17.8 CONCLUSION
The environmental impact of the small hydel project is negligible. No serious adverse impact is
anticipated. Moreover, deforestation owing to the inundation will be a meagre area.
The economic size of installed capacity depends upon the permissible tariff as well as the capital cost.
It was found that the project is financially viable for an installed capacity of 650kW at a project cost
of Rs. 3.5 Crores per MW and a tariff rate of Rs.2.5 per unit of electricity. Alternatively, if the tariff is
raised to Rs.3.00 per unit, an installed capacity of 750kW would become economically viable.
Cost effective methods of construction, like the use of gabion weirs, can be used to reduce the capital
costs. A methodology for implementing the project with a maximum of peoples= participation should
also be devised. The role of the Grama Panchayath in this effort is crucial.
-�-
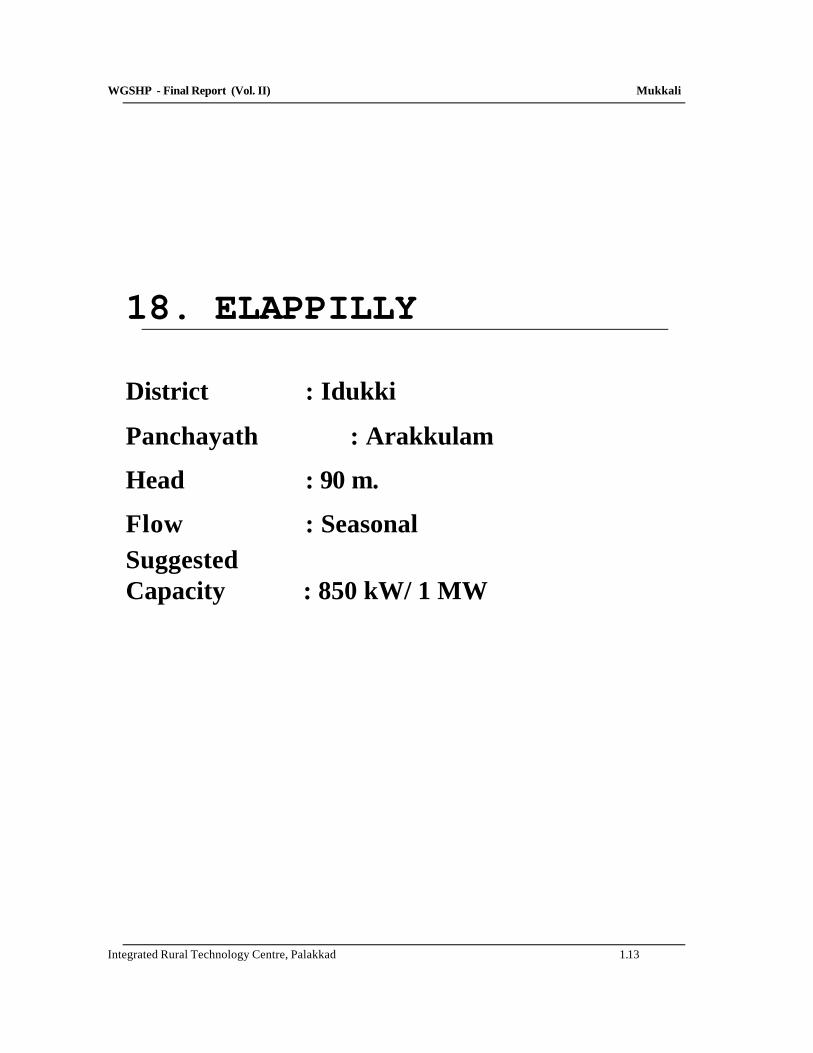
WGSHP - Final Report (Vol. II) Mukkali
Integrated Rural Technology Centre, Palakkad 1.13
18. ELAPPILLY
District : Idukki
Panchayath : Arakkulam
Head : 90 m.
Flow : Seasonal
Suggested Capacity : 850 kW/ 1 MW

WGSHP - Final Report (Vol. II) Elappilly
Integrated Rural Technology Centre, Palakkad 1.1
18.1 GENERAL
18.1.1 The site
The project site is at Elappilly, which is in the 2nd ward of Arakkulam Grama Panchayath in
Idukki District. The site is a distance of 18 km from Moolamattom. Bus services are available to
the site occasionally. The site is near by the road. The stream has nearly 10 months flow and the
head is about 90m. The 11kV transformer is available at a distance of 2 km from the site.
The water fall is located at 760 52' 0" E longitude and 9 0 46' 38" N latitude. The catchment area
measured from topo sheet is 3.88 sq.km. The falls are situated at an elevation of 160m from
MSL, in Elappilly stream which is beginning at an elevation of 900m. This is one of the main fall
in this stream. The down stream of the fall has steep slope and it contains so many small falls.
After the fall the stream joins the Thodupuzha river which drains to the Moovattupuzha river
(Fig.No. 18.1)
18.1.2 Topography of the site
The site is situated in private land. The land has moderate slope in this area. The possibility of
land slide is more in this area and the possibility of soil erosion is less in stream. The bed of the
stream is rocky and boulders are available in plenty at site. The stream is a seasonal one and it
has a head of 90m.
18.2 FIELD INVESTIGATION
18.2.1 Reconnaissance survey
A topographical survey was conducted for obtaining topographical details of the site. The total
head of the site was found to be 85m. The position of the diversion structure and power house
were identified and tacheometric method is used for surveying work.
18.2.2 Catchment area
Topographical survey sheets to a scale of 1: 50,000 are available from the Survey of India. The
catchment of Elappilly was located using the toposheet. It is shown in the Fig.No.18.2. From
the figure it is identified as a fan shaped catchment and it comes to nearly 3.88 sq.km. Peak
value of flood will be less for this basin as the difference between concentration time and time at
WGSHP - Final Report (Vol. II) Elappilly
Integrated Rural Technology Centre, Palakkad 1.2
which flow starts will be large. The volume of flow will be distributed through a larger length of
time.
18.2.3 Contour map
The survey details were plotted on a sheet of paper at a scale of 1:200 (Annexure A.18.). The
undulations of the site, the location of the falls and other topographical features were identified
from the contour map. The location of the weir, the alignment of the penstock and location of the
power house were also determined using this and marked in the above map, along with the
contours of the area.
18.2.4 River flow data
For a period of 12 months (December 97 to December 98) the water level observations were
taken every week. A suitable location was identified on the upstream side of the fall, where the
whole water is flowing through that point, cross sectional details of the point were noted for
calculating the stream discharge . We fixed a measuring gauge at that point and engaged a local
person for taking weekly flow data, we also visited the site once in every month for collecting the
data from the local person. From the collected data the weekly discharge is collected and make
it into tabular form (Table 18.1) for weekly discharge graph preparation. The graph was shown
in Fig.No. 18.3
18.2.5 Flow duration curve
Using weekly discharge hydro graph, percentage flow of exceedence was calculated. From this,
the flow duration curve was plotted (Fig. No. 18.4). The same curve also functions as
percentage flow of exceedence graph. This river flow data is recalculated in tabular form, giving
the corresponding energy potential in weekly and cumulative mode is given in Table 18.2. These
data are used for calculating energy potential and selection of unit sizes in section 18.4.
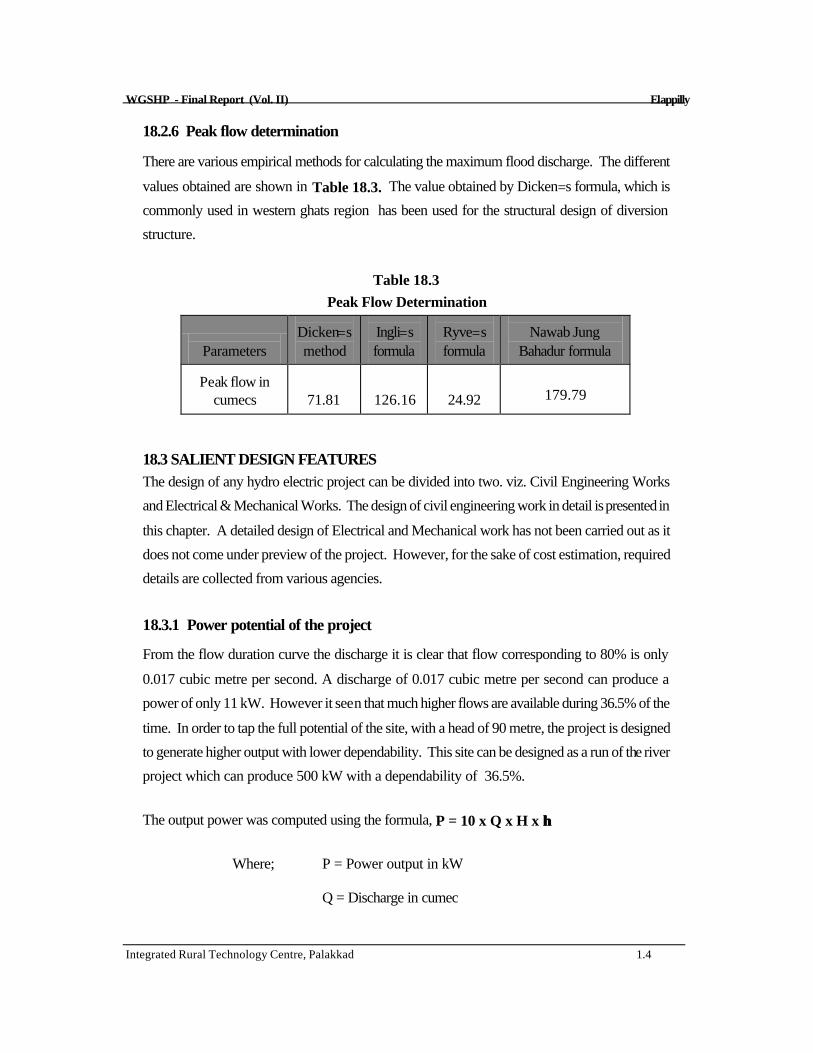
WGSHP - Final Report (Vol. II) Elappilly
Integrated Rural Technology Centre, Palakkad 1.4
18.2.6 Peak flow determination
There are various empirical methods for calculating the maximum flood discharge. The different
values obtained are shown in Table 18.3. The value obtained by Dicken=s formula, which is
commonly used in western ghats region has been used for the structural design of diversion
structure.
Table 18.3
Peak Flow Determination
Parameters
Dicken=s method
Ingli=s formula
Ryve=s formula
Nawab Jung
Bahadur formula
Peak flow in cumecs
71.81
126.16
24.92
179.79
18.3 SALIENT DESIGN FEATURES The design of any hydro electric project can be divided into two. viz. Civil Engineering Works
and Electrical & Mechanical Works. The design of civil engineering work in detail is presented in
this chapter. A detailed design of Electrical and Mechanical work has not been carried out as it
does not come under preview of the project. However, for the sake of cost estimation, required
details are collected from various agencies.
18.3.1 Power potential of the project
From the flow duration curve the discharge it is clear that flow corresponding to 80% is only
0.017 cubic metre per second. A discharge of 0.017 cubic metre per second can produce a
power of only 11 kW. However it seen that much higher flows are available during 36.5% of the
time. In order to tap the full potential of the site, with a head of 90 metre, the project is designed
to generate higher output with lower dependability. This site can be designed as a run of the river
project which can produce 500 kW with a dependability of 36.5%.
The output power was computed using the formula, P = 10 x Q x H x ηη
Where; P = Power output in kW
Q = Discharge in cumec

WGSHP - Final Report (Vol. II) Elappilly
Integrated Rural Technology Centre, Palakkad 1.5
H = Head in metres
η = Efficiency taken as 0.75
For 50%exceedence P = 10 x 0.22 x 90 x 0.75 = 150 kW.
For 40%exceedence P = 10 x 0.67 x 90 x 0.75 = 445 kW.
For 30%exceedence P = 10 x 1 x 90 x 0.75 = 675 kW.
18.3.2 Energy potential
At this site, sufficient flow is there so that we can obtain 500kW power output for 38.5% of the
time (133 days) which reduces to 8kW by 80% time (292 days). The energy input corresponding
to 38.5% time will be (38.5/100 x 500 x 365 x 24) = 1.69 MU. The flow after 38.5% time
can be utilized by providing a small pondage. The quantity of water available from 38.5% to
100% time is calculated to be 2616365m3. Energy obtained from this water is calculated to be
0.49 MU.
Total amount of energy produced = 1.69 MU + 0.49MU = 2.18 MU
It may be noted that, this much amount of energy can be generated for the particular year. If
higher flows are available during any year, it will enable higher production and vice versa.
18.3.3 Pondage requirement
From the contour map a plot of surface area Vs. elevation is drawn in (Fig.No. 18.5). These are
corresponding to each elevation is used to find the volume of water that can be stored in each
elevation and the details are shown in Table 18.4. From this information a capacity elevation
curve of the pondage is prepared and is shown in Fig. 18.6. The height of weir was chosen
based on the following considerations.

WGSHP - Final Report (Vol. II) Elappilly
Integrated Rural Technology Centre, Palakkad 1.6
Table No. 18.4
Pondage Area Details Sl. No.
Elevation (m)
Area (m2)
Capacity (m3)
Energy (kWh)
1
500.00
0
0
0
2
501
111.56
27.89
5
3
502
240.36
203.85
38
4
503
333.76
490.91
92
5
504
527.52
921.55
173
6
505
774.52
1572.57
295
7
506
1006.40
2463.03
462
8
507
1250.40
3591.43
673
9
508
1481.6
4957.43
930
As the terrain is suitable for storing 4950m3, it follows that, at full storage, the energy capacity is
only about 900 kWh. If a single 900 kW machine is installed, it can be operated for only one
hour at full capacity during peak time. Fortunately, pondage becomes critical only during lean
months, this kid of operation practice is acceptable. Hence, a weir height of 8m, to create a
storage of 4950m3 is suggested.
18.4 SELECTION OF PLANT CAPACITY AND UNIT SIZES For optimization of plant capacity, the following parameters were assumed.
Rate of return on investment - 15%
Loan repayment period - 10 years
Average O/M cost - 2.5% of capital cost
Resulting standard annual cost - 25%
(This consists of 2.5% O & M costs, 15% return on 25% equity, 15% interest on 75% loan and
repayment of loan in 10 annual instalments)
Tariff (per Unit) - Rs. 2.5 and 3.0 (Two cases)
Investment cost (Rs.in Crores per MW) - Rs. 3.5 (Two cases)
Since manufacturers were not in a position to quote exact figures, no attempt was made to fine

WGSHP - Final Report (Vol. II) Elappilly
Integrated Rural Technology Centre, Palakkad 1.7
tune the cost in relation to site specific conditions. Only ranges could be indicated. Each
combination of tariff and capital cost selected above, will demand a minimum annual generation
per kW installed. This can be taken to be the break even Plant Capacity Factor (PCF) for the
site under the specified conditions.
Lower the cost/MW and higher the price for energy, the larger will be the economically
viable installed capacity and the quantity of energy that can be economically extracted
from a given site.
Let the capital cost of Elappilly be Rs.3.5 crores/MW. The annual rate is 25%. Let the unit rate
of tariff offered by K.S.E.B be Rs. 2.5/kWh.
If X be the number of hours of operation at full load capacity,
per Mega Watt annual cost, at the rate of 25% on investment = Rs. 3.5 Crores x 0.25
per Mega Watt revenue = 1000 kW x Rs. 2.5 x X
Equating the two, we get 3,50,00,000 x 0.2.5 = X x 1000 x 2.5
X = 3,500 hrs.
It follows that, any combination of machines, that can work at full capacity for over 3500 hours
can deliver a profit, if the overall project cost is below Rs. 3.5 crores/MW and tariff is Rs. 2.5
per kilo Watt hour.
This can be explained better in terms of Plant Capacity Factor, which is defined as the ratio of
actual amount of energy obtained to the maximum energy that can be obtained from the given
installed capacity during an year, to the actual amount of energy obtained.
In this case, for the value of X = 3500 hours, PCF = (3500 / 8760) x 100 = 40%
That is, a maximum capacity, which yields a PCF of 40% is economically viable for this site.
Similarly, break even PCF for Rs.3.0 per and Rs. 3.5 Crores per mega watt where X=2916
hours is 33.3%.
Now we shall check various capacities of turbine size which are suitable for this two conditions.
a. Tariff: Rs.2.5/kWh and break even PCF of 40%
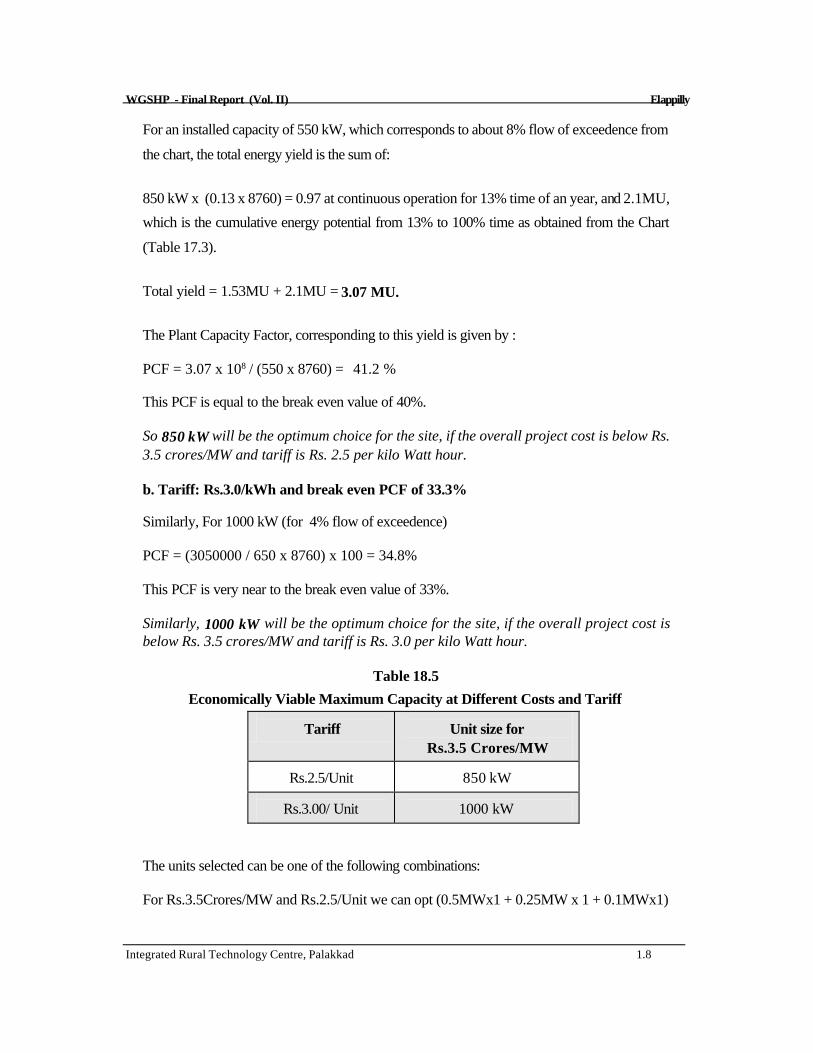
WGSHP - Final Report (Vol. II) Elappilly
Integrated Rural Technology Centre, Palakkad 1.8
For an installed capacity of 550 kW, which corresponds to about 8% flow of exceedence from
the chart, the total energy yield is the sum of:
850 kW x (0.13 x 8760) = 0.97 at continuous operation for 13% time of an year, and 2.1MU,
which is the cumulative energy potential from 13% to 100% time as obtained from the Chart
(Table 17.3).
Total yield = 1.53MU + 2.1MU = 3.07 MU.
The Plant Capacity Factor, corresponding to this yield is given by :
PCF = 3.07 x 10⁸ / (550 x 8760) = 41.2 %
This PCF is equal to the break even value of 40%.
So 850 kW will be the optimum choice for the site, if the overall project cost is below Rs. 3.5 crores/MW and tariff is Rs. 2.5 per kilo Watt hour.
b. Tariff: Rs.3.0/kWh and break even PCF of 33.3%
Similarly, For 1000 kW (for 4% flow of exceedence)
PCF = (3050000 / 650 x 8760) x 100 = 34.8%
This PCF is very near to the break even value of 33%.
Similarly, 1000 kW will be the optimum choice for the site, if the overall project cost is below Rs. 3.5 crores/MW and tariff is Rs. 3.0 per kilo Watt hour.
Table 18.5
Economically Viable Maximum Capacity at Different Costs and Tariff
Tariff
Unit size for Rs.3.5 Crores/MW
Rs.2.5/Unit
850 kW
Rs.3.00/ Unit
1000 kW
The units selected can be one of the following combinations:
For Rs.3.5Crores/MW and Rs.2.5/Unit we can opt (0.5MWx1 + 0.25MW x 1 + 0.1MWx1)

WGSHP - Final Report (Vol. II) Elappilly
Integrated Rural Technology Centre, Palakkad 1.9
For Rs.3.5 Crores/MW and Rs.3.0/Unit we can opt (0.5MW x 1 + 0.25 MW x 2)
Among these two categories, the first one seems to be less viable since it is bulky with units.
We have restricted ourselves to the more realistic combination of Rs.3.5 Crores/MW of
investment cost and two tariff choices of Rs.2.5/Unit and Rs.3.0/Unit.
18.5 CIVIL ENGINEERING WORKS The important Civil Engineering Works required for the project are a weir, an intake structure, a
penstock and a power house. A weir is constructed to have a small storage and to divert the
water from stream to the intake. For this project an overflow weir is to be constructed, which
allows the excess water to flow over the weir to the downstream. The intake structure takes
water from the weir and leads it to the penstock. The penstock is a pressure pipe which carries
water to the turbine. It can be made of steel, cast iron, plastics (Poly Vinyl Chloride, High
Density Poly Ethylene) and concrete. In this project a steel penstock is used. A power house is
constructed for the purpose of housing the electro mechanical equipment. It is usually a small
building of size 12.5mx 6m .
18.5.1 Weir at Elappilly
A Gabion weir has been proposed on the Kanjirappuzha stream, at a bed level of +495.500
metres. The base width of the weir at bed level is 7.5 m. The structure is 4.50 m high having a
length of 60 m at the top with a central broad crested free over fall type spill way. The cross
sectional details of the proposed diversion site is shown in (Fig. No. 18.7) .
18.5.2 Intake Structure, Penstock and Power house
A simple box type, direct intake structure of reinforced cement concrete is provided on the
stream bed. A trash rack is provided at the intake mouth, the penstock entrance starts from the
wall of intake box near the gabion. The economic diameter of the penstock is calculated as
0.76m and the penstock can carry a maximum flow of 1.26 cumec with a velocity of 1.67 metre
per second. The possible alignment for the penstock is located on the left bank of the stream.
The longitudinal section of the proposed penstock line was drawn from the contour map and the
length was calculated, which came to 147m (Fig. No. 18.8).
A surface power house is proposed on the left bank of the stream. The slope at the proposed site

WGSHP - Final Report (Vol. II) Elappilly
Integrated Rural Technology Centre, Palakkad 1.10
is moderate but increases up the hill towards north east direction. The power house is of size
12.5 m x 6.5m to accommodate 850 kW, generator and standardised turbine.
18.6 ELECTRICAL AND MECHANICAL EQUIPMENTS The power house proposed in the scheme will have an installed capacity of 850 kW. The
electricity generated would be connected to the existing power grid system by a 300m
transmission line. A standardised turbine for 90m gross head is proposed for this particular site.
The turbine shall be complete with governor, control equipment and safety devices. The
generator would be synchronous with a brushless excitation system shall be rated to generate
850kW 11kV three phases, 50Hz and shall be suitable for coupling with turbine described
above. The generator shall have voltage regulation equipment, parallel operation equipment etc.
18.7 ENVIRONMENTAL IMPACTS
A small hydro project has been proposed at Elappilly (Idukki Dist.). The project aims to
generates about 850 kW of hydro power from a fall having a head of 90 m. Some preliminary
environmental impact analysis have been carried out. They are land, water and socio-
economical environmental impacts.
18.7.1 Environmental impact on land
The catchment area measured from toposheet comes to be 3.88sq.km. The falls are in Elappilly
stream. This is one of the main fall in this stream. The down stream side of the fall has steep
slope and it contains so many small falls. After the fall the stream joins to the Thodupuzha river
which drains to the Moovattupuzha river. The site is situated in private land. The land has
moderate slope in this area. The possibility of land slide is more in this area and the possibility of
soil erosion is less in stream. The bed of the stream is rocky and boulders are available in plenty
at site. The stream is a seasonal one and it has a head of 90m.

WGSHP - Final Report (Vol. II) Elappilly
Integrated Rural Technology Centre, Palakkad 1.11
The most significant thing is that, due to impoundment, no forest land will be submerged. The
construction of weir, penstock, power house, tailrace and temporary road will not take away any
forest land. So no forest clearance is required for the project.
18.7.2 Environmental impact on water
The Elappilly stream, which finally drains to Moovattupuzha river is the stream of this fall. The
diversion structure will create a pond of area 0.1481hectare. No forest land will be submerged.
Above all, this accounts for only 0.174 ha/MW. This diversion structure which also acts as a check
dam can increase the height of water table level at the site. The impounded water will also change soil
moisture regime in adjacent forest land.
18.7.3 Socio-economic impact
The construction phase would create employment opportunities for a period of 18 months. The peak
labour strength is 50 skilled and 100 unskilled labour. It requires only minimum land acquisition for
construction. The acquisition does not need any rehabilitation.
18.8 CONCLUSION The environmental impact of this small hydel project is negligible. No serious adverse impact is
anticipated. Moreover, deforestation owing to the inundation will be a meagre area.
The economic size of installed capacity depends upon the permissible tariff as well as the capital cost.
It was found that the project is financially viable for an installed capacity of 850kW at a project cost
of Rs. 3.5 Crores per MW and a tariff rate of Rs.2.5 per unit of electricity. Alternatively, if the tariff is
raised to Rs.3.00 per unit, an installed capacity of 1000kW would become economically viable.
Cost effective methods of construction, like the use of gabion weirs, can be used to reduce the capital
costs. A methodology for implementing the project with a maximum of peoples= participation should
also be devised. The role of the Grama Panchayath in this effort is crucial.
-�-

WGSHP - Final Report (Vol. II) Elappilly
Integrated Rural Technology Centre, Palakkad 1.12
19. VALARA
District : Idukki
Panchayath : Adimali
Head : 90 m.
Flow : Seasonal
Suggested Capacity : 7MW/ 10MW

WGSHP - Final Report (Vol. II) Valara-Idukki
Integrated Rural Technology Centre, Palakkad 1.1
19.1 GENERAL
19.1.1 The Site
Valarakuthu is a scenic water fall situated in the 1st ward of Adimali (Mannamkandom) Grama
Panchayath in Idukki District. The site is at a distance of 18 km before Adimali in Kothamangalam-
Adimali route. There is a bus route from Kothamangalam to Adimali through Valara. The site is
near to the main road. It can be see from the road. The stream is a seasonal one, but it has more
discharge in rainy season because of its large catchment.
The water fall is located at 760 50' 25" E longitude and 100 2' 44" N latitude. The catchment area
measured from topo sheet is 63.00 sq.km. The falls are situated at an elevation of 460m from
MSL, in Deviar stream which is beginning at an elevation of 1000m from MSL. This is one of the
main fall in this stream. The stream has more falls on its upstream side. The head comes to 90m
nearly. The stream flows through medium slopes on the up stream as well as down stream of the
fall. After the fall, the stream joins the Periyar river (Fig.19.1).
19.1.2 Topography
The site is situated in forest. The land is having steep slopes in this area. The possibility of land
slide is more in this site. Land slides are occurred in monsoon seasons. Soil erosion is also high in
this stream. The bed of the stream is rocky and boulders are available in plenty at site. The stream
has nearly 10 months flow and the head of the stream has 90m. The number of rainy days exceeds
50% in its catchment.
19.2 FIELD INVESTIGATION
19.2.1 Reconnaissance Survey
A topographical survey was conducted for obtaining topographical details of the site. There is one
main fall which gives a total head of 90m. The possible location for diversion structure and power
house were identified and the details were taken using tacheometric method of surveying.

WGSHP - Final Report (Vol. II) Valara-Idukki
Integrated Rural Technology Centre, Palakkad 1.2
19.2.2 Catchment Area
Topographical survey sheets to a scale of 1: 50,000 are available from the Survey of India. The
catchment of Valarakuthu was located using the toposheet. It is shown in the Fig.No.19.2. From
the shape it is identified as a fan shaped catchment and it comes to 63.00 sq.km. The catchment
area is having almost steep slopes. Maximum flood discharge measured at this site during 1998 is
about 40.16 cumec.
19.2.3 Contour Map
The survey details were plotted on a sheet of paper at a scale of 1:200. The undulations of the site,
the location of the falls and other topographical features were identified from the contour map. The
location of the weir, the alignment of the penstock and location of the power house were also
determined using this and the prepared contour map has been shown in Annexure A.19.
19.2.4 River Flow Data
For a period of 12 months (January 98 to January 99) the water level observations were taken
every week. A suitable location was identified on the up stream side of the fall, where the whole
water is flowing through that point, cross sectional details of the point were noted for calculating the
stream discharge. We fixed a measuring gauge at this point to measure the peak flow. Using the
collected data (Table 19.1) the weekly discharge hydrograph of the site is prepared. The graph is
shown in Fig. No. 19.3.
19.2.5 Flow Duration Curve
Using weekly discharge hydro graph, percentage flow of exceedence was calculated. From this,
the flow duration curve was plotted (Fig. No. 19.4). The same curve also functions as percentage
flow of exceedence graph. This river flow data is recalculated in tabular form, giving the
corresponding energy potential in weekly and cumulative mode is given in Table 19.2. These data
are used for calculating energy potential and selection of unit sizes in section 19.4.
19.2.6 Peak Flow Determination
There are various empirical methods for calculating the maximum flood discharge. The different
values obtained are shown in Table 19.3. The value obtained by Dicken=s formula, which is
commonly used in western ghats region has been used for the structural design of diversion

WGSHP - Final Report (Vol. II) Valara-Idukki
Integrated Rural Technology Centre, Palakkad 1.3
structure.
Table 19.3
Peak Flow Determination
Parameters
Dicken=s method
Ingli=s formula
Ryve=s formula
Nawab Jung
Bahadur formula
Peak flow in cumecs
581.4
904.48
159.91
1494.59
19.3 SALIENT DESIGN FEATURES
A detailed design of Civil, Electrical & Mechanical work has not been carried out in this report as
it does not come under the purview of the project, but a typical section of the proposed diversion
structure is given here. The stability analysis of the section and economic diameter of the
penstock was carried out as part of preliminary design. The capability and number of units, type
and specification of turbine, generator and it=s cost have been estimated, after consulting various
agencies.
19.3.1 Power Potential of the Project
The discharge corresponding to 80% exceedence is only 0.009cubic metre per second. A
discharge of 0.009cubic metre per second can produce only about 6 kW. However it seen that
higher flows are available during 50% of the time. In order to tap the full potential of the site, with
a head of 90metre, the project is designed to generate higher output with lower dependability. This
site can be designed as a run of the river project which can produce 3400kW with a dependability
of 40%.
The output power was computed using the formula, P = 10 x Q x H x ηη
Where; P = Power output in kW
Q = Discharge in cumec
H = Head in metres
η = Overall efficiency (Here it is assumed as 0.75)
For 50% exceedence P = 10 x 1.87 x 90 x 0.75 = 1250 kW.

WGSHP - Final Report (Vol. II) Valara-Idukki
Integrated Rural Technology Centre, Palakkad 1.5
For 40% exceedence P = 10 x 5.08 x 90 x 0.75 = 3400 kW.
For 30% exceedence P = 10 x 8.7 x 90 x 0.75 = 5500 kW.
19.3.2 Energy Potential
At this site, sufficient flow is there so that we can obtain 3400kW power output for 40% of the
time (146 days) which reduces to 3kW by 80% time (292 days). The energy input corresponding
to 40% time will be (40/100 x 3400 x 365 x 24) = 11.91 MU. The flow after 50% time can be
utilized by providing a small pondage. The quantity of water available from 35% to 100% time is
calculated to be 6825336 m3. Energy obtained from this water is calculated to be 1.28 MU.
Total amount of energy produced = 11.91 MU + 1.28 MU = 13.2 MU
It may be noted that, this much amount of energy can be generated for the particular year. If higher
flows are available during any year, it will enable higher production and vice versa.
19.3.3 Pondage Requirement
From the contour map a plot of surface area Vs. elevation is drawn in Fig.No. 19.5. The areas
corresponding to each elevation is used to find the volume of water that can be stored in each
elevation and the details are shown in Table 19.4. From this information a capacity elevation curve
of the pondage is prepared and is shown in Fig.No.19.6.
Table 19.4
Pondage Area Details Sl. No.
Elevation (m)
Area (m2)
Capacity (m3)
Energy (kWh)
1
743.50
0
0
0
2
744
257.19
64.2975
12
3
745
628.44
507.1125
95
4
746
1136.88
1389.7725
261
5
747
2286.88
3998.76
750

WGSHP - Final Report (Vol. II) Valara-Idukki
Integrated Rural Technology Centre, Palakkad 1.6
As the terrain is suitable for storing 4000m3, it follows that, at full storage, the energy capacity is
only about 750 kWh. If a single 750 kW machine is installed, it can be operated for only one hour
at full capacity during peak time. Fortunately, pondage becomes critical only during lean months,
this kid of operation practice is acceptable. Hence, a weir height of 3.5m, to create a storage of
4000m3 is suggested.
19.4 SELECTION OF PLANT CAPACITY AND UNIT SIZES
For optimization of plant capacity, the following parameters were assumed.
Rate of return on investment - 15%
Loan repayment period - 10 years
Average O/M cost - 2.5% of capital cost
Resulting standard annual cost - 25%
(This consists of 2.5% O & M costs, 15% return on 25% equity, 15% interest on 75% loan and
repayment of loan in 10 annual instalments)
Tariff (per Unit) - Rs. 2.5 and 3.0 (Two cases)
Investment cost (Rs.in Crores per MW) - Rs. 3.5 (Two cases)
Since manufacturers were not in a position to quote exact figures, no attempt was made to fine
tune the cost in relation to site specific conditions. Only ranges could be indicated. Each
combination of tariff and capital cost selected above, will demand a minimum annual generation
per kW installed. This can be taken to be the break even Plant Capacity Factor (PCF) for the
site under the specified conditions.
Lower the cost/MW and higher the price for energy, the larger will be the economically
viable installed capacity and the quantity of energy that can be economically extracted
from a given site.
Let the capital cost of Valara be Rs.3.5 crores/MW. The annual rate is 25%. Let the unit rate of
tariff offered by K.S.E.B be Rs. 2.5/kWh.

WGSHP - Final Report (Vol. II) Valara-Idukki
Integrated Rural Technology Centre, Palakkad 1.7
If X be the number of hours of operation at full load capacity,
per Mega Watt annual cost, at the rate of 25% on investment = Rs. 3.5 Crores x 0.25
per Mega Watt revenue = 1000 kW x Rs. 2.5 x X
Equating the two, we get 3,50,00,000 x 0.2.5 = X x 1000 x 2.5
X = 3,500 hrs.
It follows that, any combination of machines, that can work at full capacity for over 3500 hours
can deliver a profit, if the overall project cost is below Rs. 3.5 crores/MW and tariff is Rs. 2.5
per kilo Watt hour.
This can be explained better in terms of Plant Capacity Factor, which is defined as the ratio of
actual amount of energy obtained to the maximum energy that can be obtained from the given
installed capacity during an year, to the actual amount of energy obtained.
In this case, for the value of X = 3500 hours, PCF = (3500 / 8760) x 100 = 40%
That is, a maximum capacity, which yields a PCF of 40% is economically viable for this site.
Similarly, break even PCF for Rs.3.0 per and Rs. 3.5 Crores per Mega Watt where X=2916
hours is 33.3%.
Now we shall check various capacities of turbine size which are suitable for this two conditions.
a. Tariff: Rs.2.50/kWh and break even PCF of 40%
For an installed capacity of 7000 kW, which corresponds to about 25% flow of exceedence
from the chart, the total energy yield is the sum of:
7000 kW x (0.25 x 8760) = 0.3854 at continuous operation for 25% time of an year, and
1.53MU, which is the cumulative energy potential from 25% to 100% time as obtained from the
Chart (Table 19.3).
Total yield = 15.33MU + 10.06MU = 25.4 MU.

WGSHP - Final Report (Vol. II) Valara-Idukki
Integrated Rural Technology Centre, Palakkad 1.8
The Plant Capacity Factor, corresponding to this yield is given by :
PCF = 25.4 x 10⁸ / (7000 x 8760) = 41.4 %
This PCF is equal to the break even value of 40%.
So 550 kW will be the optimum choice for the site, if the overall project cost is below Rs.3.5 crores/MW and tariff is Rs. 2.5 per kilo Watt hour.
b. Tariff: Rs.3.0/kWh and break even PCF of 33.3%
Similarly, for 10000 kW (for 13.5% flow of exceedence)
PCF = (30130000/10000 x 8760) x 100 = 34.4%
This PCF is very near to the break even value of 33%.
Similarly, 650 kW will be the optimum choice for the site, if the overall project cost is
below Rs. 3.5 crores/MW and tariff is Rs. 3.0 per kilo Watt hour.
Table 19.5
Economically Viable Maximum Capacity at Different Costs and Tariff
Tariff
Unit size for
Rs.3.5 Crores/MW
Rs.2.5/Unit
7000 kW
Rs.3.00/ Unit
10000 kW
The units selected can be one of the following combinations:
For Rs.3.5 Crores/MW and Rs.2.5/Unit we can opt (5MW x 1 + 1 MW x 2)
For Rs.3.5 Crores/MW and Rs.3.0/Unit we can opt (5MW x 1 + 2 MW x 2 + 1MW x 1)
Among these two categories, the second one seems to be less viable since it is bulky with units.
We have restricted ourselves to the more realistic combination of Rs. 3.5 Crores/MW of
investment cost and two tariff choices of Rs.2.5/Unit and Rs.3.0/Unit.
19.5 CIVIL ENGINEERING WORKS

WGSHP - Final Report (Vol. II) Valara-Idukki
Integrated Rural Technology Centre, Palakkad 1.9
The important Civil Engineering Works required for the project are a diversion weir, an intake
structure, a penstock and a power house. A weir is constructed to have a small storage and to
divert the water from stream to the intake. For this project only a diversion weir is proposed,
which allows the excess water to flow over the weir to the downstream. The intake structure
takes water from the weir and leads it to the penstock. The penstock made of steel is proposed
in this site. A power house is constructed for the purpose of housing the electro mechanical
equipment. It is usually a small building of 12.5m x 8m.
19.5.1 Weir at Valarakuthu
A concrete weir has been proposed on the Deviar stream, at a bed level of +742.600 metres. The
base width of the weir at bed level is 6.35m. The structure is 3m high having a length of 40m at the
top with a central broad crested free over fall type spill way. The cross sectional details of the
proposed diversion site is shown in Fig.No. 19.7.
19.5.2 Intake Structure, Penstock and Power House
A simple box type, direct intake structure of reinforced cement concrete is provided on the stream
bed. A trash rack is provided at the intake mouth, the penstock entrance starts from the wall of
intake box near the gabion. The economic diameter of the penstock is calculated as 1.9m and the
thickness of the penstock is found as 8mm. The penstock can carry a maximum flow of 10.37
cumec with a velocity of 3.66 metre per second. The possible alignment for the penstock is
located on the left bank of the stream. The longitudinal section of the proposed penstock line was
drawn from the contour map and the length was calculated, which came to 259m (Fig. No. 19.8).
A surface power house is proposed on the left bank of the stream. The slope at the proposed site
is moderate but increases up the hill towards north east direction. The power house is of size 12.5
mx 8m to accommodate 7000 kW generator and standardised turbine.
19.6 ELECTRICAL AND MECHANICAL EQUIPMENTS

WGSHP - Final Report (Vol. II) Valara-Idukki
Integrated Rural Technology Centre, Palakkad 1.10
The power house proposed in the scheme will have an installed capacity of 7000 kW. The electricity
generated would be connected to the existing power grid system at Valara by a 300m transmission
line. A standardised turbine for 90m gross head is proposed for this particular site. The turbine shall
be complete with governor, control equipment and safety devices. The generator would be
synchronous with a brushless excitation system shall be rated to generate 7000kW, 11kV three
phases, 50Hz and shall be suitable for coupling with turbine described above. The generator shall
have voltage regulation equipment, parallel operation equipment etc.
19.7 ENVIRONMENTAL IMPACTS
A small hydro project has been proposed at Valara (Idukki Dist.). The project aims to generates
about 3400 kW of hydro power from a fall having a head of 90 m. Some preliminary environmental
impact analysis have been carried out. They are land, water and socio-economical environmental
impacts.
19.7.1 Environmental Impact on Land
The catchment area measured from topo sheet comes to be 63.00 sq.km. The falls are situated in
Deviar stream. This is one of the main fall in this stream. The stream has more falls on its upstream side.
The head comes to 90m nearly. The stream flows through medium slopes on the up stream as well as
down stream side of the fall. After the fall, the stream joins to the Periyar river.
The most significant thing is that, due to impoundment, no forest land will be submerged. The
construction of weir, penstock, power house, tailrace and temporary road will not take away any forest
land. So no Forest clearance is required for the project.
19.7.2 Environmental Impact on Water
The Deviar stream which drains to Periyar river is the stream of this fall. The diversion structure will
create a pond of area 0.2286 hectare. No forest land will be submerged. Above all, this accounts for
only 0.033 ha/MW. This diversion structure which also acts as a check dam can increase the height of
water table level at the site. The impounded water will also change soil moisture regime in adjacent
forest land.
19.7.3 Socio-economic Impact
The construction phase would create employment opportunities for a period of 18 months. The peak

WGSHP - Final Report (Vol. II) Valara-Idukki
Integrated Rural Technology Centre, Palakkad 1.11
labour strength is 100 skilled and 250 unskilled labour. It requires only minimum land acquisition for
construction. The acquisition does not need any rehabilitation.

WGSHP - Final Report (Vol. II) Valara-Idukki
Integrated Rural Technology Centre, Palakkad 1.12
19.8 CONCLUSION
The environmental impact of this small hydel project is negligible. No serious adverse impact is
anticipated. Moreover, deforestation owing to the inundation will be a meagre area.
The economic size of installed capacity depends upon the permissible tariff as well as the capital
cost. It was found that the project is financially viable for an installed capacity of 7000kW at a
project cost of Rs. 3.5 Crores per MW and a tariff rate of Rs.2.5 per unit of electricity.
Alternatively, if the tariff is raised to Rs.3.00 per unit, an installed capacity of 10000kW would
become economically viable.
Cost effective methods of construction, like the use of gabion weirs, can be used to reduce the
capital costs. A methodology for implementing the project with a maximum of peoples=
participation should also be devised. The role of the Grama Panchayath in this effort is crucial.
-�-
20. VALARA

WGSHP - Final Report (Vol. II) Valara-Idukki
Integrated Rural Technology Centre, Palakkad 1.13
District : Thrissur
Panchayath : Athirappilly
Head : 90 m.
Flow : Seasonal
Suggested Capacity : 2.5MW/ 3MW

WGSHP - Final Report (Vol. II) Valara-Thrissur
Integrated Rural Technology Centre, Palakkad 1.1
20.1 GENERAL
20.1.1 The Site
The Valarakuthu is a scenic waterfall is situated in Aroormuzhi, which is in the 2nd ward of
Athirappilly Grama Panchayath in Thrissur District. The site is at a distance of 22 km from
Chalakkudy. There is a bus route from Chalakkudy to Athirappilly through Aroormuzhi. From
there through a forest foot path of nearly 4 km long we can reach the site. The site is in forest
land. The nearest 11kV line is at Aroormuzhi 4 km away from site. The site contains two falls
which gives a head of 90m.
The water fall is located at 760 29' 30" E longitude and 100 17' 30" N latitude. The catchment
area measured from topo sheet is 0.88sq.km. The falls are situated at an elevation of 200m from
MSL, in Aroormuzhithodu which is beginning at an elevation of 500m. There is two falls in the
site . The upstream side of the fall has gentle slope while the down stream has moderate slope.
After the fall the stream joins the Chalakkudy puzha near to Aroormuzhi, which drains to the
Periyar river (Fig.No.20.1).
20.1.2 Topography
The site is situated in Valara reserved forest. The forest is very thick. The land is having steeply
sloping in this area. There is no possibility for land slides in this area and chances for soil erosion
are negligible. Boulders are available in plenty at site and the bed of stream is rocky. The number
of rainy days exceeds 50% in its catchment.
20.2 FIELD INVESTIGATION
20.2.1 Reconnaissance Survey
A topographical survey was conducted for obtaining topographical details of the site. There is
one main fall which gives a total head of 90m. The possible location for diversion structure and
power house were identified and the details were taken using tacheometric method of surveying.

WGSHP - Final Report (Vol. II) Valara-Thrissur
Integrated Rural Technology Centre, Palakkad 1.2
20.2.2 Catchment Area
Topographical survey sheets to a scale of 1: 50,000 are available from the Survey of India. The
catchment of valarathodu was located using the toposheet. It is shown in the Fig.No.20.2. From
the shape it is identified as a fan shaped catchment and its area is measured as 0.88sq.km. The
catchment area is having almost moderate slope but some portions are very steep. Maximum
flood discharge measured at this site during 1998 is about 5.85 cumec.
20.2.3 Contour Map
The survey details were plotted on a sheet of paper at a scale of 1:200. The undulations of the
site, the location of the falls and other topographical features were identified from the contour
map. The location of the weir, the alignment of the penstock and location of the power house
were also determined using this and the prepared contour map has been shown in Annexure
A.20.
20.2.4 River Flow Data
For a period of 12 months (March 98 to March 99) the water level observations were taken
every week. A suitable location was identified on the down stream side of the fall, where the
whole water is flowing through that point, cross sectional details of the point were noted for
calculating the stream discharge. We fixed a measuring gauge at this point to measure the peak
flow. Using the collected data (Table 20.1) the weekly discharge hydrograph of the site is
prepared. The graph is shown in Fig. No. 20.3.
20.2.5 Flow Duration Curve
Using weekly discharge hydro graph, percentage flow of exceedence was calculated. From this,
the flow duration curve was plotted (Fig. No. 20.4). The same curve also functions as
percentage flow of exceedence graph. This river flow data is recalculated in tabular form, giving
the corresponding energy potential in weekly and cumulative mode is given in Table 20.2. These
data are used for calculating energy potential and selection of unit sizes in section 20.4.
20.2.6 Peak Flow Determination
There are various empirical methods for calculating the maximum flood discharge. The different
values obtained are shown in Table 20.3. The value obtained by Dicken=s formula, which is

WGSHP - Final Report (Vol. II) Valara-Thrissur
Integrated Rural Technology Centre, Palakkad 1.3
commonly used in western ghats region has been used for the structural design.
Table 20.3
Peak Flow Determination
Parameters
Dicken=s method
Ingli=s formula
Ryve=s formula
Nawab Jung
Bahadur formula
Peak flow in cumecs
23.52
32.05
9.24
47.67
20.3 SALIENT DESIGN FEATURES
A detailed design of Civil, Electrical & Mechanical work has not been carried out in this report as
it does not come under the purview of the project, but a typical section of the proposed diversion
structure is given here. The stability analysis of the section and economic diameter of the
penstock was carried out as part of preliminary design. The capability and number of units, type
and specification of turbine, generator and it=s cost have been estimated, after consulting various
agencies.
20.3.1 Power Potential of the Project
The discharge corresponding to 80% exceedence is only 0.02cubic metre per second. A
discharge of 0.02 cubic metre per second can produce only about 14kW. However it seen that
much higher flows are available during 50% of the time. In order to tap the full potential of the
site, with a head of 90 metre, the project is designed to generate higher output with lower
dependability. This site can be designed as a run of the river project which can produce
1000kW with a dependability of 50%.
The output power was computed using the formula, P = 10 x Q x H x ηη
Where; P = Power output in kW
Q = Discharge in cumec
H = Head in metres
η = Efficiency taken as 0.75
For 50% exceedence P = 10 x 1.5 x 90 x 0.75 = 1000 kW.
For 40% exceedence P = 10 x 2.04 x 90 x 0.75 = 1350 kW.

WGSHP - Final Report (Vol. II) Valara-Thrissur
Integrated Rural Technology Centre, Palakkad 1.5
For 30% exceedence P = 10 x 2.4 x 90 x 0.75 = 1600 kW.
20.3.2 Energy Potential
At this site, sufficient flow is there so that we can obtain 1000kW power output for 50% of the
time (183days) which reduces to 13kW by 80% time (292 days). The energy input
corresponding to 50% time will be (50/100 * 1000 * 365 * 24) = 4.38 MU. The flow after
50% time can be utilized by providing a small pondage. The quantity of water available from
50% to 100% time is calculated to be 2516888 m3. Energy obtained from this water is
calculated to be 0.4724 MU.
Total amount of energy produced = 4.38 MU + 0.4724 MU = 4.85 MU
It may be noted that, this much amount of energy can be generated for the particular year. If
higher flows are available during any year, it will enable higher production and vice versa.
20.3.3 Pondage Requirement
From the contour map a plot of surface area Vs. elevation is drawn in Fig.No. 20.5. The areas
corresponding to each elevation is used to find the volume of water that can be stored in each
elevation and the details are shown in Table 20.4. From this information a capacity elevation
curve of the pondage is prepared and is shown in Fig.No.20.6.
Table 20.4
Pondage Area Details Sl. No.
Elevation (m)
Area (m2)
Capacity (m3)
Energy (kWh)
1
296.50
0
0
0
2
297
54.60
13.65
3
3
298
166.20
124.05
23
4
299
232.60
323.45
61
5
300
347.60
713.55
134
6
301
858.00
1416.35
266

WGSHP - Final Report (Vol. II) Valara-Thrissur
Integrated Rural Technology Centre, Palakkad 1.6
7 302 1450.00 2570.35 482
As the terrain is suitable for storing 2550m3, it follows that, at full storage, the energy capacity is
only about 450 kWh. If a single 450 kW machine is installed, it can be operated for only one
hour at full capacity during peak time. Fortunately, pondage becomes critical only during lean
months, this kid of operation practice is acceptable. Hence, a weir height of 3.5m, to create a
storage of 2550m3 is suggested.
20.4 SELECTION OF PLANT CAPACITY AND UNIT SIZES
For optimization of plant capacity, the following parameters were assumed.
Rate of return on investment - 15%
Loan repayment period - 10 years
Average O/M cost - 2.5% of capital cost
Resulting standard annual cost - 25%
(This consists of 2.5% O & M costs, 15% return on 25% equity, 15% interest on 75% loan and repayment of loan in 10 annual instalments)
Tariff (per Unit) - Rs. 2.5 and 3.0 (Two cases)
Investment cost (Rs. in Crores per MW) - Rs. 3.5 (Two cases)
Since manufacturers were not in a position to quote exact figures, no attempt was made to fine
tune the cost in relation to site specific conditions. Only ranges could be indicated. Each
combination of tariff and capital cost selected above, will demand a minimum annual generation
per kW installed. This can be taken to be the break even Plant Capacity Factor (PCF) for the
site under the specified conditions.
Lower the cost/MW and higher the price for energy, the larger will be the economically
viable installed capacity and the quantity of energy that can be economically extracted
from a given site.

WGSHP - Final Report (Vol. II) Valara-Thrissur
Integrated Rural Technology Centre, Palakkad 1.7
Let the capital cost of Valara be Rs.3.5 crores/MW. The annual rate is 25%. Let the unit rate of
tariff offered by K.S.E.B be Rs. 2.5/kWh.
If X be the number of hours of operation at full load capacity,
per Mega Watt annual cost, at the rate of 25% on investment = Rs. 3.5 Crores x 0.25
per Mega Watt revenue = 1000 kW x Rs. 2.5 x X
Equating the two, we get 3,50,00,000 x 0.2.5 = X x 1000 x 2.5
X = 3,500 hrs.
It follows that, any combination of machines, that can work at full capacity for over 3500 hours
can deliver a profit, if the overall project cost is below Rs. 3.5 crores/MW and tariff is Rs. 2.5
per kilo Watt hour.
This can be explained better in terms of Plant Capacity Factor, which is defined as the ratio of
actual amount of energy obtained to the maximum energy that can be obtained from the given
installed capacity during an year, to the actual amount of energy obtained.
In this case, for the value of X = 3500 hours, PCF = (3500 / 8760) x 100 = 40%
That is, a maximum capacity, which yields a PCF of 40% is economically viable for this site.
Similarly, break even PCF for Rs.3.0 per and Rs. 3.5 Crores per Mega Watt where X=2916
hours is 33.3%.
Now we shall check various capacities of turbine size which are suitable for this two conditions.
a. Tariff: Rs.2.50/kWh and break even PCF of 40%
For an installed capacity of 2500 kW, which corresponds to about 10% flow of exceedence
from the chart, the total energy yield is the sum of:
2500 kW x (0.1 x 8760) = 0.3854 at continuous operation for 10% time of an year, and
6.5MU, which is the cumulative energy potential from 10% to 100% time as obtained from the

WGSHP - Final Report (Vol. II) Valara-Thrissur
Integrated Rural Technology Centre, Palakkad 1.8
Chart (Table 20.3).
Total yield = 2.2MU + 6.5MU = 8.7 MU.
The Plant Capacity Factor, corresponding to this yield is given by :
PCF = 8.7 x 10⁸ / (2500 x 8760) = 39.70 %
This PCF is equal to the break even value of 40%.
So 2500 kW will be the optimum choice for the site, if the overall project cost is below
Rs.3.5 crores/MW and tariff is Rs. 2.5 per kilo Watt hour.
b. Tariff: Rs.3.0/kWh and break even PCF of 33.3%
Similarly, for 3000 kW (for 4% flow of exceedence)
PCF = (9050000/3000 x 8760) x 100 = 34.4%
This PCF is very near to the break even value of 33%.
Similarly, 3000 kW will be the optimum choice for the site, if the overall project cost is
below Rs. 3.5 crores/MW and tariff is Rs. 3.0 per kilo Watt hour.
Table 20.5
Economically Viable Maximum Capacity at Different Costs and Tariff
Tariff
Unit size for Rs.3.5 Crores/MW
Rs.2.5/Unit
2500 kW
Rs.3.00/ Unit
3000 kW
The units selected can be one of the following combinations:
For Rs.3.5 Crores/MW and Rs.2.5/Unit we can opt (1MW x 2 + 0.5 MW x 1)
For Rs.3.5 Crores/MW and Rs.3.0/Unit we can opt (1 MW x 3)
Among these two categories, the second one seems to be less viable since it is bulky with units.
We have restricted ourselves to the more realistic combination of Rs. 3.5 Crores/MW of
investment cost and two tariff choices of Rs. 2.5/Unit and Rs. 3.0/Unit.

WGSHP - Final Report (Vol. II) Valara-Thrissur
Integrated Rural Technology Centre, Palakkad 1.9
20.5 CIVIL ENGINEERING WORKS
The important Civil Engineering Works required for the project are a diversion weir, an intake
structure, a penstock and a power house. A weir is constructed to have a small storage and to divert
the water from stream to the intake. For this project only a diversion weir is proposed, which allows
the excess water to flow over the weir to the downstream. The intake structure takes water from the
weir and leads it to the penstock. The penstock made of steel is proposed in this site. A power house
is constructed for the purpose of housing the electro mechanical equipment. It is usually a small
building of size 12.5m x 8m.
20.5.1 Weir at Valarakuthu
A gabion weir has been proposed on the Aroormuzhi thodu, at a bed level of +296.000 metres. The
base width of the weir at bed level is 2.95m. The structure is 3m high having a length of 23.50m at the
top with a central broad crested free over fall type spill way. the cross sectional details of the
proposed diversion site is shown in Fig.No. 20.7.
20.5.2 Intake Structure, Penstock and Power House
A simple box type, direct intake structure of reinforced cement concrete is provided on the stream
bed. A trash rack is provided at the intake mouth, the penstock entrance starts from the wall of intake
box near the gabion. The economic diameter of the penstock is calculated as 1.22m and the thickness
of the penstock is found as 10mm. The penstock can carry a maximum flow of 3.7 cumec with a
velocity of 3.16 metre per second. The possible alignment for the penstock is located on the left bank
of the stream. The longitudinal section of the proposed penstock line was drawn from the contour
map and the length was calculated, which came to 210m (Fig. No. 20.8).
A surface power house is proposed on the left bank of the stream. The slope at the proposed site is
moderate but increases up the hill towards north east direction. The power house is of size 12.5m x
8m to accommodate 2500 kW, generator and standardised turbine.
20.6 ELECTRICAL AND MECHANICAL EQUIPMENTS
The power house proposed in the scheme will have an installed capacity of 2500 kW. The electricity
generated would be connected to the existing power grid system at Aroormuzhi by a 300m
transmission line. A standardised turbine for 90m gross head is proposed for this particular site. The

WGSHP - Final Report (Vol. II) Valara-Thrissur
Integrated Rural Technology Centre, Palakkad 1.10
turbine shall be complete with governor, control equipment and safety devices. The generator would
be synchronous with a brushless excitation system shall be rated to generate 2500kW 11kV three
phases, 50Hz and shall be suitable for coupling with turbine described above. The generator shall
have voltage regulation equipment, parallel operation equipment etc.
20.7 ENVIRONMENTAL IMPACTS
A small hydro project has been proposed at Valara (Thrissur Dist). The project aims to generates
about 2500 kW of hydro power from a fall having a head of 90m. Some preliminary environmental
impact analysis have been carried out. They are land, water and socio-economical environmental
impacts.
20.7.1 Environmental Impact on Land
The catchment area measured from topo sheet comes to be 0.88sq.km. The falls are situated in
Aroormuzhithodu. There is two falls in the site. The upstream side of the fall has gentle slope while
the down stream has moderate slope. After the fall the stream joins to the Chalakkudi puzha near to
Aroormuzhi, which drains to the Periyar river.
The most significant thing is that, due to impoundment, no forest land will be submerged. The
construction of weir, penstock, power house, tailrace and temporary road will not take away any
forest land. So no forest clearance is required for the project.
20.7.2 Environmental Impact on Water
The Aroormuzhithodu, which finally drains to Periyar river is the stream of this fall. The diversion
structure will create a pond of area 0.145 hectare. No forest land will be submerged. Above all, this
accounts for only 0.058ha/MW. This diversion structure which also acts as a check dam can increase
the height of water table level at the site. The impounded water will also change soil moisture regime in
adjacent forest land.
20.7.3 Socio-economic Impact
The construction phase would create employment opportunities for a period of 18 months. The peak
labour strength is 100 skilled and 100 unskilled labour. It requires only minimum land acquisition for
construction. The acquisition does not need any rehabilitation.

WGSHP - Final Report (Vol. II) Valara-Thrissur
Integrated Rural Technology Centre, Palakkad 1.11
20.8 CONCLUSION
The environmental impact of this small hydel project is negligible. No serious adverse impact is
anticipated. Moreover, deforestation owing to the inundation will be a meagre area.
The economic size of installed capacity depends upon the permissible tariff as well as the capital cost.
It was found that the project is financially viable for an installed capacity of 2500kW at a project cost
of Rs. 3.5 Crores per MW and a tariff rate of Rs.2.5 per unit of electricity. Alternatively, if the tariff is
raised to Rs.3.00 per unit, an installed capacity of 3000 kW would become economically viable.
Cost effective methods of construction, like the use of gabion weirs, can be used to reduce the capital
costs. A methodology for implementing the project with a maximum of peoples= participation should
also be devised. The role of the Grama Panchayath in this effort is crucial.
-�-
21. POOMALA

WGSHP - Final Report (Vol. II) Valara-Thrissur
Integrated Rural Technology Centre, Palakkad 1.12
District : Idukki
Panchayath : Velliamattom
Head : 90 m.
Flow : Perennial
Suggested Capacity : 850 kW/ 1.1 MW
WGSHP - Final Report (Vol. II) Poomala
Integrated Rural Technology Centre, Palakkad 1.1
21.1 GENERAL
21.1.1 The Site
The Njandirukki water fall is situated in Poomala, which is in the 7th ward of Velliamattom
Grama Panchayath in Idukki District. The site at a distance of 3 km from Poomala near to
Velliamattom Grama Panchayath. There is bus service from Thodupuzha to Poomala. From
there jeeps are available to the upstream side of the fall. The 11 KV transformer is at a distance
of 1 km from the site.
The water fall is located at 760 52' 0" E longitude and 9 0 50' 33" N latitude. The catchment area
measured from topo sheet is be 0.63 sq. km. The falls are situated at an elevation of 260m from
MSL, in Njandirukki stream which is beginning at an elevation of 550m. The site contains 3 falls
which gives a total head of 90m. After the fall, the stream joins to the Thodupuzha river which
drains to Moovattupuzha (Fig.No.21.1).
21.1.2 Topography
Topography of any site means the description of the geographical details of the site. The site is
situated in private land. The land is having steep slopes in this area. There is no possibility of
landslide is this area and the chances for soil erosion is less and it is negligible. The bed of the
stream is rocky and boulders are available in site. The site is perennial and number of rainy days
exceeds 50% in its catchment.
21.2 FIELD INVESTIGATION
21.2.1 Reconnaissance Survey
A topographical survey for obtaining topographical details of the site. There is one main fall
which gives a total head of 20m. The possible location for diversion structure and power house
are identified and the details are taken using tacheometric method of surveying.

WGSHP - Final Report (Vol. II) Poomala
Integrated Rural Technology Centre, Palakkad 1.2
21.2.2 Catchment Area
Topographical survey sheets to a scale of 1: 50,000 are available from the Survey of India. The
catchment of Poomala-Njandirukki was located using the toposheet. It is shown in the
Fig.No.21.2. From the shape it is identified as a fan shaped catchment and it comes to 0.63m.
The catchment area having almost moderate slope but some portions are very steep. Maximum
flood discharge measured at this site during 1998 is about 1.87 cumec.
21.2.3 Contour Map
The survey details were plotted on a sheet of paper at a scale of 1:200. The undulations of the
site, the location of the falls and other topographical features were identified from the contour
map. The location of the weir, the alignment of the penstock and location of the power house
was also determined using this and the prepared contour map has been shown in Annexure
A.21.
21.2.4 River Flow Data
For a period of 12 months (November 98 to November 99) the water level observations were
taken in every week. A suitable location was identified on the upstream of the fall, where the
whole water is flowing through that point, cross sectional details of the point was noted for
calculating discharge of stream. We fixed a measuring gauge at this point to measure the peak
flow. Using the collected data (Table 21.1) the weekly discharge hydrograph of the site is
prepared. The graph is shown in Fig. No. 21.3.
21.2.5 Flow Duration Curve
Using weekly discharge hydro graph, percentage flow of exceedence was calculated. From this,
the flow duration curve was plotted (Fig. No. 21.4). The same curve also functions as
percentage flow of exceedence graph. This river flow data is recalculated in tabular form, giving
the corresponding energy potential in weekly and cumulative mode is given in Table 21.2. These
data are used for calculating energy potential and selection of unit sizes in section 21.4.

WGSHP - Final Report (Vol. II) Poomala
Integrated Rural Technology Centre, Palakkad 1.3
21.2.6 Peak Flow Determination
There are various empirical methods for calculating the maximum flood discharge. The different
values obtained are shown in Table 21.3. The value obtained by Dicken=s formula, which is
commonly used in western ghats region has been used for the structural design of diversion
structure.
Table 21.3
Peak Flow Determination
Parameters
Dicken=s method
Ingli=s formula
Ryve=s formula
Nawab Jung
Bahadur formula Peak flow in
cumecs
18.28
23.15
7.38
34.64
21.3 SALIENT DESIGN FEATURES
A detailed design of Civil, Electrical, Mechanical work have not been carried out in this report as
it is does not come under the purview of the project, but a typical section of the proposed
diversion structure is given here. The stability analysis of the section and economic diameter of
the penstock was carried out as part of preliminary design. The capability and number of units,
type and specification of turbine, generator and it=s cost are fixed consulting various agencies.
21.3.1 Power Potential of the Project
The discharge corresponding to 80% of exceedence is only 0.023 cubic metre per second. A
discharge of 0.023cubic metre per second can produce only about 15 KW. In order to tap the
full potential of the site, with a head of 90 metre, the project is designed to generate higher output
with lower dependability. This site can be designed as run off the river which can produce 200
kW with a dependability of 40%.
The output power was computed using the formula, P = 10 x Q x H x ηη
Where; P = Power output in kW
Q = Discharge in cumec

WGSHP - Final Report (Vol. II) Poomala
Integrated Rural Technology Centre, Palakkad 1.4
H = Head in metres
η = Overall efficiency (here it is assumed as 0.75)
For 50% exceedence P = 10 x 0.19 x 90 x 0.75 = 125 kW.
For 40% exceedence P = 10 x 0.319 x 90 x 0.75 = 200 kW.
For 30% exceedence P = 10 x 1.3 x 90 x 0.75 = 875 kW.
21.3.2 Energy Potential
At this site, sufficient flow is there so that we can obtain 200kW power output for 40% of the
time (146 days) which reduces to 15kW by 80% time (292 days). The energy input
corresponding to 40% time will be (40/100 * 200 * 365 * 24) = 0.7 MU. The flow after 40%
time can be utilized by providing a small pondage. The quantity of water available from 40% to
100% time is calculated to be 1009572 m3. Energy obtained from this water is calculated to be
0.187 MU.
Total amount of energy produced = 0.70 MU + 0.187 MU = 0.887 MU
21.3.3 Pondage Requirement
From the contour map a plot of surface area Vs. elevation is drawn in Fig. No. 21.5. The areas
corresponding to each elevation is used to find the volume of water that can be stored in each
elevation and the details is shown in Table 21.4. From this information capacity elevation curve
of the pondage is prepared and is shown in Fig.No. 21.6.
Table 21.4
Pondage Area Details Sl. No.
Elevation (m)
Area (m2)
Capacity (m3)
Energy (kWh)
1
192.75
0
0
0
2
196
43.4
70.53
1
3
199
185.2
413.13
8
4
201
512.2
1110.5
21

WGSHP - Final Report (Vol. II) Poomala
Integrated Rural Technology Centre, Palakkad 1.5
5 202 697 1715 32
6
204
1060.2
3472
65
As the terrain is suitable for storing 3450m3, it follows that, at full storage, the energy capacity is
only about 65kWh. If a single 65kW machine is installed, it can be operated for only one hour at
full capacity during peak time. Fortunately, pondage becomes critical only during lean months,
this kid of operation practice is acceptable. Hence, a weir height of 11.25m, to create a storage
of 3450m3 is suggested.
20.4 SELECTION OF PLANT CAPACITY AND UNIT SIZES
For optimization of plant capacity, the following parameters were assumed.
Rate of return on investment - 15%
Loan repayment period - 10 years
Average O/M cost - 2.5% of capital cost
Resulting standard annual cost - 25%
(This consists of 2.5% O & M costs, 15% return on 25% equity, 15% interest on 75% loan and
repayment of loan in 10 annual instalments)
Tariff (per Unit) - Rs. 2.5 and 3.0 (Two cases)
Investment cost (Rs. in Crores per MW) - Rs. 3.5 (Two cases)
Since manufacturers were not in a position to quote exact figures, no attempt was made to fine
tune the cost in relation to site specific conditions. Only ranges could be indicated. Each
combination of tariff and capital cost selected above, will demand a minimum annual generation
per kW installed. This can be taken to be the break even Plant Capacity Factor (PCF) for the
site under the specified conditions.
Lower the cost/MW and higher the price for energy, the larger will be the economically
viable installed capacity and the quantity of energy that can be economically extracted
from a given site.

WGSHP - Final Report (Vol. II) Poomala
Integrated Rural Technology Centre, Palakkad 1.6
Let the capital cost of Poomala be Rs.3.5 crores/MW. The annual rate is 25%. Let the unit rate
of tariff offered by K.S.E.B be Rs. 2.5/kWh.
If X be the number of hours of operation at full load capacity,
per Mega Watt annual cost, at the rate of 25% on investment = Rs. 3.5 Crores x 0.25
per Mega Watt revenue = 1000 kW x Rs. 2.5 x X
Equating the two, we get 3,50,00,000 x 0.2.5 = X x 1000 x 2.5
X = 3,500 hrs.
It follows that, any combination of machines, that can work at full capacity for over 3500 hours
can deliver a profit, if the overall project cost is below Rs. 3.5 crores/MW and tariff is Rs. 2.5
per kilo Watt hour.
This can be explained better in terms of Plant Capacity Factor, which is defined as the ratio of
actual amount of energy obtained to the maximum energy that can be obtained from the given
installed capacity during an year, to the actual amount of energy obtained.
In this case, for the value of X = 3500 hours, PCF = (3500 / 8760) x 100 = 40%
That is, a maximum capacity, which yields a PCF of 40% is economically viable for this site.
Similarly, break even PCF for Rs.3.0 per and Rs. 3.5 Crores per mega watt where X=2916
hours is 33.3%
Now we shall check various capacities of turbine size which are suitable for this two conditions.
a. Tariff: Rs.2.50/kWh and break even PCF of 40%
For an installed capacity of 850 kW, which corresponds to about 25% flow of exceedence from
the chart, the total energy yield is the sum of:
850 kW x (0.25 x 8760) = 0.3854 at continuous operation for 25% time of an year, and
1.11MU, which is the cumulative energy potential from 25% to 100% time as obtained from the
Chart (Table 21.3).
Total yield = 1.86MU + 1.1MU = 3 MU.
The Plant Capacity Factor, corresponding to this yield is given by :

WGSHP - Final Report (Vol. II) Poomala
Integrated Rural Technology Centre, Palakkad 1.7
PCF = 3 x 10⁸ / (550 x 8760) = 40.29 %
This PCF is equal to the break even value of 40%.
So 850 kW will be the optimum choice for the site, if the overall project cost is below Rs.3.5 crores/MW and tariff is Rs. 2.5 per kilo Watt hour.
b. Tariff: Rs.3.0/kWh and break even PCF of 33.3%
Similarly, for 1100 kW (for 8% flow of exceedence)
PCF = (3270000 / 1100 x 8760) x 100 = 33.9%
This PCF is very near to the break even value of 33%.
Similarly, 1100 kW will be the optimum choice for the site, if the overall project cost is
below Rs. 3.5 crores/MW and tariff is Rs. 3.0 per kilo Watt hour.
Table 21.5
Economically Viable Maximum Capacity at Different Costs and Tariff
Tariff
Unit size for Rs.3.5 Crores/MW
Rs.2.5/Unit
850 kW
Rs.3.00/ Unit
1100 kW
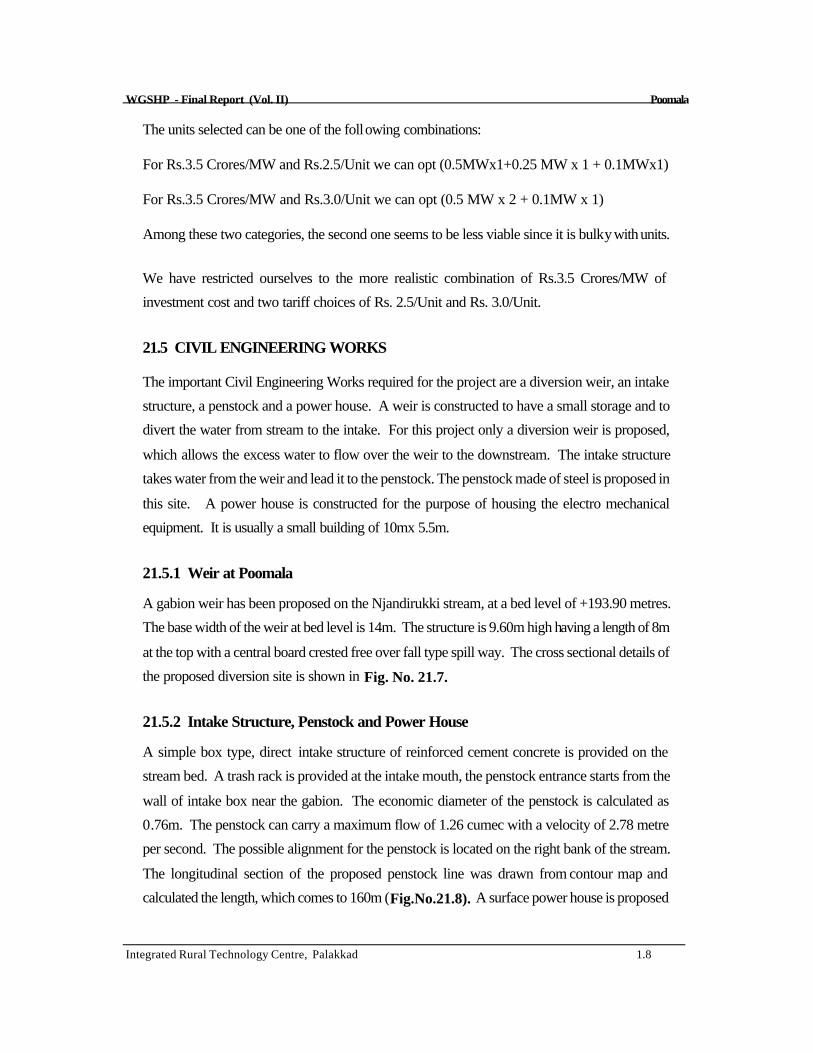
WGSHP - Final Report (Vol. II) Poomala
Integrated Rural Technology Centre, Palakkad 1.8
The units selected can be one of the following combinations:
For Rs.3.5 Crores/MW and Rs.2.5/Unit we can opt (0.5MWx1+0.25 MW x 1 + 0.1MWx1)
For Rs.3.5 Crores/MW and Rs.3.0/Unit we can opt (0.5 MW x 2 + 0.1MW x 1)
Among these two categories, the second one seems to be less viable since it is bulky with units.
We have restricted ourselves to the more realistic combination of Rs.3.5 Crores/MW of
investment cost and two tariff choices of Rs. 2.5/Unit and Rs. 3.0/Unit.
21.5 CIVIL ENGINEERING WORKS
The important Civil Engineering Works required for the project are a diversion weir, an intake
structure, a penstock and a power house. A weir is constructed to have a small storage and to
divert the water from stream to the intake. For this project only a diversion weir is proposed,
which allows the excess water to flow over the weir to the downstream. The intake structure
takes water from the weir and lead it to the penstock. The penstock made of steel is proposed in
this site. A power house is constructed for the purpose of housing the electro mechanical
equipment. It is usually a small building of 10mx 5.5m.
21.5.1 Weir at Poomala
A gabion weir has been proposed on the Njandirukki stream, at a bed level of +193.90 metres.
The base width of the weir at bed level is 14m. The structure is 9.60m high having a length of 8m
at the top with a central board crested free over fall type spill way. The cross sectional details of
the proposed diversion site is shown in Fig. No. 21.7.
21.5.2 Intake Structure, Penstock and Power House
A simple box type, direct intake structure of reinforced cement concrete is provided on the
stream bed. A trash rack is provided at the intake mouth, the penstock entrance starts from the
wall of intake box near the gabion. The economic diameter of the penstock is calculated as
0.76m. The penstock can carry a maximum flow of 1.26 cumec with a velocity of 2.78 metre
per second. The possible alignment for the penstock is located on the right bank of the stream.
The longitudinal section of the proposed penstock line was drawn from contour map and
calculated the length, which comes to 160m (Fig.No.21.8). A surface power house is proposed

WGSHP - Final Report (Vol. II) Poomala
Integrated Rural Technology Centre, Palakkad 1.9
on the right bank of stream The slope at the proposed site is moderate. The power house is of
size 10mx 5.5m, to accommodate 850 kW, generator and standardised turbine.
21.6 ELECTRICAL AND MECHANICAL EQUIPMENTS
The power house proposed in the scheme will have an installed capacity of 850 kW. The
electricity generated would be connected to the existing power grid system at Poomala by a 2km
transmission line. A standardised turbine for 20m gross head is proposed for this particular site.
The turbine shall be complete with governor, control equipment and safety devices. The
generator would be synchronous with a brushless excitation system shall be rated to generate
850kW, 11kV three phases, 50Hz and shall be suitable for coupling with turbine described
above. The generator shall have voltage regulation equipment, parallel operation equipment etc.
21.7 ENVIRONMENTAL IMPACTS
A small hydro project has been proposed at Njandirukki-Poomala (Idukki Dist.). The project
aims to generates about 850 kW of hydro power from a fall having a head of 90m. Some
preliminary environmental impact analysis have been carried out. They are land, water and
socio-economical environmental impacts.
21.7.1 Environmental Impact on Land
The catchment area measured from topo sheet comes to be 0.63 sq. km. The falls are situated in
Njandirukki stream. The site contains 3 falls which gives a total head of 90m. After the fall, the
stream joins to the Thodupuzha river which drains to Moovattupuzha.
The most significant thing is that, due to impoundment, no forest land will be submerged. The
constructio n of weir, penstock, power house, tailrace and temporary road will not take away any
forest land.
21.7.2 Environmental Impact on Water

WGSHP - Final Report (Vol. II) Poomala
Integrated Rural Technology Centre, Palakkad 1.10
The Njandirukki stream, which drains to Moovattupuzha river is the stream of this fall. The diversion
structure will create a pond of area 0.106 hectare. No forest land will be submerged. Above all, this
accounts for only 0.125 ha/MW. This diversion structure which also acts as a check dam can
increase the height of water table level at the site. The impounded water will also change soil moisture
regime in adjacent forest land.
21.7.3 Socio-economic Impact
The construction phase would create employment opportunities for a period of 18 months. The peak
labour strength is 50 skilled and 100 unskilled labour. It requires only minimum land acquisition for
construction. The acquisition does not need any rehabilitation.
21.8 CONCLUSION
The environmental impact of small hydel project is negligible compared to large hydel projects.
Moreover, deforestation owing to the inundation will be a meagre area.
The economic size of installed capacity depends upon the permissible tariff as well as the capital cost.
It was found that the project is financially viable for an installed capacity of 850kW at a project cost of
Rs. 3.5 Crores per MW and a tariff rate of Rs.2.5 per unit of electricity. Alternatively, if the tariff is
raised to Rs.3.00 per unit, an installed capacity of 1100kW would become economically viable.
Cost effective methods of construction, like the use of gabion weirs, can be used to reduce the capital
costs. A methodology for implementing the project with a maximum of peoples= participation should
also be devised. The role of the Grama Panchayath in this effort is crucial.
-�-
WGSHP - Final Report (Vol. II) Poomala
Integrated Rural Technology Centre, Palakkad 1.11
22. KALKANDY
District : Palakkad
Panchayath : Agali
Head : 90 m.
Flow : Perennial
Suggested Capacity : 950 kW/ 1.25 MW

WGSHP - Final Report (Vol. II) Kalkandy
Integrated Rural Technology Centre, Palakkad 1.1
22.1 GENERAL
22.1.1 The site
Kalkandy Mandompotty water fall is situated in Chellekkad near Kalkandy, which is in the 12th
ward of Agali Grama Panchayath in Palakkad district. The site is at a distance of 22 km. from
Mannaarkkad. Kalkandy is a main stop in Mannarkkad- Aanakkatti route. Bus services are
available from Mannaarkkad. From Kalkandy there is about 3 km. to the site. The site is in
forest land. The nearest 11 KV line is 2 km away from the site.
The water fall is located at 75o 32' 34" E longitude and 11o 4' 37" N latitude. The catchment area
measured from toposheet is 9.50 sq.km. The fall is situated at an elevation of 300m. from MSL,
in Kalkandy thodu which is beginning at an elevation of 700m from MSL. After the fall the stream
is flowing through moderate slopes. The stream is joins to the Nellipuzha river which is drains to
the Bharathapuzha. The upstream side of the fall is sloped steep (Fig.No.22.1)
22.1.2 Topography
The site is situated in Mannarkkad reserved forest. The forest is very thick. The land is having
steep slope in this area. There is no possibility of land slide and the chances for soil erosion is
very less. Boulders are available in plenty at site. The number of rainy days exceeds 50% in its
catchment.
22.2 FIELD INVESTIGATION
22.2.1 Reconnaissance survey
A topographical survey was conducted for obtaining topographical details of the site. There is
one main fall which gives a total head of 90m. The possible location for diversion structure and
power house were identified and the details were taken using tacheometric method of surveying.

WGSHP - Final Report (Vol. II) Kalkandy
Integrated Rural Technology Centre, Palakkad 1.2
22.2.2 Catchment area
Topographical survey sheets to a scale of 1: 50,000 are available from the Survey of India. The
catchment of Kalkandy site was located using the toposheet. It is shown in Fig.No.22.2. The
area is measured and its comes to 9.75 sq km. The catchment area is having almost moderate
slope but some portions are very steep. Maximum flood discharge measured at this site during
1998 is about 4.5 cumec.
22.2.3 Contour map
The data collected by survey were used to calculate the horizontal distance, vertical distance and
the reduced level of various points on the ground. The survey details were plotted on a sheet of
paper at a scale of 1:200. The undulations of the site, the location of the falls and other
topographical features were identified from the contour map. The location of the weir, the
alignment of the penstock and location of the power house were also determined using this and
the prepared contour map has been shown in Annexure A.22.
22.2.4 River flow data
For a period of 12 months (January 98 to January 1999) the water level observations were taken
every week. A suitable location was identified on the upstream of the fall, where the whole water
is flowing through that point, cross sectional details of the point were noted for calculating the
stream discharge. We fixed a measuring gauge at that point to measure the peak flow. Using the
collected data (Table 22.1) the weekly discharge hydrograph of the site was prepared. The
graph is shown in Fig. No. 22.3.
22.2.5 Flow duration curves
Using weekly discharge hydro graph, percentage flow of exceedence was calculated. From this,
the flow duration curve was plotted (Fig. No. 22.4). The same curve also functions as
percentage flow of exceedence graph. This river flow data is recalculated in tabular form, giving
the corresponding energy potential in weekly and cumulative mode is given in Table 22.2. These
data are used for calculating energy potential and selection of unit sizes in section 22.4.
22.2.6 Peak flow determination
There are various empirical methods for calculating the maximum flood discharge. The different
values obtained are shown in Table 22.3. The value obtained by Dicken=s formula which is

WGSHP - Final Report (Vol. II) Kalkandy
Integrated Rural Technology Centre, Palakkad 1.3
commonly used in western ghats region has been used for the structural design.
Table 22.3
Peak Flow Determination
Parameters
Dicken== s
method
Ingli== s formula
Ryve == s formula
Nawab Jung
Bahadur formula Peak flow in
cumec
140.69
261.94
45.3
374.4
22.3 SALIENT DESIGN FEATURES
A detailed design of Civil, Electrical & Mechanical work has not been carried out in this report as
it does not come under the purview of the project, but a typical section of the proposed diversion
structure is given here. The stability analysis of the section and economic diameter of the
penstock was carried out as part of preliminary design. The capability and number of units, type
and specification of turbine, generator and it=s cost have been estimated, after consulting various
agencies.
22.3.1 Power potential of the project
The discharge corresponding to 90% of exceedence is only 0.002 cubic metre per second. A
discharge of 0.002 cubic metre per seconds can produce only about 1 kW. In order to tap the
full potential of the site, with a head of 90m, the project is designed to generate higher output with
lower dependability. This site can be designed as run off the river which can produce 200 kW
with a dependability of 50%.
The output power can be computed using the formula, P = 10 x Q x H x ηη
Where; P = Power output in kW
Q = Discharge in cumec
H = Head in metres
η = Efficiency taken as 0.75

WGSHP - Final Report (Vol. II) Kalkandy
Integrated Rural Technology Centre, Palakkad 1.5
For 50% exceedence P = 10 x 0.29 x 90 x 0.75 = 200 kW.
For 40% exceedence P = 10 x 0.36 x 90 x 0.75 = 240 kW.
For 30% exceedence P = 10 x 0.8 x 90 x 0.75 = 550 kW.
22.3.2 Energy potential
At this site, sufficient flow is there so that we can obtain 200kW power output for 50% of the
time (146 days) which reduces to 15kW by 80% time (292 days). The energy input
corresponding to 50% time will be (50/100 * 200 * 365 * 24) = 0.876 MU. The flow after
50% time can be utilized by providing a small pondage. The quantity of water available from
50% to 100% time is calculated to be 2202682 m3. Energy obtained from this water is calculated
to be 0.413 MU.
Total amount of energy produced = 0.876 MU + 0.413 MU = 1.289 MU
22.3.3 Pondage requirement
From the contour map a plot of surface area Vs. elevation is drawn in Fig. No. 22.5. The areas
corresponding to each elevation is used to find the volume of water that can be stored in each
elevation and the details are shown in Table 22.4. From this information a capacity elevation
curve of the pondage is prepared and is shown in Fig.No. 22.6.
Table 22.4
Pondage Area Details Sl. No.
Elevation (m)
Area (m2)
Capacity (m3)
Energy (kWh)
1
497.5
0
0
0
2
498.0
145.31
36.33
1
3
499.0
439.06
328.52
6
4
500.0
698.44
897.27
17
5
501.0
811.00
1652.00
31
6
502.0
1281.25
2698.00
51
As the terrain is suitable for storing 2698m3 it follows that, at full storage, the energy capacity is

WGSHP - Final Report (Vol. II) Kalkandy
Integrated Rural Technology Centre, Palakkad 1.6
only about 50kWh. If a single 50kW machine is installed, it can be operated for only one hour at
full capacity during peak time. Fortunately, pondage becomes critical only during lean months,
this kid of operation practice is acceptable. Hence, a weir height of 4.5m, to create a storage of
3450m3 is suggested.
22.4 SELECTION OF PLANT CAPACITY AND UNIT SIZES
For optimization of plant capacity, the following parameters were assumed.
Rate of return on investment - 15%
Loan repayment period - 10 years
Average O/M cost - 2.5% of capital cost
Resulting standard annual cost - 25%
(This consists of 2.5% O & M costs, 15% return on 25% equity, 15% interest on 75% loan and
repayment of loan in 10 annual instalments)
Tariff (per Unit) - Rs. 2.5 and 3.0 (Two cases)
Investment cost (Rs.in Crores per MW) - Rs. 3.5 (Two cases)
Since manufacturers were not in a position to quote exact figures, no attempt was made to fine
tune the cost in relation to site specific conditions. Only ranges could be indicated. Each
combination of tariff and capital cost selected above, will demand a minimum annual generation
per kW installed. This can be taken to be the break even Plant Capacity Factor (PCF) for the
site under the specified conditions.
Lower the cost/MW and higher the price for energy, the larger will be the economically
viable installed capacity and the quantity of energy that can be economically extracted
from a given site.
Let the capital cost of Kalkandy be Rs.3.5 crores/MW. The annual rate is 25%. Let the unit
rate of tariff offered by K.S.E.B be Rs. 2.5/kWh.
If X be the number of hours of operation at full load capacity,

WGSHP - Final Report (Vol. II) Kalkandy
Integrated Rural Technology Centre, Palakkad 1.7
per Mega Watt annual cost, at the rate of 25% on investment = Rs. 3.5 Crores x 0.25
per Mega Watt revenue = 1000 kW x Rs. 2.5 x X
Equating the two, we get 3,50,00,000 x 0.2.5 = X x 1000 x 2.5
X = 3,500 hrs.
It follows that, any combination of machines, that can be work at full capacity for over 3500
hours can deliver a profit, if the overall project cost is below Rs. 3.5 crores/MW and tariff is Rs.
2.5 per kilo Watt hour.
This can be explained better in terms of Plant Capacity Factor, which is defined as the ratio of
actual amount of energy obtained to the maximum energy that can be obtained from the given
installed capacity during an year, to the actual amount of energy obtained.
In this case, for the value of X = 3500 hours, PCF = (3500 / 8760) x 100 = 40%
That is, a maximum capacity, which yields a PCF of 40% is economically viable for this site.
Similarly, break even PCF for Rs.3.0 per and Rs. 3.5 Crores per Mega Watt where X=2916
hours is 33.3%
Now we shall check various capacities of turbine size which are suitable for this two conditions.
a. Tariff: Rs.2.50/kWh and break even PCF of 40%
For an installed capacity of 950 kW, which corresponds to about 21% flow of exceedence from
the chart, the total energy yield is the sum of:
950 kW x (0.21 x 8760) = 1.75 MU at continuous operation for 21% time of an year, and
1.576MU, which is the cumulative energy potential from 21% to 100% time as obtained from the
Chart (Table 22.3).
Total yield = 1.86MU + 1.1MU = 3.326 MU.
The Plant Capacity Factor, corresponding to this yield is given by :

WGSHP - Final Report (Vol. II) Kalkandy
Integrated Rural Technology Centre, Palakkad 1.8
PCF = 3.326 x 10⁸ / (950 x 8760) = 39.9 %
This PCF is equal to the break even value of 40%.
So 950 kW will be the optimum choice for the site, if the overall project cost is below Rs.3.5 crores/MW and tariff is Rs. 2.5 per kilo Watt hour.
b. Tariff: Rs.3.0/kWh and break even PCF of 40%
Similarly, for 1250 kW (for 16% flow of exceedence)
PCF = (3750000 / 1250 x 8760) x 100 = 34.24%
This PCF is very near to the break even value of 33%.
Similarly, 1250 kW will be the optimum choice for the site, if the overall project cost is
below Rs.3.5 crores/MW and tariff is Rs. 3.0 per kilo Watt hour.
Table 22.5
Economically Viable Maximum Capacity at Different Costs and Tariff
Tariff
Unit size for Rs.3.5 Crores/MW
Rs.2.5/Unit
950 kW
Rs.3.00/ Unit
1250 kW
The units sele cted can be one of the following combinations:
For Rs.3.5 Crores/MW and Rs.2.5/Unit we can opt (0.5MW x 1 + 0.25 MW x 2)
For Rs.3.5 Crores/MW and Rs.3.0/Unit we can opt (0.5 MW x 2 + 0.025MW x 1)
Among these two categories, the second one seems to be less viable since it is bulky with units.
We have restricted ourselves to the more realistic combination of Rs.3.5 Crores/MW of
investment cost and two tariff choices of Rs. 2.5/Unit and Rs. 3.0/Unit.
22.5 CIVIL ENGINEERING WORKS
The important Civil Engineering Works required for the project are a diversion weir, an intake
structure, a penstock and a power house. A weir is constructed to have a small storage and to
divert the water from stream to the intake. For this project only a diversion weir is proposed,
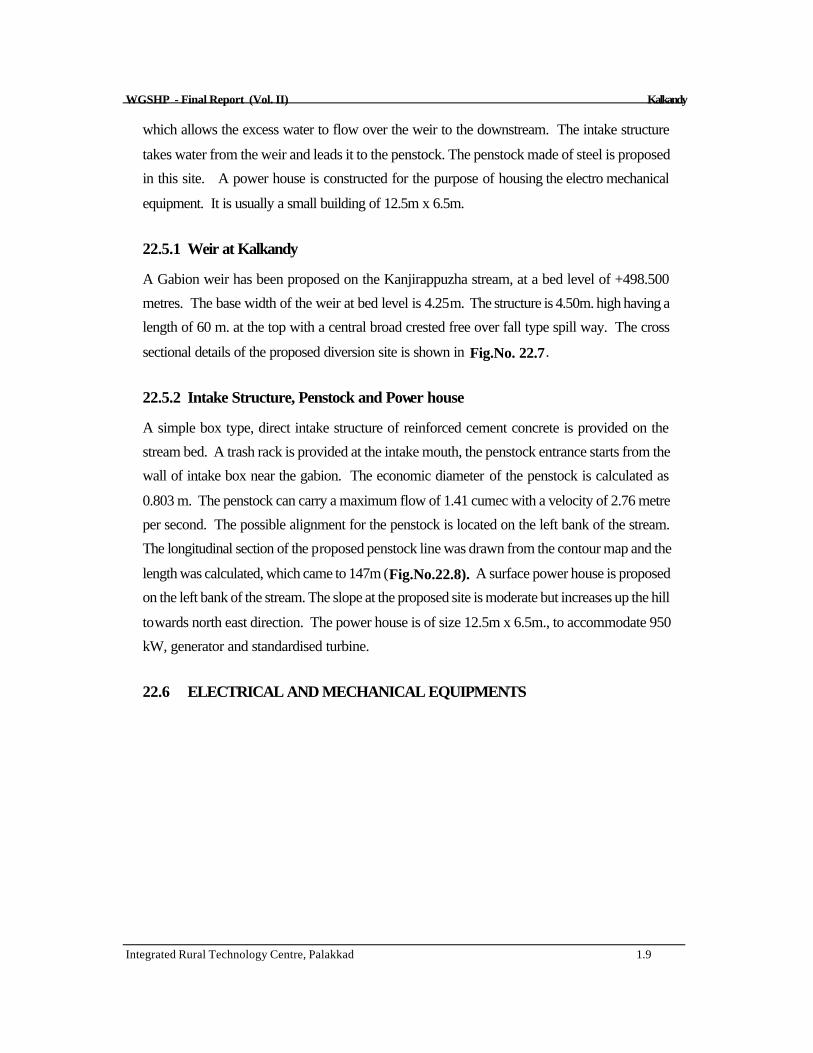
WGSHP - Final Report (Vol. II) Kalkandy
Integrated Rural Technology Centre, Palakkad 1.9
which allows the excess water to flow over the weir to the downstream. The intake structure
takes water from the weir and leads it to the penstock. The penstock made of steel is proposed
in this site. A power house is constructed for the purpose of housing the electro mechanical
equipment. It is usually a small building of 12.5m x 6.5m.
22.5.1 Weir at Kalkandy
A Gabion weir has been proposed on the Kanjirappuzha stream, at a bed level of +498.500
metres. The base width of the weir at bed level is 4.25m. The structure is 4.50m. high having a
length of 60 m. at the top with a central broad crested free over fall type spill way. The cross
sectional details of the proposed diversion site is shown in Fig.No. 22.7.
22.5.2 Intake Structure, Penstock and Power house
A simple box type, direct intake structure of reinforced cement concrete is provided on the
stream bed. A trash rack is provided at the intake mouth, the penstock entrance starts from the
wall of intake box near the gabion. The economic diameter of the penstock is calculated as
0.803 m. The penstock can carry a maximum flow of 1.41 cumec with a velocity of 2.76 metre
per second. The possible alignment for the penstock is located on the left bank of the stream.
The longitudinal section of the proposed penstock line was drawn from the contour map and the
length was calculated, which came to 147m (Fig.No.22.8). A surface power house is proposed
on the left bank of the stream. The slope at the proposed site is moderate but increases up the hill
towards north east direction. The power house is of size 12.5m x 6.5m., to accommodate 950
kW, generator and standardised turbine.
22.6 ELECTRICAL AND MECHANICAL EQUIPMENTS
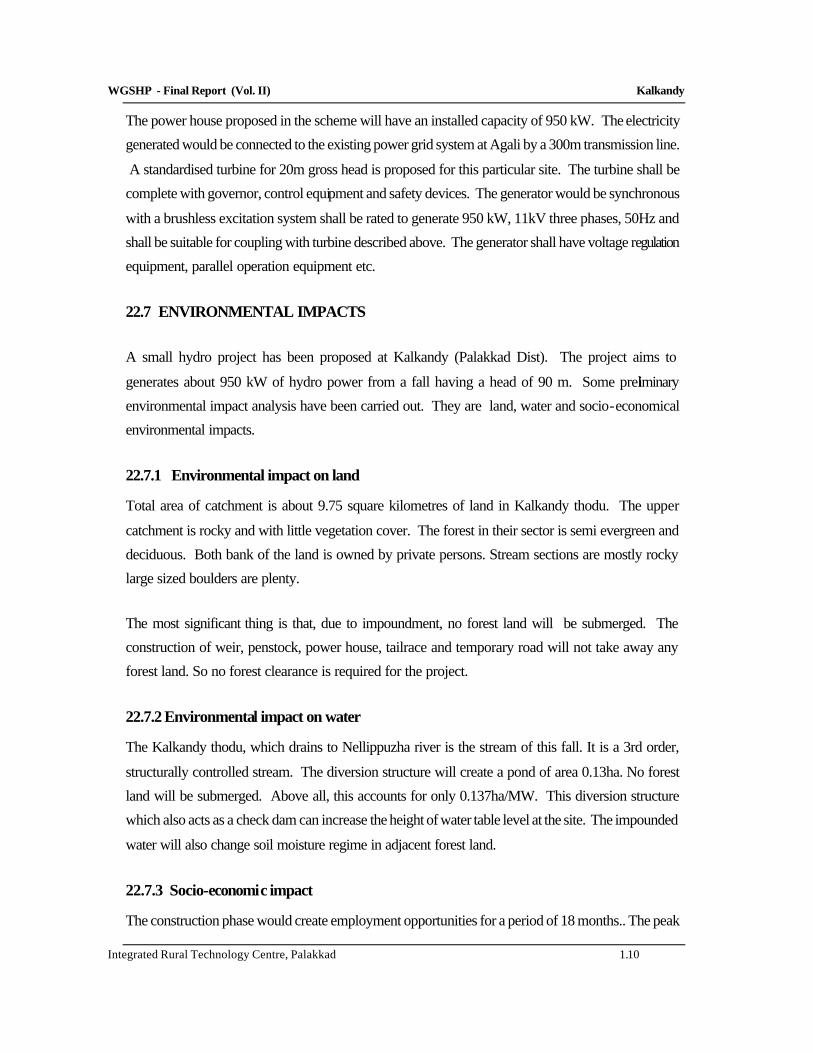
WGSHP - Final Report (Vol. II) Kalkandy
Integrated Rural Technology Centre, Palakkad 1.10
The power house proposed in the scheme will have an installed capacity of 950 kW. The electricity
generated would be connected to the existing power grid system at Agali by a 300m transmission line.
A standardised turbine for 20m gross head is proposed for this particular site. The turbine shall be
complete with governor, control equipment and safety devices. The generator would be synchronous
with a brushless excitation system shall be rated to generate 950 kW, 11kV three phases, 50Hz and
shall be suitable for coupling with turbine described above. The generator shall have voltage regulation
equipment, parallel operation equipment etc.
22.7 ENVIRONMENTAL IMPACTS
A small hydro project has been proposed at Kalkandy (Palakkad Dist). The project aims to
generates about 950 kW of hydro power from a fall having a head of 90 m. Some preliminary
environmental impact analysis have been carried out. They are land, water and socio-economical
environmental impacts.
22.7.1 Environmental impact on land
Total area of catchment is about 9.75 square kilometres of land in Kalkandy thodu. The upper
catchment is rocky and with little vegetation cover. The forest in their sector is semi evergreen and
deciduous. Both bank of the land is owned by private persons. Stream sections are mostly rocky
large sized boulders are plenty.
The most significant thing is that, due to impoundment, no forest land will be submerged. The
construction of weir, penstock, power house, tailrace and temporary road will not take away any
forest land. So no forest clearance is required for the project.
22.7.2 Environmental impact on water
The Kalkandy thodu, which drains to Nellippuzha river is the stream of this fall. It is a 3rd order,
structurally controlled stream. The diversion structure will create a pond of area 0.13ha. No forest
land will be submerged. Above all, this accounts for only 0.137ha/MW. This diversion structure
which also acts as a check dam can increase the height of water table level at the site. The impounded
water will also change soil moisture regime in adjacent forest land.
22.7.3 Socio-economic impact
The construction phase would create employment opportunities for a period of 18 months.. The peak

WGSHP - Final Report (Vol. II) Kalkandy
Integrated Rural Technology Centre, Palakkad 1.11
labour strength is 75 skilled and 100 unskilled labour. It require only minimum land acquisition for
construction. The acquisition does not need any rehabilitation.
22.8 CONCLUSION
The environmental impact of the small hydel project is negligible. Moreover, deforestation owing to
the inundation will be a meagre area.
The economic size of installed capacity depends upon the permissible tariff as well as the capital cost.
It was found that the project is financially viable for an installed capacity of 950kW at a project cost
of Rs. 3.5 Crores per MW and a tariff rate of Rs.2.5 per unit of electricity. Alternatively, if the tariff is
raised to Rs.3.00 per unit, an installed capacity of 1750kW would become economically viable.
Cost effective methods of construction, like the use of gabion weirs, can be used to reduce the capital
costs. A methodology for implementing the project with a maximum of peoples= participation should
also be devised. The role of the Grama Panchayath in this effort is crucial.
-�-
23. VELLACHATTAPARA

WGSHP - Final Report (Vol. II) Kalkandy
Integrated Rural Technology Centre, Palakkad 1.12
District : Palakkad
Panchayath : Alanallur
Head : 125 m.
Flow : Seasonal
Suggested Capacity : 2MW/ 2.75MW

WGSHP - Final Report (Vol. II) Vellachattappara
Integrated Rural Technology Centre, Palakkad 1.1
23.1 GENERAL
23.1.1 The Site
Vellachattappara, which is in the 1st ward of Alanallur Grama Panchayath is in Palakkad District.
The site is at a distance of 43 km from Mannarkkad. There is a bus route to Edathanattukara
(Kottappallom) from Mannarkkad. From Kottappallom bus service are available to Uppukulam
occasionally. From there jeep service are available to Ponpara. From Ponpara the site is 4 km
away.
The water fall is located at 750 36' 28" E longitude and 80 9' 9" N latitude. The catchment area
measured from topo sheet is 2.50sq. km. The falls are situated at an elevation of 220m from
MSL, in Vellachattappara stream which is beginning at an elevation of 1050m. After the fall, the
stream joins the Pulayanthodu which flows to Velli Aar that finally drains to Kunthi Ppuzha
(Fig.No.23.1.).
23.1.2 Topography
The site is situated in Mannarkkad reserved forest. The forest is very thick. The land is having
moderate slope in this area. There is no possibility of land slides any where near the site , and the
chances for soil erosion are negligible. The number of rainy days exceeds 50% in its catchment.
23.2 FIELD INVESTIGATION
23.2.1 Reconnaissance Survey
A topographical survey was conducted for obtaining topographical details of the site. There is
one main fall which gives a total head of 125m. The possible location for diversion structure and
power house are identified and the details are taken using tacheometric method of surveying.

WGSHP - Final Report (Vol. II) Vellachattappara
Integrated Rural Technology Centre, Palakkad 1.2
23.2.2 Catchment Area
Topographical survey sheets to a scale of 1:50,000 are available from the Survey of India. The
catchment of Vellachattappara was located using the toposheet. It is shown in the Fig.No. 23.2.
From the shape it is identified as a fan shaped catchment and its area comes to nearly 2.50
sq.km. The catchment area is having almost moderate slope but some portions are very steep.
Maximum flood discharge measured at this site during 1998-99 is about 5.63cumec.
23.2.3 Contour Map
The survey details were plotted on a sheet of paper at a scale of 1:400. The undulations of the
site, the location of the falls and other topographical features were identified from the contour
map. The location of the weir, the alignment of the penstock and location of the power house
were also determined using this and the prepared contour map has been shown in Annexure
A.23.
23.2.4 River Flow Data
For a period of 12 months (December 97 to December 98) the water level observations were
taken every week. A suitable location was identified on the upstream side of the fall, where the
whole water is flowing through that point, cross sectional details of the point were noted for
calculating the stream discharge. We fixed a measuring gauge at this point to measure the peak
flow. Using the collected data (Table 23.1) the weekly discharge hydrograph of the site is
prepared. The graph is shown in Fig. No. 23.3.
23.2.5 Flow Duration Curves
Using weekly discharge hydro graph, percentage flow of exceedence was calculated. From this,
the flow duration curve was plotted (Fig. No. 23.4). The same curve also functions as
percentage flow of exceedence graph. This river flow data is recalculated in tabular form, giving
the corresponding energy potential in weekly and cumulative mode is given in Table 23.2. These
data are used for calculating energy potential and selection of unit sizes in section 23.4.
23.2.6 Peak Flow Determination
There are various empirical methods for calculating the maximum flood discharge. The different
values obtained are shown in Table 23.3. The value obtained by Dicken=s formula which is
commonly used in western ghats region has been used for the structural design.

WGSHP - Final Report (Vol. II) Vellachattappara
Integrated Rural Technology Centre, Palakkad 1.3
Table 23.3
Peak Flow Determination
Parameters
Dicken==s method
Ingli== s formula
Ryve == s formula
Nawab Jung
Bahadur formula
Peak flow in cumec
51.69
85.62
18.6
123.36
23.3 SALIENT DESIGN FEATURES
A detailed design of Civil, Electrical & Mechanical work has not been carried out in this report as
it does not come under the purview of the project, but a typical section of the proposed diversion
structure is given here. The stability analysis of the section and economic diameter of the
penstock was carried out as part of preliminary design. The capability and number of units, type
and specification of turbine, generator and it=s cost have been estimated, after consulting various
agencies.
23.3.1 Power Potential of the Project
The discharge corresponding to 80% of exceedence is only 0.04cubic metre per second. A
discharge of 0.04cubic metre per second can produce only about 35 kW. In order to tap the full
potential of the site, with a head of 125 metre, the project is designed to generate higher output
with lower dependability. This site can be designed as a run of the river project which can
produce 700kW with a dependability of 40%.
The output power was computed using the formula, P = 10 x Q x H x ηη
Where; P = Power output in kW
Q = Discharge in cumec
H = Head in metres
η = Efficiency taken as 0.75
For 50% exceedence P = 10 x 0.58 x 125 x 0.75 = 540 kW.
For 40% exceedence P = 10 x 0.74 x 125 x 0.75 = 700 kW.

WGSHP - Final Report (Vol. II) Vellachattappara
Integrated Rural Technology Centre, Palakkad 1.5
For 30% exceedence P = 10 x 1.24 x 125 x 0.75 = 1200 kW.
23.3.2 Energy Potential
At this site, sufficient flow is there so that we can obtain 675kW power output for40% of the time
(146 days) which reduces to 8.5kW by 80% time (292 days). The energy input corresponding to
40% time will be (40/100 x 675 x 365 x 24) = 2.19 MU. The flow after 50% time can be
utilized by providing a small pondage. The quantity of water available from 35% to 100% time is
calculated to be 969732 m3. Energy obtained from this water is calculated to be 0.969 MU.
Total amount of energy produced = 2.19 MU + 0.657 MU = 2.85 MU
It may be noted that, this much amount of energy can be generated for the particular year. If
higher flows are available during any year, it will enable higher production and vice versa.
23.3.3 Pondage Requirement
From the contour map a plot of surface area Vs. elevation is drawn in Fig. No. 23.5. The areas
corresponding to each elevation is used to find the volume of water that can be stored in each
elevation and the details are shown in Table 23.4. From this information a capacity elevation
curve of the pondage is prepared and is shown in Fig.No. 23.6.
Table 23.4
Pondage Area Details Sl. No.
Elevation (metre)
Area (m2)
Capacity (m3)
Energy(kWh)
1
493.25
0
0
0
2
494
109.60
41.10
1
3
495
190.94
191.27
5
4
497
344
725.02
19
5
499
609.12
1678.18
44
6
501
883.84
3171.14
83

WGSHP - Final Report (Vol. II) Vellachattappara
Integrated Rural Technology Centre, Palakkad 1.6
As the terrain is suitable for storing 3150m3, it follows that, at full storage, the energy capacity is
only about 80 kWh. If a single 50 kW machine is installed, it can be operated for only one and
half hour at full capacity during peak time. Fortunately, pondage becomes critical only during lean
months, this kid of operation practice is acceptable. Hence, a weir height of 3.5m, to create a
storage of 3150m3 is suggested.
23.4 SELECTION OF PLANT CAPACITY AND UNIT SIZES
For optimization of plant capacity, the following parameters were assumed.
Rate of return on investment - 15%
Loan repayment period - 10 years
Average O/M cost - 2.5% of capital cost
Resulting standard annual cost - 25%
(This consists of 2.5% O & M costs, 15% return on 25% equity, 15% interest on 75% loan and
repayment of loan in 10 annual instalments)
Tariff (per Unit) - Rs. 2.5 and 3.0 (Two cases)
Investment cost (Rs.in Crores per MW) - Rs. 3.5 (Two cases)
Since manufacturers were not in a position to quote exact figures, no attempt was made to fine
tune the cost in relation to site specific conditions. Only ranges could be indicated. Each
combination of tariff and capital cost selected above, will demand a minimum annual generation
per kW installed. This can be taken to be the break even Plant Capacity Factor (PCF) for the
site under the specified conditions.
Lower the cost/MW and higher the price for energy, the larger will be the economically
viable installed capacity and the quantity of energy that can be economically extracted
from a given site.
Let the capital cost of Vellachattappara be Rs.3.5 crores/MW. The annual rate is 25%. Let the
unit rate of tariff offered by K.S.E.B be Rs. 2.5/kWh.

WGSHP - Final Report (Vol. II) Vellachattappara
Integrated Rural Technology Centre, Palakkad 1.7
If X be the number of hours of operation at full load capacity,
per Mega Watt annual cost, at the rate of 25% on investment = Rs. 3.5 Crores x 0.25
per Mega Watt revenue = 1000 kW x Rs. 2.5 x X
Equating the two, we get 3,50,00,000 x 0.2.5 = X x 1000 x 2.5
X = 3,500 hrs.
It follows that, any combination of machines, that can work at full capacity for over 3500 hours
can deliver a profit, if the overall project cost is below Rs. 3.5 crores/MW and tariff is Rs. 2.5
per kilo Watt hour.
This can be explained better in terms of Plant Capacity Factor, which is defined as the ratio of
actual amount of energy obtained to the maximum energy that can be obtained from the given
installed capacity during an year, to the actual amount of energy obtained.
In this case, for the value of X = 3500 hours, PCF = (3500 / 8760) x 100 = 40%
That is, a maximum capacity, which yields a PCF of 40% is economically viable for this site.
Similarly, break even PCF for Rs.3.0 per and Rs. 3.5 Crores per mega watt where X=2916
hours is 33.3%
Now we shall check various capacities of turbine size which are suitable for this two conditions.
a. Tariff: Rs.2.50/kWh and break even PCF of 40%
For an installed capacity of 2000 kW, which corresponds to about 21% flow of exceedence
from the chart, the total energy yield is the sum of:
2000 kW x (0.21 x 8760) = 3.7MU at continuous operation for 21% time of an year, and
3.15MU, which is the cumulative energy potential from 21% to 100% time as obtained from the
Chart (Table 3.3).
Total yield = 1.53MU + 3.15MU = 6.85 MU.
The Plant Capacity Factor, corresponding to this yield is given by :
WGSHP - Final Report (Vol. II) Vellachattappara
Integrated Rural Technology Centre, Palakkad 1.8
PCF = 6.85 x 10⁸ / (2000 x 8760) = 39 %
This PCF is equal to the break even value of 40%.
So 2000 kW will be the optimum choice for the site, if the overall project cost is below Rs.3.5 crores/MW and tariff is Rs. 2.5 per kilo Watt hour.
b. Tariff: Rs.3.00/kWh and break even PCF of 33.3%
Similarly, for 2750 kW (for 11.5% flow of exceedence)
PCF = (8080000 / 2750 x 8760) x 100 = 33.5%
This PCF is very near to the break even value of 33%.
Similarly, 2750 kW will be the optimum choice for the site, if the overall project cost is
below Rs. 3.5 crores/MW and tariff is Rs. 3.0 per kilo Watt hour.
Table 23.5
Economically Viable Maximum Capacity at Different Costs and Tariff
Tariff
Unit size for Rs.3.5 Crores/MW
Rs.2.5/Unit
2000 kW
Rs.3.00/ Unit
2750 kW
The units selected can be one of the following combinations:
For Rs.3.5 Crores/MW and Rs.2.5/Unit we can opt (1MW x 3 + 0.5 MW x 2)
For Rs.3.5 Crores/MW and Rs.3.0/Unit we can opt (2MWx1 + 0.5 MW x 1 + 0.25MW x1)
Among these two categories, the second one seems to be less viable since it is bulky with units.
We have restricted ourselves to the more realistic combination of Rs.3.5 Crores/MW of
investment cost and two tariff choices of Rs.2.5/Unit and Rs.3.0/Unit.
23.5 CIVIL ENGINEERING WORKS
The important Civil Engineering Works required for the project are a diversion weir, an intake
structure, a penstock and a power house. A weir is constructed to have a small storage and to
divert the water from stream to the intake. For this project only a diversion weir is proposed,
which allows the excess water to flow over the weir to the downstream. The intake structure

WGSHP - Final Report (Vol. II) Vellachattappara
Integrated Rural Technology Centre, Palakkad 1.9
takes water from the weir and leads it to the penstock. The penstock made of steel is proposed
in this site. A power house is constructed for the purpose of housing the electro mechanical
equipment. It is usually a small building of 10m x 6.5m.
23.5.1 Weir at Vellachattappara
A Gabion weir has been proposed on the Vellachattappara stream, at a bed level of +492.750
metres. The base width of the weir at bed level is 5.50m. The structure is 4.10m high having a
length of 13m at the top with a central broad crested free over fall type spill way. The cross
sectional details of the proposed diversion site is shown in Fig.No. 23.7.
23.5.2 Intake Structure, Penstock and Power House
A simple box type, direct intake structure of reinforced cement concrete is provided on the
stream bed. A trash rack is provided at the intake mouth, the penstock entrance starts from the
wall of intake box near the gabion. The economic diameter of the penstock is calculated as
0.91m and the thickness of the penstock is found as 8 mm. The penstock can carry a maximum
flow of 2.13 cumec with a velocity of 3.3 metre per second. The possible alignment for the
penstock is located on the left bank of the stream. The longitudinal section of the proposed
penstock line was drawn from the contour map and the length was calculated, which came to
521m (Fig. No. 23.8).
A surface power house is proposed on the left bank of the stream. The slope at the proposed site
is moderate but increases up the hill towards north east direction. The power house is of size
10m x 6.5m, to accommodate 2000 kW, generator and standardised turbine. A typical section
of the intake structure and silt extruder also shown in Fig.No.23.9.
23.6 ELECTRICAL AND MECHANICAL EQUIPMENTS
The power house proposed in the scheme will have an installed capacity of 2000 kW. The
electricity generated would be connected to the existing power grid system at Ponpara by a 2km
transmission line. A standardised turbine for 125m gross head is proposed for this particular site.
The turbine shall be complete with governor, control equipment and safety devices. The
generator would be synchronous with a brushless excitation system shall be rated to generate
2000 kW, 11kV three phases, 50Hz and shall be suitable for coupling with turbine described
above. The generator shall have voltage regulation equipment, parallel operation equipment etc.

WGSHP - Final Report (Vol. II) Vellachattappara
Integrated Rural Technology Centre, Palakkad 1.10
23.7 ENVIRONMENTAL IMPACTS
A small hydro project has been proposed at Vellachattappara (Palakkad Dist.). The project
aims to generates about 2000 kW of hydro power from a fall having a head of 125 m. Some
preliminary environmental impact analysis have been carried out. They are land, water and
socio-economical environmental impacts.
23.7.1. Environmental Impact on Land
The catchment area measured from topo sheet comes to be 2.50sq. km. The falls are situated in
Vellachattappara stream. After the fall, the stream joins to the Pulayanthodu which flows to Velli
Aar that finally drains to Kadalundi Puzha.
The most significant thing is that, due to impoundment, no forest land will be submerged. The
construction of weir, penstock, power house, tailrace and temporary road will not take away any
forest land. So no forest clearance is required for the project.
23.7.2 Environmental Impact on Water
The Vellachattappara stream which drains to Kadalundi puzha is the stream of this fall. The
diversion structure will create a pond of area 0.088hectare. No forest land will be submerged.
Above all, this accounts for only 0.131 ha/MW. This diversion structure which also acts as a
check dam can increase the height of water table level at the site. The impounded water will also
change soil moisture regime in adjacent forest land.

WGSHP - Final Report (Vol. II) Vellachattappara
Integrated Rural Technology Centre, Palakkad 1.11
23.7.3 Socio-economic Impact
The construction phase would create employment opportunities for a period of 18 months. The peak
labour strength is 100 skilled and 100 unskilled labour. It requires only minimum land acquisition for
construction. The acquisition does not need any rehabilitation.

WGSHP - Final Report (Vol. II) Vellachattappara
Integrated Rural Technology Centre, Palakkad 1.12
23.8 CONCLUSION
The environmental impact of this small hydel project is negligible. No serious adverse impact is
anticipated. Moreover, deforestation owing to the inundation will be a meagre area.
The economic size of installed capacity depends upon the permissible tariff as well as the capital cost.
It was found that the project is financially viable for an installed capacity of 2000kW at a project cost
of Rs. 3.5 Crores per MW and a tariff rate of Rs.2.5 per unit of electricity. Alternatively, if the tariff is
raised to Rs.3.00 per unit, an installed capacity of 2750kW would become economically viable.
Cost effective methods of construction, like the use of gabion weirs, can be used to reduce the capital
costs. A methodology for implementing the project with a maximum of peoples= participation should
also be devised. The role of the Grama Panchayath in this effort is crucial.
-�-
24. KOZHIVALKUTHU

WGSHP - Final Report (Vol. II) Vellachattappara
Integrated Rural Technology Centre, Palakkad 1.13
District : Idukki
Panchayath : Munnar
Head : 125 m.
Flow : Perennial
Suggested Capacity : 13 MW/ 16 MW

WGSHP - Final Report (Vol. II) Kozhivalkuthu
Integrated Rural Technology Centre, Palakkad 1.1
24.1 GENERAL
24.1.1 The site
The scenic fall Kozhivalkuthu, which is in the 10th ward of Munnar Grama Panchayath is in
Idukki District. The site is at a distance of 36 km from Adimali. There is a bus route from
Adimali to Kallaar on the Adimali-Munnar state highway. Mankulam is about 16 km away from
Kallar. The road is tarred up to 6km and remaining is unmetalled road. Jeep services are
available from Adimali to Mankulam. The site is at a distance of 1.5km. from Mankulam. The
nearest 11KV line is about 16 km. away from site.
The water fall is located at 760 0' 58" E longitude and 100 6' 35" N latitude. The catchment area
measured from topo sheet is 2.25 sq. km. The falls are situated at an elevation of 300m from
MSL, in Mankulam stream which is beginning at an elevation of 1500m from MSL. The stream
flows through a gentle slope at the upstream side and the flows through steep slopped area. The
fall is almost vertical. After the fall, the stream joins to the Karinthiripuzha which drains to the
Periyar river (Fig.No.24.1).
24.1.2 Topography of the site
The left bank of the stream is forest land and right bank is owned by private persons. The land is
having gentle slope in this area. There is no possibility of land slide and the chances for soil
erosion is very less and it is negligible. The bed of this stream is rocky and boulders are available
in plenty at site. The total head of the site comes nearly 125m. The stream is a perennial one and
rainfall is getting more than half of the year in its catchment.
24.2 FIELD INVESTIGATION
24.2.1 Reconnaissance survey
A contour survey for obtaining topographical details of the site. There is three main falls in the
stream which gives a total head of 125m. The position of the diversion structure and power

WGSHP - Final Report (Vol. II) Kozhivalkuthu
Integrated Rural Technology Centre, Palakkad 1.2
house are identified and details of the proposed location was collected using tacheometric survey.
24.2.2 Catchment area
Topographical survey sheets to a scale of 1:50,000 are available from the Survey of India. The
catchment of Kozhivalkuthu was located using the toposheet. It is shown in the Fig.No. 24.2.
From the shape it is identified as a feather shaped catchment and its area comes nearly 2.25
sq.km. The catchment area having almost moderate slope and the stream get flooded soon after
the rain, but the width of the stream is much enough to carry the flood discharge with in the bank.
24.2.3 Contour map
The survey details were plotted on a sheet of paper at a scale of 1:500. The undulations of the
site, the location of the falls and other topographical features were identified from the contour
map. The location of the weir, the alignment of the penstock and location of the power house
were also determined using this and the prepared contour map has been shown in Annexure
A.24.
24.2.4 River flow data
For a period of 12 months (December 1997 to December 1998) the water level observations
were taken in every week. A suitable location was identified on the upstream of the fall, where
the whole water is flowing through that point, cross sectional details of the point was noted for
calculating discharge of stream. We fixed a measuring gauge at this point and engaged a local
person for taking weekly flow data, we also visited the site once in every month for collecting the
data from the local person. From the collected data (Table.24.1). The weekly discharge
hydrograph of the site is prepared. The graph is shown in Fig.No.24.3.
24.2.5 Flow duration curves

WGSHP - Final Report (Vol. II) Kozhivalkuthu
Integrated Rural Technology Centre, Palakkad 1.3
Using weekly discharge hydro graph, percentage flow of exceedence was calculated. From this,
the flow duration curve was plotted (Fig. No. 24.4). The same curve also functions as
percentage flow of exceedence graph. This river flow data is recalculated in tabular form, giving
the corresponding energy potential in weekly and cumulative mode is given in Table 24.2. These
data are used for calculating energy potential and selection of unit sizes in section 24.4.
24.2.6 Peak flow determination
There are various empirical methods for calculating the maximum flood discharge. The different
values obtained are shown in Table 24.3. The value obtained by Dicken=s formula which is
commonly used in western ghats region has been used for the structural design.
Table 24.3
Peak Flow Determination
Parameters
Dicken==s method
Ingli== s formula
Ryve == s formula
Nawab Jung
Bahadur formula Peak flow in cumec
47.77
77.81
17.34
112.48
24.3 SALIENT DESIGN FEATURES
The design of any hydro electric project can be divided into two. viz. Civil Engineering Works
and Electrical & Mechanical Works in this chapter. A detailed design of Civil, Electrical and
Mechanical work have not been carried out in this report, as it does not come under preview of
the project, but a typical section of the proposed diversion structure is given here. The stability of
the section and economic diameter of the penstock was carried out as part of preliminary design.
The capacity and number of unit, type and specification of turbine, generator and it=s cost is fixed
by consulting various agencies. However, for the sake of cost estimation, required details are
collected from various agencies.
24.3.1 Power potential of the project
From the flow duration curve the discharge corresponding to 100 % of exceedence is only 0.2
cubic metre per second. A discharge of 0.21 cubic metre per second can produce only about
180 kW of power. However it is seen that higher flow are available during 50 % of the time. In
order to tap the full potential of the site, with a head of 125 metre, the project is designed to

WGSHP - Final Report (Vol. II) Kozhivalkuthu
Integrated Rural Technology Centre, Palakkad 1.4
generate higher output with lower dependability.
The out put power was computed using the formula, P = 10 x Q x H x ηη
Where; P = Power out put in KW
Q = Discharge in cumec
H = Head in metres
η = Overall efficiency (Here it is assumed as 0.75)
For 50 % exceedence, P = 10 x 3.49 x 125 x 0.75 = 3250 kW.
For 40 % exceedence, P = 10 x 8.2 x 125 x 0.75 = 7500 kW.
For 30 % exceedence, P = 10 x 10.7 x 125 x 0.75 = 10,000kW.
24.3.2 Energy potential
3 MW capacity needs a discharge of 3.22. metre cube per second, which has a dependability of
50%. ie. there is sufficient flow available to produce 3 MW during 50% of time. So, the energy
output corresponding to this period is equal to 50/100 x 3000 x 365 x 24=13.14 million units.
From 50% to 100%, the site has a cumulative discharge of 15303859 m3 by which we can
generate 4 MU .
So total energy that can be produced = 13.17 MU + 4 MU = 17.17 MU.
It may be noted that, this much amount of energy can be generated for the particular year. If
higher flows are available during any year, it will enable higher production and vice versa.
24.3.3 Pondage requirement
From the contour map a plot of surface area Vs. elevation is drawn in Fig. No. 24.5. The areas
corresponding to each elevation is used to find the volume of water that can be stored in each
elevation and the details are shown in Table 24.4. From this information a capacity elevation
curve of the pondage is prepared and is shown in Fig.No. 24.6.
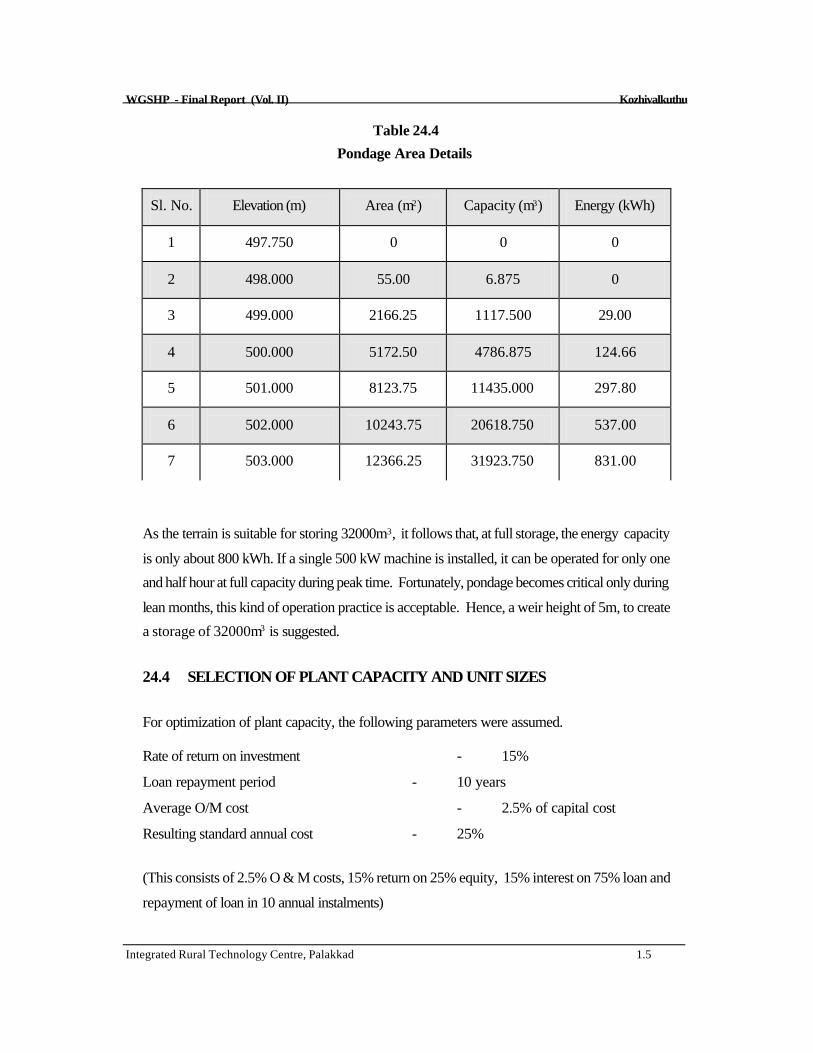
WGSHP - Final Report (Vol. II) Kozhivalkuthu
Integrated Rural Technology Centre, Palakkad 1.5
Table 24.4
Pondage Area Details
Sl. No.
Elevation (m)
Area (m2)
Capacity (m3)
Energy (kWh)
1
497.750
0
0
0
2
498.000
55.00
6.875
0
3
499.000
2166.25
1117.500
29.00
4
500.000
5172.50
4786.875
124.66
5
501.000
8123.75
11435.000
297.80
6
502.000
10243.75
20618.750
537.00
7
503.000
12366.25
31923.750
831.00
As the terrain is suitable for storing 32000m3, it follows that, at full storage, the energy capacity
is only about 800 kWh. If a single 500 kW machine is installed, it can be operated for only one
and half hour at full capacity during peak time. Fortunately, pondage becomes critical only during
lean months, this kind of operation practice is acceptable. Hence, a weir height of 5m, to create
a storage of 32000m3 is suggested.
24.4 SELECTION OF PLANT CAPACITY AND UNIT SIZES
For optimization of plant capacity, the following parameters were assumed.
Rate of return on investment - 15%
Loan repayment period - 10 years
Average O/M cost - 2.5% of capital cost
Resulting standard annual cost - 25%
(This consists of 2.5% O & M costs, 15% return on 25% equity, 15% interest on 75% loan and
repayment of loan in 10 annual instalments)
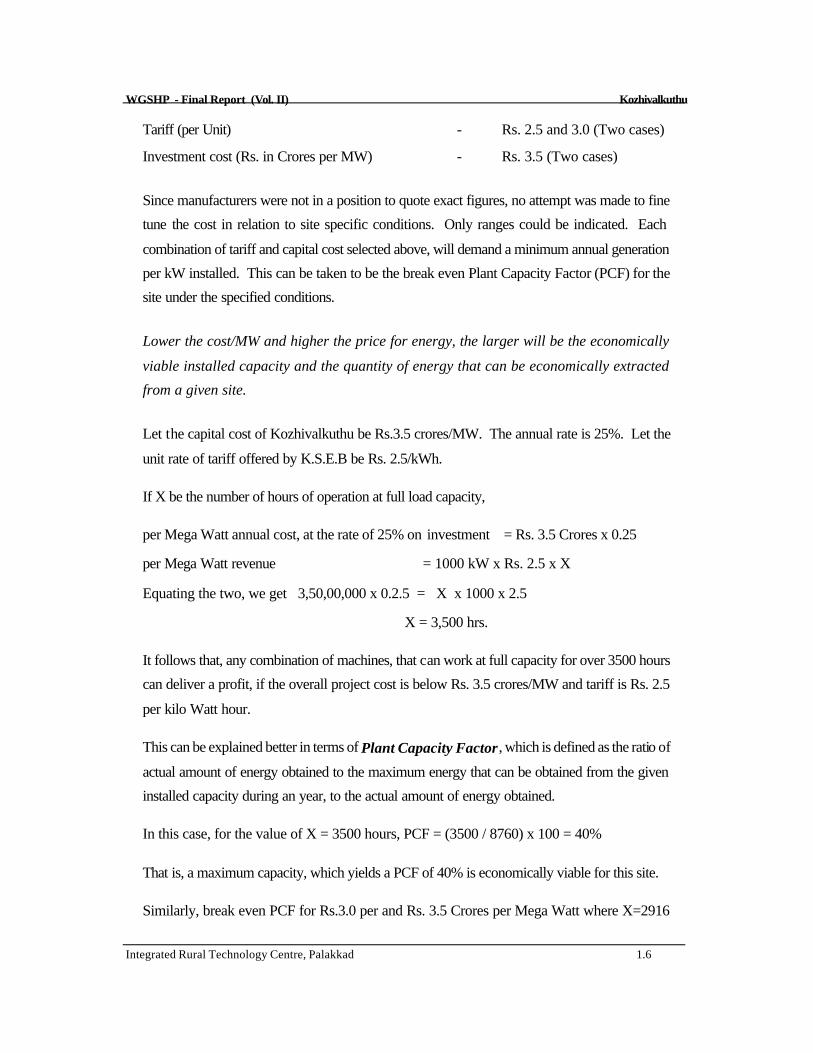
WGSHP - Final Report (Vol. II) Kozhivalkuthu
Integrated Rural Technology Centre, Palakkad 1.6
Tariff (per Unit) - Rs. 2.5 and 3.0 (Two cases)
Investment cost (Rs. in Crores per MW) - Rs. 3.5 (Two cases)
Since manufacturers were not in a position to quote exact figures, no attempt was made to fine
tune the cost in relation to site specific conditions. Only ranges could be indicated. Each
combination of tariff and capital cost selected above, will demand a minimum annual generation
per kW installed. This can be taken to be the break even Plant Capacity Factor (PCF) for the
site under the specified conditions.
Lower the cost/MW and higher the price for energy, the larger will be the economically
viable installed capacity and the quantity of energy that can be economically extracted
from a given site.
Let the capital cost of Kozhivalkuthu be Rs.3.5 crores/MW. The annual rate is 25%. Let the
unit rate of tariff offered by K.S.E.B be Rs. 2.5/kWh.
If X be the number of hours of operation at full load capacity,
per Mega Watt annual cost, at the rate of 25% on investment = Rs. 3.5 Crores x 0.25
per Mega Watt revenue = 1000 kW x Rs. 2.5 x X
Equating the two, we get 3,50,00,000 x 0.2.5 = X x 1000 x 2.5
X = 3,500 hrs.
It follows that, any combination of machines, that can work at full capacity for over 3500 hours
can deliver a profit, if the overall project cost is below Rs. 3.5 crores/MW and tariff is Rs. 2.5
per kilo Watt hour.
This can be explained better in terms of Plant Capacity Factor, which is defined as the ratio of
actual amount of energy obtained to the maximum energy that can be obtained from the given
installed capacity during an year, to the actual amount of energy obtained.
In this case, for the value of X = 3500 hours, PCF = (3500 / 8760) x 100 = 40%
That is, a maximum capacity, which yields a PCF of 40% is economically viable for this site.
Similarly, break even PCF for Rs.3.0 per and Rs. 3.5 Crores per Mega Watt where X=2916

WGSHP - Final Report (Vol. II) Kozhivalkuthu
Integrated Rural Technology Centre, Palakkad 1.7
hours is 33.3%
Now we shall check various capacities of turbine size which are suitable for this two conditions.
a. Tariff: Rs.2.50/kWh and break even PCF of 40%
For an installed capacity of 13000 kW, which corresponds to about 13.5% flow of exceedence
from the chart, the total energy yield is the sum of:
13000 kW x (0.135 x 8760) = 15.4MU at continuous operation for 13.5% time of an year, and
32.88MU, which is the cumulative energy potential from 13.5% to 100% time as obtained from
the Chart (Table 24.3).
Total yield = 13.5MU + 33MU = 46.5 MU.
The Plant Capacity Factor, corresponding to this yield is given by :
PCF = 46.5 x 10⁸ / (13000 x 8760) = 40.8 %
This PCF is equal to the break even value of 40%. So 13000 kW will be the optimum choice
for the site, if the overall project cost is below Rs.3.5 crores/MW and tariff is Rs. 2.5 per
kilo Watt hour.
b. Tariff: Rs.3.0/kWh and break even PCF of 33.3%
Similarly, for 16000 kW (for 6% flow of exceedence)
PCF = (49000000 / 160000 x 8760) x 100 = 35%
This PCF is very near to the break even value of 33%.
Similarly, 16000 kW will be the optimum choice for the site, if the overall project cost is
below Rs. 3.5 crores/MW and tariff is Rs. 3.0 per kilo Watt hour.
Table 25.5
Economically Viable Maximum Capacity at Different Costs and Tariff
Tariff
Unit size for
Rs.3.5 Crores/MW
Rs.2.5/Unit
13000 kW

WGSHP - Final Report (Vol. II) Kozhivalkuthu
Integrated Rural Technology Centre, Palakkad 1.8
Rs.3.00/ Unit 16000 kW
WGSHP - Final Report (Vol. II) Kozhivalkuthu
Integrated Rural Technology Centre, Palakkad 1.9
The units selected can be one of the following combinations:
For Rs.3.5 Crores/MW and Rs.2.5/Unit we can opt (5MW x 2 + 1MW x 3)
For Rs.3.5 Crores/MW and Rs.3.0/Unit we can opt (5 MW x 3 + 1 MW x 1)
Among these two categories, the second one seems to be less viable since it is bulky with units.
We have restricted ourselves to the more realistic combination of Rs. 3.5 Crores/MW of
investment cost and two tariff choices of Rs. 2.5/Unit and Rs. 3.0/Unit.
24.5 CIVIL ENGINEERING WORKS
The important Civil Engineering Works required for the project are a weir, an intake structure, a
penstock and a power house. A weir is constructed to have a small storage and to divert the
water from stream to the intake. For this project an overflow weir is to be constructed, which
allows the excess water to flow over the weir to the downstream. The intake structure takes
water from the weir and lead it to the penstock. The penstock is a pressure pipe which carries
water to the turbine. It can be made of steel, cast iron, plastics (Poly Vinyl Chloride, High
Density Poly Ethylene) and concrete. In this project a steel penstock is used. A power houses
constructed for the purpose of housing the electro mechanical equipment. It is usually small
building of one or two rooms.
24.5.1 Weir at Kozhivalkuthu
A gabion weir has been proposed on the Mankulam stream, at a bed level of +497.750 metres.
The gabion structure is 6.6 metre height having a length of 57m at the top with a central board
crested free over fall type spill way. A gravity dam is a structure which is designed in a such a
way that its own weight resists the external forces. The preliminary analysis of the proposed
structure has been carried out and a typical section of the structure is shown in Fig.No.24.7.
24.5.2 Intake Structure, Penstock and Power House
A simple box type direct intake structure of reinforced cement concrete is provided on the stream
bed. A trash rack is provided at the intake mouth. The pen stock entrance starts from the wall
of intake box near the gabion. The economic diameter of the penstock is the diameter for which
the annual cost which includes the cost of power lost due to friction and changes for amortization
of construction, cost, maintenance, operation etc., is the minimum. The economic diameter is
calculated as 2 m.

WGSHP - Final Report (Vol. II) Kozhivalkuthu
Integrated Rural Technology Centre, Palakkad 1.10
The steel penstock of 2 m inner diameter takes off from the intake structure. The penstock can
carry a maximum flow of 13.87 cumec with a velocity of 4.4 m/sec. The possible alignment for
the penstock was located on the left bank of the Kozhival stream. The longitudinal section of the
proposed penstock line was drawn and calculated the length of the penstock, which comes to be
342 m. (Fig.No.24.8). A surface power house is proposed on the left bank of stream. The
slope at the proposed site is moderate but it increases up the hill towards upstream. The power
house is of size 24m x 12m. to accommodate 13 MW generator and the standardised turbine.
24.6 ELECTRICAL AND MECHANICAL EQUIPMENTS
The power house proposed in the scheme will have an installed capacity of 13 MW. The
electricity generated would be connected with the existing power grid system at by a 6 Km
transmission line.
A standardised turbine for 125 m. gross head is proposed for this particular site. The turbine
shall be complete with a governor, control equipment and safety devices. The generator would
be synchronous with a brushless excitation system shall be rated to generate 13MW, at 11KV,
three phases, 50Hz and shall be suitable for coupling with turbine described above. The
generator shall have voltage regulation equipment, parallel operation equipment etc.
24.7 ENVIRONMENTAL IMPACTS
A small hydro project has been proposed at Kozhivalkuthu (Idukki District). The project aims to
generates about 13000 of hydro power from a fall having a head of 125 m. Some preliminary
environmental impact analysis have been carried out. They are land, water and socio-
economical environmental impacts.
24.7.1. Environmental impact on land
The catchment area measured from topo sheet comes to be 2.25sq. km. The falls are situated in
Kozhivalkuthu stream. After the fall, the stream joins to the Karinthiripuzha which flows to
Periyar river.

WGSHP - Final Report (Vol. II) Kozhivalkuthu
Integrated Rural Technology Centre, Palakkad 1.11
The most significant thing is that, due to impoundment, no forest land will be submerged. The
construction of weir, penstock, power house, tailrace and temporary road will not take away any
forest land. So no forest clearance is required for the project.
23.7.2 Environmental impact on water
The Kozhivalkuthu stream which drains to Karinthiripuzha is the stream of this fall. The diversion
structure will create a pond of area 1.2ha. No forest land will be submerged. Above all, this accounts
for only 0.092 ha/MW. This diversion structure which also acts as a check dam can increase the
height of water table level at the site. The impounded water will also change soil moisture regime in
adjacent forest land.
23.7.3 Socio-economic impact
The construction phase would create employment opportunities for a period of 18 months. The peak
labour strength is 100 skilled and 250 unskilled labour. It requires only minimum land acquisition for
construction. The acquisition does not need any rehabilitation.
24.8 CONCLUSION
The environmental impact of small hydel project is negligible compared to large hydel projects.
Moreover, deforestation owing to the indentation will be a meagre area.
The economic size of installed capacity depends upon the permissible tariff as well as the capital cost.
It was found that the project is financially viable for an installed capacity of 13000kW at a project
cost of Rs. 3.5 Crores per MW and a tariff rate of Rs.2.5 per unit of electricity. Alternatively, if the
tariff is raised to Rs.3.00 per unit, an installed capacity of 16000kW would become economically
viable.
Cost effective methods of construction, like the use of gabion weirs, can be used to reduce the capital
costs. A methodology for implementing the project with a maximum of peoples= participation should
also be devised. The role of the Grama Panchayat in this effort is crucial.
-�-

WGSHP - Final Report (Vol. II) Kozhivalkuthu
Integrated Rural Technology Centre, Palakkad 1.12
25. PAMBLE
District : Idukki Panchayath : Kanjikuzhi Head : 140 m. Flow : Perennial
Suggested Capacity : 2.5 MW/ 4MW
25.1 GENERAL
25.1.1 The Site Idukki district is blessed with a number of water falls. Most of them are potential sites for small hydro
power generation. The Pamble water fall is situated in the 11th ward of Kanjikkuzhi Grama
Panchayath in Idukki district. The site is at a distance of 1.5 km from Kanjikkuzhi town. There is bus
route from Kothamangalam to Kattappana. Kanjikuzhi is at a distance of 7 km. from Chelachuvadu
which is a major stop in the Kothamangalam -Kattappana route. From Kanjikkuzhi there is a
jeepable road to the site. Nearest 11 kV transformer is at a distance of 1km. from the site.
The water fall is located at 76056'40" E longitude and 90057'30" N latitude. The catchment area
measured from toposheet is 17.75 sq.km. The falls are situated at an elevation of 480 m from MSL in
Pazhayarithodu which begins at an elevation of 825 m from MSL. The stream flows through steeply
sloping areas. There are a number of falls in this stream other than Pamble. Another main fall is
located at the upstream side of the Pamble named Vattompara. After the fall, the stream joins the
Periyar river. The joining point of the stream is just down stream of the Lower Periyar Dam. (Fig.
No. 25.1).

WGSHP - Final Report (Vol. II) Kozhivalkuthu
Integrated Rural Technology Centre, Palakkad 1.13
25.1.2 Topography The site is situated out side forest area. Both sides of the stream are owned by private persons. The
land has a moderate slope in this area. There is no possibility of land slide and the chances of soil
erosion are negligible. The bed of the stream is rocky and boulders are available in plenty at site. The
number of rainy days exceeds 50% in its catchment.
25.2 FIELD INVESTIGATION 25.2.1 Reconnaissance Survey A topographical survey was conducted for obtaining topographical details of the site. The total head
of the site was found to be 125 m. The possible location for diversion structure and power house were identified and the details were taken using tacheometric method of surveying.
25.2.2 Catchment Area Topographical survey sheets to a scale of 1:50,000 are available from the Survey of India. The
catchment of Pamble water fall was located using the toposheet. It is shown in the Fig.25.2 and the
area measured comes to nearly 17.75 sq.km. The catchment area is having mostly moderate slope but
some portions are very steep. Maximum flood discharge measured at this site during 1998 is about
17.56 cumec.
25.2.3 Contour Map The tacheometric survey details were plotted on a sheet of paper at a scale of 1:500 (Annexure
A.25). The undulations of the site, the location of the falls and other topographical features were
identified from the contour map. The location of the weir, the alignment of the penstock and location of
the power house were also determined using this and marked in the above map, along with the
contours of the area.
25.2.4 River Flow Data For a period of 12 months (December 97 to December 98) the water level observations were taken
every week. A suitable location was identified at the upstream of the fall, where the discharge will be
identical. The cross sectional details of the point were measured for calculating the stream discharge .
We fixed a measuring gauge at this point. The peak flow was also recorded. Using the collected data
(Table. 25.1) the weekly discharge hydrograph of the site was prepared (Fig. 25.3).
25.2.5 Flow Duration Curves Using weekly discharge hydro graph, percentage flow of exceedence was calculated. From this, the
flow duration curve was plotted (Fig. 25.4). The same curve also functions as percentage flow of
exceedence graph. This river flow data is recalculated in tabular form, giving the corresponding energy
potential in weekly and cumulative mode is given in Table 25.2. These data are used for calculating
energy potential and selection of unit sizes in section 25.4.

WGSHP - Final Report (Vol. II) Kozhivalkuthu
Integrated Rural Technology Centre, Palakkad 1.14
25.2.6 Peak Flow Determination There are various empirical methods for calculating the maximum flood discharge. The different values
obtained are shown in Table 25.3 The value obtained by Dicken=s formula, which is commonly used
in western ghats region has been used for the structural design.
Table 25.3 Peak Flow Determination
Parameters Dicken== s method Ingli== s formula Ryve== s formula Nawab Jung Bahadur
formula Peak flow in cumecs 224.84 411.49 68.73 606.30
25.3 SALIENT DESIGN FEATURES A detailed design of Civil, Electrical, and Mechanical work has not been carried out in this report as it
does not come under the scope of this work, but a typical section of the proposed diversion structure
is given here. The stability analysis of the section and economic diameter of the penstock was carried
out as part of preliminary design. The capability and number of units, type and specification of turbine,
generator and their cost have been estimated, after consulting various agencies.
25.3.1 Power Potential of the Project The discharge corresponding to 90% exceedence is only 0.02 cubic metre/second. A discharge of
0.02 cubic metre/second can produce only about 25 kW. However it is seen 0.33 cumec is available
for 50% of the time and 0.68 for 40%. In order to tap the optimum full potential of the site, the
project is designed to generate higher output with lower dependability.
The output power can be computed using the formula, P = 10 x Q x H x ηη
Where; P = Power output in kW.
Q = Discharge in cumec.
H = Head available in metres
η = Overall Efficiency (Here it is assumed as 75%)
For 50% of exceedence P = 10 x 0.33 x 140 x 0.75 . 345 kW
For 40% of exceedence P = 10 x 0.68 x 140 x 0.75 = 700 kW
For 30% of exceedence P = 10 x 2.45 x 140 x 0.75 = 2500 kW
25.3.2 Energy Potential At this site, sufficient flow is there so that we can obtain 750kW power output for 39% of the time
(147 days) or 350kW for 50% time (183 days). The energy output corresponding to 39% time will
be (39/100 x 750 x 365 x 24) = 2.56 MU. The flow after 40% time can be utilized by providing a
small pondage. The quantity of water available from 40% to 100% time (ie, 23 rd week to 52 nd
week) is calculated to be 3418934 m3 (Table 25.2). Energy obtained from this water is calculated to
be 0.997 MU.

WGSHP - Final Report (Vol. II) Kozhivalkuthu
Integrated Rural Technology Centre, Palakkad 1.15
Total amount of energy produced = 2.56 MU + 0.997 MU = 3.56 MU. It may be noted that, this much amount of energy can be generated for the particular year. If higher
flows are available during any year, it will enable higher production and vice versa.
25.3.3 Pondage Requirement From the contour map prepared for the weir site, a plot of surface area Vs. elevation is drawn in
Fig.25.5. The areas corresponding to each elevation is used to find the volume of water that can be
stored in each elevation and the details are shown in Table 25.4. From this information a capacity
elevation curve of the pondage is prepared and is shown in Fig.No.25.6. The height of weir was
chosen based on the following considerations.

WGSHP - Final Report (Vol. II) Kozhivalkuthu
Integrated Rural Technology Centre, Palakkad 1.16
Table 25.4
Pondage Area Details Sl. No. Elevation (m.) Area (m2) Capacity (m3) Energy (kWh) 1 501.50 0 0 0 2 502 15.75 7.875 2
3 503 56.75 44.125 13 4 504 207.50 176.250 51 5 505 352.50 456.250 133 6 506 446.25
855.625 249 7 507 525.00 1341.250 391 8 508 648.75 1928.125 562 9 509 922.50 2713.750
791
As the terrain is suitable for only storing about 2700m3, it follows that, at full storage, the energy
capacity is only about 791 kWh. If a single 750kW machine is operated at full capacity, it will last
only for about an hour. However, if a 250kW unit is also installed, this is sufficient for about 3 hours
of generation, during peak time. Since this pondage becomes critical only during the lean months, this
kind of an operating practice is acceptable. Hence a weir height of 7.5m, to create a pondage of
2713m3 is suggested.
25.4 SELECTION OF PLANT CAPACITY AND UNIT SIZES For optimization of plant capacity, the following parameters were assumed.
Rate of return on investment - 15% Loan repayment period - 10 years Average O/M cost - 2.5% of capital cost Resulting standard annual cost - 25%
(This consists of 2.5% O & M costs, 15% return on 25% equity, 15% interest on 75% loan and
repayment of loan in 10 annual instalments)
Tariff (per Unit) - Rs. 2.5 and 3.0 (Two cases) Investment cost (Rs. in Crores per MW) - Rs. 3.5 (Two cases)
Since manufacturers were not in a position to quote exact figures, no attempt was made to fine tune the cost in relation to site specific conditions. Only ranges could be indicated. Each combination of tariff and capital cost selected above, will demand a minimum annual generation per kW installed. This can be taken to be the break even Plant Capacity Factor (PCF) for the site under the specified conditions. Lower the cost/MW and higher the price for energy, the larger will be the economically viable installed capacity and the quantity of energy that can be economically extracted from a given site. Let the capital cost of Pamble be Rs.3.5 crores/MW. The annual rate is 25%. Let the unit rate of tariff offered by K.S.E.B be Rs. 2.5/kWh. If X be the number of hours of operation at full load capacity, per Mega Watt annual cost, at the rate of 25% on investment = Rs. 3.5 Crores x 0.25 per Mega Watt revenue = 1000 kW x Rs. 2.5 x X Equating the two, we get 3,50,00,000 x 0.2.5 = X x 1000 x 2.5
X = 3,500 hrs.
It follows that, any combination of machines, that can work at full capacity for over 3500 hours can

WGSHP - Final Report (Vol. II) Kozhivalkuthu
Integrated Rural Technology Centre, Palakkad 1.17
deliver a profit, if the overall project cost is below Rs. 3.5 crores/MW and tariff is Rs. 2.5 per kilo
Watt hour.
This can be explained better in terms of Plant Capacity Factor, which is defined as the ratio of
actual amount of energy obtained to the maximum energy that can be obtained from the given installed
capacity during an year, to the actual amount of energy obtained.
In this case, for the value of X = 3500 hours, PCF = (3500 / 8760) x 100 = 40%
That is, a maximum capacity, which yields a PCF of 40% is economically viable for this site.
Similarly, break even PCF for Rs.3.0 per and Rs. 3.5 Crores per mega watt where X=2916 hours is
33.3%
Now we shall check various capacities of turbine size which are suitable for this two conditions.
a. Tariff: Rs.2.50/kWh and break even PCF of 40%
For an installed capacity of 2500 kW, which corresponds to about 30% flow of exceedence from the
chart, the total energy yield is the sum of:
2500 kW x (0.3 x 8760) = 6.6MU at continuous operation for 30% time of an year, and 2.04MU,
which is the cumulative energy potential from 30% to 100% time as obtained from the Chart (Table
25.3).
Total yield = 6.6MU + 2.04MU = 8.64 MU. The Plant Capacity Factor, corresponding to this yield is given by :
PCF = 8.64 x 10⁸ / (2500 x 8760) = 39.5%
This PCF is equal to the break even value of 40%.
So 2500 kW will be the optimum choice for the site, if the overall project cost is below Rs.3.5
crores/MW and tariff is Rs. 2.5 per kilo Watt hour.
b. Tariff: Rs.3.0/kWh and break even PCF of 33.3%
Similarly, for 4000 kW (for 18% flow of exceedence)
PCF = (12000000/4000x8760) x 100 = 34.2%
This PCF is very near to the break even value of 33%.
Similarly, 4000 kW will be the optimum choice for the site, if the overall project cost is below
Rs. 3.5 crores/MW and tariff is Rs. 3.0 per kilo Watt hour.
Table 25.5 Economically Viable Maximum Capacity at Different Costs and Tariff
Tariff Unit size for Rs.3.5 Crores/MW Rs.2.5/Unit 2500 kW Rs.3.00/ Unit 4000 kW
The units selected can be one of the following combinations:
For Rs.3.5 Crores/MW and Rs.2.5/Unit we can opt (1MW x 2 + 0.5 MW x 1)
For Rs.3.5 Crores/MW and Rs.3.0/Unit we can opt (2 MW x 1 + 1 MW x 2).

WGSHP - Final Report (Vol. II) Kozhivalkuthu
Integrated Rural Technology Centre, Palakkad 1.18
Among these two categories, the second one seems to be less viable since it is bulky with units. We
have restricted ourselves to the more realistic combination of Rs.3.5 Crores/MW of investment cost
and two tariff choices of Rs.2.5/Unit and Rs.3.0/Unit.
25.5 CIVIL ENGINEERING WORKS The important Civil Engineering Works required for the project are a diversion weir, an intake
structure, a penstock and a power house. A weir is constructed to have a small storage and to divert
the water from stream to the intake. For this project only a diversion weir is proposed, which allows
the excess water to flow over the weir to the downstream. The intake structure takes water from the
weir and leads it to the penstock. The penstock made of steel is proposed in this site. A power house
is constructed for the purpose of housing the electro mechanical equipment. A small building of one
or two rooms will suffice.
25.5.1 Weir at Pamble A concrete weir has been proposed on the Pazhayarithod, at a bed level of 501.500 metres. The
base width of the weir at bed level is 5.10 m. The structure is 7.50 m high having a length of 35m at
the top with a central broad crested free over fall type spill way. The cross sectional details of the
proposed site is shown in Fig.No. 25.7
25.5.2 Intake Structure, Penstock and Power House A simple box type, direct intake structure of reinforced cement concrete is provided on the stream
bed. A trash rack is provided at the intake mouth, the penstock entrance starts from the wall of intake
box near the structure. The economic diameter of the penstock is calculated as 0.69 m and the
thickness of the penstock is found as 6 mm. The penstock can carry a maximum flow of 0.476 cumec
with a velocity of 1.27 metre per second. The possible alignment for the penstock is located on the
left bank of the stream.
The longitudinal section of the proposed penstock line was drawn from the contour map and the length
was calculated, which came to 366 m (Fig. No. 25.8).
A surface power house is proposed on the left bank of the stream. The slope at the proposed site is moderate but increases up the hill towards north east direction. The power house building is of size 12.5m x 8m to accommodate a 2.5 MW and 2.5 MW generator and standardised turbine. 25.6 ELECTRICAL AND MECHANICAL EQUIPMENTS The power house proposed in the scheme will have an installed capacity of 2.5 MW. Using an 1 kM
transmission line, power generated will be connected to the existing power grid system at Kanjikkuzhi.
They will be equipped with governor, control equipment and safety devices. There will be three
corresponding generators with brushless excitation system. They will have regulation equipment,
parallel operation equipment etc. A 11 kV, three phase line with a frequency of 50Hz will be

WGSHP - Final Report (Vol. II) Kozhivalkuthu
Integrated Rural Technology Centre, Palakkad 1.19
satisfactory for us.
25.7 ENVIRONMENTAL IMPACTS A small hydro project is being proposed at Pamble (Idukki Dist). The project aims to generates about
2.5 MW of hydro power from a fall having a head of 140 m. Some preliminary environmental impact
analysis have been carried out. They are land, water and socio -economical environmental impacts.
25.7.1 Environmental Impact on Land Total area of catchment is about 17.75 square kilometres of land in Pazhayarithodu. The upper
catchment is rocky and with little vegetation cover. The forest in this sector is semi evergreen and
deciduous. Both banks of the land is owned by private persons. Stream sections are mostly rocky
and large sized boulders are available in plenty.
The most significant thing is that, due to impoundment, no forest land will be submerged. The
construction of weir, penstock, power house, tailrace and temporary road will not take away any
forest land. So no forest clearance is required for the Project. The inundated land (922 m2) is mostly
river bed and low lying banks.
25.7.2 Environmental Impact on Water The Pazhayarithodu, which drains to Periyar river is the stream of this fall. It is a 3rd order, structurally
controlled stream. The diversion structure will create a pond of area 0.0922 hectare. No forest land
will be submerged. Above all, this accounts for only 0.037 ha/MW. The diversion structure which
also acts as a check dam can increase the height of water table level at the site. The impounded water
will also change soil moisture regime in adjacent forest land. So, in ecological point of view, the
diversion structure not only helps to hold the rain water, but also causes a positive effect.
25.7.3 Socio-economic Impact The construction phase would create employment opportunities for a period of 18 months. The peak
labour strength is 100 skilled and 100 unskilled labour. It require only minimum land acquisition for
construction. The acquisition does not need any rehabilitation. Not even a single family needs to be
rehabilitated.
25.8 CONCLUSION The environmental impact of this small hydel project is negligible. No serious adverse impact is
anticipated. Moreover, deforestation owing to the inundation will be a meagre area.
The economic size of installed capacity depends upon the permissible tariff as well as the capital cost.
It was found that the project is financially viable for an installed capacity of 2500kW at a project cost
of Rs. 3.5 Crores per MW and a tariff rate of Rs.2.5 per unit of electricity. Alternatively, if the tariff is
raised to Rs.3.00 per unit, an installed capacity of 4000kW would become economically viable.

WGSHP - Final Report (Vol. II) Kozhivalkuthu
Integrated Rural Technology Centre, Palakkad 1.20
Cost effective methods of construction, like the use of gabion weirs, can be used to reduce the capital
costs. A methodology for implementing the project with a maximum of peoples= participation should
also be devised. The role of the Grama Panchayath in this effort is crucial.
-�-
26. VATTOMPARA
District : Idukki
Panchayath : Kanjikuzhi
Head : 140 m.
Flow : Perennial
Suggested Capacity : 2.5MW/ 4MW

WGSHP - Final Report (Vol. II) Vattompara
Integrated Rural Technology Centre, Palakkad 1.1
26.1 GENERAL
26.1.1 The Site
The Vattompara water fall is situated in the 11th ward of Kanjikkuzhi Grama Panchayath in
Idukki district. The site is at a distance of 1.3 km from Kanjikkuzhi town. There is a bus route
from Kothamangalam to Kattappana. Kanjikuzhi is at a distance of 7 km. from Chelachuvadu
which is a major stop in the above said route. Jeep services are also available to Kanjikuzhi from
Chelachuvadu. From Kanjikkuzhi there is a jeepable road to the site. Nearest 11 kV
transformer is at a distance of 1km. from the site.
The water fall is located at 760 56' 10" E longitude and 90 57' 40" N latitude. The catchment area
measured from topo sheet is 12.63sq. km. The falls are situated at an elevation of 680m, in
Pazhayarithodu which is beginning at an elevation of 820m. The stream flows through steeply
sloping areas. There are a number of falls in this stream other than Vattompara. Another main
fall is located at the downstream side of the Vattompara named Pamble. After the fall, the stream
joins the Periyar river. The joining point of the stream is just dam stream of the Lower Periyar
Dam (Fig.No.26.1)
26.1.2 Topography
The site is situated in forest area owned by Revenue Department. Both sides of the stream is
almost steep slope. There is no possibility for land slide in this are and the chances of soil erosion
are negligible. The bed of this stream is rocky and boulder are available in plenty at site. The
number of rainy days exceeds 50% in its catchment.
26.2 FIELD INVESTIGATION
26.2.1 Reconnaissance Survey
A topographical survey was conducted for obtaining topographical details of the site. There is
one main fall which gives a total head of 20m. The possible location for diversion structure and
power house were identified and the details were taken using tacheometric method of surveying.

WGSHP - Final Report (Vol. II) Vattompara
Integrated Rural Technology Centre, Palakkad 1.2
26.2.2 Catchment Area
Topographical survey sheets to a scale of 1:50,000 are available from the Survey of India. The
catchment of Vattompara falls was located using the toposheet. It is shown in the Fig.No.26.2.
From the shape it is identified as a fan shaped catchment and its area comes to nearly 12.63km.
The catchment area having almost moderate slope but some portions are very steep. Maximum
flood discharge measured at this site during 1998-99 is about 17.56 cumec.
26.2.3 Contour Map
The survey details were plotted on a sheet of paper at a scale of 1:500. The undulations of the
site, the location of the falls and other topographical features were identified from the contour
map. The location of the weir, the alignment of the penstock and location of the power house
were also determined using this and the prepared contour map has been shown in Annexure
A.26..
26.2.4 River Flow Data
For a period of 12 months (January 1998 to January 1999) the water level observations were
taken every week. A suitable location was identified on the upstream of the fall, where the whole
water is flowing through that point, cross sectional details of the point were noted for calculating
the stream discharge. We fixed a measuring gauge at this point to measure the peak flow. Using
the collected data (Table 26.1) the weekly discharge hydrograph of the site is prepared. The
graph is shown in Fig. No. 26.3.
26.2.5 Flow Duration Curves
Using weekly discharge hydro graph, percentage flow of exceedence was calculated. From this,
the flow duration curve was plotted (Fig. No. 1.4). The same curve also functions as percentage
flow of exceedence graph. This river flow data is recalculated in tabular form, giving the
corresponding energy potential in weekly and cumulative mode is given in Table 1.2. These data
are used for calculating energy potential and selection of unit sizes in section 1.4.
26.2.6 Peak Flow Determination
There are various empirical methods for calculating the maximum flood discharge. The different
values obtained are shown in Table 26.3 The value obtained by Dicken=s formula, which is

WGSHP - Final Report (Vol. II) Vattompara
Integrated Rural Technology Centre, Palakkad 1.3
commonly used in western ghats region has been used for the structural design.
Table 26.3
Peak Flow Determination
Parameters
Dicken==s method
Ingli== s formula
Ryve == s formula
Nawab Jung
Bahadur formula Peak flow in cumecs
174.14
323.62
54.76
467.65
26.3 SALIENT DESIGN FEATURES
A detailed design of Civil, Electrical & Mechanical work has not been carried out in this report as
it does not come under the purview of the project, but a typical section of the proposed diversion
structure is given here. The stability analysis of the section and economic diameter of the
penstock was carried out as part of preliminary design. The capability and number of units, type
and specification of turbine, generator and it=s cost have been estimated, after consulting various
agencies.
26.3.1 Power Potential of the Project
The discharge corresponding to 90% exceedence is only 0.02 cubic metre/second. A discharge
of 0.02 cubic metre/second can produce only about 25 kW. However it is seen 0.33 cumec is
available for 50% of the time and 0.68 for 40%. In order to tap the optimum full potential of the
site, the project is designed to generate higher output with lower dependability.
The output power can be computed using the formula, P = 10 x Q x H x ηη
Where; P = Power output in kW .
Q = Discharge in cumec.
H = Head available in metres
η = Overall Efficiency (Here it is assumed as 75%)
For 50% of exceedence P = 10 x 0.33 x 140 x 0.75 . 345 kW
For 40% of exceedence P = 10 x 0.68 x 140 x 0.75 = 700 kW
For 30% of exceedence P = 10 x 2.45 x 140 x 0.75 = 2500 kW

WGSHP - Final Report (Vol. II) Vattompara
Integrated Rural Technology Centre, Palakkad 1.5
26.3.2 Energy Potential
At this site, sufficient flow is there so that we can obtain 750kW power output for 39% of the
time (147 days) or 350kW for 50% time (183 days). The energy output corresponding to 39%
time will be (39/100 x 750 x 365 x 24) = 2.56 MU. The flow after 40% time can be utilized by
providing a small pondage. The quantity of water available from 40% to 100% time (ie, 23rd
week to 52 nd week)is calculated to be 3418934 m3 (Table 25.2). Energy obtained from this
water is calculated to be 0.997 MU.
Total amount of energy produced = 2.56 MU + 0.997 MU = 3.56 MU.
It may be noted that , this much amount of energy can be generated for the particular year. If
higher flows are available during any year, it will enable higher production and vice versa.
26.3.3 Pondage Requirement
From the contour map a plot of surface area Vs. elevation is drawn in Fig.No. 26.5. The areas
corresponding to each elevation is used to find the volume of water that can be stored in each
elevation and the details are shown in Table 26.4. From this information a capacity elevation
curve of the pondage is prepared and is shown in Fig.No. 26.6.
Table 26.4
Pondage Area Details Sl. No.
Elevation (m.)
Area (m2)
Capacity (m3)
Energy (kWh)
1
797.50
0
0
0
2
798
39.25
9.8125
0.3
3
799
183.00
120.9375
3.5
4
800
501.25
463.9625
13.5
As the terrain is suitable for only storing about 460m3, it follows that, at full storage, the energy
capacity is only about 13 kWh. If a single 10kW machine is operated at full capacity, it will last
only for about an hour. As the terrain is not suitable for creating a pondage, here we opt for a run
of the river system.
WGSHP - Final Report (Vol. II) Vattompara
Integrated Rural Technology Centre, Palakkad 1.6
26.4 SELECTION OF PLANT CAPACITY AND UNIT SIZES
For optimization of plant capacity, the following parameters were assumed.
Rate of return on investment - 15%
Loan repayment period - 10 years
Average O/M cost - 2.5% of capital cost
Resulting standard annual cost - 25%
(This consists of 2.5% O & M costs, 15% return on 25% equity, 15% interest on 75% loan and
repayment of loan in 10 annual instalments)
Tariff (per Unit) - Rs. 2.5 and 3.0 (Two cases)
Investment cost (Rs. in Crores per MW) - Rs. 3.5 (Two cases)
Since manufacturers were not in a position to quote exact figures, no attempt was made to fine
tune the cost in relation to site specific conditions. Only ranges could be indicated. Each
combination of tariff and capital cost selected above, will demand a minimum annual generation
per kW installed. This can be taken to be the break even Plant Capacity Factor (PCF) for the
site under the specified conditions.
Lower the cost/MW and higher the price for energy, the larger will be the economically viable
installed capacity and the quantity of energy that can be economically extracted from a given site.
Let the capital cost of Vattompara be Rs.3.5 crores/MW. The annual rate is 25%. Let the unit
rate of tariff offered by K.S.E.B be Rs. 2.5/kWh.
If X be the number of hours of operation at full load capacity,
per Mega Watt annual cost, at the rate of 25% on investment = Rs. 3.5 Crores x 0.25
per Mega Watt revenue = 1000 kW x Rs. 2.5 x X
Equating the two, we get 3,50,00,000 x 0.2.5 = X x 1000 x 2.5
WGSHP - Final Report (Vol. II) Vattompara
Integrated Rural Technology Centre, Palakkad 1.7
X = 3,500 hrs.
It follows that, any combination of machines, that can work at full capacity for over 3500 hours
can deliver a profit, if the overall project cost is below Rs.3.5 crores/MW and tariff is Rs.2.5 per
kilo Watt hour.
This can be explained better in terms of Plant Capacity Factor, which is defined as the ratio of
actual amount of energy obtained to the maximum energy that can be obtained from the given
installed capacity during an year, to the actual amount of energy obtained.
In this case, for the value of X = 3500 hours, PCF = (3500 / 8760) x 100 = 40%
That is, a maximum capacity, which yields a PCF of 40% is economically viable for this site.
Similarly, break even PCF for Rs.3.0 per and Rs. 3.5 Crores per mega watt where X=2916
hours is 33.3%
Now we shall check various capacities of turbine size which are suitable for this two conditions.
a. Tariff: Rs.2.50/kWh and break even PCF of 40%
For an installed capacity of 2500 kW, which corresponds to about 30% flow of exceedence
from the chart, the total energy yield is the sum of:
2500 kW x (0.3 x 8760) = 6.6MU at continuous operation for 30% time of an year, and
2.04MU, which is the cumulative energy potential from 30% to 100% time as obtained from the
Chart (Table 26.3).
Total yield = 6.6MU + 2.04MU = 8.64 MU.
The Plant Capacity Factor, corresponding to this yield is given by :
PCF = 8.64 x 10⁸ / (2500 x 8760) = 39.5%
This PCF is equal to the break even value of 40%.
So 2500 kW will be the optimum choice for the site, if the overall project cost is below

WGSHP - Final Report (Vol. II) Vattompara
Integrated Rural Technology Centre, Palakkad 1.8
Rs.3.5 crores/MW and tariff is Rs. 2.5 per kilo Watt hour.
b. Tariff: Rs.3.0/kWh and break even PCF of 33.3%
Similarly, For 4000 kW (for 18% flow of exceedence)
PCF = (12000000/4000x8760) x 100 = 34.2%
This PCF is very near to the break even value of 33%.
Similarly, 4000 kW will be the optimum choice for the site, if the overall project cost is
below Rs. 3.5 crores/MW and tariff is Rs. 3.0 per kilo Watt hour.
Table 26.5
Economically Viable Maximum Capacity at Different Costs and Tariff
Tariff
Unit size for
Rs.3.5 Crores/MW
Rs.2.5/Unit
2500 kW
Rs.3.00/ Unit
4000 kW
The units selected can be one of the following combinations:
For Rs.3.5 Crores/MW and Rs.2.5/Unit we can opt ( 1MW x 2 + 0.5 MW x 1)
For Rs.3.5 Crores/MW and Rs.3.0/Unit we can opt ( 2MW x 1 + 1MW x 2).
Among these two categories, the second one seems to be less viable since it is bulky with units.
We have restricted ourselves to the more realistic combination of Rs.3.5 Crores/MW of
investment cost and two tariff choices of Rs. 2.5/Unit and Rs. 3.0/Unit.
26.5 CIVIL ENGINEERING WORKS
The important Civil Engineering Works required for the project are a diversion weir, an intake
structure, a penstock and a power house. A weir is constructed to have a small storage and to
divert the water from stream to the intake. For this project only a diversion weir is proposed,
which allows the excess water to flow over the weir to the downstream. The intake structure
takes water from the weir and leads it to the penstock. The penstock made of steel is proposed

WGSHP - Final Report (Vol. II) Vattompara
Integrated Rural Technology Centre, Palakkad 1.9
in this site. A power house is constructed for the purpose of housing the electro mechanical
equipment. It is usually a small building of 12.5mx 8m
26.5.1 Weir at Vattompara
A concrete weir has been proposed on the Pazhayarithodu, at a bed level of +797.000 metres.
The base width of the weir at bed level is 5.15m. The structure is 2.50m high having a length of
10.50 m at the top with a central broad crested free over fall type spill way. The cross sectional
details of the proposed site is shown in Fig.No. 26.7.
26.5.2 Intake Structure, Penstock and Power House
A simple box type, direct intake structure of reinforced cement concrete is provided on the
stream bed. A trash rack is provided at the intake mouth, the penstock entrance starts from the
wall of intake box near the gabion. The economic diameter of the penstock is calculated as
0.69m. The penstock can carry a maximum flow of 0.76 cumec with a velocity of 1.27 metre
per second. The possible alignment for the penstock is located on the left bank of the stream.
The longitudinal section of the proposed penstock line was drawn from the contour map and the
length was calculated, which came to 507m (Fig. No. 26.8).
A surface power house is proposed on the left bank of the stream. The slope at the proposed site
is moderate but increases up the hill towards north east direction. The power house is of size
12.5m x 8m, to accommodate 2500 kW, generator and standardised turbine.
26.6 ELECTRICAL AND MECHANICAL EQUIPMENTS
The power house proposed in the scheme will have an installed capacity of 2500 kW. The
electricity generated would be connected to the existing power grid system at Kanjikkuzhi by a
500m transmission line. A standardised turbine for 140m gross head is proposed for this
particular site. The turbine shall be complete with governor, control equipment and safety
devices. The generator would be synchronous with a brushless excitation system shall be rated to
generate 2500 kW, 11kV three phases, 50Hz and shall be suitable for coupling with turbine
described above. The generator shall have voltage regulation equipment, parallel operation
equipment etc.

WGSHP - Final Report (Vol. II) Vattompara
Integrated Rural Technology Centre, Palakkad 1.10
26.7 ENVIRONMENTAL IMPACTS
A small hydro project has been proposed at Vattompara (Idukki Dist). The project aims to
generates about 2500 kW of hydro power from a fall having a head of 140 m. Some preliminary
environmental impact analysis have been carried out. They are land, water and socio-
economical environmental impacts.
26.7.1 Environmental Impact on Land
The catchment area measured from topo sheet comes to be 12.63sq. km. The falls are situated in
Pazhayarithodu. The stream flows through steep slope areas. There are a number of falls in this
stream other than Vattompara. Another main fall is located at the downstream side of the
Vattompara named Pamble. After the fall, the stream joins to the Periyar river. The joining point
of the stream is just dam stream side of the Lower Periyar Dam.
The most significant thing is that, due to impoundment, no forest land will be submerged. The
construction of weir, penstock, power house, tailrace and temporary road will not take away any
forest land. So no forest clearance is required for the project.
26.7.2 Environmental Impact on Water
The Pazhayarithodu, which drains to Periyar river is the stream of this fall. It is a 3rd order,
structurally controlled stream. The diversion structure will create a pond of area 0.05 hectare.
No forest land will be submerged. Above all, this accounts for only 0.02ha/MW. This diversion
structure which also acts as a check dam can increase the height of water table level at the site.
The impounded water will also change soil moisture regime in adjacent forest land.

WGSHP - Final Report (Vol. II) Vattompara
Integrated Rural Technology Centre, Palakkad 1.11
26.7.3 Socio-economic Impact
The construction phase would create employment opportunities for a period of 18 months. The peak
labour strength is 50 skilled and 100 unskilled labour. It require only minimum land acquisition for
construction. The acquisition does not need any rehabilitation.
26.8 CONCLUSION
The environmental impact of this small hydel project is negligible. No serious adverse impact is
anticipated. Moreover, deforestation owing to the inundation will be a meagre area.
The economic size of installed capacity depends upon the permissible tariff as well as the capital cost.
It was found that the project is financially viable for an installed capacity of 2500kW at a project cost
of Rs. 3.5 Crores per MW and a tariff rate of Rs.2.5 per unit of electricity. Alternatively, if the tariff is
raised to Rs.3.00 per unit, an installed capacity of 4000kW would become economically viable.
Cost effective methods of construction, like the use of gabion weirs, can be used to reduce the capital
costs. A methodology for implementing the project with a maximum of peoples= participation should
also be devised. The role of the Grama Panchayath in this effort is crucial.
-�-

WGSHP - Final Report (Vol. II) Vattompara
Integrated Rural Technology Centre, Palakkad 1.12
27. CHEMBUKATTY
District : Palakkad
Panchayath : Agali
Head : 140m.
Flow : Seasonal Suggested Capacity : 4 MW/6MW

WGSHP - Final Report (Vol. II) Chembukatty
Integrated Rural Technology Centre, Palakkad 1.1
27.1 GENERAL
27.1.1 The site
Chembukatty water fall is situated in Kottoppadam Grama Panchayath in Palakkad district. The
site is at a distance of 69 km from Palakkad. There is a bus route from Mannarkkaad to
Thiruvizhamkunnu. From there, local bus services are available occasionally to Ambalappara.
Jeep services are available to Chembukatti from Ambalappaara. From there we have to walk 3
km to reach the site. The nearest 11kV transformer is at a distance of 5km. away from the site.
The water fall is located at 760 22' 21" E longitude and 110 1' 12" N latitude. The catchment area
measured from toposheet is 11.875 sq. km. The falls are situated at an elevation of 40 m from
MSL in Chembukatti stream which is beginning at an elevation of 954 m from MSL. After the
fall, the stream joins the Palakkuzhipuzha which drains to Chaliyar River (Fig.No.27.1).
27.1.2 Topography
The site is situated in forest. The forest is very thick. The land is having steeply sloping in this
area. The possibility of land slide is very less and chances of soil erosion are negligible. The bed
of the stream is rocky and boulders are available in plenty at the site. The number of rainy days
exceeds 50% in its catchment.
27.2 FIELD INVESTIGATION
27.2.1 Reconnaissance survey
A topographical survey was conducted for obtaining topographical details of the site. The total
head of the site is 140 m. The possible location for diversion structure and power house were
identified and the details were taken using tacheometric method of surveying.
27.2.2 Catchment area

WGSHP - Final Report (Vol. II) Chembukatty
Integrated Rural Technology Centre, Palakkad 1.2
Topographical survey sheets to a scale of 1:50,000 are available from the Survey of India. The
catchment of Chembukatty falls was located using the toposheet. It is shown in the Fig.No.
27.2. From the shape it is identified as a fan shaped catchment and its area comes to nearly
11.875 sq.km. The catchment area is having almost moderate slope but some portions are very
steep. Maximum flood discharge measured at this site during 1998 is about 17.72 cumec.
27.2.3 Contour map
The survey details were plotted on a sheet of paper at a scale of 1:500. The undulations of the
site, the location of the falls and other topographical features were identified from the contour
map. The location of the weir, the alignment of the penstock and location of the power house
were also determined using this and the prepared contour map has been shown in Annexure
A.27.
27.2.4 River flow data
For a period of 12 months (December 97 to December 98) the water level observations were
taken every week. A suitable location was identified on the downstream side of the fall, where
the whole water is flowing through that point, cross sectional details of the point were noted for
calculating the stream discharge. We fixed a measuring gauge at this point to measure the peak
flow. Using the collected data (Table 27.1) the weekly discharge hydrograph of the site is
prepared. The graph is shown in Fig. No. 27.3.
27.2.5 Flow duration curves
Using weekly discharge hydro graph, percentage flow of exceedence was calculated. From this,
the flow duration curve was plotted (Fig. No. 27.4). The same curve also functions as
percentage flow of exceedence graph. This river flow data is recalculated in tabular form, giving
the corresponding energy potential in weekly and cumulative mode is given in Table 27.2. These
data are used for calculating energy potential and selection of unit sizes in section 27.4.
27.2.6 Peak flow determination
There are various empirical methods for calculating the maximum flood discharge. The different
values obtained are shown in Table 27.3. The value obtained by Dicken=s formula, which is
commonly used in western ghats region has been used for the structural design.

WGSHP - Final Report (Vol. II) Chembukatty
Integrated Rural Technology Centre, Palakkad 1.3
Table 27.3
Peak Flow Determination
Parameters
Dicken== s method
Ingli== s formula
Ryve == s formula
Nawab Jung
Bahadur formula Peak flow in cumecs
166.32
309.48
52.57
445.98
27.3 SALIENT DESIGN FEATURES
A detailed design of Civil, Electrical & Mechanical work has not been carried out in this report as
it does not come under the purview of the project, but a typical section of the proposed diversion
structure is given here. The stability analysis of the section and economic diameter of the
penstock was carried out as part of preliminary design. The capability and number of units, type
and specification of turbine, generator and it=s cost have been estimated, after consulting various
agencies.
27.3.1 Power potential of the project
The discharge corresponding to 100% exceedence is only 0.008 cubic metre per second. A
discharge of 0.008 cubic metre per second can produce only about 8 kW. In order to tap the
full potential of the site, with a head of 140 metre., the project is designed to generate higher
output with lower dependability. This site can be designed as a run of the river project which can
produce 1500 kW for 3 hours duration of peak load with a dependability of 40%.
The output power was computed using the formula , P = 10 x Q x H x ηη
Where; P = Power output in kW
Q = Discharge in cumec
H = Head in metres
η = Efficiency taken as 0.75
For 50% exceedence P = 10 x 0.68 x 140 x 0.75 = 700 kW.
For 40% exceedence P = 10 x 1.5 x 140 x 0.75 = 1500 kW.
WGSHP - Final Report (Vol. II) Chembukatty
Integrated Rural Technology Centre, Palakkad 1.5
For 30% exceedence P = 10 x 3.15 x 140 x 0.75 = 3250 kW.
27.3.2 Energy potential
At this site, sufficient flow is there so that we can obtain 1543kW power output for 40% of the
time (146 days) which reduces to 210kW by 60% time (219 days). The energy input
corresponding to 40% time will be (40/100 * 1500 * 365 * 24) = 5.26 MU. The flow after
40% time can be utilized by providing a small pondage. The quantity of water available from
40% to 100% time is calculated to be 4394962m3. Energy obtained from this water is calculated
to be 1.28 MU.
Total amount of energy produced = 5.26 MU + 1.28 MU = 6.54 MU
It may be noted that, this much amount of energy can be generated for the particular year. If
higher flows are available during any year, it will enable higher production and vice versa.
27.3.3 Pondage requirement
From the contour map a plot of surface area Vs. elevation is drawn in Fig. No.27.5. The areas
corresponding to each elevation is used to find the volume of water that can be stored in each
elevation and the details are shown in Table 27.4. From this information a capacity elevation
curve of the pondage is prepared and is shown in Fig.No.27.6.
Table 27.4
Pondage Area Details Sl. No.
Elevation (m.)
Area (m2)
Capacity (m3)
Energy (kWh)
1
497.50
0
0
0
2
498
238.00
119.00
3.5
3
499
283.80
379.90
11
As the terrain is not suitable for storage the structure proposed at this site is only for diverting water.
27.4 SELECTION OF PLANT CAPACITY AND UNIT SIZES

WGSHP - Final Report (Vol. II) Chembukatty
Integrated Rural Technology Centre, Palakkad 1.6
For optimization of plant capacity, the following parameters were assumed.
Rate of return on investment - 15%
Loan repayment period - 10 years
Average O/M cost - 2.5% of capital cost
Resulting standard annual cost - 25%
(This consists of 2.5% O & M costs, 15% return on 25% equity, 15% interest on 75% loan and
repayment of loan in 10 annual instalments)
Tariff (per Unit) - Rs. 2.5 and 3.0 (Two cases)
Investment cost (Rs.in Crores per MW) - Rs. 3.5 (Two cases)
Since manufacturers were not in a position to quote exact figures, no attempt was made to fine
tune the cost in relation to site specific conditions. Only ranges could be indicated. Each
combination of tariff and capital cost selected above, will demand a minimum annual generation
per kW installed. This can be taken to be the break even Plant Capacity Factor (PCF) for the
site under the specified conditions.
Lower the cost/MW and higher the price for energy, the larger will be the economically
viable installed capacity and the quantity of energy that can be economically extracted
from a given site.
Let the capital cost of Chembukatty be Rs.3.5 crores/MW. The annual rate is 25%. Let the unit
rate of tariff offered by K.S.E.B be Rs. 2.5/kWh.
If X be the number of hours of operation at full load capacity,
per Mega Watt annual cost, at the rate of 25% on investment = Rs. 3.5 Crores x 0.25
per Mega Watt revenue = 1000 kW x Rs. 2.5 x X
Equating the two, we get 3,50,00,000 x 0.2.5 = X x 1000 x 2.5
X = 3,500 hrs.

WGSHP - Final Report (Vol. II) Chembukatty
Integrated Rural Technology Centre, Palakkad 1.7
It follows that, any combination of machines, that can work at full capacity for over 3500 hours
can deliver a profit, if the overall project cost is below Rs. 3.5 crores/MW and tariff is Rs. 2.5
per kilo Watt hour.
This can be explained better in terms of Plant Capacity Factor, which is defined as the ratio of
actual amount of energy obtained to the maximum energy that can be obtained from the given
installed capacity during an year, to the actual amount of energy obtained.
In this case, for the value of X = 3500 hours, PCF = (3500 / 8760) x 100 = 40%
That is, a maximum capacity, which yields a PCF of 40% is economically viable for this site.
Similarly, break even PCF for Rs.3.0 per and Rs. 3.5 Crores per mega watt where X=2916
hours is 33.3%
Now we shall check various capacities of turbine size which are suitable for this two conditions.
a. Tariff: Rs.2.5/kWh and break even PCF of 40%
For an installed capacity of 4000 kW, which corresponds to about 25% flow of exceedence
from the chart, the total energy yield is the sum of:
4000 kW x (0.25 x 8760) = 8.76 MU at continuous operation for 25% time of an year, and
5.14MU, which is the cumulative energy potential from 25% to 100% time as obtained from the
Chart (Table 27.3).
Total yield = 8.76MU + 5.14MU = 14 MU.
The Plant Capacity Factor, corresponding to this yield is given by :
PCF = 14 x 108 / (4000 x 8760) = 39.9 %
This PCF is equal to the break even value of 40%.
So 4000 kW will be the optimum choice for the site, if the overall project cost is below
Rs.3.5 crores/MW and tariff is Rs. 2.5 per kilo Watt hour.

WGSHP - Final Report (Vol. II) Chembukatty
Integrated Rural Technology Centre, Palakkad 1.8
b. Tariff: Rs.3.00/kWh and break even PCF of 33.3%
Similarly, for 6000 kW (for 19.23% flow of exceedence)
PCF = (17700000 / 6000 x 8760) x 100 = 33.6%
This PCF is very near to the break even value of 33%.
Similarly, 6000 kW will be the optimum choice for the site, if the overall project cost is
below Rs. 3.5 crores/MW and tariff is Rs. 3.0 per kilo Watt hour.
Table 27.5
Economically Viable Maximum Capacity at Different Costs and Tariff
Tariff
Unit size for
Rs.3.5 Crores/MW
Rs.2.5/Unit
4000 kW
Rs.3.00/ Unit
6000 kW
The units selected can be one of the following combinations:
For Rs.3.5 Crores/MW and Rs.2.5/Unit we can opt (2MW x 1 + 1 MW x 2)
For Rs.3.5 Crores/MW and Rs.3.0/Unit we can opt (1MW x 2 + 2MW x 2)
Among these two categories, the second one seems to be less viable since it is bulky with units.
We have restricted ourselves to the more realistic combination of Rs. 3.5 Crores/MW of
investment cost and two tariff choices of Rs. 2.5/Unit and Rs. 3.0/Unit.
27.5 CIVIL ENGINEERING WORKS
The important Civil Engineering Works required for the project are a diversion weir, an intake
structure, a penstock and a power house. A weir is constructed to have a small storage and to
divert the water from stream to the intake. For this project only a diversion weir is proposed,
which allows the excess water to flow over the weir to the downstream. The intake structure
WGSHP - Final Report (Vol. II) Chembukatty
Integrated Rural Technology Centre, Palakkad 1.9
takes water from the weir and leads it to the penstock. The penstock made of steel is proposed
in this site. A power house is constructed for the purpose of housing the electro mechanical
equipment. It is usually a small building of 12.5m x 8m.
27.5.1 Weir at Chembukatty
A gabion weir has been proposed on the Chembukatti stream, at a bed level of +444.500
metres. The base width of the weir at bed level is 10 m. The structure is 6.50 m high having a
length of 30.50 m at the top with a central broad crested free over fall type spill way. The cross
sectional details of the proposed diversion site is shown in Fig. No. 27.7
27.5.2 Intake Structure, Penstock and Power house
A simple box type, direct intake structure of reinforced cement concrete is provided on the
stream bed. A trash rack is provided at the intake mouth, the penstock entrance starts from the
wall of intake box near the gabion. The economic diameter of the penstock is calculated as 0.69
m and the thickness of the penstock is found as 8 mm. The penstock can carry a maximum flow
of 0.476 cumec with a velocity of 1.27 metre per second. The possible alignment for the
penstock is located on the left bank of the stream. The longitudinal section of the proposed
penstock line was drawn from the contour map and the length was calculated, which came to 807
m (Fig. No. 27.8). A surface power house is proposed on the left bank of the stream. The slope
at the proposed site is moderate. The power house is of size 12.5m x 8m, to accommodate
1500kW, generator and standardised turbine.
27.6 ELECTRICAL AND MECHANICAL EQUIPMENTS

WGSHP - Final Report (Vol. II) Chembukatty
Integrated Rural Technology Centre, Palakkad 1.10
The power house proposed in the scheme will have an installed capacity of 4000 kW. The electricity
generated would be connected to the existing power grid system at Thiruvizhamkunnu by a 2 km
transmission line. A standardised turbine for 140 m gross head is proposed for this particular site.
The turbine shall be complete with governor, control equipment and safety devices. The generator
would be synchronous with a brushless excitation system shall be rated to generate 4000kW, 11kV
three phases, 50Hz and shall be suitable for coupling with turbine described above. The generator
shall have voltage regulation equipment, parallel operation equipment etc.
27.7 ENVIRONMENTAL IMPACTS
A small hydro project has been proposed at Chembukatty (Palakkad Dist.). The project aims to
generates about 4000 kW of hydro power from a fall having a head of 140 m. Some preliminary
environmental impact analysis have been carried out. They are land, water and socio-economical
environmental impacts.
27.7.1 Environmental impact on land
The catchment area measured from topo sheet comes to be 11.875 sq. km. The falls are situated in
Chembukatti stream. After the fall, the stream joins to the Palakkuzhi puzha which drains to Chaliyar
River.
The most significant thing is that, due to impoundment, no forest land will be submerged. The
construction of weir, penstock, power house, tailrace and temporary road will not take away any
forest land. So no forest clearance is required for the project.
27.7.2 Environmental impact on water
The Palakkuzhi puzha, which drains to Chaliyar river is the stream of this fall. The diversion structure
will create a pond of area 0.0284 hectare. No forest land will be submerged. Above all, this accounts
for only 0.007 ha/MW. This diversion structure which also acts as a check dam can increase the
height of water table level at the site. The impounded water will also change soil moisture regime in
adjacent forest land.
27.7.3 Socio-economic impact
The construction phase would create employment opportunities for a period of 18 months. The peak
labour strength is 100 skilled and 250 unskilled labour. It requires only minimum land acquisition for
construction. The acquisition does not need any rehabilitation.

WGSHP - Final Report (Vol. II) Chembukatty
Integrated Rural Technology Centre, Palakkad 1.11
27.8 CONCLUSION
The environmental impact of this small hydel project is negligible. No serious adverse impact is
anticipated. Moreover, deforestation owing to the inundation will be a meagre area.
The economic size of installed capacity depends upon the permissible tariff as well as the capital cost.
It was found that the project is financially viable for an installed capacity of 4000kW at a project cost
of Rs. 3.5 Crores per MW and a tariff rate of Rs.2.5 per unit of electricity. Alternatively, if the tariff is
raised to Rs.3.00 per unit, an installed capacity of 6000kW would become economically viable.
Cost effective methods of construction, like the use of gabion weirs, can be used to reduce the capital
costs. A methodology for implementing the project with a maximum of peoples= participation should
also be devised. The role of the Grama Panchayath in this effort is crucial.
-�-
28. THENDILLAM

WGSHP - Final Report (Vol. II) Chembukatty
Integrated Rural Technology Centre, Palakkad 1.12
District : Palakkad
Panchayath : Kizhakkanchery
Head : 140 m.
Flow : Seasonal
Suggested Capacity : 2MW/ 3MW
28.1 GENERAL
28.1.1 The Site
The Thendillam water fall is situated in the 10th ward of Kizhakkanchery Grama Panchayath in
Palakkad District. The site is at a distance of 10 km from Vadakkanchery. From
Vadakkanchery there is jeep service to Palakkuzhy which is on the upstream side of the fall.
There is only 0.50km. to the site from Palakkuzhy.
The water fall is located at 760 29' 0" E longitude and 100 30' 26" N latitude. The catchment area
measured from topo sheet is 5.50sq. km. The falls are situated at an elevation of 360m from
MSL, in Palakkuzhi stream which is beginning at an elevation of 928m from MSL (Fig.No.28.1).
28.1.2 Topography
The site is situated in private land. The land is having steep slope in this area. There is no
possibility for land slide and the chances of soil erosion are negligible. The bed of the stream is
rocky and boulders are available from the site. The total head comes nearly 140m. The number
of rainy days exceeds 50% in its catchment.
28.2 FIELD INVESTIGATION
28.2.1 Reconnaissance Survey
A topographical survey was conducted for obtaining topographical details of the site. There is

WGSHP - Final Report (Vol. II) Thendillam
Integrated Rural Technology Centre, Palakkad 1.13
one main fall which gives a total head of 20m. The possible location for diversion structure and
power house were identified and the details were taken using tacheometric method of surveying.
28.2.2 Catchment Area
Topographical survey sheets to a scale of 1:50,000 are available from the Survey of India. The
catchment of Thendillam was located using the toposheet. It is shown in the Fig.No. 28.2. From
the shape it is identified as a fan shaped catchment and its area comes to nearly 5.50 sq.km. The
catchment area is having almost moderate slope but some portions are very steep. Maximum
flood discharge measured at this site during 1998 is about 10.85 cumec.
28.2.3 Contour Map
The survey details were plotted on a sheet of paper at a scale of 1:300. The undulations of the
site, the location of the falls and other topographical features were identified from the contour
map. The location of the weir, the alignment of the penstock and location of the power house
were also determined using this and the prepared contour map has been shown in Annexure
A.28.
28.2.4 River Flow Data
For a period of 12 months (November 1997 to November 1998) the water level observations
were taken every week. A suitable location was identified on the upstream side of the fall, where
the whole water is flowing through that point, cross sectional details of the point were noted for
calculating the stream discharge. We fixed a measuring gauge at this point to measure the peak
flow. Using the collected data (Table 28.1) the weekly discharge hydrograph of the site is
prepared. The graph is shown in Fig. No. 28.3.
28.2.5 Flow Duration Curves
Using weekly discharge hydro graph, percentage flow of exceedence was calculated. From this,
the flow duration curve was plotted (Fig. No. 28.4). The same curve also functions as
percentage flow of exceedence graph. This river flow data is recalculated in tabular form, giving
the corresponding energy potential in weekly and cumulative mode is given in Table 28.2. These
data are used for calculating energy potential and selection of unit sizes in section 28.4.
28.2.6 Peak Flow Determination

WGSHP - Final Report (Vol. II) Thendillam
Integrated Rural Technology Centre, Palakkad 1.14
There are various empirical methods for calculating the maximum flood discharge. The different
values obtained are shown in Table 28.3. The value obtained by Dicken=s formula, which is
commonly used in western ghats region has been used for the structural design of diversion
structure.
Table 28.3
Peak Flow Determination
Parameters
Dicken== s
method
Ingli== s formula
Ryve == s formula
Nawab Jung
Bahadur formula Peak flow in cumecs
93.38
169.66
31.47
240.87
28.3 SALIENT DESIGN FEATURES
A detailed design of Civil, Electrical & Mechanical work has not been carried out in this report as
it does not come under the purview of the project, but a typical section of the proposed diversion
structure is given here. The stability analysis of the section and economic diameter of the
penstock was carried out as part of preliminary design. The capability and number of units, type
and specification of turbine, generator and it=s cost have been estimated, after consulting various
agencies.
28.3.1 Power Potential of the Project
The discharge corresponding to 76% exceedence is only 0.003 cubic metre per second. A
discharge of 0.003cubic metre per second can produce only about 3.15kW. In order to tap the
full potential of the site, with a head of 140 metre, the project is designed to generate higher
output with lower dependability. This site can be designed as a peak load station which can
produce 700kW with a dependability of 40%.
The output power was computed using the formula, P = 10 x Q x H x η
Where; P = Power output in kW
Q = Discharge in cumec
H = Head in metres
η = Efficiency taken as 0.75

WGSHP - Final Report (Vol. II) Thendillam
Integrated Rural Technology Centre, Palakkad 1.15
For 50% exceedence P = 10 x 0.34 x 140 x 0.75 = 350 kW.
For 40% exceedence P = 10 x 0.78 x 140 x 0.75 = 800 kW.
For 30% exceedence P = 10 x 1.42 x 140 x 0.75 = 1500 kW.
28.3.2 Energy Potential
At this site, sufficient flow is there so that we can obtain 700kW power output for 40% of the
time (146 days) which reduces to 42kW by 70% time. The energy input corresponding to 40%
time will be (40/100 x 700 x 365 x 24) = 2.45 MU. The flow after 40% time can be utilised by
providing a small pondage. The quantity of water available from 40% to 100% time is calculated
to be 4119128m3. Energy obtained from this water is calculated to be 1.14 MU.
Total amount of energy produced = 2.45 MU + 1.14 MU = 3.59 MU.
It may be noted that this much amount of energy can be generated for the particular year. If
higher flows are available during any year, it will enable higher production and vice versa.
28.3.3 Pondage Requirement
From the contour map a plot of surface area Vs. elevation is drawn in Fig. No. 28.5. The areas
corresponding to each elevation is used to find the volume of water that can be stored in each
elevation and the details are shown in Table 28.4. From this information a capacity elevation
curve of the pondage is prepared and is shown in Fig.No. 28.6.

WGSHP - Final Report (Vol. II) Thendillam
Integrated Rural Technology Centre, Palakkad 1.16
Table 28.4
Pondage Area Details Sl.. No.
Elevation (m.)
Area (m2)
Capacity (m3)
Energy (kWh)
1
496.500
0
0
0
2
497
63.00
31.50
1
3
499
279.90
374.40
11
3
501
901.80
1336.10
39
5
503
1746.90
4204.80
123
6
505
2560.05
8511.75
248
7
506
2912.40
13984.20
408
As the terrain is suitable for storing 14000m3, it follows that, at full storage, the energy capacity
is only about 400 kWh. If a single 400 kW machine is installed, it can be operated for only one
hour at full capacity during peak time. Fortunately, pondage becomes critical only during lean
months, this kind of operation practice is acceptable. Hence, a weir height of 9.5m, to create a
storage of 32000m3 is suggested.
28.4 SELECTION OF PLANT CAPACITY AND UNIT SIZES
For optimization of plant capacity, the following parameters were assumed.
Rate of return on investment - 15%
Loan repayment period - 10 years
Average O/M cost - 2.5% of capital cost
Resulting standard annual cost - 25%
(This consists of 2.5% O & M costs, 15% return on 25% equity, 15% interest on 75% loan and
repayment of loan in 10 annual instalments)
Tariff (per Unit) - Rs. 2.5 and 3.0 (Two cases)

WGSHP - Final Report (Vol. II) Thendillam
Integrated Rural Technology Centre, Palakkad 1.17
Investment cost (Rs. in Crores per MW) - Rs. 3.5 (Two cases)
Since manufacturers were not in a position to quote exact figures, no attempt was made to fine
tune the cost in relation to site specific conditions. Only ranges could be indicated. Each
combination of tariff and capital cost selected above, will demand a minimum annual generation
per kW installed. This can be taken to be the break even Plant Capacity Factor (PCF) for the
site under the specified conditions.
Lower the cost/MW and higher the price for energy, the larger will be the economically
viable installed capacity and the quantity of energy that can be economically extracted
from a given site.
Let the capital cost of Thendillam be Rs.3.5 crores/MW. The annual rate is 25%. Let the unit
rate of tariff offered by K.S.E.B be Rs. 2.5/kWh.
If X be the number of hours of operation at full load capacity,
per Mega Watt annual cost, at the rate of 25% on investment = Rs. 3.5 Crores x 0.25
per Mega Watt revenue = 1000 kW x Rs. 2.5 x X
Equating the two, we get 3,50,00,000 x 0.2.5 = X x 1000 x 2.5
X = 3,500 hrs.
It follows that, any combination of machines, that can work at full capacity for over 3500 hours
can deliver a profit, if the overall project cost is below Rs. 3.5 crores/MW and tariff is Rs. 2.5
per kilo Watt hour.
This can be explained better in terms of Plant Capacity Factor, which is defined as the ratio of
actual amount of energy obtained to the maximum energy that can be obtained from the given
installed capacity during an year, to the actual amount of energy obtained.
In this case, for the value of X = 3500 hours, PCF = (3500 / 8760) x 100 = 40%
That is, a maximum capacity, which yields a PCF of 40% is economically viable for this site.
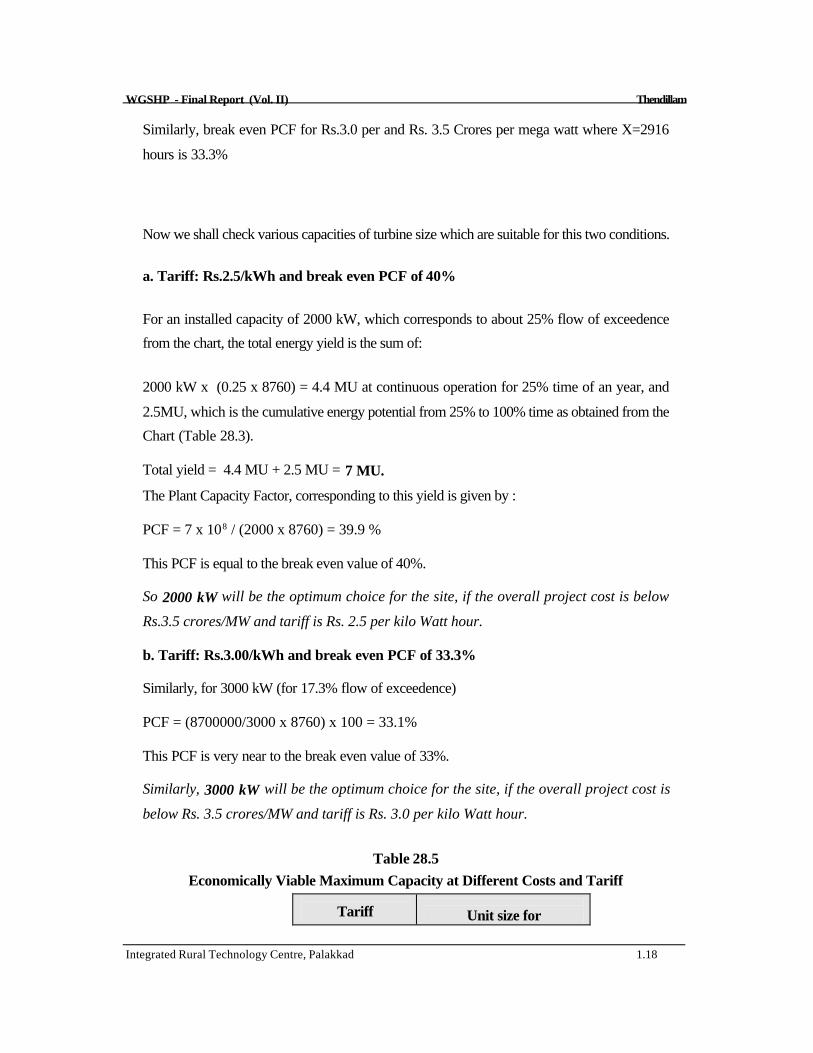
WGSHP - Final Report (Vol. II) Thendillam
Integrated Rural Technology Centre, Palakkad 1.18
Similarly, break even PCF for Rs.3.0 per and Rs. 3.5 Crores per mega watt where X=2916
hours is 33.3%
Now we shall check various capacities of turbine size which are suitable for this two conditions.
a. Tariff: Rs.2.5/kWh and break even PCF of 40%
For an installed capacity of 2000 kW, which corresponds to about 25% flow of exceedence
from the chart, the total energy yield is the sum of:
2000 kW x (0.25 x 8760) = 4.4 MU at continuous operation for 25% time of an year, and
2.5MU, which is the cumulative energy potential from 25% to 100% time as obtained from the
Chart (Table 28.3).
Total yield = 4.4 MU + 2.5 MU = 7 MU.
The Plant Capacity Factor, corresponding to this yield is given by :
PCF = 7 x 10⁸ / (2000 x 8760) = 39.9 %
This PCF is equal to the break even value of 40%.
So 2000 kW will be the optimum choice for the site, if the overall project cost is below
Rs.3.5 crores/MW and tariff is Rs. 2.5 per kilo Watt hour.
b. Tariff: Rs.3.00/kWh and break even PCF of 33.3%
Similarly, for 3000 kW (for 17.3% flow of exceedence)
PCF = (8700000/3000 x 8760) x 100 = 33.1%
This PCF is very near to the break even value of 33%.
Similarly, 3000 kW will be the optimum choice for the site, if the overall project cost is
below Rs. 3.5 crores/MW and tariff is Rs. 3.0 per kilo Watt hour.
Table 28.5
Economically Viable Maximum Capacity at Different Costs and Tariff
Tariff
Unit size for

WGSHP - Final Report (Vol. II) Thendillam
Integrated Rural Technology Centre, Palakkad 1.19
Rs.3.5 Crores/MW
Rs.2.5/Unit
2000 kW
Rs.3.00/ Unit
3000 kW
The units selected can be one of the following combinations:
For Rs.3.5 Crores/MW and Rs.2.5/Unit we can opt (1MW x 1 + 0.5 MW x 2)
For Rs.3.5 Crores/MW and Rs.3.0/Unit we can opt (2MW x 1 + 1MW x 1).
Among these two categories, the second one seems to be less viable since it is bulky with units.
We have restricted ourselves to the more realistic combination of Rs. 3.5 Crores/MW of
investment cost and two tariff choices of Rs. 2.5/Unit and Rs. 3.0/Unit.
28.5 CIVIL ENGINEERING WORKS
The important Civil Engineering Works required for the project are a weir, an intake structure, a
penstock and a power house. A weir is constructed to have a small storage and to divert the
water from stream to the intake. For this project an overflow weir is to be constructed, which
allows the excess water to flow over the weir to the downstream. The intake structure takes
water from the weir and leads it to the penstock. The penstock is a pressure pipe which carries
water to the turbine. It can be made of steel, cast iron, plastics (Poly Vinyl Chloride, High
Density Poly Ethylene) and concrete. In this project a steel penstock is used. A power house is
constructed for the purpose of housing the electro mechanical equipment. It is usually a small
building of A detailed design of the civil works are given below.
28.5.1 Weir at Thendillam
A gabion weir has been proposed on the Thendillam stream, at a bed level of +496.000 metres.
The base width of the weir at bed level is 7.5m. The gabion structure is 7.1m. high having a
length of 21.5m. at the top. The cross sectional details of the proposed diversion site is shown in
Fig. No. 28.7.
28.5.2 Intake Structure, Penstock and Power House

WGSHP - Final Report (Vol. II) Thendillam
Integrated Rural Technology Centre, Palakkad 1.20
A simple box type, direct intake structure of reinforced cement concrete is provided on the
stream bed. A trash rack is provided at the intake mouth, the penstock entrance starts from the
wall of intake box near the gabion. The economic diameter of the penstock is calculated as
0.94m. The penstock can carry a maximum flow of 1.00 cumec with a velocity of 1.44 metre
per second. The possible alignment for the penstock is located on the left bank of the stream.
The longitudinal section of the proposed penstock line was drawn from the contour map and the
length was calculated, which came to 147m (Fig. No. 28.8).
A surface power house is proposed on the left bank of the stream. The slope at the proposed site
is moderate but increases up the hill towards north east direction. The power house is of size
12.5m. x 8 m, to accommodate 2000 kW, generator and standardised turbine.
28.6 ELECTRICAL AND MECHANICAL EQUIPMENTS
The power house proposed in the scheme will have an installed capacity of 2000 kW. The
electricity generated would be connected to the existing power grid system at Nilambur by a
300m transmission line. A standardised turbine for 140m gross head is proposed for this
particular site. The turbine shall be complete with governor, control equipment and safety
devices. The generator would be synchronous with a brushless excitation system shall be rated to
generate 2000 kW, 11kV three phases, 50Hz and shall be suitable for coupling with turbine
described above. The generator shall have voltage regulation equipment, parallel operation
equipment etc.
28.7 ENVIRONMENTAL IMPACTS
A small hydro project has been proposed at Thendillam (Palakkad Dist.). The project aims to
generates about 2000 kW of hydro power from a fall having a head of 140 m. Some preliminary
environmental impact analysis have been carried out. They are land, water and socio-
economical environmental impacts.
28.7.1 Environmental Impact on Land
WGSHP - Final Report (Vol. II) Thendillam
Integrated Rural Technology Centre, Palakkad 1.21
The catchment area measured from topo sheet comes to be 5.50sq. km. The falls are situated in
Palakkuzhi stream. The site is situated in private land. The land is having steep slope in this area.
There is no possibility for land slide and the chances for soil erosion is very less and it is negligible.
The bed of the stream is rocky and boulders are available from the site. The total head comes nearly
140m. The number of rainy days exceeds 50% in its catchment. The most significant thing is that, due
to impoundment, no forest land will be submerged. The construction of weir, penstock, power house,
tailrace and temporary road will not take away any forest land. So no forest clearance is required for
the project.
28.7.2 Environmental Impact on Water
The fall which drains to Palakkuzhy stream is the stream of this fall. It is a 3rd order, structurally
controlled stream. The diversion structure will create a pond of 0.2912 ha. No forest land will be
submerged. Above all, this accounts for only 0.1456ha/MW. This diversion structure which also acts
as a check dam can increase the height of water table level at the site. The impounded water will also
change soil moisture regime in adjacent forest land.
28.7.3 Socio-economic Impact
The construction phase would create employment opportunities for a period of 18 months. The peak
labour strength is 75 skilled and 100 unskilled labour. It requires only minimum land acquisition for
construction. The acquisition does not need any rehabilitation.
28.8 CONCLUSION
The environmental impact of this small hydel project is negligible. No serious adverse impact is
anticipated. Moreover, deforestation owing to the inundation will be a meagre area.
The economic size of installed capacity depends upon the permissible tariff as well as the capital cost.
It was found that the project is financially viable for an installed capacity of 2000kW at a project cost
of Rs. 3.5 Crores per MW and a tariff rate of Rs.2.5 per unit of electricity. Alternatively, if the tariff is
raised to Rs.3.00 per unit, an installed capacity of 3000kW would become economically viable.
Cost effective methods of construction, like the use of gabion weirs, can be used to reduce the capital
costs. A methodology for implementing the project with a maximum of peoples= participation should
also be devised. The role of the Grama Panchayath in this effort is crucial.

WGSHP - Final Report (Vol. II) Thendillam
Integrated Rural Technology Centre, Palakkad 1.22
-�-
29. PANAMKUDANTHA
District : Pathanamthitta
Panchayath : Narayanamoozhi
Head : 140 m.
Flow : Seasonal Suggested Capacity : 450 kW/ 650 kW

WGSHP - Final Report (Vol. II) Panamkudantha
Integrated Rural Technology Centre, Palakkad 1.1
29.1 GENERAL
29.1.1 The Site
The Panamkudantha water fall is situated in the 2nd ward of Naranammoozhi Grama Panchayath
in Pathanamthitta district. The site at a distance of 15km from Ranni. There is bus route from
Ranni to Athikkayam. A jeepable road starts from Athikkayam and ends near the site. There is
also another way to reach the site. From Pathanamthitta to Vechuchira, bus services are
available. The site is 3 km away from there . The stream is a seasonal one and the flow is
available for 4 months. The head is nearly 140m. The nearest 11KV transformer is available at
Perinthenaruvi which is about 4km away from the site.
The water fall is located at 760 54' 39" E longitude and 90 23' 51" N latitude. The catchment area
measured from topo sheet is 3.57sq. km. The falls are situated at an elevation of 200 m from
MSL in Panamkudantha stream. The stream flows through sleep slope. After the fall, the stream
joins to the Pampa River near Panamkudantha (Fig.No.29.1)
29.1.2 Topography
The site is situated in Kannamala Forest Station Limit. The forest is very thick. The land is
having steep slopes in this area. There is no possibility for land slide in this area and chances for
soil erosion is less and it is negligible. The bed of the stream is rocky and boulders are available
in plenty in this area. The rainfall intensity is high in its catchment. The number of rainy days
exceeds 50% in its catchment.
29.2 FIELD INVESTIGATION
29.2.1 Reconnaissance Survey
A topographical survey for obtaining topographical details of the site. There is two main fall and
two moderate falls which gives a total head of 140m. The possible location for diversion
structure and power house are identified and the details are taken using tacheometric method of
surveying.

WGSHP - Final Report (Vol. II) Panamkudantha
Integrated Rural Technology Centre, Palakkad 1.2
29.2.2 Catchment Area
Topographical survey sheets to a scale of 1:50,000 are available from the Survey of India. The
catchment of Panamkudantha was located using the toposheet. It is shown in the Fig.No. 29.2.
From the shape it is identified as a fern shaped catchment and its area comes nearly 3.50km. The
catchment area having almost moderate slope but some portions are very steep. Maximum flood
discharge measured at this site during 1998-99 is about 4.48 cumec.
29.2.3 Contour Map
The survey details were plotted on a sheet of paper at a scale of 1:200. The undulations of the
site, the location of the falls and other topographical features were identified from the contour
map. The location of the weir, the alignment of the penstock and location of the power house
was also determined using this and the prepared contour map has been shown in Annexure
A.29.
29.2.4 River Flow Data
For a period of 12 months (January 1998 to January 1999) the water level observations were
taken in every week. A suitable location was identified on the down stream of the fall, where the
whole water is flowing through that point, cross sectional details of the point was noted for
calculating discharge of stream. We fixed a measuring gauge at this point to measure the peak
flow. Using the collected data (Table 29.1) the weekly discharge hydrograph of the site is
prepared. The graph is shown in Fig. No. 29.3.
29.2.5 Flow Duration Curves
Using weekly discharge hydro graph, percentage flow of exceedence was calculated. From this,
the flow duration curve was plotted (Fig. No. 29.4). The same curve also functions as
percentage flow of exceedence graph. This river flow data is recalculated in tabular form, giving
the corresponding energy potential in weekly and cumulative mode is given in Table 29.2. These
data are used for calculating energy potential and selection of unit sizes in section 29.4.
29.2.6 Peak Flow Determination
There are various empirical methods for calculating the maximum flood discharge. The different
values obtained are shown in Table 29.3. The value obtained by Dicken=s formula, which is

WGSHP - Final Report (Vol. II) Panamkudantha
Integrated Rural Technology Centre, Palakkad 1.3
commonly used in western ghats region has been used for the structural design.
Table 29.3
Peak Flow Determination
Parameters
Dicken== s method
Ingli== s formula
Ryve == s formula
Nawab Jung
Bahadur formula Peak flow in cumecs
66.53
115.57
23.28
164.96
29.3 SALIENT DESIGN FEATURES
A detailed design of Civil, Electrical and Mechanical work have not been carried out in this report
as it is does not come under the purview of the project, but a typical section of the proposed
diversion structure is given here. The stability analysis of the section and economic diameter of
the penstock was carried out as part of preliminary design. The capability and number of units,
type and specification of turbine, generator and it=s cost are fixed consulting various agencies
29.3.1 Power Potential of the Project
The discharge corresponding to 75% of exceedence is only 0.009 cubic metre per second. A
discharge of 0.009cubic metre per second can produce only about 8 KW. In order to tap the
full potential of the site, with a head of 140 metre, the project is designed to generate higher
output with lower dependability. This site can be designed as a peak load station which can
produce 100 kW with a dependability of 50%.
The output power was computed using the formula, P = 10 x Q x H x ηη
Where; P = Power output in kW
Q = Discharge in cumec
H = Head in metres
η = Overall efficiency (Here it is assumed as 0.75)
For 50% exceedence P = 10 x 0.095 x 140 x 0.75 = 100 kW.
For 40% exceedence P = 10 x 0.095 x 140 x 0.75 = 200 kW.

WGSHP - Final Report (Vol. II) Panamkudantha
Integrated Rural Technology Centre, Palakkad 1.5
For 30% exceedence P = 10 x 1 x 140 x 0.75 = 550 kW.
29.3.2 Energy Potential
At this site, sufficient flow is there so that we can obtain 100kW power output for 50% of the
time (183 days) which reduces to 10kW by 60% time (219 days). The energy input
corresponding to 50% time will be (50/100 * 100 * 365 * 24) = 0.438 MU. The flow after
50% time can be utilized by providing a small pondage. The quantity of water available from
50% to 100% time is calculated to be 316516 m3. Energy obtained from this water is calculated
to be 0.092 MU.
Total amount of energy produced = 0.438 MU + 0.092 MU = 0.53 MU
It may be noted that, this much amount of energy can be generated for the particular year. If
higher flows are available during any year, it will enable higher production and vice versa.
29.3.3 Pondage Requirement
From the contour map a plot of surface area Vs. elevation is drawn in Fig. No. 29.5. The areas
corresponding to each elevation is used to find the volume of water that can be stored in each
elevation and the details is shown in Table 29.4. From this information capacity elevation curve
of the pondage is prepared and is shown in Fig.No. 29.6.
Table 29.4
Pondage Area Details Sl. No.
Elevation (m.)
Area (m2)
Capacity (m3)
Energy (kWh)
1
298.50
0
0
0
2
299
96.20
48.10
1.4
3
300
188.80
190.60
505
4
301
386.20
478.10
14
5
303
666.00
1530.30
44.5
6
305
975.00
3171.30
92.5

WGSHP - Final Report (Vol. II) Panamkudantha
Integrated Rural Technology Centre, Palakkad 1.6
As the terrain is suitable for storing 3000m3, it follows that, at full storage, the energy capacity is
only about 600 kWh. If a single 600 kW machine is installed, it can be operated for only one
hour at full capacity (during peak time). Fortunately, pondage becomes critical only during lean
months, this kind of operation practice is acceptable. Hence, a weir height of 6.5 m, to create a
storage of 3000 m3 is suggested.
29.4 SELECTION OF PLANT CAPACITY AND UNIT SIZES
For optimization of plant capacity, the following parameters were assumed.
Rate of return on investment - 15%
Loan repayment period - 10 years
Average O/M cost - 2.5% of capital cost
Resulting standard annual cost - 25%
(This consists of 2.5% O & M costs, 15% return on 25% equity, 15% interest on 75% loan and
repayment of loan in 10 annual instalments)
Tariff (per Unit) - Rs. 2.5 and 3.0 (Two cases)
Investment cost (Rs. in Crores per MW) - Rs. 3.5 (Two cases)
Since manufacturers were not in a position to quote exact figures, no attempt was made to fine
tune the cost in relation to site specific conditions. Only ranges could be indicated. Each
combination of tariff and capital cost selected above, will demand a minimum annual generation
per kW installed. This can be taken to be the break even Plant Capacity Factor (PCF) for the
site under the specified conditions.
Lower the cost/MW and higher the price for energy, the larger will be the economically
viable installed capacity and the quantity of energy that can be economically extracted
from a given site.
Let the capital cost of Panamkudantha be Rs.3.5 crores/MW. The annual rate is 25%. Let the
unit rate of tariff offered by K.S.E.B be Rs.2.5/kWh.
If X be the number of hours of operation at full load capacity,

WGSHP - Final Report (Vol. II) Panamkudantha
Integrated Rural Technology Centre, Palakkad 1.7
per Mega Watt annual cost, at the rate of 25% on investment = Rs. 3.5 Crores x 0.25
per Mega Watt revenue = 1000 kW x Rs. 2.5 x X
Equating the two, we get 3,50,00,000 x 0.2.5 = X x 1000 x 2.5
X = 3,500 hrs.
It follows that, any combination of machines, that can work at full capacity for over 3500 hours
can deliver a profit, if the overall project cost is below Rs. 3.5 crores/MW and tariff is Rs. 2.5
per kilo Watt hour.
This can be explained better in terms of Plant Capacity Factor, which is defined as the ratio of
actual amount of energy obtained to the maximum energy that can be obtained from the given
installed capacity during an year, to the actual amount of energy obtained.
In this case, for the value of X = 3500 hours, PCF = (3500 / 8760) x 100 = 40%
That is, a maximum capacity, which yields a PCF of 40% is economically viable for this site.
Similarly, break even PCF for Rs.3.0 per and Rs. 3.5 Crores per mega watt where X=2916
hours is 33.3%
Now we shall check various capacities of turbine size which are suitable for this two conditions.
a. Tariff: Rs.2.50/kWh and break even PCF of 40%
For an installed capacity of 450 kW, which corresponds to about 33% flow of exceedence from
the chart, the total energy yield is the sum of:
450 kW x (0.33 x 8760) = 1.3 MU at continuous operation for 33% time of an year, and
0.3MU, which is the cumulative energy potential from 33% to 100% time as obtained from the
Chart (Table 29.3).
Total yield = 1.3MU + 0.3MU = 1.6 MU.
The Plant Capacity Factor, corresponding to this yield is given by :

WGSHP - Final Report (Vol. II) Panamkudantha
Integrated Rural Technology Centre, Palakkad 1.8
PCF = 1.6 x 10⁸ / (450 x 8760) = 40.5 %
This PCF is equal to the break even value of 40%.
So 450 kW will be the optimum choice for the site, if the overall project cost is below
Rs.3.5 crores/MW and tariff is Rs. 2.5 per kilo Watt hour.
b. Tariff: Rs.3.00/kWh and break even PCF of 33.3%
Similarly, for 650 kW (for 21% flow of exceedence)
PCF = (2000000 / 650 x 8760) x 100 = 35%
This PCF is very near to the break even value of 33%.
Similarly, 650 kW will be the optimum choice for the site, if the overall project cost is
below Rs. 3.5 crores/MW and tariff is Rs. 3.0 per kilo Watt hour.
Table 29.5
Economically Viable Maximum Capacity at Different Costs and Tariff
Tariff
Unit size for
Rs.3.5 Crores/MW
Rs.2.5/Unit
450 kW
Rs.3.00/ Unit
650 kW
The units selected can be one of the following combinations:
For Rs.3.5 Crores/MW and Rs.2.5/Unit we can opt (0.25 MW x 2)
For Rs.3.5 Crores/MW and Rs.3.0/Unit we can opt (0.5 MW x 1 + 0.1MW x 1 +0.05 x1)
Among these two categories, the second one seems to be less viable since it is bulky with units.
We have restricted ourselves to the more realistic combination of Rs.3.5 Crores/MW of
investment cost and two tariff choices of Rs. 2.5/Unit and Rs. 3.0/Unit.

WGSHP - Final Report (Vol. II) Panamkudantha
Integrated Rural Technology Centre, Palakkad 1.9
29.5 CIVIL ENGINEERING WORKS
The important Civil Engineering Works required for the project are a diversion weir, an intake
structure, a penstock and a power house. A weir is constructed to have a small storage and to
divert the water from stream to the intake. For this project only a diversion weir is proposed,
which allows the excess water to flow over the weir to the downstream. The intake structure
takes water from the weir and lead it to the penstock. The penstock made of steel is proposed in
this site. A power house is constructed for the purpose of housing the electro mechanical
equipment. It is usually a small building of 7.5m x 5m.
29.5.1 Weir at Panamkudantha
A concrete weir has been proposed on the Panamkudantha stream, at a bed level of +198.000
metres. The base width of the weir at bed level is 6.00 m. The structure is 4.60 m high having a
length of 25m. at the top with a central board crested free over fall type spill way. The cross
sectional details of the proposed diversion site is shown in Fig.No.29.7.
29.5.2 Intake Structure, Penstock and Power House
A simple box type, direct intake structure of reinforced cement concrete is provided on the
stream bed. A trash rack is provided at the intake mouth, the penstock entrance starts from the
wall of intake box near the gabion. The economic diameter of the penstock is calculated as
0.45m. The penstock can carry a maximum flow of 0.43 cumec with a velocity of 0.93 metre
per second. The possible alignment for the penstock is located on the right bank of the stream.
The longitudinal section of the proposed penstock line was drawn from contour map and
calculated the length, which comes to 126m (Fig. No. 29.8).
A surface power house is proposed on the right bank of the stream. The slope at the proposed
site is moderate. The power house is of size 7.5m x 5m to accommodate 450kW, generator and
standardised turbine.
29.6 ELECTRICAL AND MECHANICAL EQUIPMENTS
The power house proposed in the scheme will have an installed capacity of 100 kW. The
electricity generated would be connected to the existing power grid system at Vechuchira by a
900 m transmission line. A standardised turbine for 140m gross head is proposed for this

WGSHP - Final Report (Vol. II) Panamkudantha
Integrated Rural Technology Centre, Palakkad 1.10
particular site. The turbine shall be complete with governor, control equipment and safety
devices. The generator would be synchronous with a brushless excitation system shall be rated to
generate 450 kW, 11kV three phases, 50Hz and shall be suitable for coupling with turbine
described above. The generator shall have voltage regulation equipment, parallel operation
equipment etc.
29.7 ENVIRONMENTAL IMPACTS
A small hydro project has been proposed at Panamkudantha (Pathanamthitta Dist.). The project
aims to generates about 450 kW of hydro power from a fall having a head of 140m. Some
preliminary environmental impact analysis have been carried out. They are land, water and socio-
economical environmental impacts.
29.7.1 Environmental Impact on Land
Total area of catchment is about 28.5 square kilometres of land in Kanjirappuzha. The upper
catchment is rocky and with little vegetation cover. The forest in this sector is semi evergreen and
deciduous. The land at left bank of stream is owned by private persons and the right bank is
forest land. Stream sections are mostly rocky large sized boulders are plenty.
The most significant thing is that, due to impoundment, no forest land will be submerged. The
construction of weir, penstock, power house, tailrace and temporary road will not take away any
forest land.
29.7.2 Environmental Impact on Water

WGSHP - Final Report (Vol. II) Panamkudantha
Integrated Rural Technology Centre, Palakkad 1.11
The Kanjirappuzha, which drains to Chaliyar river is the stream of this fall. It is a 3rd order, structurally
controlled stream. The diversion structure will create a pond of area 0.0975ha. No forest land will be
submerged. Above all, this accounts for only 0.22 ha/MW. This diversion structure which also acts
as a check dam can increase the height of water table level at the site. The impounded water will also
change soil moisture regime in adjacent forest land.
29.7.3 Socio-economic Impact
The construction phase would create employment opportunities for a period of 18 months. The peak
labour strength is 50 skilled and 100 unskilled labour. It requires only minimum land acquisition for
construction. The acquisition does not need any rehabilitation.
29.8 CONCLUSION
The environmental impact of small hydel project is negligible compared to large hydel projects.
Moreover, deforestation owing to the inundation will be a meagre area.
The economic size of installed capacity depends upon the permissible tariff as well as the capital cost.
It was found that the project is financially viable for an installed capacity of 450kW at a project cost
of Rs. 3.5 Crores per MW and a tariff rate of Rs.2.5 per unit of electricity. Alternatively, if the tariff is
raised to Rs.3.00 per unit, an installed capacity of 650kW would become economically viable.
Cost effective methods of construction, like the use of gabion weirs, can be used to reduce the capital
costs. A methodology for implementing the project with a maximum of peoples= participation should
also be devised. The role of the Grama Panchayath in this effort is crucial.
-�-

WGSHP - Final Report (Vol. II) Panamkudantha
Integrated Rural Technology Centre, Palakkad 1.12
30. KEEZHARKUTHU
District : Idukki
Panchayath : Kanjikuzhi
Head : 180 m.
Flow : Perennial Suggested Capacity : 10.5 MW/ 13 MW

WGSHP - Final Report (Vol. II) Keezharkuthu
Integrated Rural Technology Centre, Palakkad 1.13

WGSHP - Final Report (Vol. II) Keezharkuthu
Integrated Rural Technology Centre, Palakkad 1.14
30.1 GENERAL
30.1.1 The site
The Keezharkuthu water fall is situated in the 10th ward of Kanjikkuzhi Grama Panchayath in
Idukki district. The site is at a distance of 30km. from Kanjikkuzhi. There is a bus route from
Kanjikkuzhi to Thadiyampadam which is 5km. away from Kanjikkuzhi. From Thadiyampadam,
there are occasional bus services to Maniyarkkudy. From Maniyarkkudy which is at 10km. from
Thadiyampadam, there is a jeepable road to Kaithappara. From there, we have to travel 3km.
through dense forest to reach the site. There is another bus route from Thodupuzha to
Kaithappara through Udumbannoore. But it is very lengthy and not convenient for transport.
The water fall is located at 760 52' 30" E longitude and 90 54' 20" N latitude. The catchment area
measured from topo sheet is 17sq. km. The falls are situated at an elevation of 770m from MSL
in Keezhar stream which is beginning at an elevation of 1034m. It is flowing almost strate through
the fern shaped catchment area. After the fall, the stream joins the Velur Puzha which in turn is
draining into Kaliyar a tributery of Muvattupuzha (Fig.No.30.1).
30.1.2 Topography
The site is situated in Thodupuzha Reserved Forest . This is a dense forest. The land is having
steep slopes in this area. There is no possibility for land slide in this area and chances for soil
erosion is less and it is negligible. The bed of the stream is rocky and boulders are available in
plenty in this area. The rainfall intensity is high in its catchment. The number of rainy days exceeds
50% in its catchment. The fall is located almost 200m. high before the stream starts flowing
horizontally.
30.2 FIELD INVESTIGATION
30.2.1 Reconnaissance survey
A topographical survey for obtaining topographical details of the site. There is two main fall and
two moderate falls which gives a total head of 180m. The possible location for diversion
structure and power house are identified and the details are taken using tacheometric method of

WGSHP - Final Report (Vol. II) Keezharkuthu
Integrated Rural Technology Centre, Palakkad 1.15
surveying.
30.2.2 Catchment area
Topographical survey sheets to a scale of 1:50,000 are available from the Survey of India. The
catchment of Keezharkuthu was located using the toposheet. It is shown in the Fig.No.30.2.
From the shape it is identified as a fern shaped catchment and its area comes nearly 3.50km. The
catchment area having almost moderate slope but some portions are very steep. Maximum flood
discharge measured at this site during 1998-99 is about 12 cumec.
30.2.3 Contour map
The survey details were plotted on a sheet of paper at a scale of 1:400. The undulations of the
site, the location of the falls and other topographical features were identified from the contour
map. The location of the weir, the alignment of the penstock and location of the power house
was also determined using this and the prepared contour map has been shown in Annexure
A.30.
30.2.4 River flow data
For a period of 12 months (November 1997 to 1998) the water level observations were taken in
every week. A suitable location was identified on the down stream of the fall, where the whole
water is flowing through that point, cross sectional details of the point was noted for calculating
discharge of stream. We fixed a measuring gauge at this point to measure the peak flow. Using
the collected data (Table 30.1) the weekly discharge hydrograph of the site is prepared. The
graph is shown in Fig. No. 30.3.
30.2.5 Flow duration curves
Using weekly discharge hydro graph, percentage flow of exceedence was calculated. From this,
the flow duration curve was plotted (Fig. No. 30.4). The same curve also functions as
percentage flow of exceedence graph. This river flow data is recalculated in tabular form, giving
the corresponding energy potential in weekly and cumulative mode is given in Table 30.2. These
data are used for calculating energy potential and selection of unit sizes in section 30.4.
30.2.6 Peak flow determination

WGSHP - Final Report (Vol. II) Keezharkuthu
Integrated Rural Technology Centre, Palakkad 1.16
There are various empirical methods for calculating the maximum flood discharge. The different
values obtained are shown in Table 30.3. The value obtained by Dicken=s formula, which is
commonly used in western ghats region has been used for the structural design of diversion
structure.
Table 30.3
Peak Flow Determination
Parameters
Dicken==s method
Ingli== s formula
Ryve == s formula
Nawab Jung
Bahadur formula Peak flow in cumec
217.68
399.44
66.77
259.87
30.3 SALIENT DESIGN FEATURES
A detailed design of Civil, Electrical and Mechanical work have not been carried out in this report
as it is does not come under the purview of the project, but a typical section of the proposed
diversion structure is given here. The stability analysis of the section and economic diameter of
the penstock was carried out as part of preliminary design. The capability and number of units,
type and specification of turbine, generator and it=s cost are fixed consulting various agencies
30.3.1 Power potential of the project
The discharge corresponding to 100% of exceedence is only 0.02cubic metre per second. A
discharge of 0.02cubic metre per second can produce only about 27kW. In order to tap the full
potential of the site, with a head of 180 metre, the project is designed to generate higher output
with lower dependability. This site can be designed as a peak load station which can produce
2500 kW with a dependability of 50%.
The output power was computed using the formula, P = 10 x Q x H x ηη
Where; P = Power output in kW
Q = Discharge in cumec
H = Head in metres
η = Overall efficiency (Here it is assumed as 0.75)
For 50% exceedence P = 10 x 1.85 x 180 x 0.75 = 2500 kW
For 40% exceedence P = 10 x 4 x 180 x 0.75 = 5400 kW

WGSHP - Final Report (Vol. II) Keezharkuthu
Integrated Rural Technology Centre, Palakkad 1.17
For 30% exceedence P = 10 x 5.88 x 180 x 0.75 = 8000 kW
30.3.2 Energy potential
At this site, sufficient flow is there so that we can obtain 2500kW power output for 50% of the
time (183 days) which reduces to 10kW by 60% time (219 days). The energy input
corresponding to 50% time will be (50/100 * 2500 * 365 * 24) = 11MU. The flow after 50%
time can be utilized by providing a small pondage. The quantity of water available from 50% to
100% time is calculated to be 8416699 m3. Energy obtained from this water is calculated to be
3.16 MU.
Total amount of energy produced = 11 MU +3.16 MU = 14.16 MU
It may be noted that, this much amount of energy can be generated for the particular year. If
higher flows are available during any year, it will enable higher production and vice versa.
30.3.3 Pondage requirement
From the contour map a plot of surface area Vs. elevation is drawn in Fig. No. 30.5. The areas
corresponding to each elevation is used to find the volume of water that can be stored in each
elevation and the details is shown in Table 30.4. From this information capacity elevation curve
of the pondage is prepared and is shown in Fig.No. 30.6.
Table 30.4
Pondage Area Details Sl. No.
Elevation (m.)
Area (m2)
Capacity (m3)
Energy (kWh)
1
93.0
804.80
201.120
7.5
2
93.5
1301.40
757.590
27.3
3
94.0
1917.28
1532.26
57.5
4
94.5
2506.14
2638.121
99
5
95.0
3173.76
4058.098
152
6
95.5
3680.22
5771.593
216
7
96.0
4224.16
7747.880
291
8
96.5
4819.95
10008.710
375
9
97.0
5455.00
12577.466
472

WGSHP - Final Report (Vol. II) Keezharkuthu
Integrated Rural Technology Centre, Palakkad 1.18
As the terrain is suitable for storing 12500m3, it follows that, at full storage, the energy capacity
is only about 450 kWh. If a single 450 kW machine is installed, it can be operated for only one
hour at full capacity during peak time. Fortunately, pondage becomes critical only during lean
months, this kind of operation practice is acceptable. Hence, a weir height of 6m. to create a
storage of 12500 m3 is suggested.
30.4 SELECTION OF PLANT CAPACITY AND UNIT SIZES
For optimization of plant capacity, the following parameters were assumed.
Rate of return on investment - 15%
Loan repayment period - 10 years
Average O/M cost - 2.5% of capital cost
Resulting standard annual cost - 25%
(This consists of 2.5% O & M costs, 15% return on 25% equity, 15% interest on 75% loan and
repayment of loan in 10 annual instalments)
Tariff (per Unit) - Rs. 2.5 and 3.0 (Two cases)
Investment cost (Rs.in Crores per MW) - Rs. 3.5 (Two cases)
Since manufacturers were not in a position to quote exact figures, no attempt was made to fine
tune the cost in relation to site specific conditions. Only ranges could be indicated. Each
combination of tariff and capital cost selected above, will demand a minimum annual generation
per kW installed. This can be taken to be the break even Plant Capacity Factor (PCF) for the
site under the specified conditions.
Lower the cost/MW and higher the price for energy, the larger will be the economically
viable installed capacity and the quantity of energy that can be economically extracted
from a given site.
Let the capital cost of Keezharkuthu be Rs.3.5 crores/MW. The annual rate is 25%. Let the unit
rate of tariff offered by K.S.E.B be Rs. 2.5/kWh.
If X be the number of hours of operation at full load capacity,

WGSHP - Final Report (Vol. II) Keezharkuthu
Integrated Rural Technology Centre, Palakkad 1.19
per Mega Watt annual cost, at the rate of 25% on investment = Rs. 3.5 Crores x 0.25
per Mega Watt revenue = 1000 kW x Rs. 2.5 x X
Equating the two, we get 3,50,00,000 x 0.2.5 = X x 1000 x 2.5 X = 3,500 hrs.
It follows that, any combination of machines, that can work at full capacity for over 3500 hours
can deliver a profit, if the overall project cost is below Rs. 3.5 crores/MW and tariff is Rs. 2.5
per kilo Watt hour.
This can be explained better in terms of Plant Capacity Factor, which is defined as the ratio of
actual amount of energy obtained to the maximum energy that can be obtained from the given
installed capacity during an year, to the actual amount of energy obtained.
In this case, for the value of X = 3500 hours, PCF = (3500 / 8760) x 100 = 40%
That is, a maximum capacity, which yields a PCF of 40% is economically viable for this site.
Similarly, break even PCF for Rs.3.0 per and Rs. 3.5 Crores per mega watt where X=2916
hours is 33.3%.
Now we shall check various capacities of turbine size which are suitable for this two conditions.
a. Tariff: Rs.2.50/kWh and break even PCF of 40%
For an installed capacity of 10500 kW, which corresponds to about 12% flow of exceedence
from the chart, the total energy yield is the sum of:
10500 kW x (0.12 x 8760) = 11MU at continuous operation for 12% time of an year, and 27.5
MU, which is the cumulative energy potential from 12% to 100% time as obtained from the Chart
(Table 30.3).
Total yield = 11MU + 27.5MU = 38.5 MU.
The Plant Capacity Factor, corresponding to this yield is given by :
PCF = 38.5 x 10⁸ / (10500 x 8760) = 41.8 %

WGSHP - Final Report (Vol. II) Keezharkuthu
Integrated Rural Technology Centre, Palakkad 1.20
This PCF is equal to the break even value of 40%.
So 10500 kW will be the optimum choice for the site, if the overall project cost is below
Rs.3.5 crores/MW and tariff is Rs. 2.5 per kilo Watt hour.
b. Tariff: Rs.3.00/kWh and break even PCF of 33.3%
Similarly, for 13000 kW (for 5.5% flow of exceedence)
PCF = (40260000 / 13000 x 8760) x 100 = 35.3%
This PCF is very near to the break even value of 33%.
Similarly, 13000 kW will be the optimum choice for the site, if the overall project cost is
below Rs. 3.5 crores/MW and tariff is Rs. 3.0 per kilo Watt hour.
Table 30.5
Economically Viable Maximum Capacity at Different Costs and Tariff
Tariff
Unit size for
Rs.3.5 Crores/MW
Rs.2.5/Unit
10500 kW
Rs.3.00/ Unit
13000 kW
The units selected can be one of the following combinations:
For Rs.3.5 Crores/MW and Rs.2.5/Unit we can opt (5 MW x 2 + 0.5 MW x 1)
For Rs.3.5 Crores/MW and Rs.3.0/Unit we can opt (5 MW x 2 + 1MW x 3)
Among these two categories, the second one seems to be less viable since it is bulky with units.
We have restricted ourselves to the more realistic combination of Rs. 3.5 Crores/MW of
investment cost and two tariff choices of Rs.2.5/Unit and Rs.3.0/Unit.

WGSHP - Final Report (Vol. II) Keezharkuthu
Integrated Rural Technology Centre, Palakkad 1.21
30.5 CIVIL ENGINEERING WORKS
The important Civil Engineering Works required for the project are a diversion weir, an intake
structure, a penstock and a power house. A weir is constructed to have a small storage and to
divert the water from stream to the intake. For this project only a diversion weir is proposed,
which allows the excess water to flow over the weir to the downstream. The intake structure
takes water from the weir and lead it to the penstock. The penstock made of steel is proposed in
this site. A power house is constructed for the purpose of housing the electro mechanical
equipment. It is usually a small building of 10m x 8m.
30.5.1 Weir at Keezharkuthu
A concrete weir has been proposed on the Keezharkuthu stream, at a bed level of +198.000
metres. The base width of the weir at bed level is 6.00 m. The structure is 4.60 m high having a
length of 25m. at the top with a central board crested free over fall type spill way. The cross
sectional details of the proposed diversion site is shown in Fig.No.30.7.
30.5.2 Intake Structure, Penstock and Power house
A simple box type, direct intake structure of reinforced cement concrete is provided on the
stream bed. A trash rack is provided at the intake mouth, the penstock entrance starts from the
wall of intake box near the gabion. The economic diameter of the penstock is calculated as
1.5m. The penstock can carry a maximum flow of 7.78 cumec with a velocity of 4.4 metre per
second. The possible alignment for the penstock is located on the right bank of the stream. The
longitudinal section of the proposed penstock line was drawn from contour map and calculated
the length, which comes to 404.5m (Fig. No. 30.8). A surface power house is proposed on the
right bank of the stream. The slope at the proposed site is moderate. The power house is of size
10m x 8m to accommodate 10500kW, generator and standardised turbine.
30.6 ELECTRICAL AND MECHANICAL EQUIPMENTS
The power house proposed in the scheme will have an installed capacity of 10500 kW. The
electricity generated would be connected to the existing power grid system at Vechuchira by a
900 m transmission line. A standardised turbine for 180m gross head is proposed for this
particular site. The turbine shall be complete with governor, control equipment and safety

WGSHP - Final Report (Vol. II) Keezharkuthu
Integrated Rural Technology Centre, Palakkad 1.22
devices. The generator would be synchronous with a brushless excitation system shall be rated to
generate 10500 kW, 11kV three phases, 50Hz and shall be suitable for coupling with turbine
described above. The generator shall have voltage regulation equipment, parallel operation
equipment etc.
30.7 ENVIRONMENTAL IMPACTS
A small hydro project has been proposed at Keezharkuthu (Idukki Dist.). The project aims to
generates about 450 kW of hydro power from a fall having a head of 140 m. Some preliminary
environmental impact analysis have been carried out. They are land, water and socio-
economical environmental impacts.
30.7.1 Environmental impact on land

WGSHP - Final Report (Vol. II) Keezharkuthu
Integrated Rural Technology Centre, Palakkad 1.23
Total area of catchment is about 28.5 square kilometres of land in Kanjirappuzha. The upper
catchment is rocky and with little vegetation cover. The forest in this sector is semi evergreen and
deciduous. The land at left bank of stream is owned by private persons and the right bank is forest
land. Stream sections are mostly rocky large sized boulders are plenty. The most significant thing is
that, due to impoundment, no forest land will be submerged. The construction of weir, penstock,
power house, tailrace and temporary road will not take away any forest land.
30.7.2 Environmental impact on water
The Kanjirappuzha, which drains to Chaliyar river is the stream of this fall. It is a 3rd order, structurally
controlled stream. The diversion structure will create a pond of area 0.0975ha. No forest land will be
submerged. Above all, this accounts for only 0.22 ha/MW. This diversion structure which also acts
as a check dam can increase the height of water table level at the site. The impounded water will also
change soil moisture regime in adjacent forest land.
30.7.3 Socio-economic impact
The construction phase would create employment opportunities for a period of 18 months. The peak
labour strength is 50 skilled and 100 unskilled labour. It requires only minimum land acquisition for
construction. The acquisition does not need any rehabilitation.
30.8 CONCLUSION
The environmental impact of small hydel project is negligible compared to large hydel projects.
Moreover, deforestation owing to the inundation will be a meagre area.
The economic size of installed capacity depends upon the permissible tariff as well as the capital cost.
It was found that the project is financially viable for an installed capacity of 10500kW at a project
cost of Rs. 3.5 Crores per MW and a tariff rate of Rs.2.5 per unit of electricity. Alternatively, if the
tariff is raised to Rs.3.00 per unit, an installed capacity of 13000kW would become economically
viable.
Cost effective methods of construction, like the use of gabion weirs, can be used to reduce the capital
costs. A methodology for implementing the project with a maximum of peoples= participation should
also be devised. The role of the Grama Panchayath in this effort is crucial.

WGSHP - Final Report (Vol. II) Keezharkuthu
Integrated Rural Technology Centre, Palakkad 1.24
-�-
31. ATTALA
District : Palakkad
Panchayath : Karimba
Head : 180 m.
Flow : Perennial
Suggested Capacity : 6 MW / 7.5 MW

WGSHP - Final Report (Vol. II) Attala
Integrated Rural Technology Centre, Palakkad 1.1
31.1 GENERAL
31.1.1 The site
The Attala is a scenic water fall situated in the 8th ward of Karimba Grama Panchayath in
Palakkad district. The site at a distance of 11 km from Kalladikkode. There is bus service form
Mannarkkad to Munnekkar through Kalladikkode. From Munnekkar, there is an unmetalled
jeepable road nearly 3 km. to reach the site. The nearest 11KV transformer is at a distance of
3km. away from site.
The water fall is located at 770 25' 49" E longitude and 100 56' 30" N latitude. The catchment
area measured from topo sheet is 4.5 sq. km. The falls are situated at an elevation of 620m, in
Karimpuzha stream which is beginning at an elevation of 1924m. After the fall, the stream joins to
the Karimbuzha which is drains to the Bharathapuzha (Fig.No.31.1).
31.1.2 Topography
The site is situated in Karimala reserved forest. The forest is very thick. The land is having steep
slope in this area. There is no possibility for land slide in this area and the chances for soil erosion
is very less and it is negligible. The bed of the stream is rocky and boulders are available in plenty
at site.
31.2 FIELD INVESTIGATION
31.2.1 Reconnaissance survey
A topographical survey for obtaining topographical details of the site. The site contains five falls
which gives a total head of 210m. The position of the diversion structure and power house are
identified and tacheometric method is used for surveying work.
31.2.2 Catchment area

WGSHP - Final Report (Vol. II) Attala
Integrated Rural Technology Centre, Palakkad 1.2
Topographical survey sheets to a scale of 1:50,000 are available from the Survey of India. The
catchment of Attala water fall was located using the toposheet. It is shown in the Fig.No.31.2.
From the shape it is identified as a fan shaped catchment and its area comes nearly 4.75 sq.km.
Peak value of flood will be less for this basin as the difference between concentration time and
time at which flow starts will be large. The volume of flow will be distributed through a larger
length of time.
31.2.3 Contour map
The survey details were plotted on a sheet of paper at a scale of 1:200 (Annexure A.31). The
undulations of the site, the location of the falls and other topographical features were identified
from the contour map. The location of the weir, the alignment of the penstock and location of the
power house were also determined using this and marked in the above map, along with the
contours of the area.
31.2.4 River flow data
For a period of 12 months (January 1997 to January 1998) the water level observations were
taken in every week. A suitable location was identified on the downstream of the fall, where the
whole water is flowing through that point, cross sectional details of the point was noted for
calculating discharge of stream. We fixed a measuring gauge at this point and engaged a local
person for taking weekly flow data, we also visited the site once in every month for collecting the
data from the local person. From the collected data the weekly discharge is collected and make
it into tabular form (Table No.31.1) for weekly discharge graph preparation. The graph is
shown in Fig.No.31.3
31.2.5 Flow duration curves
Using weekly discharge hydro graph, percentage flow of exceedence was calculated. From this,
the flow duration curve was plotted (Fig. No. 31.4). The same curve also functions as
percentage flow of exceedence graph. This river flow data is recalculated in tabular form, giving
the corresponding energy potential in weekly and cumulative mode is given in Table 31.2. These
data are used for calculating energy potential and selection of unit sizes in section 31.4.
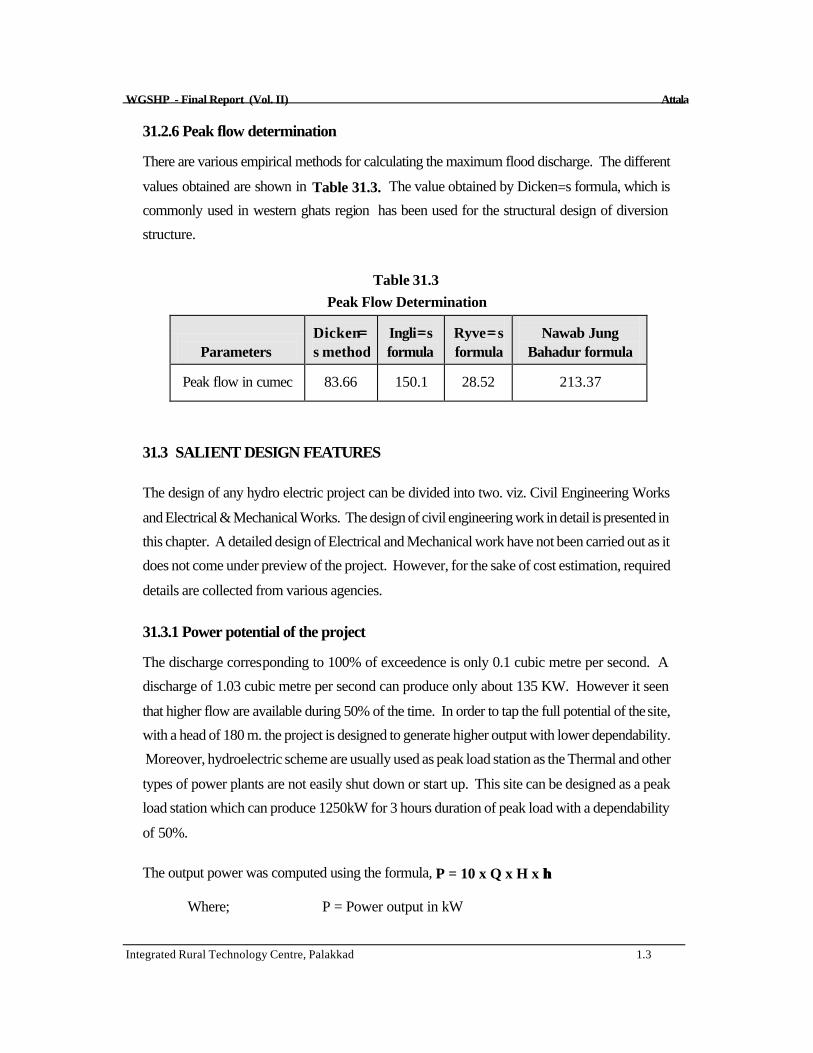
WGSHP - Final Report (Vol. II) Attala
Integrated Rural Technology Centre, Palakkad 1.3
31.2.6 Peak flow determination
There are various empirical methods for calculating the maximum flood discharge. The different
values obtained are shown in Table 31.3. The value obtained by Dicken=s formula, which is
commonly used in western ghats region has been used for the structural design of diversion
structure.
Table 31.3
Peak Flow Determination
Parameters
Dicken==s method
Ingli== s formula
Ryve == s formula
Nawab Jung
Bahadur formula Peak flow in cumec
83.66
150.1
28.52
213.37
31.3 SALIENT DESIGN FEATURES
The design of any hydro electric project can be divided into two. viz. Civil Engineering Works
and Electrical & Mechanical Works. The design of civil engineering work in detail is presented in
this chapter. A detailed design of Electrical and Mechanical work have not been carried out as it
does not come under preview of the project. However, for the sake of cost estimation, required
details are collected from various agencies.
31.3.1 Power potential of the project
The discharge corresponding to 100% of exceedence is only 0.1 cubic metre per second. A
discharge of 1.03 cubic metre per second can produce only about 135 KW. However it seen
that higher flow are available during 50% of the time. In order to tap the full potential of the site,
with a head of 180 m. the project is designed to generate higher output with lower dependability.
Moreover, hydroelectric scheme are usually used as peak load station as the Thermal and other
types of power plants are not easily shut down or start up. This site can be designed as a peak
load station which can produce 1250kW for 3 hours duration of peak load with a dependability
of 50%.
The output power was computed using the formula, P = 10 x Q x H x ηη
Where; P = Power output in kW

WGSHP - Final Report (Vol. II) Attala
Integrated Rural Technology Centre, Palakkad 1.4
Q = Discharge in cumec
H = Head in metres
η = Overall efficiency (Here it is assumed as 0.75)
For 50% exceedence P = 10 x 1.03 x 180 x 0.75 = 1250 kW
For 40% exceedence P = 10 x 2.57 x 180 x 0.75 = 3500 kW
For 30% exceedence P = 10 x 3.67 x 180 x 0.75 = 5000 kW
31.3.2 Energy potential
At this site, sufficient flow is there so that we can obtain 1250kW power output for 50% of the
time (183 days) which reduces to 100kW by 90% time (328 days). The energy input
corresponding to 50% time will be (50/100 * 1250 * 365 * 24)= 5.5MU. The flow after 50%
time can be utilized by providing a small pondage. The quantity of water available from 50% to
100% time is calculated to be 5676048 m3. Energy obtained from this water is calculated to be
2.12 MU.
Total amount of energy produced = 5.5 MU +2.12 MU = 7.6 MU
It may be noted that, this much amount of energy can be generated for the particular year. If
higher flows are available during any year, it will enable higher production and vice versa.
31.3.3 Pondage requirement
From the contour map a plot of surface area Vs. elevation is drawn in Fig.No.31.5. The areas
corresponding to each elevation is used to find the volume of water that can be stored in each
elevation and the details is shown in Table 31.4. From this information capacity elevation curve
of the pondage is prepared and is shown in Fig.No. 31.6.
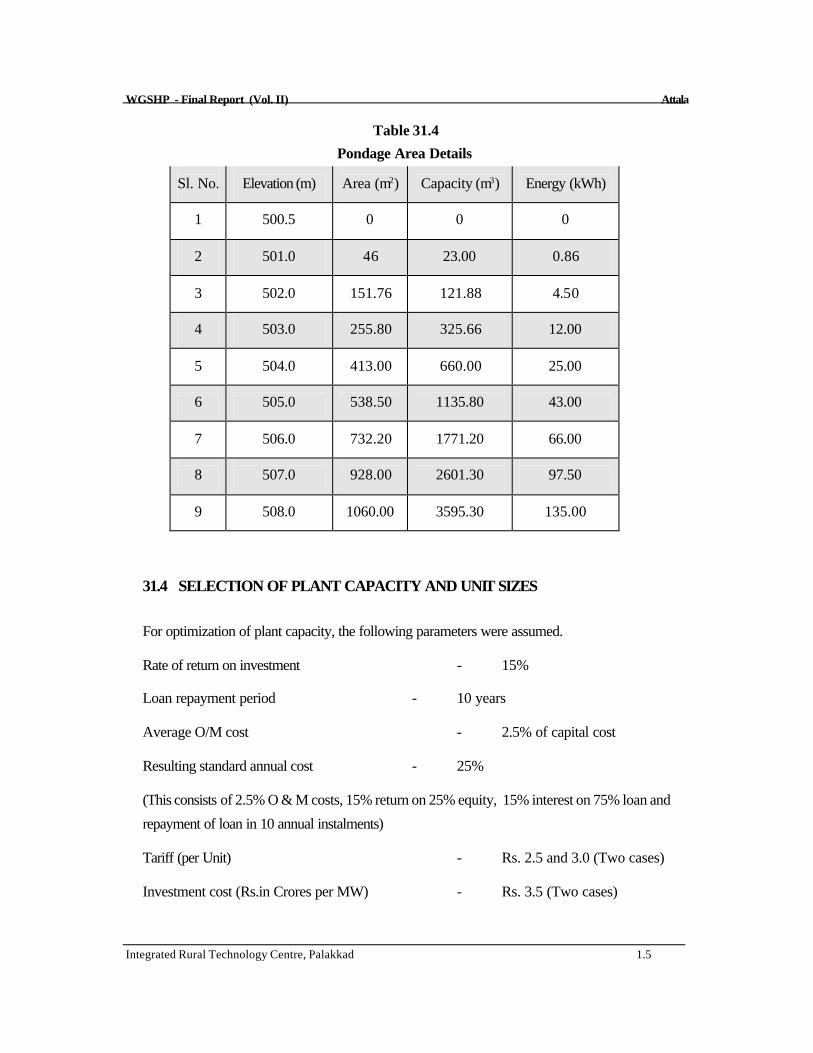
WGSHP - Final Report (Vol. II) Attala
Integrated Rural Technology Centre, Palakkad 1.5
Table 31.4
Pondage Area Details Sl. No.
Elevation (m)
Area (m2)
Capacity (m3)
Energy (kWh)
1
500.5
0
0
0
2
501.0
46
23.00
0.86
3
502.0
151.76
121.88
4.50
4
503.0
255.80
325.66
12.00
5
504.0
413.00
660.00
25.00
6
505.0
538.50
1135.80
43.00
7
506.0
732.20
1771.20
66.00
8
507.0
928.00
2601.30
97.50
9
508.0
1060.00
3595.30
135.00
31.4 SELECTION OF PLANT CAPACITY AND UNIT SIZES
For optimization of plant capacity, the following parameters were assumed.
Rate of return on investment - 15%
Loan repayment period - 10 years
Average O/M cost - 2.5% of capital cost
Resulting standard annual cost - 25%
(This consists of 2.5% O & M costs, 15% return on 25% equity, 15% interest on 75% loan and
repayment of loan in 10 annual instalments)
Tariff (per Unit) - Rs. 2.5 and 3.0 (Two cases)
Investment cost (Rs.in Crores per MW) - Rs. 3.5 (Two cases)

WGSHP - Final Report (Vol. II) Attala
Integrated Rural Technology Centre, Palakkad 1.6
Since manufacturers were not in a position to quote exact figures, no attempt was made to fine
tune the cost in relation to site specific conditions. Only ranges could be indicated. Each
combination of tariff and capital cost selected above, will demand a minimum annual generation
per kW installed. This can be taken to be the break even Plant Capacity Factor (PCF) for the
site under the specified conditions.
Lower the cost/MW and higher the price for energy, the larger will be the economically
viable installed capacity and the quantity of energy that can be economically extracted
from a given site.
Let the capital cost of Attala be Rs.3.5 crores/MW. The annual rate is 25%. Let the unit rate of
tariff offered by K.S.E.B be Rs. 2.5/kWh.
If X be the number of hours of operation at full load capacity,
per Mega Watt annual cost, at the rate of 25% on investment = Rs. 3.5 Crores x 0.25
per Mega Watt revenue = 1000 kW x Rs. 2.5 x X
Equating the two, we get 3,50,00,000 x 0.2.5 = X x 1000 x 2.5
X = 3,500 hrs.
It follows that, any combination of machines, that can work at full capacity for over 3500 hours
can deliver a profit, if the overall project cost is below Rs. 3.5 crores/MW and tariff is Rs. 2.5
per kilo Watt hour.
This can be explained better in terms of Plant Capacity Factor, which is defined as the ratio of
actual amount of energy obtained to the maximum energy that can be obtained from the given
installed capacity during an year, to the actual amount of energy obtained.
In this case, for the value of X = 3500 hours, PCF = (3500 / 8760) x 100 = 40%
That is, a maximum capacity, which yields a PCF of 40% is economically viable for this site.
Similarly, break even PCF for Rs.3.0 per and Rs. 3.5 Crores per Mega Watt where X=2916
hours is 33.3%

WGSHP - Final Report (Vol. II) Attala
Integrated Rural Technology Centre, Palakkad 1.7
Now we shall check various capacities of turbine size which are suitable for this two conditions.
a. Tariff: Rs.2.50/kWh and break even PCF of 40%
For an installed capacity of 6000 kW, which corresponds to about 10% flow of exceedence
from the chart, the total energy yield is the sum of:
6000 kW x (0.1 x 8760) = 5.26MU at continuous operation for 10% time of an year, and
17MU, which is the cumulative energy potential from 10% to 100% time as obtained from the
Chart (Table 31.3).
Total yield = 5.26MU + 17MU = 22.26 MU.
The Plant Capacity Factor, corresponding to this yield is given by :
PCF = 22.26 x 10⁸ / (6000 x 8760) = 42.4 %
This PCF is equal to the break even value of 40%.
So 6000 kW will be the optimum choice for the site, if the overall project cost is below
Rs.3.5 crores/MW and tariff is Rs. 2.5 per kilo Watt hour.
b. Tariff: Rs.3.00/kWh and break even PCF of 33.3%
Similarly, For 7500 kW (for 1.5% flow of exceedence)
PCF = (23500000 / 7500 x 8760) x 100 = 35.5%
This PCF is very near to the break even value of 33%.
Similarly, 7500 kW will be the optimum choice for the site, if the overall project cost is below Rs. 3.5 crores/MW and tariff is Rs. 3.0 per kilo Watt hour.
Table 31.5
Economically Viable Maximum Capacity at Different Costs and Tariff
Tariff
Unit size for
Rs.3.5 Crores/MW
Rs.2.5/Unit
6000 kW
Rs.3.00/ Unit
7500 kW
The units selected can be one of the following combinations:

WGSHP - Final Report (Vol. II) Attala
Integrated Rural Technology Centre, Palakkad 1.8
For Rs.3.5 Crores/MW and Rs.2.5/Unit we can opt (2 MW x 3)
For Rs.3.5 Crores/MW and Rs.3.0/Unit we can opt (5 MW x 1 + 2MW x 1 + 0.5 x 1).
Among these two categories, the second one seems to be less viable since it is bulky with units.
We have restricted ourselves to the more realistic combination of Rs.3.5 Crores/MW of
investment cost and two tariff choices of Rs. 2.5/Unit and Rs. 3.0/Unit.
31.5 CIVIL ENGINEERING WORKS
The important Civil Engineering Works required for the project are a weir, an intake structure, a
penstock and a power house. A weir is constructed to have a small storage and to divert the
water from stream to the intake. For this project an overflow weir is to be constructed, which
allows the excess water to flow over the weir to the downstream. The intake structure takes
water from the weir and lead it to the penstock. The penstock is a pressure pipe which carries
water to the turbine. It can be made of steel, cast iron, plastics (Poly Vinyl Chloride, High
Density Poly Ethylene) and concrete. In this project a steel penstock is used. A power house is
constructed for the purpose of housing the electro mechanical equipment. It is usually a small
building of 20m.x 10m. A detailed design of the civil works are given below.
31.5.1 Weir at Attala
A gabion weir has been proposed on the Attala stream, at a bed level of +500.500 metres. The
base width of the weir at bed level is 4.2m. The structure is 7m. high having a length of 15m. at
the top with a central board crested free over fall type spill way. The cross sectional details of
the proposed diversion site is shown in Fig.No.31.7.
31.5.2 Intake Structure, Penstock and Power house
A simple box type, direct intake structure of reinforced cement concrete is provided on the
stream bed. A trash rack is provided at the intake mouth, the penstock entrance starts from the
wall of intake box near the gabion. The economic diameter of the penstock is calculated as
1.2m. The penstock can carry a maximum flow of 4.44 cumec with a velocity of 4 metre per
second. The possible alignment for the penstock is located on the left bank of the stream. The
longitudinal section of the proposed penstock line was drawn from contour map and calculated
the length, which comes to 147m (Fig. No. 31.8).

WGSHP - Final Report (Vol. II) Attala
Integrated Rural Technology Centre, Palakkad 1.9
A surface power house is proposed on the left bank of the stream. The slope at the proposed site
is moderate but increases up the hill towards north east direction. The power house is of size
20m x 10m, to accommodate 6000 kW, generator and standardised turbine.
31.6 ELECTRICAL AND MECHANICAL EQUIPMENTS
The power house proposed in the scheme will have an installed capacity of 6000 kW. The
electricity generated would be connected to the existing power grid system at Munnekkar by a 500m
transmission line. A standardised turbine for 20m gross head is proposed for this particular site. The
turbine shall be complete with governor, control equipment and safety devices. The generator would
be synchronous with a brushless excitation system shall be rated to generate 6000kW, 11kV three
phases, 50Hz and shall be suitable for coupling with turbine described above. The generator shall
have voltage regulation equipment, parallel operation equipment etc.
31.7 ENVIRONMENTAL IMPACT
A small hydro project has been proposed at Attala (Palakkad Dist.). The project aims to generates
about 6000 kW of hydro power from a fall having a head of 180m. Some preliminary environmental
impact analysis have been carried out. They are land, water and socio-economical environmental
impacts.
31.7.1 Environmental impact on land
Total area of catchment is about 4.75 sq. km.of land in Karimbuzha. The upper catchment is rocky
and with little vegetation cover. The forest in this sector is semi evergreen and deciduous. The land at
left bank of stream is owned by private persons and the right bank is forest land. Stream sections
are mostly rocky large sized boulders are plenty.
The most significant thing is that, due to impoundment, no forest land will be submerged. The
construction of weir, penstock, power house, tailrace and temporary road will not take away any
forest land.
31.7.2 Environmental impact on water

WGSHP - Final Report (Vol. II) Attala
Integrated Rural Technology Centre, Palakkad 1.10
The Karimpuzha, which drains to Bharathapuzha is the stream of this fall. It is a 3rd order, structurally
controlled stream. The diversion structure will create a pond of area 0.106ha. No forest land will be
submerged. Above all, this accounts for only 0.0177ha/MW. This diversion structure which also acts
as a check dam can increase the height of water table level at the site. The impounded water will also
change soil moisture regime in adjacent forest land.
31.7.3 Socio-economic impact
The construction phase would create employment opportunities for a period of 18 months. The peak
labour strength is 100 skilled and 150 unskilled labour. It requires only minimum land acquisition for
construction. The acquisition does not need any rehabilitation.
31.8 CONCLUSION
The environmental impact of small hydel project is negligible compared to large hydel projects.
Moreover, deforestation owing to the inundation will be a meagre area.
The economic size of installed capacity depends upon the permissible tariff as well as the capital cost.
It was found that the project is financially viable for an installed capacity of 6000kW at a project cost
of Rs. 3.5 Crores per MW and a tariff rate of Rs.2.5 per unit of electricity. Alternatively, if the tariff is
raised to Rs.3.00 per unit, an installed capacity of 7500kW would become economically viable.
Cost effective methods of construction, like the use of gabion weirs, can be used to reduce the capital
costs. A methodology for implementing the project with a maximum of peoples= participation should
also be devised. The role of the Grama Panchayath in this effort is crucial.
-�-
![Nuffield co-ordinated sciences: chemistry worksheetsmypchem.com/root_pdf/Chemistry_Worksheets.pdf · NUFFIELD CO-ORDINATED SCIENCES CHEMISTRY WORKSHEETS Worksheet C2B [side 1] Cracking](https://img.pdfslide.us/doc/110x75/5a9da9ee7f8b9a21688d7bfe/nuffield-co-ordinated-sciences-chemistry-co-ordinated-sciences-chemistry-worksheets.jpg)