Embed Size (px)
Citation preview
A Climatology ofFlash Flood Events
in the NWS Eastern Region
Alan M. Cope
National Weather Service
Mount Holly, New Jersey

Part 1: All FF Events
Spatial and Temporal Distribution of Flash Flood Events
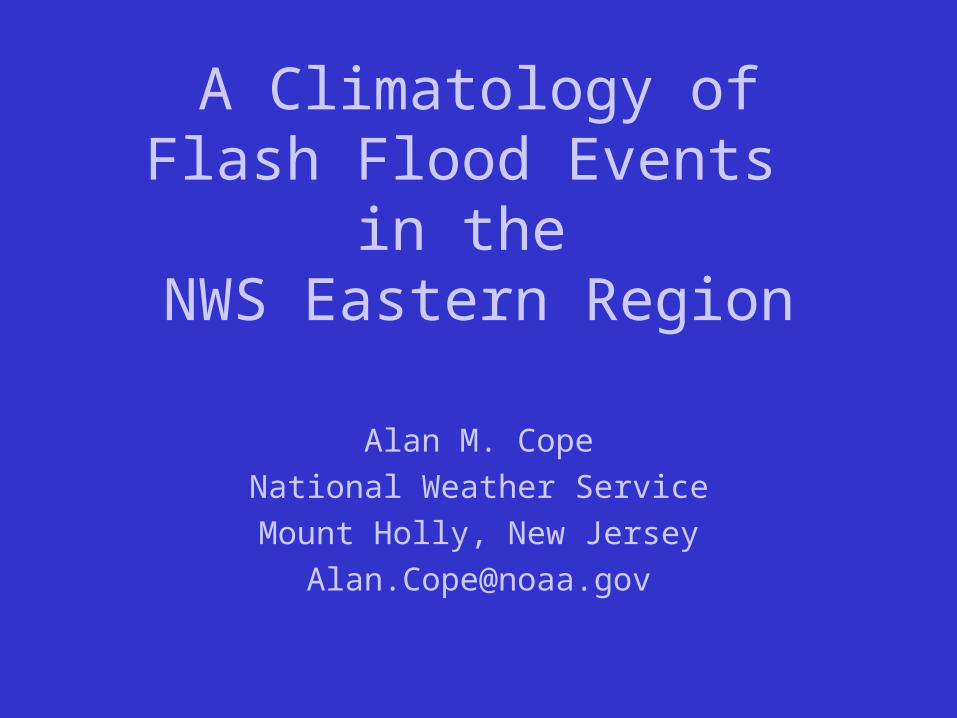
Methodology
• Do a climatological study of flash flood events only, not warnings or verification.
• Download data for all flash flood events in NWS Eastern Region, 1996-2005, from the Verification/Storm Data “Stats on Demand” web site.
• Stratify data by year, time of year, time of day, sub-region, WFO, etc.
• Plot the results…
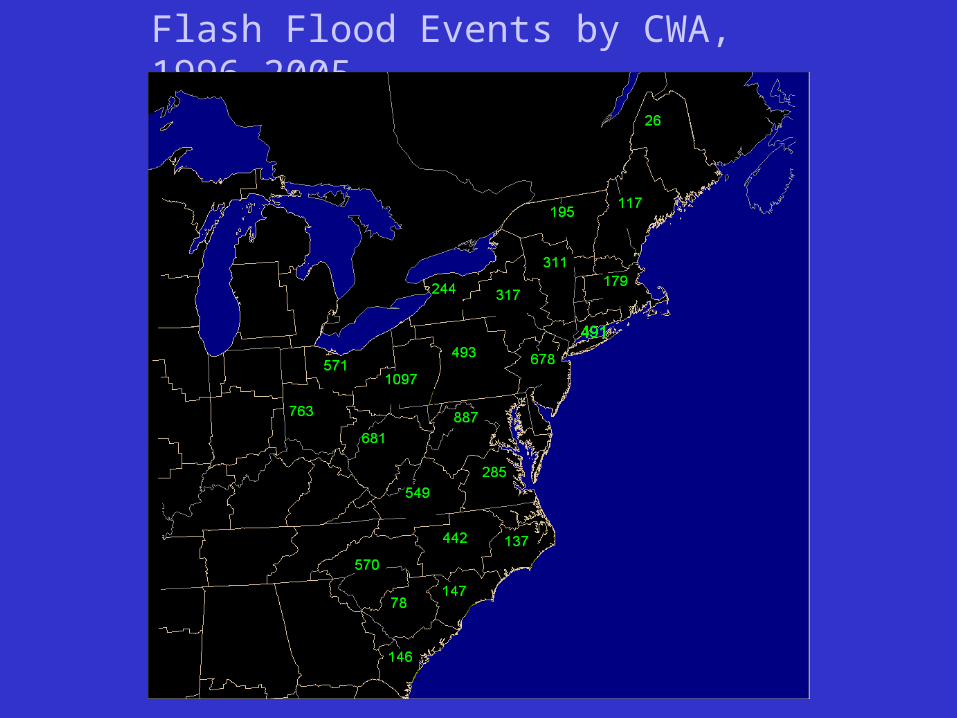
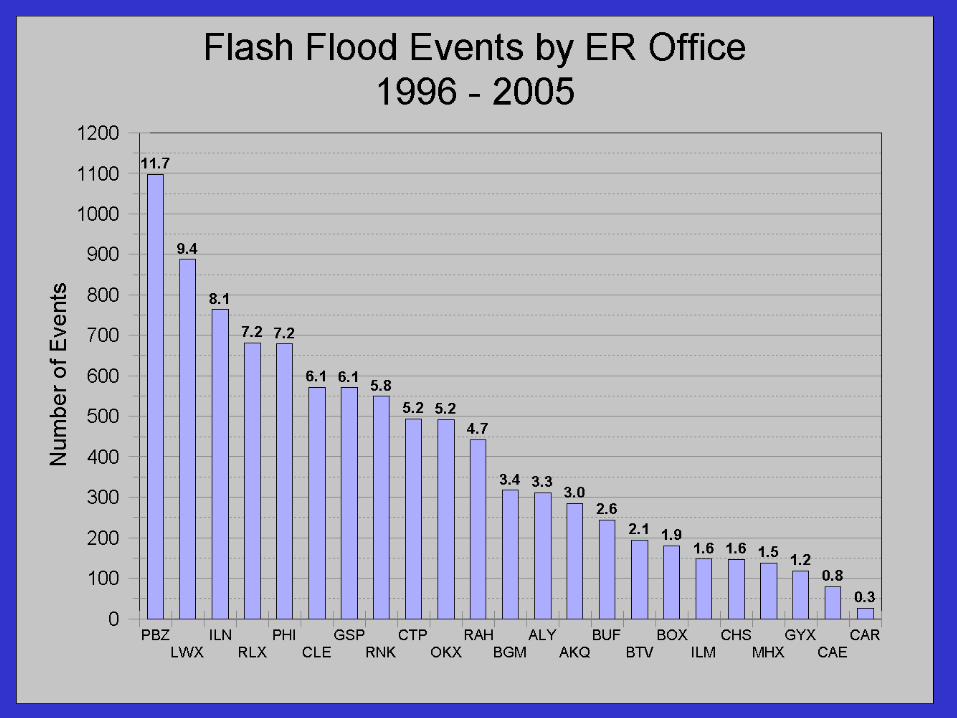
Flash Flood Events by CWA, 1996-2005
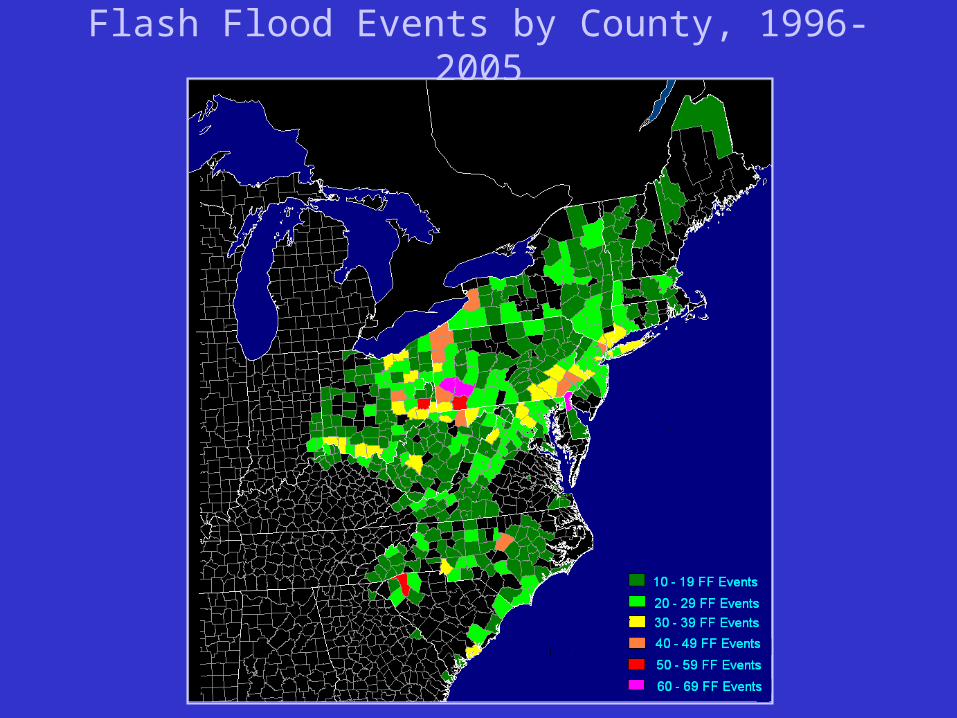
Flash Flood Events by County, 1996-2005
Ohio Valley New England
South Mid Atlantic
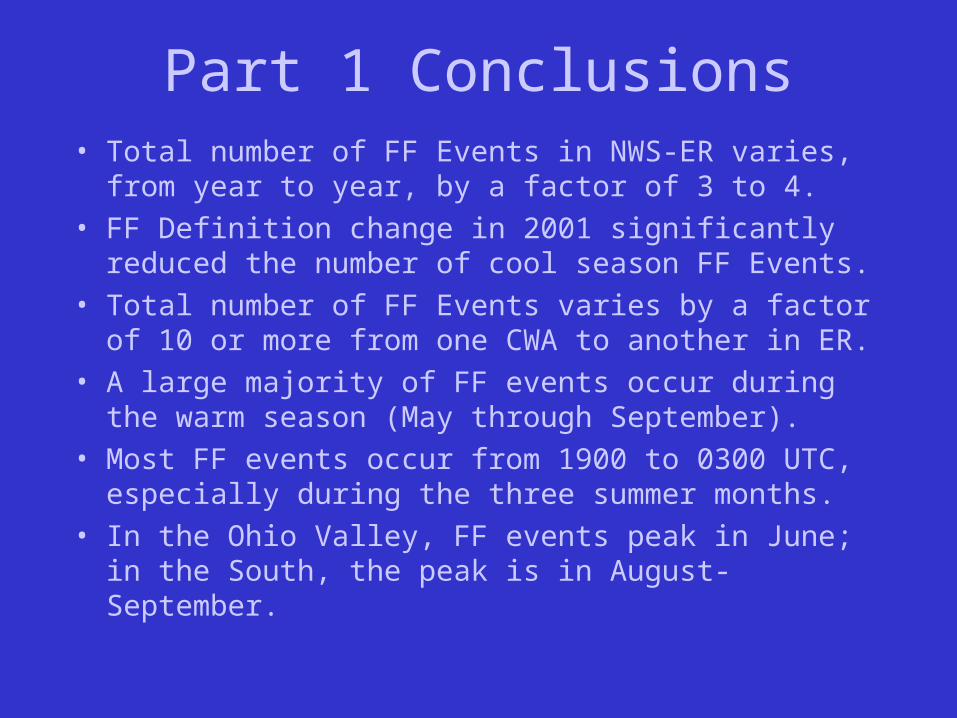
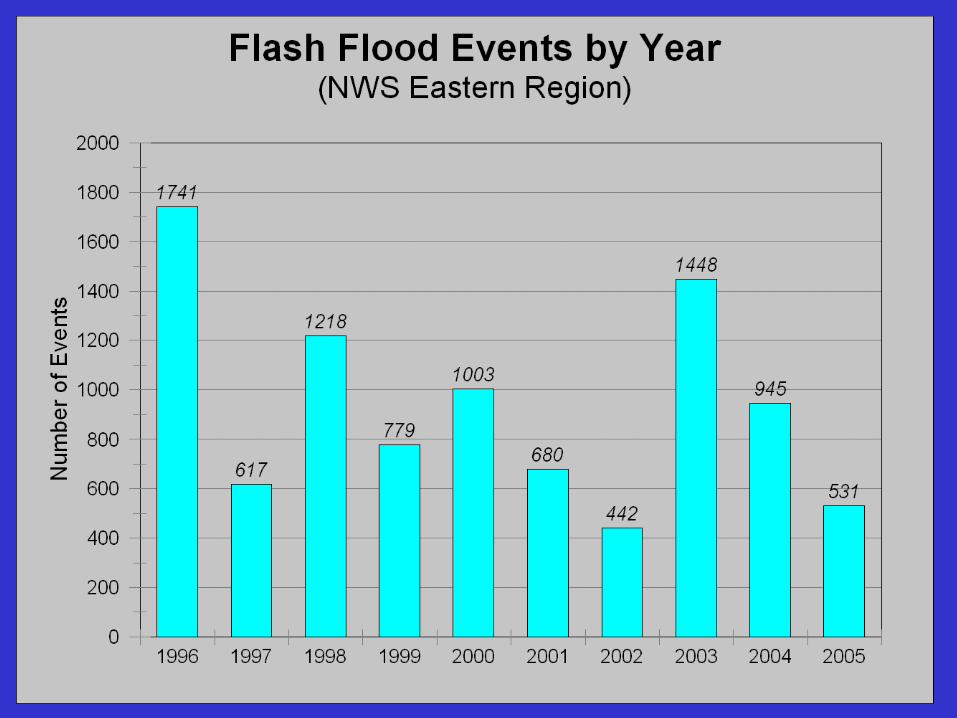
Part 1 Conclusions• Total number of FF Events in NWS-ER varies, from year to
year, by a factor of 3 to 4.
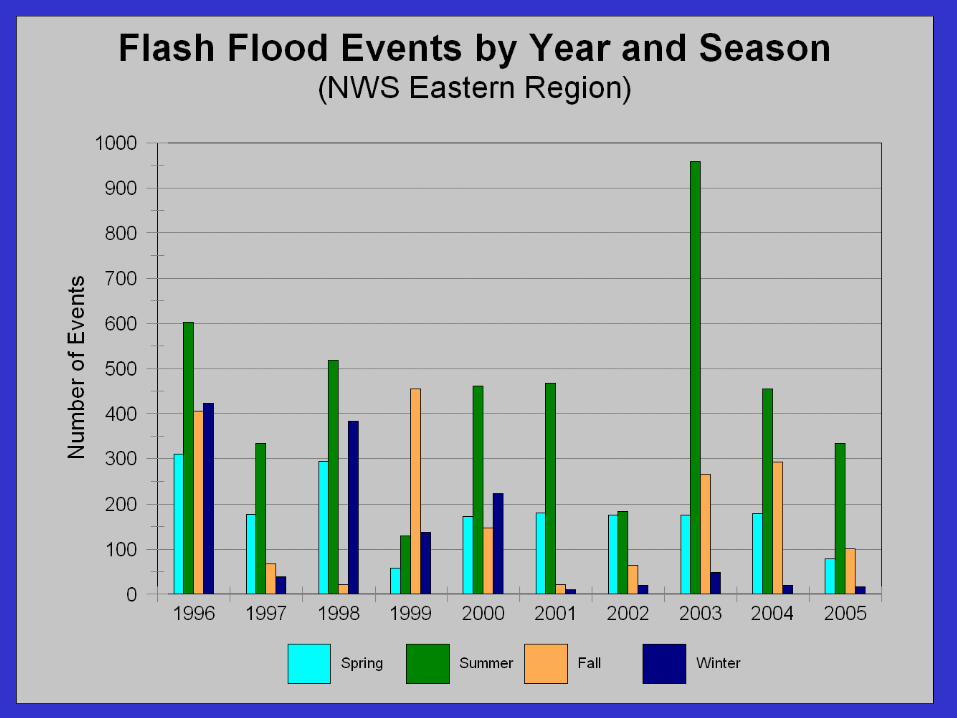
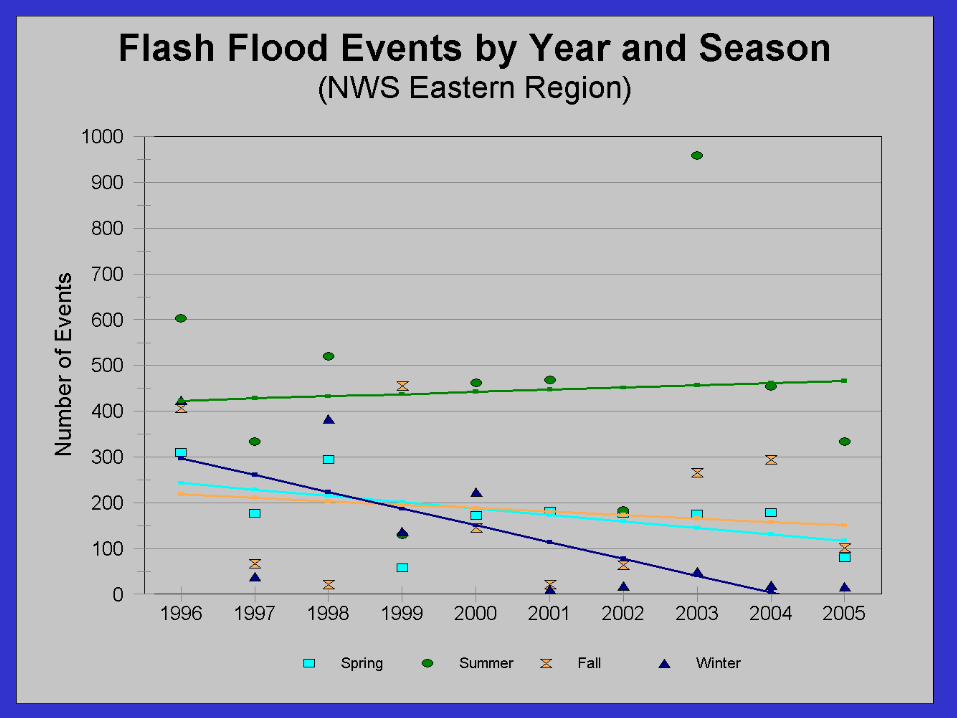
• FF Definition change in 2001 significantly reduced the number of cool season FF Events.
• Total number of FF Events varies by a factor of 10 or more from one CWA to another in ER.
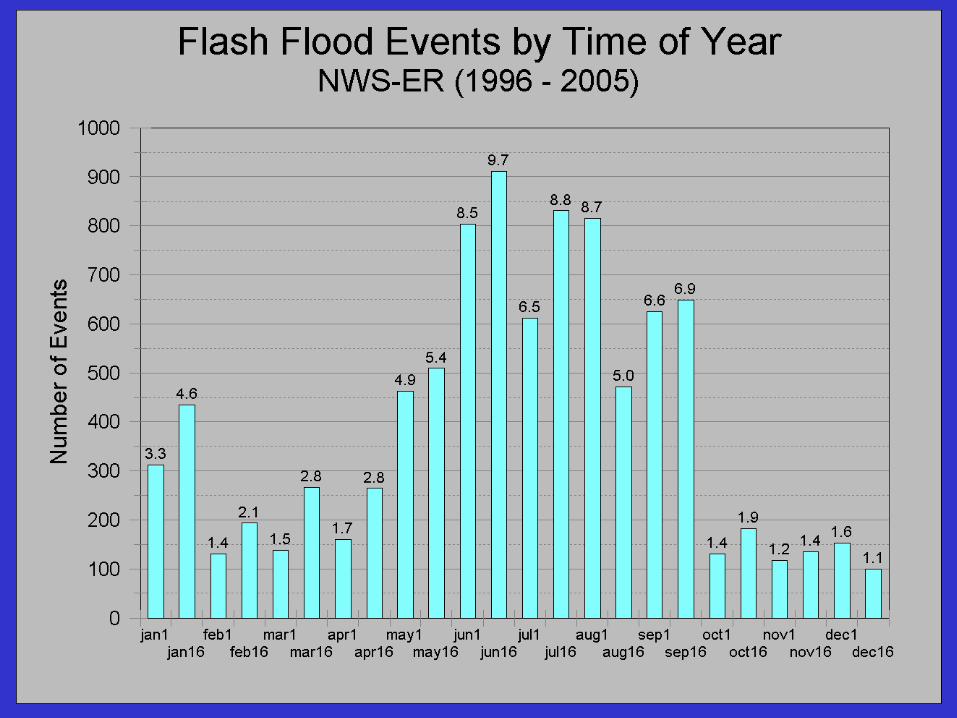
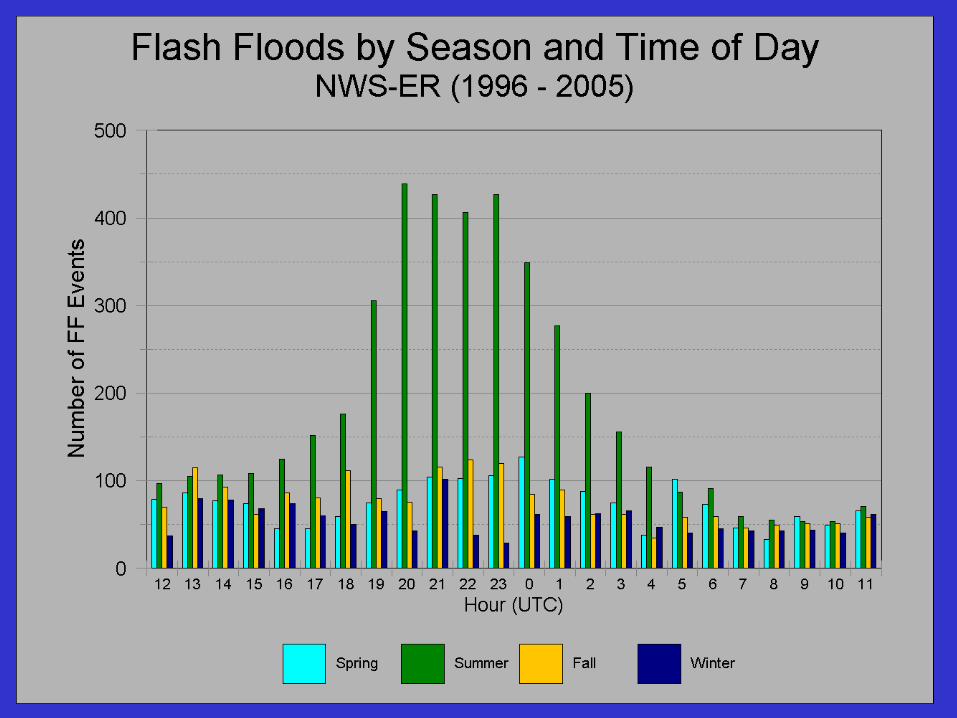
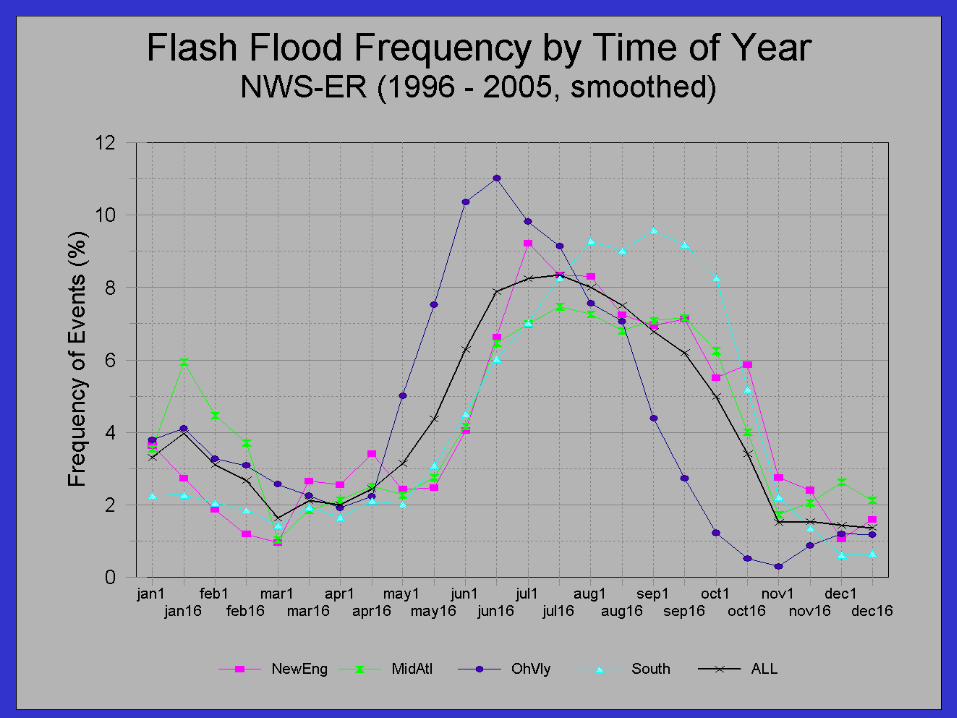
• A large majority of FF events occur during the warm season (May through September).
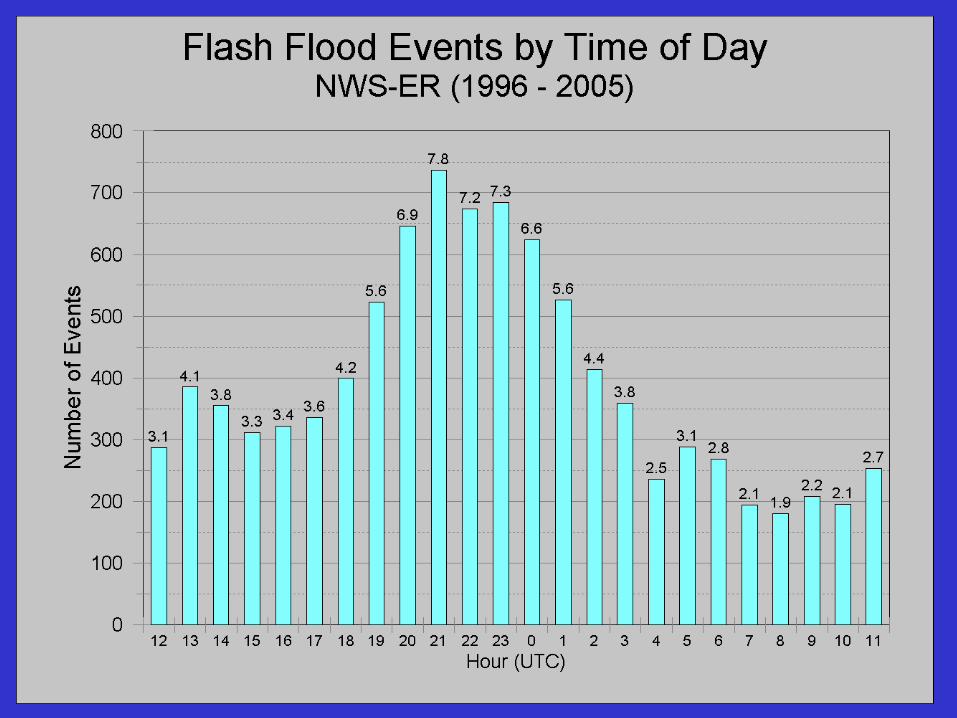
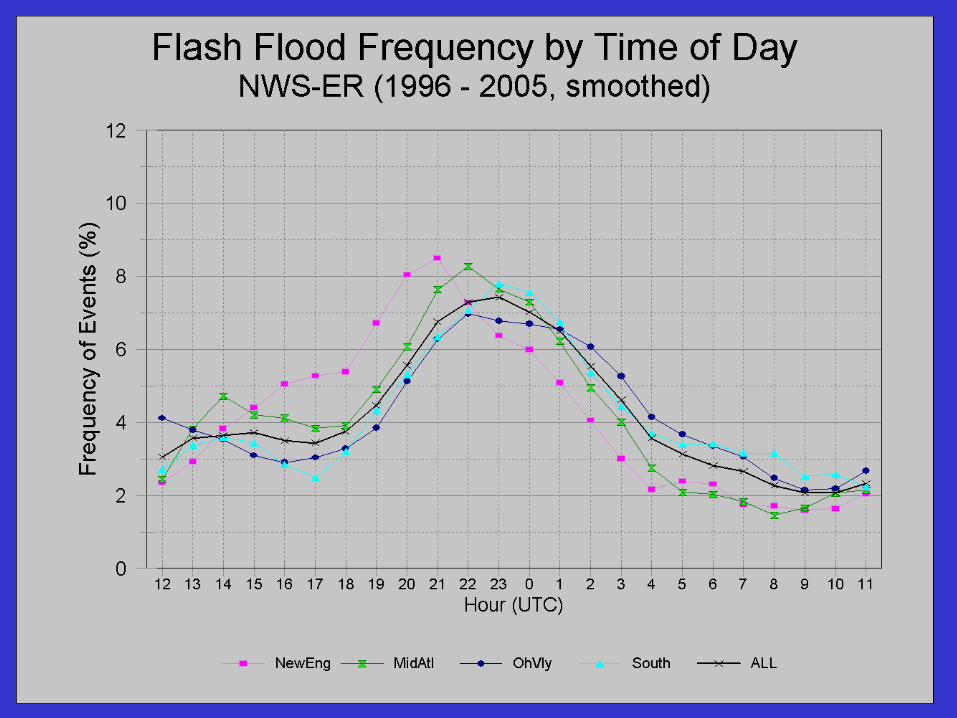
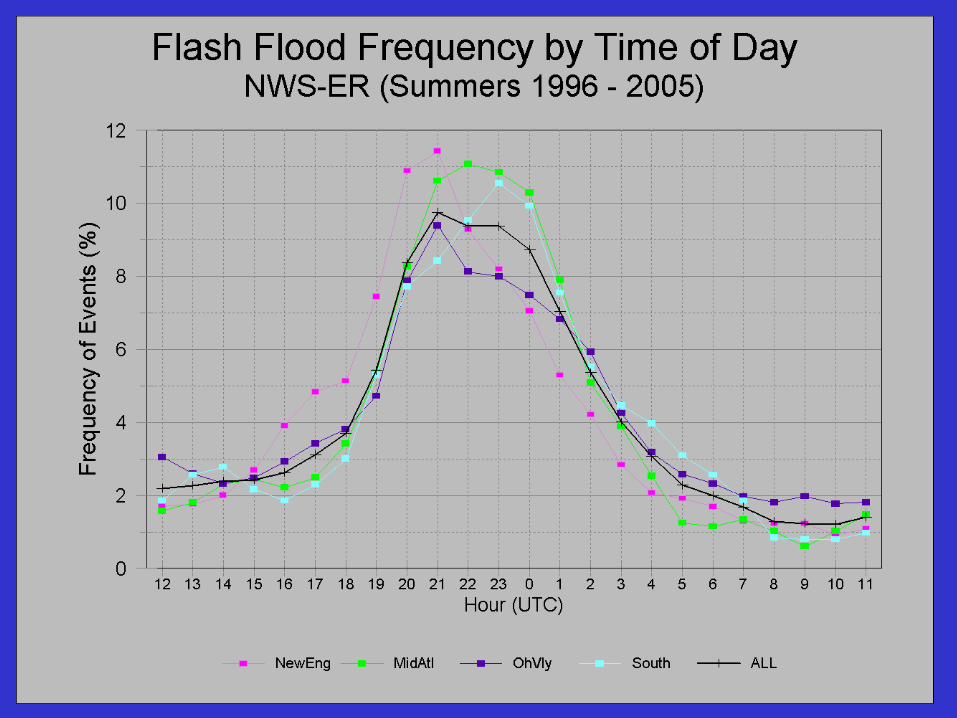
• Most FF events occur from 1900 to 0300 UTC, especially during the three summer months.
• In the Ohio Valley, FF events peak in June; in the South, the peak is in August-September.

Part 2: Summer FF Events
Composite Charts:Means and Anomalies
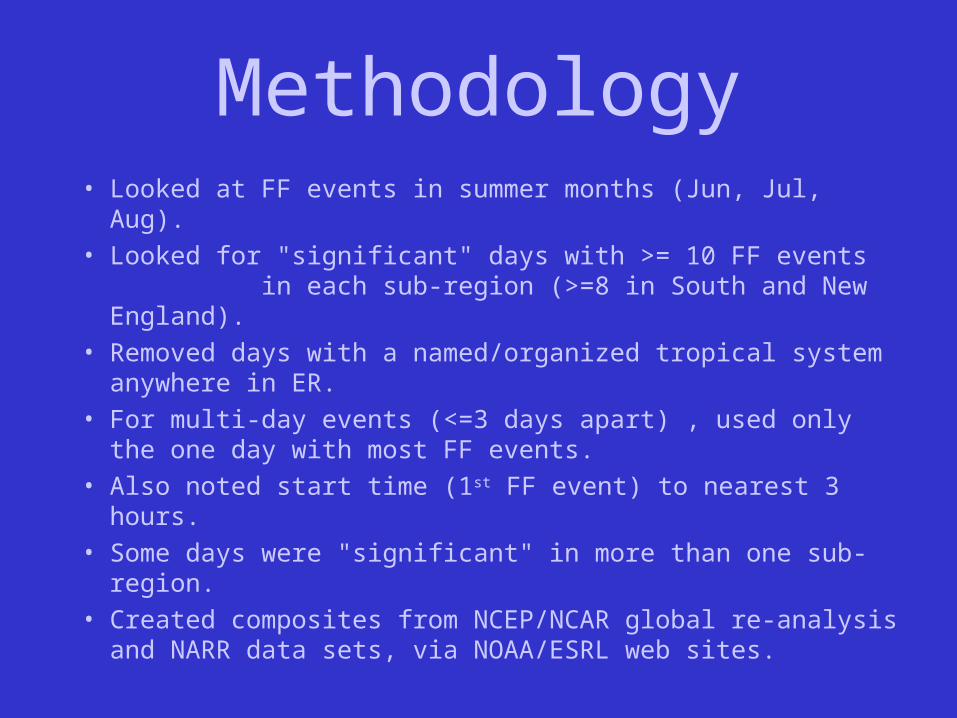
Methodology• Looked at FF events in summer months (Jun, Jul, Aug).
• Looked for "significant" days with >= 10 FF events in each sub-region (>=8 in South and New England).
• Removed days with a named/organized tropical system anywhere in ER.
• For multi-day events (<=3 days apart) , used only the one day with most FF events.
• Also noted start time (1st FF event) to nearest 3 hours.
• Some days were "significant" in more than one sub-region.
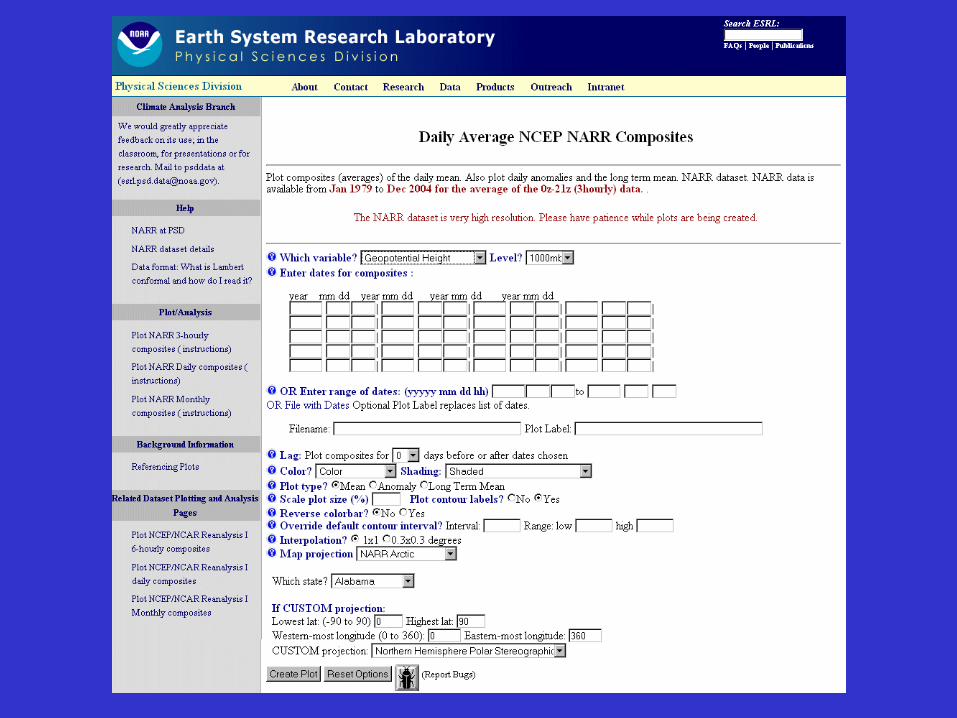
• Created composites from NCEP/NCAR global re-analysis and NARR data sets, via NOAA/ESRL web sites.
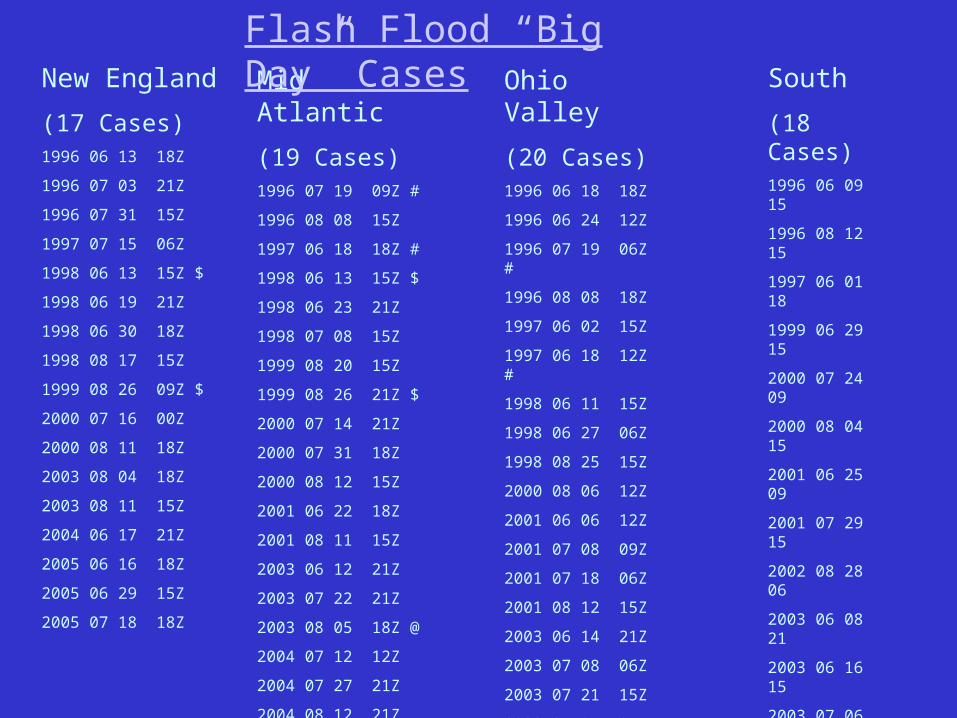
Ohio Valley
(20 Cases)1996 06 18 18Z
1996 06 24 12Z
1996 07 19 06Z #
1996 08 08 18Z
1997 06 02 15Z
1997 06 18 12Z #
1998 06 11 15Z
1998 06 27 06Z
1998 08 25 15Z
2000 08 06 12Z
2001 06 06 12Z
2001 07 08 09Z
2001 07 18 06Z
2001 08 12 15Z
2003 06 14 21Z
2003 07 08 06Z
2003 07 21 15Z
2003 07 27 21Z
2003 08 27 12Z
2004 06 15 18Z
New England
(17 Cases)1996 06 13 18Z
1996 07 03 21Z
1996 07 31 15Z
1997 07 15 06Z
1998 06 13 15Z $
1998 06 19 21Z
1998 06 30 18Z
1998 08 17 15Z
1999 08 26 09Z $
2000 07 16 00Z
2000 08 11 18Z
2003 08 04 18Z
2003 08 11 15Z
2004 06 17 21Z
2005 06 16 18Z
2005 06 29 15Z
2005 07 18 18Z
South
(18 Cases)1996 06 09 15
1996 08 12 15
1997 06 01 18
1999 06 29 15
2000 07 24 09
2000 08 04 15
2001 06 25 09
2001 07 29 15
2002 08 28 06
2003 06 08 21
2003 06 16 15
2003 07 06 18
2003 07 13 21
2003 07 29 18
2003 08 05 09 @
2003 08 16 12
2005 07 07 09
2005 08 09 18
Mid Atlantic
(19 Cases)1996 07 19 09Z #
1996 08 08 15Z
1997 06 18 18Z #
1998 06 13 15Z $
1998 06 23 21Z
1998 07 08 15Z
1999 08 20 15Z
1999 08 26 21Z $
2000 07 14 21Z
2000 07 31 18Z
2000 08 12 15Z
2001 06 22 18Z
2001 08 11 15Z
2003 06 12 21Z
2003 07 22 21Z
2003 08 05 18Z @
2004 07 12 12Z
2004 07 27 21Z
2004 08 12 21Z
Flash Flood “Big Day” Cases
Ohio Valley New England
South Mid Atlantic
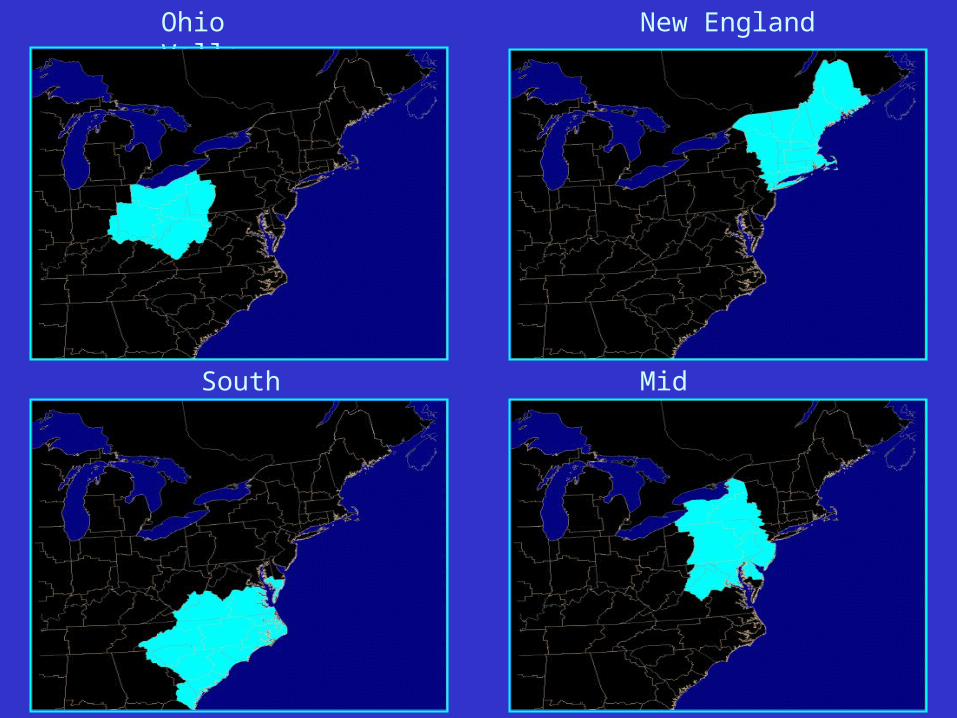
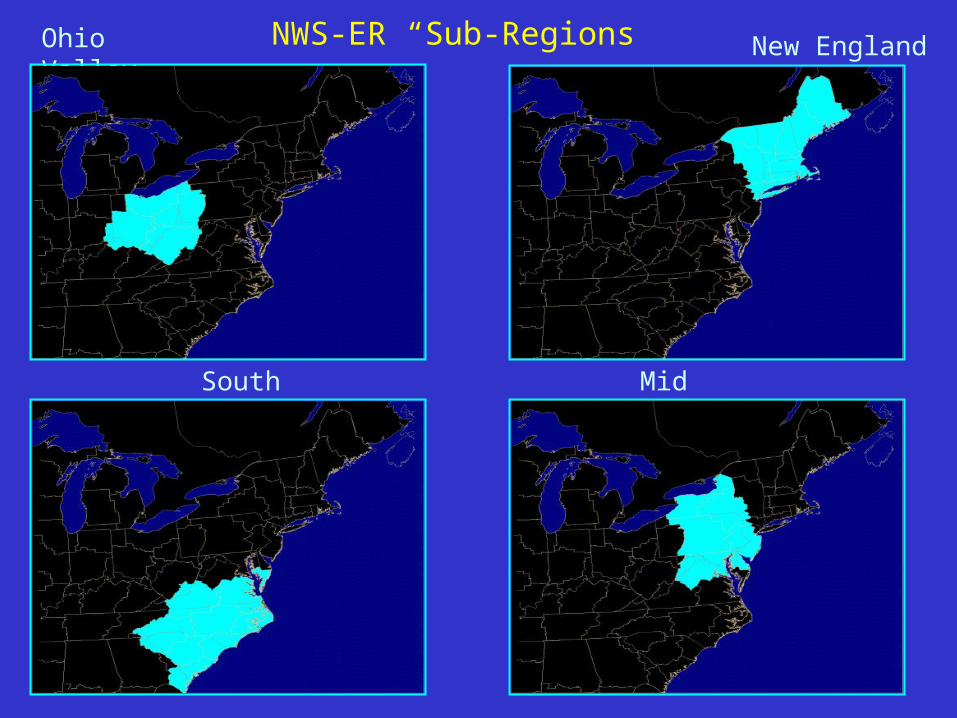
NWS-ER “Sub-Regions”
Ohio Valley New England
South Mid Atlantic
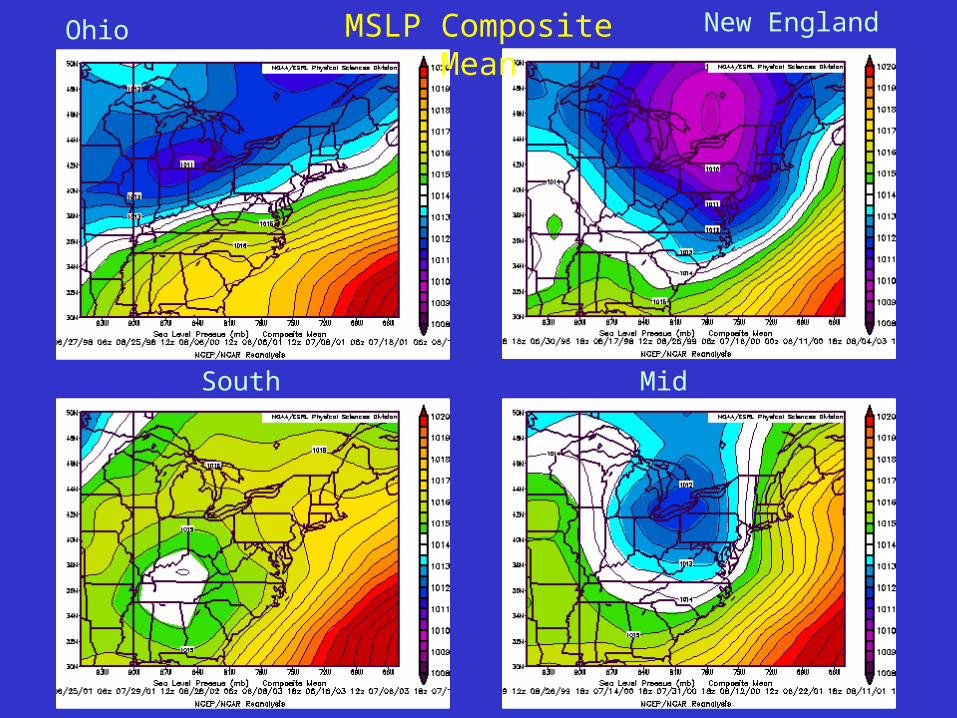
MSLP Composite Mean
Ohio Valley New England
South Mid Atlantic
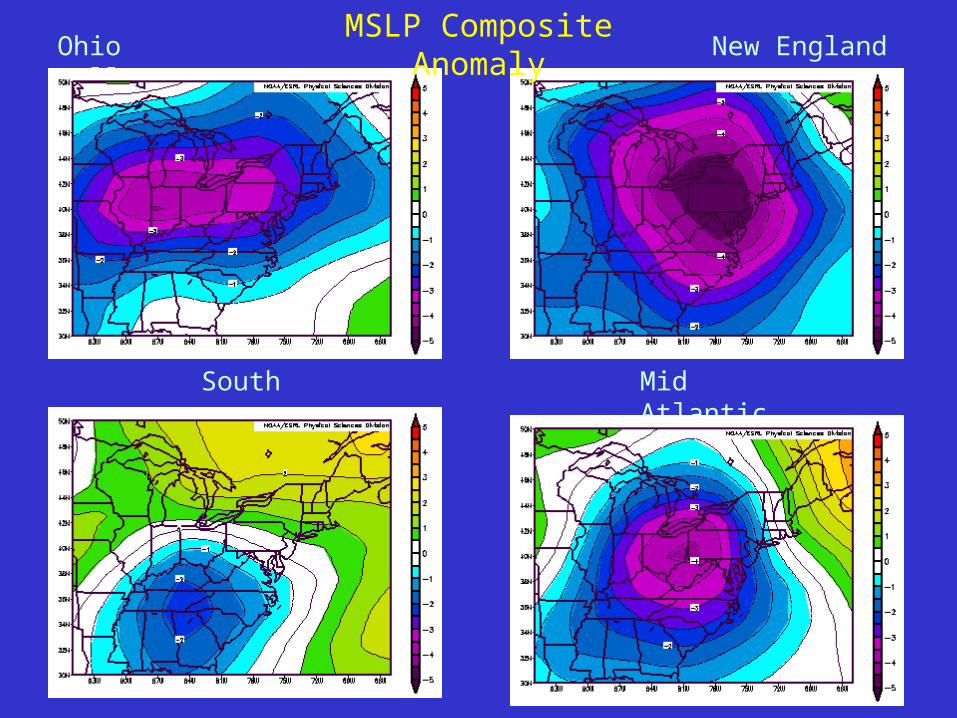
MSLP Composite Anomaly
Ohio Valley New England
South Mid Atlantic
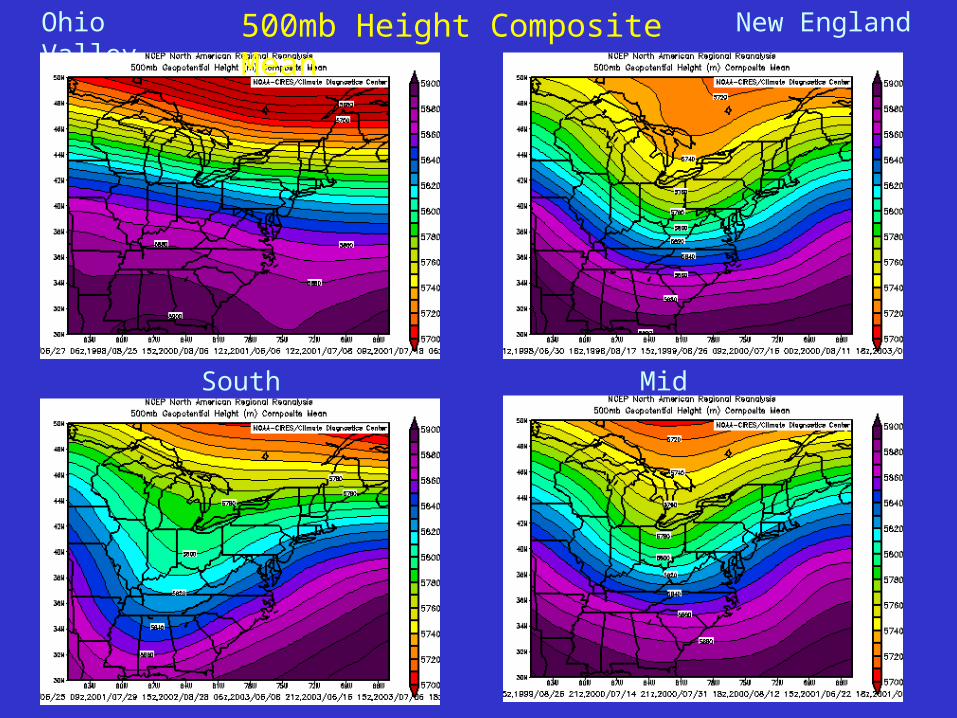
500mb Height Composite Mean
Ohio Valley New England
South Mid Atlantic
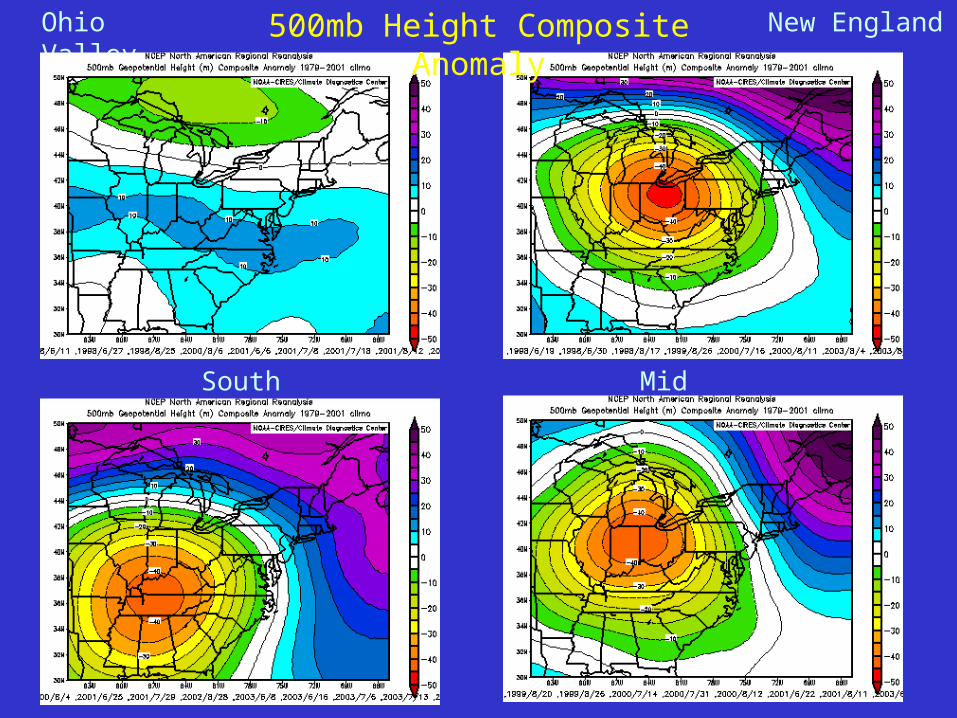
500mb Height Composite Anomaly
Ohio Valley New England
South Mid Atlantic
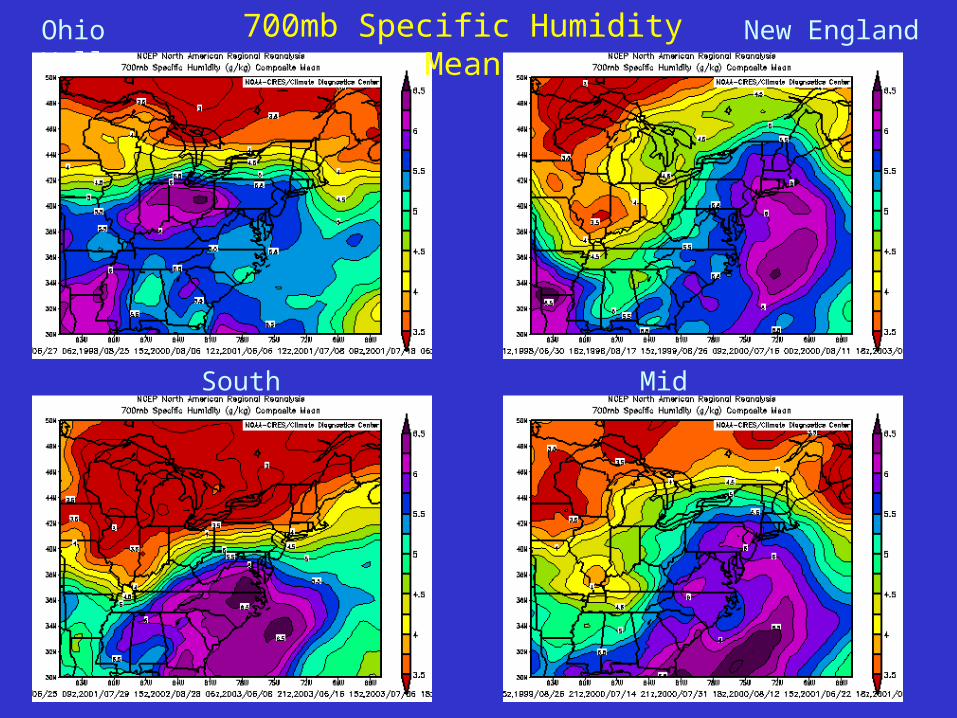
700mb Specific Humidity Mean
Ohio Valley New England
South Mid Atlantic
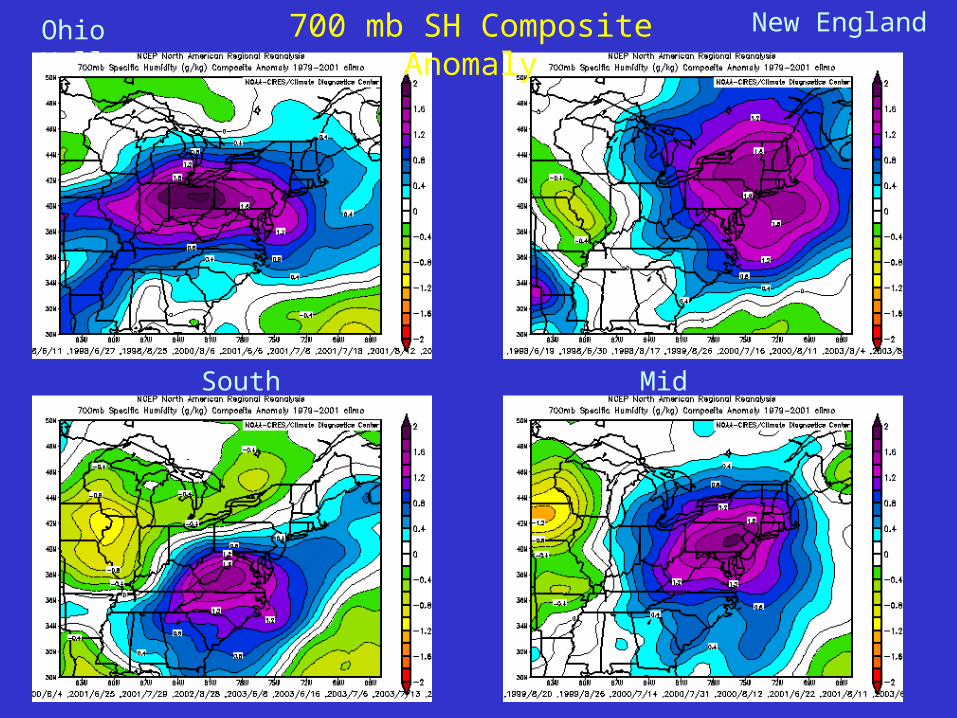
700 mb SH Composite Anomaly
Ohio Valley New England
South Mid Atlantic
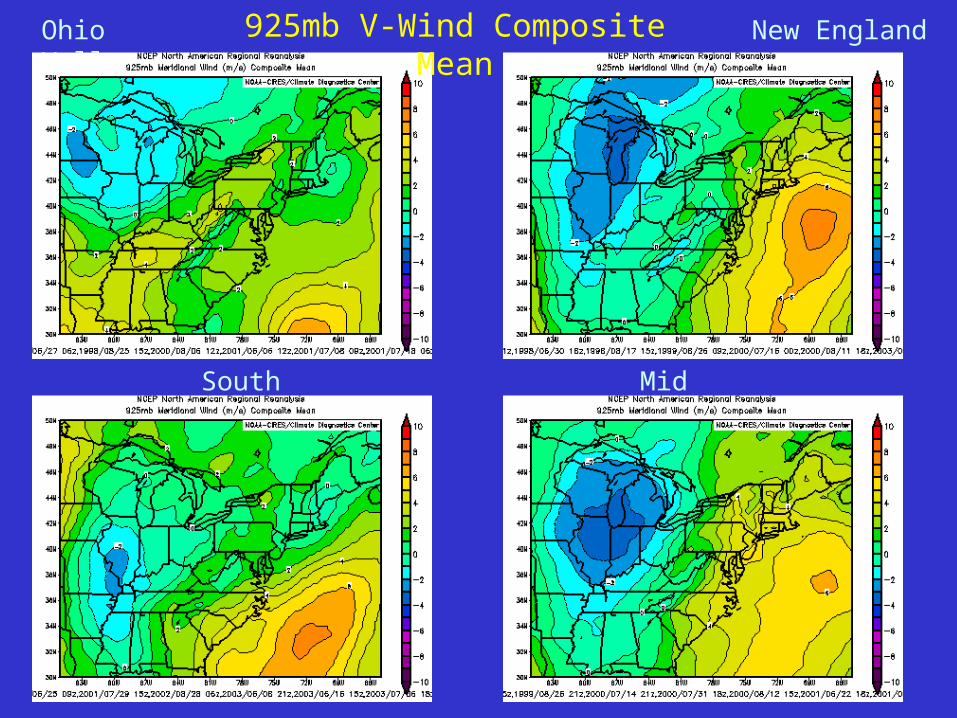
925mb V-Wind Composite Mean
Ohio Valley New England
South Mid Atlantic
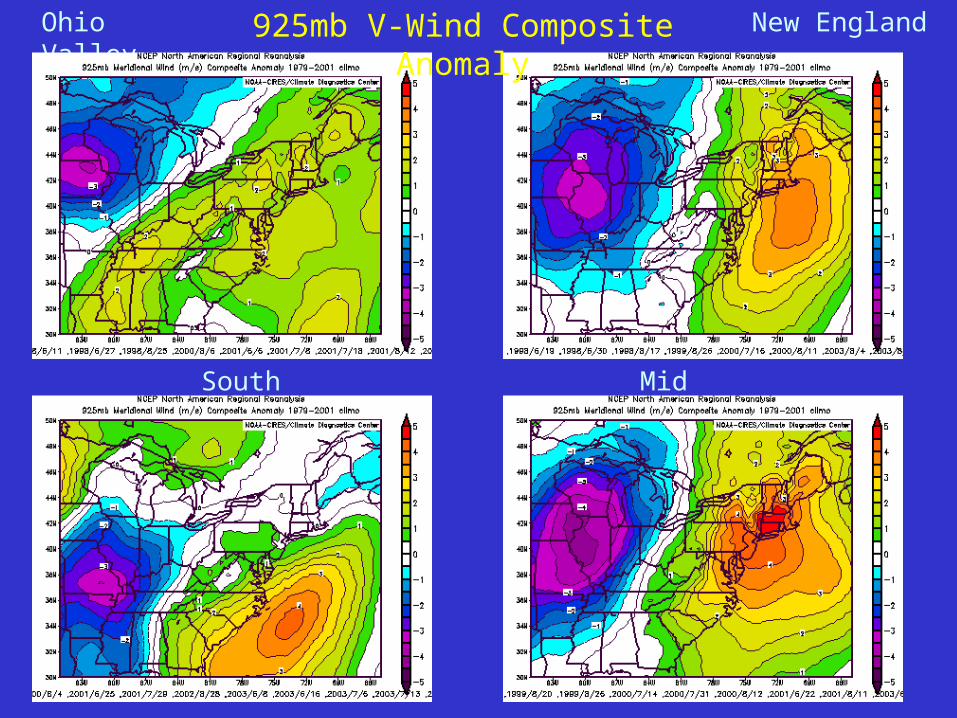
925mb V-Wind Composite Anomaly
Ohio Valley New England
South Mid Atlantic
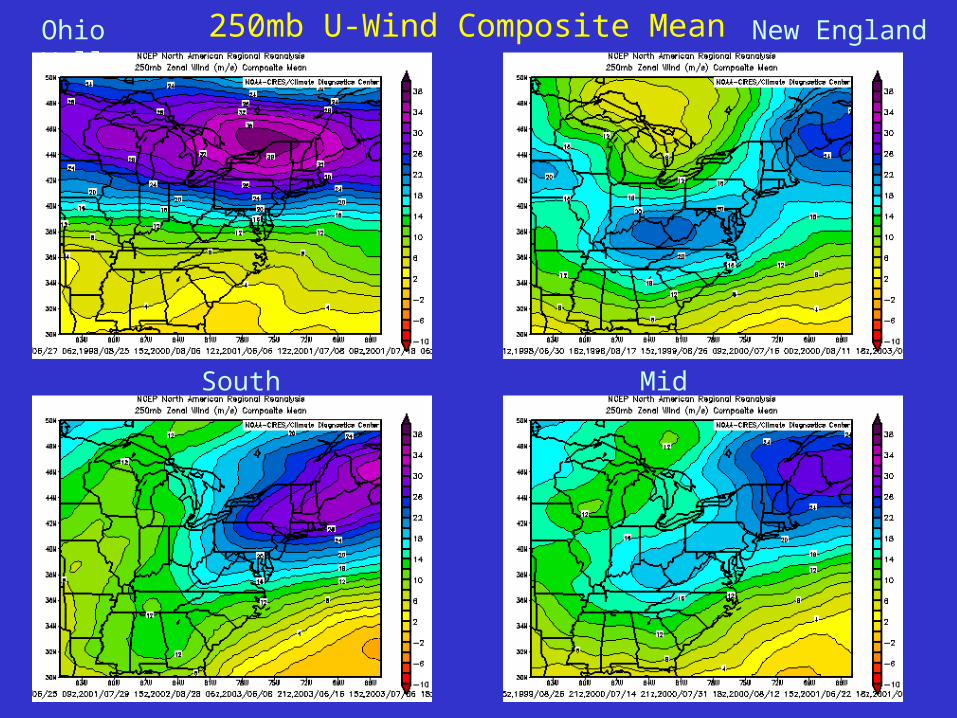
250mb U-Wind Composite Mean
Ohio Valley New England
South Mid Atlantic
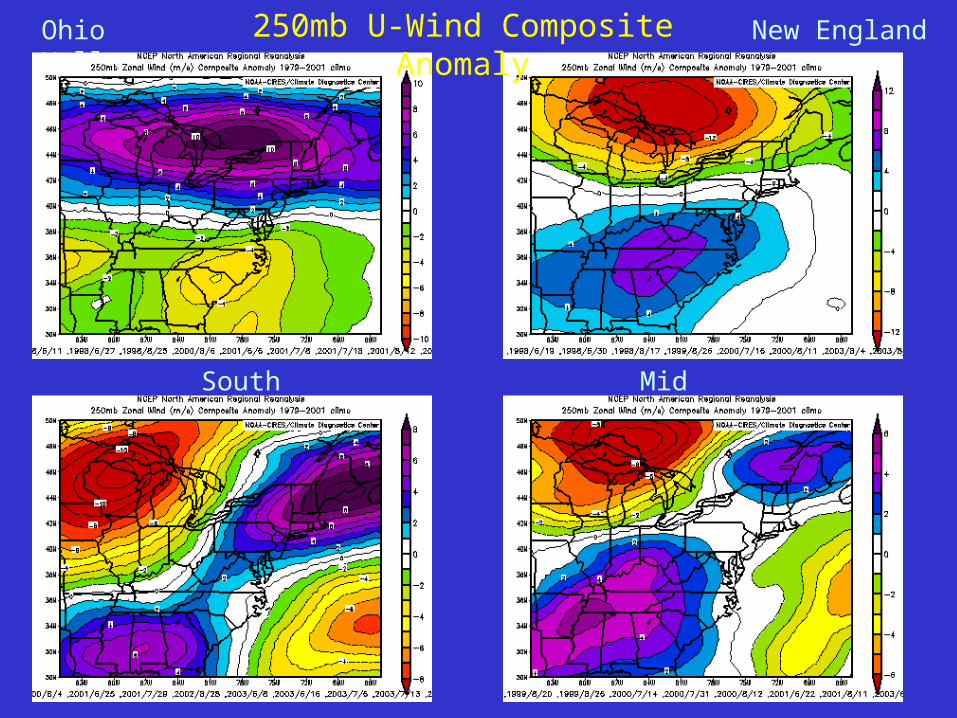
250mb U-Wind Composite Anomaly
Ohio Valley New England
South Mid Atlantic
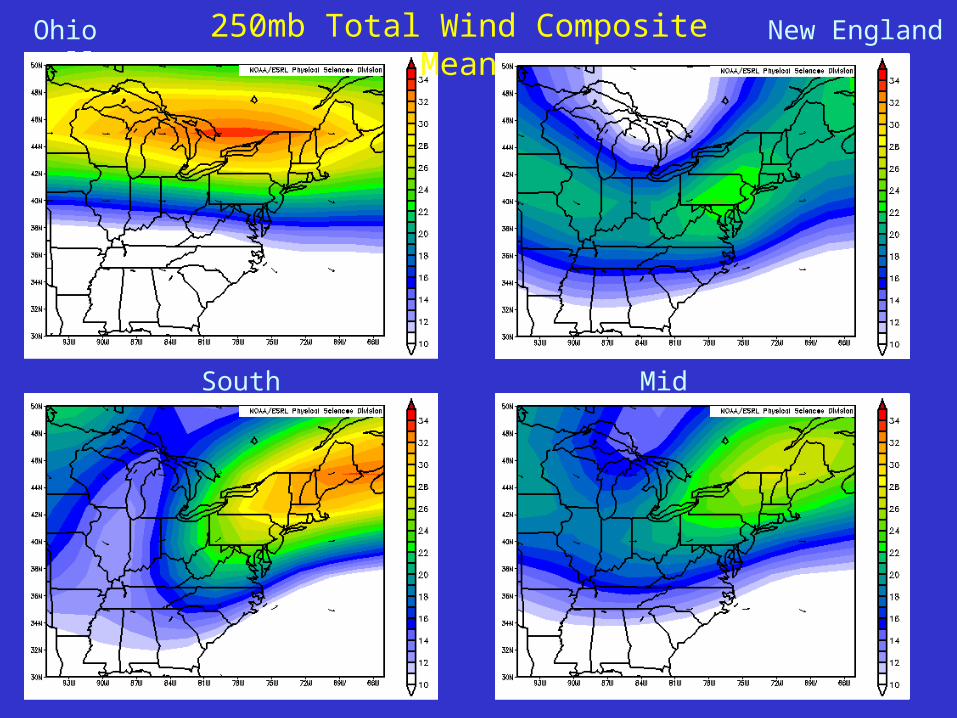
250mb Total Wind Composite Mean
Part 2 Conclusions• Composite analyses show different signals for each
NWS-ER “Sub-region”.
• Ohio valley sub-region seems most different, likely due to being west of the Appalachian Mtns.
• Negative height anomalies are found to the west of each sub-region, except Ohio Valley.
• Positive moisture anomalies are found over each sub-region.
• Positive v-wind anomalies are found over or near each sub-region.
• Upper-level jet streak pattern indicates favorable position for large-scale upward motion.

THE END
Expanded version of Part 2 is at
ftp.werh.noaa.gov /share/PHI/FF_NWS-ER_Study.ppt