Embed Size (px)
Citation preview
1960–1989(observed)1990–2009
(observed)2010–2039
(predicted)
Crop surplus area
Productive cropareas shrinking
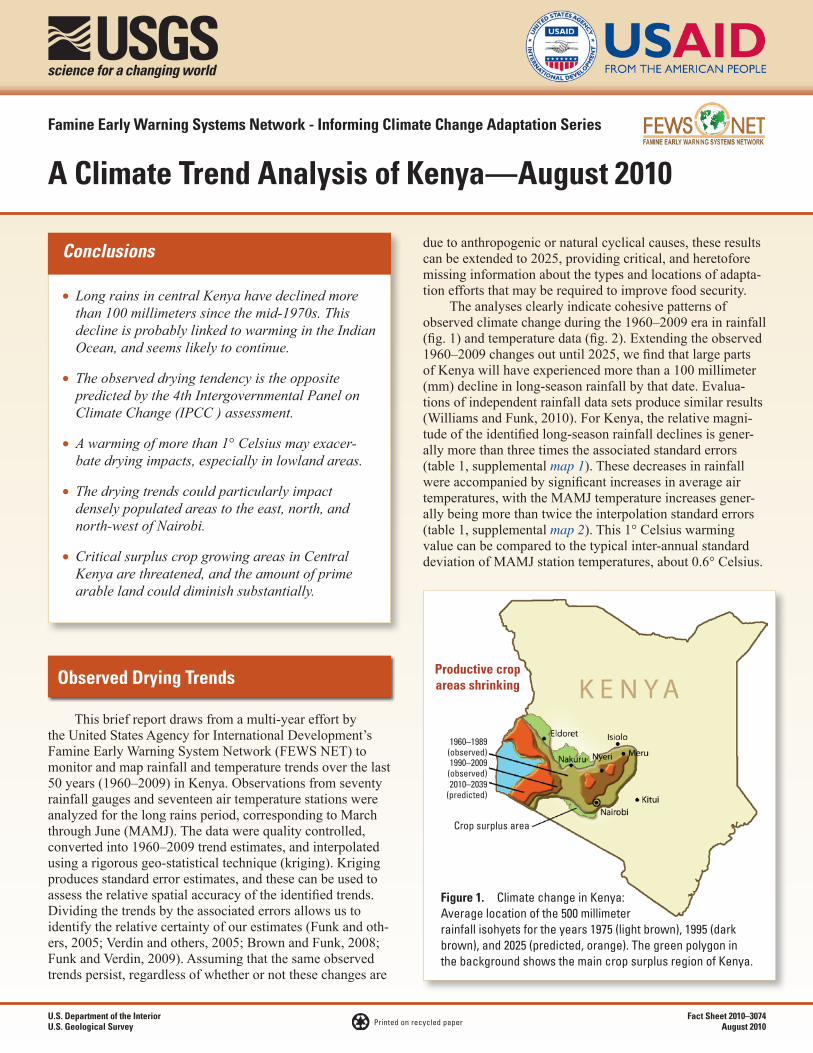
Figure 1. Climate change in Kenya: Average location of the 500 millimeter rainfall isohyets for the years 1975 (light brown), 1995 (dark brown), and 2025 (predicted, orange). The green polygon in the background shows the main crop surplus region of Kenya.
U.S. Department of the InteriorU.S. Geological Survey
Fact Sheet 2010–3074August 2010
Famine Early Warning Systems Network - Informing Climate Change Adaptation Series
A Climate Trend Analysis of Kenya—August 2010
Printed on recycled paper
Conclusions
Observed Drying Trends
due to anthropogenic or natural cyclical causes, these results can be extended to 2025, providing critical, and heretofore missing information about the types and locations of adapta-tion efforts that may be required to improve food security.
The analyses clearly indicate cohesive patterns of observed climate change during the 1960–2009 era in rainfall (fig. 1) and temperature data (fig. 2). Extending the observed 1960–2009 changes out until 2025, we find that large parts of Kenya will have experienced more than a 100 millimeter (mm) decline in long-season rainfall by that date. Evalua-tions of independent rainfall data sets produce similar results (Williams and Funk, 2010). For Kenya, the relative magni-tude of the identified long-season rainfall declines is gener-ally more than three times the associated standard errors (table 1, supplemental map 1). These decreases in rainfall were accompanied by significant increases in average air temperatures, with the MAMJ temperature increases gener-ally being more than twice the interpolation standard errors (table 1, supplemental map 2). This 1° Celsius warming value can be compared to the typical inter-annual standard deviation of MAMJ station temperatures, about 0.6° Celsius.
This brief report draws from a multi-year effort by the United States Agency for International Development’s Famine Early Warning System Network (FEWS NET) to monitor and map rainfall and temperature trends over the last 50 years (1960–2009) in Kenya. Observations from seventy rainfall gauges and seventeen air temperature stations were analyzed for the long rains period, corresponding to March through June (MAMJ). The data were quality controlled, converted into 1960–2009 trend estimates, and interpolated using a rigorous geo-statistical technique (kriging). Kriging produces standard error estimates, and these can be used to assess the relative spatial accuracy of the identified trends. Dividing the trends by the associated errors allows us to identify the relative certainty of our estimates (Funk and oth-ers, 2005; Verdin and others, 2005; Brown and Funk, 2008; Funk and Verdin, 2009). Assuming that the same observed trends persist, regardless of whether or not these changes are
• LongrainsincentralKenyahavedeclinedmorethan100millimeterssincethemid-1970s.ThisdeclineisprobablylinkedtowarmingintheIndianOcean,andseemslikelytocontinue.
• Theobserveddryingtendencyistheoppositepredictedbythe4thIntergovernmentalPanelonClimateChange(IPCC)assessment.
• Awarmingofmorethan1°Celsiusmayexacer-batedryingimpacts,especiallyinlowlandareas.
• Thedryingtrendscouldparticularlyimpactdenselypopulatedareastotheeast,north,andnorth-westofNairobi.
• CriticalsurpluscropgrowingareasinCentralKenyaarethreatened,andtheamountofprimearablelandcoulddiminishsubstantially.
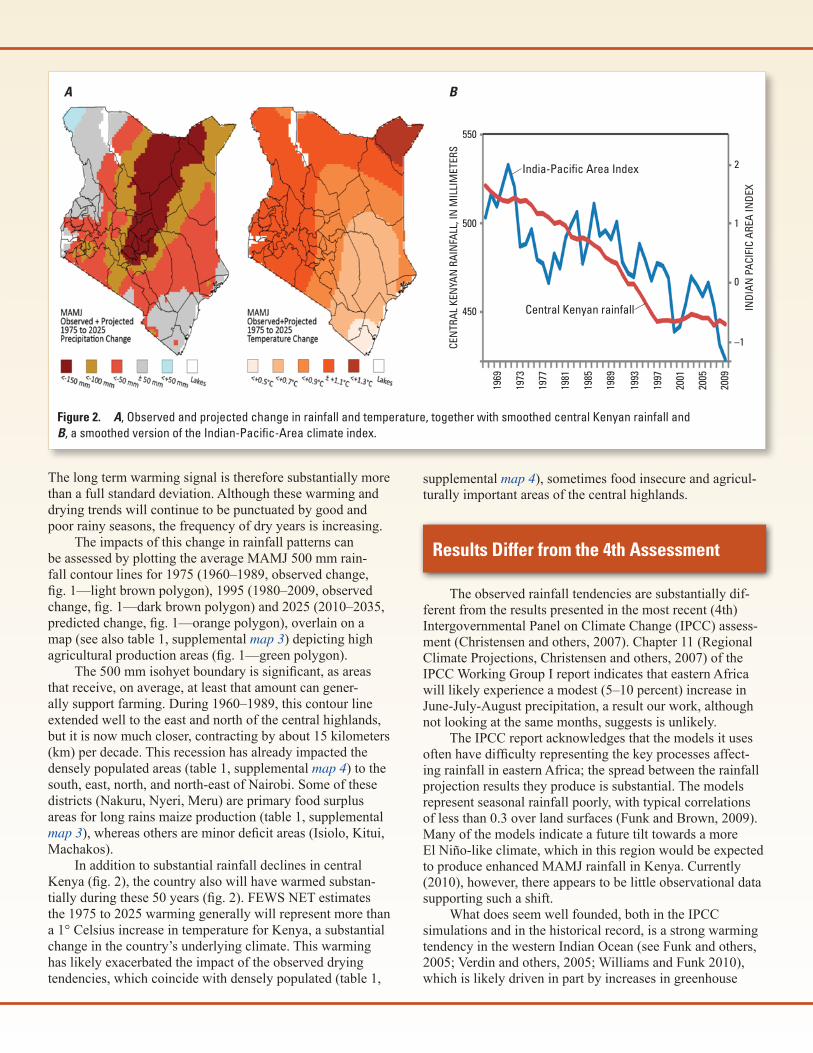
Figure 2. A, Observed and projected change in rainfall and temperature, together with smoothed central Kenyan rainfall and B, a smoothed version of the Indian-Pacific-Area climate index.
CEN
TRAL
KEN
YAN
RAI
NFA
LL, I
N M
ILLI
MET
ERS
550
500
450
2
1
0
–1
INDI
AN P
ACIF
IC A
REA
INDE
X
1969
1973
1977
1981
1985
1989
1993
1997
2001
2005
2009
A B
India-Pacific Area Index
Central Kenyan rainfall
The long term warming signal is therefore substantially more than a full standard deviation. Although these warming and drying trends will continue to be punctuated by good and poor rainy seasons, the frequency of dry years is increasing.
The impacts of this change in rainfall patterns can be assessed by plotting the average MAMJ 500 mm rain-fall contour lines for 1975 (1960–1989, observed change, fig. 1—light brown polygon), 1995 (1980–2009, observed change, fig. 1—dark brown polygon) and 2025 (2010–2035, predicted change, fig. 1—orange polygon), overlain on a map (see also table 1, supplemental map 3) depicting high agricultural production areas (fig. 1—green polygon).
The 500 mm isohyet boundary is significant, as areas that receive, on average, at least that amount can gener-ally support farming. During 1960–1989, this contour line extended well to the east and north of the central highlands, but it is now much closer, contracting by about 15 kilometers (km) per decade. This recession has already impacted the densely populated areas (table 1, supplemental map 4) to the south, east, north, and north-east of Nairobi. Some of these districts (Nakuru, Nyeri, Meru) are primary food surplus areas for long rains maize production (table 1, supplemental map 3), whereas others are minor deficit areas (Isiolo, Kitui, Machakos).
In addition to substantial rainfall declines in central Kenya (fig. 2), the country also will have warmed substan-tially during these 50 years (fig. 2). FEWS NET estimates the 1975 to 2025 warming generally will represent more than a 1° Celsius increase in temperature for Kenya, a substantial change in the country’s underlying climate. This warming has likely exacerbated the impact of the observed drying tendencies, which coincide with densely populated (table 1,
supplemental map 4), sometimes food insecure and agricul-turally important areas of the central highlands.
Results Differ from the 4th Assessment
The observed rainfall tendencies are substantially dif-ferent from the results presented in the most recent (4th) Intergovernmental Panel on Climate Change (IPCC) assess-ment (Christensen and others, 2007). Chapter 11 (Regional Climate Projections, Christensen and others, 2007) of the IPCC Working Group I report indicates that eastern Africa will likely experience a modest (5–10 percent) increase in June-July-August precipitation, a result our work, although not looking at the same months, suggests is unlikely.
The IPCC report acknowledges that the models it uses often have difficulty representing the key processes affect-ing rainfall in eastern Africa; the spread between the rainfall projection results they produce is substantial. The models represent seasonal rainfall poorly, with typical correlations of less than 0.3 over land surfaces (Funk and Brown, 2009). Many of the models indicate a future tilt towards a more El Niño-like climate, which in this region would be expected to produce enhanced MAMJ rainfall in Kenya. Currently (2010), however, there appears to be little observational data supporting such a shift.
What does seem well founded, both in the IPCC simulations and in the historical record, is a strong warming tendency in the western Indian Ocean (see Funk and others, 2005; Verdin and others, 2005; Williams and Funk 2010), which is likely driven in part by increases in greenhouse
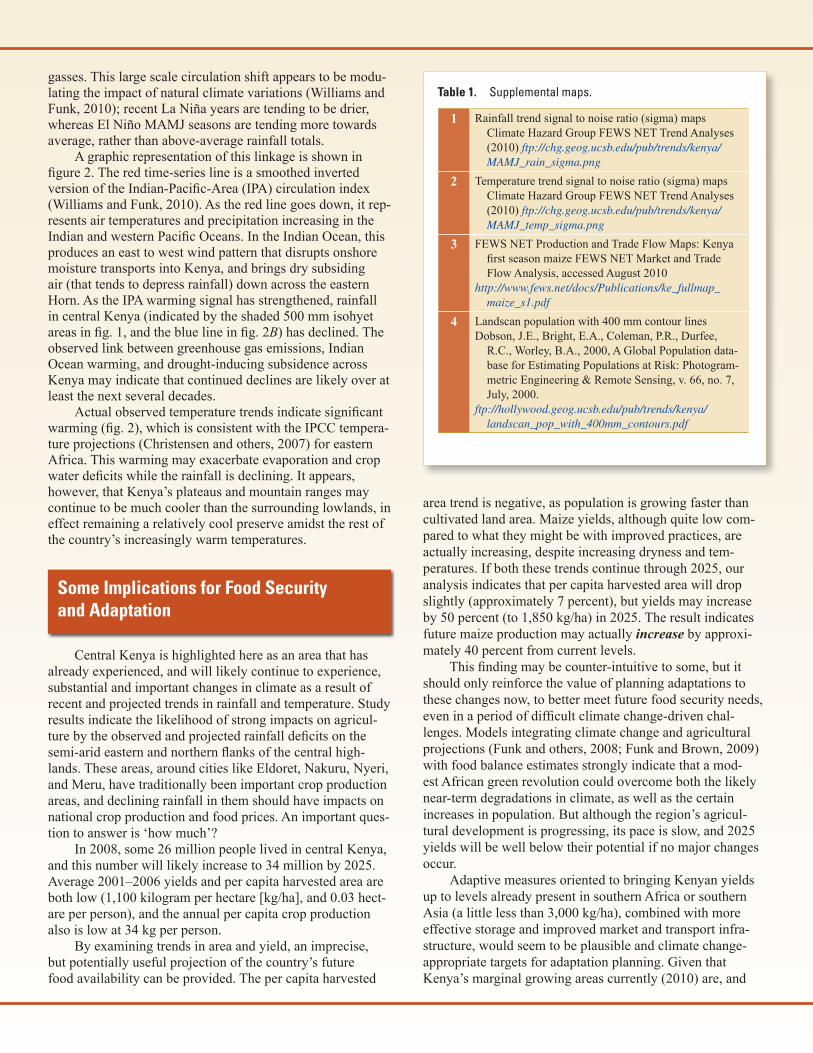
Table 1. Supplemental maps.
1 Rainfall trend signal to noise ratio (sigma) maps Climate Hazard Group FEWS NET Trend Analyses (2010) ftp://chg.geog.ucsb.edu/pub/trends/kenya/MAMJ_rain_sigma.png
2 Temperature trend signal to noise ratio (sigma) maps Climate Hazard Group FEWS NET Trend Analyses (2010) ftp://chg.geog.ucsb.edu/pub/trends/kenya/MAMJ_temp_sigma.png
3 FEWS NET Production and Trade Flow Maps: Kenya first season maize FEWS NET Market and Trade Flow Analysis, accessed August 2010
http://www.fews.net/docs/Publications/ke_fullmap_maize_s1.pdf
4 Landscan population with 400 mm contour linesDobson, J.E., Bright, E.A., Coleman, P.R., Durfee,
R.C., Worley, B.A., 2000, A Global Population data-base for Estimating Populations at Risk: Photogram-metric Engineering & Remote Sensing, v. 66, no. 7, July, 2000.
ftp://hollywood.geog.ucsb.edu/pub/trends/kenya/landscan_pop_with_400mm_contours.pdf
gasses. This large scale circulation shift appears to be modu-lating the impact of natural climate variations (Williams and Funk, 2010); recent La Niña years are tending to be drier, whereas El Niño MAMJ seasons are tending more towards average, rather than above-average rainfall totals.
A graphic representation of this linkage is shown in figure 2. The red time-series line is a smoothed inverted version of the Indian-Pacific-Area (IPA) circulation index (Williams and Funk, 2010). As the red line goes down, it rep-resents air temperatures and precipitation increasing in the Indian and western Pacific Oceans. In the Indian Ocean, this produces an east to west wind pattern that disrupts onshore moisture transports into Kenya, and brings dry subsiding air (that tends to depress rainfall) down across the eastern Horn. As the IPA warming signal has strengthened, rainfall in central Kenya (indicated by the shaded 500 mm isohyet areas in fig. 1, and the blue line in fig. 2B) has declined. The observed link between greenhouse gas emissions, Indian Ocean warming, and drought-inducing subsidence across Kenya may indicate that continued declines are likely over at least the next several decades.
Actual observed temperature trends indicate significant warming (fig. 2), which is consistent with the IPCC tempera-ture projections (Christensen and others, 2007) for eastern Africa. This warming may exacerbate evaporation and crop water deficits while the rainfall is declining. It appears, however, that Kenya’s plateaus and mountain ranges may continue to be much cooler than the surrounding lowlands, in effect remaining a relatively cool preserve amidst the rest of the country’s increasingly warm temperatures.
area trend is negative, as population is growing faster than cultivated land area. Maize yields, although quite low com-pared to what they might be with improved practices, are actually increasing, despite increasing dryness and tem-peratures. If both these trends continue through 2025, our analysis indicates that per capita harvested area will drop slightly (approximately 7 percent), but yields may increase by 50 percent (to 1,850 kg/ha) in 2025. The result indicates future maize production may actually increase by approxi-mately 40 percent from current levels.
This finding may be counter-intuitive to some, but it should only reinforce the value of planning adaptations to these changes now, to better meet future food security needs, even in a period of difficult climate change-driven chal-lenges. Models integrating climate change and agricultural projections (Funk and others, 2008; Funk and Brown, 2009) with food balance estimates strongly indicate that a mod-est African green revolution could overcome both the likely near-term degradations in climate, as well as the certain increases in population. But although the region’s agricul-tural development is progressing, its pace is slow, and 2025 yields will be well below their potential if no major changes occur.
Adaptive measures oriented to bringing Kenyan yields up to levels already present in southern Africa or southern Asia (a little less than 3,000 kg/ha), combined with more effective storage and improved market and transport infra-structure, would seem to be plausible and climate change-appropriate targets for adaptation planning. Given that Kenya’s marginal growing areas currently (2010) are, and
Some Implications for Food Security and Adaptation
Central Kenya is highlighted here as an area that has already experienced, and will likely continue to experience, substantial and important changes in climate as a result of recent and projected trends in rainfall and temperature. Study results indicate the likelihood of strong impacts on agricul-ture by the observed and projected rainfall deficits on the semi-arid eastern and northern flanks of the central high-lands. These areas, around cities like Eldoret, Nakuru, Nyeri, and Meru, have traditionally been important crop production areas, and declining rainfall in them should have impacts on national crop production and food prices. An important ques-tion to answer is ‘how much’?
In 2008, some 26 million people lived in central Kenya, and this number will likely increase to 34 million by 2025. Average 2001–2006 yields and per capita harvested area are both low (1,100 kilogram per hectare [kg/ha], and 0.03 hect-are per person), and the annual per capita crop production also is low at 34 kg per person.
By examining trends in area and yield, an imprecise, but potentially useful projection of the country’s future food availability can be provided. The per capita harvested
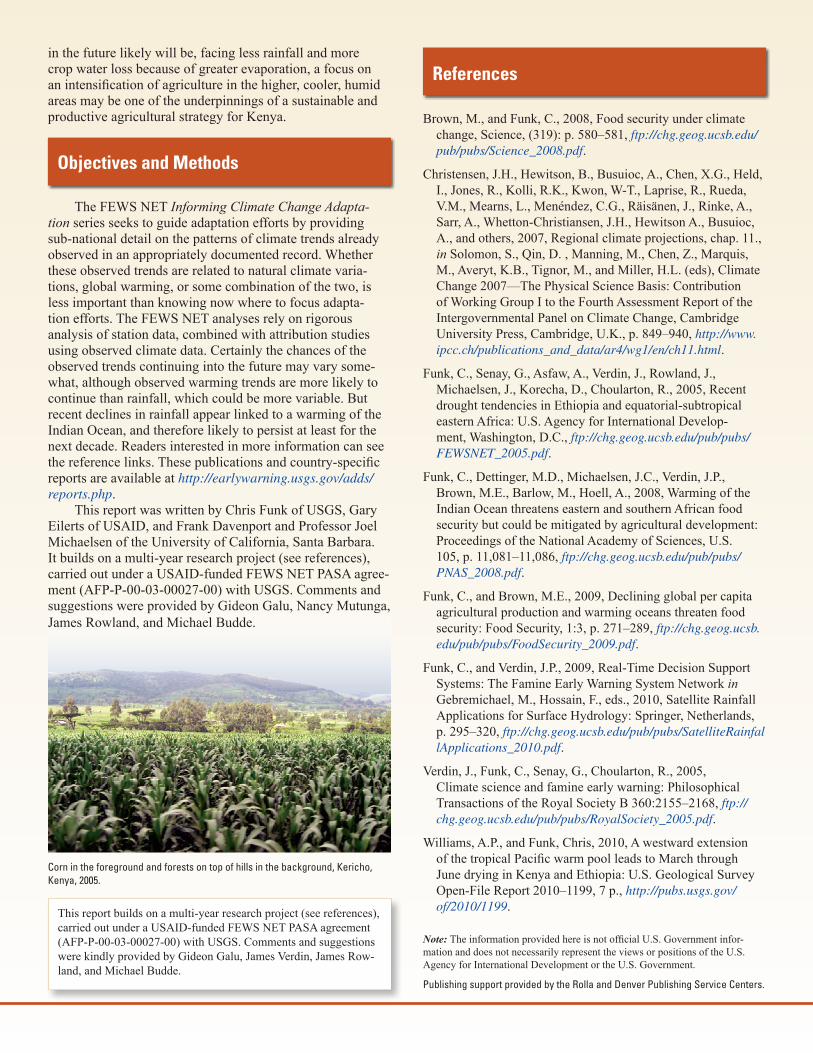
Corn in the foreground and forests on top of hills in the background, Kericho, Kenya, 2005.
in the future likely will be, facing less rainfall and more crop water loss because of greater evaporation, a focus on an intensification of agriculture in the higher, cooler, humid areas may be one of the underpinnings of a sustainable and productive agricultural strategy for Kenya.
References
Objectives and Methods
The FEWS NET InformingClimateChangeAdapta-tion series seeks to guide adaptation efforts by providing sub-national detail on the patterns of climate trends already observed in an appropriately documented record. Whether these observed trends are related to natural climate varia-tions, global warming, or some combination of the two, is less important than knowing now where to focus adapta-tion efforts. The FEWS NET analyses rely on rigorous analysis of station data, combined with attribution studies using observed climate data. Certainly the chances of the observed trends continuing into the future may vary some-what, although observed warming trends are more likely to continue than rainfall, which could be more variable. But recent declines in rainfall appear linked to a warming of the Indian Ocean, and therefore likely to persist at least for the next decade. Readers interested in more information can see the reference links. These publications and country-specific reports are available at http://earlywarning.usgs.gov/adds/reports.php.
This report was written by Chris Funk of USGS, Gary Eilerts of USAID, and Frank Davenport and Professor Joel Michaelsen of the University of California, Santa Barbara. It builds on a multi-year research project (see references), carried out under a USAID-funded FEWS NET PASA agree-ment (AFP-P-00-03-00027-00) with USGS. Comments and suggestions were provided by Gideon Galu, Nancy Mutunga, James Rowland, and Michael Budde.
Brown, M., and Funk, C., 2008, Food security under climate change, Science, (319): p. 580–581, ftp://chg.geog.ucsb.edu/pub/pubs/Science_2008.pdf.
Christensen, J.H., Hewitson, B., Busuioc, A., Chen, X.G., Held, I., Jones, R., Kolli, R.K., Kwon, W-T., Laprise, R., Rueda, V.M., Mearns, L., Menéndez, C.G., Räisänen, J., Rinke, A., Sarr, A., Whetton-Christiansen, J.H., Hewitson A., Busuioc, A., and others, 2007, Regional climate projections, chap. 11., in Solomon, S., Qin, D. , Manning, M., Chen, Z., Marquis, M., Averyt, K.B., Tignor, M., and Miller, H.L. (eds), Climate Change 2007—The Physical Science Basis: Contribution of Working Group I to the Fourth Assessment Report of the Intergovernmental Panel on Climate Change, Cambridge University Press, Cambridge, U.K., p. 849–940, http://www.ipcc.ch/publications_and_data/ar4/wg1/en/ch11.html.
Funk, C., Senay, G., Asfaw, A., Verdin, J., Rowland, J., Michaelsen, J., Korecha, D., Choularton, R., 2005, Recent drought tendencies in Ethiopia and equatorial-subtropical eastern Africa: U.S. Agency for International Develop-ment, Washington, D.C., ftp://chg.geog.ucsb.edu/pub/pubs/FEWSNET_2005.pdf.
Funk, C., Dettinger, M.D., Michaelsen, J.C., Verdin, J.P., Brown, M.E., Barlow, M., Hoell, A., 2008, Warming of the Indian Ocean threatens eastern and southern African food security but could be mitigated by agricultural development: Proceedings of the National Academy of Sciences, U.S. 105, p. 11,081–11,086, ftp://chg.geog.ucsb.edu/pub/pubs/PNAS_2008.pdf.
Funk, C., and Brown, M.E., 2009, Declining global per capita agricultural production and warming oceans threaten food security: Food Security, 1:3, p. 271–289, ftp://chg.geog.ucsb.edu/pub/pubs/FoodSecurity_2009.pdf.
Funk, C., and Verdin, J.P., 2009, Real-Time Decision Support Systems: The Famine Early Warning System Network in Gebremichael, M., Hossain, F., eds., 2010, Satellite Rainfall Applications for Surface Hydrology: Springer, Netherlands, p. 295–320, ftp://chg.geog.ucsb.edu/pub/pubs/SatelliteRainfallApplications_2010.pdf.
Verdin, J., Funk, C., Senay, G., Choularton, R., 2005, Climate science and famine early warning: Philosophical Transactions of the Royal Society B 360:2155–2168, ftp://chg.geog.ucsb.edu/pub/pubs/RoyalSociety_2005.pdf.
Williams, A.P., and Funk, Chris, 2010, A westward extension of the tropical Pacific warm pool leads to March through June drying in Kenya and Ethiopia: U.S. Geological Survey Open-File Report 2010–1199, 7 p., http://pubs.usgs.gov/of/2010/1199.
Note: The information provided here is not official U.S. Government infor-mation and does not necessarily represent the views or positions of the U.S. Agency for International Development or the U.S. Government.
Publishing support provided by the Rolla and Denver Publishing Service Centers.
This report builds on a multi-year research project (see references), carried out under a USAID-funded FEWS NET PASA agreement (AFP-P-00-03-00027-00) with USGS. Comments and suggestions were kindly provided by Gideon Galu, James Verdin, James Row-land, and Michael Budde.