Embed Size (px)
Citation preview
A circular economy for smart devices Opportunities in the US, UK and India

1
Summary 2
1. Introduction: good devices, bad systems 3
2. Six circular economy models 6
3. Market opportunities in the US, UK and India 21
4. The benefits of a circular economy for smart devices 26
5. Annex: methodology 33
Contents
2
Smartphones, tablets and laptops have moved from the fringe of computing to the mainstream in just five years. Sales of these smart devices exploded as consumers saw the benefits of seamless connectivity, and were drawn to the simplicity of new user interfaces. In many cases, the environment benefited too, as energy efficient devices displaced older computers, and new mobile-enabled cloud systems became platforms for efficiency across the economy.
Unfortunately, this isn’t the whole story. Smart devices are smart, but the physical systems they end up in are not: 89 per cent of mobile devices in the US were thrown into landfill in 2010, even though the resources they contain mean it is economically sensible to recycle them. Many millions of usable devices are left forgotten in drawers once their owners upgrade, despite a robust second-hand market. This wastes perfectly good devices, frustrates consumers and harms the environment.
But technologists don’t have to let their hard work end up as waste after a few short years. A circular economy for smart devices would keep them in use for longer. This
analysis reveals that a two year old flagship smartphone can be more attractive than today’s mid to low tier best sellers. It shows that repair makes economic and environmental sense for at least four years, and up to seven in some cases. And it demonstrates that keeping a mobile phone in use for just one extra year cuts its lifetime CO
2 impact by a third.
Just as there isn’t a single business model for smart devices, there isn’t a single route to a circular economy. Instead, this report sets out six circular economy business models that companies in different parts of the supply chain can experiment with. These range from software only changes to hardware redesign to enable existing parts to be used again. Even small design adjustments can make a huge difference: replacing a screen on the iPhone 3GS takes 15 minutes; on the less modular HTC One, it takes 90 minutes.
This report analyses US, UK, and Indian markets, identifying the most receptive consumers for the different circular economy models. In developed markets like the US and UK, second-hand phones could prove attractive to the roughly 40 per cent
of consumers without a smartphone, who tend to be older and less well off.
The saturated market for laptops, by contrast, would be better suited to circular economy models which keep laptops with a single user for longer.
In India, low labour costs and more standardised hardware in cheaper devices make harvesting parts a viable strategy. Similarly, India’s existing network of small electronics repairers would favour a decentralised, DIY repair approach.
There are huge circular economy opportunities for the makers of smartphones, tablets and laptops. With five billion potential customers seeking access to smart devices, companies that reduce their costs and environmental impact through circular strategies will prosper. The good news is that the tools to do so, as we outline in this report, are already at hand.
Summary

1 Introduction: good devices, bad systems

4
The technologists that created mobile computing started with a gloriously blank canvas. They used their creativity to design elegant, useful, and universally desirable new devices and systems. Their products are carried in billions of back pockets and bags across the wealthy world, and they are aiming to sell to the next five billion people, all of whom are eager to benefit from the information and communication that the internet provides.
But these ingenious people have sent their devices out into a world whose physical systems are designed with none of the elegance of their digital counterparts. The result is that old but usable laptops, tablets and smartphones are ending up in landfill or languishing in drawers, where they sit until they reach technological obsolescence. But clever devices deserve better than to become waste after just a couple of years of use: electronics and the cloud services that they connect to can be the source of the solution.
This report shows how companies across the mobile electronics supply chain can adopt a circular economy model to make money out of old devices, attract new
customers around the world, increase brand loyalty, and cut manufacturing costs and risks. Doing so would also help to cut electronic waste, carbon emissions and resource use.
The circular economy is already making moneyA circular economy for consumer electronics is already here. It has developed from the bottom up: the value of Apple devices sold on eBay in the US in 2013 was nearly $2 billion.2 NextWorth estimates the potential value of the US smartphone trade in market in 2014 to be over $3 billion.3
And it’s not just smartphones. WRAP estimated in 2013 that the value of two to three year old laptops in the UK was £720 million and two to three year old tablets were worth £90 million after any collection and repair costs were taken into account.4 Even when devices are no longer usable they have value: the market for IT spares and components is estimated to be greater than £10 million a year in the UK alone.5
Valuable resources are being lost1
89 per cent end up in landfillThe US threw away 141million mobile devicesin 2010, 89 per cent of them went to landfill
...while millions are discarded28-125 million phones languish unusedin the UK alone. This means for every phonein use, up to four sit in drawers unused
89%

5
The used device market is growing fast, with estimates of global used smartphone sales expected to rise from 53 million to 257 million between 2013 and 2018, driven by a doubling of trade-ins in the US.6 But these big numbers hide far greater potential: globally, only 12 per cent of smartphone upgrades involved the old device being sold or traded.
This is changing the market. Credible projections suggest that eight per cent of new sales will be cannibalised by reuse in 2018.7 Rather than seeing these trends as a threat, forward thinking companies could see them as a new opportunity.
They wouldn’t be alone: a growing number of independent trade-in businesses like Gazelle in the US and Mazuma in the UK are competing for old mobile devices on the ease, trust, and reliability of their service. Manufacturers are also beginning to enter the market, with Apple offering a trade-in service for iPhones and iPads in the UK, US and India, and Samsung running one for smartphones in India. But carriers, retailers and software providers also have an opportunity to grow the total size of the market by using their relationship with
consumers to recover more of the devices that would otherwise end up scrapped or stored away.
But it is not just about gaining more value. Manufacturers, software providers, retailers and carriers would benefit from building circular economy thinking into their business plans because it is popular with customers, helps to mitigate business risks, and dramatically cuts the environmental impact of devices: just keeping a smartphone in use for an additional year cuts its CO
2 impact by 31 per cent.
In this report we set out these benefits in detail, but if they are to be realised, companies will have to experiment with new, circular economy models.
We outline six models in chapter two (see page six), demonstrating how companies can adapt software, hardware and business models for a circular economy. They show the changes companies could make, which parts of the supply chain might benefit most and which consumers are likely to be most receptive.
In chapter three we provide a more detailed analysis of the US, UK and Indian markets, to show how circular models for smart devices meet the demands of their consumers.
Market predictions for traded-in and used smartphones to 2018
Trade-in Used
Upgraded smart phones either traded in or sold
25%50%
2013 2018 2013 2018
53 million usedsmartphonesales
257 million usedsmartphonesales

2 Six circular economy models

7
There is no single model for a circular economy in consumer electronics. The supply chain for mobile devices is complex, highly varied and still evolving.
Companies like Apple and Microsoft are vertically integrated across hardware and software; Samsung is even more tightly integrated across hardware, but largely reliant on others for software; Google is mostly a software company but is increasingly influencing hardware design; and carriers, like O
2 in the UK or AT&T in
the US, provide services but also occasionally produce hardware. There is similar diversity across the whole supply chain.
Rather than imposing a single model, this analysis builds on three types of intervention: hardware, software and business model changes. Each has a number of options, outlined in the tables on the left.
Using this framework, six combinations of hardware, software and business model options are set out in this chapter. All will increase the lifetime of older devices, but some will work better for different parts of
the supply chain than others. They are developed with information about why different supply chain actors might benefit from a particular model, and also which consumers might find them attractive.
The overall aim is to provide an interested company with enough information to experiment with different ways of becoming more circular.
The six models are:
1. Software led longevity
2. Better reuse
3. Minor modularity
4. Cloud offloading
5. Parts harvesting and remanufacturing
6. DIY repair
Hardware
No redesign
Battery and screen replacement
Cosmetic modularity (eg Nokia’s swappable shells)
Full modularity (eg Phonebloks)
Durability
Part compatibility
Software
No redesign
Simplified second life OS
Hardware diagnosis
Performance diagnosis
Collection prompting
Driver standardisation
Business model
No redesign
Leasing, eg device upgrades on schedule
Buy back
Servitisation, eg Chrome OS
Three types of intervention

8
Model 1 Software led longevity
Out of date software means usable hardware provides a second rate experience, with reduced features, limited app compatibility and security vulnerabilities. This reduces reuse opportunities: twenty per cent of consumers say that they replace a device when there are no more software updates for the old one.8 Updates are a significant factor in a device’s resale value: The LG G2, which has no guarantee of timely software updates, is worth 15 per
cent less than the almost identical Google Nexus, which does.9
Research firm Bernstein notes that smartphones with unsupported operating systems have “limited to no resale value.”10 This is a major barrier to reuse: 63 per cent of Android and 54 per cent of Windows Phone devices are running two year old versions; 19 per cent and 17 per cent, respectively, are running three year old versions.11
Hardware
No redesign
Battery and screen replacement
Cosmetic modularity (eg Nokia’s swappable shells)
Full modularity (eg Phonebloks)
Durability
Part compatibility
Software
No redesign
Simplified second life OS
Hardware diagnosis
Performance diagnosis
Collection prompting
Driver standardisation
Business model
No redesign
Leasing, eg device upgrades on schedule
Buy back
Servitisation, eg Chrome OS
Name Manufactured Support ended Months supported
Nexus One January 2010 September 2011 20
Nexus S December 2010 October 2012 22
Galaxy Nexus November 2011 July 2013 20
iPhone June 2007 February 2010 32
iPhone 3G July 2008 November 2010 28
iPhone 3Gs June 2009 February 2014 56
iPhone 4 June 2010 March 2014 45
iPad April 2010 May 2012 25
Nokia Lumia 800 November 2011 November 2012 12
Nokia Lumia 900 April 2012 November 2012 7
HTC HD7 October 2010 November 2012 25
HTC Titan October 2011 November 2012 13
9
Eighteen month old iPhones on average retain 53 per cent of their value, versus 42 per cent for Android flagships.12 iPhone software support lasts on average 16 months longer.
The circular economy strategy to solve these problems has two potential routes: the first would be simply to extend and guarantee software support for longer. The second is to develop a lighter weight second life firmware for older devices. This could possibly involve turning off certain features like visual transitions, skins, gesture controls, widgets and cloud syncing, for example, and then either selling second-hand devices with more limited functionality to market segments that would buy lower tier devices, or providing this as an additional ‘keep your device fast’ service for existing users for free or for a small upgrade fee.
A version of this model exists already, with tech savvy users switching to Cyanogenmod or other custom firmware for mobiles and tablets, or less resource intensive PC operating systems like Lubuntu for laptops. And developing software shouldn’t be expensive: Cyanogenmod is estimated to
have cost $44 million to code and LXDE $1.6 million.13
Which parts of the supply chain benefit?
Software producersCompanies that make money through the use of a device (eg Google via Android, Apple via iTunes, and other digital services and app developers) already have incentives to give customers up to date software: showcasing the best features of the OS, enabling wider choice of apps and better data analytics, and avoiding reputational risks from security breaches. The challenge for them lies in diverting funding to a second life operating system, and securing agreement from hardware providers either to open source hardware drivers or to provide continued support for these over time.
ManufacturersManufacturers have less direct incentive to support second life operating systems, as they make money based on device sales, not device lifetime. However, indirect reasons to provide software support include:
• Customer frustration: customers who replace a device due to frustration with
outdated software are less likely to buy their next device from the same manufacturer. HTC has recognised this and promised to support software for two years after release.14
• User experience: this is a differentiating factor among brands as prices drop, markets become saturated and hardware innovation slows.15 Software support for previous generations of iPhones has been part of Apple’s strategy of leading the market in customer experience.16
• Maintaining value: consumers prefer products with higher resale values.17 Some users buy devices with a plan to sell them afterwards; others use resale value as the best indication of the quality of the product.18
Where’s the market?In the US and UK, simply extending software updates would be popular with consumers who buy new hardware infrequently, such as lower socioeconomic groups or those using prepaid plans with unsubsidised devices.19 Also, it would be popular with the increasing number of people who sell devices on after first use.20
In India, extended software support is becoming a defining feature of lower specification phones which can’t compete on hardware with premium models. For instance, Chinese manufacturer Xiaomi is focusing explicitly on providing the latest Android OS to all device users, rather than competing solely on specifications.21 Google’s Android One programme will guarantee regular updates by providing hardware standards for companies, such as budget Indian manufacturers Micromax and Karbonn.22
A used device with second life firmware would be most attractive for those in the US or UK who don’t already own a smartphone or tablet. This includes low income consumers, or those who would prefer a simpler device;23 for example, the over 65s market, which makes up around a sixth of the population of the UK.24
Similarly, in India, older devices with second life firmware would suit those who are looking to enter the market for the first time and would like a working device at minimal cost. Older devices could easily compete with the $35 Cloud FX mobile phone, for example.25

10
Model 2 Better reuse
Globally, there is no shortage of demand for second-hand devices, yet millions of phones sit in drawers in the US and the UK, while the same models fetch high prices on eBay. Between 27 per cent and 36 per cent of US consumers said they keep an old phone because they “don’t know what to do with it.” Seventeen per cent were just “too lazy” to get rid of them.26 The key to maximising the value and environmental benefits of reuse is to retrieve used devices as early as possible, although there is value
in many devices for over five years from the original sale date.
This model would use two software tools to supply more used devices to the people who want to buy them.
The first would be a hardware diagnosis app which would measure water damage, memory errors, charge cycles and battery lifetime, impact Gs, number of reboots, etc. These data could either directly determine
the condition of the device, or be used as a proxy for likely damage. For example, a tablet which receives above a certain number of impact Gs is likely to be damaged. This would reduce the cost of assessing second-hand devices and increase confidence in their quality.
The second tool would address the lack of awareness and hassle factor preventing greater reuse. It would do so by prompting consumers to sell their old device, displaying its value on a range of different buyback services, like eBay, Mazuma, or Gazelle. It would need to offer very simple collection options, building on recent improvements in delivery systems for online shopping, including Collect+, Amazon lockers, the post office network, or home delivery.
Ideally, selling would be a simple, one click action, using geolocation to offer the nearest drop off point, automatically deducting postage charges and providing packaging, securely wiping data and immediately crediting the user’s bank account.27 The trigger for such a prompt could be set based on contract length, as with existing upgrades, or could be based
Profit from reuseHardware
No redesign
Battery and screen replacement
Cosmetic modularity (eg Nokia’s swappable shells)
Full modularity (eg Phonebloks)
Durability
Part compatibility
Software
No redesign
Simplified second life OS
Hardware diagnosis
Performance diagnosis
Collection prompting
Driver standardisation
Business model
No redesign
Leasing, eg device upgrades on schedule
Buy back
Servitisation, eg Chrome OS
0 1 2 3 4 5 6
50
100
150
200
250
100
200
300
400
500
iPhoneSale price
Profit
iPad
MacBook
Android phone
Android tablet
Years
Cost of acquiring
800
1,200
1,600
2,000
400
100
200
300
400
500
100
200
300
400
500
$
$
$
$
$

11
on sim card swapping, Google or iCloud registration of a new device, or could even prompt a user when a device hasn’t been used for a period of time.
This model would be most likely to work for smartphones and tablets, where information about device usage is routinely collected already and upgrade cycles have not yet matched the technical obsolescence of the underlying product.
Which parts of the supply chain benefit?Manufacturers, carriers or retailers could capitalise on the high value of unused devices: up to $58 billion of unused US and UK smartphones alone.28 However, as the market develops it is likely to become highly competitive, with schemes being subject to a significant network effect.
ManufacturersRelatively new second-hand devices can be used internally by manufacturers, as a replacement for insurance claims or warranty returns.29 Older devices can be sold to consumers in the developing world to attract new users to the ecosystem who could buy new devices in the future.30
Carriers and retailersBenefits are likely to be higher for carriers: retailers like mobiles.co.uk already offer six month old refurbished devices on contracts that cost 15 per cent less than normal contracts, addressing a more price sensitive market segment.
The biggest challenge for this model is that the software provider is probably best placed to develop and deliver both hardware diagnosis and software prompting services. This is because it sees when users change their devices, is a neutral party when presenting different end of life buyback options and already collects user data, which may be relevant to hardware diagnosis. However, it has the least to gain from doing so at present. But, as e-waste collection requirements expand, it is possible to imagine that software providers could offer collection prompting as a core feature of an operating system, in exchange for a service fee or as part of the attractiveness of a software ecosystem.
Where’s the market?The problem of unused devices not getting into second-hand markets is currently a first world problem. Informal reuse, repair
and recycling is mostly very effective in India.31 Of the smartphones collected through trade-in programs in the developed world, 30 per cent are sold in developed markets and 70 per cent are sold in emerging markets, as export costs are cheap and brand name devices are in high demand.32, 33, 34 A similar pattern holds for laptops and tablets.35
It is likely that Apple already sells factory refurbished phones from developed markets to India.36 It is able to do this easily as it controls hardware, software and has substantial power over carriers. A similar model could be used for mid-range devices from other manufacturers, which could compete with low cost Indian and Chinese products to attract first time buyers.
In the US and UK, there is an opportunity for manufacturers to sell used devices to compete directly with budget devices. For example, the Samsung Galaxy SIII, released in May 2012, has similar specifications to the Moto E, released in May 2014, and commands a similar price.37 Potential market segments to target include:
• the third of US and UK customers who cite value for money as most important when choosing a mobile device, plus those who don’t own one at all due to cost: in the US, 59 per cent of 18 to 29 year olds without a smartphone don’t own one because it’s too expensive;38
• prepaid customers who don’t have access to a subsidised device on contract;
• the 30 per cent of the UK population who are ‘gadget lovers’ and want to experience a more premium model or upgrade more often than they could afford to with new devices; and39
• corporate customers, who are “increasingly willing to give employees like-new refurbished phones that are cheaper than new phones.”40

12
Model 3 Minor modularity
Second-hand devices requiring minor repair are worth repairing for three to five years after sale, even after logistical and refurbishment costs are taken into account. But there is huge variation in the cost of repair: many devices don’t have easily removable batteries or replaceable screens, as designers favour slimness over repairability.
Screen and battery replacements are the most frequently needed repairs for a range of devices: 85 per cent of iPhone repairs are for cracked screens according to iCracked.41 According to WRAP, 73 per cent of tablets requiring repairs only need battery or screen replacements.42
Lack of battery life limits the attractiveness of phones, with 71 per cent of consumers putting a long lasting battery as the most important feature desired in a new phone, compared to internet access (57 per cent) and a high specification camera (41 per cent).43 Laptops are much less likely to need screen replacement but would benefit from an easily replaceable battery.44, 45
Profit from minor modularityHardware
No redesign
Battery and screen replacement
Cosmetic modularity (eg Nokia’s swappable shells)
Full modularity (eg Phonebloks)
Durability
Part compatibility
Software
No redesign
Simplified second life OS
Hardware diagnosis
Performance diagnosis
Collection prompting
Driver standardisation
Business model
No redesign
Leasing, eg device upgrades on schedule
Buy back
Servitisation, eg Chrome OS
0 1 2 3 4 5 6
50
100
150
200
250
Sale price
Profit
Cost of acquiring
100
200
300
400
500
iPhone
MacBook
Android phone
Android tablet
iPad
Years
100200300400500600
400
800
1,200
1,600
2,000
100
200
300
400
500
$
$
$
$
$

13
In this model, minor modularity means that batteries and screens are designed to be easily replaceable. More modular devices would have substantially cheaper repair costs. According to iFixit, replacing a screen on the iPhone 3GS takes 15 minutes versus 90 minutes on the HTC One.46 This sixfold difference has a huge impact given the frequency of these repairs and the fact that labour cost is the main constraint on repair. The trade off in thickness, at least comparing the iPad and Google Nexus 7, appears to be just one millimetre.47
Which parts of the supply chain benefit?
ManufacturersThere are three main benefits for manufacturers:
• Brand loyalty: 95 per cent of iFixit users say successful repair makes them more likely to buy another product from the same manufacturer.48 Customers have high expectations of reliability for electronics products and are frustrated if they break, so easy repair may go some way to reducing this frustration.49
• Higher resale value: as mentioned in model one, higher resale value will add brand value.
• Low cost style differentiation: the worldwide popularity of the Nokia 520, which comes in bright colours with swappable shells to ‘match your outfit’ indicates there could be an appetite for devices that include modular covers, in addition to screens and batteries.50, 51 Swappable covers for second-hand devices could refresh the style of an older core, boosting the attractiveness of refurbished devices.
Where’s the market?A manufacturer that adopts minor modularity could attract two types of customers, in addition to those consumers identified as potential purchasers of second-hand devices in the ‘better reuse’ model.
The first group could be attracted on the basis of longer lived devices. This could encompass the 70 per cent of people in the UK who don’t prioritise owning the latest gadgets, the third who buy accessories to prevent their screen from scratching and
the 70 per cent frustrated with battery life, who might benefit from changing the battery as their device gets older.52, 53 The large amount of repair activity in India suggests that Indian consumers would find minor modularity attractive (see model six for more details.)
The second group is those who are upgrading for reasons of style differentiation: for example, 45 per cent of German consumers replace devices because “there is a new model on the market”54. For some, a superficial change could be enough.
Similarly, the 16 per cent of UK consumers that prioritise stylish design when choosing a device may be interested in only changing the exterior look of the device.
The enduring popularity of Nokia models in India suggests that changeable cases may be of interest to Indian consumers, more of whom choose devices based on style than on price, according to one survey.55

14
Model 4 Cloud offloading
This model accelerates the trend of offloading functionality to the cloud, seen in software like Dropbox, Evernote, Google Docs, Opera Mini and others. This is done by shifting away from selling a device and access to the cloud (the traditional smartphone model) or device only (common for tablets and laptops). Instead, it promotes servitisation: selling a service that bundles access, device and performance together.
In practice, this might mean paying for a service package that provides access to a device; guaranteed application load times; compatibility with MS Office; access to specialist software; 3G and WiFi connectivity and minimum battery life.56
Offloading tasks to the cloud means older hardware can be used, including second-hand devices. More durable hardware could be helpful, and performance diagnosis software would need to be integrated to ensure that the agreed service commitments (eg speed to load webpages) were met.
Network coverage and latency are the main challenges for this model, but elements of
cloud offloading already apply to all device types: Opera Mini can speed up browsing on smartphones; Kindle Fire tablets offload web browsing tasks to Amazon’s EC2 cloud; and ChromeOS and Citrix demonstrate that lower power laptops can meet the needs of some consumers.
Even the most latency sensitive applications, like video gaming, are offloading tasks to the cloud: the Xbox One offloads processing to Microsoft’s Azure cloud.57 This suggests the network has caught up. The challenge is to extend this trend and to target second-hand hardware more explicitly.
Which parts of the supply chain benefit?
Service providersCloud offloading offers an opportunity to grow based on providing an integrated service, rather than simply competing on data bandwidth, while reducing total service cost by using cheaper second-hand devices. However, software developers are the early movers in providing the cloud based services that any servitised model would require.
Hardware
No redesign
Battery and screen replacement
Cosmetic modularity (eg Nokia’s swappable shells)
Full modularity (eg Phonebloks)
Durability
Part compatibility
Software
No redesign
Simplified second life OS
Hardware diagnosis
Performance diagnosis
Collection prompting
Driver standardisation
Business model
No redesign
Leasing, eg device upgrades on schedule
Buy back
Servitisation, eg Chrome OS

15
ManufacturersThe main benefit of cloud offloading may be to lower cost, less established manufacturers, who could focus on durable, lower specification new and remanufactured devices rather than going into direct competition with manufacturers who are competing on high cost, high specification new devices.
Where’s the market?Cloud computing and servitisation exist already, but they don’t often use second-hand devices. However, the majority of consumers (70 per cent in the UK) don’t “love buying gadgets”,58 and many others want only a limited set of features. Examples include:
• lower socioeconomic groups or those looking to spend as little as possible on a device, as this model could work out much cheaper, eg currently Chromebooks are available for $200-400, while regular notebook prices start around $400;59
• consumers confused by the range of new devices who would rather only choose the service, especially if they only plan to use basic features.60 For example, 57 per
cent of over 65s without a smartphone perceive no need or relevance for new devices while a further 13 per cent say they are too complicated;61a targeted device with the right features could attract these customers; and
• business customers who have a high turnover of different users on the same devices, or who require the strong data security enabled by not processing data locally.
Cloud offloading could also apply to facilities where data control is important and tasks are limited. One example might be using second-hand tablets for medical records management in hospitals or for warehouse stock management. Existing successful cloud models for laptops are in education and large businesses with a limited range of use cases. Unfortunately, relatively patchy 3G networks in India limit cloud offloading at present.62

16
Model 5 Parts harvesting and remanufacturing
This model would extend the minor modularity envisaged in model three to include improved disassemblability and compatibility of additional components.
This would enable the reuse of components when the device is otherwise not able to be repaired. It would keep high embodied carbon components, such as integrated circuits, which contribute 35 per cent of a smartphone’s carbon footprint, in use for longer.63
Embodied carbon in laptop components
This model could be most useful for slowly evolving technologies, such as mid-range cameras and power supplies, as well as components that break easily, such as micro USB connectors, laptop power connectors and radio modules for WiFi and Bluetooth.
Used components could be used in new or remanufactured devices, or in secondary markets.64 For a detailed breakdown of the carbon impacts of repair, see chapter four.
Hardware
No redesign
Battery and screen replacement
Cosmetic modularity (eg Nokia’s swappable shells)
Full modularity (eg Phonebloks)
Durability
Part compatibility
Software
No redesign
Simplified second life OS
Hardware diagnosis
Performance diagnosis
Collection prompting
Driver standardisation
Business model
No redesign
Leasing, eg device upgrades on schedule
Buy back
Servitisation, eg Chrome OS
Low carbon
Plastic 5 kgCO2e/kg
High carbon
Camera 370 kgCO2e/kg
Display 360 kgCO2e/kg
17
Currently, disassembly is common for expensive servers but uneconomic for most mobile devices in the US and UK, due to a combination of high labour costs and design choices that favour slimness over disassemblability.65 Even in China, which has wages only somewhat higher than India, complete disassembly may become uneconomic by 2015, with limited disassembly ceasing to be economic by 2026.66
This suggests there is a window of opportunity for manufacturers to remanufacture devices over the next decade in India, starting with existing devices, while they redesign devices to ensure that partial disassembly is economic in the longer term, for example to extract the camera.
Pressure to produce low cost devices is already leading to component standardisation in Android One devices. The limited range and high popularity of Apple products also makes component reuse possible.
However, there are a number of barriers to expanding remanufacturing. On the
hardware side, components’ size, shape and connectivity need to be standardised. On the software side, a lack of available drivers is the main challenge: although Windows and Linux are able to dynamically load drivers, tablets and smartphones have architectures which require device specific kernels. There is no technical reason why this couldn’t change, as Google’s Project Ara, which uses dynamically loading drivers, shows.67 However, the more fundamental challenge is to extend the availability of drivers, most of which are developed by component manufacturers and are only provided under licence to original equipment manufacturers (OEMs).68
Which parts of the supply chain benefit?
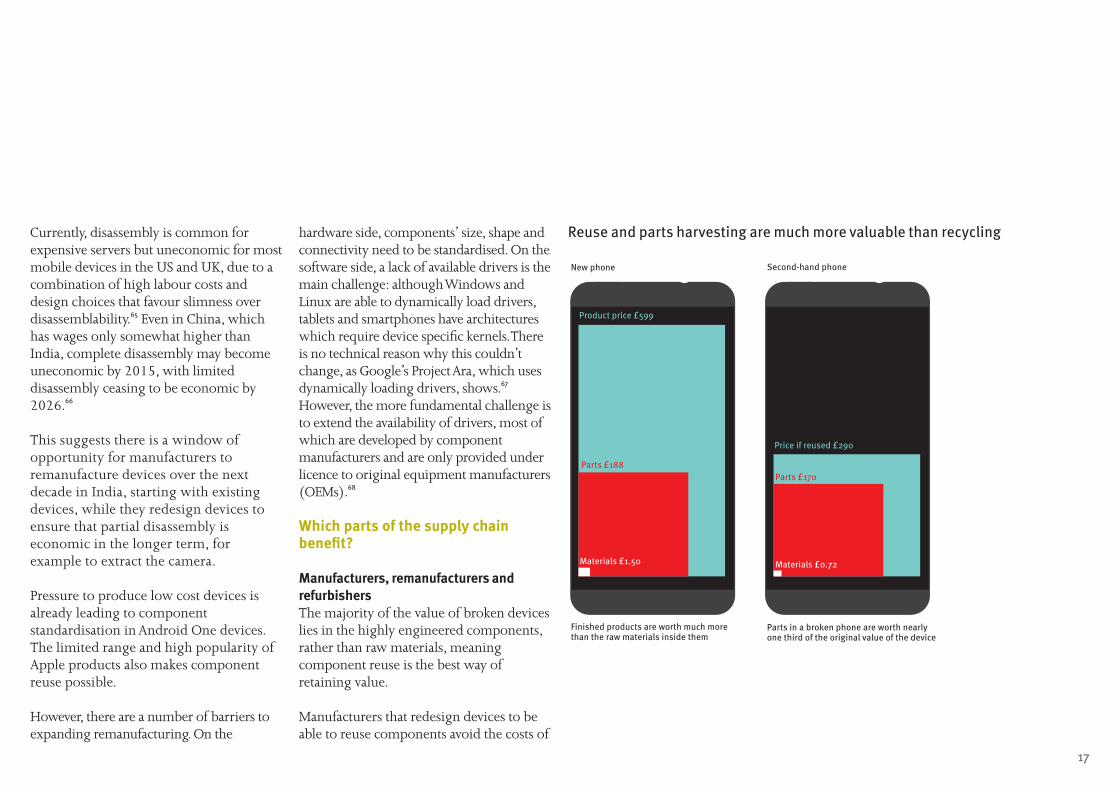
Manufacturers, remanufacturers and refurbishersThe majority of the value of broken devices lies in the highly engineered components, rather than raw materials, meaning component reuse is the best way of retaining value.
Manufacturers that redesign devices to be able to reuse components avoid the costs of
Parts in a broken phone are worth nearlyone third of the original value of the device
Second-hand phone
Finished products are worth much more than the raw materials inside them
New phone
Product price £599
Price if reused £290
Parts £188
Materials £1.50
Parts £170
Materials £0.72
Reuse and parts harvesting are much more valuable than recycling
18
producing new parts. The same is true for remanufacturers and refurbishers. An apt metaphor is the car industry: cars are readily disassemblable; and many parts are compatible across generations and model types. The result is a robust market for spare parts and substantial profits for remanufacturers.
At the same time, raw material prices have risen dramatically as well, particularly for specialty metals. Reuse of components is an opportunity to hedge against material risks (see chapter four.)
Carriers and retailersBecause of high labour costs in the US and UK, dramatic design changes would be required to increase parts harvesting and remanufacturing significantly.
The most obvious way to justify such a redesign would be for a manufacturer and a carrier or retailer to form a partnership for leased devices. This would enable devices to come back to the manufacturer and savings to be shared between the manufacturer and the retailer or carrier.
Where’s the market?The UK’s Centre for Remanufacturing and Reuse notes that remanufacturing is at its most successful when it is most hidden, due to consumer perceptions about the reliability of remanufactured goods.69 Certainly, in the US and UK markets, remanufacturing would work best if it were invisible to the consumer, with full new warranties applying to devices that contain remanufactured parts.
In India, device and component reuse is higher than in developed markets, and some generic components are already used. For example, Micromax buys Mediatek or Snapdragon processors for budget devices rather than custom building them.70, 71
This suggests that a more explicit strategy of leasing phones to consumers could be successful. Such a leasing model could promise that the recovered components from a traded-in phone will be used to reduce the cost of a new phone, provided consumers stick with the same manufacturer. This could be done via online channels, but as these account for only ten per cent of sales, manufacturers may wish to partner with brick and
mortar retailers for distribution and reverse logistics.
Opportunities for parts use in secondary markets include redeploying screens and cameras for low cost devices, and using laptop batteries to power off-grid LED lighting, a secondary use which has already been trialled in Bangalore.72

19
Model 6 DIY repair
In addition to screen and battery replacements, for which there is robust UK data, interviews with the Restart Project and iFixit suggest that some consumers replace their tablets and laptops early due to maintenance issues like dust blocking fans, laptop hinge failures, crumbs stopping keys from working or damaged power ports, which they find difficult or impossible to fix.
Redesigning devices for repairability, and providing information on how to repair them, would enable customers to address these problems themselves. However, many IT manufacturers have resisted such an approach: Toshiba has refused to release its repair manuals, citing intellectual property rights and Apple has developed proprietary screws to prevent customers from opening their devices.73, 74
Which parts of the supply chain benefit?
Manufacturers, refurbishers and repairersThis model is the most challenging for manufacturers: DIY repair provides very limited opportunities to make money from longer lived devices. Nevertheless, there are
some benefits. Consumers find it frustrating to throw devices away because of minor breakages that can’t easily be repaired.
Ninety five per cent of iFixit users say successful repair makes them more likely to buy another product from the same manufacturer.75, 76
Dell makes repairability a unique selling point, providing extensive support including interactive video teardowns.77, 78
And DIY repair can help to cut the cost of servicing warranty repairs. Dyson, for example, designs for repair, sells spare parts and provides guidance on how to repair its appliances via a call centre.79 The benefits of this to refurbishers or repairers are obvious.
CarriersCarriers should be largely unaffected except in so far as they make money on mobile phone insurance, as greater repairability may decrease sales of insurance.
Hardware
No redesign
Battery and screen replacement
Cosmetic modularity (eg Nokia’s swappable shells)
Full modularity (eg Phonebloks)
Durability
Part compatibility
Software
No redesign
Simplified second life OS
Hardware diagnosis
Performance diagnosis
Collection prompting
Driver standardisation
Business model
No redesign
Leasing, eg device upgrades on schedule
Buy back
Servitisation, eg Chrome OS
20
Where’s the market?In the US and UK, greater repairability would appeal to those who are prepared to repair their devices, which is currently around ten per cent of customers.80 As this increases the resale value of devices, it would benefit all customers, especially for those devices subject to slower upgrade cycles, like laptops and tablets.
In India, there is a stronger culture of repair and an expectation that devices should be reliable and easily serviceable.81 For consumer electronics this is done mainly through a large network of small traders across the country, though increasingly it is also offered by branded service centres.82
For example, Micromax has started to compete on repair speed, aiming to reduce the turnaround time to less than seven days from the current 15 by tripling the number of its centrally run service centres and piloting a home pick-up and drop off service.83
India’s geography, consumers’ preferences for quick turnaround times on repair and the prevalence of informal face to face interactions, mean that, if devices were
more widely repairable in a decentralised or DIY capacity, then maximum repairability, user satisfaction and brand loyalty could be ensured.84

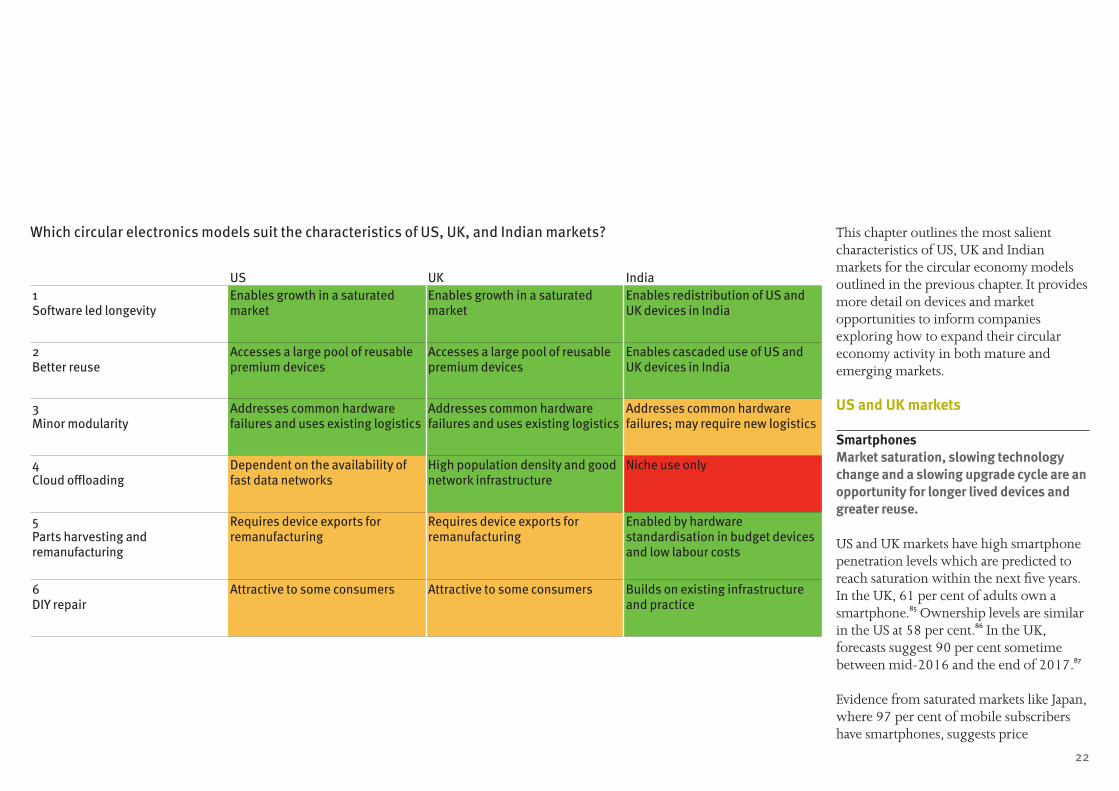
3 Market opportunities in the US, UK and India
22
This chapter outlines the most salient characteristics of US, UK and Indian markets for the circular economy models outlined in the previous chapter. It provides more detail on devices and market opportunities to inform companies exploring how to expand their circular economy activity in both mature and emerging markets.
US and UK markets
Smartphones Market saturation, slowing technology change and a slowing upgrade cycle are an opportunity for longer lived devices and greater reuse.
US and UK markets have high smartphone penetration levels which are predicted to reach saturation within the next five years. In the UK, 61 per cent of adults own a smartphone.85 Ownership levels are similar in the US at 58 per cent.86 In the UK, forecasts suggest 90 per cent sometime between mid-2016 and the end of 2017.87
Evidence from saturated markets like Japan, where 97 per cent of mobile subscribers have smartphones, suggests price
US UK India1 Software led longevity
Enables growth in a saturated market
Enables growth in a saturated market
Enables redistribution of US and UK devices in India
2 Better reuse
Accesses a large pool of reusable premium devices
Accesses a large pool of reusable premium devices
Enables cascaded use of US and UK devices in India
3 Minor modularity
Addresses common hardware failures and uses existing logistics
Addresses common hardware failures and uses existing logistics
Addresses common hardware failures; may require new logistics
4 Cloud offloading
Dependent on the availability of fast data networks
High population density and good network infrastructure
Niche use only
5 Parts harvesting and remanufacturing
Requires device exports for remanufacturing
Requires device exports for remanufacturing
Enabled by hardware standardisation in budget devices and low labour costs
6 DIY repair
Attractive to some consumers Attractive to some consumers Builds on existing infrastructure and practice
Which circular electronics models suit the characteristics of US, UK, and Indian markets?

23
competition will sharpen: “[Retailers] get aggressive on pricing, and then when the excitement fades, they move on to the next hit.” Budget models are already seeing strong sales in the US and UK.88
Ownership patterns show significant differences in take-up across age groups. For example, 88 per cent of 16-24 year olds owned smartphones in 2014 in the UK, compared to 14 per cent of those over 65.89 The pattern is similar for US consumers.90 This suggests that older and less well off consumers are the next potential markets for smartphones.91 However, the majority of these consumers identify a lack of need or relevance for new smartphone features, saying “they don’t think they’ll make use of the advanced features, or think they’ll find it too complicated.”92, 93, 94
As hardware innovation slows, competition among manufacturers based on technological features decreases in importance.95 Price is an important driver: the top selection criterion for buying mobile devices in both markets is “value for money” (UK 28 per cent and US 30 per cent).96 This doesn’t mean premium devices
will disappear: two thirds of UK smartphone users own Apple and Samsung devices. But even premium devices may struggle to maintain premium prices.97
Taken together, market saturation and the slowing pace of technology change for high end models suggest that the next round of smartphone sales could be served by lower cost, lower specification, second-hand devices.
The structure of the carrier market is reinforcing this opportunity. Smartphone replacement rates are influenced by the carrier refresh cycle, which are slowing in the US and UK. Most customers in the US (75 per cent) and UK (58 per cent) are on postpaid contracts and, in the US, contract periods have moved from 18 to 22 months, to match the UK’s 24 months.98, 99
At the same time, US and UK carriers are now offering early upgrade options, after 12 or even six months, which rely on the device being traded-in, creating a pool of lightly used devices available for reuse.100, 101
On the prepaid side of the market, countries with higher numbers of
prepaid consumers tend to have longer upgrade cycles, and the US has seen a rise in prepaid plans, which may slow the pace of upgrades.102, 103
Tablets The slowdown in demand for premium tablets, alongside strong demand for low cost tablets suggests reused premium tablets could displace new low cost ones.
The sale of tablets in both markets is sharply on the rise. 44 per cent of households in the UK had a tablet in 2014, up from 24 per cent in 2013.104 In the US, ownership grew from three per cent in 2010 to 42 per cent in 2014.105
As with smartphones, there is a marked difference between age groups, with the over 65s being an untapped market, and variation amongst socioeconomic groups, with 26 per cent of US households earning under $30,000 owning a tablet compared to 65 per cent of households with income above $75,000, suggesting price is an important restraint on ownership.106
Global research from Strategy Analytics suggests the tablet market is separating into
two types: “the branded side, which is slowing, and the low cost which is continuing to grow… The branded side is struggling because it’s already taken the low hanging fruit of people who had netbooks, who moved swiftly to tablets.”107 Tablet refresh cycles are roughly two and a half years but are predicted to lengthen, in the same way as PCs and laptops.108, 109
Laptops A saturated market suggests enabling laptop longevity is the best strategy.
Laptops are still the most popular device in the US and UK, with penetration rates of 63 per cent in the UK and 81 per cent in the US.110, 111 Although growth has flatlined, and sales are declining.112 Samsung has announced it will stop selling laptops in Europe.113
There is more limited variation between ownership across age groups, and more limited socioeconomic differences, with 74 per cent of ABC1s in the UK owning laptops compared to 50 per cent of C2DEs.114 Laptop upgrade cycles are just over three years.115
24
The Indian market
Reuse in India Growing demand for low specification, cheap and used models of consumer electronics is mediated through a heterogeneous, mostly decentralised distribution system.
Reuse happens efficiently in India, mostly in small shops through informal, decentralised networks, but increasingly also online, again mostly through peer to peer markets like quikr.com rather than central vendors like Gazelle in the US.
Devices are more efficiently recovered than in the developed world. Many fewer devices are left stuck in drawers. Used high end devices are in highest demand, but there is a large market for used, budget devices in working condition, even though these depreciate faster than premium products like the iPhone.116
A decentralised repair market works in conjunction with the informal resale market. Broken devices are repaired and refurbished, while defunct devices are stripped and sold for parts. There is also a
centralised repair network operated by major manufacturers.117
As there is huge demand for cheap and low specification devices, the second-hand market is likely to continue to grow and, without other interventions, will remain informal and decentralised.
There is some indication, however, that a centralised resale market may develop. In India, carriers don’t tend to offer subsidies for purchasing phones with plans, though Reliance mobile has just introduced a subsidised iPhone deal, creating a structure more like the US market.
India’s legislation already places responsibility on producers to make options available for consumers to return devices, and some are offering buyback schemes, led by a desire to increase upgrade cycles rather than to recover any value from old devices.118 This could tie in well to centralised repair systems being introduced by OEMs like Micromax (see model six on page 19), to provide opportunities for a company to reuse components.
Smartphones The premium market is saturated, but low smartphone penetration suggests second-hand premium devices from the developed world could compete with mid-tier and budget devices.
India has millions of potential first time buyers of mobile devices. Smartphone growth rates have been the highest in the Asia Pacific region, with a year-on-year smartphone shipment growth of over 186 per cent in the first quarter of 2014.119
There is still only ten per cent smartphone penetration of the mobile market, and projections indicate rapid growth rates will continue, especially in urban areas.120, 121
Due to low levels of overall wealth and high inequality, the premium market is already saturated. Apple has less than five per cent market share, and Android dominates 90 per cent of sales.122 Cheap models have been driving growth, with the sub-$200 category contributing about 78 per cent of market growth in early 2014.123
The majority of future growth will continue to be in low end, low
specification devices, with increased penetration being caused by prices falling even further, eg smartphones costing less than $100 or even less than $50.124 Budget Indian manufacturers, like Micromax and Karbonn, have also enjoyed rapid success and Micromax now closely rivals market leader Samsung. Cheap devices achieve low costs through generic components and larger scale production, which may contribute to greater potential for circular use.125
Tablets Very cheap devices with limited internet connectivity are the norm, meaning second-hand premium devices may have a niche in the market.
Tablets are less popular in India but are seeing rapid growth; again this is most pronounced in the cheapest segments of the market. Few people have access to broadband and 90 per cent of those accessing the internet do so on smartphones and tablets.126 Rural areas still have very limited access to 3G networks and have seen much slower uptake rates. As of August 2013, Vodafone had only upgraded 15 per cent of its 9,000 cell sites

25
in Uttar Pradesh to support 3G services.127 The government is promoting internet access by subsidising the development of a very cheap tablet, which will be available for INR 1,500 (£14).128
Laptops Limited penetration, as smartphones and tablets are the preferred devices.
Laptops are less widespread, with users who can only afford one device more often opting for a smartphone or a tablet. Budget laptops have been available for some time but, with prices starting at £150 for the cheapest devices, they are nowhere near as affordable for most consumers.129 Lack of reliable internet access other than by mobile data may also limit uptake. As such, these devices are much less relevant for the Indian market.
The problem with e-wasteExisting reuse markets for electronics are global, with a substantial fraction of lower specification devices being sent to the developing world. A number of the circular economy models outlined in this report could involve capturing older premium devices from developed
markets and sending them for reuse in emerging markets.
This poses a challenge: increasing second-hand exports to India could exacerbate India’s e-waste problem for genuinely end of life devices. Indian fears of becoming a dumping ground for e-waste have led to a partial block on imports of used computers and proposals to limit imports of other used electronics.130, 131
Adopting the reuse and remanufacturing focused circular models suggested in this report will reduce the total number of devices reaching the end of their useful life, as second-hand devices displace new devices. The logistics networks developed for the six circular business models we have described could help to ensure that end of life devices are collected for recycling. However, this alone will not solve the major environmental and health hazards associated with inadequate recycling facilities in emerging markets. Companies making and marketing mobile devices, new or used, have a responsibility to develop recycling infrastructure in emerging markets.

4 The benefits of a circular economy for smart devices

27
There are many good reasons to adopt a circular economy model for consumer electronics. Three of the most important are:
1 Consumer demand and technology change have created a new market opportunity.
2 Circular economy models reduce business risks.
3 Keeping devices in use for longer significantly reduces environmental impacts.
New market opportunitiesAcross developed markets, the pace of upgrades for smartphones and laptops is slowing. Businesses increasingly have to compete on price and user experience rather than impressive hardware to attract and retain customers.
Value for money is the most commonly cited factor for customers purchasing new devices in the US and UK, and circular economy business models provide two major opportunities to demonstrate value for money.135
Attracting new customers
“We have more people that are able to join the party when we have a trade-in, because in essence it winds up being used by...somebody else in that country that is very price-sensitive, or somebody in a different country” Tim Cook, Apple CEO136
In India Apple sells older generation iPhones, including the four year old iPhone 4 and 4s models. Katyayan Gupta, an analyst at Forrester Research in New Delhi explains that “Indians want to show their status, so people want Apple. It doesn’t matter if it’s a two year old phone. It’s an Apple at the end of the day.”137
As the research firm Bernstein points out, it is in Apple’s interest to support trade-in programs as a source of second-hand devices from a software ecosystem perspective, “as… the vast majority [emerging market] consumers cannot afford iPhones and are adopting Android.”138 Offering used devices enables carriers and manufacturers to engage customers with their brand who could not afford a new device.
Upgrades are slowing in mature markets, and are slow in emerging markets132,133,134
Years
USA phones
US & UKLaptops
0 1 2 3 4 5 6 7 8 9
200720082009201020122013
Years
0 1 2 3 4 5 6 7 8 9
India phones
UK phones
USA phones
2010
28
Our interviews with the IT asset disposal industry suggest that emerging market consumers have a preference for developed market brands, provided they compete on price. Moreover, it’s not just emerging market customers. Laptop and tablet ownership amongst the lowest socioeconomic groups in the UK is just over half that of the highest (two thirds in the case of smartphones), so there are large sections of developed markets that could be targeted with lower cost devices.139
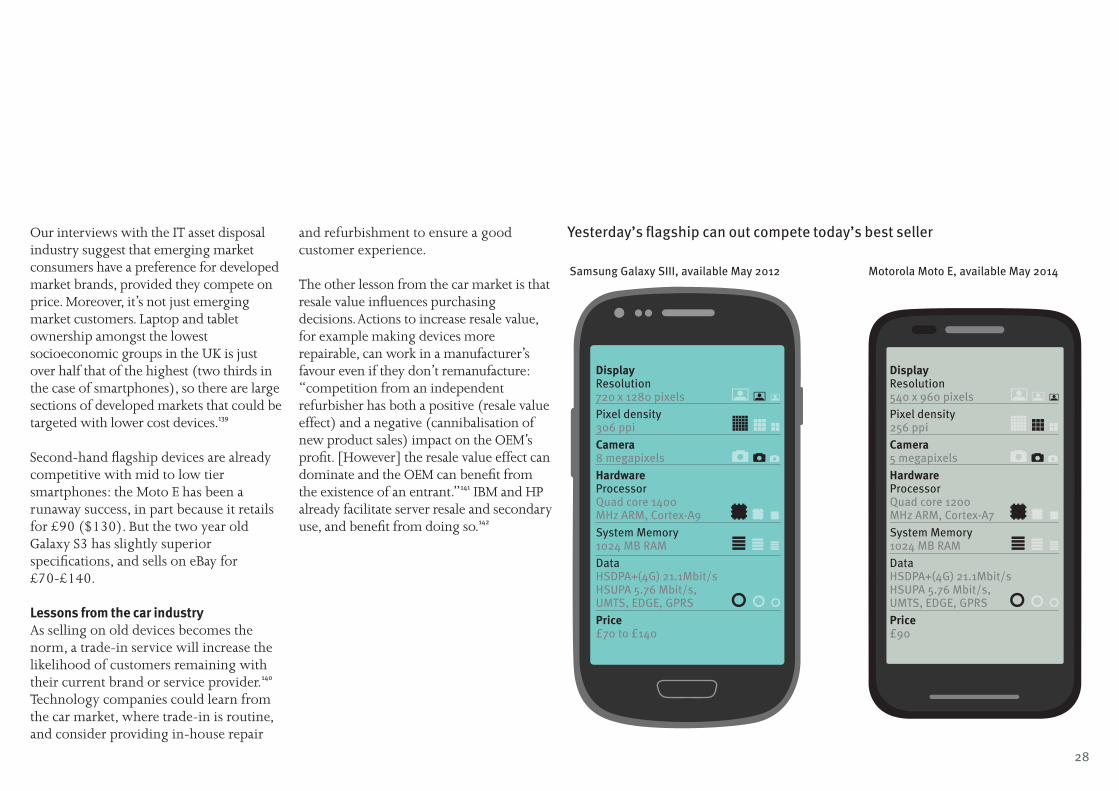
Second-hand flagship devices are already competitive with mid to low tier smartphones: the Moto E has been a runaway success, in part because it retails for £90 ($130). But the two year old Galaxy S3 has slightly superior specifications, and sells on eBay for £70-£140.
Lessons from the car industryAs selling on old devices becomes the norm, a trade-in service will increase the likelihood of customers remaining with their current brand or service provider.140 Technology companies could learn from the car market, where trade-in is routine, and consider providing in-house repair
and refurbishment to ensure a good customer experience.
The other lesson from the car market is that resale value influences purchasing decisions. Actions to increase resale value, for example making devices more repairable, can work in a manufacturer’s favour even if they don’t remanufacture: “competition from an independent refurbisher has both a positive (resale value effect) and a negative (cannibalisation of new product sales) impact on the OEM’s profit. [However] the resale value effect can dominate and the OEM can benefit from the existence of an entrant.”141 IBM and HP already facilitate server resale and secondary use, and benefit from doing so.142
Yesterday’s flagship can out compete today’s best seller
Samsung Galaxy SIII, available May 2012
DisplayResolution 720 x 1280 pixelsPixel density 306 ppiCamera 8 megapixelsHardwareProcessor Quad core 1400 MHz ARM, Cortex-A9System Memory 1024 MB RAMData HSDPA+(4G) 21.1Mbit/s HSUPA 5.76 Mbit/s, UMTS, EDGE, GPRSPrice£70 to £140
Motorola Moto E, available May 2014
DisplayResolution 540 x 960 pixelsPixel density 256 ppiCamera 5 megapixelsHardwareProcessor Quad core 1200 MHz ARM, Cortex-A7System Memory 1024 MB RAMData HSDPA+(4G) 21.1Mbit/s HSUPA 5.76 Mbit/s, UMTS, EDGE, GPRSPrice£90

29
Reducing business risksThe circular economy helps to reduce three core business risks: market risk, regulatory risk and the cost of goods sold. Used devices are already being sent to customers for insurance returns and warranty claims, lowering warranty costs. But developing supply chains to recover unwanted devices and designing devices that last longer and are more easily repaired helps to mitigate other risks. Most immediately, expanding reuse will reduce the market risk of cannibalisation, given predictions that used smartphones sales will rise from 53 million to 257 million between 2013 and 2018.
It also helps to address regulatory risk. E-waste is the fastest growing waste stream globally and policy makers are increasingly passing on the costs of the associated social and environmental impacts to retailers and manufacturers through producer responsibility legislation.143
More circular models will help defray producer responsibility costs and can contribute to reducing e-waste impacts.
Used devices can also provide a low risk, and potentially lower cost, source of parts
and materials for new devices. This new supply is insulated from:
• environmental risks, like those arising from unsustainable tin mining in Indonesia;144
• conflict risks, including those regulated under the US Dodd Frank Act;
• commodity price volatility; and
• short term supply disruptions.145
These factors have made self supply through recycling common in industry. For example, Honda recovers rare earths from the battery packs in its hybrid vehicles for reuse in new Honda cars, in part due to supply concerns.146 Similarly, Dell recovers plastics from the old electronics it collects.147 Although platinum group metals, copper and bulk metals can be recovered through shredding, yields are low. For many materials that are used in smart devices, disassembly focused recovery is likely to make the most sense. More exotic materials, like neodymium which faces supply issues (see left), need to be separated prior to recycling; these could be more readily recovered if hardware was adapted to make disassembly easier.
Lowering environmental impactUnlike many other electronics, mobile devices are optimised to run on battery power. Their low energy use means the majority of mobile devices’ environmental impact, between 60 and 85 per cent, arises from the manufacturing process.148 This makes product lifetime the key determinant of overall environmental impact, because a device that lasts longer spreads its manufacturing impacts over a longer time period.
Most CO2 emissions come from manufacturing149
0
50,000
100,000
150,000
200,000
250,000
2050
2030
2012
Forecast demand for neodymium
Forecast production of neodymium
Tonn
es
Average smartphone
Average tablet
Average laptop
Manufacturing75%
End of life2%Use19%Distribution6%
Manufacturing73%
End of life2%Use20%Distribution6%
End of life0.37%Use27%
Manufacturing67%
Distribution6%
Demand for neodymium will outstrip supply
30
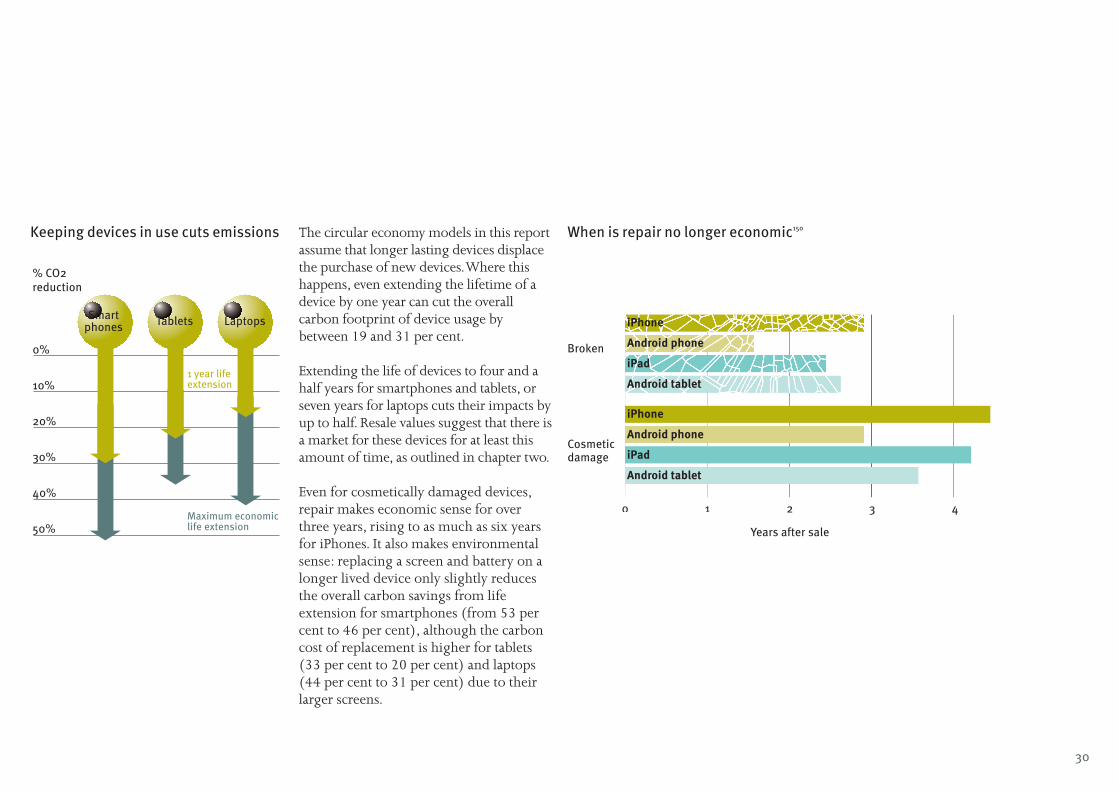
Keeping devices in use cuts emissions The circular economy models in this report assume that longer lasting devices displace the purchase of new devices. Where this happens, even extending the lifetime of a device by one year can cut the overall carbon footprint of device usage by between 19 and 31 per cent.
Extending the life of devices to four and a half years for smartphones and tablets, or seven years for laptops cuts their impacts by up to half. Resale values suggest that there is a market for these devices for at least this amount of time, as outlined in chapter two.
Even for cosmetically damaged devices, repair makes economic sense for over three years, rising to as much as six years for iPhones. It also makes environmental sense: replacing a screen and battery on a longer lived device only slightly reduces the overall carbon savings from life extension for smartphones (from 53 per cent to 46 per cent), although the carbon cost of replacement is higher for tablets (33 per cent to 20 per cent) and laptops (44 per cent to 31 per cent) due to their larger screens.
0%
10%
20%
30%
40%
50%
1 year life extension
Maximum economiclife extension
% CO2 reduction
Smartphones Tablets Laptops
When is repair no longer economic150
Years after sale
1 2 3 4
Broken
Cosmeticdamage
iPhone
Android phone
iPad
Android tablet
iPhone
Android phone
iPad
Android tablet
0

31
The industry’s environmental impactA circular economy approach to mobile devices can help to mitigate the rising environmental impacts of mobile devices. These impacts are being driven up by two factors. First, embodied emissions appear to be rising as specifications for new generations of the same product increase, as data from Apple’s lifecycle assessments shows (see below).
Second, smaller devices have higher carbon intensity, meaning the shift from desktops, to laptops, or even to smartphones, will not automatically reduce the environmental footprint of IT equipment overall.151
The global footprint of the industry is already significant, and will rise as the market grows and the carbon intensity of each device rises.
Our analysis suggests that the industry had emissions substantially greater than the whole of the UK’s transport sector in 2013 (131 Mt CO
2e).152 Similarly, the amount of
water used by the industry could meet the domestic needs of 38 million people each year (1,929 billion litres).153, 154
2009 2010 2011 2012 2013 2014 2015
0
20
40
60
80
100
120
140
160
180
kgCO
2e
iPad 1
iPad 2
iPad 3
iPad retina display iPad air
iPad air 2
iPhone 6
iPhone 3GS
iPhone 4iPhone 4s
iPhone 5
iPhone 5s0
100
200
300
400
500
600
700
Carb
on in
tens
ity (k
gCO
2e/k
g)
Mas
s (k
g)
iPho
ne 6
iPho
ne 6
plu
s
iPad
min
i 3
iPad
air
2
Mac
Book
Air
11"
Mac
Book
Air
13"
Mac
Book
Pro
13"
Mac
Book
Pro
15"
21.5
inch
iMac
27-in
ch iM
ac w
ithRe
tina
5K d
ispl
ay
0
2
4
6
8
10
12
Smaller Apple devices have higher carbon intensityEmbodied carbon of Apple devices rises as specifications increase

32
Beyond reuse: which components matter most?Companies choosing to redesign their products for repair or remanufacturing can minimise the carbon footprint of their activities by keeping highly carbon intensive components in use.
Chips (ICs) are the biggest source of embodied carbon (around 35 per cent in all devices), so these should be kept in use the longest to maximise environmental benefit.
The power supply has the second largest proportion of embodied carbon, especially in smartphones (30 per cent). Some operators, like O
2, have already moved
towards not shipping a new power supply as the default, while EU regulations encourage charger standardisation.
In contrast, batteries (two to three per cent embodied carbon) and casings (five to seven per cent embodied carbon) have lower carbon impact so could easily be swapped to give the rest of the device a longer lifetime.
Screens are somewhere in the middle. Although the proportion of embodied carbon in screens is small for a smartphone (11 per cent), it is larger for tablets (39 per cent)and laptops (30 per cent).155, 156, 157 Given the high frequency of damaged screens, manufacturers should consider making the LCD and glass separately replaceable, as the glass has lower embodied carbon than an LCD or AMOLED display. Even so, screen replacement still makes sense in environmental terms.
Overall, that companies can significantly cut the environmental impacts of mobile devices by enabling longer lived devices, through reuse, repair, remanufacturing, or even selective parts harvesting of high carbon components.
Embodied carbon vs mass of components in three mobile devices158
kgCO
2e %
Mas
s %
Apple iPod Touch 8gb third generation (2009) –proxy for iPhone
Circuit boards (excluding ICs)Integrated circuitsPower supplyBatteryDisplayCasingOther
0
20
40
60
80
100
kgCO
2e %
Mas
s %
Apple iPad 8gb Wi-Fi first generation (2009)0
20
40
60
80
100
kgCO
2e %
Mas
s %
HP 530 laptop, 16”(2009)0
20
40
60
80
100

Annex: methodology

34
Environmental impactEstimates vary widely on the total embodied carbon, water and energy in electronics devices, which analysts attribute to different accounting methodology and the absence of regulatory standards, as much as differences between devices.
Data about product lifecycle impact for water and energy for smartphones, tablets and laptops were provided by Google. Our embodied carbon estimates are averages of data from various published sources: smartphone data comes from Nokia, Apple, Sony, Samsung and Fairphone; tablet data comes from Apple and independent analysis using the ecoinvent lifecycle analysis database; laptop data comes from Google, Apple, Dell and a study from the EU’s Joint Research Centre.
Environmental benefits from life extensionsOur baselines were 1.81 years of use for smartphones, 2.55 years for tablets and 3.11 years for laptops, based on averaging the data of available estimates of current device lifetimes.159
We determined the baseline environmental impact of a year of device use by dividing the total impact in the baseline use scenario by the baseline lifetime. Alternative scenarios were generated by extending the lifetime: first through a one year extension, and then longer, to reach four and half years for smartphones and tablets, and seven years for laptops.
Although our analysis showed the economic lifetime of most devices to be five or more years for tablets and smartphones and longer for laptops, we used a conservative estimate, rather than the maximum possible lifetime, when modelling the environmental benefits of lifetime extension.
Although the impacts from the use phase increased with a longer lifetime, the much greater manufacturing impacts were spread over a longer period and so reduced the overall impact per year.
The percentage savings were calculated by dividing the yearly impacts of a device used for the longer period by the yearly impacts of a device used for the baseline period and subtracting the result from one.
We also calculated the carbon savings incurred when screens and batteries were replaced, as these are the most common repairs and would probably be needed in a four and half or seven year device lifetime.
While data at a component level was not available for water or energy use, proportions of embodied carbon for components were provided by Teehan and multiplied by average embodied manufacturing emissions to determine the embodied carbon in screens and batteries.160
The disused components then incurred end of life emissions, by assuming the component contribution to end of life emissions was proportionate to their contribution to total emissions.

35
Calculation of per device savings arising from lifetime extension
Years of use Embodied carbon per cent saved
Primary energy per cent saved
Water consumption per cent saved
Smartphones
Baseline 1.81 0% 0% 0%
1 year life extension 2.81 31% 27% 29%
Longer economic lifetime 4.50 53% 45% 49%
Longer life with screen & battery replacement
4.50 46% n/a n/a
Tablets
Baseline 2.55 0% 0% 0%
1 year life extension 3.55 21% 21% 23%
Longer economic lifetime 4.50 33% 32% 35%
Longer life with screen & battery replacement
4.50 20% n/a n/a
Laptops
Baseline 3.11 0% 0% 0%
1 year life extension 4.11 19% n/a 18%
Longer economic lifetime 7.00 44% n/a 41%
Longer life with screen & battery replacement
7.00 31% n/a n/a
Sales 2013 (millions)
Global CO2e burden of 2013 sales (manufacturing only) (MtCO2e)
Global water burden of 2013 sales (manufacturing only) (billion litres)
Smartphones 990 31.91 93.11
Tablets 186 12.94 79.24
Laptops 316 86.54 1,757.37
Total 131.39 1,929.72
Environmental burden of 2013 sales for manufacturing only

36
Deriving the economic lifetimeIf a device is no longer wanted by its first owner, a resale company can only exploit its value if it can acquire the device, perform any necessary repairs, repackage and then resell it for a profit. The point at which the costs incurred surpass the resale value is deemed the ‘maximum economic lifetime’.
Cost of acquisition (all devices) This was estimated as the average price that a recycler or reseller would pay a customer for a used device. This varies between nearly nothing for old, broken or low end devices, to over $400 for barely used recent models in excellent condition. Data was collected from sellcell.com and Gazelle.com for a range of different devices of different ages.
Cost of checking, cleaning, storage, repackaging and dispatch (all devices)Average refurbishment costs for tablets and laptops were provided by WRAP.161
Fallout (broken devices only)A percentage of broken devices cannot be repaired, which grows with the age of the device. Data was provided by WRAP, with Green Alliance estimates.162
Cost of repair This varies by device (see below). Average repair costs were from WRAP.163
Resale price This was determined by the price refurbished devices sold for on eBay. Data was collected via Terapeak over a three month period.
Net price after discounting for falloutBroken devices only (see below).
The economic lifetime of ‘good’ devicesAll devices in this category were assumed to be in good working order and needing no repairs. The only costs incurred were acquisition, checking, cleaning, storage, repackaging and dispatch.
The economic lifetime of devices needing superficial repairIn this category, all devices needed superficial repairs (replacement of batteries, charger or casing). The number of superficial repairs was estimated to increase slightly with the age of the device.
The price repaired devices sold for was assumed to be equal to devices requiring no repair.
The economic lifetime of broken devicesWhile broken devices are cheaper to acquire, on average they require more repairs and some may not be repairable at all. Using data provided by WRAP, we estimated the percentage of broken devices able to be repaired to be around 64 per cent, though this varied with the age and type of the device. Devices not able to be repaired incurred recycling rather than repair costs.
Broken but repairable devices were assumed to need several superficial repairs and additionally several major repairs (replacement of screen, digitiser, webcam, main board, CMOS battery, etc.). The number of repairs needed also varied with the age of the device.
As not all devices in this category were repairable, not all could be resold for revenue. To reflect this we lowered the resale price to around 64 per cent of the price assumed for devices in the other two categories.
37
1 Landfill figures from. US Environmental Protection Agency Office of Resource Conservation and Recovery, 1 May 2011, Electronics waste management in the United States through 2009, www.epa.gov/waste/conserve/materials/ecycling/docs/fullbaselinereport2011.pdf
2 Gregg Keizer, 24 July 2014, ‘The other Apple economy: $2b in devices on ebay’, Computerworld, www.computerworld.com/article/2490396/apple-mac/the-other-apple-economy---2b-in-devices-on-ebay.html
3 NextWorth, 10 December 2014, ‘NextWorth estimates the 2014 US Smartphone trade-in market value potential to be more than $3 billion’, PR Newswire, finance.yahoo.com/news/nextworth-estimates-2014-u-smartphone-130000177.html
4 WRAP, 12 December 2013, Switched on to value, www.wrap.org.uk/sites/files/wrap/Switched%20on%20to%20Value%2012%202014.pdf
5 Private correspondence with the IT asset disposal company RDC
6 Toni Sacconaghi, 7 August 2013, The long view: the used smartphone market, part 1: what, where and how big?, Bernstein Research, p 2
7 Toni Sacconaghi, 7 August 2013, The long view: the used smartphone market, part 1: what, where and how big?,Bernstein Research
8 Data from German consumers, which we believe is representative of most wealthy world markets. Corinna Fischer (et al), 16 June 2014, Preparatory study to establish the ecodesign working plan 2015-2017 implementing directive 2009/125/EC: draft task 3 report, Deloitte, p108, www.ecodesign-wp3.eu/sites/default/files/Ecodesign%20WP3_Draft_Task_3_report_20140616_1500.pdf
9 Used LG G2 and Nexus 5 second-hand values from: glyde.com/sell/LG-G2-32GB-Black-TMobile/12076356; glyde.com/sell/LG-Nexus-5-32GB-Black-TMobile/12076573 accessed 1 June 2014
10 Toni Sacconaghi, 7 August 2013, The long view: the used smartphone market, part 1: what, where and how big?, Bernstein Research, p 11
11 Android: as at November 3, 2014, developer.android.com/about/dashboards/index.html ; Windows Phone: from October 2014, winsupersite.com/windows-phone/windows-phone-stats-october-2014 accessed 1 November 2014
12 Rohin Dhar, 8 February 2012, ‘Your phone loses value pretty fast (unless it’s an iPhone)’, priceonomics, priceonomics.com/phones/
13 Cost of coding Cyanogenmod, www.ohloh.net/p/cyanogenmod/estimated_cost; cost of coding LXDE: www.ohloh.net/p/lxde/estimated_cost, accessed 1 June 2014
14 JR Raphael, 8 February 2012, ‘Surprise! The Android upgrade challenge has been answered’, Computerworld, www.computerworld.com/article/2475858/android/surprise--the-android-upgrade-challenge-has-been-answered.html
15 See section three of this report, US and UK market characteristics, p X
16 Tim Bajarin, 7 May 2012, ‘6 reasons Apple is so successful’, TIME, techland.time.com/2012/05/07/six-reasons-why-apple-is-successful/
17 Nektarios Oraiopoulos, Mark Ferguson and L Toktay, 1 May 2012, ‘Relicensing as a secondary market strategy’, Management science, vol 58, issue 5, p 6, www.prism.gatech.edu/~bt71/articles/OFT.pdf
18 “At Priceonomics, we firmly believe that resale value is the best objective indicator of product quality”, quoted from: Rohin Dhar, 8 February 2012, ‘Your phone loses value pretty fast (unless it’s an iPhone)’, priceonomics, priceonomics.com/phones/
19 Roger Entner, 23 June 2011, International comparisons: the handset replacement cycle, Recon Analytics, mobilefuture.org/wp-content/uploads/2013/02/mobile-future.publications.handset-replacement-cycle.pdf
20 According to data from Bernstein in 2011-2012, ten per cent of customers traded in their old device when buying a new one, versus 23 per cent in 2011-2012. See: Toni Sacconaghi, 7 August 2013, The long view: the used smartphone market, part 1: what, where and how big?, Bernstein Research, p 20
21 Asif Iqbal Shaik, 8 August 2014, ‘The next big challenge for Apple inc. (aapl) and Google inc. (googl): improve smartphone upgrade cycle’, dazeinfo.com, www.dazeinfo.com/2014/08/08/next-big-challenge-apple-inc-aapl-google-inc-googl-improve-smartphone-upgrade-cycle/
22 Dan Seifert, 26 June 2014, ‘With Android one, Google is poised to own the entire world’, The Verge, www.theverge.com/2014/6/26/5845562/android-one-google-the-next-billion
23 In the UK six in ten admit that new technology “always” or “sometimes” confuses them, and the same proportion say they wait until someone they know gets new technology before they consider it themselves. 7 August 2014, The communications market report, Ofcom, p 38, stakeholders.ofcom.org.uk/binaries/research/cmr/cmr14/2014_UK_CMR.pdf
24 The World Bank, 2013, ‘Population ages 65 and above (% of total)’, data.worldbank.org/indicator/SP.POP.65UP.TO.ZS/, accessed 1 November 2014
25 Ron Amadeo, 7 October 2014, ‘Testing a $35 Firefox OS phone—how bad could it be?’, Ars Technica, arstechnica.com/gadgets/2014/10/testing-a-35-firefox-os-phone-how-bad-could-it-be/1/
26 Quentin Fottrell, 13 February 2014, ‘Consumers hoard $13 billion in old iPhones’, MarketWatch, www.marketwatch.com/story/consumers-hoard-13-billion-in-old-iphones-2014-02-12
27 13 per cent of consumers asked why they haven’t sold their old phone are concerned about their personal information, while 17 per cent haven’t wiped their data “yet”. Lookout, 29 November 2012, ‘End #phonehoarding with Lookout’, blog.lookout.com/blog/2012/11/29/end-phonehoarding-with-lookout/
28 These figures are likely to be the maximum size of the market, and would only be realised if devices were efficiently repurchased. From: Sellmymobile.com Mobile Mountain Study referred to in: Dawn Smith, 14 February 2013, ‘Phone-hoarding brits sit on £6.86 billion mobile mountain’, PRWEB UK, uk.prweb.com/releases/2013/2/prweb10422613.htm; and Sellcell.com Mobile Mountain Study conducted by research agency OnePoll, referred to in: Josie Cruz, 14 February 2014, ‘The mobile mountain grows: Americans hoard $47 billion in unused mobile phones, 39 percent more than last year’, PRWEB, www.prweb.com/releases/2014/02/prweb11583191.htm
29 Sellmymobile.com Mobile Mountain Study, referred to in Toni Sacconaghi, 7 August 2013, The long view: the used smartphone market, part 1: what, where and how big?, Bernstein Research, p 4
30 Ibid 31 It appears that the growing Indian middle class retain gadgets
much like the middle class in the developed world, so the trend for repair and reuse in India may decline as India grows wealthier. See: 15 January 2014, ‘Urban Indians stocking an estimated Rs. 22,000cr worth of used goods: OLX crust
survey’, India infoline news service, www.indiainfoline.com/article/news/indians-have-a-habit-of-stocking-goods-they-no-longer-use-olx-crust-survey-5849260571_1.html
32 Toni Sacconaghi, 7 August 2013, The long view: the used smartphone market, part 1: what, where and how big?, Bernstein Research, p 9
33 Export costs are cheap in absolute terms as ships are often returning empty after exporting goods, but also in relative terms compared to high costs of sorting, disassembling and recycling phones in developed world. See: Djahane Salehabadi, 25 March 2013, Transboundary movements of discarded electrical and electronic equipment, Solving the E-Waste Problem (StEP) Green Paper, p 27, www.step-initiative.org/tl_files/step/files/5.%20StEP%20Task%20Forces/5.1%20TF%201%20Policy/5.1.4%20Projects/Transboundary%20Movement%20of%20WEEE/StEP_GP_TBM_20130325.pdf
34 Toni Sacconaghi, 7 August 2013, The long view: the used smartphone market, part 1: what, where and how big?, Bernstein Research, p 9
35 Green Alliance private correspondence with several IT asset disposal companies.
36 Bianca Vázquez Toness, 8 August 2014, ‘Indians flaunt 4-year-old iPhones as Apple builds appeal: tech’, Bloomberg, www.bloomberg.com/news/2014-08-07/indians-flaunt-4-year-old-iphones-as-apple-builds-appeal-tech.html
37 ‘Samsung galaxy SIII vs. Moto E - phone specs comparison’, PhoneArena, www.phonearena.com/phones/compare/Samsung-Galaxy-S-III,Motorola-Moto-E/phones/6330,8654, accessed 1 November 2014
38 Aaron Smith, 30 November 2012, The best (and worst) of mobile connectivity, Pew Research Center, p 14, www.pewinternet.org/files/old-media//Files/Reports/2012/PIP_Best_Worst_Mobile_113012.pdf
39 Those who agree with the statement “I love to buy new gadgets”. 1 August 2013, Communications market report 2013, Ofcom, p 87, stakeholders.ofcom.org.uk/binaries/research/cmr/cmr13/2013_UK_CMR.pdf
40 Toni Sacconaghi, 7 August 2013, The long view: the used smartphone market, part 1: what, where and how big?, Bernstein Research, p 9
41 priceonomics, 8 March 2012, ‘The cost of cracking’, priceonomics.com/phones/apple/
42 Screen and battery repair as a proportion of all repairs. Kevin Culligan and Brian Menzies, 29 March 2013, The value of
Endnotes
38
consumer electronics for trade-in and re-sale, WRAP, appendices, available on request, www.wrap.org.uk/node/18473
43 Cat phones, 28 November 2013, ‘New research reveals mobile users want phones to have a longer than average battery life’, catphones.com/news/press-releases/new-research-reveals-mobile-users-want-phones-to-have-a-longer-than-average-battery-life.aspx
44 According to Re-Tek data, only 18 per cent of laptop repairs were for screen replacement, vs 47 per cent for hard drive. Kevin Culligan and Brian Menzies, 29 March 2013, The value of consumer electronics for trade-in and re-sale, WRAP, appendices, available on request, www.wrap.org.uk/node/18473
45 The trend with ultrabooks is towards ‘embedded’ batteries. 15 August 2012, ULTRA-INCONVENIENT: with most new ‘ultrabook’ laptops users can’t change the battery themselves, Electronics TakeBack Coalition, p 1, www.electronicstakeback.com/wp-content/uploads/Ultrabook-report-Aug-2012.pdf
46 iPhone 3GS Display Assembly Replacement: Ben Eisenman, iFixit, www.ifixit.com/Guide/iPhone+3GS+Display+Assembly+Replacement/1554, accessed 1 November 2014; HTC One Display Assembly Replacement: alcs99, iFixit, www.ifixit.com/Guide/HTC+One+Display+Assembly+Replacement/19277, accessed 1 November 2014
47 The iPad is sealed, while the Nexus 7 is designed to be repaired. Dustin Benton, 5 July 2012, ‘What’s the difference between a circular and a linear economy? 1 mm’, Green Alliance Blog, greenallianceblog.org.uk/2012/07/05/whats-the-difference-between-a-circular-and-a-linear-economy-1-mm
48 Julia, 1 May 2013, ‘iFixit community survey: the results are in’, iFixit, ifixit.org/blog/4631/ifixit-community-survey-the-results-are-in/
49 Brook Lyndhurst Ltd, 1 July 2011, Public understanding of product lifetimes and durability (1), Department for Environment, Food and Rural Affairs, p 51, randd.defra.gov.uk/Document.aspx?Document=Publicunderstandingproductlifetimes1_Finalpublishedreport.pdf
50 The leading budget model has 30 per cent of the Windows phone market as of December 2013. Ron, 5 January 2014, ‘Nokia Lumia 520: exploring the world’s most popular windows phone device ever’, WinBeta, www.winbeta.org/news/nokia-lumia-520-exploring-worlds-most-popular-windows-phone-device-ever
51 ‘Buy Nokia shell for Lumia 520 - Microsoft store’, www.microsoftstore.com/store/msusa/en_US/pdp/Nokia-Shell-for-Lumia-520/productID.283833500, accessed 1 November 2014
52 Those who don’t agree with the statement “I love to buy new gadgets” . 1 August 2013, Communications market report 2013, Ofcom, p 87, stakeholders.ofcom.org.uk/binaries/research/cmr/cmr13/2013_UK_CMR.pdf
53 Cat phones, 28 November 2013, ‘New research reveals mobile users want phones to have a longer than average battery life’, catphones.com/news/press-releases/new-research-reveals-mobile-users-want-phones-to-have-a-longer-than-average-battery-life.aspx
54 Corinna Fischer (et al), 16 June 2014, Preparatory study to establish the Ecodesign Working Plan 2015-2017 implementing Directive 2009/125/EC: Draft Task 3 Report, Deloitte, p108, www.ecodesign-wp3.eu/sites/default/files/Ecodesign%20WP3_Draft_Task_3_report_20140616_1500.pdf
55 Nielsen, 1 February 2013, The mobile consumer: a global snapshot, p 17, www.nielsen.com/content/dam/corporate/us/en/reports-downloads/2013%20Reports/Mobile-Consumer-Report-2013.pdf
56 Andy Wolber, 5 November 2013, ‘Put Chromebooks in proper context: this is not a joke’, TechRepublic UK, www.techrepublic.com/blog/google-in-the-enterprise/put-chromebooks-in-proper-context-this-is-not-a-joke/
57 John Rath, 25 March 2014, ‘Titanfall taps windows azure cloud for low-latency gaming’, Data centre knowledge, www.datacenterknowledge.com/archives/2014/03/25/titanfall-taps-windows-azure-cloud-low-latency-gaming/
58 Those who don’t agree with the statement “I love to buy new gadgets”. 1 August 2013, Communications market report 2013, Ofcom, p 87, stakeholders.ofcom.org.uk/binaries/research/cmr/cmr13/2013_UK_CMR.pdf
59 Yardena Arar, 18 November 2013, ‘Laptop buying guide 2013: how to find the right notebook for you’, PCWorld, www.pcworld.com/article/211000/laptop-buying-guide.html
60 Michael S. Rosenwald, 16 January 2014, ‘Smartphones get more sophisticated, but their owners do not’, The Washington Post, www.washingtonpost.com/local/smartphones-get-more-sophisticated-but-their-owners-do-not/2014/01/15/99d7e100-7a20-11e3-8963-b4b654bcc9b2_story.html?hpid=z3
61 Aaron Smith, 30 November 2012, The best (and worst) of mobile connectivity, Pew Research Center, p 14, www.pewinternet.org/files/old-media//Files/Reports/2012/PIP_Best_Worst_Mobile_113012.pdf
62 As of 30 November 2012, India had 736,654 base transceiver stations (2G GSM & CDMA, and 3G). Of those, 96,212 (13 per cent) provided 3G mobile and data services. Out of India’s 640 districts, 610 districts were covered by 3G services. Sanjay Bafna, 21 December 2012, ‘India has 7,36,654 mobile towers and only 96,112 BTS’s are 3G enabled !’, Telecom Talk, telecomtalk.info/india-has-736654mobile-towers-and-only-96112bts-are-3g-enabled/103422/
63 Paul Teehan and Milind Kandlikar, 7 May 2013, Comparing embodied greenhouse gas emissions of modern computing and electronics products, environmental science and technology, vol 47, p 3,999, pubs.acs.org/doi/pdf/10.1021/es303012r
64 For example, Toyota deploys used hybrid car batteries as grid storage for its car dealerships. Silvio Marcacci, 5 February 2013, ‘Toyota recycles hybrid batteries into energy management systems’, CleanTechnica, cleantechnica.com/2013/02/05/toyota-recycles-hybrid-batteries-into-energy-management-systems/
65 Disassemblability of devices varies widely. ‘Smartphone repairability scores’, iFixit, www.ifixit.com/smartphone_repairability, accessed 1 November 2014; ‘Tablet repairability scores’, iFixit, www.ifixit.com/Tablet_Repairability, accessed 1 November 2014; laptops historically were more disassemblable, though this has changed with ultrabooks: 15 August 2012, ULTRA-INCONVENIENT: with most new ‘ultrabook’ laptops users can’t change the battery themselves, Electronics TakeBack Coalition, p 5-6, www.electronicstakeback.com/wp-content/uploads/Ultrabook-report-Aug-2012.pdf
66 Current minimum wages differ by state, eg:176-274rupees per day in electronics (Bihar), www.paycheck.in/main/salary/minimumwages/bihar/minimum-wages-in-bihar-w-e-f-april-1-2014-to-september-30-2014; 216-241 rupees per day in electronics (Haryana), www.paycheck.in/main/salary/minimumwages/haryana/haryana-minimum-wage-from-july-1-2014-to-december-31-2014. According to one study, as labour costs rise to 1.26 €/h (676 rupees per day, an equivalent wage is expected by 2015 in China but somewhat later in India), only partial (rather than full) disassembly will be profitable and, once labour costs reach 2.95 €/h (1582 rupees per day, an equivalent wage is expected by 2026 in China), manual disassembly will not be profitable at all. See:
Feng Wanga, Jaco Huisman, Christina EM Meskers, Mathias Schluep, Ab Stevels, Christian Hagelüken, 1 November 2012, ‘The best-of-2-worlds philosophy: developing local dismantling and global infrastructure network for sustainable e-waste treatment in emerging economies’, Waste Management, vol 32, issue 11, p 9, www.sciencedirect.com/science/article/pii/S0956053X12001407
67 It’s true that Android does not support dynamic hardware today, Eremenko said, “The good news is that we’re Google”, from: Phil Goldstein, 16 April 2014, ‘Google wants first Project Ara smartphone to go on sale in January 2015’, FierceWireless, www.fiercewireless.com/story/google-wants-first-project-ara-smartphone-go-sale-january-2015/2014-04-16
68 Richard Stallman, 19 September 2011, ‘Is Android really free software?’, The Guardian, www.theguardian.com/technology/2011/sep/19/android-free-software-stallman
69 The automotive and aerospace markets include significant remanufacturing, but this is rarely explicit. Nicholas Morley, 29 October 2012, Materials security, productivity and new business models, Centre for Remanufacturing and Reuse, cfsd.org.uk/site-pdfs/si12/presentations/day-1/10-25--Morley--Materials-Security,-Productivity+New-Business-Models-v4--2-slides-per-page.pdf
70 Mike Ives, 6 February 2014, ‘In developing world, a push to bring e-waste out of shadows’, Yale Environment 360, Yale School of Forestry & Environmental Studies, e360.yale.edu/feature/in_developing_world_a_push_to_bring_e-waste_out_of_shadows/2736/
71 Rohin Dharmakumar, 2 December 2013, ‘Can Micromax become India’s leading smartphone maker?’, IBN Live, ibnlive.in.com/news/can-micromax-become-indias-leading-smartphone-maker/437322-55.html
72 Dave Lee, 5 December 2014, ‘Old laptop batteries could power slums, IBM says’, www.bbc.com/news/technology-30345221
73 Tim, 10 November 2012, ‘Toshiba laptop service manuals and the sorry state of copyright law’, Future Proof, www.tim.id.au/blog/2012/11/10/toshiba-laptop-service-manuals-and-the-sorry-state-of-copyright-law/
74 Bill Ray, 24 January 2011, ‘The cost of beating Apple’s shrewd screws? £2’, The Register, www.theregister.co.uk/2011/01/24/apple_screws/
75 Brook Lyndhurst Ltd, 1 July 2011, Public understanding of product lifetimes and durability (1), Department for

39
Environment, Food and Rural Affairs, p 51, randd.defra.gov.uk/Document.aspx?Document=Publicunderstandingproductlifetimes1_Finalpublishedreport.pdf
76 Julia, 1 May 2013, ‘iFixit community survey: the results are in’, iFixit, ifixit.org/blog/4631/ifixit-community-survey-the-results-are-in/
77 Kyle Wiens, 31 October 2012, ‘One way to create American jobs: fix our 5 million tons of out-of-use electronics’, iFixit, ifixit.org/blog/3654/one-way-to-create-american-jobs-fix-our-5-million-tons-of-out-of-use-electronics/
78 Dell, ‘Interactive video teardowns’, support.dell.com/support/topics/global.aspx/support/csr/interactive_video_teardowns, accessed 1 November 2014
79 1 June 2011, ‘Case study: specifying durability and repair in vacuum cleaners’, WRAP, p 7, www2.wrap.org.uk/downloads/Dyson_Case_study_AG.aa37bdc4.11040.pdf
80 C Lee-Woolf, O Hughes, O M Fernandez, and J Cox, 11 December 2012, Engagement with re-use and repair services in the context of local provision, Brook Lyndhurst and Zero Waste Scotland, p 45, www.brooklyndhurst.co.uk/download/201/d92687a5/Brook%20Lyndhurst%20-%20Re-use%20and%20repair%20in%20context%20of%20local%20provision%20-%20Full.pdf
81 Rohin Dharmakumar, 2 December 2013, ‘Can Micromax become India’s leading smartphone maker?’, IBN Live, ibnlive.in.com/news/can-micromax-become-indias-leading-smartphone-maker/437322-55.html
82 Assa Doron, 1 September 2012, ‘Consumption, technology and adaptation: care and repair economies of mobile phones in north India’, Pacific Affairs, vol 85, issue 3, p 563, www.ingentaconnect.com/content/paaf/paaf/2012/00000085/00000003/art00006
83 Rohin Dharmakumar, 2 December 2013, ‘Can Micromax become India’s leading smartphone maker?’, IBN Live, ibnlive.in.com/news/can-micromax-become-indias-leading-smartphone-maker/437322-55.html
84 Assa Doron, 1 September 2012, ‘Consumption, technology and adaptation: care and repair economies of mobile phones in north India’, Pacific Affairs, vol 85, issue 3, p 578, www.ingentaconnect.com/content/paaf/paaf/2012/00000085/00000003/art00006
85 7 August 2014, The communications market report, Ofcom, p 3, stakeholders.ofcom.org.uk/binaries/research/cmr/cmr14/2014_UK_CMR.pdf
86 Pew Research Center, 2013, ‘Cell phone and smartphone ownership demographics’, www.pewinternet.org/data-trend/mobile/cell-phone-and-smartphone-ownership-demographics/
87 Charles Arthur, 30 April 2014, ‘The death of the featurephone in the UK - and what’s next’, The Guardian, www.theguardian.com/technology/2014/apr/30/featurephone-smartphone-uk-
88 For example, Moto G launched in November 2013, boosting the manufacturer from “nowhere in Europe” to six per cent of UK smartphone sales. Gareth Beavis, 16 May 2014, ‘The next smartphone war is going to be cheap, not nasty’, techradar, www.techradar.com/news/phone-and-communications/mobile-phones/the-next-smartphone-war-is-going-to-be-cheap-not-nasty-1248451
89 7 August 2014, The communications market report, Ofcom, p 110, stakeholders.ofcom.org.uk/binaries/research/cmr/cmr14/2014_UK_CMR.pdf
90 Pew Research Center, 2013, ‘Cell phone and smartphone ownership demographics’, www.pewinternet.org/data-trend/mobile/cell-phone-and-smartphone-ownership-demographics/
91 70 per cent of AB groups own smartphones vs 47 per cent of DEs. From: 7 August 2014, The communications market report, Ofcom, p 274, stakeholders.ofcom.org.uk/binaries/research/cmr/cmr14/2014_UK_CMR.pdf
92 Aaron Smith, 30 November 2012, The best (and worst) of mobile connectivity, Pew Research Center, p 14, www.pewinternet.org/files/old-media//Files/Reports/2012/PIP_Best_Worst_Mobile_113012.pdf
93 Charles Arthur, 30 April 2014, ‘The death of the featurephone in the UK - and what’s next’, The Guardian, www.theguardian.com/technology/2014/apr/30/featurephone-smartphone-uk-
94 Charles Arthur, 27 April 2014, ‘How to keep on selling smartphones when we’ve nearly all got one already’, The Observer, www.theguardian.com/technology/2014/apr/27/smartphone-market-saturation-apple-samsung
95 Matt Hamblen, 24 March 2014, ‘Smartphone innovation is slowing, so what’s next?’, Computerworld, www.computerworld.com/article/2488558/smartphones/smartphone-innovation-is-slowing--so-what-s-next-.html
96 Nielsen, 1 February 2013, The mobile consumer: a global snapshot, p 17, www.nielsen.com/content/dam/corporate/
us/en/reports-downloads/2013%20Reports/Mobile-Consumer-Report-2013.pdf
97 Charles Arthur, 27 April 2014, ‘How to keep on selling smartphones when we’ve nearly all got one already’, The Observer, www.theguardian.com/technology/2014/apr/27/smartphone-market-saturation-apple-samsung
98 Compare China, 21 per cent; India, five per cent; and Italy, 16 per cent. ‘GSMA intelligence – data’, GSMA Intelligence, gsmaintelligence.com/data/, accessed 29 October 2014
99 Toni Sacconaghi, 7 August 2013, The long view: the used smartphone market, part 1: what, where and how big?, Bernstein Research, p 4
100 Eric Ravenscraft, 23 September 2013, ‘Are early upgrade plans worth it?’, lifehacker, lifehacker.com/are-early-upgrade-plans-worth-it-1369868915
101 O2, 12 April 2014, ‘O2 launches new tariff allowing customers to get the latest phone whenever they want’, news.o2.co.uk/?press-release=o2-launches-new-tariff-allowing-customers-to-get-the-latest-phone-whenever-they-want
102 Roger Entner, 23 June 2011, International comparisons: the handset replacement cycle, Recon Analytics, p2, mobilefuture.org/wp-content/uploads/2013/02/mobile-future.publications.handset-replacement-cycle.pdf; see also Toni Sacconaghi, 7 August 2013, The long view: the used smartphone market, part 1: what, where and how big?, Bernstein Research, p 19
103 By contrast, in the UK, the number of contract users has slightly increased. See: 1 May 2013, ‘Mobile users move toward contract tariffs as prepaid plateaus’, GSMA Intelligence, gsmaintelligence.com/analysis/2013/05/mobile-users-move-toward-contract-tariffs-as-prepaid-plateaus/386/
104 Charles Arthur, 16 October 2014, ‘Peak tablet: how will Apple sell even more iPads?’, The Guardian, www.theguardian.com/technology/2014/oct/16/apple-peak-tablet-ipad-ipad-air-pro
105 Kathryn Zickuhr and Lee Rainie, 1 January 2014, ‘Tablet and e-reader ownership’, Pew Research Center, www.pewinternet.org/2014/01/16/tablet-and-e-reader-ownership/
106 Kathryn Zickuhr and Lee Rainie, 16 January 2014, E-reading rises as device ownership jumps: three in ten adults read an e-book last year; half own a tablet or e-reader, Pew Research Centre, p 5, www.pewinternet.org/files/old-media//Files/Reports/2014/PIP_E-reading_011614.pdf
107 Charles Arthur, 16 October 2014, ‘Peak tablet: how will Apple sell even more iPads?’, The Guardian, www.theguardian.com/technology/2014/oct/16/apple-peak-tablet-ipad-ipad-air-pro
108 Tablets have only been sold for four years so refresh cycles are uncertain. We averaged estimates provided by Jackdaw research, Consumer Intelligence Research Partners, HP, and TabTimes, to arrive at an estimate of 2.55 years.
109 Steve Daniel, 1 July 2013, United States PC, tablet, & mobile phone market size and forecast, July 2013, Daniel Research Group, p 5, www.danielresearchgroup.com/LinkClick.aspx?fileticket=1ejALRMAUbk%3D&tabid=122&mid=522
110 7 August 2014, The communications market report, Ofcom, p 271, stakeholders.ofcom.org.uk/binaries/research/cmr/cmr14/2014_UK_CMR.pdf
111 Deloitte’s Digital Democracy Survey, referenced in: 2 April 2014, ‘Half of us millennials own a laptop, smartphone and tablet’, MarketingCharts, www.marketingcharts.com/online/half-of-us-millennials-own-a-laptop-smartphone-and-tablet-41706/
112 Year on year sales declined by seven per cent in the fourth quarter of 2013. Mohana Ravindranath, 11 February 2014, ‘PCs lumber towards the technological graveyard’, The Guardian, www.theguardian.com/technology/2014/feb/11/personal-computer-decline-pc-obsolete
113 Katie Collins, 23 September 2014, ‘Samsung will no longer sell laptops or Chromebooks in Europe’, wired.co.uk, www.wired.co.uk/news/archive/2014-09/23/samsung-exits-laptop-market
114 7 August 2014, The communications market report, Ofcom, p 271, stakeholders.ofcom.org.uk/binaries/research/cmr/cmr14/2014_UK_CMR.pdf
115 An average of 3.11 years, based on information from the Oeko Institut, Daniel research group, Lenovo, Crucial, HP and the EU’s Joint Research Centre
116 Naina Khedekar, 25 February 2013, ‘Market watch: the second-hand options’, Tech2, tech.firstpost.com/news-analysis/market-watch-the-second-hand-options-75481.html
117 Assa Doron, 1 September 2012, ‘Consumption, technology and adaptation: care and repair economies of mobile phones in north India’, Pacific Affairs, vol 85, issue 3, p 563, www.ingentaconnect.com/content/paaf/paaf/2012/00000085/00000003/art00006
118 The Gazette of India: Extraordinary, 12 May 2011, Ministry of Environment and Forests Notification, Controller of
40
Publications, Delhi, p29, www.moef.nic.in/downloads/rules-and-regulations/1035e_eng.pdf
119 4 June 2014, ‘India continues as one of the fastest growing smartphone markets in Asia Pacific in 1Q 2014, says IDC’, IDC, www.idc.com/getdoc.jsp?containerId=prIN24908614
120 Anand Rai, 29 May 2014, ‘India had third largest smartphone base with 117m users in 2013; to grow 45% in 2014: Mary Meeker report’, techcircle.in, techcircle.vccircle.com/2014/05/29/india-had-third-largest-smartphone-base-with-117m-users-in-2013-to-grow-45-in-2014-mary-meeker-report/
121 Vasanth R, 30 March 2014, ‘Smartphone users doubled in urban India: recorded 89% y-o-y growth in 2013!’, dazeinfo.com, www.dazeinfo.com/2014/03/20/smartphone-users-doubled-urban-india-recorded-89-yoy-growth-2013/
122 Javed Anwer, 20 September 2013, ‘Android’s market share in India over 90%: IDC’, The Times of India, timesofindia.indiatimes.com/tech/tech-news/Androids-market-share-in-India-over-90-IDC/articleshow/22793647.cms
123 4 June 2014, ‘India continues as one of the fastest growing smartphone markets in Asia Pacific in 1q 2014, says IDC’, IDC, www.idc.com/getdoc.jsp?containerId=prIN24908614
124 James Crabtree, 28 July 2014, ‘India prepares for ‘big bang’ in smartphone use’, Financial Times, www.ft.com/cms/s/0/15942a48-0e2c-11e4-85ab-00144feabdc0.html?siteedition=uk
125 Rohin Dharmakumar, 2 December 2013, ‘Can Micromax become India’s leading smartphone maker?’, IBN Live, ibnlive.in.com/news/can-micromax-become-indias-leading-smartphone-maker/437322-55.html
126 PTI (Press Trust of India), 16 June 2014, ‘India to have 519 million mobile internet users by FY18: Morgan Stanley’, The Times of India, timesofindia.indiatimes.com/tech/tech-news/India-to-have-519-million-mobile-internet-users-by-FY18-Morgan-Stanley/articleshow/36656019.cms
127 Singh Rawat, 11 October 2013, ‘Vodafone connects to rural India for data segment growth’, Business Standard, www.business-standard.com/article/companies/vodafone-connects-to-rural-india-for-data-segment-growth-113101100781_1.html
128 Phil Muncaster, 20 December 2013, ‘World’s cheapest tablet just got cheaper’, The Register, www.theregister.co.uk/2013/12/20/aakash4_datawind_india_cheapest_tablet/
129 ‘Laptops | buy laptops online at best prices in India’, flipkart.com, www.flipkart.com/laptops/pr?p=facets.pricerange%255B%255D%3DRs.%2B10001%2B-%2BRs.%2B20000&p=sort%3Dprice_asc&sid=6bo%2Cb5g&ref=3a0d498b-9d6b-4da3-ab6f-a0292544fde2, accessed 1 December 2014
130 Ministry of Environment and Forests, 15 November 2010, ‘Ban on import of second-hand computers’, Press Information Bureau Government of India, pib.nic.in/newsite/erelease.aspx?relid=67144
131 The Gazette Of India: Extraordinary, 14 October 2013, ‘Ministry of Environment and Forests notification’, Controller of Publications, Delhi, pp 20, 27, 30, envfor.nic.in/sites/default/files/SO%203100%28E%29.pdf
132 Data from Recon Analytics, mobilefuture.org/wp-content/uploads/2013/02/mobile-future.publications.handset-replacement-cycle.pdf; 2013 data suggests US replacement rates may have risen slightly to 22.4 months reconanalytics.com/2014/02/rogers-recon-state-of-wireless-union-2014-part-two/
133 An average of 3.11 years, based on information from the Oeko Institut, Daniel research group, Lenovo, Crucial, HP and the EU’s Joint Research Centre.
134 Tiernan Ray, 11 April 2013, ‘AAPL, DELL, HPQ: Bernstein ponders lengthening PC cycle’, Barrons, blogs.barrons.com/techtraderdaily/2013/04/11/aapl-dell-hpq-bernstein-ponders-lengthening-pc-cycle/
135 Nielsen, 1 February 2013, The mobile consumer: a global snapshot, p 17, www.nielsen.com/content/dam/corporate/us/en/reports-downloads/2013%20Reports/Mobile-Consumer-Report-2013.pdf
136 Serenity Caldwell, 22 July 2014, ‘This is Tim: Apple’s CEO on iPad sales, china, beats, IBM, and more’, Macworld, www.macworld.com/article/2455693/this-is-tim-apples-ceo-on-ipad-sales-china-beats-ibm-and-more.html
137 Bianca Vázquez Toness, 8 August 2014, ‘Indians flaunt 4-year-old iPhones as Apple builds appeal: tech’, Bloomberg, www.bloomberg.com/news/2014-08-07/indians-flaunt-4-year-old-iphones-as-apple-builds-appeal-tech.html
138 Toni Sacconaghi, 7 August 2013, The long view: the used smartphone market, part 1: what, where and how big?, Bernstein Research, p4
139 7 August 2014, The communications market report, Ofcom, p 274, stakeholders.ofcom.org.uk/binaries/research/cmr/cmr14/2014_UK_CMR.pdf
140 Toni Sacconaghi, 7 August 2013, The long view: the used smartphone market, part 1: what, where and how big?, Bernstein Research, p4
141 Nektarios Oraiopoulos, Mark Ferguson and L. Toktay, 1 May 2012, ‘Relicensing as a secondary market strategy’, Management Science, vol 58, issue 5, p 6, www.prism.gatech.edu/~bt71/articles/OFT.pdf
142 ibid, p 3 143 10 February 2012, ‘Un-backed report warns of dangers of
increasing electronic waste in west Africa’, UN News Centre, www.un.org/apps/news/story.asp?NewsID=41201
144 1 November 2012, Mining for smartphones: the true cost of tin, Friends of the Earth, p 4, www.foe.co.uk/sites/default/files/downloads/tin_mining.pdf
145 eef (The manufacturers’ organisation), 1 July 2014, Materials for manufacturing: safeguarding supply, p 1, www.eef.org.uk/resources-and-knowledge/research-and-intelligence/industry-reports/materials-for-manufacturing-safeguarding-supply
146 Honda, 4 March 2013, ‘World’s first process to reuse rare earth metals extracted from nickel-metal hydride batteries for hybrid vehicles’, phys.org, phys.org/news/2013-03-world-reuse-rare-earth-metals.html
147 Heather Clancy, 28 May 2014, ‘Dell’s supply chain brings closed-loop recycling advantage’, Forbes, www.forbes.com/sites/heatherclancy/2014/05/28/dells-supply-chain-brings-closed-loop-recycling-advantage/
148 85 per cent of emissions arise from production for the iPhone 6. From: Apple, 1 September 2014, iPhone 6 environmental report, p 1, images.apple.com/environment/reports/docs/iPhone6_PER_Sept2014.pdf
149 Averages of available footprint data. Smartphone data from: Nokia, Apple, Google, Sony, Samsung, Fairphone; tablets from Google and Apple; laptops from Google, Apple, Dell and a study from the EU’s Joint Research Centre
150 We’ve calculated the economic lifetime described here as the time during which the cost of acquisition and repair of these devices is below the price that the device can fetch on the market.
151 The relationship between mass and carbon intensity is reasonably strong, with an R² value of 0.731
152 27 March 2014, 2013 UK greenhouse gas emissions, provisional figures and 2012 UK greenhouse gas emissions,
final figures by fuel type and end-user, Department of Energy and Climate Change, p 10, www.gov.uk/government/uploads/system/uploads/attachment_data/file/295968/20140327_2013_UK_Greenhouse_Gas_Emissions_Provisional_Figures.pdf
153 Based on the UN’s definition of humans needing a minimum of 50 litres of water per day. United Nations, ‘Global issues: water’, www.un.org/en/globalissues/water, accessed 1 November 2014
154 Average footprint data. Smartphone data from: Nokia, Apple, Google, Sony, Samsung, Fairphone; tablets from Google and Apple; laptops from Google, Apple, Dell and a study from the EU’s Joint Research Centre
155 Data for a 3.5-inch screen 2009 iPod touch, which we take to be equivalent to an early iPhone. Paul Teehan and Milind Kandlikar, 7 May 2013, ‘Comparing embodied greenhouse gas emissions of modern computing and electronics products’, Environmental Science and Technology, vol 47, p 3999, pubs.acs.org/doi/pdf/10.1021/es303012r
156 Data for an iPad 1, ibid 157 Data for a 16” HP laptop, ibid 158 Paul Teehan and Milind Kandlikar, 7 May 2013, ‘Comparing
embodied greenhouse gas emissions of modern computing and electronics products’, Environmental Science and Technology, vol 47, p 3,999, pubs.acs.org/doi/pdf/10.1021/es303012r
159 Smartphone data from Recon Analytics; tablet data provided by Jackdaw research, Consumer Intelligence Research Partners, HP, and TabTimes to arrive at an estimate of 2.55 years; laptops estimated at 3.11 years, based on information from the Oeko Institut, Daniel research group, Lenovo, Crucial, HP and the EU’s Joint Research Centre
160 Paul Teehan and Milind Kandlikar, 7 May 2013, ‘Comparing embodied greenhouse gas emissions of modern computing and electronics products’, Environmental Science and Technology, vol 47, p3999, pubs.acs.org/doi/pdf/10.1021/es303012r
161 Kevin Culligan and Brian Menzies, 29 March 2013, The value of consumer electronics for trade-in and re-sale, WRAP, appendices, available on request, www.wrap.org.uk/node/18473
162 ibid 163 ibid

Green Alliance Green Alliance is a charity and independent think tank focused on ambitious leadership for the environment. We have a track record of 35 years, working with the most influential leaders from the NGO, business, and political communities. Our work generates new thinking and dialogue, and has increased political action and support for environmental solutions in the UK.
Authors: Dustin Benton, Emily Coats and Jonny Hazell
Acknowledgements: Andrea Steves, Audrey Davenport, and Saleem Van Groenou from Google; and Claire Ollerenshaw and Gerrard Fisher from WRAP.
This work was kindly supported by Google.org. However, the views expressed are Green Alliance’s, and do not necessarily reflect those of Google.
Green Alliance 36 Buckingham Palace Road, London, SW1W 0RE 020 7233 7433 [email protected] www.green-alliance.org.uk
blog: greenallianceblog.org.uktwitter: @GreenAllianceUK
The Green Alliance Trust is a registered charity 1045395 and company limited by guarantee (England and Wales) 3037633, registered at the above address
Published by Green Alliance, January 2015
Designed by Howdy
ISBN: 978-1-909980-36-5
© Green Alliance, 2015
Green Alliance’s work is licensed under a Creative Commons Attribution-Noncommercial-No derivative works 3.0 unported licence. This does not replace copyright but gives certain rights without having to ask Green Alliance for permission.
Under this licence, our work may be shared freely. This provides the freedom to copy, distribute and transmit this work on to others, provided Green Alliance is credited as the author and text is unaltered. This work must not be resold or used for commercial purposes. These conditions can be waived under certain circumstances with the written permission of Green Alliance. For more information about this licence go to http://creativecommons.org/licenses/by-nc-nd/3.0/


![FOR RENT Economy Circular Economy Infographic.pdf · the framework of a circular economy."[5] Global Partners Many major companies are embracing the circular economy shift by partnering](https://img.pdfslide.us/doc/110x75/6013459c7f9b4e43ae74bad4/for-rent-economy-circular-economy-the-framework-of-a-circular-economy5.jpg)