Embed Size (px)
Citation preview
American Journal of Botany 91(6): 966-975. 2004.
A CHEMOTAXONOMIC ANALYSIS OF CANNABINOID
VARIATION IN CANNABIS (CANNABACEAE) 1
KARL W. HILLIG2 AND PAUL G. MAHLBERG
Department of Biology, Indiana University, Bloomington, Indiana 47405 USA
Cannabinoids are important chemotaxonomic markers unique to Cannabis. Previous studies show that a plant's dry-weight ratio of �•-tetrahydrocannabinol (THC) to cannabidiol (CBD) can be assigned to one of three chemotypes and that alleles 81> and 8,- encode alloenzymes that catalyze the conversion of cannabigerol to CBD and THC, respectively. In the present study, the frequencies of 8
0
and B,- in sample populations of 157 Cannabis accessions were determined from CBD and THC banding patterns, visualized by starch gel electrophoresis. Gas chromatography was used to quantify cannabinoid levels in 96 of the same accessions. The data were interpreted with respect to previous analyses of genetic and morphological variation in the same germplasm collection. Two biotypes (infraspecific taxa of unassigned rank) of C. sativa and four biotypes of C. indica were recognized. Mean THC levels and the frequency of 8,- were significantly higher in C. indica than C. sativa. The proportion of high THC/CBD chemotype plants in most accessions assigned to C. sativa was <25% and in most accessions assigned to C. indica was >25%. Plants with relatively high levels of tetrahydrocannabivarin (THCV) and/or cannabidivarin (CBDV) were common only in C. indica. This study supports a two-species concept of Cannabis.
Key words: cannabinoid; Cannabis: chemotaxonomy; evolution; genetics; taxonomy; tetrahydrocannabinol.
Cannabis (Cannabaceae) has been a source of fiber, food,oil, medicine, and inebriant since prehistoric times (Chopra, 1969; Schultes, 1973; Abel, 1980). Whether the genus consists of one or more species is a matter of divided opinion (Schultes et al., 1974; Small and Cronquist, 1976; Emboden, 1981). Cannabis strains cultivated for fiber and/or seed production(here referred to as hemp) are commonly differentiated from strains cultivated for medicinal or recreational use, but the evolutionary relationships between these two groups and between cultivated and wild or naturalized (feral) populations are not well understood. To further resolve these issues, a systematic investigation of genetic, morphological, and biochemical variation was conducted on a diverse collection of 157 Cannabis accessions grown in a common environment (Hillig, 2004, in press). Chemotaxonomic aspects of that investigation are reported herein. Qualitative and quantitative analyses of cannabinoid variation and a method of characterizing cannabinoid differences among populations based on a simple genetic model provide new evidence regarding the evolution and domestication of this socioeconomically important genus.
Cannabinoids are terpenophenolic compounds unique to Cannabis. They are produced by glandular trichomes that occur on most aerial surfaces of the plant (Dayanandan and Kaufman, 1976; Turner et al., 1978). Approximately 61 cannabinoids are known to exist, although some of these are breakdown products or artifacts (Schultes and Hofmann, 1980; Turner et al., 1980). The cannabinoids discussed in this paper are biosynthesized in an acidic (carboxylated) form and are decarboxylated upon heating and drying of harvested plant material (Doorenbos et al., 1971). They are here referred to in their decarboxylated form. Cannabigerol (CBG) is the direct precursor of cannabichromene (CBC), cannabidiol (CBD), and
' Manuscript received 19 June 2003; revision accepted 12 February 2004. The authors thank all those who contributed germplasm for this investi
gation. We also thank John McPartland, Mark Bierner, and an anonymous reviewer for helpful comments on this manuscript. This research was supported by a grant from HortaPharm B.V., Netherlands. Drug Enforcement Administration number PI0043 I l 3 (PGM).
2 Current address: 1010 Saratoga Road, Ballston Lake, NY 12019.
966
Ll9-tetrahydrocannabinol (THC) (Taura et al., 1995, 1996; Morimoto et al., 1997). A homologous series of compounds with propyl side-chains is biosynthesized from cannabigerovarin (CBGV), including cannabivarichromene (CBCV), cannabidivarin (CBDV), and Ll9-tetrahydrocannabivarin (THCV), respectively (Fig. lA-D) (Schultes and Hofmann, 1980). THC and/or CBD are generally produced in greatest abundance. However, THCV and less commonly CBDV may exceed the levels of THC and/or CBD in some plants (Baker et al., 1980). THC and THCV are primarily responsible for the euphoric effects of marijuana and hashish (McPartland and Russo, 2001).
Chemotaxonomy has a long history of use in the delimitation of Cannabis taxa. Lamarck ( 1785) emphasized the greaterinebriant potential of C. indica Lam. when he differentiated itfrom C. sativa L. Names and descriptions of other putativespecies of Cannabis have been published (reviewed in Schultes et al., 1974; Small and Cronquist, 1976). Of these, only C. ruderalis Janisch. is commonly accepted. Small (1979a) considered the amount of THC produced by Cannabis to be an"extremely important" taxonomic character and used gas chromatography (GC) to differentiate indica strains from saliva strains on the basis of their THC content (Small and Beckstead, 1973a, b; Small et al., 1975; Small and Cronquist, 1976). Small and Cronquist (1976) favored a monospecific concept and assigned these two taxa to subspecies of C. saliva.
Numerous biochemical studies of Cannabis plants grownfrom achenes ("seeds") of known geographic origin have been reported (Fetterman et al., 1971; Fetterman and Turner, 1972; Nordal and Braenden, 1973; Small and Beckstead, 1973a, b; Turner et al., 1973; Turner and Hadley, 1973a, 1974; Boucher et al., 1974; Holley et al., 1975; Small et al., 1975; Rowan and Fairbairn, 1977; Beutler and Der Marderosian, 1978; Clark and Bohm, 1979; Turner et al., 1979; Fournier and Paris, 1980; Hemphill et al., 1980; Veszki et al., 1980; de Meijer et al., 1992). Forensic studies of Cannabis examined marijuanaand hashish samples of known origin, grown in a range of environments (Jenkins and Patterson, 1973; Poddar et al., 1973; Baker et al., 1980, 1982; Bami-Comparini et al., 1984;
June 2004] HILLIG AND MAHLBERG-CANNABINOID VARIATION IN CANNABIS 967
OH OH
R R
I
A R R
OH OH OH
R = Cl!, Cannabigerovarin (CBGV) R = Cl!, Cannabivarichromene (CBCV) R = Cl!, Cannabidivarin (CBDV) R = C3H
7 .d9-Tetrahydrocannabivarin (THCV)
R - C5H11 Cannabigerol (CBG) R- C5H11 Cannabichromene (CBC) R = C5H
11 Cannabidiol (CBD) R = C5H11 .d
9-Tetrahydrocannabinol (THC)
A B C D Fig. I. Chemical structures of various cannabinoids in a Cannabis extract.
Brenneisen and ElSohly, 1988). In studies that used packed columns for gas chromatographic separations, CBC may sometimes have been mistaken for CBD because of their close retention times (Small and Beckstead, 1973a; Turner and Hadley, 1973b). Most botanical and forensic studies of Cannabis lack voucher specimens for taxonomic identification. A notable exception is the systematic/forensic investigation by Small and coworkers that is referred to extensively herein (Small and Beckstead, 1973a, b; Small et al., 1975; Small and Cronquist, 1976; Small, 1979a, b).
The cannabinoid content of different strains of Cannabis is associated with their geographic origins. Extracts of Cannabis indica ("Indian hemp") were commonly used in Western medicine, while the common hemp of Europe was generally regarded as unsuitable for medicinal use (Winek, 1977). Small and Beckstead ( l 973a, b) observed that most strains in their collection that produced high levels of THC originated from latitudes south of 30°N. They detected elevated levels of a cannabinoid presumed to be cannabigerol monomethylether (CBGM) in strains from northeast Asia. High levels of THCV were reported in Cannabis strains from southern Africa, India, Nepal, and eastern Asia (Merkus, 1971; Fetterman and Turner, 1972; Turner et al., 1973; Boucher et al., 1974; Baker et al., 1980).
The amounts of CBD and THC in an individual Cannabis plant can be characterized both qualitatively and quantitatively (Hemphill et al., 1980; Hillig, 2002; Mandolino et al., 2003). Qualitative characterization involves determining a plant's THC/CBD ratio (the inverse ratio is sometimes used) and assigning it to a discrete chemical phenotype (chemotype). Fetterman et al. ( 1971) recognized two chemotypes: a THC/CBD ratio > 1.0 characteristic of "drug-type" plants, and a THC/ CBD ratio < 1.0 characteristic of "fiber-type" plants. Small and Beckstead ( l 973a, b) also recognized an intermediate chemotype. According to their system of classification (that is used herein), chemotype I plants have a high THC/CBD ratio (::» 1.0), chemotype II plants have an intermediate ratio ( close to 1.0), and chemotype III plants have a low THC/CBD ratio (�1.0). The THC/CBD chemotype of a plant is determined at a young age and is stable beyond the seedling stage throughout the life of the plant (Bami-Comparini et al., 1984; Vogelmann et al., 1988).
In addition to the qualitative determination of THC/CBD chemotype, a plant can be characterized by the quantitative levels of cannabinoids within its tissues. These levels are likely determined by the interaction of several genes with a plant's environment. Numerous biotic and abiotic factors affect cannabinoid production including the sex and maturity of the
plant (Doorenbos et al., 1971; Fetterman et al., 1971; Small et al., 1975), daylight length (Valle et al., 1978), ambient temperature (Bazzaz et al., 1975), nutrient availability (Coffman and Gentner, 1977; B6csa et al., 1997), and ultraviolet light intensity (Lydon et al., 1987; Pate, 1994). Quantitative levels of cannabinoids also vary among different tissues within a plant (Fetterman et al., 1971; Hemphill et al., 1980). The amount of CBD or THC in the mature inflorescence of a pistillate plant (Cannabis is dioecious) may exceed 10.0% of its dry weight (d.w.), while the amount of these cannabinoids in the primary leaves is often < 1.0% (Baker et al., 1982; BarniComparini et al., 1984).
Small and Beckstead (1973a, b) and de Meijer et al. (1992) characterized Cannabis populations by determining the average CBD and THC content in a random sample of plants from a given population and calculating the THC/CBD (or CBD/ THC) ratio. This method blurs the distinction between the chemotypes of individual plants. An alternative method for population analysis is to determine the proportion of chemotype I, II, and III individuals within a sample population and calculate the frequencies of the alleles that determine this trait. This is possible due to the simple genetic control of THC/ CBD chemotype.
Enzymes that catalyze the conversion of CBG to CBD and of CBG to THC have been isolated (Taura et al., 1995, 1996). De Meijer et al. (2003) hypothesized that CBD-acid synthase and THC-acid synthase are "isoforms" of the same enzyme and are encoded at a single locus by two alleles designated B
0
and B.,,
respectively. This single-gene model is consistent with segregation ratios observed for controlled crosses between the three chemotypes (de Meijer et al., 2003; K. Hillig, unpublished data, Indiana University). In a population in HardyWeinberg equilibrium, the frequencies of B
0 and Br are ex
pected to be stable from one generation to the next and not subject to the year-to-year fluctuation of cannabinoid levels reported by de Meijer et al. (1992).
Hillig (2004) used allozyme allele frequencies (excluding B
0 and Br) to determine that most of the 157 accessions in the
Cannabis collection under study derive from two major gene pools that correspond (more or less) to previous circumscriptions of C. indica and C. sativa. The most common allele at each locus was the same for both gene pools, but significantly differed in frequency for 10 of the 17 loci surveyed. All but six accessions were assigned to the indica or sativa gene pool. Six ruderal accessions from central Asia were tentatively assigned to a third ruderalis gene pool. All of the 157 accessions were also assigned to various taxa in accord with previous taxonomic treatments and tested for goodness of fit to the ge-
968 AMERICAN JOURNAL OF BOTANY [Vol. 91
TABLE I. Taxonomic circumscription of the Cannabis germplasm collection based on a previous analysis of allozyme allele frequencies. The assignment of accessions to putative taxa was previously published (Hillig, 2004).
Putative Taxon Description
C. indica hemp biotype•C. indica feral biotypeb
C. indica NLD biotype'C. indica WLD biotype•C. sativa hemp biotype'C. sativa feral biotype'C. rude rafis&
Hemp landraces from southern and eastern Asia Feral populations from India and Nepal Narrow-leaflet drug (NLD) strains from the Indian subcontinent and other drug producing regions Wide-leaflet drug (WLD) strains from Afghanistan and Pakistan Hemp landraces from Europe, Asia Minor and central Asia Feral populations from eastern Europe Ruderal populations from central Asia
' Includes accessions previously assigned to C. chinensis Delile. b Includes accessions previously assigned to C. sativa L. subsp. indica (Lam.) Small & Cronq. var. kafiristanica (Vav.) Small & Cronq. 'Includes accessions previously assigned to C. sativa subsp. indica var. indica (Lam.) Wehmer, excluding accessions assigned to C. indica sensu
Schultes et al. (1974) and Anderson (1980). "Includes accessions previously assigned to C. indica Lam. sensu Schultes et al. (1974) and Anderson (1980). 'Includes accessions previously assigned to C. sativa subsp. sativa var. sativa sensu Small and Cronquist (1976), excluding accessions assigned
to C. chinensis. 'Includes accessions previously assigned to C. sativa subsp. sativa var. spontanea (Vav.) Small & Cronq., excluding accessions assigned to C.
ruderalis Janisch. g Includes accessions previously assigned to C. ruderalis.
netic data. Based on these results, a working hypothesis for a taxonomic circumscription of the Cannabis germplasm collection is given in Table 1. This hypothesis represents a synthesis of polytypic treatments of Cannabis by Lamarck (1785), Delile (1849), Janischewsky (1924 ), Vavilov and Bukinich (1929), Schultes et al. (1974), and Anderson (1980). Recognition of C. sativa and C. indica as separate species is primarily based on allozyme allele frequencies, morphological differences, different geographic ranges, and the fact that putative wild populations of both species have been found within the indigenous range of Cannabis, presumed to be in central Asia, the northwest Himalayas, and western China (de Candolle, 1885; Vavilov, 1926; Vavilov and Bukinich, 1929; Zukovskij, 1962; Hillig, 2004, in press). Putative infraspecific taxa of unassigned rank are referred to as "biotypes" pending a taxonomic revision of the genus, in progress. Chemotaxonornic support for a two-species hypothesis is provided by an analysis of flavonoid variation that detected luteolin C-glycuronide in 30 of 31 plants assignable to C. sativa, but not in 21 of 22 plants assignable to C. indica (Clark and Bohm, 1979).
Allozyme analysis revealed that the hemp accessions in the germplasm collection under study derive from both the C. sativa and C. indica gene pools (Hillig, 2004). Hemp landraces from Europe, Asia Minor, and central Asia are assigned to the hemp biotype of C. sativa and hemp landraces from southern and eastern Asia are assigned to the hemp biotype of C. indica.Accessions of wild or naturalized populations from eastern Europe and the northwest Himalayas are assigned to the feral biotypes of C. sativa and C. indica, respectively. Ruderal accessions from central Asia are tentatively assigned to C. ruderalis, although few morphological differences were found between these accessions and those assigned to the feral biotype of C. sativa (Hillig, in press). Plants of accessions cultivated for drug production were characterized as having either narrow lanceolate or linear-lanceolate leaflets or wide oblanceolate leaflets. Both biotypes derive from the C. indica gene pool and are morphologically distinct (Anderson, 1980; Hillig, 2004, in press).
The objective of the present study was to characterize qualitative and quantitative patterns of cannabinoid variation and differences in Bv and B7 allele frequencies among putative
taxa, in the same Cannabis collection that Hillig (2004, in press) examined in previous genetic and morphological studies. Comparison of genetic, morphological, and biochemical patterns of variation within a single set of accessions was anticipated to advance our understanding of taxonomic and evolutionary relationships within the genus.
MATERIALS AND METHODS
Germplasm collection-A diverse collection of 157 Cannabis accessions of known geographic origin was obtained from breeders, researchers, gene banks, and law enforcement agencies. Each accession consisted of a small packet of viable achenes. Passport data, accession codes, and the assignment of accessions to putative taxa are published elsewhere (Hillig, 2004). Industrial hemp strains selected for low THC production were excluded from this investigation. Voucher specimens are deposited in the Indiana University herbarium (IND). The a priori assignment of accessions to species is based on a multivariate analysis of allozyme allele frequencies and on geographic origins, without regard to cannabinoid content (Hillig, 2004). Assignment of accessions to infraspecific taxa (biotypes) is primarily based on geographic origins, morphological traits, and presumed purpose of cultivation.
Sample preparation for GC analysis-Cannabis plants were grown in two secure greenhouses at Indiana University, Bloomington, Indiana, USA. The plants were individually grown in 13-cm clay pots in a soil mixture of three parts (by volume) black peat, two parts vermiculite, and one part each of sand and top soil. Each plant received 100 mL of nutrient solution at weekly intervals during the vegetative period of growth, consisting of 25 mL of DynaGro 7-9-5 (Dyna-Gro Corporation, San Pablo, California, USA) and 18 mL of I M potassium hydroxide (to neutralize the acidity) per 3.8 L of water. Pistillate plants were isolated from staminate plants before anther dehiscence. The inflorescences of pistillate plants were sampled when resin production of each plant was visually assessed to have reached its peak. The samples were air dried at room temperature and oven dried overnight at 30°C prior to extraction. The primary and larger secondary leaves were removed, and only visibly resinous floral bracts and small subtending leaves were analyzed.
Sample extraction-Sample material (50 mg) was placed in a test tube with I mL of chloroform. The plant material was crushed with a glass rod and briefly sonicated to dislodge and/or rupture the resin heads of the glandular trichomes. The sample remained in the solvent at room temperature for at least one hour, and was sonicated again for a few seconds. A 20-µ.L volume of extract was transferred to a small test tube, and the solvent was evaporated
June 2004] HILLIG AND MAHLBERG--CANNABINOID V ARIATION IN CANNABIS 969
CBD
me
n-eicosane
CBDV
11-ICV
CBC
Time ---
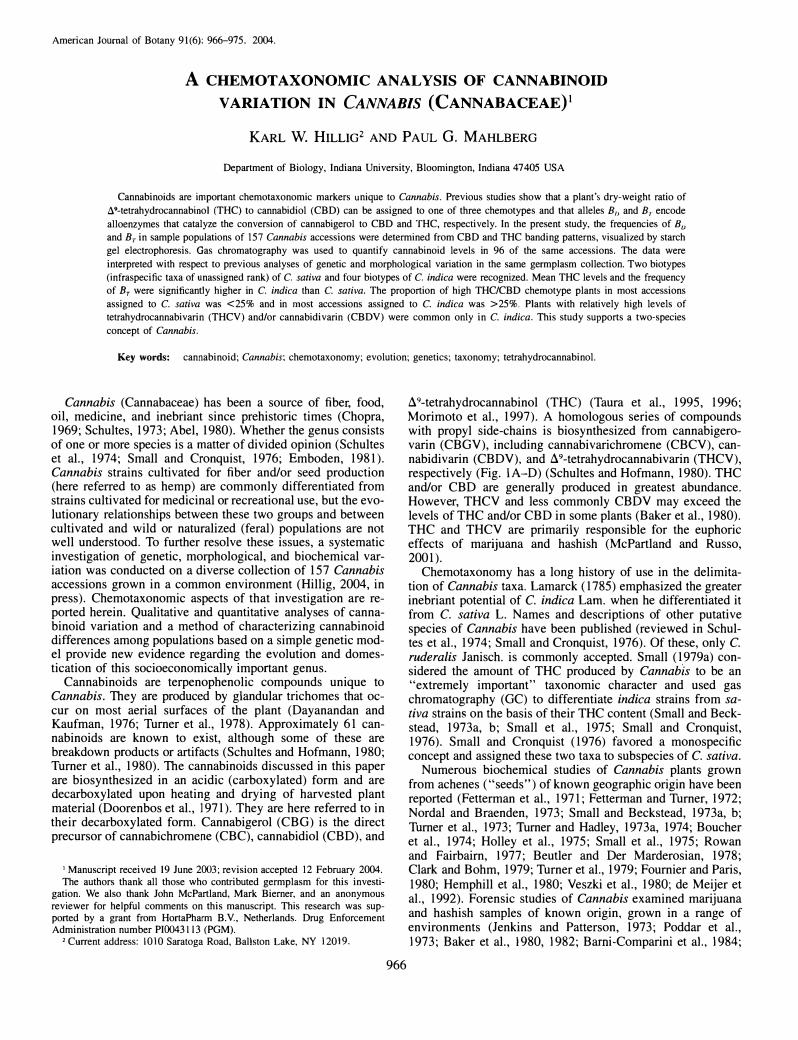
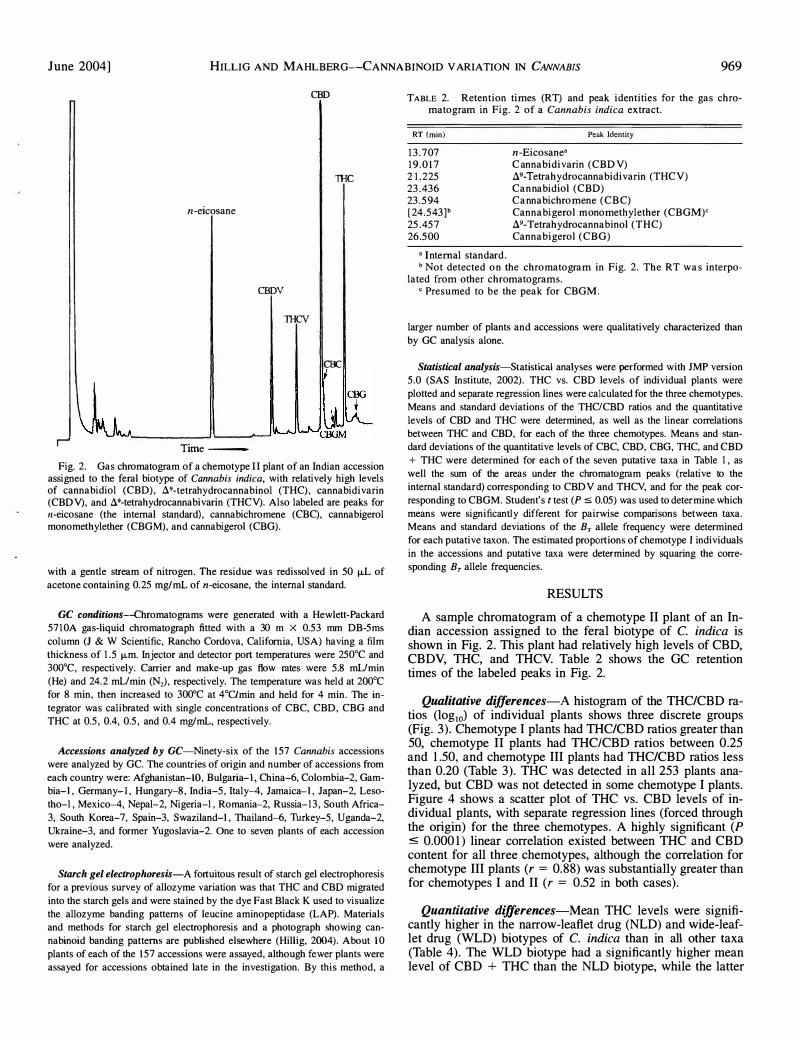
Fig. 2. Gas chromatogram of a chemotype II plant of an Indian accession assigned to the feral biotype of Cannabis indica, with relatively high levels of cannabidiol (CBD), A9-tetrahydrocannabinol (THC), cannabidivarin (CBDV), and A9-tetrahydrocannabivarin (THCV). Also labeled are peaks for n-eicosane (the internal standard), cannabichromene (CBC), cannabigerolmonomethylether (CBGM), and cannabigerol (CBG).
with a gentle stream of nitrogen. The residue was redissolved in 50 µL of acetone containing 0.25 mg/mL of n-eicosane, the internal standard.
GC conditions-Chromatograms were generated with a Hewlett-Packard 5710A gas-liquid chromatograph fitted with a 30 m X 0.53 mm DB-5ms column (J & W Scientific, Rancho Cordova, California, USA) having a film thickness of 1.5 µm. Injector and detector port temperatures were 250°C and 300°C, respectively. Carrier and make-up gas flow rates were 5.8 mUmin (He) and 24.2 mUmin (N2), respectively. The temperature was held at 200°C for 8 min, then increased to 300°C at 4°C/min and held for 4 min. The integrator was calibrated with single concentrations of CBC, CBD, CBG and THC at 0.5, 0.4, 0.5, and 0.4 mg/mL, respectively.
Accessions analyzed by GC-Ninety-six of the 157 Cannabis accessions were analyzed by GC. The countries of origin and number of accessions from each country were: Afghanistan-IO, Bulgaria-I, China-6, Colombia-2, Gambia-I , Germany-I , Hungary-8, India-5, Italy-4, Jamaica- I , Japan-2, Lesotho-I, Mexico-4, Nepal-2, Nigeria-I, Romania- 2, Russia-13, South Africa-3, South Korea-7, Spain-3, Swaziland-I , Thailand-6, Turkey-5, Uganda-2, Ukraine-3, and former Yugoslavia-2. One to seven plants of each accession were analyzed.
Starch gel electrophoresis-A fortuitous result of starch gel electrophoresis for a previous survey of allozyme variation was that THC and CBD migrated into the starch gels and were stained by the dye Fast Black K used to visualize the allozyme banding patterns of leucine aminopeptidase (LAP). Materials and methods for starch gel electrophoresis and a photograph showing cannabinoid banding patterns are published elsewhere (Hillig, 2004). About 10 plants of each of the 157 accessions were assayed, although fewer plants were assayed for accessions obtained late in the investigation. By this method, a
TABLE 2. Retention times (RT) and peak identities for the gas chromatogram in Fig. 2 of a Cannabis indica extract.
RT (min)
13.707 19.017 2 1.225 23.436 23.594 [24.543]" 25.457 26.500
• I nternal standard.
Peak Identity
n-Eicosane•C annabidivarin (CBDV)A9-Tetrahydrocannabidivarin (THCV) Cannabidiol (CBD)Cannabichromene (CBC)Cannabigerol monomethylether (CBGM)<A9-Tetrahydrocannabinol (THC)Cannabigerol (CBG)
b Not detected on the chromatogram in Fig. 2. The RT was interpolated from other chromatograms.
c Presumed to be the peak for CBGM.
larger number of plants and accessions were qualitatively characterized than by GC analysis alone.
Statistical analysis-Statistical analyses were performed with JMP version 5.0 (SAS Institute, 2002). THC vs. CBD levels of individual plants were plotted and separate regression lines were calculated for the three chemotypes. Means and standard deviations of the THCICBD ratios and the quantitative levels of CBD and THC were determined, as well as the linear correlations between THC and CBD, for each of the three chemotypes. Means and standard deviations of the quantitative levels of CBC, CBD, CBG, THC, and CBD + THC were determined for each of the seven putative taxa in Table I, as well the sum of the areas under the chromatogram peaks (relative to the internal standard) corresponding to CBDV and THCV, and for the peak corresponding to CBGM. Student's t test (P � 0.05) was used to determine which means were significantly different for pairwise comparisons between taxa. Means and standard deviations of the Br allele frequency were determined for each putative taxon. The estimated propcrtions of chemotype I individuals in the accessions and putative taxa were determined by squaring the corresponding Br allele frequencies.
RESULTS
A sample chromatogram of a chemotype II plant of an Indian accession assigned to the feral biotype of C. indica is shown in Fig. 2. This plant had relatively high levels of CBD, CBDV, THC, and THCV. Table 2 shows the GC retention times of the labeled peaks in Fig. 2.
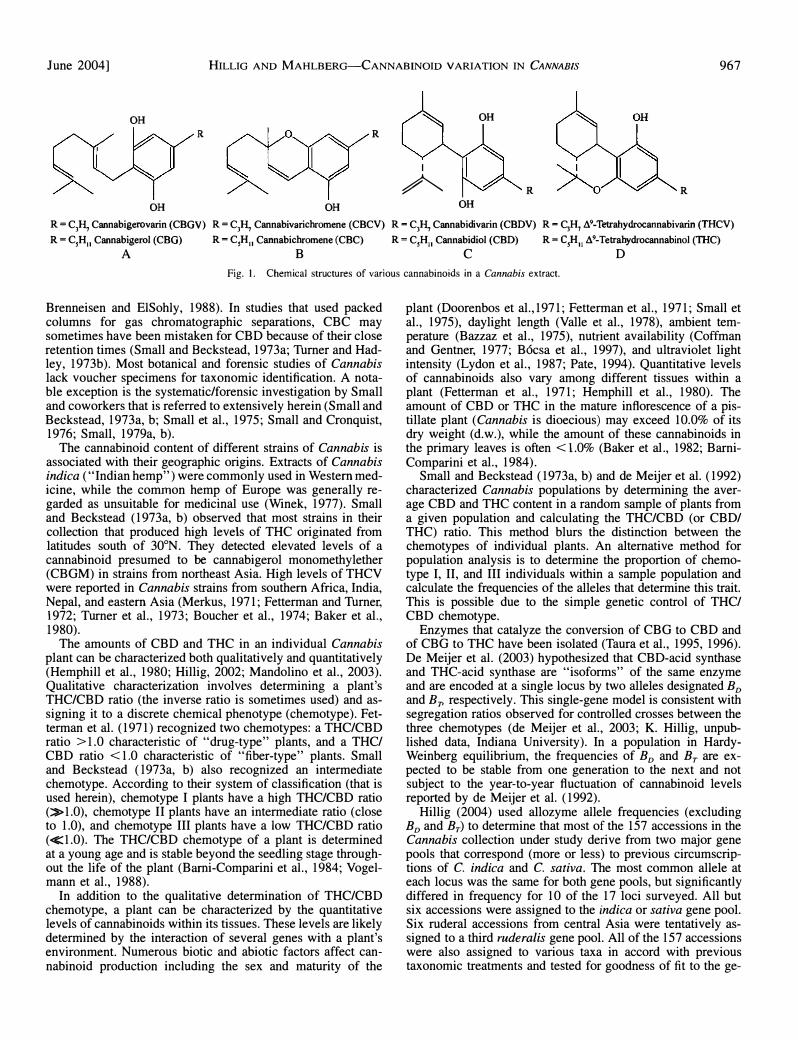
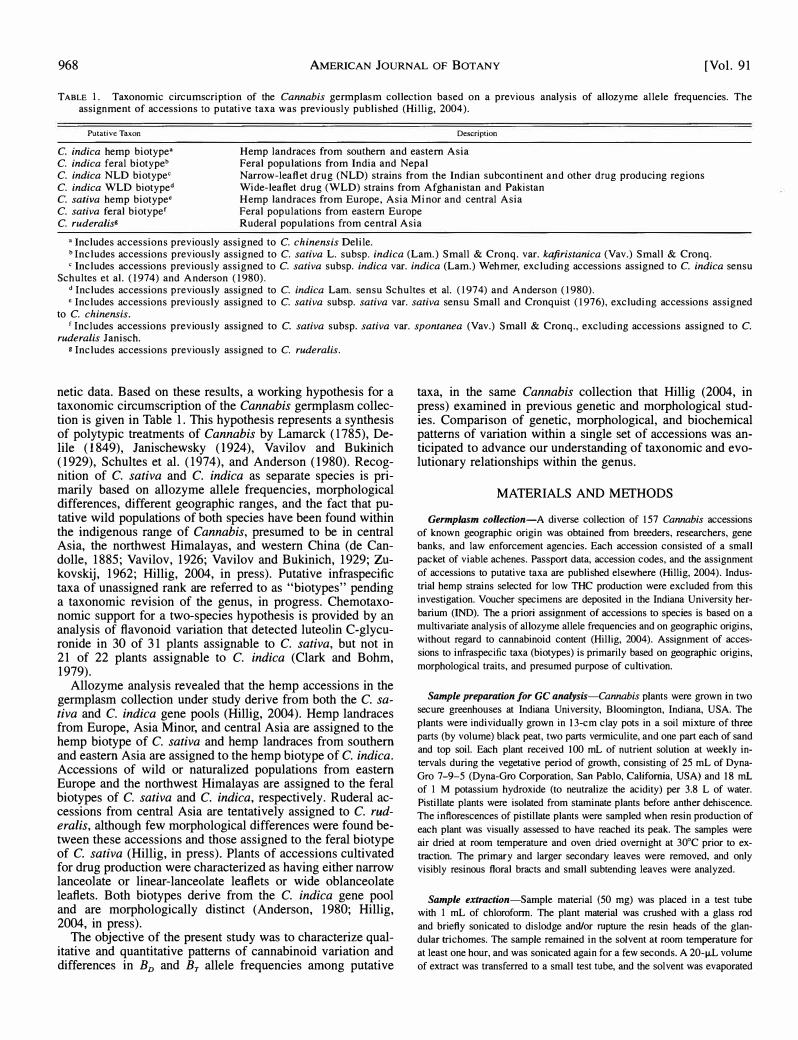
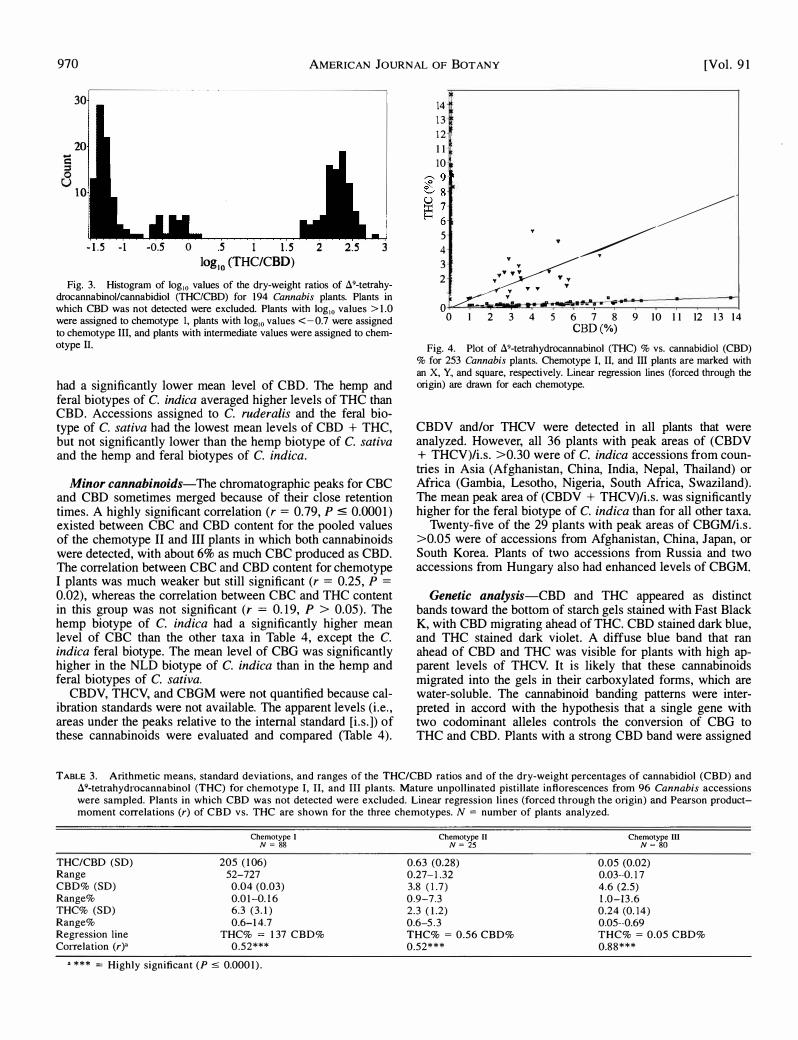
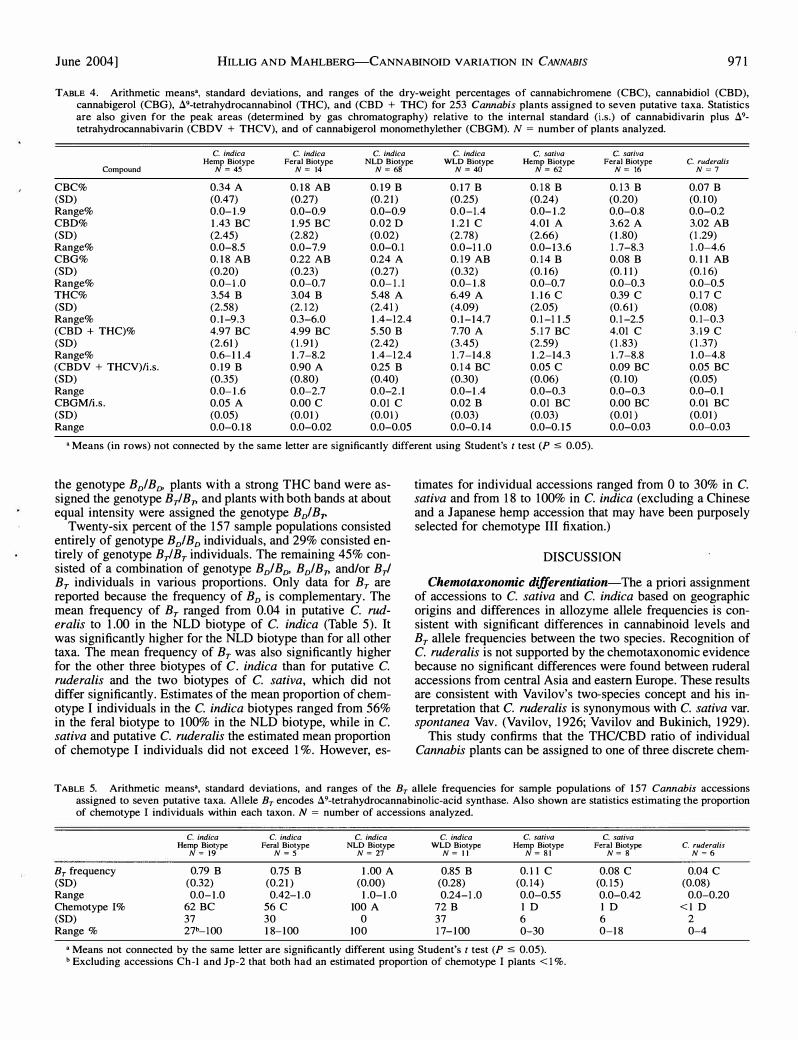
Qualitative differences-A histogram of the THC/CBD ratios (log10) of individual plants shows three discrete groups (Fig. 3). Chemotype I plants had THC/CBD ratios greater than 50, chemotype II plants had THC/CBD ratios between 0.25 and 1.50, and chemotype III plants had THC/CBD ratios less than 0.20 (Table 3). THC was detected in all 253 plants analyzed, but CBD was not detected in some chemotype I plants. Figure 4 shows a scatter plot of THC vs. CBD levels of individual plants, with separate regression lines (forced through the origin) for the three chemotypes. A highly significant (P � 0.0001) linear correlation existed between THC and CBD content for all three chemotypes, although the correlation for chemotype III plants (r = 0.88) was substantially greater than for chemotypes I and II (r = 0.52 in both cases).
Quantitative differences-Mean THC levels were significantly higher in the narrow-leaflet drug (NLD) and wide-leaflet drug (WLD) biotypes of C. indica than in all other taxa (Table 4). The WLD biotype had a significantly higher mean level of CBD + THC than the NLD biotype, while the latter
970 AMERICAN JOURNAL OF BOTANY [Vol. 91
...
c
30
20
10
- 1 .S -1 -0.5 0 .S l l .S
log10
(THC/CBD) 2 2.5 3
Fig. 3. Histogram of Jog 10 values of the dry-weight ratios of 89-tetrahydrocannabinol/cannabidiol (THC/CBD) for 194 Cannabis plants. Plants in which CBD was not detected were excluded. Plants with log 10 values > 1 .0 were assigned to chemotype I, plants with Jog,
0 values <-0.7 were assigned to chemotype III, and plants with intermediate values were assigned to chemotype IL
had a significantly lower mean level of CBD. The hemp and feral biotypes of C. indica averaged higher levels of THC than CBD. Accessions assigned to C. ruderalis and the feral biotype of C. sativa had the lowest mean levels of CBD + THC, but not significantly lower than the hemp biotype of C. sativa and the hemp and feral biotypes of C. indica.
Minor cannabinoids-The chromatographic peaks for CBC and CBD sometimes merged because of their close retention times. A highly significant correlation (r = 0.79, P ::5 0.0001) existed between CBC and CBD content for the pooled values of the chemotype II and III plants in which both cannabinoids were detected, with about 6% as much CBC produced as CBD. The correlation between CBC and CBD content for chemotype I plants was much weaker but still significant (r = 0.25, P = 0.02), whereas the correlation between CBC and THC content in this group was not significant (r = 0.19, P > 0.05). The hemp biotype of C. indica had a significantly higher mean level of CBC than the other taxa in Table 4, except the C. indica feral biotype. The mean level of CBG was significantly higher in the NLD biotype of C. indica than in the hemp and feral biotypes of C. sativa.
CBDV, THCV, and CBGM were not quantified because calibration standards were not available. The apparent levels (i.e., areas under the peaks relative to the internal standard [i.s.]) of these cannabinoids were evaluated and compared (Table 4).
14 13 12 1 1 10
5 4
3
�
.:.: ·�� 2 · � · .,:_____.,.,. y y T y
Q II� _11....._ y. --- - • • a...-
O l 2 3 4 5 6 7 8 9 10 1 1 12 1 3 14 CBD (%)
Fig. 4. Plot of 89-tetrahydrocannabinol (THC) % vs. cannabidiol (CBD) % for 253 Cannabis plants. Chemotype I, II, and III plants are marked with an X, Y, and square, respectively. Linear regression lines (forced through the origin) are drawn for each chemotype.
CBDV and/or THCV were detected in all plants that were analyzed. However, all 36 plants with peak areas of (CBDV + THCV)/i.s. >0.30 were of C. indica accessions from countries in Asia (Afghanistan, China, India, Nepal, Thailand) orAfrica (Gambia, Lesotho, Nigeria, South Africa, Swaziland).The mean peak area of (CBDV + THCV)/i.s. was significantlyhigher for the feral biotype of C. indica than for all other taxa.
Twenty-five of the 29 plants with peak areas of CBGM/i.s. >0.05 were of accessions from Afghanistan, China, Japan, orSouth Korea. Plants of two accessions from Russia and twoaccessions from Hungary also had enhanced levels of CBGM.
Genetic analysis-CBD and THC appeared as distinct bands toward the bottom of starch gels stained with Fast Black K, with CBD migrating ahead of THC. CBD stained dark blue, and THC stained dark violet. A diffuse blue band that ran ahead of CBD and THC was visible for plants with high apparent levels of THCV. It is likely that these cannabinoids migrated into the gels in their carboxylated forms, which are water-soluble. The cannabinoid banding patterns were interpreted in accord with the hypothesis that a single gene with two codominant alleles controls the conversion of CBG to THC and CBD. Plants with a strong CBD band were assigned
TABLE 3. Arithmetic means, standard deviations, and ranges of the THC/CBD ratios and of the dry-weight percentages of cannabidiol (CBD) and 89-tetrahydrocannabinol (THC) for chemotype I, II, and III plants. Mature unpollinated pistillate inflorescences from 96 Cannabis accessions were sampled. Plants in which CBD was not detected were excluded. Linear regression lines (forced through the origin) and Pearson productmoment correlations (r) of CBD vs. THC are shown for the three chemotypes. N = number of plants analyzed.
Chemotype I Chemotype II Chemotype III N = 88 N = 25 N = 80
THC/CBD (SD) 205 ( 106) 0.63 (0.28) 0.05 (0.02) Range 52-727 0.27-1 .32 0.03--0. 1 7 CBD% (SD) 0.04 (0.03) 3.8 ( 1 .7) 4.6 (2.5) Range% 0.01--0. 1 6 0.9-7.3 1 .0-13.6 THC% (SD) 6.3 (3. 1 ) 2.3 ( 1 .2) 0.24 (0. 14) Range% 0.6-14.7 0.6-5.3 0.05--0.69 Regression line THC% = 1 37 CBD% THC% = 0.56 CBD% THC% = 0.05 CBD% Correlation (r)• 0.52*** 0.52*** 0.88***
• *** = Highly significant (P $ 0.0001) .
June 2004] HILLIG AND MAHLBERG-CANNABINOID VARIATION IN CANNABIS 971
TABLE 4. Arithmetic means•, standard deviations, and ranges of the dry-weight percentages of cannabichromene (CBC), cannabidiol (CBD), cannabigerol (CBG), d9-tetrahydrocannabinol (THC), and (CBD + THC) for 253 Cannabis plants assigned to seven putative taxa. Statistics are also given for the peak areas (determined by gas chromatography) relative to the internal standard (i.s.) of cannabidivarin plus d9
-
tetrahydrocannabivarin (CBDV + THCV), and of cannabigerol monomethylether (CBGM). N = number of plants analyzed.
C. indica C. indica C. indica C. indica C. sativa C. sativa
Hemp Biotype Feral Biotype NLD Biotype WLD Biotype Hemp Biotype Feral Biotype C. ruderalis
Compound N = 45 N = 14 N = 68 N = 40 N = 62 N = 16 N = ?
CBC% 0.34 A 0. 1 8 AB 0. 19 B 0. 17 B 0. 1 8 B 0. 13 B 0.07 B (SD) (0.47) (0.27) (0.21) (0.25) (0.24) (0.20) (0. 10) Range% 0.0-1 .9 0.0-0.9 0.0-0.9 0.0-1.4 0.0- 1 .2 0.0-0.8 0.0-0.2 CBD% 1 .43 BC 1 .95 BC 0.02 D 1 .2 1 C 4.01 A 3.62 A 3.02 AB (SD) (2.45) (2.82) (0.02) (2.78) (2.66) ( 1 .80) (1 .29) Range% 0.0-8.5 0.0-7.9 0.0-0. 1 0.0-1 1 .0 0.0-13.6 1 .7-8.3 1 .0-4.6 CBG% 0. 1 8 AB 0.22 AB 0.24 A 0. 19 AB 0. 14 B 0.08 B 0. 1 1 AB(SD) (0.20) (0.23) (0.27) (0.32) (0. 1 6) (0. 1 1 ) (0. 1 6)Range% 0.0-1 .0 0.0-0.7 0.0- 1 . 1 0.0-1 .8 0.0-0.7 0.0-0.3 0.0-0.5THC% 3.54 B 3.04 B 5.48 A 6.49 A 1 . 1 6 C 0.39 C 0. 1 7 C(SD) (2.58) (2. 1 2) (2.41 ) (4.09) (2.05) (0.61) (0.08)Range% 0.1-9.3 0.3-6.0 1 .4-12.4 0.1-14.7 0. 1-1 1 .5 0. 1-2.5 0. 1-0.3(CBD + THC)% 4.97 BC 4.99 BC 5.50 B 7.70 A 5 . 17 BC 4.01 C 3 . 19 C(SD) (2.61 ) ( 1 .9 1 ) (2.42) (3.45) (2.59) (1 .83) ( 1 .37)Range% 0.6-1 1 .4 1 .7-8.2 1 .4-12.4 1 .7-14.8 1 .2-14.3 1 .7-8.8 1 .0-4.8(CBDV + THCV)/i.s. 0 . 19 B 0.90 A 0.25 B 0. 14 BC 0.05 C 0.09 BC 0.05 BC(SD) (0.35) (0.80) (0.40) (0.30) (0.06) (0. 10) (0.05)Range 0.0-1 .6 0.0-2.7 0.0-2 . 1 0.0-1 .4 0.0-0.3 0.0-0.3 0.0-0. 1CBGM/i.s. 0.05 A 0.00 C 0.01 C 0.02 B 0.01 BC 0.00 BC 0.01 BC(SD) (0.05) (0.01 ) (0.01 ) (0.03) (0.03) (0.01 ) (0.01 )Range 0.0-0. 1 8 0.0-0.02 0.0-0.05 0.0-0. 14 0.0-0. 15 0.0-0.03 0.0-0.03
• Means (in rows) not connected by the same letter are significantly different using Student's t test (P :s 0.05).
the genotype Bv!Bv, plants with a strong THC band were assigned the genotype BJ Br, and plants with both bands at about equal intensity were assigned the genotype Bv!Br
Twenty-six percent of the 157 sample populations consisted entirely of genotype BvlBv individuals, and 29% consisted entirely of genotype BJBT individuals. The remaining 45% consisted of a combination of genotype BvlBv, Bv!Br, and/or BT/ BT individuals in various proportions. Only data for BT are reported because the frequency of Bv is complementary. The mean frequency of BT ranged from 0.04 in putative C. ruderalis to 1.00 in the NLD biotype of C. indica (Table 5). It was significantly higher for the NLD biotype than for all other taxa. The mean frequency of BT was also significantly higher for the other three biotypes of C. indica than for putative C. ruderalis and the two biotypes of C. sativa, which did not differ significantly. Estimates of the mean proportion of chemotype I individuals in the C. indica biotypes ranged from 56% in the feral biotype to I 00% in the NLD biotype, while in C. sativa and putative C. ruderalis the estimated mean proportion of chemotype I individuals did not exceed 1 %. However, es-
timates for individual accessions ranged from O to 30% in C. sativa and from 18 to 100% in C. indica (excluding a Chinese and a Japanese hemp accession that may have been purposely selected for chemotype III fixation.)
DISCUSSION
Chemotaxonomic differentiation-The a priori assignment of accessions to C. sativa and C. indica based on geographic origins and differences in allozyme allele frequencies is consistent with significant differences in cannabinoid levels and BT allele frequencies between the two species. Recognition of C. ruderalis is not supported by the chemotaxonomic evidencebecause no significant differences were found between ruderalaccessions from central Asia and eastern Europe. These resultsare consistent with Vavilov's two-species concept and his interpretation that C. ruderalis is synonymous with C. sativa var. spontanea Vav. (Vavilov, 1926; Vavilov and Bukinich, 1929).
This study confirms that the THC/CBD ratio of individual Cannabis plants can be assigned to one of three discrete chem-
TABLE 5. Arithmetic means•, standard deviations, and ranges of the Br allele frequencies for sample populations of 1 57 Cannabis accessions assigned to seven putative taxa. Allele Br encodes d9-tetrahydrocannabinolic-acid synthase. Also shown are statistics estimating the proportion of chemotype I individuals within each taxon. N = number of accessions analyzed.
C. indica C. indica C. indica C. indica C. sativa C. sativa
Hemp Biotype Feral Biotype NLD Biotype WLD Biotype Hemp Biotype Feral Biotype C. ruderalis
N = 19 N = 5 N = 27 N = 1 1 N = 8 1 N = 8 N = 6
Br frequency 0.79 B 0.75 B 1 .00 A 0.85 B 0. 1 1 C 0.08 C 0.04 C(SD) (0.32) (0.21 ) (0.00) (0.28) (0. 14) (0. 15) (0.08)Range 0.0-1 .0 0.42-1 .0 1 .0-1 .0 0.24-1 .0 0.0-0.55 0.0-0.42 0.0-0.20Chemotype 1% 62 BC 56 C 100 A 72 B 1 D 1 D <I D(SD) 37 30 0 37 6 6 2 Range % 27b-IOO 1 8-100 100 17-100 0-30 0-18 0-4
• Means not connected by the same letter are significantly different using Student's t test (P :s 0.05).b Excluding accessions Ch-I and Jp-2 that both had an estimated proportion of chemotype I plants < I %.
972 AMERICAN JOURNAL OF BOTANY [Vol. 91
otypes. The limits between chemotypes coincide with those reported by Vollner et al. (1986). As expected, plants with high levels of THC were common within the two drug biotypes of C. indica. However, plants with relatively high levels of THCwere also common within the hemp and feral biotypes of thisspecies. In contrast, most plants assigned to C. sativa had relatively low levels of THC. Because chemotype I, II, and IIIplants were found in both species, the chemotype of an individual plant is of limited use for chemotaxonomic determination of species membership.
It was estimated that chemotype I individuals comprised <25% of each population for all but two of the 89 accessions assigned to C. sativa and >25% of each population for all but four of the 62 accessions assigned to C. indica. This appears to be a reasonable guideline for differentiation of the two species, in conjunction with other taxonomic traits. The advantage of this approach over the method of Small and Cronquist (1976) for differentiating sativa from indica (regardless of taxonomic rank) is that the frequency of chemotype I plants in a given population is stable from one generation to the next (assuming Hardy-Weinberg equilibrium) and not influenced by biotic and abiotic factors that affect the quantitative production of cannabinoids. For populations that have been purposely selected for a fixed chemotype, geographic origin and morphological traits are better indicators of species membership (Hillig, 2004, in press).
Small and Beckstead ( 1973a) reported that chemotype I strains usually originate from countries south of latitude 30°N and that chemotype II and III strains usually originate from countries north of this latitude. In the present study, nearly all accessions having a relatively low BT frequency ( <0.4) originated from latitudes north of 35°N. However, several accessions with a relatively high BT frequency (>0.4) also originated from above this latitude, including drug accessions from Afghanistan and Pakistan and hemp accessions from China, Japan, and South Korea. It appears that the range of C. sativain Europe and Asia does not extend below about 35°N latitude, whereas the range of C. indica extends both above and below this latitude (Hillig, 2004).
The propyl side-chain homologs of CBD and THC are also of chemotaxonomic significance. Elevated levels of CBDV and/or THCV were much more common in plants of C. indicathan in plants of C. sativa. Plants with elevated levels of THCV, sometimes exceeding THC, were detected in all four biotypes of C. indica, but not in all accessions. Segregation ratios in F2 populations from controlled crosses between low and high THCV individuals indicate that at least two loci control this trait (de Meijer et al., 2003; K. Hillig, unpublished data). The gene(s) controlling the enhanced biosynthesis of propyl cannabinoids appear to have originated in C. indica and not to have spread appreciably into C. sativa.
Small and Beckstead (1973b) reported that plants of several accessions from China, Japan, and South Korea had enhanced levels of CBGM. They assigned these accessions to a fourth chemotype, but Small and Cronquist (1976) did not treat this group as a separate taxon. In the present study, a relatively high apparent level of CBGM was most common in plants assigned to the hemp biotype of C. indica. This trait appears to be a useful chemotaxonomic marker for differentiating this tax on.
For the purpose of hypothesis testing, Hillig (2004) assigned hemp landraces from southern and eastern Asia to C. chinensisDelile. Although Small and Cronquist (1976) reduced C. chi-
nensis to synonymy with C. sativa subsp. sativa var. sativa(together with European hemp), an analysis of allozyme allele frequencies shows that the southern and eastern Asian hemp accessions in the germplasm collection under study derive from the C. indica gene pool (Hillig, 2004 ). In general, the southern and eastern Asian hemp accessions consisted mostly of chemotype I plants, although they tended to produce less THC than accessions assigned to the drug biotypes. This is consistent with the results of Rowan and Fairbairn (1977) who reported relatively high THC/CBD ratios but low THC content in plants grown from birdseed of Chinese origin. Hong and Clarke (1996) reported that hemp strains cultivated in China are generally lower in THC than drug strains, but THC/CBD ratios were not reported. European hemp breeders have struggled for over 50 years to reduce THC levels in Chinese hemp, partially because they did not recognize that eastern Asian hemp is a biotype of C. indica (Bredemann et al., 1956).
For systematic studies, it is best to obtain achenes of southern and eastern Asian strains directly from sources in these regions because of the possibility that such strains in European germplasm collections have hybridized with C. sativa. The Cannabis germplasm collection studied by Small and Beckstead (1973b) included accessions labeled "gigantea," "sinensis," "indica," and "himalayana" that were obtained from European sources, although these labels suggest that these strains were of Asian origin. Small and Beckstead categorized these accessions as chemotype II or III populations, in contrast with accessions obtained directly from China, India, Japan, and South Korea, several of which were categorized as chemotype I populations. A few strains from China and Japan with relatively high THC/CBD ratios were categorized with the moderate to low ( <0.5% d.w.) THC strains, apparently due to their late maturity and low resin production. It seems likely that several of the aforementioned strains that Small and Beckstead obtained from European sources were hybridized with C. sativa and that several strains from southern and easternAsian sources that they included in the high THC categorywere cultivated for fiber and/or seed production, and not fordrug production.
Quantitative differences-The cannabinoid levels reported in this investigation are approximately four to five times greater than those reported by Small and Beckstead (1973b). About 20% of the chemotype III plants had THC levels >0.30% d.w. of the sampled plant material, which exceeds the arbitrary divide established by Small and Beckstead between "non-psychotomimetic" and "psychotomimetic" plants. This 0.3% value is used in several countries as an upper limit for allowable THC levels in industrial hemp strains (Small, 1999). The present study shows that an upper limit of 0.8% d.w. of THC would be more consistent with the natural range of variation among chemotype III plants, based on a hypothetical maximum d.w. of 16% CBD in pistillate inflorescences and a 1 : 20 ratio of THC : CBD.
Although CBD was not detected in some chemotype I plants, separate GC analyses in which more highly concentrated extracts were analyzed show that CBD was indeed present in these plants, but below the threshold of detection in the present study (K. Hillig, unpublished data, Indiana University). This may also be the case in other studies that reported the absence of CBD in certain drug strains (summarized in Baker et al., 1980). About 5% as much THC relative to CBD was produced in chemotype III plants, which is close to
June 2004] HILLIG AND MAHLBERG-CANNABINOID VARIATION IN CANNABIS 973
the 4% value reported by Fournier and Paris (1980). Reasons for the low level production of CBD in chemotype I plants and of THC in chemotype III plants are unknown. De Meijer et al. (2003) hypothesized that more than one variant of the CBD-acid synthase and/or THC-acid synthase alleles are present in the Cannabis gene pool and that these variant alleles encode allozymes with different catalytic efficiencies. They proposed that different combinations of these alleles result in somewhat different THC/CBD ratios among heterozygous (B0/
BT) individuals. The histogram in Fig. 3 appears to show a bimodal distribution among chemotype II plants, consistent with this hypothesis. However, only two alleles (B0 and BT) were inferred from the CBD and THC banding patterns visualized by starch gel electrophoresis.
Barni-Comparini et al. (1984) reported the complete absence of CBC in chemotype II and III plants. In the present study, CBC was detected in all three chemotypes but not in all plants. The high correlation (r = 0.79) between CBC and CBD levels in chemotype II and III plants has not previously been reported. Curiously, the highest levels of CBC were detected in staminate flowers of chemotype I plants assigned to the hemp biotype of C. indica (K. Hillig, unpublished data, Indiana University).
Domestication and evolution-Small and Cronquist (1976) assumed that the sativa and indica taxa diverged primarily as a result of human selection for fiber and/or seed production on the one hand and for high THC production on the other. However, the present investigation does not support this hypothesis. The high frequency of BT in the feral biotype of C. indica suggests that this allele may have been present at high frequency in the C. indica gene pool prior to domestication. Human selection of plants carrying two copies of the BT allele appears only to be of appreciable significance in the domestication of the NLD biotype. Human selection may have resulted in an increase in the quantitative levels of cannabinoids produced by the WLD biotype, but the average amount of CBD + THC produced by the NLD biotype did not significantly differ from the hemp and feral biotypes of C. indica. In fact, the average amount of THC + CBD produced by the NLD accessions was not significantly greater than the average amount of these two cannabinoids produced by the hemp accessions of C. sativa. Small and Beckstead (1973b) also reported comparable levels of total cannabinoids in their "psychotomimetic" and "non-psychotomimetic" strains. Plants with enhanced levels of THCV were uncommon in most drug accessions, except those from southern Africa and an accession from Afghanistan. This suggests that humans may have selected against this trait in cultivated drug strains.
In contrast with the NLD biotype, the WLD biotype did not have a significantly higher frequency of BT than the hemp and feral biotypes of C. indica. This may be explained by the different products obtained from the two drug biotypes of C. indica. NLD strains are usually cultivated for the production of marijuana (pistillate inflorescences), and it is the product of a single plant that is utilized. WLD strains are traditionally cultivated for the production of hashish (detached glandular trichomes), which is the combined product of many plants. A marijuana plant with two Bv alleles (chemotype III) would be ineffectual for its intended use, whereas hashish made from a population of chemotype I, II, and III individuals typically contains more THC than CBD and depending on the proportions of the different chemotypes is more or less psychoactive
(Ek et al., 1972; Clarke, 1998). Thus, human selection is expected to favor chemotype I plants as seed sources for marijuana cultivation, whereas the chemotypes of individual plants cultivated for hashish production are usually unknown to the cultivator (Clarke and Watson, 2002).
The presence of allele BT in the C. sativa gene pool suggests that introgression from C. indica might have played a role in the evolution of C. sativa. Wind-blown pollen may have contributed to allele migration between the two gene pools (Cabezudo et al., 1997). Relatively high BT frequencies (range 0.38-0.55) were detected in seven hemp accessions from Turkey, Spain, Italy, former Yugoslavia, and southern Russia, which are assignable to the southern eco-geographical group of C. sativa (Davidyan, 1972). Additional allozyme markers and morphological traits typical of C. indica were also observed in the southern group of C. sativa (Hillig, 2004, in press). Cannabis indica may have been introduced into Asia Minor for the purpose of hashish production and hybridized with C. sativa. Davidian (1972) cited evidence that Cannabis was introduced into Europe by both a northern and a southern route. Introgressed stock may have spread into new areas through trade or human migration (Heiser, 1973).
The patterns of cannabinoid variation provide evidence of progenitor-derivative relationships. The low frequency of BT
and the low levels of propyl cannabinoids in accessions assigned to C. ruderalis suggest that this putative taxon could be the progenitor of C. sativa, but not of C. indica. The feral biotype of C. sativa may be comprised of "escaped" populations of cultivated C. sativa that have merged with naturalized populations of C. ruderalis (Vavilov, 1926). The wide range of cannabinoid variation within feral accessions of C. indica suggests that this biotype could be the progenitor of the cultivated biotypes of C. indica. The high incidence of plants in this taxon with enhanced levels of propyl cannabinoids suggests that it is not the progenitor of C. sativa, in which plants with enhanced levels of propyl cannabinoids are much less common. It is unlikely that the feral biotype of C. indica represents an escape of NLD strains from cultivation because the NLD biotype is lacking in cannabinoid variation. The high frequency of BT in the hemp biotype of C. indica suggests the possibility that one or both drug biotypes could have been secondarily derived from this taxon's gene pool. More feral and cultivated populations of C. indica and C. sativa will have to be studied to further resolve these issues.
This study of cannabinoid variation supports a two-species concept for Cannabis. A taxonomic revision that applies valid scientific names to the biotypes of C. indica recognized herein is supported by the chemotaxonomic data.
LITERATURE CITED
ABEL, E. L. 1980. Marihuana. The first twelve thousand years. Plenum Press, New York, New York, USA.
ANDERSON, L. C. 1980. Leaf variation among Cannabis species from a controlled garden. Harvard University Botanical Museum Leaflets 28: 61-69.
BAKER, P. B., T. A. GOUGH, S. I. M. JOHNCOCK, B. J. TAYLOR, AND L. T. WYLES. 1982. Variation in the THC content in illicitly imported Cannabis products. Part II. Bulletin on Narcotics 34: 101-108.
BAKER, P. B., T. A. GOUGH, AND B. J. TAYLOR. 1980. Illicitly imported Cannabis products: some physical and chemical features indicative of their origin. Bulletin on Narcotics 32: 31-40.
BARNI-COMPARINI, I., s. FERRI, AND E CENTINI. 1984. Cannabinoid level inthe leaves as a tool for the early discrimination of Cannabis chemiovariants. Forensic Science International 24: 37-42.
974 AMERICAN JOURNAL OF BOTANY [Vol. 9 1
BAZZAZ, F. A., D . DUSEK, D. S. SEIGLER, AND A. W. HANEY. 1975. Photosynthesis and cannabinoid content of temperate and tropical populations of Cannabis sativa. Biochemical Systematics and Ecology 3: 15-18.
BEUTLER, J. A., AND A. H. DER MARDEROSIAN. 1978. Chemotaxonomy of Cannabis I. Crossbreeding between Cannabis sativa and C. ruderalis, with analysis of cannabinoid content. Economic Botany 32: 387-394.
86CSA, I., P. MATHE, AND L. HANGYEL. 1997. Effect of nitrogen on tetrahydrocannabinol (THC) content in hemp (Cannabis sativa L.) leaves at different positions. Journal of the International Hemp Association 4: 80-8 1.
BOUCHER, F., L. COSSON, J. UNGER, AND M. R. PARIS. 1974. Le Cannabis sativa L. Races chimiques ou varietes. Plan/es Medicinales et Phytotherapie 8: 20-31.
BREDEMANN, G., FR. SCHWANITZ, AND R. VON SENGBUSCH. 1956. Problems of modern hemp breeding, with particular reference to the breeding of varieties of hemp containing little or no hashish. Bulletin on Narcotics 8: 3 1-35.
BRENNEISEN, R., AND M. A. ELSOHLY. 1988. Chromatographic and spectroscopic profiles of Cannabis of different origins. Part I. Journal of Forensic Sciences 33: 1385-1404.
CABEZUDO, 8., M. RECIO, J. M. SANCHEZ-LAULHE, M. DEL MAR TRIGO, F. J. TORO, AND F. PoL VORINOS. 1997. Atmospheric transportation of marihuana pollen from North Africa to the southwest of Europe. Atmospheric Environment 31 : 3323-3328.
CHOPRA, G. S. 1969. Man and marijuana. The International Journal of the Addictions 4: 2 15-247.
CLARK, M. N., AND B. A. BOHM. 1979. Flavonoid variation in Cannabis L. Botanical Journal of the Linnean Society 79: 249-257.
CLARKE, R. C . 1998. Hashish! Red Eye Press, Los Angeles, California, USA. CLARKE, R. C., AND D. P. WATSON. 2002. Botany of natural Cannabis med
icines. In F. Grotenhermen and E. Russo [eds.], Cannabis and cannabinoids: pharmacology, toxicology and therapeutic potential, 3-13. Haworth Integrative Healing Press, Binghamton, New York, USA.
COFFMAN, C. 8., AND W. A. GENTNER. 1977. Responses of greenhousegrown Cannabis sativa L. to nitrogen, phosphorous, and potassium. Agronomy Journal 69: 832-836.
DAVIDYAN, G. G. 1972. Botanicheskaya kharakteristika konopli. Trudy po Prikladnoi Botanike, Genetike i Seliktsii 48: 17-52.
DAYANANDAN, P., AND P. B. KAUFMAN. 1976. Trichomes of Cannabis saliva L. (Cannabaceae). American Journal of Botany 63: 578--591 .
D E CANDOLLE, A. 1885. Origin of cultivated plants, 148--149. D . Appleton and Company, New York, New York, USA.
DELILE, A. R. 1849. Index seminum horti botanici Monspeliensis. Anna/es des Sciences Naturelles; Botanique 12: 365-366.
DE MEJJER, E. P. M., M. 8AGATTA, A. CARBONI, P. CRUCITTI, V. M. CR!STIANA MOLITERNI, P. RANALLI, AND G. MANDOLINO. 2003. The inheritance of chemical phenotype in Cannabis saliva L. Genetics 163: 335-346.
DE MEJJER, E. P. M., H. J. VAN DER KAMP, AND F. A. VAN EEUWJJK. 1992. Characterisation of Cannabis accessions with regard to cannabinoid content in relation to other plant characters. Euphytica 62: 187-200.
DOORENBOS, N. J., P. S. FETIERMAN, M. W. QUIMBY, AND C. E. TURNER. 1971. Cultivation, extraction, and analysis of Cannabis sativa L. Annals of the New York Academy of Sciences 19 1 : 3-14.
EK, N. A., E. L6NBERG, A. c. MAEHLY, AND L. STROMBERG. 1972. Cannabinoid content of fifty seized hashish samples. Journal of Forensic Sciences 17: 456--459.
EMBODEN, W. A. 1981. The genus Cannabis and the correct use of taxonomic categories. Journal of Psychoactive Drugs 13: 15-21 .
FETTERMAN, P. S., E. s. KEITH, C. W. WALLER, 0. GUERRERO, N. J . DooRENBOS, AND M. W. QUIMBY. 1971. Mississippi-grown Cannabis sativa L. Preliminary observation on chemical definition of phenotype and variations in tetrahydrocannabinol content versus age, sex, and plant part. Journal of Pharmaceutical Sciences 60: 1246--1249.
FETTERMAN, P. s., AND C. E. TURNER. 1972. Constituents of Cannabis sativa L. I. Propyl homologs of cannabinoids from an Indian variant. Journalof Pharmaceutical Sciences 61: 1476--1477.
FOURNIER, G., AND M. PARIS. 1980. Determination de chimiotypes a partir des cannabinoi:des chez le Chanvre a fibres monoi:que (Cannabis sativa L.). Possibilites de selection. Physiologie Vegetale 18: 349-356.
HEISER, C. B. 1973. Introgression re-examined. The Botanical Review 39: 347-366.
HEMPHILL, J. K., J. c. TURNER, AND P. G. MAHLBERG. 1980. Cannabinoid
content of individual plant organs from different geographical strains of Cannabis sativa L. Journal of Natural Products 43: 1 12-122.
HILLIG, K. 2002. Letter to the editor. Journal of Industrial Hemp 7: 5-6. HILLIG, K. W. 2004 In press. Genetic evidence for speciation in Cannabis
(Cannabaceae). Genetic Resources and Crop Evolution 51 . HILLIG, K . W . In press. A multivariate analysis of phenotypic variation in
Cannabis. Systematic Botany. HOLLEY, J. H., K. w. HADLEY, AND c. E. TURNER. 1975. Constituents of
Cannabis sativa L. XI. Cannabidiol and cannabichromene in samples of known geographical origin. Journal of Pharmaceutical Sciences 64: 892-894.
HONG, S., AND R. C. CLARKE. 1996. Taxonomic studies of Cannabis in China. Journal of the International Hemp Association 3: 55-60.
JANISCHEWSKY, D. E. 1924. Forma konopli na sornykh mestakh v Yugovostochnoi Rossii. In I. A. Chiuevsky [ed.], Uchenye Zapiski Gosudarstvennogo Saratovskogo imeni N. G. Chernyshevskogo Universiteta. FisikoMatematicheskoye otdelenie Pedagogicheskogo Fakul'teta vol. II, no. 2, 3-17. Saratov University Press, Saratov, USSR.
JENKINS, R. W., AND D. A. PATTERSON. 1973. The relationship between chemical composition and geographical origin of Cannabis. Forensic Science 2: 59-66.
LAMARCK, J. B. DE 1785. Encyclopedique methodique, Botanique I (part 2): 694-695. Panckoucke, Paris, France.
LYDON, J., A. H. TERAMURA, AND c. B. COFFMAN. 1987. UV-8 radiation effects on photosynthesis, growth and cannabinoid production of two Cannabis sativa chemotypes. Photochemistry and Photobiology 46: 201-206.
MANDOLINO, G., M. 8AGATIA, A. CARBONI, P. RANALLI, AND E. DE MEIJER. 2003. Qualitative and quantitative aspects of the inheritance of chemical phenotype in Cannabis. Journal of Industrial Hemp 8: 5 1-72.
MCPARTLAND, J. M., AND E. B. Russo. 2001 . Cannabis and Cannabis extracts: greater than the sum of their parts? Journal of Cannabis Therapeutics I : 103-132.
MERKUS, F. W. H. M. 1971. Cannabivarin and tetrahydrocannabivarin, two new constituents of hashish. Nature 232: 579-580.
MORIMOTO, S., K. KOMATSU, F. TAURA, AND Y. SHOYAMA. 1997. Enzymological evidence for cannabichromenic acid biosynthesis. Journal of Natural Products 60: 854-857.
NORDAL, A., AND 0. BRAENDEN. 1973. Variations in the cannabinoid content of Cannabis plants grown from the same batches of seeds under different ecological conditions. Saertrykk av Meddelelser fra Nordsk Farmaceutisk Selkap 35: 8-15.
PATE, D. W. 1994. Chemical ecology of Cannabis. Journal of the International Hemp Association I : 29, 32-37.
PODDAR, M. K., J. J. GHOSH, AND J. DUTTA. 1973. A study on cannabinol composition of Indian Cannabis. Journal of the Indian Academy of Forensic Sciences 12: 1-4.
ROWAN, M. G., AND J. w. FAIRBAIRN. 1977. Cannabinoid patterns in seedlings of Cannabis sativa L. and their use in the determination of chemical race. Journal of Pharmacy and Pharmacology 29: 491-494.
SAS INSTITUTE. 2002. JMP statistics and graphics guide. SAS Institute, Cary, North Carolina, USA.
SCHULTES, R. E. 1973. Man and marijuana. Natural History 82: 58--63, 80, 82.
SCHULTES, R. E., AND A. HOFMANN. 1980. The botany and chemistry of hallucinogens. Charles C. Thomas, Springfield, Illinois, USA.
SCHULTES, R. E., W. M. KLEIN, T. PLOWMAN, AND T. E. LOCKWOOD. 1974. Cannabis: an example of taxonomic neglect. Harvard University Botanical Museum Leaflets 23: 337-367.
SMALL, E. 1979a. The species problem in Cannabis, vol. 1, Science. Corpus Information Services, Toronto, Ontario, Canada.
SMALL, E. 1979b. The species problem in Cannabis, vol. 2, Semantics. Corpus Information Services, Toronto, Ontario, Canada.
SMALL, E. 1999. Interview. Journal of the International Hemp Association 6: 67-71.
SMALL, E., AND H. D. BECKSTEAD. l 973a. Cannabinoid phenotypes in Cannabis sativa. Nature 245: 147-148.
SMALL, E., AND H. D. BECKSTEAD. 1973b. Common cannabinoid phenotypes in 350 stocks of Cannabis. Lloydia 36: 144-165.
SMALL, E., H. D. BECKSTEAD, AND A. CHAN. 1975. The evolution of cannabinoid phenotypes in Cannabis. Economic Botany 29: 2 19-232.
SMALL, E., AND A. CRONQUIST. 1976. A practical and natural taxonomy for Cannabis. Taxon 25: 405-435.
June 2004] HILLIG AND MAHLBERG-CANNABINOID VARIATION IN CANNABIS 975
T AURA, F., s. MORIMOTO, AND Y. SHOY AMA. 1996. Purification and characterization of cannabidiolic-acid synthase from Cannabis sativa L. Journal of Biological Chemistry 271: 174 1 1-174 1 6.
TAURA, F., s. MORIMOTO, Y. SHOYAMA, AND R. MECHOULAM. 1995. First direct evidence for the mechanism of d 1-tetrahydrocannabinolic acid biosynthesis. Journal of the American Chemical Society 1 17: 9766-9767.
TURNER, C. E., P. C. CHENG, G. S. LEWIS, M. H. RUSSELL, AND G. K. SHARMA. 1979. Constituents of Cannabis sativa XV. Botanical and chemical profile of Indian variants. Planta Medica 37: 217-225.
TURNER, C. E., M. A. ELSOHLY, AND E. G. BOEREN. 1980. Constituents of Cannabis sativa L. XVII. A review of the natural constituents. Journal of Natural Products 43: 169-234.
TURNER, C. E., AND K. HADLEY. J 973a. Constituents of Cannabis sativa L. II. Absence of cannabidiol in an African variant. Journal of Pharmaceutical Sciences 62: 251-255.
TURNER, C. E., AND K. W. HADLEY. 1973b. Constituents of Cannabis sativa L. III. Clear and discrete separation of cannabidiol and cannabichromene.Journal of Pharmaceutical Sciences 62: 1083-1086.
TURNER, c. E., AND K. W. HADLEY. 1974. Chemical analysis of Cannabis sativa of distinct origin. Archivos de Investigacion Medica 5: 141-150.
TURNER, c. E., K. HADLEY, AND P. s. FETTERMAN. 1973. Constituents of Cannabis sativa L. VI. Propyl homologs in samples of known geographical origin. Journal of Pharmaceutical Sciences 62: 1739-174 1 .
TURNER, J. C., J. K. HEMPHILL, AND P. G. MAHLBERG. 1978. Quantitative determination of cannabinoids in individual glandular trichomes of Cannabis sativa L. (Cannabaceae). American Journal of Botany 65: 1 103-1 106.
VALLE, J. R., J. E. V. VIEIRA, ]. G. AUCELIO, AND I. F. M. VALIO. 1978. Influence of photoperiodism on cannabinoid content of Cannabis sativa L. Bulletin on Narcotics 30: 67-68.
VAVILOV, N. I. 1926. The origin of the cultivation of "primary" crops, in particular cultivated hemp. In Studies on the origin of cultivated plants, 22 1-233. Institute of Applied Botany and Plant Breeding, Leningrad, USSR.
VAVILOV, N. I., AND D. D. BUKINICH. 1929. Zemledel'cheskii Afghanistan. Trudy po Prikladnoi Botanike. Genetike i Selektsii, Supplement 33: 378-382, 474, 480, 584-585, 604. [Reissued in 1959 by Izdatel'stuo Akademii Nauk SSSR, Moskva-Leningrad.]
VESZKI, P., G. VERZAR-PETRI, AND s. MESZAROS. 1980. Comparative phytochemical study on the cannabinoid composition of the geographical varieties of Cannabis sativa L. under the same conditions. Herba Hungarica 19: 95-103.
VOGELMANN, A. F., J. C. TURNER, AND P. G. MAHLBERG. 1988. Cannabinoid composition in seedlings compared to adult plants of Cannabis sativa. Journal of Natural Products 51 : 1075-1079.
VOLLNER, L., D. BIENIEK, AND F. KORTE. 1986. Review of analytical methods for identification and quantification of Cannabis products. Regulatory Toxicology and Pharmacology 6: 348-358.
WINEK, C. L. 1977. Some historical aspects of marijuana. Clinical Toxicology 10: 243-253.
ZuKOVSKIJ, P. M. 1962. Cultivated plants and their wild relatives (Transl. P. S. Hudson), 83-84. Commonwealth Agricultural Bureaux, Farnham Royal, Bucks, UK.