Embed Size (px)
Citation preview
Loughborough UniversityInstitutional Repository
A chemical method for theinvestigation of chemicalchanges in fish during
smoking
This item was submitted to Loughborough University's Institutional Repositoryby the/an author.
Additional Information:
• A Master's Thesis. Submitted in partial fulfilment of the requirements forthe award of a degree of Master of Science of the Loughborough Universityof Technology.
Metadata Record: https://dspace.lboro.ac.uk/2134/33875
Publisher: c© Suet Lan Tang
Rights: This work is made available according to the conditions of the Cre-ative Commons Attribution-NonCommercial-NoDerivatives 4.0 International(CC BY-NC-ND 4.0) licence. Full details of this licence are available at:https://creativecommons.org/licenses/by-nc-nd/4.0/
Please cite the published version.

"··' ; ,, LOUGHBOROUGH " I ·!} • .. /~·, UNIVERSITY OF TECHNOLOGY
LIBRARY
AUTHOR/FILING TITLE
___________ :r_~~-ct,_ s _________________________ _
-------------------------------------------- --- _..,... ACCESSION/COPY NO.
--voi:~"No _____ _<?_ 01t'Isrt-~lP.P.i< -------------------
AR.C..KIUE.S
CoP'f
FOR REI=ERENCE ONLY
A CHEMICAL METHOD FOR THE INVESTIGATION
OF CHEMICAL CHANGES I~ FISH DURING SMOKING
by
Suet Lan Tang B.Sc.
A Master's Thesis submit•ed in partial fulf~lment of the requirements
for the award of a degree of Master of Science of the Loughborough
University of Technology.
Supervisors: Professor J. ~1ann
Department of Chemical Engineering Loughborough University of Technology. ' - ~ \
' Dr. M.N. Clifford Department of Scien;e and, Food Technology Grims~y ~allege Of Technology.
(c) by Suet Lan Tang. 1978.

Loughborough University
of T ..-:r,nology Library - ~ ..... ill P~r•
Cla's
Ace. 001'\'\ '0 /o 1 No -.
Abstract
This report surveys the literature an the effects of smoking
an the nutrit1ve value of flesh foods and the chem1cal changes
associated with such processing methods. The development of a dye
binding method far use 1n assessing protein damage 1n smoked Coley
(Pollachius vireus) fillets is described.
The use of blacking reagents with dye binding permitting
estimat1an of lysine content is also described and the results sa
determined are compared with values for lysine obtained by the use
of fluaro dinitrobenzene. The possibil1ty of interference from
smoke components in the dye binding and the fluoro dinitrabenzene
methods was also examined.
i -
Acknowledgements
I wish to express my gratitude to:
Professor J. Mann for his understanding and advice,
Dr. M.N. Clifford to whom I am indebted for his guidance,
continual support and encour~gement,
My family, especially my parBnts.for their pat1ence and
financial help and J. Deli for his help.
The librarian, staff and laboratory technicians at the
Grimsby College of Technology.
- ii -
1 .o.o
2.0.0
2.1.0
2.2.0
2.3.0
2.4.0
2.4.1 (a)
CONTENTS
Introduction ••••••.•
Literature review of:-
Methods of smok~ng and relation to deposition of smoke on fish ••
Wood smoke compos~tion
Effect of smoke components on protein surfaces . . . . . . . . . . . . . . . . Effects of heat and othex components on protein, that is mechan~sm of heat damage
"Maillard" type reactions ••••••
3
3
7
11
13
13
2.4.1 (b) Carbonyl groups from fat oxidation products with E: -amino groups of lysine 17
2.4.1 (c) Protein-protein interact~an 19
2.5 .o
2.6.0
•2.7.0
2. 7.1
2.8.0
2.9.0
2. 9.1
2.9.2
2.9.3
3.1 .o
3.1. 5
3.2.0
Nutritional aspects of heat-damaged proteins • ••••••••••••••••••
Proteolytic activity in f~sh (post-mortem)
Determination of 1-fluoro-2,4-dinitro benzene (FDNE) reactive lysine .; ••••
FDNE-reactive lysine by difference •
Dye binding of food and feed stuffs
A review of the different blocking reagents for cS -amino group of lys~ne . . • • • • • .
Acylation of ~-amino group of lysine by propionic anhydride • • • • • • • • •
Acylation of E-amino group of lys~ne with 2,4,6-trinitro benzene sulphonic acid (TNES)
Acylation by ethyl chloro formate ••••••
Determination of FDNE-reactive lysine in smoked and unsmoked Coley (Pollach1us vi~ens) fillets by method of Carpenter (1960) as modif1ed by Booth ( 1971) ••••••••••
Recover1es of added DNP-L~with sample.
Invest~gat~on into the e~fects of smoke components on DNP-L during acid hydrolysis
.. , . ·~~~
24
32
35
39
41
52
52
54
59
61
65
68
Contents cont.
4.1 .o
4.1 .1
4.2.0
4.3.0
4.4.0
4.5.0
4.6.0
4.7.0
4.8.0
4.8.2
4.9.0
4.9.4
4.9.5
4.9.6
4.9.7
4.9 ,8
Dye procedures for the estimation of basic groups in smoked and unsmoked freeze-dried defatted Coley fillets ••••••••••••
Smok1ng and treatment of fillets before dye binding ••••••••••••••••••
Invest1gation into the adsorption isotherms of skimmed milk powder •••••••
Investigat1on of dye adsorption isotherms 'with smoked and unsmoked defatted fish samples •••••• . . . . . . . . . . . . . . . . . . Investigation of dye binding properties of smoked and unsmoked Coley fillets without the s% sod1um chloride . • . • . • . • • • • . • •
Invest1gation of possible interactions between smoke components and A0.12 dye
Investigation of the effects of proteolysis during smoking:- dye binding of short chain peptides amino acids and amines ••••
Investigation of dye binding properties of A0.12 dye with the smoked and unsmoked freeze-dried Coley f1llets •••••••••••
Investigation of dye binding properties of fillets smoked over a period and blocking of the 40: -amino groups of lysine of the smoked and unsmoked fillets •••••••••••••••
Investigation of dye binding values of unsmoked and smoked Coley fillets (1,3 and 5 h smoking time) •••••••••••••••••
Blocking or acylation of the G-amine group of lysine by methoxy carbonyl chloride (methyl chloroformate) • • • • • • • • • • • •
Effect of smoke components on ava1lable lysine •• . . . . . . . . . . . . . . . . . . . . . . Effect of protein-protein
c intera~ion .. . .
Effect of fat and protein-protein interact~on
Effect of heating protein at high relative humidity .. • • . . . . • • .. .. .. • • .. .. Effect of heat1ng glucose or ribose (aldehyde groups) with protein .. . .
~-------~- ------------
73
74
77
81
85
90
95
100
105
106
110
116
117
11 8
119
120
Contents cont. Page
4.9.9 Some observations on the colour of the smoked fillets . . . . . . . . . . . . . . . . .. . . 120
4.10 .o Investigation of dye binding difference (DBD) of ~-amino groups of lys~ne using
(a) methoxy carbonyl chloride (MCC) •• .. 123
(b) 2, 4, 6 -trinitro benzene sulphonic acid (TNBS) . . . . . . . . .. . . . . . . 123
4.10.3 Procedure to determine the dye binding difference values of the samples by using 2,4 6-trinitro benzene sulphonic acid .. . . 124
4. 11 .o General discussions . . . . . . . . . . . . .. 128
4.11.1 Conclusion . . . . . . . . •• . . . . . . . . 130
4.12.0 Suggestions for future Work . . . .. 131
fiaure
2.1
2.2
2.3
List of figures
Thermal decompos~tion of ferulic acid {Fiddler~ al 1967)
-to Pathways lead~ngkbrown melonoidins or pigments formation
Strekker degradation reaction
2.4 Possible degradation of cystine in heated proteins
2.5
2.6
2.8
2.9
2.10
2.11
2.12
2.13
2.14
Four poss~ble inter-linkages between am1no acids
Reaction between lysine residue and 1-fluoro-2,4-dinitro benzene
DNP lysine-methoxy carbonyl complex
Structures of 3 basic dyes commonly employed ~n dye binding procedures
Simulated protein chain showing the basic aming acid residues
The dye binding of a lysine residue with Acid Orange 12
React~ons between E -am~no group of lysine 2,4,6-trinitro benzene sulphonic acid
Dye binding of protein with TNBS as blocking agent
Sample affected by early Ma~llard browning
Sample affected by advanced Maillard browning
3.1 The destruction of DNP-L in 2 situations
8
15
16
20
22
36
37
43
43
44
54
57
58
58
during acid hydrolysis with smoked samples 72
4.1 Cross-section of fillet illustrating the top layer which is investigated T4
4.2 Cross-section of fillet illustrat~ng the layers investigated 106
Graoh
4.1
4.2
4.3
4.4
List of Graohs
Dye b1nd1ng isotherms of skimmed milk powder w1th acid orange 12 dye
Mg of acid orange 12 dye bound by skimmed milk powder with increasing dye concentrat1ons
Dye binding isotherms of freeze-dried smoked and unsmoked Coley fillets 1n the presence of chloride ions
Mg dye bound g-1 sample of freeze-dried smoked and unsmoked Coley fillets with increas1ng dye concentrat1on in the presence of chloride 1ons
4.5 Dye binding isotherms of freeze-dr1ed smoked and unsmoked Coley fillets w1thout chloride ions
4.6 Mg dye bound g-1 sample of freeze-dried smoked and unsmoked Coley fillets without chloride ions
4.7 Adsorption isotherms on smoked and unsmoked Coley fillets using acid orange-12 dye
4.8 Mg of free dye against mg of acid orange 12 added to smoked and unsmoked freeze-dried Coley fillets
4.9 Mg acid orange 12 bound g-1 sample of freeze-
72
BD
83
84
86
87
101
102
dried smoked and unsmoked Coley fillets 103
4.10 Percentage loss of DBD (MCC) lysine in the upper layers, lower layers and average of both layers with time of smoking 128
.. ' ... Vll-
\
3.1
3.2
4.1
4.2
List of Tables
Correct1on factors as determined by Booth ( 1 971 )
Effect of smoke components on DNP-L recovery after acid hydrolysis
Calibration of A0.12 dye
Dye binding isotherms of skimmed milk powder
4.3 Dye binding isotherms of smoked and unsmoked freeze-dried Coley fillet with chloride ions
4.4 Dye binding isotherms of smoked and unsmoked freeze-dried Coley fillets without chlor1de ions
4.5 Reduction in extinction of A0.12 dye by selected smoke components
4.6 Dye binding of A0.12 dye by short chain peptides, terminal-am1no groups and amino acids
4.7 Dye binding isotherms of smoked and unsmoked Coley fillets over a large dye concentration range
4.8
4.10
Dye binding·values of unacylated samples and DBD-lysine the samples treated w1th MCC compared with FDNB-reactive lysine
Dye binding values of unacylated samples and DBD-lysine the samples treated with MCC and TNBS compared w1th FDNB-react1ve lysine
66
70
76
Appendix 1
Appendix 2
Appendix 3
92
97
Appendix 4
111.
126
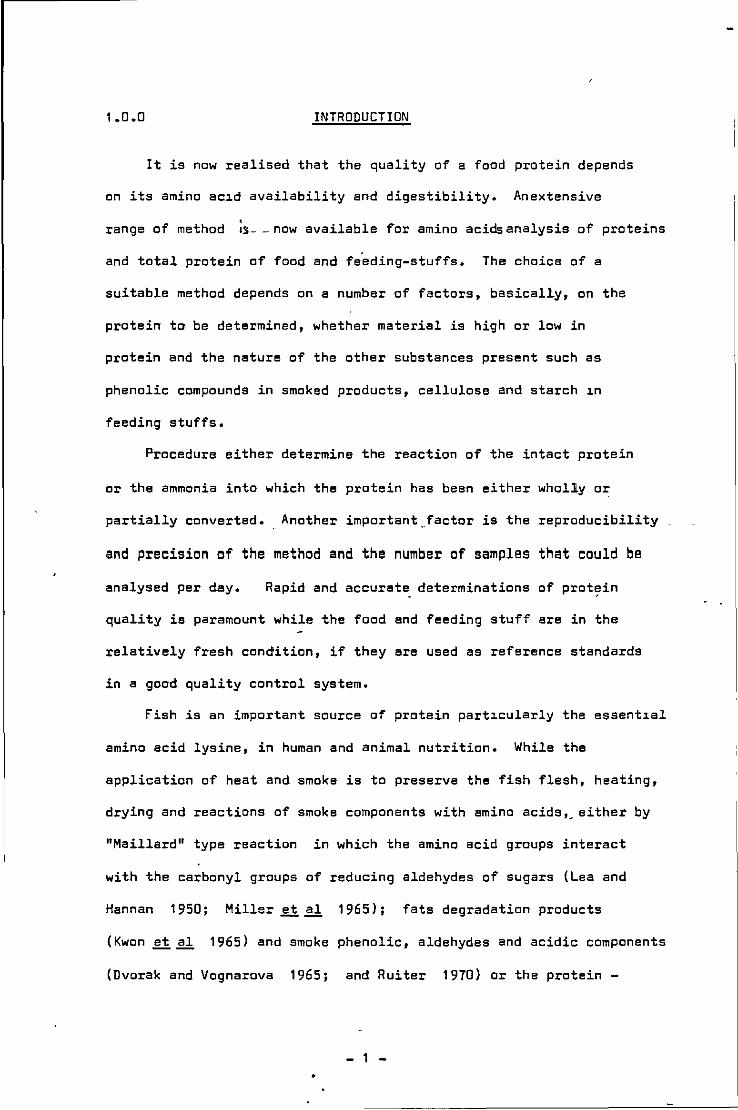
1.0.0 INTRODUCTION
It is now realised that the quality of a food protein depends
on its amino ac1d availability and digestibility. Anextensive
range of method ;s __ now available for amino acids analysis of proteins
and total protein of food and fe,eding-stuffs. The choice of a
suitable method depends on a number of factors, basically, on the
protein to be determined, whether material is high or low in
protein and the nature of the other substances present such as
phenolic compounds in smoked products, cellulose and starch 1n
feeding stuffs.
Procedure either determine the reaction of the intact protein
or the ammonia into which the protein has been either whol1y or
partially converted. Another important_factor is the reproducibility
and precision of the method and the number of samples that could be
analysed per day. Rapid and accurate determinations of prot7in
quality is paramount while the food and feeding stuff are in the
relatively fresh condition, if they are used as reference standards
in a good quality control system.
fish is an important source of protein part1cularly the essent1al
amino acid lysine, in human and animal nutrition. While the
application of heat and smoke is to preserve the fish flesh, heating,
drying and reactions of smoke components with amino acids,_ either by
"Maillard" type reaction in which the amine acid groups interact
with the carbonyl groups of reducing aldehydes of sugars (Lea and
Hannan 1950; Miller~~ 1965); fats degradation products
(Kwon ~~ 1965) and smoke phenolic, aldehydes and acidic components
(Dvorak and Vognarova 1965; and Ruiter 1970) or the protein -
- 1
protein type damage (Bjarnason and Carpenter 1970) render the
amino acids 1nvolved ~particularly methionine and lysine) nutrition
ally unavailable. The concept of "available" as distinct from
"total" amino acidspresent in a protein is used ,to differentiate
between amino acids, modified or denatured during processing, with
the consequent loss of nutritive value, and those amino acids
which remain of nutritional use to'the metabolic processes. The
lysine which has had its E·amino groups bound was said to have
no nutritive value as these groups were not susceptible to enzymatic
hydrolysis (Lea and Hannan 1950; Henry and Ken 1950; Buraczewski,
Buraczewska and Ford 1967).
Extensive studies have been made on the chemical and nutritional
changes in fish meal (Lea, Parr and Carpenter 1958, 1960, 1962)
and dried fish products ( Tarr 1954; Carpenter ll al 1957; Jones
1962) but there is little information on the lysine levels of
smoked-temperate fish in a Terry ~iln, similar to that of a commercial
products. Although there is abundant information on the dye binding
of fish meals (Bunyan and Price 1960; Moran,Jensen and McGinnis
1963; Hurrell and Carpenter 1975; Jones 1974) and freeze-dried
cod (Jones 1974), there is little or no information on the dye
binding of smoked fish.
The objective here is to determine the dye binding capacity
of smoked and the control unsmoked fillets of Coley and to find the
Dye Binding Difference (DBD) or available lysine values by suitable
blocking reagents and compare the available lysine obtained by DBD
with those of 1-fluoro-2,4-dinitrobenzene (FDNB)-reactive lysine
values.
- 2 -
•
2.0.0
2.1.0
LITERATURE REVIEW
Methods of smoking and relation to deposition of smoke on fish
Before the effects of smake~hemical reactions on fish prate~ns
could be evaluated, a knowledge of the campas~tian of smoke,
reaction of smoke components an 'surface proteins, degree of smoke
penetration and a review of the chemistry and technology of smak~ng '
and the methods of measuring lysine would be useful.
Traditional methods of smoking over waodfire usually have high
wastage of droppers and there is no control an the combustion
parameters, hence no control on the degree of smokiness (i.e. amount
of smoke produced) or the temperature during the smoking process.
Smoke is not uniformly distributed, resulting in same fish virtual1y
unsmoked and undried in addition to the smuts and moulds deposited
on the products.
The Tarry kiln is now widely used by industries to produce goad
quality, uniformly smoked fish such as kippers, roes and smoked
sa1man. In the Terry mini-kiln, smoke is produced external1y in
three-tier fire-boxes, it is drawn into the kiln and circulated by
an electrically-operated fan. fresh air can also be sucked ~nta
the k~ln by opening the adjustable air inlet flap and the amount of
wet smakey air displaced up the chimney is adjusted by a metal
place across the chimney. The temperature of the smoke is maintained
by thermostatically controlled electric heaters of 1 to 3 Kw. The
electric heaters are essential, because as the smoke passes over the
fish, it ~s cooled by the process of evaporation of water from the
fish.
The much larger 50 stones and 120 stones Tarry kilns have
- 3 -
adjustable splitters or vertical partit~ons, aerofo~ls and diffuser
walls for more uniform distribution of smoke and air throughout the
large kiln with air velocity of 600-700 ft/min in the centre of the
k~ln. The large kilns also have a smoke by-pass damper adjustable
in 2 positions, "open to ch~mney," position for smoke' to be led out
of kiln when the fans are stopped and dampers of the fire boxes are
closed, when the positions of the trolleys of fish are interchanged
during half-time. The "open to kiln" position is to re circulate the
smoke. There is also a central heater battery controlled by a
thermostat, which operates on 2 switches of 6 Kw and 12 Kw.
It is important to note that the more air allow~q into the
kiln, the more smoke is allowed out, the faster the drying process
and the more dilute the smoke, hence less smoke deposition is
obtained (Burgess and Bannerman 1963). Hence the proportion of
smoke and air is important in the smoking process. The rate of
• deposition of smoke on fish have been found to increase proportionally
with the optical density of the smoke (Tilgner 1958), temperature
(Tilgner 1958) and velocity of smoke in the kiln (Linton and
French 1945). At high humidity, the wet fish surface end inter-
stitial water absorb smoke more rapidly tha~ at low humidity or
when the fish flesh dries. Foster and Simpson (1961) have
suggested that most of the smoke is deposited or absorbed by the
surface and interstitial water of the fish muscle and they (Foster,
Simpson and Campbell 1961) have shown that the rate of deposition
of smoke phenolic compounds on pre-dried fish is only 5% of that
deposited on the wet fish surface; ( that vapour absorpt~on seemed to
be the main mode of smoke deposition and that the disperse particulate
phase contribute a negligible amount of steam-non-volatile phenols •
. - 4-
Since the absorption of invisible smoke vapour components by surface
and interstitial water of fish and meat is proportional to the mass
concentration of that smoke component in the vapour phase, changes
in the vapour phase, such as by raising the temperature, would
result in changes in the compos1tion of the smoke deposits.
At the very high temperature of combustion, the degradation
products of wood are in the gaseous form, and as they mix with the
air, they cool and the less volatile components condense to form
the disperse liquid or particulate phase (i.e. the visible particles
of smoke in which the more volatile compounds tend to dissolve.)
The two phases thus form a gas-liquid partition system in which the
different smoke components are partitioned between the vapour and
particulate phases according to the Nersnt's law. Since the surface
I
area of the particulate phase is large relative to its volume,
equilibria are very rapidly attained.
Foster, Simpson and Campbell (1961) have also shown that when
the wood smoke is diluted by air as in the kiln, the concentration
of the more volatile phenols fall to a greater extent than that of
the non-volatile phenols. Hence there must be a transfer of smoke
components from the particulate or liquid phase to the vapour phase
showing that a dynamic state of equilibrium exist. Within the
temperature range of 30 to 80°C, absorption of smoke vapours is
independent of temperature while deposition or absorption of the non-
volatile phenols increase with increase in temperature, as the
partition coefficients are also increased resulting in a transfer of
smoke non-volatile components from the disperse liquid to the vapour
phase.
Since the particulate phase contain small amounts of volatile
~ 5 -
components and a large amount of non-volatile components, the
composition of the vapour and particulate phase is continuously
being changed as components are absorbed and reactions take place
in the fish flesh during the smoking process. Since the moisture
content of wood sawdust affectsthe smoke generation temperature,
it could also affect the composition of the smoke (Draudt 1963).
Hence the disperse liquid phase acts as a reservoir of
volat~le and non-volatile smoke components and when the vapour
disperse liquid equilibrium is disturbed, the disperse liquid phase
release part of its non-volatile components to the gas phase as
when the smoke components are absorbed or when there is dilution
of smoke by air or when the smoking temperature is raised.
- 6 -
2.2.0 Wood Smoke Composition
To understand the mechanism of flavour and colour development,
epsilon-amino lysine inavailability and the auto oxidat~ve and
bacteriostatic properties of smoked food, a knowledge of the
chemical composition of wood and the important reactions which
takes place during pyrolysis is essential, The three major
constituents of wood are cellulose, hemicellulose and lignin occur
ring in the ratio of 2:1:1 respectively. Pettet and Lane (1940)
did some pioneering work on wood smoke composition. Since then
there have been numerous technological advances by many workers.
Substances produced during bu~ning of wood depend· on conditions
employed such as the kind of wood used, moisture content and heating
methods.
Cellulose heated under high vacuum yields levoglucosan (Pictet
and Sarasin 1918) and burning in air yields carbon dioxide and
water. Pyrolysis at atmospher~c pressure yields, through hydrolysis
of the cellulose components to glucose units, then dehydration to
give 1,6-anhydro glucose (B-glucosan), followed by secondary pyrolysis
to produce aliphatic acids such as acetic acid and its homologs,
water and small amounts of furans and phenols.(Goos 1952).
Pyrolysis of hemicellulose (least stable of the wood components)
yield furan and its derivatives, together with a range of aliphatic
carboxylic acids. Hard wood hemicellulose containing more pentosans
yield larger amounts of aliphatic carboxylic acids than softwood.
At lower combustion temperature hemicellulose would yield higher
acid production in the smoke (Wasserman and Fiddler 1969).
Pyrolysis of both hard and softwood lignin generally yield
the smoke flavouring components of phenol and phenolic ethers such
- 7-

as guaiacol(2-methoxy phenol) and syringol (2,6-dimethoxy phenol)
and their homologs and derivatives, having substituent groups of
methyl-, ethyl-, propyl-, vinyl-, allyl- and propenyl-. Hence these
side chains are usually not more than 3 carbon atoms in length and
para-position to the phenolic hydroxyl group (Goos 1952). Hard-
wood lignin (polysaccharide polymers) contains 3,5-dimethoxy-4-
hydroxy phenyl propane units and guaiacyl-propane units. When
oxidised in alkaline nitrobenzene, vanillin and syringaldehyde are
the main oxidation products. Softwood lignin contain i~ addition
to the above, 4-hydroxy phenyl propane units. Hence when softwood
lignin is oxidised, vanillin, syrinaldehyde and p-hydroxy ~
benzaldehyde are the main oxidation products. (Pearl I.A.) Thermal
degradation of lignin also yields ferulic acid as an intermediate
and Fiddler et al (1967) have shown that the pyrolysis of ferulic
acid'to'phenolic compounds such as guaiacol and derivatives in
nitrogen rich atmosphere and acetonvanillone, vanillin and vanillic
"'acid in normal air oxidation1.
OH
1801 I OMe . Ligni~~ (8_1
I
CH = CHCDDH ferulic acid
OH1 I OMe
@I r
OH
®-OMe---7
dH = CH 2 4-vinyl guiaiacol
! OH C$Y OMe
Et
OH ~DMe
I~ CHO vam.llin
OH
c$r0Me
COMe Me
4-methyl guaiacol 4.ethyl guaiacol acetovanillone
OH A..-DMe
r o 1
cl:aH vanillic acid
l OH Si OMe
~/
guaiacol
Fig. 2.1 Thermal decomposition of ferulic acid (Fiddler et al~ (1967)
- B -
Doerr, Wasserman and Fiddler (1966), Lustre and Issenberg
(1969) and Fiddler £i al (1966) have been able to obtain reproduc
ible condensates from laboratory generated wood smoke under controlled
conditions of combustion temperature, air-flow rate and they have
identified a long list of phenolic compounds in wood smoke and
liquid smoke, Volatile acetic, propionic and butyric acids in
hickory sawdust smoke were identified by Hamid and Saffle (1965).
Acids and carbonyl compounds in maple sawdust smoke have been
obtained by fractionation, isolated as 2,4-dinitro phenyl hydrazone
derivatives and identified by gas chromatography (gel retention
times (Porter, Bratzler and Pearson 1965; Love and Bratzler 1966).
Smoke phenolic co~pounds have been recognised as important
components in the flavour of smoked food. Flavour components in
the steam distillable fraction are mainly phenols; carbonyls and
acids (Husaini £i ~ 1957; Tilgner £i~ 1962). Using water
filled casings as absorbents, Bratzler and Harper (1968) found that
an increase in temperature led to less guaiacol (b.pt. 205°) and
proportionately more syringol (b.pt. 261°) being absorbed. Taste
and threshold level of guaiacol, syringol and 4-methyl syringol in
oil and water systems have been determined by Bratzler et~ (1969),
Tilgner £i~ 1962 and Wasserman (1956).
Tucker (1942) and Kurko (1959) found decreasing amounts of
phenols from outer to inner layers of smoked ham and sausage.
Bratzler £i~ (1969) found a good correlation between degree of
smokey flavour and depth of phenol penetration in Bologna sausage.
Lactones have been identified as important aroma compounds (Reynolds
1970). Knowles, Gilbert and McWeeny (1975) have studied the phenolic
composition of some commercial liquid smoke condensates and the
- 9 -
I •
smoked bacon prepared with them. Approximately 50~ of the phenolic
fractions of all the condensates is made up of guaiacol, 4-methyl
guaiacol, syringol, trans-eugenol and 4-methyl syringol. They
found a selective uptake of guaiacol, phenol, 4-methyl guaiacol and
m- and p- cresol, there was a ne~ligible uptake of syringol and
its derivatives or of eugenol and that there is relatively little
diffusion of phenols in the smoked bacon.
- 10 -
2.3.0 Effects of smoke components on protein surfaces
Development of colour in smoked products have been correlated
w1th a quantitative decrease in carbonyl groups in the smoke
vapour condensate, especially more significant in the presence of
amino compounds. Colour intensity has been found to increase with
increase in pH value, and with increase in intensity and length of
exposure to heat, light and oxygen (Ziemba 1969 a and b). Acidic
compounds influence colour formation by surface protein hydrolysis
to form the free bases wh1ch proceed to interact with the phenolic
compounds. However brown pigments on surface tissues are said to
inhibit penetration of carbonylic groups and other smoke components
(Ziemba 1969 a and b). Colour formation does not directly involve
the phenolic compounds (Chen and Issenberg 1972, Ziemba 1969b).
Both phenolic and neutral fractions of wood smoke condensate cause a
significant loss in available lysine when applied to ground pork
preparations (Chen and Issenberg 1972). Spectrophotometric studies
on colour formation in food is mainly by reacting smoke absorbates
with proteins and amino acids (Ziemba 1969 a) or using specific
smoke components such as dicarbonyls with individual amino acid and
proteins (Ruiter 1969; Kurko and Schmidt 1969; Chen and Issenberg
1972). Coniferaldehyde and sinapaldehyde of wood smoke have been
found to react with protein casein to produce a characteristic orange
and yellow colour while glyoxal, pyruvaldehyde and furfural produced
yellowish brown to brown colour in contact w1th the protein of
casein. (Chen and Issenberg 1972). It is assumed that the E-amino
group of lysine are irreversibly bound after smoking and forms the
brown colouring. Loss of lysine can be correlated with increase in
colour formation of smoked meat and model protein systems. Formaldehyde
- t1 -

has been reported to be the active smoke component in its reaction
with the € -amino group of lysine (Dvorak and Vognarova 1965) but
this reaction of formaldehyde with proteins does not contribute to
colour development in smoked food (Chen and Issenberg 1972).
Ruiter (1970) used 25% fish paste in thin Cutisin sausage
casing and found that brown colour developed during smoking and
that the free E -amino groups of lysine are irreversibly bound
(lysine was determined by Carpenter's FDNB method). The smoked water
(petri dish of water placed in the smoke-kiln for 2.5 h) gave
comparable browning reaction with 100 mg glycine as with model
mixtures of glycolic-aldehydes, glyoxal, methyl glyoxal and
formaldehyde. Hence he concluded that the E'-amino,. group of lysine
in fish provide the amino group for the browning reaction while the
guanidine group remained unchanged during the smoking process.
12 -
•
2.4.0 Effects of heat and other components on protein that is. mechanisms of heat damage
(a) carbonyl groups (reducing aldehydes) of
sugar + 10 -amino group of lysine or
"Maillard" reaction;
(b) carbonyl groups from fat oxidatio~ products
+ ii -amino group of iysine;
(c) protein - protein interaction.
(a) "Maillard" type reaction
It is generally accepted that brown colour formation in foodstuff
is due to carbonyl-amino reactions or "Maillard type" reactions
between amines, amino acids and proteins with sugars, aldehydes or
ketones at elevated temperature and low moisture content.- The
primary step in the carbonyl-amino reaction is a conden~ation
reaction between theo(-amino groups of the amino acids and proteins
and the carbonyl groups of the reducing sugars, forming the initial
condensation product, a Schiff's base, which undergo cyclization to
form N-substituted glycosylamine, the products being in equilibrium
in aqueous solution. Partridge and Brimley (1952) have demonstrated
the existence of condensation products using ion exchange chromate-
graphy. The carbonyl-amino reaction· occur at above the iso electric
point of the amino groups. (Lea and Hannan 1949, Underwood ~~
1959), increase rate of reaction with rise in temperature over the
range of 0°-90°C. (Lea and Hannan 1949) and at optimum moisture
content which correspond to fairly lcw moisture levels (Lea and
Hannan 1949 and 1950; Karel and Labuza 1968). Non-reducing sugars
cannot react unless the glycosidic bond -is cleaved while reducing
- 13 -
sugars of mono- and disaccharides provide the carbonyl group for
interaction with the free C(-amino groups. S1nce the amino acids
of proteins are joined covalently by peptide bonds, the amino
groups involved are presumed to be unavailable for the condensation
reaction hence the G -amino group of lysine provide the majority
of free groups for the reaction (Harris and Mattil 1940) while
arginine histidine and tryptophan and N-terminal amino groups also
participate.
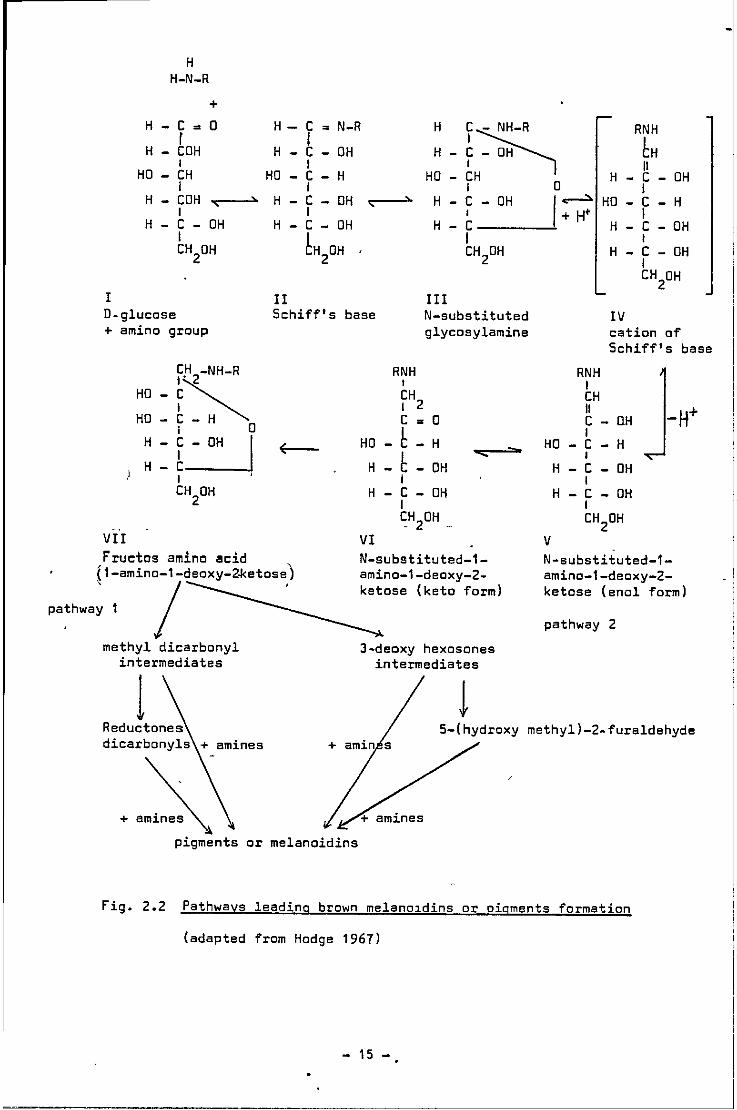
The N-substituted glycosyl amine undergoes a series of re
arrangement from the aldose to the ketose sugar, referred to as
"Amadori Rearrangement" from Fig. IV to Fig. VII (Weygand 1940;
Lea a'nd Hannan 1950; Abram ll & 1955). From the 1-amino-1-deoxy-
2-ketose derivatives, three pathways are believed to occur, involving
a series of condensations and polymerisations, leading to the
formation of brown nitrogenous pigments or melanoidins.
Several workers including Anet (1960, 1964) and Kato (1962,
1963) have provided evidence of 3-deoxyhexosones as intermediates
of pathway 2; while a second group of workers includin~ Hedge (1953);
Hedge ll& (1963) and Simon and Henback (1965)' postulated pathway 1.
The third or indirect pathway is believed to be the oxidative
degradation or "Strekker degradat1on" at high temperature of amin:o
acids by o(-dicarbonyls or other conjugated dicarbonyl compounds
(provided from other reactions) to form am1no compounds, corresponding
aldehydes with one carbon less, which is lost as carbon dioxide, thus
providing more reducing compounds for the carbonyl-amino reactions
(see Fig. 3). Cole (1967) reported good correlation between carbon
dioxide formation and formation of brown pigments and unsaturated
dicarbonyl compounds.
- 14 -..
H H-N-R
+ H - c = 0
r H - COH
I HO - CH
H- c = N-R H
r~ RNH
I tH H - c - OH H - C - OH
I I 11 HO - c- H HO - TH 0 H c - OH -I I I
H- COH I
H - C - OH
H - c - OH H - C - OH I:-; HO - c - H I I I
H - C - OH H - c H - c - OH I CH
20H ~H20H
I I CH
20H H - C - OH
I CH
20H
II I D-glucose Schiff's base
III N-substituted glycosylamine
IV + amino group
VII
CH -NH-R I. 2
HO - c"'-HO-t- H~
I 0
:=~~ I • CH
20H
~
Fructos amino acid (1-amino-1-deoxy-2~etose)
pathwa: 1 I ' methyl dicarbonyl
intermediates
1 Reductones
+ amines
.. ~ pigments or melanoidins
RNH I
fH2 c = 0
HO - 1: - H
1: ....
H - - OH I
H - C - OH I ~H20H _
VI N-substituted-1-amino-1-deoxy-2-ketose (keto form)
3-deoxy hexosones intermediates
......
RNH I CH 11
cation of Schiff's base
C - OH I
HO - C - H I
V
H - C - OH I
H - C - OH I CH
20H
-N-substituted-1-amino-1-deoxy-2-ketose (enol form)
pathway 2
methyll-2-furaldehyde
Fig. 2.2 Pathways leading brown melano1dins or pigments formation
(adapted from Hodge 1967)
- 15 -

0 u
- c -
dicarbonyl
NH I 2
R2 + R3 - CH COOH --~
amino acid
Fig. 2.3 Strekker degradation reaction
~H2 R - CH -1
0 11 C - R2 +
reducing aldehyde
More recent theories regard Maillard reactions and browning
process as independent processes occurring concurrently because the
protein - sugar interactions occur under alkaline conditions, while
browning due to sugar degradation occur at different pH conditions.
Under alkaline conditions 'the non-enzymic browning due to degradation
of sugar is mare ,illlp_ortant, t~an that of the "Mail lard" reaction.
(H6ltermand 1966).
Pyrazines have been identified in heated food e.g. potato chips.
Dawes and Edwards (1968) have suggested that these volatile substituted
pyrazines, which they determine fro~ model systems of aldose-amino
acid interaction, were from the Strekker degradation reactions.·
The carbon ring in the substituted pyrazine was derived from
degradation of sugars while the ni_trogen was from the Strekker
degradation of the amino acids (Koehler £1~ 1969). Pyrazines and
substituted pyrazines have been determined in woad smoke condensate
(Kim £1~ 1974).
Formaldehyde (Baba 1960, Dvorak and Vognarova 1965, Chen and
Issenberg 1972), acetal (Sasano ~ al 1968) and propional (Lea, Parr
and Carpenter 1960) all readily reduced FDNB - reactive lysine in
the fish protein.
- 16 -'
Sugars which occur free in the fish muscle are glucose and
ribose and their concentration in the muscle vary considerably,
depending on the physiological condition of the fish (whether well
rested and fed, or spawning, exhausted) at the time of death
(Jones 1962). Phosphorylated hexoses are found in fish muscle and
they are also reactive in the carbonyl amino reactions. Like the
freely occurring sugars glucose and ribose, their concentration in
the muscle also depend on physiological conditions before death.
Fish muscle extractives contain the free amino compounds of which
anserina and taurine are the major contributors to browning at the
surface of dried fish, while B-alanine-1-methyl histidine and
lysine become increasingly important as the fish muscle spoils
(Jones 1962). Further 1-methyl histidine and ribose gave a dark
brown colouration at high temperature and drying conditions (the
ribose, derived from degradation of nucleotide and ribo nucleic acids,
contributes much of the sugar - amino browning reactions in the fish
muscle.)
2.4 .1 (b) Carbonyl groups from fat oxidation products with E -amino of lysine
Carbonyl groups for the carbonyl-amino reactions are also
readily provided fro~ oxidative degradation of polyunsaturated fatty
acids in lipids (Lea 1958). During the oxidation of these
unsaturated fatty acids, many compounds such as aldehydes, ketones,
peroxides, keto hydroxy and epoxy compounds are produced which are
capable of reacting with the amino groups of fish am~no acids or
proteins.
Malonaldehyde (one of the products of autoxidised polyunsaturated
fatty acids, Sinnhuber ~~ 1958) has been reported to react with
- 17 -
•
var~ous food constituents including amino acids and proteins
(Kwon ~ al 1965). Buttkus (1967) has demonstrated that about 40%
of the €-amino groups of lysine in myosin have in.teracted, after
only 8 h. at 20°C and approximately the same order occurred at
-20°C due to the concentrating effect (due to the freezing effect)
and due to catalytic effect of ice crystals. Lea~~ (1958) found
that available lysine in herring meal was reduced by 4% when stored
in air at 25°C for several months and no loss in lysine availability
when the herring meal was stored under nitrogen. Lea~~ (1960)
have shown that oxidised fat will bind with lysine. They found a
12% loss of lysine when oxidised herring meal was heated at 100°
for 30 h. and this was accompanied by an increase in bound lipids.
No losses of lysine were found when fresh herring meal was processed
under nitrogen. These results indicate that when oxidation of lipids
is facilitated by heat, etc., carbonyl-amino type in.teraction occurs
between the amino acids and the oxidation products of lipids, result
ing in losses of amino acids availability. In autoxidation of
unsaturated lipids in fish oil, hydrogen abstraction by peroxide
radical (or other free radical) may be more effective in destroying
the ~-amino group of lysine than the "active" carbonyls groups (which
are the end-products of the autoxidation process). These carbonyls
are usually easily detected as they have not further reacted. Free
radicals are difficult to detect because they react very rapidly
and probably therefore are more likely to cause the observed changes.
The free radical decomposes after abstracting the hydrogen and may
then give rise to the carbonyls,reported by other workers.
- 18

2.4.1 (c) Protein - protein interact~on
Protein-rich foods that are free from carbonhydrate and fat
and isolated pure protein can still suffer heat damage during heat
processing which can lower the nutritional quality but have little
or no apparent effect on the amino acid composition.
Carbonyl-amino type reactions seem to occur to the same extent
with pure protein preparations es in the binding of free amino acids
of protein with reducing carbonyl groups from sugar and fat ·
oxidation products. (Carpenter, Morgan Lea and Parr 1962) in an
atmosphere of nitrog~n or oxygen (Carpenter, Ellinger, Munro and
Rolfe 1957). It is then suggested that theE-amino group of \ .
lysine may be bound by cross-linkage formation with the carboxylic
groups in the protein. There has been much speculation on the
possible interactions between functional groups resulting in new
linkages within and between the peptide chains. These new cross-
linkages could be resistant to hydrolysis by protease enzymes of
digestive tract, making digestion of adjacent bonds very difficult.
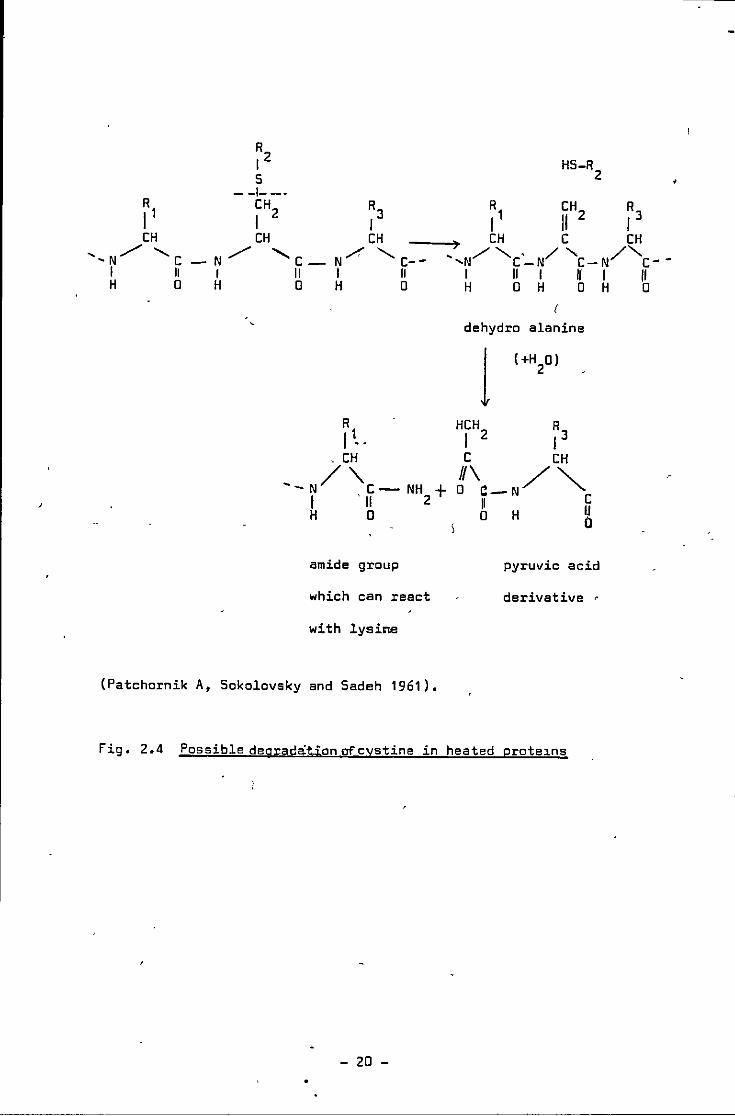
Mecham and Olcott (1947) observed that when a variety of proteins
were subjected to dry heat, there were marked losses in amino
nitrogen, decreased solubility and digestibility ?f proteins, this
being attributed to the loss of polar groups through internal formation
of amides or esters. They (Mecham and Olcott 1947) suggested that an
increase in amide formation can take place and this to some extent
is related to the breakdown of cystine, that the lysine losses during
heating of proteins at 100°C or above may be due to Maillard-type
reactions between the £-amino group and the carbonyl compounds from
cystine destruction.
- 19 -
R2 I 5
--1---CH2 I
CH CH CH ',N/ 'c- N / 'c- N/ 'c--
l 11 I 11 I 11 H 0 H 0 H 0
amide group
which can react
with lysine
(Patchornik A, Sokolovsky and Sadeh 1961),
HS-R 2
R1
CH2
R3
I 11 I CH C CH
',N/ ""-c'-N/ 'c-N/'-c--I If I U I /1 H 0 H 0 H 0
I
dehydro alanine
1
pyruvic acid
derivative r
fig. 2.4 Possible deg;adationofcystine in heated prote~ns
- 20 -
Bjarnason and Carpenter (1970) however found a low degree of
correlation between lysine destruction and cystine content in
cystine-containing proteins and they suggested that this could be
due to the different degrees of rearrangement of Schiff's base at
that point in time. Hence they consider the binding of ~-amino
group of lysine with cystine destruction products to be partially
responsible for the lysine binding in heated proteins. They
suggested that the chemically-bound lysine (frow heating carbohydrate
free and oxidised fat-free proteins) can be liberated on hydrolysis,
from the products of condensation reactions and is measured as
residual lysine in the procedure of Roach ~Al (1967).
It has also been said that inactivation of lysine is caused by
reaction between ~-amino groups of lysine and carboxylic acids
(as in Fig. Sd) but BJarnason and Carpenter (1970) concluded that
this reaction is not likely or very difficult on thermodynamic
grounds as high temperature and removal of water is needed to bring
about condensation between these groups. They, however, provided
strong evidence that the reaction between the E-amino group of
lysine and the amide group of asparagine (n = 1) or glutamine (n = 2)
with the reacting units either in the same peptide chains or between
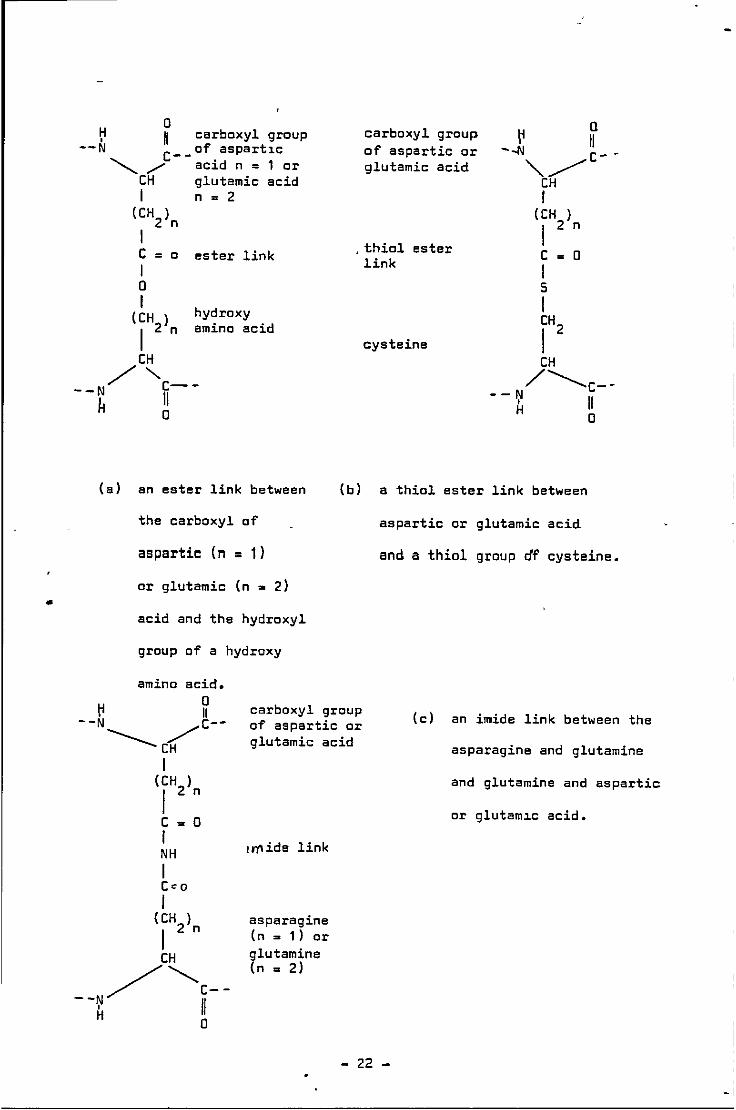
neighbouring peptide chains. Asquith (1970) noted that the
E- cy.glutamyll - lysine (which occurs naturally in wool keratin)
content is increased on heating. Fig. 2.5 shows 4 possible intra-
molecular linkages.
- 21 -
•
H --N
0 11 carboxyl group C- _of aspart1c
............ / acid n = 1 or CH glutamic acid I n = 2
(CH ) 2 n
I C = o ester link I 0 I
(CH2
) I n
CH
hydroxy amino acid
/ "c---- N 11
li o
(a) an ester link between
the carboxyl of
aspartic (n = 1)
or glutamic (n = 2)
acid and the hydroxyl
group of a hydroxy
carboxyl group of aspartic or glutamic acid
, thiol ester l.ink
cysteine
a ~ 11
--N c--"'. _,/'
CH I
(CH ) I 2 n
c = 0 I 5
I CH
2 I CH
/'-.....c---- N
I 11 H 0
(b) a thiol ester link between
aspartic or glutamic acid
and a thiol group df cysteine.
amino acid. 0
~ 11 --N c--
---u( carboxyl group of aspartic or glutamic acid
(c) an imide link between the
asparagine and glutamine I
(CH ) I 2 n
c = 0 I NH I Cco I
(CH ) I 2 n
CH
--~/""-~--H 0
1111ide link
asparagine (n = 1) or glutamine (n = 2)
and glutamine and aspartic
or glutam1c acid.
- 22 -'
-I
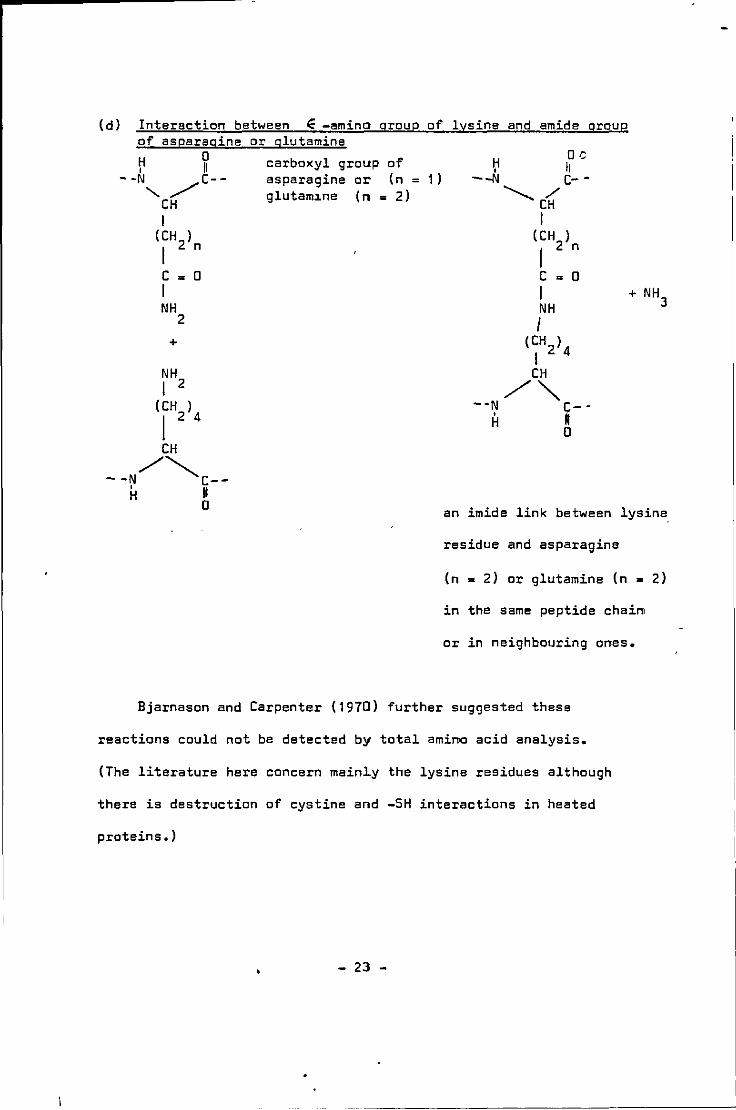
(d) Interaction between ~ -amino group of lysine and amide group of asparagine or glutamine
0 ~ 11
- -N c--"-../
CH I
(CH2
) I n
c = 0 I NH
2
+
NH I 2
(CH ) I 2 4
CH /~
- -N c--' 11 H 0
carboxyl group of asparagine or (n glutam~ne (n = 2)
1 )
oc ~ 11
--N c---..........eH'
I (CH ) I 2 n
c = 0 I NH I
(CH2
) I 4
CH /"' --N c--' . H a
an imide link between lysine_
residue and asparagine
(n = 2) or glutamine (n = 2)
in the same peptide chain
or in neighbouring ones.
Bjarnason and Carpenter (1970) further suggested these
reactions could not be detected by total amino acid analysis.
(The literature here concern mainly the lysine residues although
there is destruction of cystine and -SH interactions in heated
proteins,)
- 23 -

2.5.0 Nutritional aspects of heat-damaged proteins
The review here will concern mainly the amino acid lysine.
Extensive studies have been made on the nutrit1onal effects of
heat processing of food and feedstuffs. The above reactions
between carbonyl groups of sugar aldehydes and E -amino groups of
lysine residues form amide linkages, wh1ch have very poor gut
protease enzymic digestion (Henry. Ken, Lea and White 1947-B,
Henry and Ken 1950). rendering the lysine nutritionally unavailable.
Bissett and Tarr (1954) subjected normal and over-heated
samples of herring meal to in vitro digestion with pancreatin plus
"hog intestinal mucosa" and assayed the digests for individual
amino acids with non-proteolytic bacteria, they found a relative
decrease in the release of lysine. as with the other amino acids
from the over-heated meal samples.
Laksesvela (1958) reported a low biological value and a 40%
loss in available lysine in spontaneously heated herring meals.
Miller (1956) has reported that fish proteins are readily damaged
at high moisture content and the!ir reduced nutritional value can be
explained by formation of sugar-amino complexes which are resistant
to digestion. He also found a decreasing Net Protein Utilisation
with increasing relative humidity. Carpenter, Ellinger, Munro and
Rolfe ( 1957) have shown that losses in available lysine, resultin.g
Net Protein Utilisation (N.P.U.) is the percentage of the protein eaten that stays in the body (taking into consideration digestibility of protein) calculated from carcass and faecal analysis with allowance for metabolic and endogenous losses of nitrogen in proportion to food intake and body weight respectively.
- 24 -
from short periods of heating cod fillets (for 90 minutes at 38°
continued for a-further 36 hat 105° at 11% moisture level),
were as much in nitrogen as ~n air and no s1gnificant loss when
the samples were defatted, They also observed that there was no
evidence of carbohydrate conten~ high enough in fish (in white fish,
the amount is generally less than 1~) to explain for the 28%
reduction in Gross Protein Value and that lysine is not the only
amino acid affected by heat processing of proteins,
Ousterhout, Gran and Lundholm (1959) reported that laboratory-
dried tuna fish meal (for 3 h at 202°) in which the availability of
methionine and methionine plus cystine were judged, from the growth
assay procedure with chicks, to be 41% and 33% respectively and that
as a result of evaporation, the temperature and moisture-content·
of the fish meal must have been changing during the course of
heating. Miller, Carpenter and Milner (1965) have shown that with
severely heated animal• proteins (essentiafly free from reducing
sugars or oxidised fats), the nutritional availabilities of lysine,
methionine and tryptophan were all reduced to a similar degree,
when cod fillets at 0 to 5~ moisture content were heated for 9 to
729 hat 45° to 116°. The digestibility of the protein, as
determined with rat tests, fell with increasing heat treatment
(without sugar present.) However the fall in digestibility of the
protein is not sufficient to explain the fall in Net Protein
Utilisation, hence some of the d~gested methionine and lysine from
-------------------------------------Gross Protein Value (G.P.V.) is the extra growth in g. obtained in 2 weeks, that is, the excess over the growth on basal ration, divided by the number of g. of supplementary protein eaten.
- 25 -

the heated materials may have become unava~lable g~ving a reduced
value for growth promotion. The same results were obtained with
chicks feeding trials. Carpenter and Varnish (1975) obtained
similar results with heat-damaged proteins.
Dvorak (1968) reported twice as much protein was digested in
the albumen without glucose, heated at 121° than the albumin heated
with glucose at 90° for the same period of time. Since only about
55.5% of the heated albumin without glucose was hydrolysed, the
lowered digestibility cannot be explained solely by carbonyl-amino
linkage between the reducing sugars and E'-amino group of lys~ne.
Cross-links within or between protein molecules may be formed by
heat treatment, as shown as Mecham and Dlcott (1947) and these
linkages probably caused resistance of heat-treated proteins against
proteolytic enzymes. '
Ford and Salter (1966) found that aspartic acid, glutamic
acid, lysine and cystine in freeze-dried cod fillet heated at 135°
were poorly released by successive pepsin-trypsin-erepsin enzymic
digestion as compared to the other amino acids. They passed the
enzymic digest of heat-damaged and unheated cod muscle samples
through a sephadex gel G25 column. The eluted fractions were
hydrolysed and the amino acid content was estimated by react~on with
ninhydrin and expressed as "leucine equivalents". They found on
digestion that the heated cod muscle gave less amount of free amino
acids and more of the larger peptide units while the unheated sample
gave mainly free amino acids and some small peptide units. Amino
acid analysis showed lysine - and sulphur - containing amino ac~ds to
be relatively deficient in the free amino acid composition from the
digest of heated fish meal.
- 26 -
•

Growth tests with rats indicated that biological availability
of lysine was much lower than that of methionine and isoleucine
and analysis of the small intestine contents showed an accumulation
of undigested protein and peptides, which like the in vitro tests
were rich in lysine, aspartic and glutamic acids (Buraczewski ~ al
1967, Buraczewska 1966). Erbersdobler ~~ (1969) found on
digestion of heat-damaged casein in rats, that there were differences
in the availability of different amino acids and lysine, asparagine
and glutamine were the most reduced in availability. Since the
peptide fractions, especially the larger peptides were strongly
yellow-brown in colour they must have been the products of inter
action between protein and reducing-sugars. ford (1973) showed
that freeze-dried cod muscle contain 335 mg ribose/100g before
heat treatment. Peptide-fractions which are resistant to enzymic
digestion could be due to this residual ribose and other sugar
containing substituents (possibly the products of nucleic acid
breakdown). He also indicated that cysteic acid is produced as
breakdown product of cystine and severe heat treatment had marked
differential effect on the enzymic digestion and release of different
amino acids fro~ the heat-damaged cod muscle. The free amino acid
components in the enzymic digest were deficient in several amino
acids relative to the amino acid content in the original protein,
especially deficient ~n lysine and the sulphur-containing amino acids.
He has suggested that the damaging effect of heat treatment is
probably indirect, resulting in the formation of new intramolecular
linkages that are not easily hydrolysed by tha gut enzymes and the
linkages involved are mainly glutamine and asparagine and perhaps
- 27 -
also the corresponding glutamic and asparatic acids with lysine.
The low biolog1cal value could be due to a poorer pattern of amino
acid obtained on digestion or that some of the amino acids absorbed
from the gut are still bound up in small undigestible peptide units.
Ford and Shorrock (1971) examined the effects of feeding
heat-damaged cod muscle protein to rats and examined the peptides
and free amino acids content in their urine. They found a
increased urinary excretion of peptide-bound amino acids of approx
imately three-fold with cod fillets heated for 20 h at 135° and
lysine, aspartic acid and glutamic acid together comprise nearly 70%
of the total amino acid residues measured. There was also a higher
total content of free amino acids excreted in the urine. They
suggested that the presence of these "unavailable" peptides might
lower the renal threshold for free amino acids hence hindering the
reabsorption of amino acids by the renal tubules but they concluded
that the urinary losses of undigested peptides were of marginal
nutritional importance. This explanation was analogous to the
findings of Buraczewski, Buraczewska and Ford (1967) who postulated
that the accumulation of "unavailable" peptide material in the
intestine might h1nder the absorption of amino acids by saturating
the absorption sites 1nvolved in their transport across the ileal
mucosal barrier.
Ford and Shorrock (1971) reported findings of lysine, aspartic
and glutamic acid in the urinary residues and suggested that the
biologically unavailable peptide residues could represent the amide
linked asparagine or glutamine with lysine (Bjarnason and Carpenter
1970). However this suggestion now seems less likely to be the case
28 -
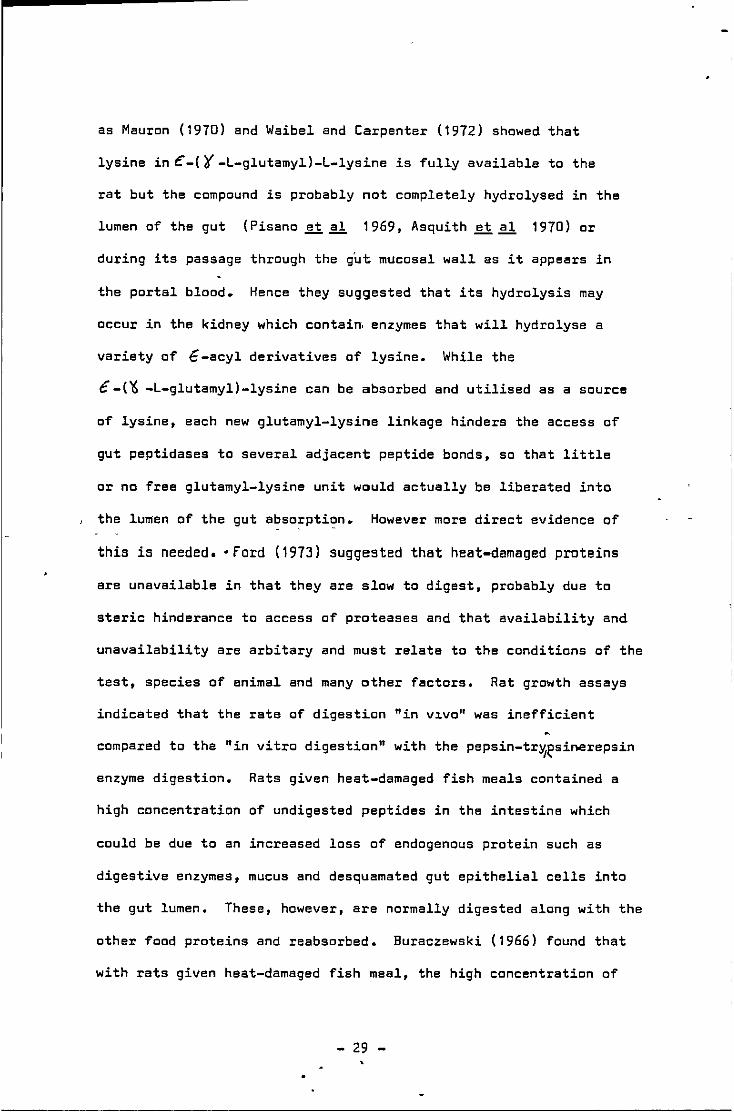
as Mauron (1970) and Waibel and Carpenter (1972) showed that
lysine in f: -( 't -L-glutamyl)-L-lysine is fully available to the
rat but the compound is probably not completely hydrolysed in the
lumen of the gut ( Pisano ll al 1 969, Asquith ll al 1970) or
during its passage through the gut mucosal wall as it appears in
the portal blood. Hence they suggested that its hydrolysis may
occur in the kidney which contain. enzymes that will hydrolyse a
variety of € -acyl derivatives of lysine. While the
c -(~ -L-glutamyl)-lysine can be absorbed and utilised as a source
of lysine, each new glutamyl-lysine linkage hinders the access of
gut peptidases to several adjacent peptide bonds, so that little
or no free glutamyl-lysine unit would actually be liberated into
the lumen of the gut absorpti~n. However more direct evidence of
this ia needed. •ford (1973) suggested that heat-damaged proteins
are unavailable in that they are slow to digest, probably due to
steric hinderance to access of proteases and that availability and
unavailability are arbitary and must relate to the conditions of the
test, species of animal and many other factors. Rat growth assays
indicated that the rate of digestion "in Vl.vo" was inefficient
compared to the "in vitro digestion" with the pepsin-tr~esinerepsin
enzyme digestion. Rats given heat-damaged fish meals contained a
high concentration of undigested peptides in the intestine which
could be due to an increased loss of endogenous protein such as
digestive enzymes, mucus and desquamated gut epithelial cells into
the gut lumen. These, however, are normally digested along with the
other food proteins and reabsorbed. Buraczewski (1966) found that
with rats given heat-damaged fish meal, the high concentration of
- 29
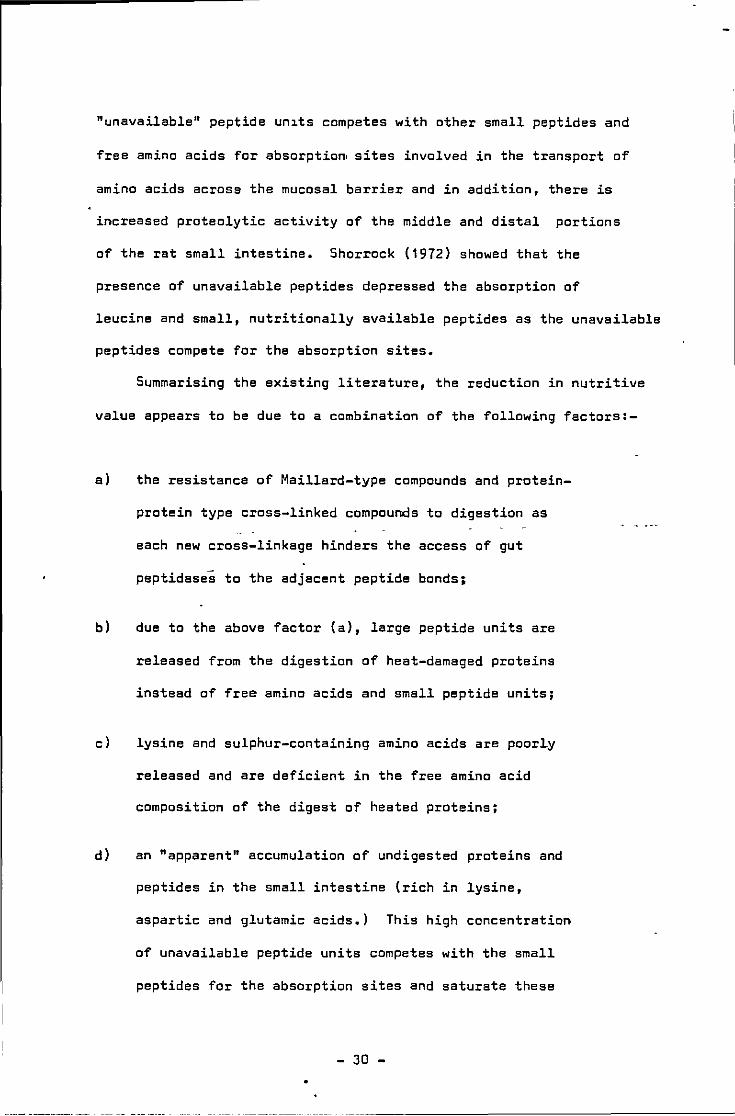
"unavailable" peptide um.ts competes with other small peptides and
free amino acids for absorption• sites involved in the transport of
amino acids across the mucosal barrier and in addition, there is
increased proteolytic activity of the middle and distal portions
of the rat small intestine. Shorrock (1972) showed that the
presence of unavailable peptides depressed the absorption of
leucine and small, nutritionally available peptides as the unavailable
peptides compete for the absorption sites.
Summarising the existing literature, the reduction in nutritive
value appears to be due to a combination of the following factors:-
a) the resistance of Maillard-type compounds and protein
protein type cross-linked compounds to digestion as
each new cross-linkage hinders the access of gut
peptidases to the adjacent peptide bonds;
b) due to the above factor (a), large peptide units are
released from the digestion of heat-damaged proteins
instead of free amino acids and small peptide units;
c) lysine and sulphur-containing amino acids are poorly
released and are deficient in the free amino acid
composition of the digest of heated proteins;
d) an "apparent" accumulation of undigested proteins and
peptides in the small intestine (rich in lysine,
aspartic and glutamic acids.) This high concentration
of unavailable peptide units competes with the small
peptides for the absorption sites and saturate these
- 30 -
sites, depressing the absorption of the small
peptides.
Hence in addition to the heat-damaging effect on fish
proteins during hot smoking at high moisture content, one needs
to consider the extent of damage caused by interaction between
the protein constituents and smoke components, carbonyl groups
of reducing sugars and lipid oxidation products, reactions which
hopefully are limited to the top few centimetres of the smoked
fish fillet surface.
- 31
2.6.0 Proteolytic activity in fish (post-mortem)
~~~ There is a possibility of proteolytic~in fish from the time
of death. The sarcoplasm in fish muscle fibres contain the
cellular organelles called lysozomes which conta~~ the hydrolytic
proteolytic enzymes, including cathepsins, which are active at
acid pH. These proteolytic enzymes are released by rupture of
the lipoprotein membranes of the lysozomes when the pH dropped
lower than the normal in vivo pH level.
Bate-Smith (1948) in a review article suggested that
proteolysis by cathepsin was the most probable cause of tenderness
developed during post-mortem ageing of meat. Sharp (1963) made
extensive studies on aseptic autolysis in rabbit and bovine muscle
at 37°C. He found that the main catheptic activity was confined
to the sarcoplasmic proteins and none from the collagen friction.
Cathepsin in fish muscle have not been studied i~ great detail.
Siebert (1958) found that cathepsin activity in fish muscle was ten
times greater than that of mammalian muscles. Catheps~ns appear
to have an optimum pH around 5.5 and are active at fairly high
temperature of around 37°C for cold blooded animals. Makmodan and
Ikeda (1969) reported proteolytic enzyme activ~ty at slightly
alkaline pH range, in· addition to those active in the acid range.
Wladyka and Dawson (1966) demonstrated that proteolysis occurred
in poultry carcass held at -16° for up to 90 days. McCain~ al
(1966) reported that there was no correlation between tenderization.
and proteolysis and that the free amino acid produced by catheptic
activity are the precursors of meat flavour.
Cathepsin D have been purified with other lysozome enzymes in
the white muscle of gold fish (Bird~~ 1969). Reddi, Spires,
32 -
' ' _,
Constantinides and Dymsza (1972) studied the intracellular
localization of catheptic activity and the phys1cal and
chemical properties of cathepsin D from the skeletal muscle of
the Winter flounder (Pseudopleuronectes americanus) in relation
to the autolytic breakdown of ha~moglobin, They found that the
breakdown of haemoglobin increased with decreased pH with optimum
range of 3 to 7, with the lysozomal fraction; it is stable at 5°C
and still active at 66°, They found that cathepsin· D hydrolyse
the protein in• the fish tissue homogenate and the breakdown products
were further hydrolysed by cathepsins A, B and C as suggested by
Huang and Tappel (1971) and this autolytic spoilage facilitate
subsequent spoilage by bacteria,
Makinodan and Ikeda (1969) reported a protease of Carp muscle
which is active in the slightly alkaline range a~d retain~d'70%
of its activity after heating at 60° for 1 hour. This relative
stability of catheptic enzymes to high temperature is an important
feature in the heat processing of fish muscle as insufficient heat
treatment would cause enzymic activity to be retained,
Advantage of catheptic activity is made by the process of
ensilaging fish wastes by the addition of hydrochloric acid or
form1c acid to bring the pH down to pH 3 to 4, to obtain a product
of high amount of soluble protein which is dried for mixing into
animal feed and fish sauces.
Raa and Gildberg (1976) measured the rate of autolysis of
cod viscera in the process of ensilaging and found that the initial
rate of autolysis is the highest at pH 3,5 to 4.0 (measured as
increase of dry weight of the soluble phases.) The protein sediment
- 33
left after autolysis is very similar to that of structural
glycoprotein extracted from connective tissue (Robert and Conte
1968) and that autolysis is the resultant of the action of proteolytic >
enzymes and other enzymes splitting thos B-glycosidic bonds which
interlink the glycoprotein with the other structural protei~.
Hence from time of death of fish when it is landed in the
trawler, the pH of fish gradually decrease due to accumulation of
lactate from breakdown of muscle glycogen. The level of pH depends
on the physiological condition of the fish (whether well fed, rested
or exhausted or spawning) species of fish, type of fishing ground and
seasonal variation. The low pH ruptures the lysozome lipoprotein
membrane, releasing the proteolytic enzymes. Short chain peptides
and amino acids are produced as a result of catheptic activity and
one would expect the fish non-protein extractives to be high in some
free amino acids. Fish which not, quickly eviscerated on board
the trawler would have a higher level of free amino acids fro~ the
protease action of the gut enzymes. Hence one must expect a
certain amount of lysine as free amino acid in the fish muscle
extractive before the smoking process and an increase during the initial
stages of smoking process, as the temperature of the fish fillet
gradually rose to the kiln temperature, before high temperature
eventually inactivated the enzymes. Of more importance than the
free lysine increase is the possible increase in N-terminal amino
groups.
- 34
2.7.0 Determination of 1-fluoro, 2 4-dinitro benzene (FDNBJ reactive lysine
Chemical methods for the determination of available lysine
have been developed because of the slow throughput and difficulties
associated with the microbiological procedures and methods
involving the use of experimental animals. An example of the
chemical methods is the amino acid analysis by the method of
Moore and Stein (1951). A disadvantage with this method is that
the results give the total lysine content of the sample and do not
indicate the level of available lysine. It is also difficult to
obtain complete recovery of an amino acid and reproducibility of
results have been reported to be poor. The method of 2,4,6- trinitro
benzene sulphonic acid (TNBS) procedure developed by Kakade and
Liener (1969) have been found to be useful in fish meal, soya bean '
oil meal and whole milk protein. Criticism of this method is that
the estimation of available lysine is less specific than that of
the FDNB procedure. Amino acid analysis after alkylation of
epsilon-amino group of lysine, (the procedure by Finlay and Friedman
1973) is lengthy and complex.
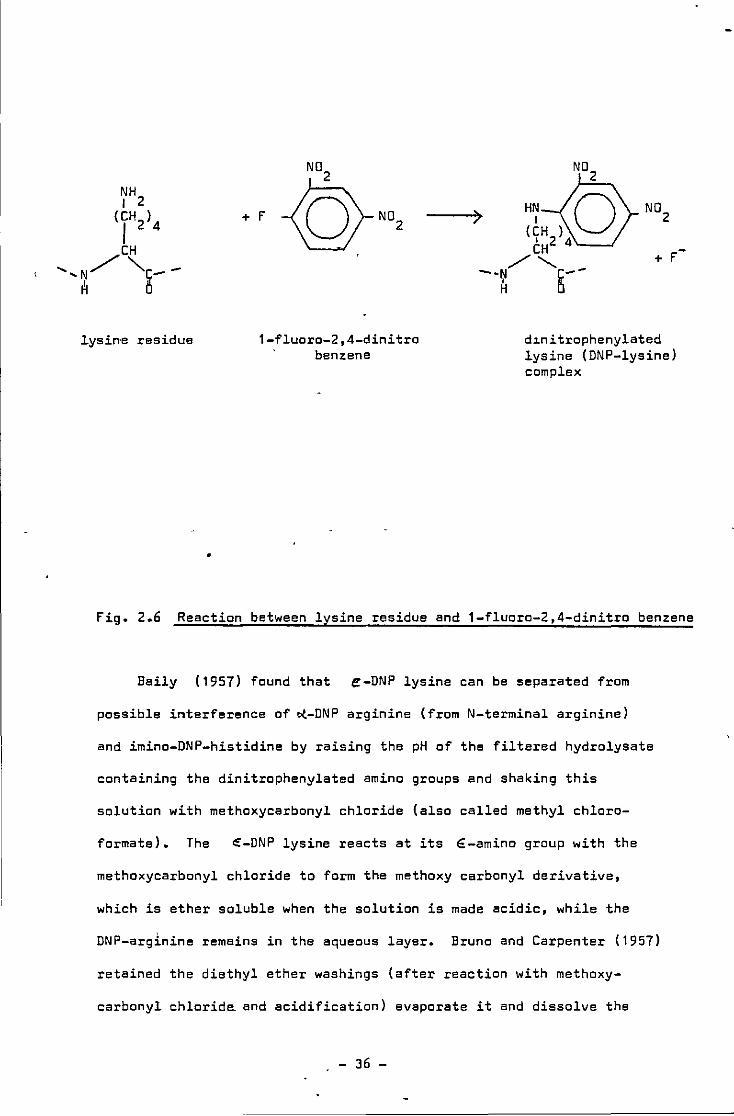
The method of Carpenter (1960) is widely used for the
determination of available lysine in proteins and protein-containing
foods, but it is not suitable for samples containing high amounts of
carbohydrates such as cereals. The reaction between the amino group
of the amino acid and 1-fluoro-2,4-dinitro benzene was introduced
by Sanger (1945). The FDNB method determines the number of lysine
molecules which have free-amino groups, that is, groups not
covalently bound by other amino acid residues. It is now generally
accepted that only these lysine molecules are nutritionally available.
- 35 - .
NH I 2
(CH2
) I 4 CH
........ N''/ "'!;:- -R !l
lysir>e residue
+ f
1-fluoro-2,4-dinitro · benzene
•
d~nitrophenylated
lysine (DNP-lysine) complex
fig. 2.6 Reaction between lysine residue and 1-fluoro-2,4-dinitro benzene
Baily ( 1957) found that e-DNP lysine can be separated from
possible interference of ~-DNP arginine (from N-terminal arginine)
and imino-DNP-histidine by raising the pH of the filtered hydrolysate
containing the dinitrophenylated amino groups and shaking this
solution with methoxycarbonyl chloride (also called methyl chloro-
formate). The e-DNP lysine reacts at its €-amino group with the
methoxycarbonyl chloride to form the methoxy carbonyl derivative,
which is ether soluble when the solution is made acidic, while the
DNP-arginine remains in the aqueous layer. Bruno and Carpenter (1957)
retained the diethyl ether washings (after reaction with methoxy-
carbonyl chlorida and acidification) evaporate it and dissolve the
- 36 -
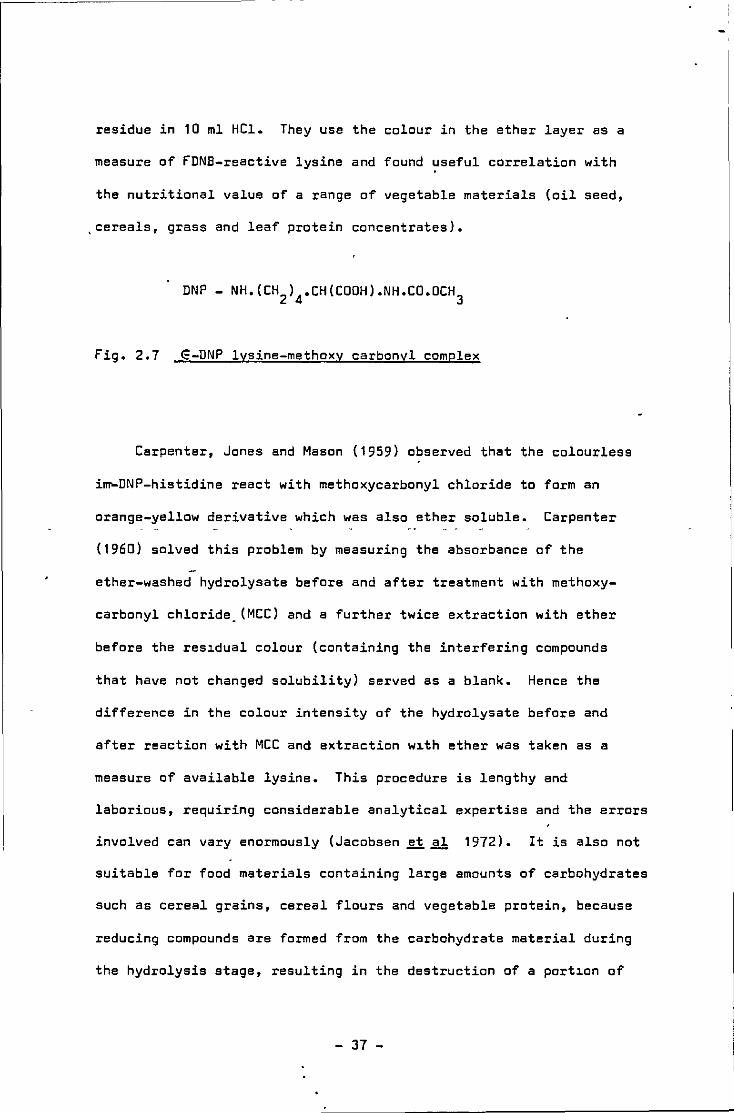
residue in 10 ml HCl. They use the colour in the ether layer as a
measure of fDNB-reactive lysine and found useful correlation with
the nutritional value of a range of vegetable materials (oil seed,
,cereals, grass and leaf protein concentrates).
fig. 2.7 ~-DNP lysine-methoxy carbonyl complex
Carpenter, Jones and Mason (1959) observed that the colourless
im-DNP-histidine react with methoxycarbonyl chloride to form an
orange-yellow derivative which was also ether soluble. Carpenter
(1960) solved this problem by measuring the absorbance of the
ether-washed hydrolysate before and after treatment with methoxy
carbonyl chloride_ (MCC) and a further twice extraction with ether
before the res~dual colour (containing the interfering compounds
that have not changed solubility) served as a blank. Hence the
difference in the colour intensity of the hydrolysate before and
after reaction with MCC and extraction w~th ether was taken as a
measure of available lysine. This procedure is lengthy and
laborious, requiring considerable analytical expertise and the errors
involved can vary enormously (Jacobsen et~ 1972). It is also not
suitable for food materials containing large amounts of carbohydrates
such as cereal grains, cereal flours and vegetable protein, because
reducing compounds are formed from the carbohydrate material during
the hydrolysis stage, resulting in the destruction of a port~on of
- 37 -
the E -dinitrophenylated lysine and the content of the chemically
available lysine is, hence, under-estimated. DNP-lysine is
absorbed by dinitrophenols, carbon1sed starch and insoluble "humin"
from vegetable materials. Booth (1971) recommended redigestion of
the washed insoluble residues. He found yields of 0.7% of the
initial yield for the second digestion of wheat, 1.6% for fish and
meat meals and cereals average about 5%.
Polylysine is not easily hydrolysed and dinitrophen.ylation of
polylysine makes digestion on hydrolysis even slower but in, a
sealed ampoule autoclaved at 120°C, Booth (1971) obtained on second
digestion, a yield of 4.3%.
A small weight of sample to volume of acid is recommended for
hydrolysis to minimise the destruction of amino acid during acid
digestion of protein (Shram, Dustin, Moore and Bigwood 1953), This
was confirmed by Rao et~ (1963) on cottonseed and Matheson (1968)
on groundnut. Reflux of carbohydrate in HCl produced a yellow
soluble compound called humin (in the case of sample with high
carbohydrate content) which absorbs light at 435 nm. Booth (1971)
reported that this problem can be overcome by hot filtration of the
acid hydrolysate. He (Booth 1971) also showed that the loss of
added DNP-lysine to fish meal in the absence of carbohydrate was 9%
but loss was increased to 20% with the addition of starch, as
carbohydrates especially pentoses when heated with HCl, produced
furfural which may act as reducing agents for the DNP-lysine. Booth
(1971) also showed that Carpenter's original correction factor of 1,09
may be too high for materials that contained no carbohydrate. He
obtained a value of 1.04 for freeze-dried chicken meat, an average
- 38 -
of 1.05 for fish meals, 1.2 for wheat and some other cereals and
1.14 for beans, groundnut and maize.
fDNB-reactive lysine by difference
Rao, Carter and Frampton (1963) determined lysine before and
after dinitrophenylation of the sample, the difference represent
fDNB-available lysine by difference (Total lysine minus Inaccessible).
Rao ~~ (1963) removed the ether-soluble breakdown products
before the acid digest1on but in Carpenter's method. these products
are left to protect the ~-DNP-lysine during the digestion. The
method also employ the use of an ion-exchange chromatographic column
containing a resin, size B Amberlite IR-120 in the sodium form in a
column of 6 cm. This requires considerable expertise in the
collection of various effluent fractions and regeneration of the
column with water-aqueous NaOH-water-HCl washings. Hence throughput
of samples is very slow and continuous attention is required when
collecting the effluent fractions. The method, however, is said to
be more specific as it includes the N-terminal lysine and free lysine
but excludes all the other amino acids.
Roach, Sanderson and Williams (1967) combined the methods of
Carpenter (1960) and Rao ~~ (1963). The determination of
available lysine was calculated by measurement of the total lysine
in an acid hydrolysate of a sample and of lysine remaining in solution
after a separate hydrolysis of the sample treated with 1-fluoro-
2,4-dinitrobenzene according to the method of Carpenter (1960). The
lysine remaining in the solution, not reacted with fDNB, being the
1naccessible lysine. Hence the difference between these 2 values of
- 39 -
lysine (in the 2 separate hydrolysis is the lysine in the protein
which have the free €:-amino group and is referred to as available
lysine). The method of Roach~~ (1967) is more rapid as it
1s semi-automated. The effluent fraction is drawn off the column
at a rate of 0.42 ml/min. and is· fed directly into the Technicon
Autoanalyser analytical system and the colour developed with
ninhydrin is read at 570 nm and recorded automatically. Standards
of 0.1 mole/ml lysine solution is run together with the samples so
that the peaks obtained with the standards are pared with that
obtained for the sample. Like Booth (1971) they found that since
the variability of recovery is high, determination of the recovery
correction factor for individual runs is required.
Although many workers have found loss in lysine with heat
damaged food samples, there is no literature on the possibility of
~-DNP lysine reacting with smoke-phenolic and -carbonyl compounds
in smoked products. This possibility of this reaction has not been
considered even by workers examining smoked meat (Dvorak and
Vognarova 1965) and smoked"fish (Hoffman ~ al 1977).
- 40 -

2.8.0 Dye binding of food and feedstuffs
The literature here will concentrate mainly on the azo acid
dyes of Acid Orange 10 (A0.10) and Acid Orange 12 (A0.12).
Much work has been carried out in the employment of dye binding
in the determination of protein quality in certain foodstuff but
little have been published on the quantitative basis.
Fraenkal-Conrat and Cooper (1944) developed a method in which
the dye acid orange G 10 (AD 10) was used to determine the number
of basic groups in protein. They (Fraenkal-Conrat and Cooper 1944)
found that the uptake of acid orange 10 by granules of gelatin i~
citrate-phosphate buffer at pH 2.2 was equivalent to the number of
titratable basic groups. The dye binding procedures commonly used
now for the estimation of protein and the evaluation of protein -
quality have generally adopted this basic method but it should be
noted that the dye-binding procedures which are currently used for
• the estimation of basic groups in proteins are quite different
from that originally employed by Fraenkal-Conrat and Cooper (1944),
as different dye-stuffs are used and experimental parameters have
changed considerably. Under the conditions currently employed, the
reaction• between the dye and the protein is no longer stoichiometric
(Lakin 1973 a).
The basic technique of dye binding procedure involves:-
1) the finely divided food sample is mixed with a
reagent containing the dye stuff of known strength
buffered at pH 2;
2) an equilibration period of violent shaking for
intimate contact to allow the acidic or basic
- 41 -
amino groups of the protein react with the dye
to form insoluble complexes;
3) insoluble complexes are removed by filtration
through an inert material (such as glass micro
filter paper) or centr~fugation;
4) the extinction of the excess dye in the
supernatant solution is then measured after
dilution or in a cuvette of short path length.
This extinction value is inversely proportional
to the amou~t of basic or acidic groups in the
sample.
The mechanism of dye binding is an electrovalent att%action
between the dye anion (in the case of azo acid dyes) and the
basic amino acid residues of the protein, which are positively
charged. In a buffer of low PH of 1 to 2, the cation imidazole,
guanidine and ~-amino groups and the free amino end groups of
the protein chains (small fraction compared to the basic amino acid
residues in the protein) binds quantitatively with the anionic
sulphonic sites of the basic dyes Acid Black, Acid Orange 12 and
Acid Orange 10.
- 42 -
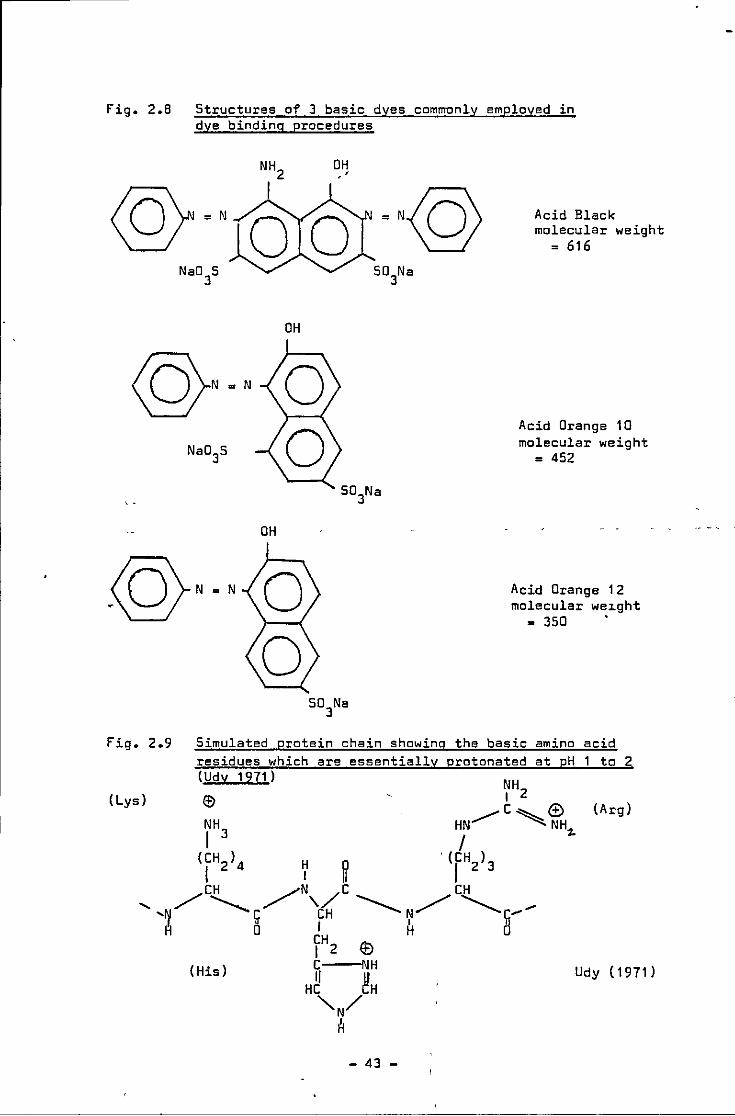
fig. 2.8
Fig. 2.9
(Lys)
Structures of 3 basic dyes commonly employed in dye binding procedures
OH
OH
Acid Black molecular weight
= 616
Acid Orange 10 molecular weight
= 452
Acid Orange 1 2 molecular we1.ght
= 350 .
Simulated protein chain showing the basic amino acid residues which are essentially protonated at pH 1 to 2 (Udy 1971)
(Arg)
(His) Udy (1971)
- 43 -
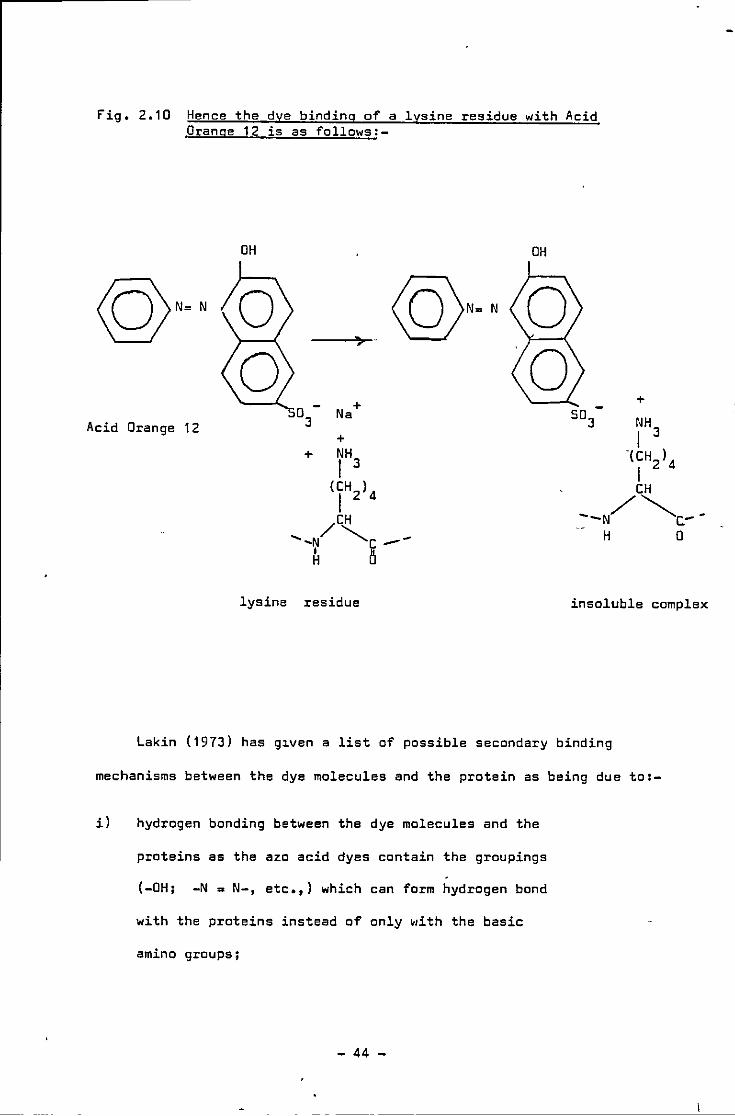
fig, 2.10 Hence the dye binding of a lysine residue with Acid Orange 12 is as follows:-
OH
Acid Orange 12 0
3- Na +
+ + NH I 3
<IH2>4 /CH
.... ,N """-c --~ 5
OH
+
lysine residue insoluble complex
Lakin (1973) has g~ven a list of passible secondary binding
mechanisms between the dye molecules and the protein as being due to:-
il hydrogen bonding between the dye molecules and the
proteins as the aza acid dyes contain the groupings
(-OH; -N ~ N-, etc.,) which can farm hydrogen band
with the proteins instead of only •li th the basic
amino groups;
- 44 -
r
ii) acid azo dyes have hydrophobic structures which are
made water soluble by substitution of the polar
groups hence the hydrophobic sites f~em hydrophobic
bonds with the proteins;
iii) hydrogen and/or hydrophobic bonding between the dye
molecules, already bound to proteins. and the
free dye molecules giving dye-dye binding reactions,
indicating more basic amino acid residues than there
actually are.
To avoid this secondary binding mechanism, a correct ratio of
dye-protein basic groups is essential, Ashworth (1971) have shown
that the proteins of meat products do not react stoichiometrically •
with the dye acid orange 12 as an increased dye/protein ratio
in.creased the dye binding capacity (DBC) and standard deviation also
increased, possibly indicating secondary binding mechanisms. Milk
protein have also been shown to react in a similar way. Ashworth
and Chanrlry (1962) determined the dye binding capacity of milk
proteins with Amide Black 108 and Orange G and stressed that the
u~bound dye or equilibrium dye concentration must be used to determine
the proper value of the DBC before the DBC can be used to convert the
dye bound to mg protein in the sample~ Hurrell and Carpenter (1975)
found that repeating the determinations with smaller quantities of
test materials gave much higher values of DBC although the relative
values of the different test material remained almost the same.
In addition to Dye/Protein ratio, (a) hydrogen ion concentration,
(b) particle size of test sample, (c) reaction or equilibration time,
- 45 -
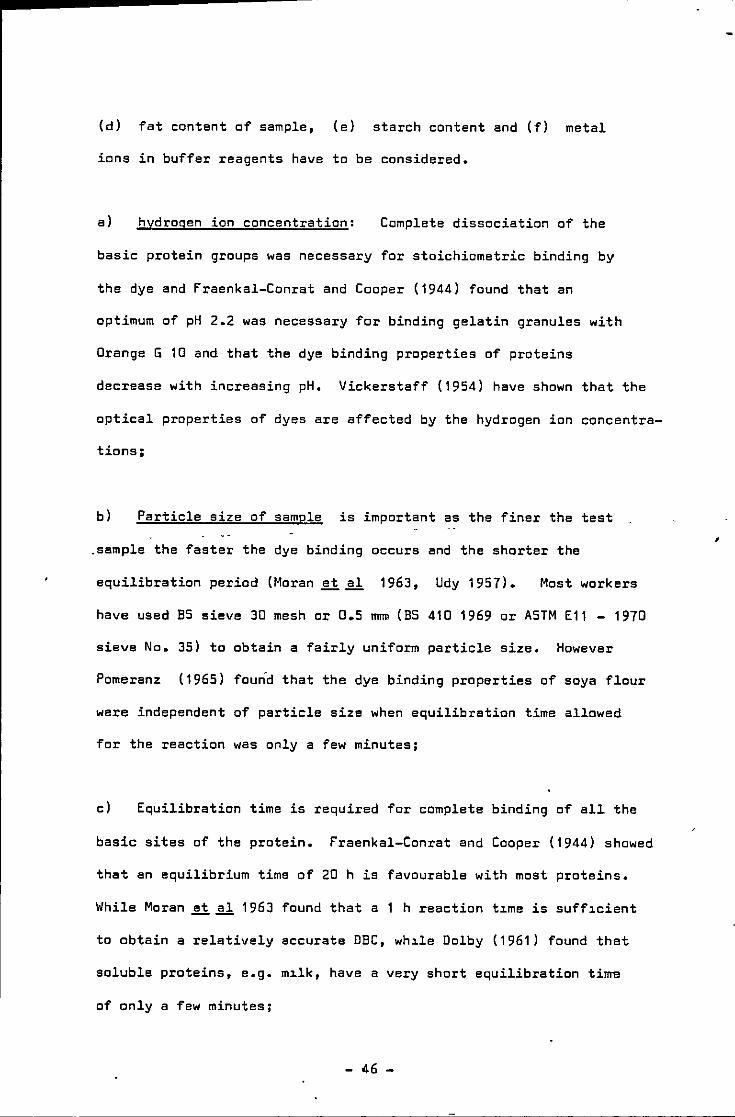
(d) fat content of sample, (e) starch content and (f) metal
ions in buffer reagents have to be considered.
a) hydrogen ion concentration: Complete dissociation of the
basic protein groups was necessary for stoichiometric binding by
the dye and Fraenkal-Conrat and Cooper (1944) found that an
optimum of pH 2.2 was necessary for binding gelatin granules with
Orange G 10 and that the dye binding properties of proteins
decrease with increasing pH. Vickerstaff (1954) have shown that the
optical properties of dyes are affected by the hydrogen ion concentra
tions;
b) Particle size of sample is important as the finer the test
.sample the faster the dye binding occurs and the shorter the
equilibration period (Moran ~~ 1963, Udy 1957). Most workers
have used 85 sieve 30 mesh or 0.5 m~ (BS 410 1969 or ASTM E11 - 1970
sieve No. 35) to obtain a fairly uniform particle size. However
Pomeranz (1965) found that the dye binding properties of soya flour
were independent of particle size when equilibration time allowed
for the reaction was only a few minutes;
cl Equilibration time is required for complete binding of all the
basic sites of the protein. Fraenkal-Conrat and Cooper (1944) showed
that an equilibrium time of 20 h is favourable with most proteins.
While Moran ~ al 1963 found that a 1 h reaction t1me is suff1cient
to obtain a relatively accurate DBC, wh1le Dolby (1961) found that
soluble proteins, e.g. m1lk, have a very short equilibration tima
of only a few minutes;
- 46 -
'
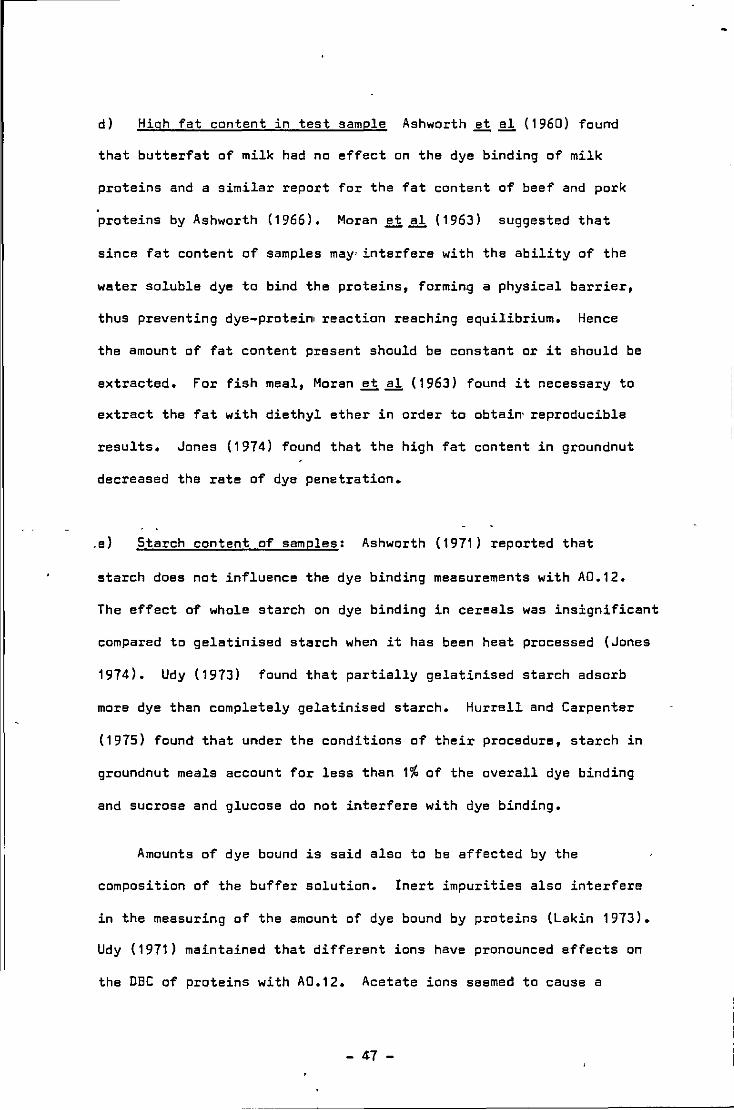
d) High fat content in test sample Ashworth ~ ~ (1960) found
that butterfat of milk had no effect on the dye binding of milk
proteins and a similar report for the fat content of beef and pork
proteins by Ashworth (1966). Moran ~~ (1963) suggested that
since fat content of samples may· interfere with the ability of the
water soluble dye to bind the proteins, forming a physical barrier,
thus preventing dye-protein reaction reaching equilibrium. Hence
the amount of fat content present should be constant or it should be
extracted. For fish meal, Moran ~~ (1963) found it necessary to
extract the fat with diethyl ether in order to obtain· reproducible
results, Jones (1974) found that the high fat content in groundnut
decreased the rate of dye penetration •
. e) Starch content of samples: Ashworth (1971) reported that
starch does not influence the dye binding measurements with A0,12.
The effect of whole starch on dye binding in cereals was insignificant
compared to gelatinised starch when it has been heat processed (Jones
1974). Udy (1973) found that partially gelatinised starch adsorb
more dye than completely gelatinised starch. Hurrell and Carpenter
(1975) found that under the conditions of their procedure, starch in
groundnut meals account for less than 1% of the overall dye binding
and sucrose and glucose do not interfere with dye binding.
Amounts of dye bound is said also to be affected by the
composition of the buffer solution. Inert impurities also interfere
in the measuring of the amount of dye bound by proteins (Lakin 1973).
Udy (1971) maintained that different ions have pronounced effects on
the DBC of proteins with AD.12. Acetate ions seemed to cause a
- 47 -
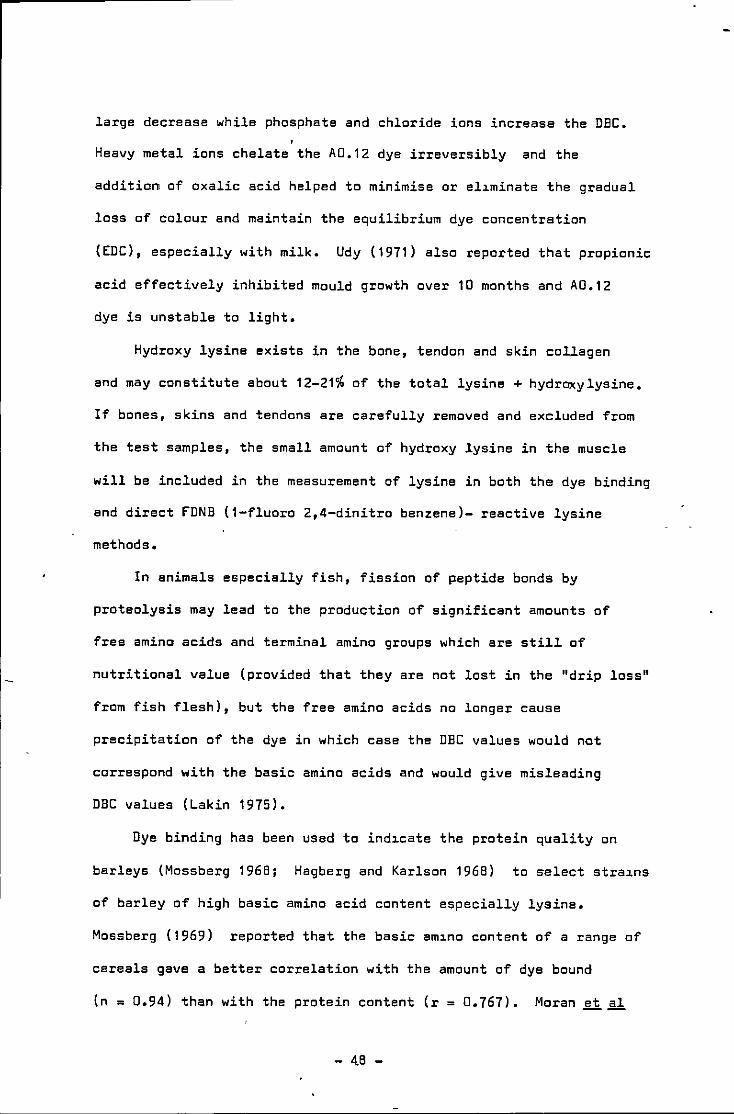
large decrease while phosphate and chloride ions increase the DEC.
Heavy metal ions chelate the A0.12 dye irreversibly and the
addition of oxalic acid helped to minimise or el~minate the gradual
loss of colour and maintain the equilibrium dye concentration
(EDC), especially with milk. Udy (1971) also reported that propionic
acid effectively inhibited mould growth over 10 months and A0.12
dye is unstable to light.
Hydroxy lysine exists in the bone, tendon and skin collagen
and may constitute about 12-21% of the total lysine + hydroxylysine.
If bones, skins and tendons are carefully removed and excluded from
the test samples, the small amount of hydroxy lysine in the muscle
will be included in the measurement of lysine in both the dye binding
and direct FDNB (1-fluoro 2,4-dinitro benzene)- reactive lysine
methods.
In animals especially fish, fission of peptide bonds by
proteolysis may lead to the production of significant amounts of
free amino acids and terminal amino groups which are still of
nutritional value (provided that they are not lost in the "drip loss"
from fish flesh), but the free amino acids no longer cause
precipitation of the dye in which case the DBC values would not
correspond with the basic amino acids and would give misleading
DBC values (Lakin 1975).
Dye binding has been used to ind~cate the protein quality on
barleys (Mossberg 1968; Hagberg and Karlson 1968) to select stra~ns
of barley of high basic amino acid content especially lysine.
Mossberg (1969) reported that the basic am~no content of a range of
cereals gave a better correlation with the amount of dye bound
(n = 0.94) than with the protein content (r = 0.767). Moran ~~
- 4.8 -
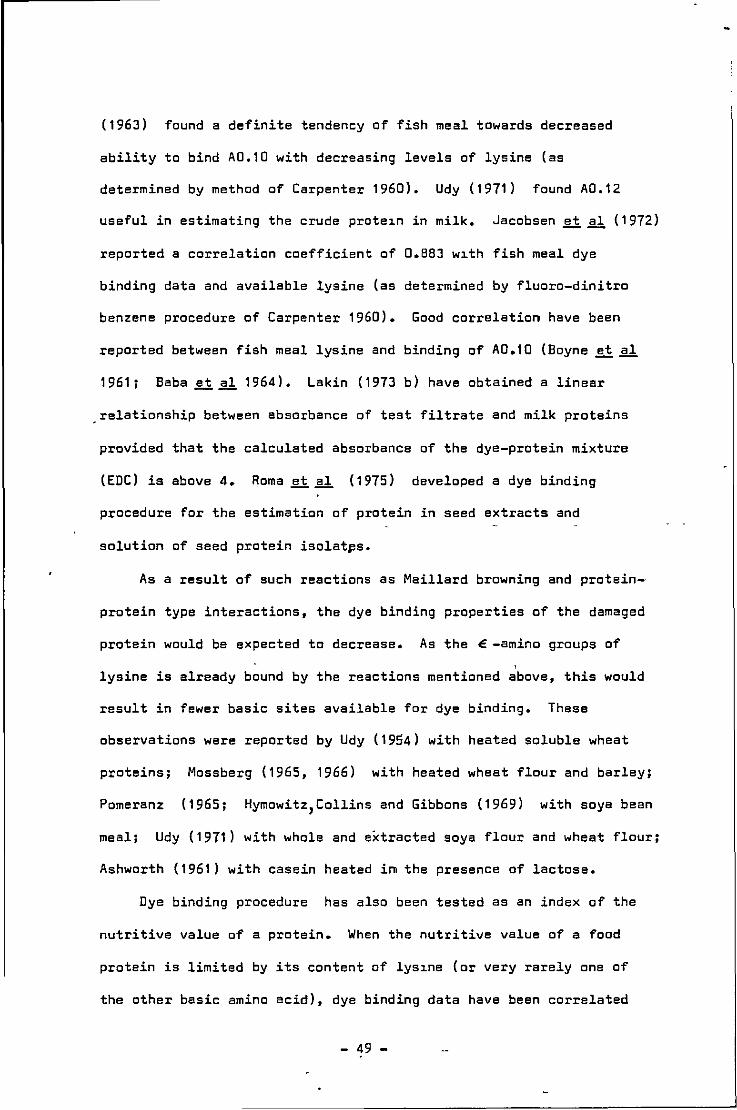
(1963) found a definite tendency of fish meal towards decreased
ability to bind A0.10 with decreasing levels of lysine (as
determined by method of Carpenter 1960). Udy (1971) found A0.12
useful in estimating the crude prote1n in milk. Jacobsen ~~ (1972)
reported a correlation coefficient of 0.883 w1th fish meal dye
binding data and available lysine (as determined by fluoro-dinitro
benzene procedure of Carpenter 1960). Good correlation have been
reported between fish meal lysine and binding of A0.10 (Boyne ~ al
1961; Baba ~~ 1964). Lakin (1973 b) have obtained a linear
relationship between absorbance of test filtrate and milk proteins
provided that the calculated absorbance of the dye-protein mixture
(EDC) is above 4. Roma ~~ (1975) developed a dye binding
procedure for the estimation of protein in seed extracts and
solution of seed protein isolat~s.
As a result of such reactions as Maillard browning and protein-
protein type interactions, the dye binding properties of the damaged
protein would be expected to decrease. As theE-amino groups of
' lysine is already bound by the reactions mentioned above, this would
result in fewer basic sites available for dye binding. These
observations were reported by Udy (1954) with heated soluble wheat
proteins; Mossberg (1965, 1966) with heated wheat flour and barley;
Pomeranz (1965; Hymowitz1 Collins and Gibbons (1969) with soya bean
meal; Udy (1971) with whole and extracted soya flour and wheat flour;
Ashworth (1961) with casein heated i~ the presence of lactose.
Dye binding procedure has also been tested as an index of the
nutritive value of a protein. When the nutritive value of a food
protein is limited by its content of lys1ne (or very rarely one of
the other basic amino acid), dye binding data have been correlated
- 49 -
~e.c
with the results of animal feeding trials. Acid Orange 10~har
been found to correlate well with the nutritive value of fish meals
(Thurston 1957); whale meat, fish meals and meat and seed meals.
(Bumyan and Price 1960, Boyne tl & 1961, Bunyan and Woodham 1974);
meat and bone meals (Choppe and Kratzer 1963); soya bean meals
(Moran tl& 1963) and a series of heated barley samples DBC values
with mouse growth (Mossberg 1965; 1966). Jones (1974) reported that
early Maillard-type reactions are not discriminated by dye binding
as the sugar-protein complex in the early stages of the Maillard
reaction are still basic in character. Hurrel1 and Carpenter (1975)
used 3 dye binding procedures for the assessment of heat damaged
protein and reported that mild heat treatment of groundnut meal
(1h at 121°C) did not affect the DBC values of AD.12 or the nutritional
•vslue of a similar sample as reported by Anantharaman and Carpenter
(1971). When the protein and glucose or sucrose system was more
severely heated (4h at 121°C) the DBC values were lowered slightly
but not to the same extent as , the reduction in basic amino acids
histidine and argininie as determined by amino acid analysts and
G\S J.eter "''"ed reactive-lysinekby fDNB method,_~ ~>the total of these 3 basic
amino acids as determined by these methods is termed H A R-L values
by Hurrell and Carpenter 1975). However, with severely heated meat
products (autoclaved, oven-dried steak and ox gut) the AD.12 DBC
values fell to the same extent as the H A R·L values, as the dye in
these conditions, has~ not been able to penetrate to the reactive
sites probably due to extensive cross-linkage formed in the protein
(due to protein-protein type damage), in add>.tion to "Maillard" type
react>.ons. With bovine plasma albumin and fat-extracted, freeze-
dried chicken muscle, unheated or severely heated in the absence of
- so -
sugar, the A0.12 dye binding values were close to the HA R L
values. When animal feeding stuffs were treated to early,
advanced Maillard and prote1n-protein type damage, they reacted
with A0.12 in much the same way as with the model systems of
lactalbumin acylated to form formyl lactalbumin and propionyl
lactalbumin.
Hence fish hot-smoked over a period of several hours undergo~
early to advanced "Maillard" type reactions and protein-protein type
heat damage and would be expected to behave in a similar manner to
that reported for A0.12 dye used under similar experimental conditions
with other similarly heat-damaged materials.
•
•
- 51 -
2,9,0 A review of the different blocking reagents forE-amino group of lysine
2.9 .1 Acylation of € -amino groups of lysine by propionic anhydride
Udy (1971) observed that when lys1ne was blocked (by an
unspecified reagent) the dye bind1ng value of the blocked protein
was the same as that obtained by severely heated soya beans and
wheat samples. He concluded that since the blocked samples and
the heated samples behaved similarly, then all the lysine must
have been made chem1cally unavailable for dye binding 1n the heated
samples. The subsequent dye binding value must be proportional to
the amount of available arginine and histidine in the protein sample.
If the dye binding value of the treated sample was subtracted from
that obtained for the, untreated sample, the difference would be
proportional to the chemically reactive lysine content.
Hurrell and Carpenter (1975) used model systems of blocked
lysine; formyl lactalbumin and propionyl lactalbumin in which 75%
and 95% respectively of their € -amino group of lysine WdS'·in a
form that w oU:tcl not react with the FDNB. The DBC values gave a very
good correlation• with the HAR-L values <histidine and arginine
determined by amino acid analysis and reactive lysine by the FDNB
method), There was a decrease of 49.05% and 49.53% in the HAR-L and
DBC (A0.12) values respectively for formyl lactalbumin and a decrease
of 67.92% and 71.02% in the HAR-L and DBC value respectively for
propionyl lactalbumin for the unacylated lactalbumin.
Hurrell and Carpenter (1976) described a method for the
propionylation of lysine residues, determining the dye binding values
before and after blocking the lysine, giv1ng a specific measure of
- 52 -
·-~-------·-- .. ,. __ , ___ _
lys~rte in, whale wheat and wheat gluten, rice, sweet corn ( zea mays
rugose), groundnut flour, beans (soya, broad and wing), chick peas
and bovine plasma albumin. The results showed good agreement but
the meat meals and fish meals S o.ve- -- :"-~r dye bindil1'g
difference (DBD) values of only 0.7-0.9 of the corresponding fDNB
values which they ascribed as due to incomplete propianylation
under the conditions used so far.
A sample containing .C. 15 mg lysine was shaken vigorously for
15 min with 0.2 ml propionic anhydride and 2 ml half saturated
sodium acetate solution in a glass tube stoppered at each end. The
suspension was then subjected to the "foss" DBC procedure. 40 ml
dye solution (3-89 mmol/litre oxalicacid-acetic acid-phosphate
buffer pH 1.25) was added and shaken violently for 6 min with a
steel disc il1' the reaction chamber. The dye sample mixture was
filtered and the extinction of the filtrate was compared with that
of the unreacted dye solution. The unacylated sample was subjected
• to the normal dye binding procedure w~th 2 ml acetate solution
added to the 40 ml dye solution. The DBC obtained for the unacylated
(unpropianylated) sample minus the DBC obtained far the ~rapionylated
sample gave the dye binding difference (DBD) values. Another
reason that Hurrell and Carpenter (1976) gave for the low correlation
for meat and fish meals was the difficulty of transferr~ng the
acylated sample from a small vessel to one suitable for dye binding
reaction. This reason should surely apply also to the cereal, beans
and bovine plasma albumin samples. It should, however, be noted that
Hu~rell and Carpenter (1976) used Acid Orange 12, ready mixed far use
with a Pro Meter Mk II (A/5 foss Electric, Hiller~d, Denmark). Bath
the dye and the reference standard were supplied by the manufacturers.
- 53 -
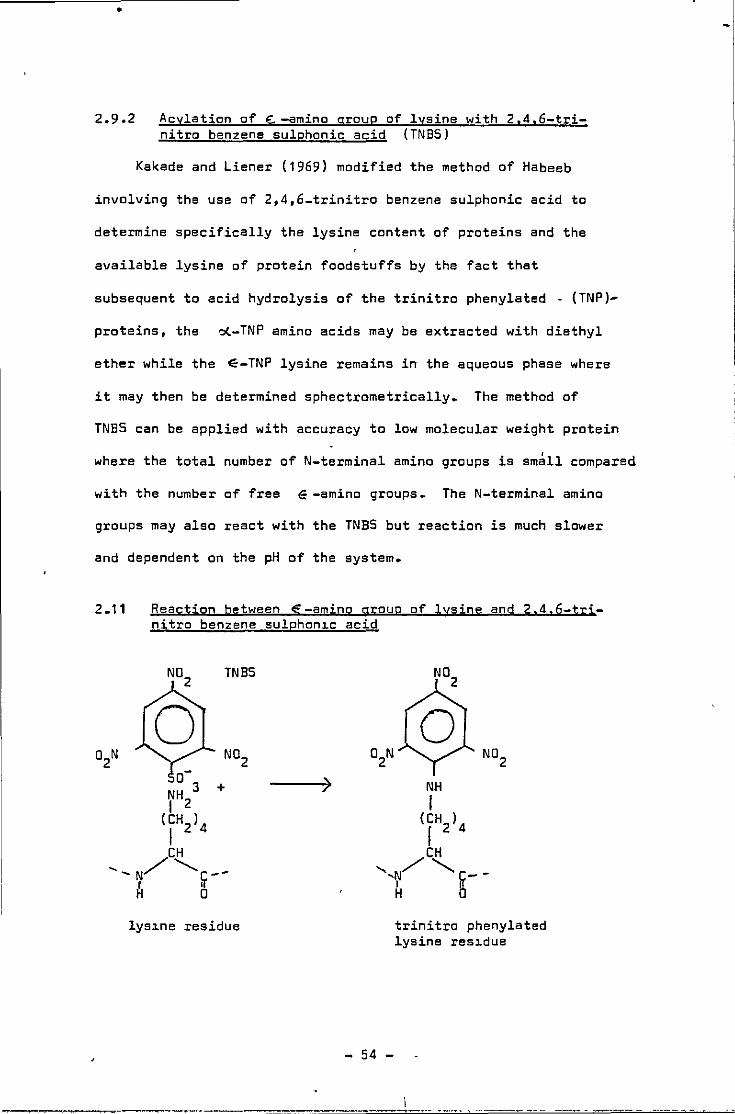
•
2.9.2 Acylation of ~..amino group of lysine with 2.4.6-trinitro benzene sulphonic acid (TNBS)
Kakade and Liener (1969) modified the method of Habeeb
involving the use of 2,4,6-trinitro benzene sulphonic acid to
determine specifically the lysine content of proteins and the
available lysine of protein foodstuffs by the fact that
subsequent to acid hydrolysis of the trinitro phenylated - (TNP)-
proteins, the el(.-TNP amino acids may be extracted with diethyl
ether while the E-TNP lysine remains in the aqueous phase where
it may then be determined sphectrometrically. The method of
TNBS can be applied with accuracy to low molecular weight protein
where the total number of N-terminal amino groups is small compared
with the number of free € -amino groups. The N-terminal amino
groups may also react with the TNBS but reaction is much slower
and dependent on the pH of the system.
2.11 Reaction between §-amino grouo of lysine and 2.4. 6-trinitro benzene sulphon~c acid
lysJ.ne residue
---------------------
- 54 -
trinitro phenylated lysine resJ.due
The TNBS reacts with the primary amino groups at pH 8.5
in 2% sodium bicarbonate at 40°C to form the trinitro-
phenylated lysine residues. The reaction between TNBS and the
P\ - or 6 -amino groups of free amino acids and proteins depend
on the pH of the system and pKa of the amino group. The ~ -amino
group of lysine being the most reactive while the imidazole
group of histidine (freedman and Radda 1968) and guanidine group
of arginine (Sataka ~~ 1960) were found not to react with
TNBS. Different proteins react at different rates with TNBS,
requiring different concentration of TNBS and adsorption isotherms
must be determined for the protein sample.
Jones (1974) found that the dye-protein equilibrium mixture may
contain the residual TNBS reagent which could change the pH of the
system or compete with the dye anions for basic sites on the proteins.
Hence it was necessary to remove the excess TNBS from the sample
reagent by filtration before proceeding with the dye binding reaction.
Jones 1 s method is as follows:-
1) sample (100 ± 1 mg) was weighed into a 100 ml polyethene
bottle and 10 ml 4% (w/ ) sodium bicarbonate V
was added. The sample was dispersed by gentle aditation
and incubated at 40°C for 30 min;
ii) TNBS solution (10 ml of 1% w/ ) was added and the reaction V
was allowed to proceed at 40°C for 4 h with occasional
agitation;
- 55 -
---------
iiil the solution was then acidified by addition of
5 ml 1M HCl and the contents mixed;
ivl the contents of the bottle were filtered through glass
micro fibre filter paper and the precipitate washed
with 2 x 5 ml aliquots of 0.2M citric acid. The
filter paper was allowed to drain;
v) the filter paper together with the treated sample was
placed back in the polyethene bottle, J glass beads were
added and tube and contents were subjected to the
normal dye binding procedure.
-1 For the untreated sample the dye concentration was J meq 1
and for the treated sample concentration was 2 meq 1-1 of Acid
Orange 10. It was necessary to use different concentrations of
dye in the dye-buffer reagent for the treated and untreated samples.
This ensured that the dye-binding properties were determined at
-1) similar equilibrium dye concentration (c 1.5 meq 1 so that the
amount of dye bound to the sample by secondary associations were of
the same order in each case.
For the dye binding procedure, 50 ml of dye buffer reagent
citric acid monohydrate (42.0Jg) + Acid Orange 10 dissolved in
1 litre of distilled water was added from a Daffert pipette.
The bottles were closed by leakproof polyethene screw tops. Mixture
were vigorously shaken overnight (~14-16 h). Portions of dye
equilibrium mixture were poured into a 15 ml centrifuge tube and
centrifuged at 2000 r.p.m. for 10 min. The absorbance of the
supernatant was measured with reference to water at 482 nm.
-.56 -
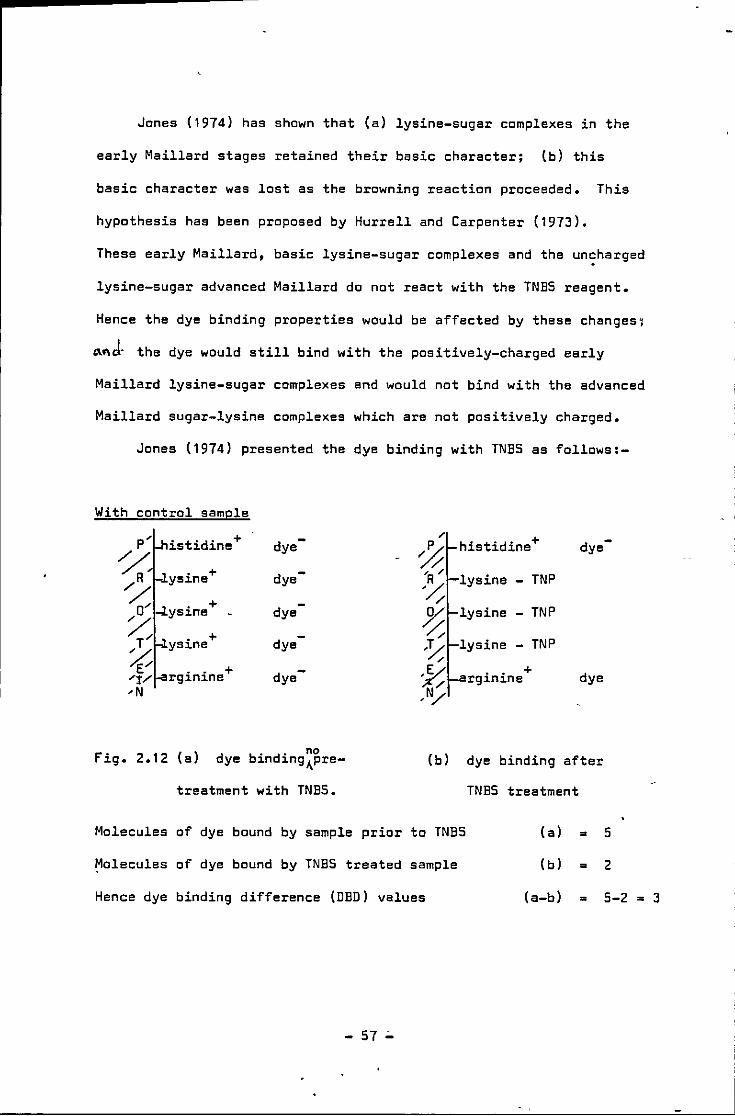
- -----------
Jones (1974) has shown that (a) lysine-sugar complexes in the
early Maillard stages retained their basic character; (b) this
basic character was lost as the browning reaction proceeded. This
hypothesis has been proposed by Hurrell and Carpenter (1973).
These early Maillard, basic lysine-sugar complexes and the un:harged
lysine-sugar advanced Maillard do not react with the TNBS reagent.
Hence the dye binding properties would be affected by these changes·;
~~J- the dye would still bind with the positively-charged early
Maillard lysine-sugar complexes and would not bind with the advanced
Maillard sugar-lysine complexes which are not positively charged.
Jones (1974) presented the dye binding with TNBS as follows:-
With control sample
istidine + dye -dye -
ysine + -dye
-dye
rginine + dye -
Fig. 2.12 (a) dye binding~~re
treatment with TNBS.
histidine + dye
TNP
TNP
- TNP
rginine + dye
(b) dye binding after
TNBS treatment
-
Molecules of dye bound by sample prior to TNBS
Molecules of dye bound by TNBS treated sample
Hence dye binding difference (DBD) values
(a) = 5
(b) = 2
(a-b) = 5-2 = J
- 57 ,;.
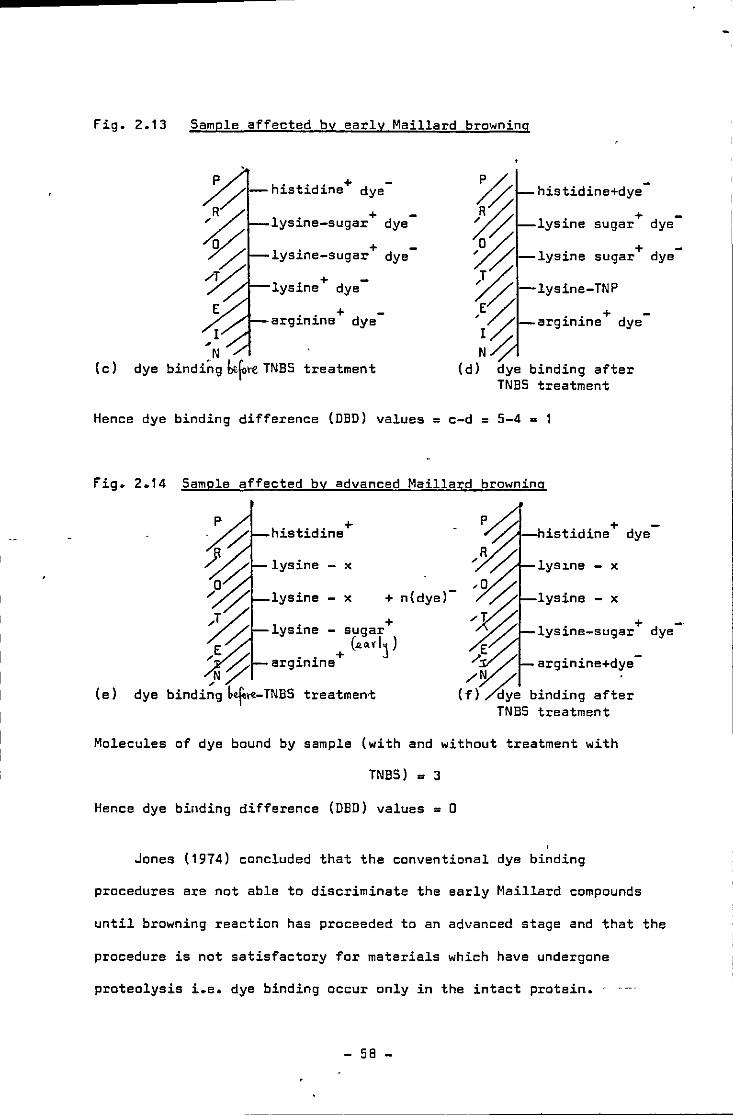
Fig. 2.13 Sample affected by early Maillard browning
histidine+ dye
1 . + -ysJ.ne-sugar dye
1 . + -ysJ.ne-sugar dye
+ -lysine dye
arginine+ dye-
I
N (cl dye binding btfore TNBS treatment
Hence dye binding difference (DBD) values = c-d = 5-4 = 1
Fig. 2.14 Sample affected by advanced Maillard browning
histidine+ dye-
lysine - x lysJ.ne - x
lysine - x + n(dye)- lysine - x
lysine 1 . + d -ysJ.ne-sugar ye
(e) dye treatmel1't
arginine+dye-
binding after TNBS treatment
Molecules of dye bound by sample (with and without treatment with
TNBS) = 3
Hence dye binding difference (DBD) values = 0
Janes (1974) concluded that the conventional dye binding
procedures are not able to discriminate the early Maillard compounds
until browning reaction has proceeded to an advanced stage and that the
procedure is not satisfactory far materials which have undergone
proteolysis i.e. dye binding occur only in the intact protein.
- 58 -
_I
2.9.3 Acylation by ethyl chloroformate
Sandler and Warren (1974) used ethyl chloroformate as the
blocking reagent. They argued that the blocking reagent should
be of small molecular size so as to avoid steric hinderance to
the reactions of the dye with other basic groups, react quantitatively
at low temperatures wi~h the f -ami~o groups, and at the same time,
do not modify the basic properties of the imidazole group of
histidine or the guan~dino group of arginine. Sandler and Warren's
method is as follows:-
i) about 120 mg of finely milled sample was moistened with
1 ml O.SM NaOH. After 15 min, the reagent dye (40 m1)
was added and mixture was stirred at 40°C at 20 min;
• cooled and hyflo super filter (120 mg) was added; and
the solution was filtered through glass wool filter paper.
An aliquot 15 m1 of filtrate was diluted with phosphate
buffer (potassium dihydrogen phosphate 3.4g, 85% phosphoric
acid (1.7 m1l, glac~al acetic acid (60 ml), propionic acid
(1 ml) and oxalic acid (2g) and the solution was made up
to 1 litre).
ii) about 120 mg of the sample was moistened with carbonate
buffer 1 m1 (carbonate buffer is Na2co
3 in 8% NaHC0
3
to give pH 8 .s.) The solution was cooled to 0° to 4°C.
and 0.5 ml ethyl chloroformate was added. The reaction
mixture was maintained at 0 to 4°C and stirred occasionally
for 20 min .• Then 20 ~ phosphate buffer + 20 ml dye
reagent (AO 12 3.71 meq/1 O.OSM phosphate buffer) and
- 59 -
•
0 mixture was allowed to react for 20 min at 40 C and
equilibrium dye concentration determined as above.
Sandler and Warren ( 1974) found good agreement between DBD
values and molar quantity of lysine by am~no acid analysis and
with lysine determined by Carpenter's method (Carpenter 1960) •
•
- 60 -
3.1 .o Determination of FDNB - available lysine in the smoked and unsmoked freeze-dried coley fillets by method of Carpenter (1960) as modified by Booth (1971)
3.1 .1 Materials: Mono- e -N-dinitrophenyl lysine hydrochloride
monohydrate (DNP-L) (S1gma London Chemical Co. Ltd.)
104 mg in 20 ml distilled water. Take 2 ml which
then contained the equivalent of 10.2 mg or 30~mol DNP-L
FDNB solution: disposable polythene gloves were used
as 1-fluoro-2,4-dinitro benzene (FDNB) is a vesicant
and carcinogenic compound. Approximately 0.3 ml of FDNB
in 12 ml ethanol, hence FDNB is in considerable excess
and exact measurement of the FDNB solution is not essential.
Enough fresh FDNB solution was made in a conical flask
for all the samples to be determined for that day. If
the FDNB was solid, it was melted by standing the bottle
in a beaker of hot water.
Methoxy carbonyl chloride (methyl chloroformate, MCC
manufactured by Aldrich Chemicals Co. Gillingham, Dorset.)
The bulk was kept in the refrigerator and a small amount
kept in a service sample bottle. It does not need to be
accurately measured. About 5 drops from a pasteur or
dropping pipette. It is handled carefully under the fume
hood as it is lachrymatoos.
NaHC03
- Na2co
3 buffer solution: 19.5g NaHC0
3 + 1g Na
2co
3 in
250 ml distilled water and pH adjusted to pH 8.5 and stored
in a well stoppered bottle.
NaHC03
solution of BOg in 1 litre distilled water. Phenol
phthalein solution 400mg/l of 60% ethanol. NaOH solution
( 120g/l) for raising the pH- of .the ether extracted filtrate
to pH 8.5 for the MCC reaction.
- 61 -
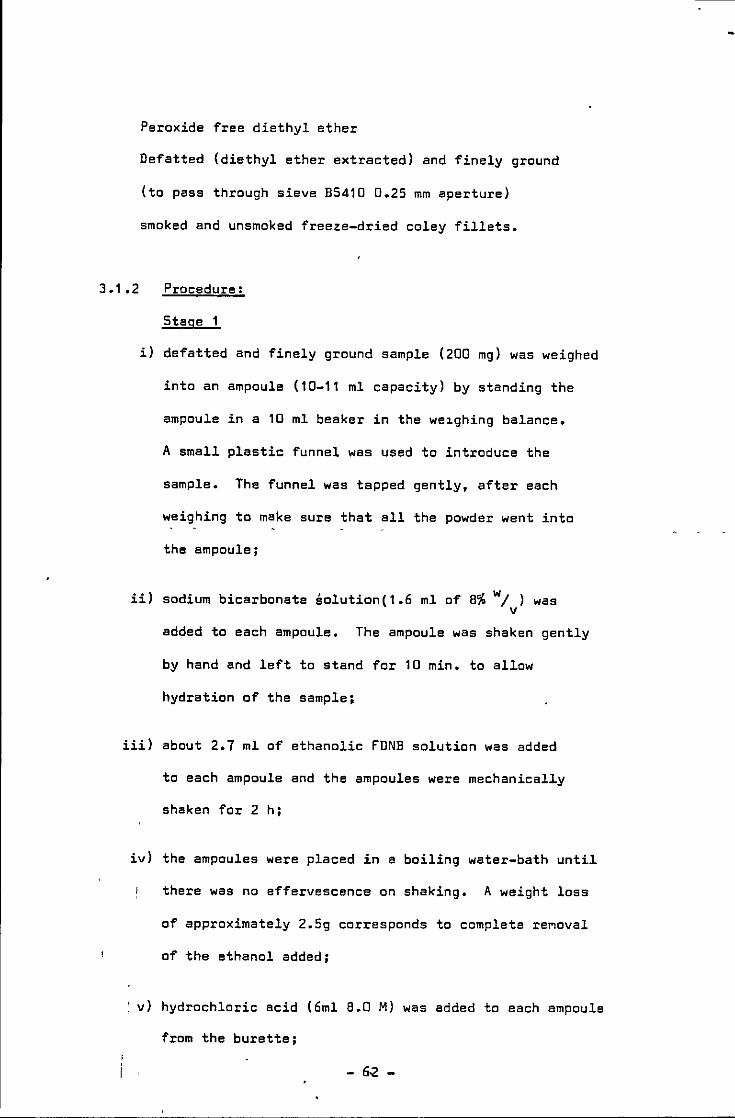
Peroxide free diethyl ether
Defatted (diethyl ether extracted) and finely ground
(to pass through sieve BS410 0.25 mm aperture)
smoked and unsmoked freeze-dried coley fillets.
3.1 .2 Procedure:
Stage 1
i) defatted and finely ground sample (200 mg) was weighed
into an ampoule (10-11 ml capacity) by standing the
ampoule in a 10 ml beaker in the we~ghing balance.
A small plastic funnel was used to introduce the
sample. The funnel was tapped gently, after each
weighing to make sure that all the powder went into
the ampoule;
ii) sodium bicarbonate solution(1.6 ml of B% w/ ) was V
added to each ampoule. The ampoule was shaken gently
by hand and left to stand for 10 min. to allow
hydration of the sample;
iii) about 2.7 ml of ethanolic FDNB solution was added
to each ampoule and the ampoules were mechanically
shaken for 2 h;
iv) the ampoules were placed in a boiling water-bath until
there was no effervescence on shaking. A weight loss
of approximately 2.5g corresponds to complete renoval
of the ethanol added;
' v) hydrochloric acid (6ml 8.0 M) was added to each ampoule
from the burette;
-6.2-
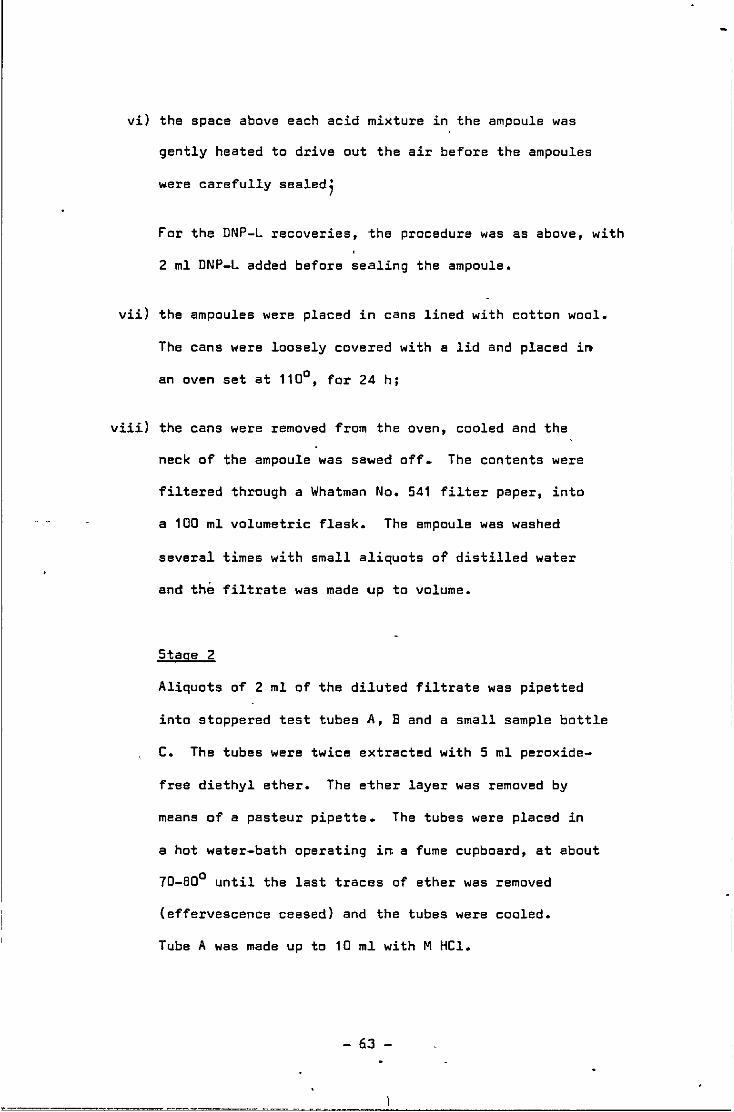
vi) the space above each acid mixture in the ampoule was
gently heated to drive out the air before the ampoules
were carefully sealed;
For the DNP-L recoveries, the procedure was as above, with
2 ml DNP-L added before sealing the ampoule.
vii) the ampoules were placed in cans lined with cotton wool.
The cans were loosely covered with a lid and placed i~
an oven set at 110°, for 24 h;
viii) the cans were removed from the oven, cooled and the
neck of the ampoule was sawed off. The contents were
filtered through a Whatman No. 541 filter paper, into
a 100 ml volumetric flask. The empoule was washed
several times with small aliquots of distilled water
and the filtrate was made up to volume.
Stage 2
Aliquots of 2 ml of the diluted filtrate was pipetted
into stoppered test tubes A, B and a small sample bottle
C. The tubes were twice extracted with 5 ml peroxide
free diethyl ether. The ether layer was removed by
means of a pasteur pipette. The tubes were placed in
a hot water-bath operating i~ a fume cupboard, at about
70-80° until the last traces of ether was removed
(effervescence ceased) and the tubes were cooled.
Tube A was made up to 10 ml with M HCl.
63 -
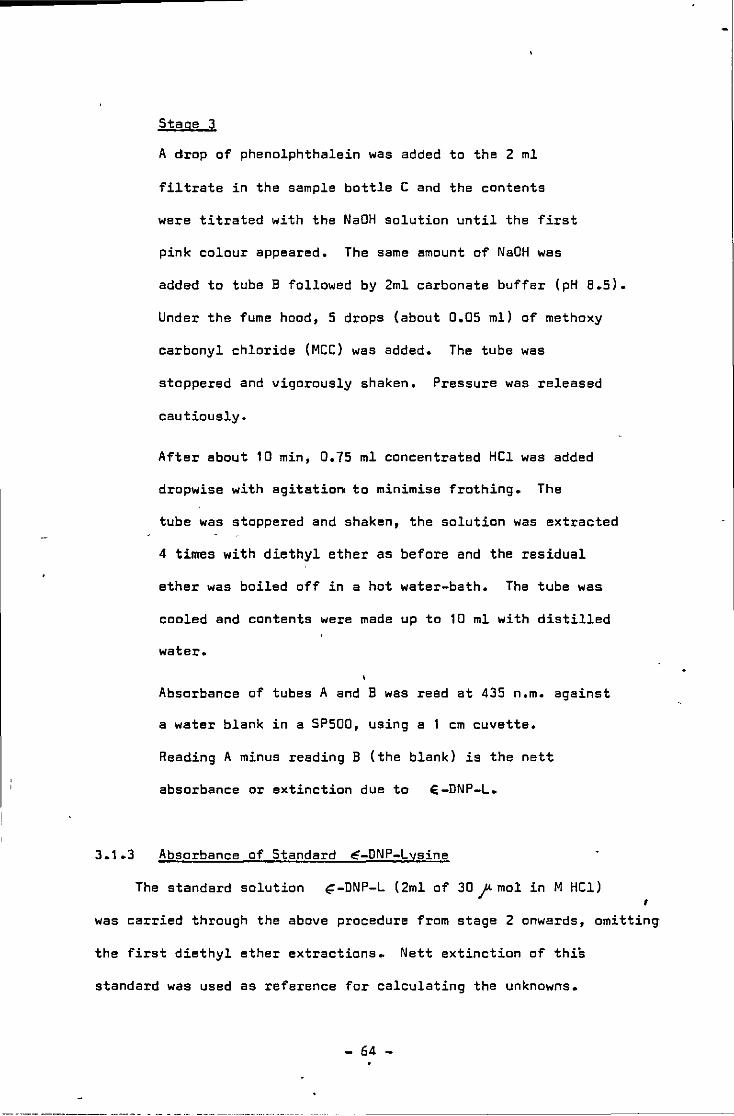
3.1 .3
Stage 3
A drop of phenolphthalein was added to the 2 ml
filtrate in the sample bottle C and the contents
were titrated with the NaOH solution until the first
pink colour appeared. The same amount of NaOH was
added to tube B followed by 2ml carbonate buffer (pH 8.5).
Under the fume hood, 5 drops (about 0.05 mll of methoxy
carbonyl chloride (MCC) was added. The tube was
stoppered and vigorously shaken. Pressure was released
cautiously.
After about 10 min, 0.75 ml concentrated HCl was added
dropwise with agitation to minimise frothing. The
tube was stoppered and shaken, the solution was extracted
4 times with diethyl ether as before and the residual
ether was boiled off in a hot water-bath. The tube was
cooled and contents were made up to 10 ml with distilled
water.
Absorbance of tubes A and B was read at 435 n.m. against
a water blank in a SPSOO, using a 1 cm cuvette.
Reading A minus reading B (the blank) is the nett
absorbance or extinction due to E-DNP-L.
Absorbance of Standard ~-DNP-Lysine
The standard solution ~-DNP-L (2ml of 30 )'-mol in M HCl) I
was carried through the above procedure from stage 2 onwards, omitting
the first diethyl ether extractions. Nett extinction of this
standard was used as reference for calculating the unknowns.
64 -
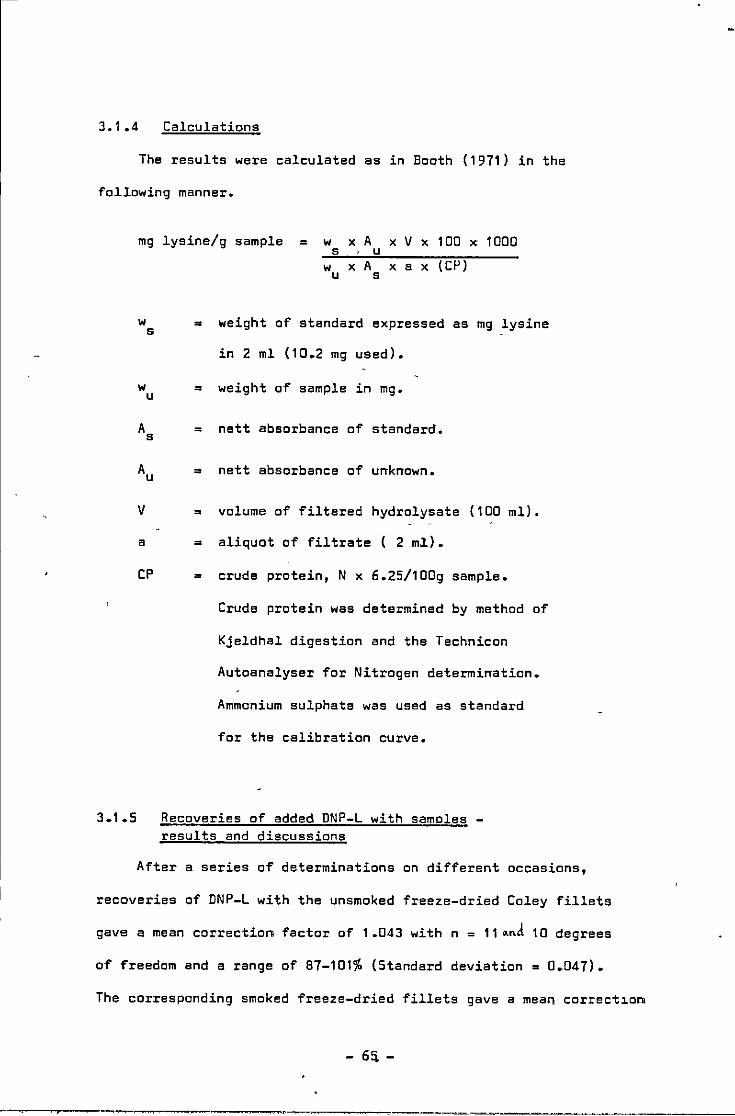
3.1 .4 Calculations
The results were calculated as in Booth (1971) in the
following manner.
3.1 .s
mg lysine/g sample = W X A X V X 100 X 1000 s . u
w X A X a X (CP) u s
w = weight of standard expressed as mg lysine s
in 2 ml (10.2 mg used).
w = weight of sample in mg. u
A = nett absorbance of standard. s
Au = nett absorbance of unknown.
V = volume of filtered hydrolysate (100 m!).
a = aliquot of filtrate ( 2 m~).
CP = crude protein, N x 6.25/100g sample.
Crude protein was determined by method of
Kjeldhal digestion and the Technicon
Autoanalyser for Nitrogen determination.
Ammonium sulphate was used as standard
for the calibration curve.
Recoveries of added DNP-L with samples -results and discussions
After a series of determinations on different occasions,
recoveries of DNP-L with the unsmoked freeze-dried Coley fillets
gave a mean correction factor of 1.043 with n = 11 ~nd 10 degrees
of freedom and a range of 87-101% (Standard deviation= 0.047).
The corresponding smoked freeze-dried fillets gave a mean correct1o~
- 6!i -
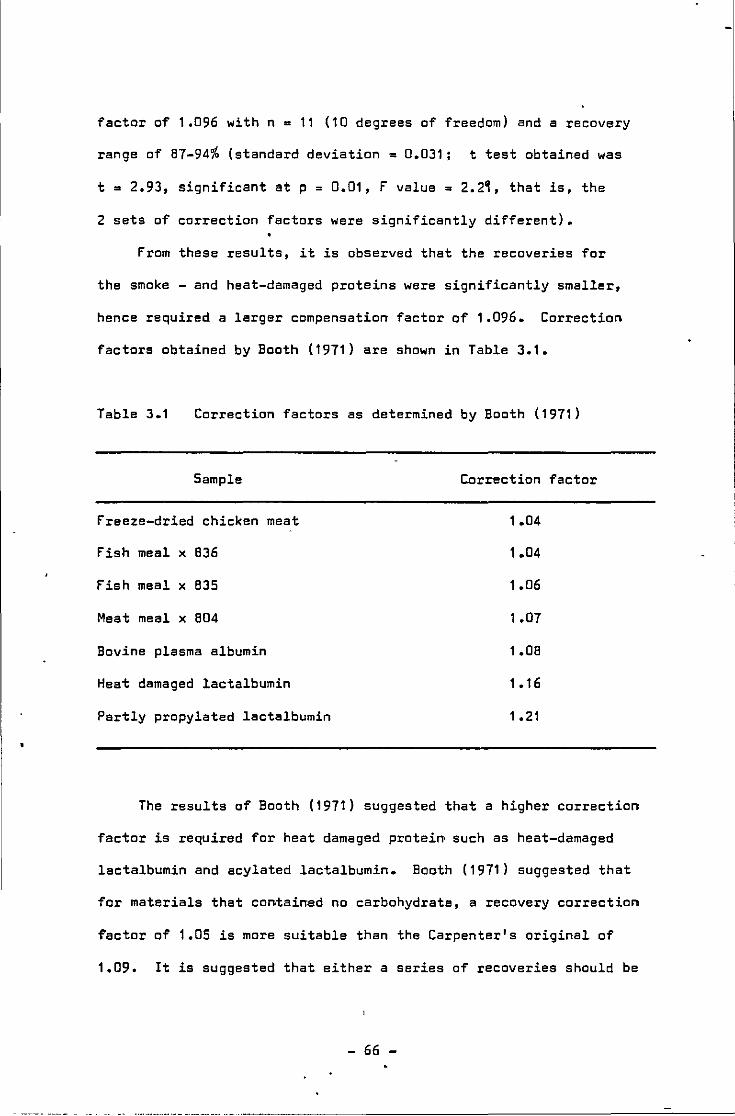
factor of 1.096 with n = 11 (10 degrees of freedom) and a recovery
range of 87-94% (standard deviation= 0.031; t test obtained was
t = 2.93, significant at p = 0.01, F value= 2.2,, that is, the
2 sets of correction factors were significantly different).
From these results, it is observed that the recoveries for
the smoke - and heat-damaged proteins were significantly smaller,
hence required a larger compensation factor of 1.096. Correction
factors obtained by Booth (1971) are shown in Table 3.1.
Table 3.1 Correction factors as determined by Booth (1971)
Sample
Freeze-dried chicken meat
Fish meal x 836
Fish meal x 835
Meat meal x 804
Bovine plasma albumin
Heat damaged lactalbumin
Partly propylated lactalbumin
Correction factor
1.04
1 .04
1.06
1.07
1.08
1 .16
1 .21
The results of Booth (1971) suggested that a higher correction
factor is required for heat damaged protein• such as heat-damaged
lactalbumin and acylated lactalbumin. Booth (1971) suggested that
for materials that contained no carbohydrate, a recovery correction
factor of 1.05 is more suitable than the Carpenter's original of
1.09. It is suggested that either a series of recoveries should be
- 66
carried out along with the sample determinations and the mean of
the recoveries should be used for the actual correction factor
(as in this experiment) or individual correction factor could be
used to compensate for the recovery of added DNP-L in that batch
of samples.
As heat-damaged proteins seemed to yield smaller DNP-L
recoveries, it is only appropriate to use a mean correction factor
of 1.043 for the unsmoked and a correction factor of 1.096 for
the smoke- and heat-damaged fillets. The smaller recoveries for
the smoked fillets suggest that "Maillard" type compounds and
residual smoke components in the smoked samples react with the
added DNP-L (and with the DNP-L formed by FDNB and inherent lysine)
resu:Ltirrg in, a larger loss of DNP-L than from the unsmoked samples.
There is no previous report on such interactions. The results of
1, 3 and 5 h smoked and the control unsmoked fiLlets are shown
along with the DBD values in Tables 4.8 and 4.10. The conclusion
here is that the recovery of DNP-L is influenced by the reaction'
conditions and the recovery factor_must be modified accordingly.
- 67 -
________________ , ________________ " - - -
3.2.0 Investigation into the effects of smoke components on DNP-L during the acid hydrolysis
Equimolar amounts of smoke component (see Table 3.2 and
DNP-L were hydrolysed together in a sealed ampoule with 8 M
HCl in order to assess the effects of res~dual smoke component or
smoke-component-protein complex on the DNP-L recovery.
3.2.1 Materials: 10-11 ml ampoule; DNP L (2ml = 10.2 mg =
30 ~moll; vanillin; vanillic acid, etc., BM HCl, smoke
deposited from the Terry mini-kiln door.
3.2.2 Procedure:
il equimolar quantities of e-DNP-lysine (2 ml) and a
smoke component was weighed into an ampoule. 5 ml
BM HCl was added;
. ii) smoke deposit (10 mg) was weighed into an ampoule
and 2 ml DNP-L + 5 ml B.OM HCl were added;
iiil the tubes were sealed and placed in the cottonwool-
lined cans in the oven at 110°C for 24 h;
iv) the tubes were cooled and the neck of the ampoule was
sawn off;
v) the contents of each ampoule was filtered through
a Whatman No. 541 filter paper into a 100 ml flask.
The filter paper and residues were washed several
times with distilled water and filtrate was made up
to the 100 ml mark with distilled water;
vi) the filtrate (2mll was used to determine the absorbance
of the recovered DNP-L as in the procedure in
section 3.1.2 on the SPSOO at 435 n.m. us~ng a 1 cm cuvette;
- 68 ~
vii) the control was DNP-L + 5 ml BM HCl placed in
an ampoule, sealed and placed in the oven, together
with the other ampoules, At the end of the acid
digestion time, the ampoule was opened and contents
diluted to 100 ml with distilled water using a 100 ml
volumetric flask. 2 ml of this filtrate was carried
through the procedure as with the other samples and
the mean duplicate absorbance reading for the DNP-L
control was determined.
The % loss in extinction of DNP-L with the smoke component
was calculated from the extinction of the control DNP-L carried
through the procedure.
3.2.3 Results and discussions
The results presented in table 3.2 showed that smoke deposit
from the smoking kiln and a range of smoke components reduced
DNP-L recovery. From the few data available, it is not possible to
suggest a mechanism for DNP-L destruction, but these results justify
the use of different recovery factors for smoked and unsmoked fish
samples.
- 69 -
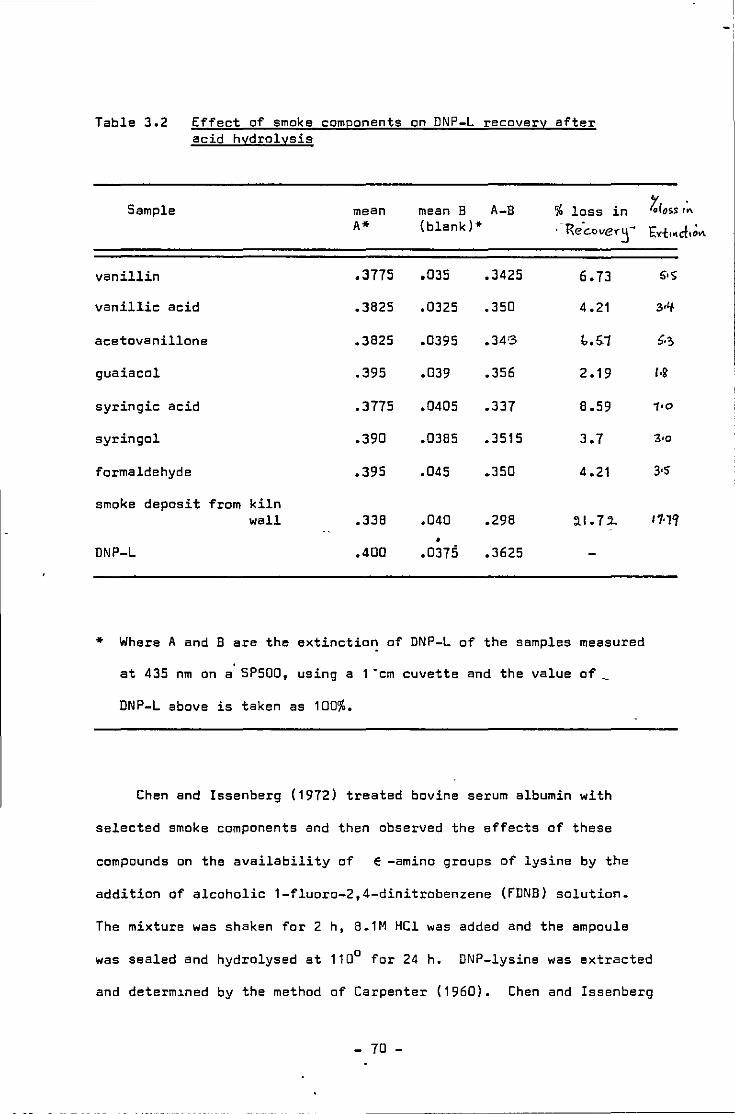
Table 3.2 Effect of smoke components on DNP-L recovery after acid hydrolysis
Sample mean mean B A-B % loss in A* (blank)* ~e-c.ove·~r
vanillin .3775 .035 .3425 6. 73
vanillic acid .3825 .0325 .350 4.21
acetovanillone .3825 .0395 .34-3 (,.5.1
guaiacol .395 .039 .356 2.19
syringic acid .3775 .0405 .337 8.59
syringol .390 .0385 .3515 3.7
formaldehyde .395 .045 .350 4.21
smoke deposit from kiln wall .338 .040 .298 :l.l • 7 .2.
• DNP-L .400 • 0375 .3625
* Where A and B are the extinctio~ of DNP-L of the samples measured
at 435 nm on a 5P500, using a 1 "cm cuvette and the value of
DNP-L above is taken as 100%.
Chen and Issenberg (1972) treated bovine serum albumin with
selected smoke components and then observed the effects of these
compounds on the availability of E -amino groups of lysine by the
addition of alcoholic 1-fluoro-2,4-dinitrobenzene (fDNB) solution.
The mixture was shaken for 2 h, 8.1M HCl was added and the ampoule
Zloss .~ E::.i .. d·~"
5•S
3•'f
··~ I·~
1•0
3•0
3•5"
11·l'l
was sealed and hydrolysed at 110° for 24 h. DNP-lysine was extracted
and determ~ned by the method of Carpenter (1960). Chen and Issenberg
- 70 -
(1972) found that of the components tested, formaldehyde exhibited
the maximum reaction rate J.n reducJ.ng the number of !'<-amino groups
available for reaction wJ.th FDNB, while coniferaldehyde and
sinapaldehyde reacted inJ.tJ.ally at a slow rate and appeared to stop
at the end of 24 h. They obtained in decreasJ.ng order of reaction,
formaldehyde, glyoxal, pyruvaldehyde, furfural, sinapaldehyde,
coniferaldehyde and furfuryl alcohol, while phenol, cyclotene,
eugenol and syringe! were the least reactive. The results in
table 3.2 also show syringe! and guaiacol to be less effective in
destroying DNP-lysine.
•
- 71 -
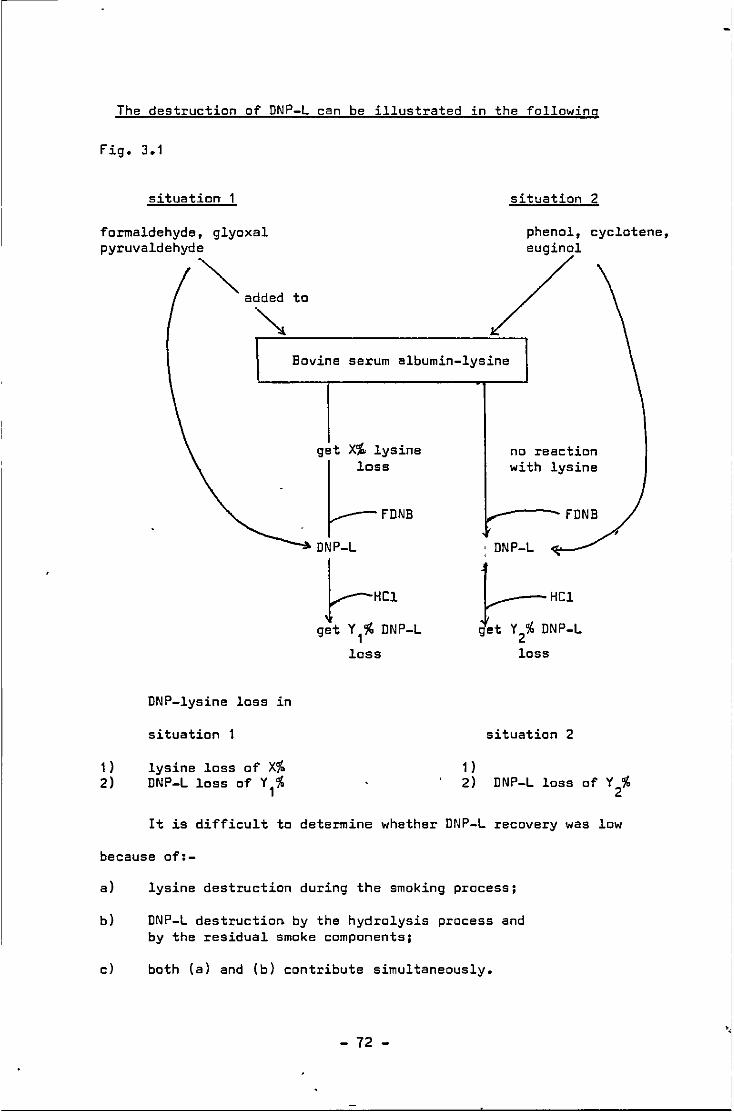
The destruction of DNP-L can be illustrated in the following
Fig. 3.1
situation 1 situation 2
formaldehyde, glyoxal phenol, cyclatene,
pyruvaldehyd~adr~-e-d~t-a-----------------------=~~-,euginal
1) 2)
DNP-lysine lass in
situation 1
lysine lass of X% DNP-L loss of Y
1%
Bovine serum albumin-lysine
get XS. lysine no reaction
~-with lysine
FDNB FDNB , DNP-L : DNP-L
}--HCl get Y
1 '](, DNP-L
~HCl get Y /• DNP-L
lass lass
situation 2
1 ) 2) DNP-L loss of Y
2%
It is difficult to determine whether DNP-L recovery was low
because of:-
a) lysine destruction during the smoking process;
b) DNP-L destruction by the hydrolysis process and by the residual smoke components;
cl bath (a) and (b) contribute simultaneously.
- 72 -
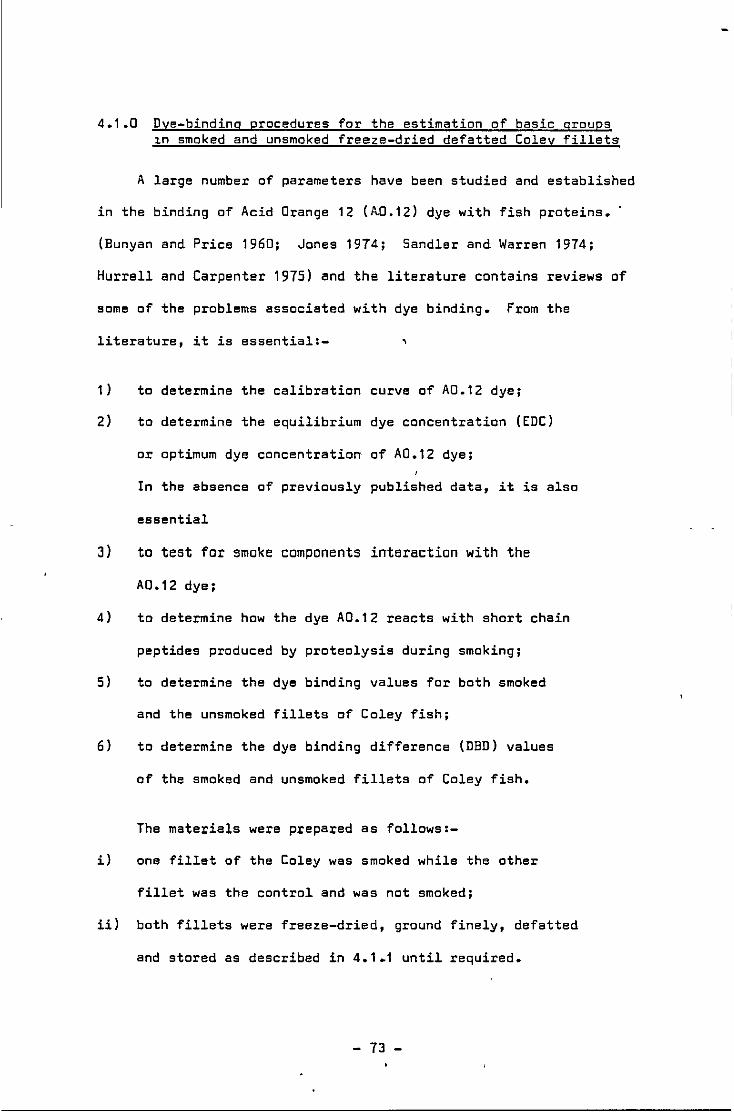
4.1.0 Dye-binding procedures for the estimation of basic groups 1n smoked and unsmoked freeze-dried defatted Coley fillets
A large number of parameters have been studied and established
in the binding of Acid Orange 12 (AD.12) dye with fish proteins.
(Bunyan and Price 1960; Jones 1974; Sandler and Warren 1974;
Hurrell and Carpenter 1975) and the literature contains reviews of
some of the problems associated with dye binding. From the
literature, it is essential:-
to determine the calibration curve of AD. 12 dye; 1 )
2) to determine the equilibrium dye concentration (EDC)
or optimum dye concentration of A0.12 dye;
In the absence of previously published data, it is also
essential
J) to test for smoke components interaction with the
A0.12 dye;
4) to determine how the dye A0.12 reacts with short chain
peptides produced by proteolysis during smoking;
5) to determine the dye binding values for both smoked
and the unsmoked fillets of Coley fish;
6) to determine the dye binding difference (DBD) values
of the smoked and unsmoked fillets of Coley fish,
The materials were prepared as follows:-
i) one fillet of the Coley was smoked while the other
fillet was the control and was not smoked;
iil both fillets were freeze-dried, ground finely, defatted
and stored as described in 4.1.1 until required.
- 73 -
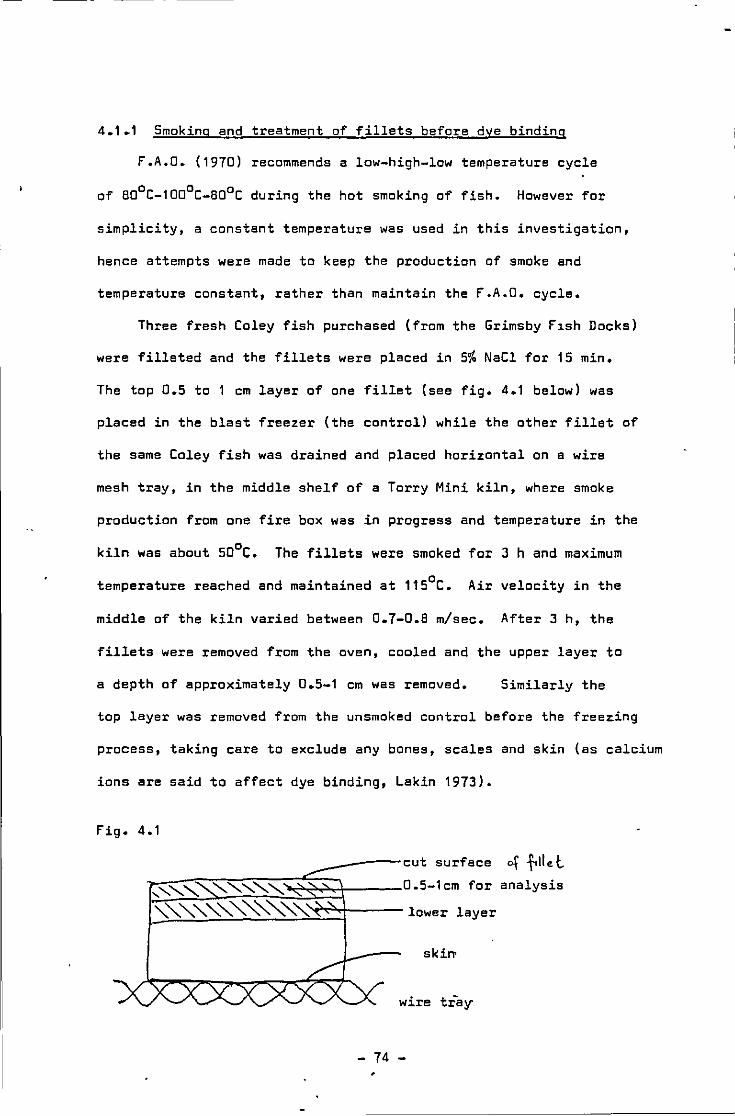
4.1.1 Smoking and treatment of fillets before dye binding
F.A.O. (1970) recommends a low-high-low temperature cycle
of B0°C-100°C-B0°C during the hot smoking of fish. However for
simplicity, a constant temperature was used in this investigation,
hence attempts were made to keep the production of smoke and
temperature constant, rather than maintain the F.A.O. cycle.
Three fresh Coley fish purchased (from the Grimsby F1sh Docks)
were filleted and the fillets were placed in 5% NaCl for 15 min.
The top 0.5 to 1 cm layer of one fillet (see fig. 4.1 below) was
placed in the blast freezer (the control) while the other fillet of
the same Coley fish was drained and placed horizontal on a wire
mesh tray, in the middle shelf of a Terry Mini kiln, where smoke
production from one fire box was in progress and temperature in the
kiln was about 50°C. The fillets were smoked for 3 h and maximum
temperature reached and maintained at 115°C. Air velocity in the
middle of the kiln varied between 0.7-0.B m/sec. After 3 h, the
fillets were removed from the oven, cooled and the upper layer to
a depth of approximately 0.5-1 cm was removed. Similarly the
top layer was removed from the unsmoked control before the freezing
process, taking care to exclude any bones, scales and skin (as calcium
ions are said to affect dye binding, Lakin 1973).
Fig. 4.1
ski"'
wire tray
- 74 '
The tap layers of bath unsmaked and smoked fillets were frozen
before freeze drying and the freeze-dried products were ground
in a hammer mill using a fine mesh. Samples were passed through a
sieve of 0.25 ~m aperture BS410, patent No. 667924 Serial No. 209918.
Bath finely divided samples of smoked and control fillets were
saxhlet extracted with 100 ml diethylether for 8 hours. The
extracted samples were stored in vacuum sealed high density
palyethene bags at 4°C until required.
4 .1.2
4.1.3
1 )
Determination of calibration curve of AD.12 dye
Procedure
Dye concentration of 1.42 meq AD.12 (A/SN Foss Electric,
Hiller~d, Denmark) in 1 litre D.2M citric acid (D.5g
acid orange 1Z + 43.02g ~itrie acid monohydrate (AR)
in 1 litre distilled H2
Dl pH measured was 1.25;
ii) dilution of this dye solution was made to obtain a range
of concentrations of dye from 0.01 mg/ml to 0.034 mg/ml.
Using a cuvette of 1 cm path length, the optical density
was measured at 482 nm wavelength an a SP500 sphectra
phatameter.
It was thought wise to use the very law dye concentration
range, as at the high dye concentration, De Beer's Law
is not obeyed.
- 75 -
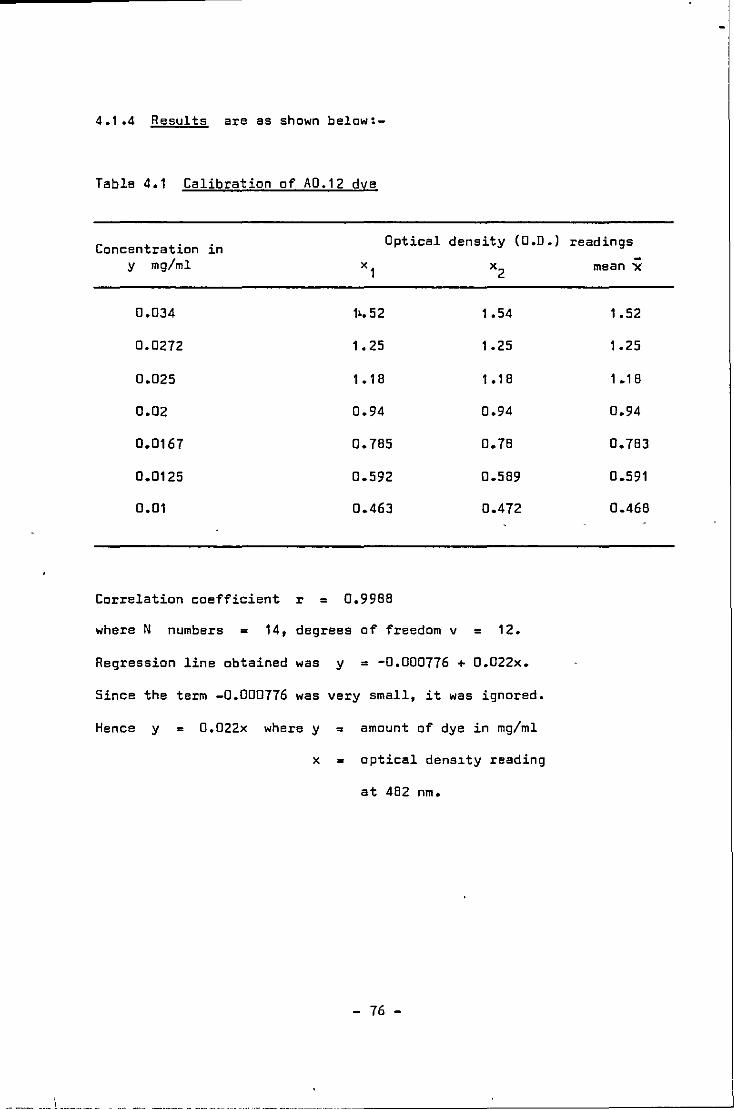
4.1 .4 Results are as shown below:-
Table 4,1 Calibration of AD.12 dye
Concentration in Optical density ( 0 .o.) readings
y mg/ml x1 x2 mean "X
0.034 1•. 52 1.54 1.52
0.0272 1. 25 1.25 1.25
0.025 1 • 1 8 1 .1 8 1 .18
o.oz 0.94 0.94 0.94
0.0167 0.785 0.78 0.783
0.0125 0.592 0.589 0.591
0.01 0.463 0.472 0.468
Correlation coefficient r = 0.9988
where N numbers = 14, degrees of freedom v = 12.
Regression line obtained was y = -0.000776 + D.022x.
Since the term -0.000776 was very small, it was ignored.
Hence y = 0.022x where y = amount of dye in mg/ml
x = optical dens1ty reading
at 482 nm.
- 76 -
4.2.0 Investigation into the Adsorption Isotherms of skimmed milk powder
Since extensive studies have been made about the dye binding
of milk with acid azo dyes (Udy 1956; Ashworth 1961; Ashworth
and Chandry 1962; Dolby 1961) and milk isotherms with ac1d azo
dye are well established, hence it was thought appropriate
initially to investigate the A0.12 with skimmed milk powder.
4.2.1 Experimental Materials
Skimmed milk powder (Marvel Brand); 100 ml polythene
centrifuge tubes with fitted caps glass beads 0.5 m~ diameter;
glass microfibre paper Whatman GF/A (as recommended by Sandler, 1972),
acid orange 12 dye (A0.12), 0.2M citric acid(42.04g in 1 litre
distilled water).
4.2.2 Procedure
i) skimmed milk powder (0.15g c 59 mg protein)was
weighed accurately into a 100 ml polythene
centrifuge tube;
ii) glass beads (3 to 4) were added to each centrifuge
tube;
iii) A0.12 dye (40 ml) of increasing concentrations
(1.14 meq to 3.14 meq/litre 0.2M citric acid) was
added. The determinations were carried out in
duplicates;
ivl the centrifuge tubes were stoppered and the dye-
sample mixtures were mechanically shaken for 1 h;
v) the mixtures were centrifuged at 2500 r.p.m. for
- 77 -
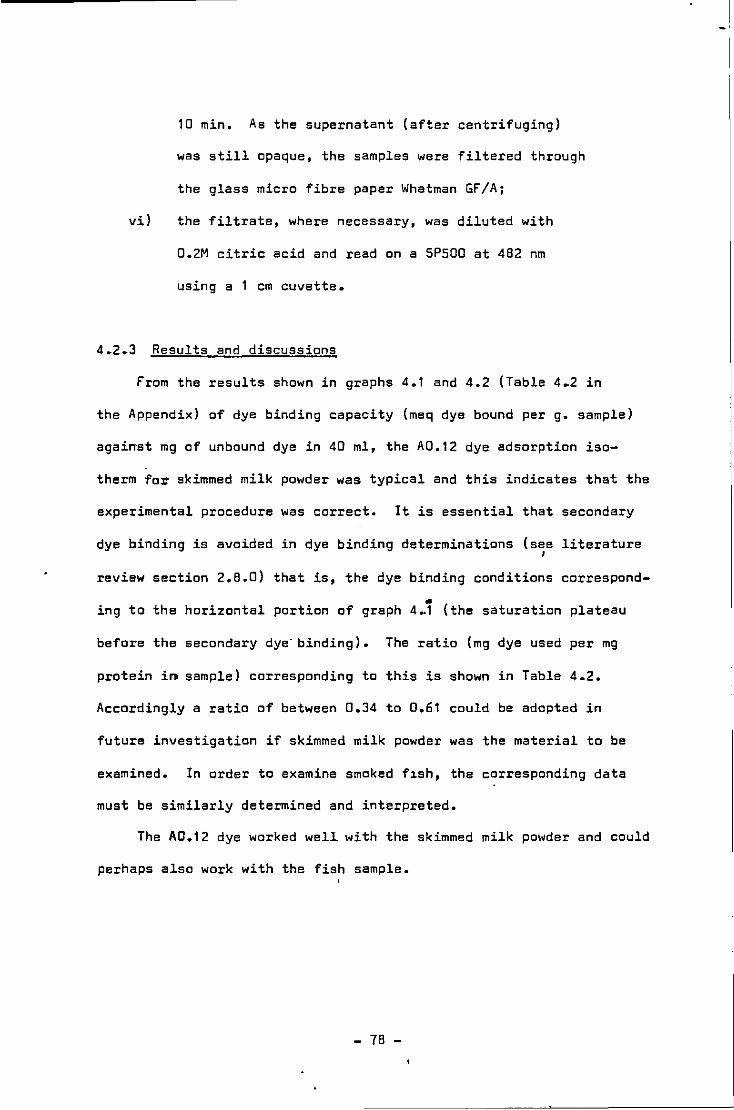
10 min. As the supernatant (after centrifuging)
was still opaque, the samples were filtered through
the glass micro fibre paper Whatman Gf/A;
vi) the filtrate, where necessary, was diluted with
0,2M citric acid and read on a SPSOO at 482 nm
using a 1 cm cuvette.
4.2.3 Results and discussions
from the results shown in graphs 4.1 and 4.2 (Table 4.2 in
the Appendix) of dye binding capacity (meq dye bound per g. sample)
against mg of unbound dye in 40 ml, the A0.12 dye adsorption iso-
therm for skimmed milk powder was typical and this indicates that the
experimental procedure was correct. It is essential that secondary
dye binding is avoided in dye binding determinations (see literature I
review section 2,8,0) that is, the dye binding conditions correspond
ing to the horizontal portion of graph 4~l (the saturation plateau
before the secondary dye~ binding). The ratio (mg dye used per mg
protein in sample) corresponding to this is shown in Table 4.2.
Accordingly a ratio of between 0,34 to 0,61 could be adopted in
future investigation if skimmed milk powder was the material to be
examined. In order to examine smoked f1sh, the corresponding data
must be similarly determined and interpreted.
The A0.12 dye worked well with the skimmed milk powder and could
perhaps also work with the fish sample.
- 78 -
I _,
I
I
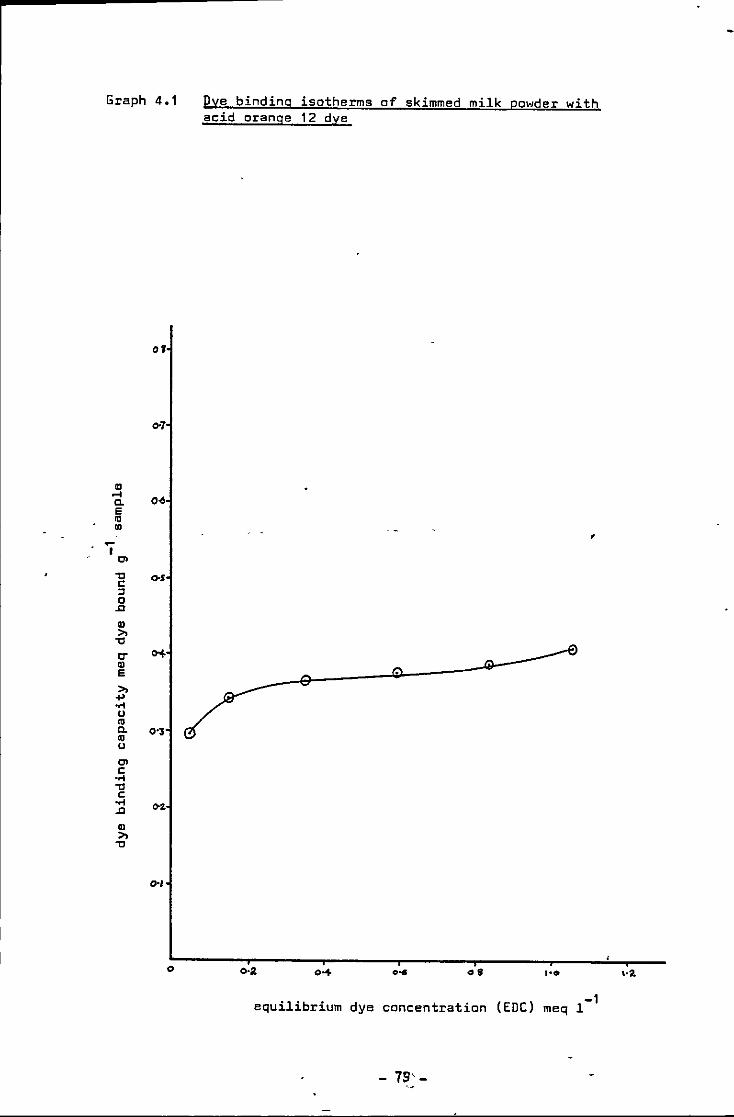
Graph 4.1
of
" .... 0.0 c.
s "' "' ~
I
"' "tl o-s c " 0 .&l
" ,., "tl
C" <>+ Q)
s ,., .... .... u
"' c. 0•3
"' u
"' c .... "tl c ....
.,.~ .&l
" ,., "tl
O•l
0
Dye binding isotherms of skimmed milk po•1der with acid orange 12 dye
'
0·2 ••• os
-1 equilibrium dye concentration (EDC) meq 1
79'-
\•2.
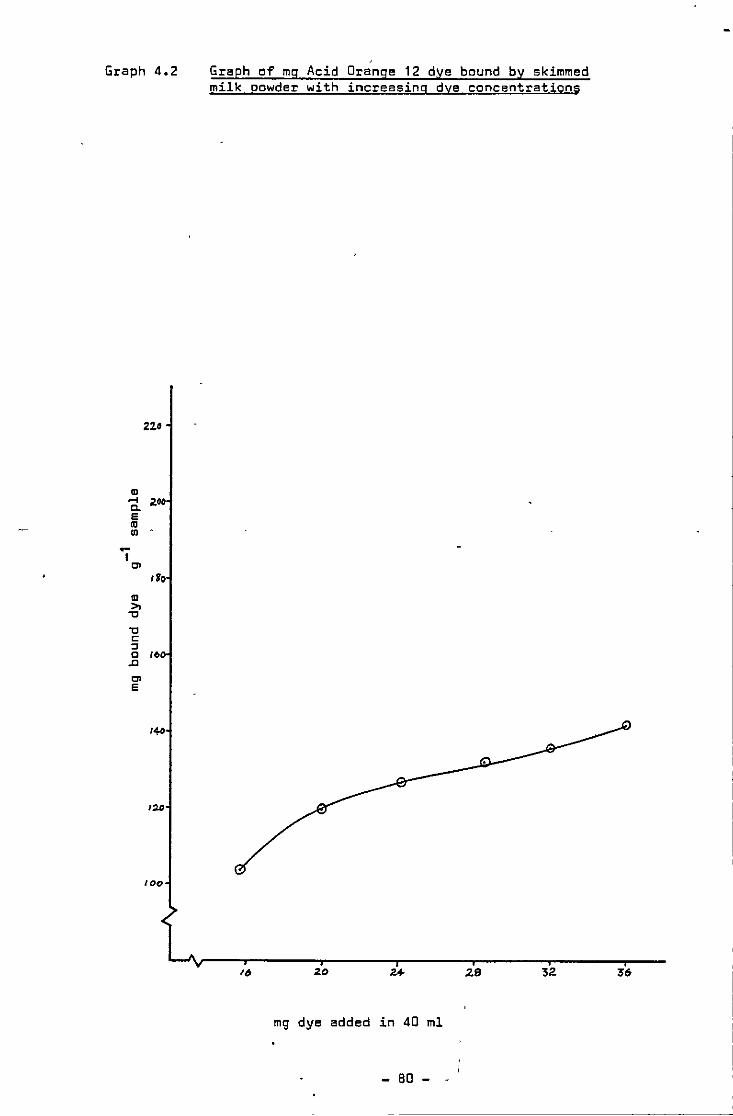
Graph 4.2
22.0
m ..... 2.00 c. e "' Ul
-I Cl ,,. m » -o -o c :I 0 10 .c Cl e
14<>
t:lD
lOO
Graph of mg Acid Orange 12 dye bound by skimmed milk powder with increasing dye concentrations
16 20 2.9 32
mg dye added in 40 ml
- 80 -
36
4.3.0 Investigation of dye adsorption isotherms with smoked and unsmoked defatted fish samples
The same dye concentrations and procedure could be used to
access the dye binding properties of unsmoked and smoked Coley
fillets.
4.3.1 Experimental materials
As previously described in 4.2.1 except for skimmed milk
powder. Finely divided, diethyl ether extracted smoked and
control fillets as prepared in section 4.1.1 (the upper layers of
3 smoked fillets were mixed in a polythene bag to give a homogenous
mixture. The unsmoked layers were similarly treated, to provide a
larger amount of homogenous materLal for the initial investigations).
4.3.2 Experimental procedure
i) unsmoked and smoked samples (0.1Sg c. 140 mg protein)
were weighed into 100 ml centrifuge tubes;
ii) glass beads (3 to 4) 0.5 m~ diameter were placed in
each centrifuge tube;
iii) A0.12 dye (40 ml) of increasing strength (0.86 meq/1 to
3.42 /1 in 1 litre 0.2M citric acid) was added. The
determinations were carried out in duplicates;
iv) the tubes were tightly stoppered with plastic caps
and mechanically shaken for 1 hour;
v) the tubes were then centrifuged at 2500 r.p.m. for
10 min;
vi) the supernatant was pipetted off using a dropping
pipette and 1 ml diluted where necessary. The
absorbance was read against 0.2M citr1c ac1d on a
SPSOO sphectrometer at 482 nm using a 1 cm cuvette.
- 81

4.3.3 Results and discussion
The dye binding isotherms far unsmoked and smoked samples are
shown in Table 4.3 in the Appendix. The curves of dye binding
capacity (DBC,meq dye bound per g sample) with equil~brium dye
concentration are similar to the' dye binding isotherms of skimmed
milk powder. (Graphs 4.1 and 4.2). The milliequivalents of dye
bound per unit weight of sample (DBC) increased with increasing dye
concentrations. However, the DBC of the smoked samples were higher
at the lower dye concentration of the isotherm than the DBC of the
unsmoked samples. This suggested that the smoked and heat-processed
proteins contained more basic amino acids than the unsmoked controls.
It is reasonable to expect hot smoking to reduce the number of basic
groups and thus the DBC of the smoked fillets, compared to the
unsmaked controls.
Assuming that at these low dye concentrations, there was no
dye-dye or other secondary binding mechanisms operating, possible
explanations for the anomalous results include:-
i) effect of the 5% NaCl solution used for bath the
smoked and unsmaked fillets before the smoking and
freeze-drying process;
ii) reactions of residual smoke basic phenolic components
with the dye anions;
iii) proteolysis during the smoking process, resulting in
short chain peptides and N-terminal groups which could
bind with the AD.12 dye.
- 62 -
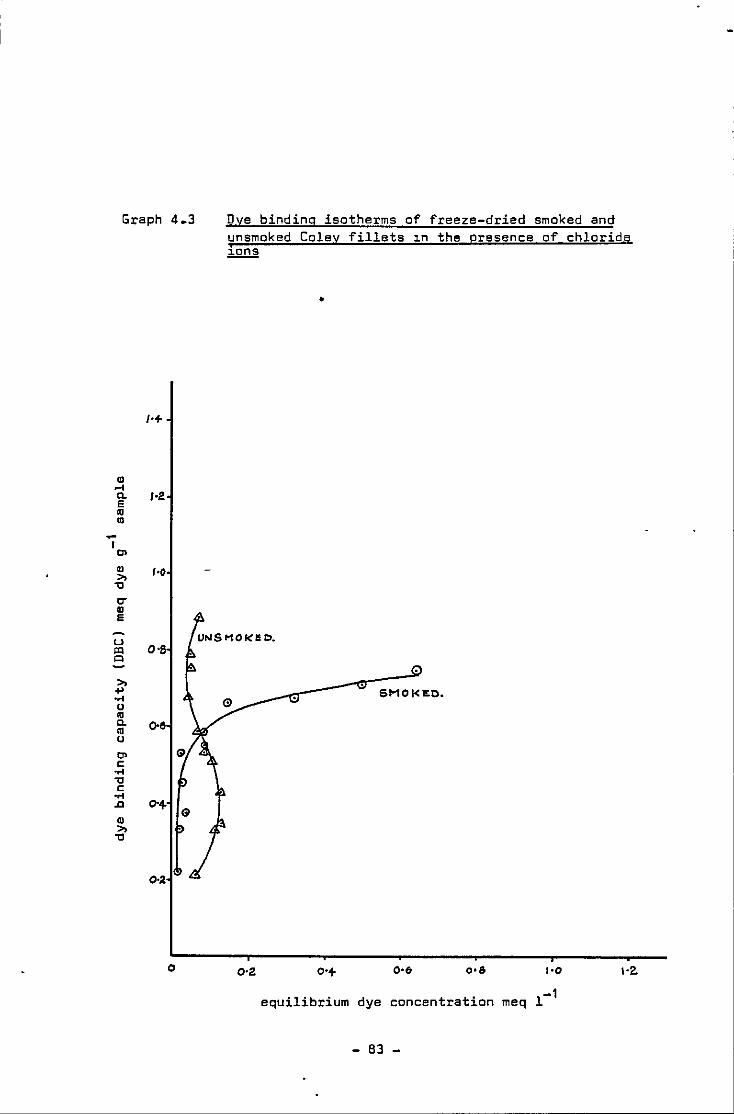
Graph 4.3
Ql .... Cl. 1•2 E 111 Ul -I C>
Ql 1•0 ,., ., C" Ql E
u 0· "' "" ,., ... ...
u 111 Cl. o-e 111 u C> c: ... ., c: ... .a Ql ,., .,
0·2
0
Dve binding isotherms of freeze-dried smoked and unsmoked Coley fillets 1n the presence of chloride ions
•
SMOI<ED •
0·2 O·+ 0•6
equilibrium dye concentration meq 1-1
- 83 -

Graph 4.4
300
" .... 2SQ c. e m
" -I Cl
"tl
"' " 0 2oo
.a
" "' "C
N
Q) ISO Cl
"' m ... 0
"tl .... u m Cl loo e
So
6o
0
-1 . Mg dye bound g sample of freeze-dr~ed smoked and unsmoked Coley fillets with increasing dye concentration in the presence of chloride ions
UN61'10KEJ).
SMOKED.
10 30 so eo
mg acid orange 12 dye in 40 ml
- 84-

4.4.0 Investigation of dye binding properties of smoked and unsmoked Coley fillets without the 5% NaCl
In the typical commercial smoking process, fish fillets are
soaked in brine conta1ning up to 10% NaCl before the smoking
process. The salt reacts with the surface free amino acids and
proteins to give the smoked fish a glossy appearance wh1ch appeals
to the customer.
4.4.1 Experimental materials
The fillets were prepared as in 4.1.1. Since the salt might
be responsible for the anomalous results in section 4.3.2, the
brining operation was omitted.
4.4.2 Experimental procedure
The dye binding properties of this batch of samples (without
sodium chloride) were determined as in the procedure in 4.3.0.
4.4.3 Results and discussion
Dye binding isotherms of smoked and unsmoked samples are shown
in Table 4.4 in the Appendix. At the h1gh dye concentrations, the
amount of dye bound by the unsalted smoked samples was slightly more
compared to the salted smoked fillets. Similarly dye binding was
less for the unsalted unsmoked samples (see graphs 4.5 and 4.6).
The difference between the salted and unsalted samples was small as
the amount of sodium chloride, used in the previous batch of fish
samples, was very small. Udy (1971) found that when chloride ions
were incorporated in buffers, high dye binding occurred. Jones (1974)
reported the reverse effect w1th chloride ions. Consistent with the
report of Jones (1974) omission of the salt increased the dye binding.
However, at the low·dye concentrations (16 mg to 30 mg per 40 ml), the
- 85 -
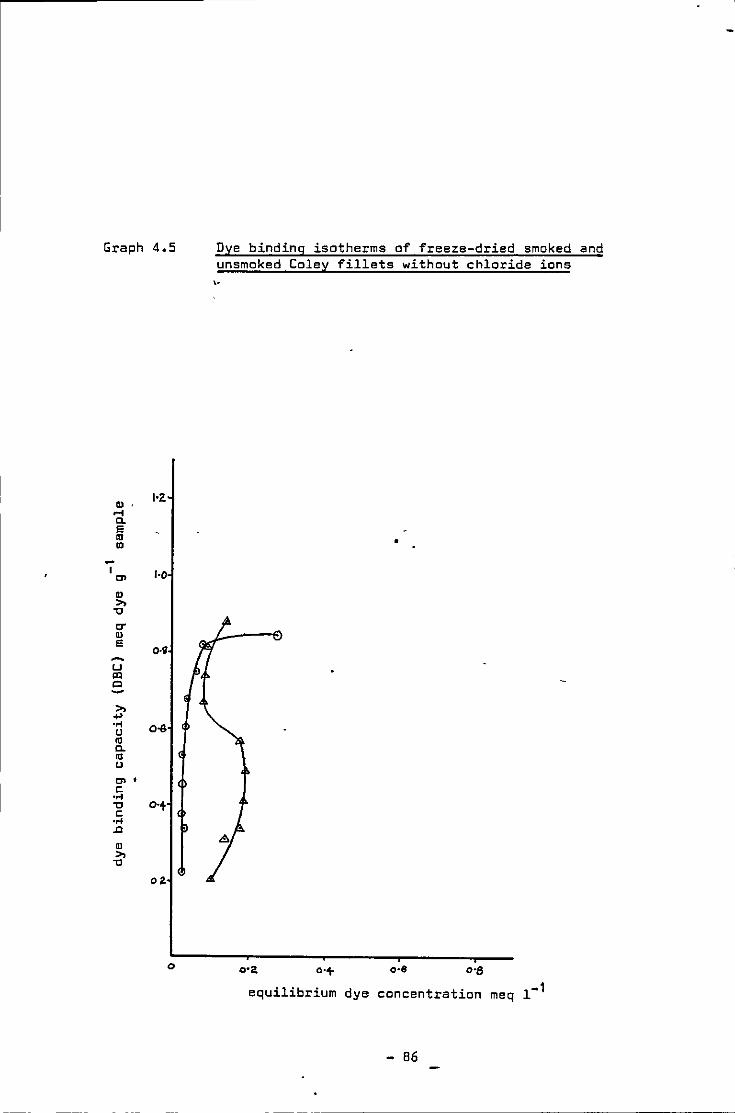
Graph 4.5
"' I•Z
.... a. E 10
" -I 1·0 a>
" "' '0
tJ'
" E 0·9
~
u IIl
"' -"' .., ....
0-6 u tU a. tU u
"'' " .... '0 O·t " .... .a
" "' '0
02.
0
Dye binding isotherms of freeze-dried smoked and unsmoked Coley fillets without chloride ions ,.
•
o·e 0•8
equilibrium dye concentration meq 1-1
- 86
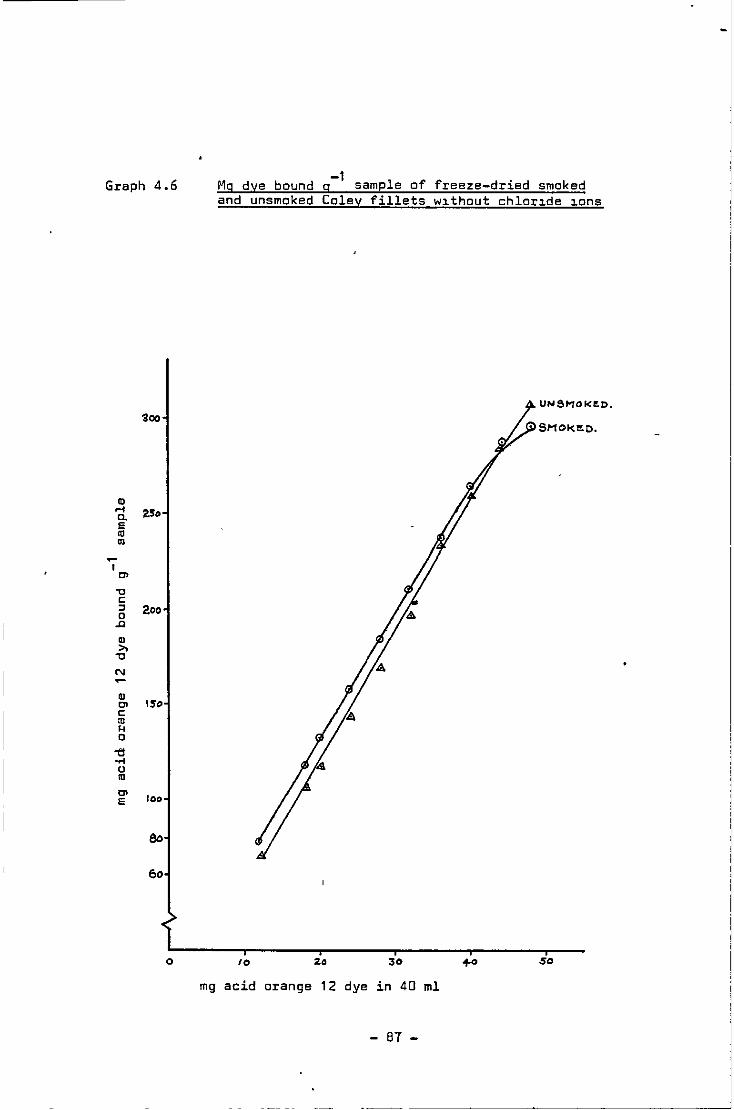
Graph 4.6 Mg dye bound -1 g sample of freeze-dried smoked
and unsmoked Coley fillets w1thout c:hlor1de 1ons
UN8MOK~D.
SMOKI!.D.
Q) .... 2.5o a. E
"' 01 -I "'
"'C c: " 2oo 0
.&J
Q) ,., "'C
N
" "' 150 c: "' ... 0
<0 .... u
"' "' too E
eo
6o
0 IO 2.0 30 so
mg acid orange 12 dye in 40 ml
- 87-

smoked samples still bound more dye than the unsmoked samples
indicating that the salt content was not respons1ble for the
anomalous results presented in section 4.3.2. It was observed
that the dye supernatant from the unsmoked samples were turbid.
It was assumed that this turbidity might account for a larger
than normal replicate var1ation. Of more importance, however, is
the possibility that light scattering was causing false high "light
absorption" readings that in turn implied high dye concentration
in the supernatant and low dye binding by the unsmoked samples.
It was postulated that the turbidity might be caused by:-
i) residual lipids in the unsmoked fish samples; or
ii) effects of low dye concentration on dye binding by
proteins.
Fraenkal-Conrat and Cooper (1944) have stated that
"when less than equivalent amounts of dyes were added to dissolved proteins, the resulting protein-dye complexes were not completely precipitated. This resulted, paradoxically, in higher colourimetric readings in the soluble phase, than when sufficient dye for the saturation of the protein was added."
Fraenkal-Conrat and Cooper (1944) used gelatin granules. Similar
observations were reported by Rawlins and Schmidt (1930).
The data here suggest possible add1tional cause for the
anomalous dye binding behaviour in sections 4.3.0 and 4.4.0, and
- 88 -
the following factors must be investigated:
a) interaction between residual smoke components
and AD.12 dye;
b) interaction between AD.12 dye and basic ends
of short chain peptides and N-terminal of
free amino acids produced by proteolysis
during the smoking process.
- 89 -
4.5.0 Investigat1on of possible interactions between smoke components and AD.12 dye
It is possible that the d1ethyl ether extractions have not
completely removed all the smoke components from the smoked fillet
samples and that these residues may modify the optical properties
of the dye supernatant.
To observe how the smoke components may react with the A0.12
dye, the following experiment was made.
4.5.1 Materials
Selected smoke components 0.2M citric acid; 1.42 meq
A0.12 dye/litre
4.5.2 Procedure •
i) smoke component (10 mg) was dissolved in 1 ml
propan-2-ol in a test tube (determinations
' were in duplicates);
ii) to this was added 5 mg dye in 10 ml 0.2M
citric acid (i.e. 0.5 g/1 dye solution);
iii) the absorbance of each mixture was read
against 0.2M citric acid on the SP500 at
482 nm and the wavelength maximum absorbance
was recorded;
iv) a steel plate 10.2 cm x 15.4 cm was hung in the
kiln and smoked for 3 hours, 40 ml methanol was
used to wash the plate. 1 ml of the wash
solution was added to 10 ml of above dye solut1on
and absorbance recorded as above.
- 90 -
The same experiment was repeated using the same smoke
components and a higher dye concentration of 12mg dye in 10 m~
0.2M citric acid (3.42 meq A0.12 dye/litre 0.2M citric acid).
Suitable dilutions with 0.2M citric acid were made where
necessary. The "control" or unreacted dye was 10 ml dye of the
appropriate concentrations + 1 m~ propan-2-o~ (70~w/ ). V
4.5.3 (a) Results and discussions
The results for the selected smoke components with di~ute
dye are shown in Table 4.5 and show a reduction in extinct1on of
the A0.12 dye with each smoke component tested and with the smoked
plate deposit. In al~ cases "-max fel~ in the range 482 ! 2 nm.
These resu~ts suggest that any residual smoke components in the
diethyl ether extracted smoked samples wi~l reduce the supernatant
extinction and thus imply a false high dye binding ability for that
• smoked sample.
It would appear that simple pheno~s or pheno~ ethers have only
a small effect but the presence of a carbonyl group, a carboxylic
acid group or an unsaturated aliphatic side chain para-positioned
to the hydroxyl group, marked~y increased the effect. The phenolic
fraction of wood smoke alone is reported to be comp~ex and some of
the components is said to have carbonyl as wel~ as pheno~ic functions~
groups (Issenberg, Korneich and Lustre, 1971) who also showed the
difficulty in completely removing al~ the phenols in the form of
smoke condensates added to pork belly. When 10 m~ of the ~ow dye
concentration of 1.42 meq A0.12 dye/l1tre 0.2M citric acid was added
to 10 mg of these compounds, the extinction was reduced. When
converted to reduction per mole of compound; of the syringe~ and
- 91 ~
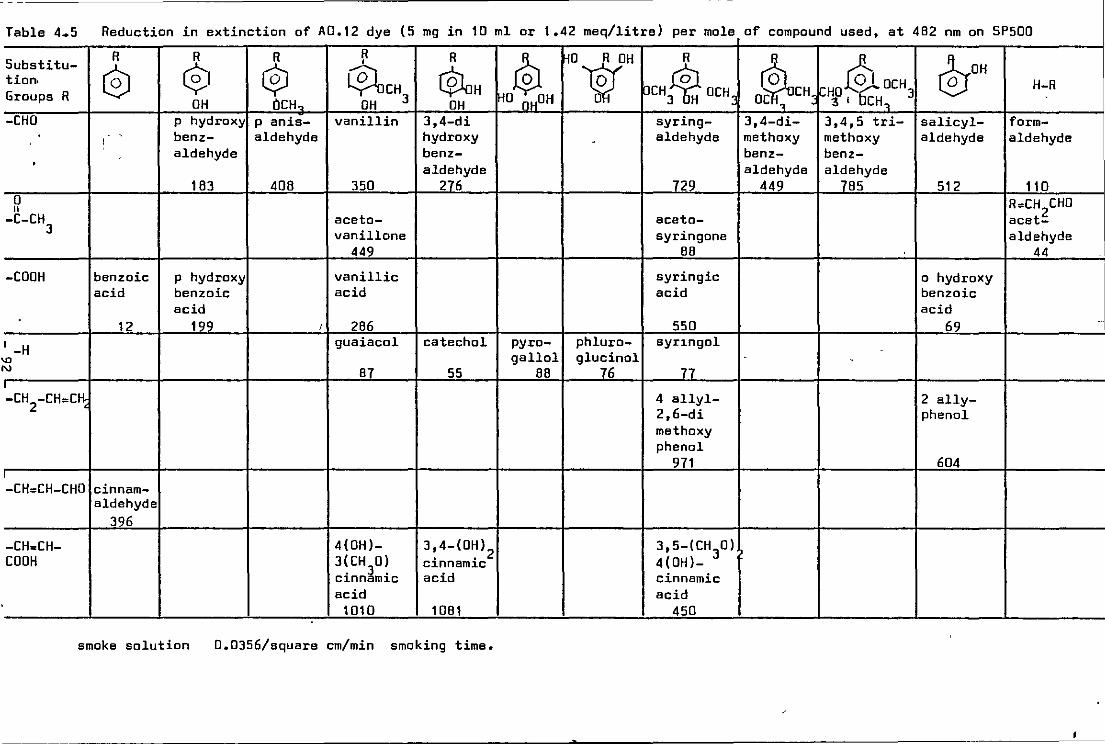
-
Table 4.5
Substitu-tion. Groups
-CHO
'
0 11
-C-CH
-COOH
I
"' N
I
-H
J
R
-CH -CH=CH; 2
' -CH=CH-CHO
-CH=CH-COOH
Reduction
R
® '
I
benzoic acid
12
cinnam-aldehyde
396
in extinction of
R R
~I $ OH OCH,
p hydroxy p anis-benz- aldehyde aldehyde
183 408
p hydroxy benzoic acid
199
AD .12 dye ( 5 mg in 10
R R '
CflocH $oH OH 3 OH
vanillin 3,4-di hydroxy benz-aldehyde
350 276
aceta-vanillone
449
vanillic acid
I 286 guaiacol catechol
B7 55
4(0H)- 3,4-(0H)2
3~CH 30~ ' . c1nnam1c
c1nnam1c acid acid
1010 1081
smoke solution 0.0356/square cm/min smoking time.
ml or 1.42 meq/litre) per mole of compound used, at 482 nm on 5P500
~O®H ~0-wH R R
i-HO~OCH3 ®OH pCH~ OCH 1 0~CH, H-R ,l ., f-'3 I CH
1
syring- 3,4-di- 3,4,5 tri- salicyl- form-- aldehyde methoxy methoxy aldehyde aldehyde
benz- benz-aldehyde aldehyde
729 449 785 512 110
ace to-R=CHlHO acet-
syringone aldehyde BB 44
syringic o hydroxy acid benzoic
acid 550 69 --
pyre- ph lure- syn.ngol -
gallol glucinol BB 76 77
4 allyl- 2 ally-2,6-di phenol methoxy phenol
971 604
J,S-(CH3
0) 4(0H)-cinnamic acid
450
guaiacol group, acetosyringone, syringaldehyde and syringic acid gave
the greatest reduct1on then came acetovanillone, vanillin and
vanillic acid in decreasing order. Syringe! and guaiacol, not
surprisingly, did not give a strong reduction but the derivatives
of syringol greatly reduced the extinct1on coefficient showing
functional activity of the aldehyde, ketone and carboxyl groups.
The methoxy and hydroxy-groups are electron-donating, contributing
to electron delocalisation and hydrogen bonding between the smoke
components and the -N = N- bond of the A0.12 dye, hence causing the
reduction in the extinction coefficient of the dye. If the ortho
hydroxy benzoic acid (which is very likely to have intramolecular
hydrogen bonding) is compared with p-hydroxy benzoic acid, the
reduction effect by the a-hydroxy benzoic acid is less due to its
intramolecular hydrogen bonding effect, hence there is less binding
to the -N = N- bond of the A0.12 dye. Hence the largest reductions
per mole were obtained with ferulic acid, caffe1c acid, 4·a11yl-
2,6-dimethoxy phenol, 3,4,5-tri-methoxy benzaldehyde, 2-allyl phenol
3,5-dimethoxy-4-hydroxy cinnamic acid, 3,4-dimethoxy benzaldehyde and
cinnamaldehyde in decreasing order. During the hot smoking of meat
products at high temperature and high relative humidity, the phenols
such as syringaldehyde, acetosyringone and acetovani11one are said
to be better adsorbed in the meat product because of the greater
polarity of these components. Potthast (1971) showed that there is
great loss of phenols with reactive carbonyl groups caused by
condensation reactions of the carbonyl groups with the free amino
groups of the proteirn when he compared the distillate of the water
smoked solution and distillate of the smoked-meat homogenate, and he
also found phenol, guaiacol, vanillin, acetosyringone and syringaldehyde
- 93
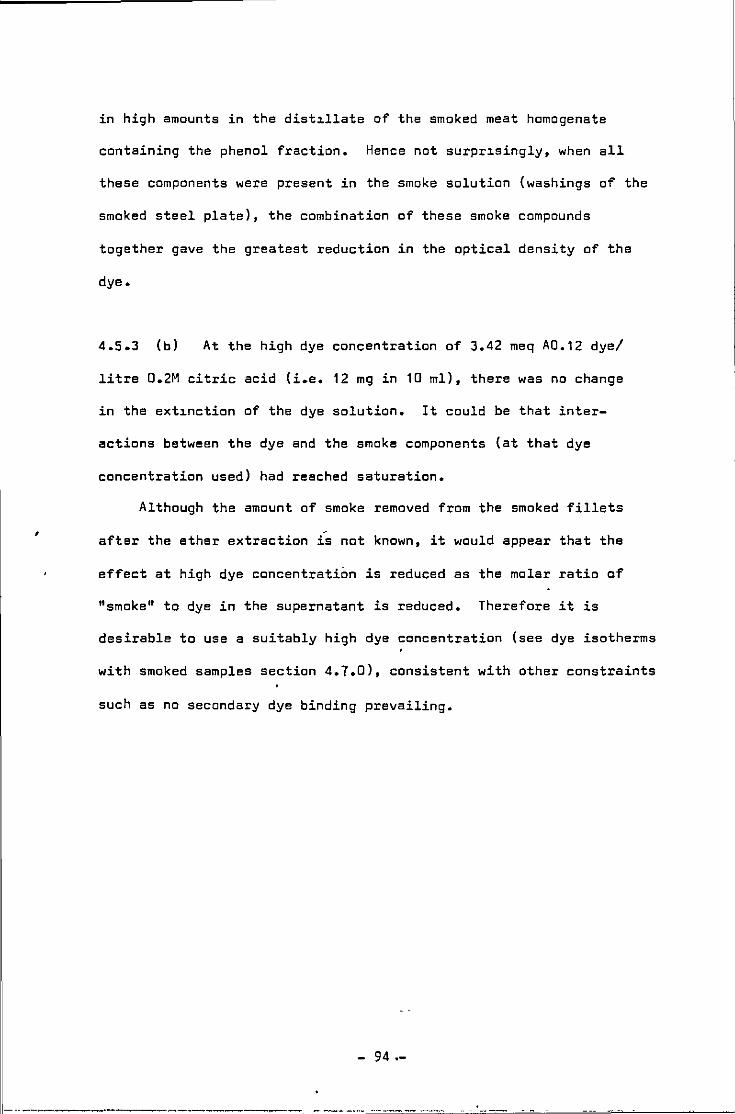
'
in high amounts in the dist~llate of the smoked meat homogenate
containing the phenol fraction. Hence not surpr~singly, when all
these components were present in the smoke solution (washings of the
smoked steel plate), the combination of these smoke compounds
together gave the greatest reduction in the optical density of the
dye.
4.5.3 (b) At the high dye concentration of 3.42 meq A0.12 dye/
litre 0.2M citric acid (i.e. 12 mg in 10 ml), there was no change
in the ext~nction of the dye solution. It could be that inter
actions between the dye and the smoke components (at that dye
concentration used) had reached saturation.
Although the amount of smoke removed from the smoked fillets
after the ether extraction is not known, it would appear that the
effect at high dye concentration is reduced as the molar ratio of
"smoke" to dye in the supernatant is reduced. Therefore it is
desirable to use a suitably high dye concentration (see dye isotherms
with smoked samples section 4.7.0), consistent with other constraints
such as no secondary dye binding prevailing.
- 94.-
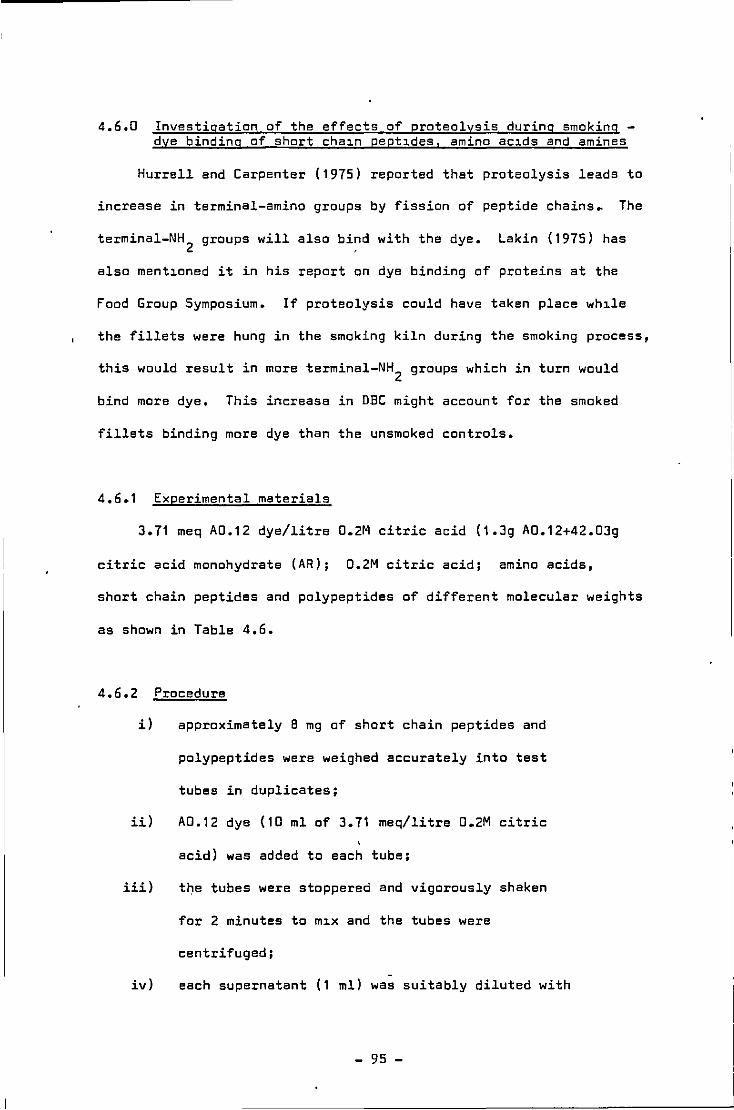
4.6.0 Investigation of the effects of proteolysis during smoking -dye binding of short cha~n pept~des, amino ac~ds and amines
Hurrell and Carpenter (1975) reported that proteolysis leads to
increase in terminal-amino groups by fission of peptide chains. The
terminal-NH2
groups will also bind with the dye. Lakin (1975) has
also ment~oned it in his report on dye binding of proteins at the
Food Group Symposium. If proteolysis could have taken place wh~le
the fillets were hung in the smoking kiln during the smoking process,
this would result in more terminal-NH2
groups which in turn would
bind more dye. This increase in DBC might account for the smoked
fillets binding more dye than the unsmoked controls.
4.6.1 Experimental materials
3.71 meq AD.12 dye/litre D.2M citric acid (1.3g A0.12+42.03g
citric acid monohydrate (AR); 0.2M citric acid; amino acids,
short chain peptides and polypeptides of different molecular weights
as shown in Table 4.6.
4.6.2 Procedure
i) approximately B mg of short chain peptides and
polypeptides were weighed accurately into test
tubes in duplicates;
ii) AD.12 dye (10 ml of 3.71 meq/litre D.2M citric
acid) was added to each tube;
iii) t~e tubes were stoppered and vigorously shaken
for 2 minutes to m~x and the tubes were
centrifuged;
iv) each supernatant (1 ml) was suitably diluted with
- 95 -
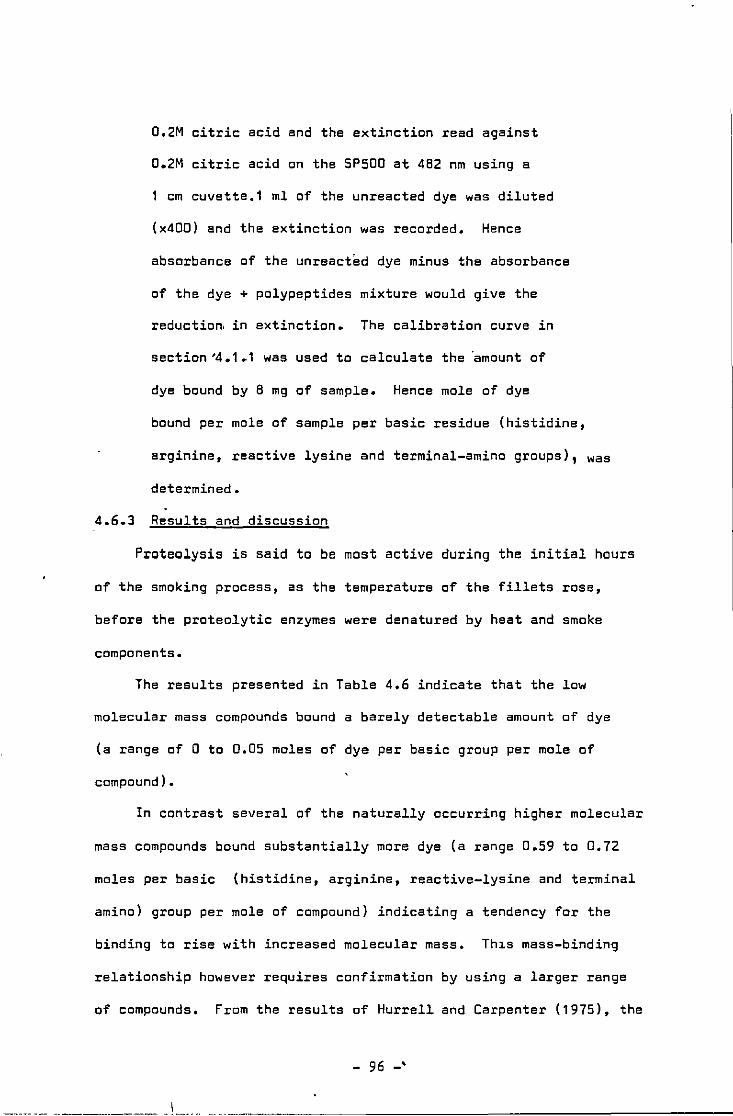
0,2M citric acid and the extinction read against
0.2M citric acid on the SPSOO at 482 nm using a
1 cm cuvette.1 ml of the unreacted dye was diluted
(x400) and the extinction was recorded, Hence
absorbance of the unreacted dye minus the absorbance
of the dye + polypeptides mixture would give the
reduction. in extinction. The calibration curve in
section '4. 1 • 1 was used to calculate the 'amount of
dye bound by 8 mg of sample. Hence mole of dye
bound per mole of sample per basic residue (histidine,
arginine, reactive lysine and terminal-amino groups) 1 was
determined.
4.6.3 Results and discussion
Proteolysis is said to be most active during the initial hours
of the smoking process, as the temperature of the fillets rose,
before the proteolytic enzymes were denatured by heat and smoke
components.
The results presented in Table 4.6 indicate that the low
molecular mass compounds bound a barely detectable amount of dye
(a range of 0 to 0.05 moles of dye per basic group per mole of
compound).
In contrast several of the naturally occurring higher molecular
mass compounds bound substantially more dye (a range 0.59 to 0,72
moles per basic (histidine, arginine, reactive-lysine and terminal
amino) group per mole of compound) indicating a tendency for the
binding to rise with increased molecular mass. Th~s mass-binding
relationship however requires confirmation by using a larger range
of compounds, from the results of Hurrell and Carpenter (1975), the
- 96 -·
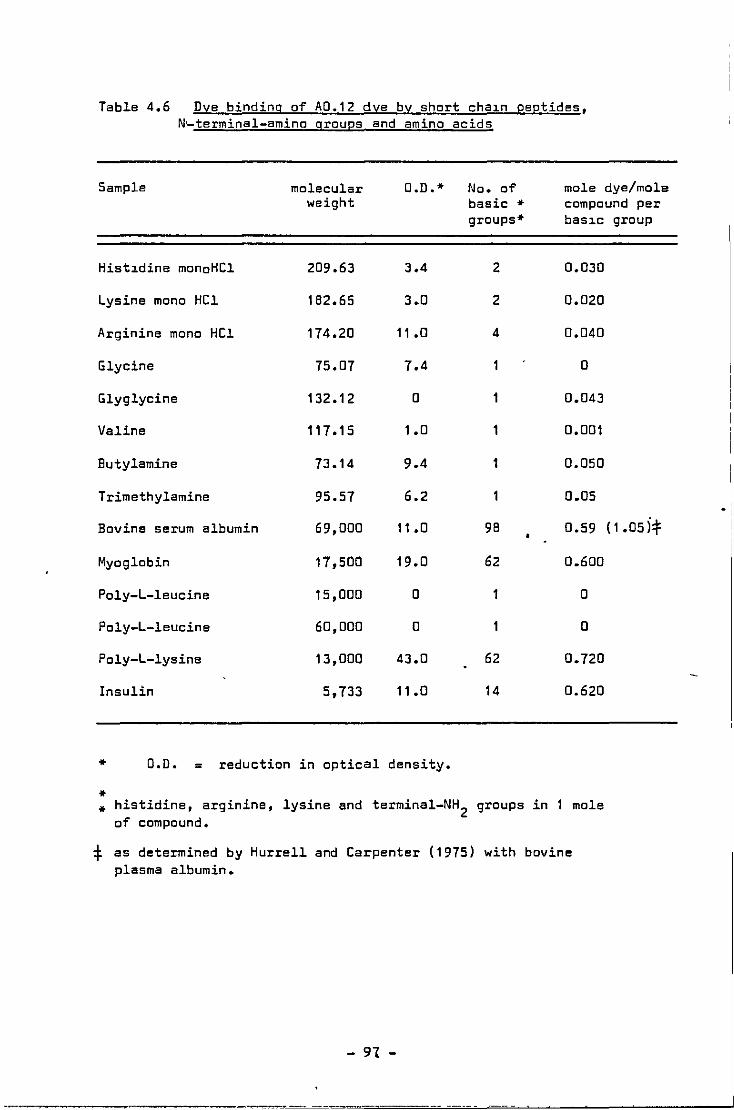
Table 4.6 Dye binding of A0.12 dye by short cha1n peptides, N~terminal-amino groups and amino acids
Sample molecular O.D. * No. of mole dye/mole weight basic * compound per
groups* bas1c group
Hist1dine monoHCl 209.63 3.4 2 0.030
Lysine mono HCl 182.65 3.0 2 0.020
Arginine mono HCl 174.20 11.0 4 0.040
Glycine 75.07 7.4 0
Glyglycine 132.1 2 0 0.043
Valine 117.15 1.0 0.001
Butylamine 73.14 9.4 0.050
Trimethylamine 95.57 6.2 0.05
Bovine serum albumin 69,000 11 .o 98 0.59
Myoglobin 17,500 19.0 62 0.600
Poly-L-leucine 15,000 0 0
Poly-L-leucine 60,000 0 0
Poly-L-lysine 13,000 43.0 62 0.720
Insulin 5,733 11.0 14 0.620
* O.D. = reduction in optical density.
* * histidine, arginine, lysine and terminal-NH2 groups in 1 mole of compound.
:j: as determined by Hurrell and Carpenter ( 1975) with bovine plasma albumin.
- 91 -
(1.o5i-'f
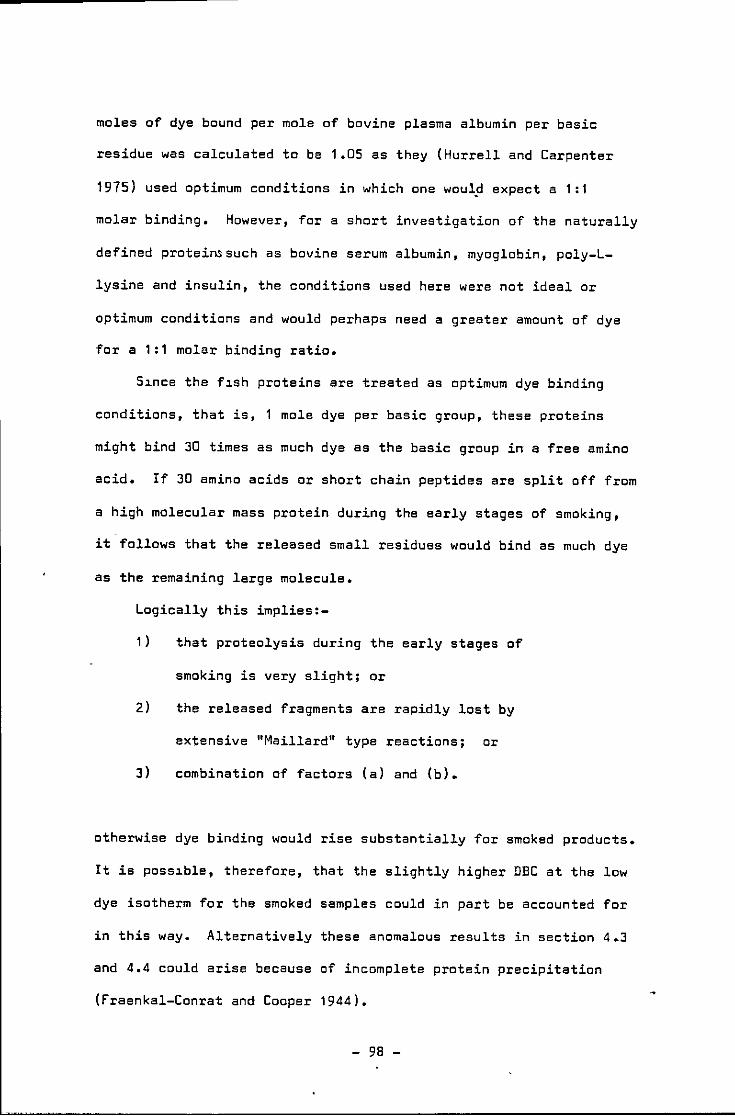
moles of dye bound per mole of bovine plasma albumin per basic
residue was calculated to be 1.05 as they (Hurrell and Carpenter
1975) used optimum conditions in which one woul~ expect a 1:1
molar binding. However, for a short investigation of the naturally
defined proteinssuch as bovine serum albumin, myoglobin, poly-L
lysine and insulin, the conditions used here were not ideal or
optimum conditions and would perhaps need a greater amount of dye
for a 1:1 molar binding ratio.
s~nce the f~sh proteins are treated as optimum dye binding
conditions, that is, 1 mole dye per basic group, these proteins
might bind 30 times as much dye as the basic group in a free amino
acid. If 30 amino acids or short chain peptides are split off from
a high molecular mass protein during the early stages of smoking,
it follows that the released small residues would bind as much dye
as the remaining large molecule.
Logically this implies:-
1) that proteolysis during the early stages of
smoking is very slight; or
2) the released fragments are rapidly lost by
extensive "Maillard" type reactions; or
3) combination of factors (a) and (b).
otherwise dye binding would rise substantially for smoked products.
It is poss~ble, therefore, that the slightly higher DBC at the low
dye isotherm for the smoked samples could in part be accounted for
in this way. Alternatively these anomalous results in section 4.3
and 4.4 could arise because of incomplete protein precipitation
(fraenkal-Conrat and Cooper 1944).
98 -
Hurrell and Carpenter (1975) reported that proteolysis may
lead to the production of free amino acids which are still of
nutritional value but no longer cause dye binding as measured
by the precipitation of the dye. However, the results here show
that the small molecular mass amino acids hardly bind dye while
small peptides b1nd to a very small extent, that could only be
significant if proteolysis is extensive, thus essentially
-confirming their (Hurrell and Carpenter, 1975) report •
•
99 -
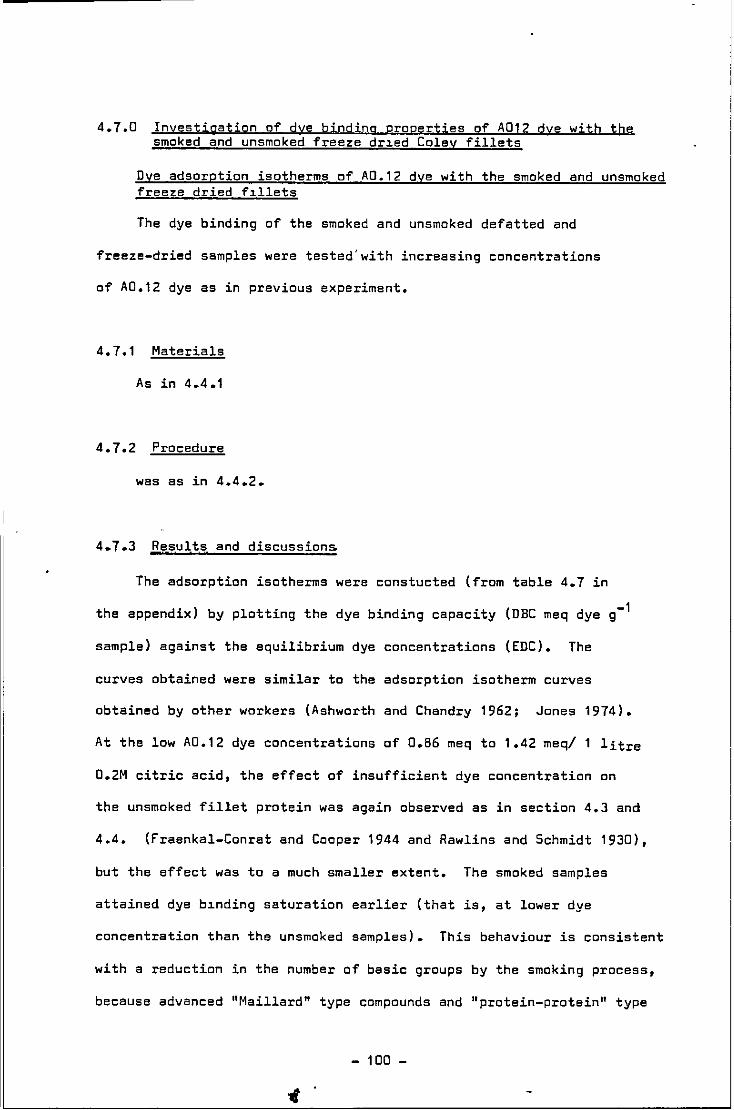
4.7.0 Investigation of dye binding properties gf A01? dye with the smoked and unsmoked freeze dr1ed Coley fillets
Dye adsorption isotherms of A0.1? dye with the smoked and unsmoked freeze dried f1llets
The dye binding of the smoked and unsmoked defatted and
freeze-dried samples were tested'with increasing concentrations
of AD.12 dye as in previous experiment.
4.7.1 Materials
As in 4.4.1
4.7.2 Procedure
was as in 4.4.2.
4.7.3 Results and discussion~
The adsorption isotherms were constucted (from table 4.7 in
the appendix) by plotting the dye binding capacity (DBC meq dye g-1
sample) against the equilibrium dye concentrations (EDC). The
curves obtained were similar to the adsorption isotherm curves
obtained by other workers (Ashworth and Chandry 1962; Jones 1974).
At the low AD.12 dye concentrations of 0.86 meq to 1.42 meq/ litre
0.2M citric acid, the effect of insufficient dye concentration on
the unsmoked fillet protein was again observed as in section 4.3 and
4.4. (fraenkal-Conrat and Cooper 1944 and Rawlins and Schmidt 1930),
but the effect was to a much smaller extent. The smoked samples
attained dye b1nding saturation earlier (that is, at lower dye
concentration than the unsmoked samples). This behaviour is consistent
with a reduction in the number of basic groups by the smoking process,
because advanced "Maillard" type compounds and "protein-protein" type
- 100 -
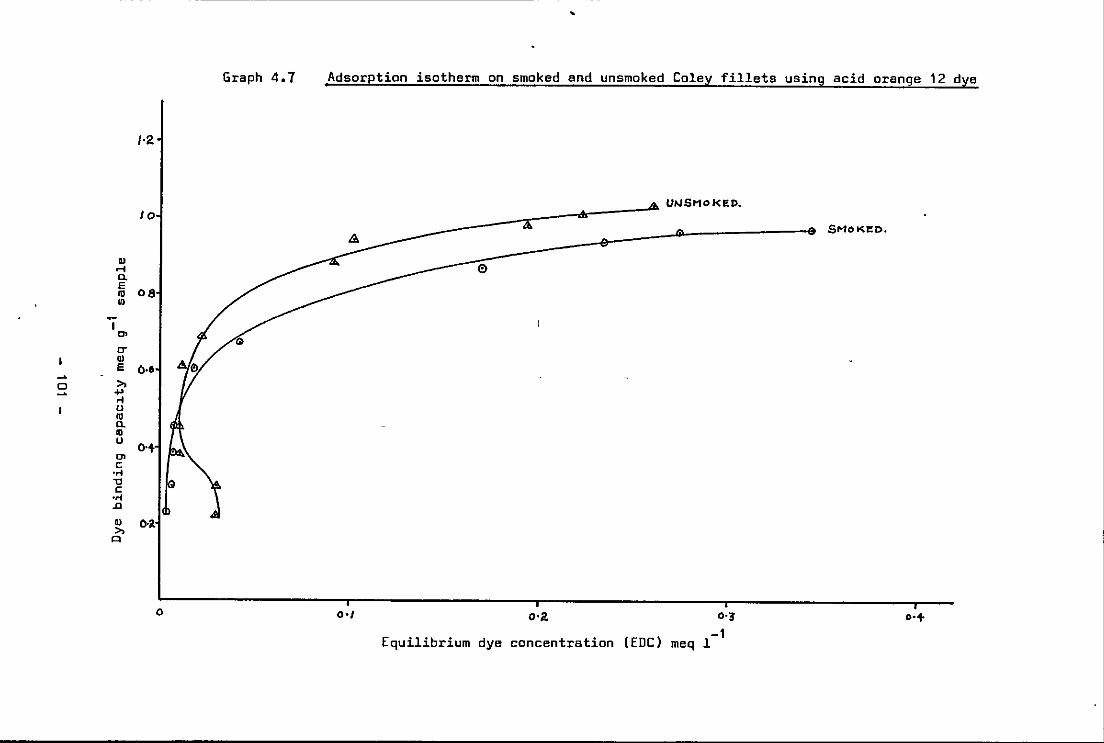
-------------------------------------------------------------------------------------------------------------------------------------- ------
" .... a. E .. Ul
~
I
"' 0" QJ
E -D » .... ... u .. a. Ill u 0> c .... ., c .... .0
QJ
» "'
Graph 4. 7
1·2
IO
08
0·6
O·+
O·lt
0
Adsorption isotherm on smoked and unsmoked Coley fillets using acid orange 12 dye
U>1St10KED.
0
0•2.
Equilibrium dye concentration (EDC) meq
0•3'
-1 1
SMOKI!D.
o·+
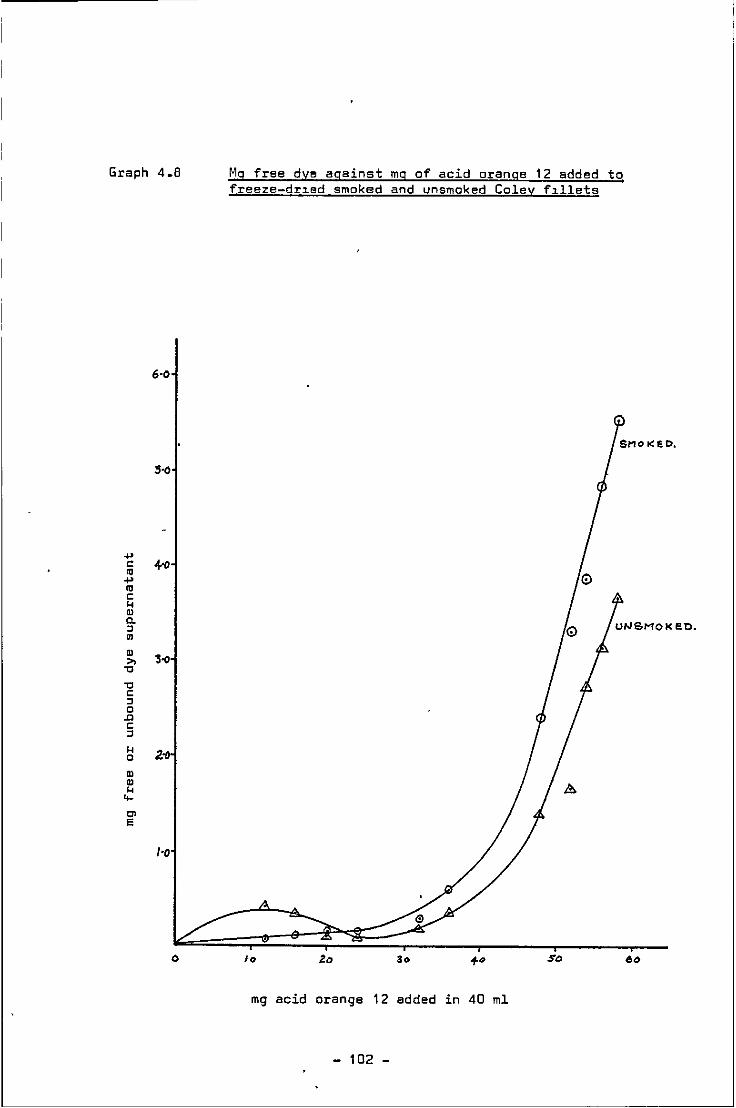
Graph 4.8
6·0
.... c 4'0 " .... " c ... Q)
a.
" "' " 3-o ,., "tl
"tl c
" 0 .0 c
" ... :?: 0
" " ... .... "' E
I·O
0
Mg free dye against mg of acid orange 12 added to freeze-dr1ed smoked and unsmoked Coley f1llets
UNSMOI<EO.
to Zo 30 so 60
mg acid orange 12 added in 40 ml
- 102 -
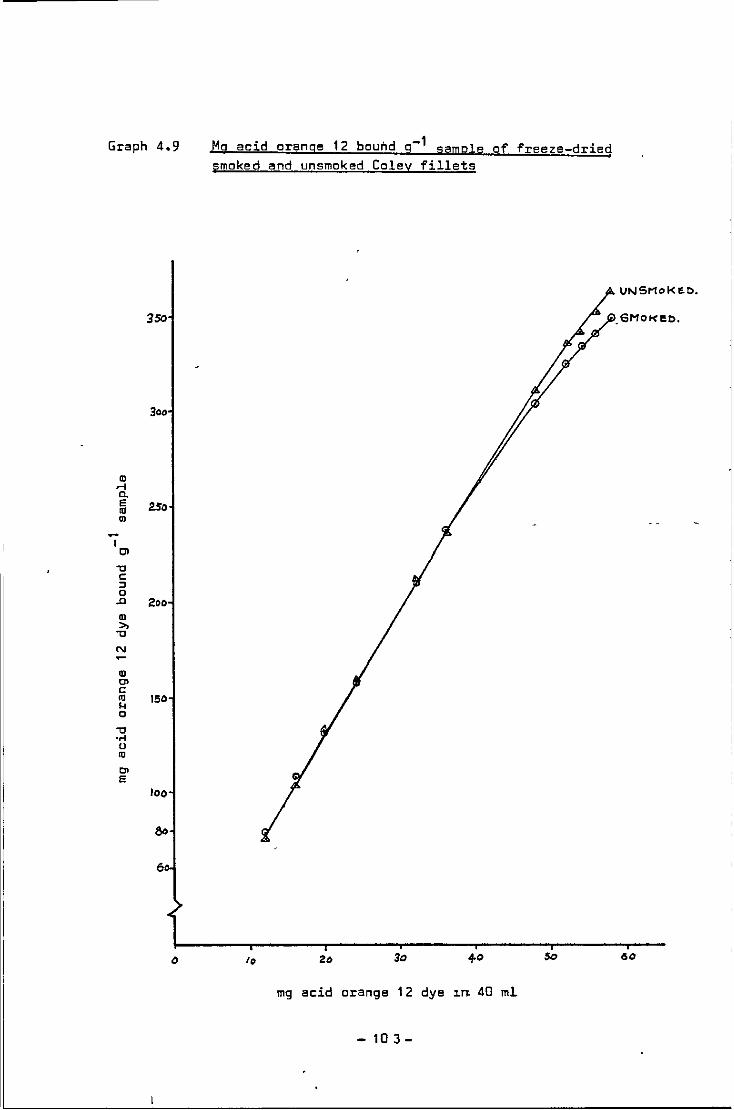
Graph 4.9
350
3oo
" ..; a. e Uo Ill
"' ~
I Cl
"'C c: ::l 0
..c 2oo Ql
"' "'C
N
" "' c: Ill 150
" 0
"'C .... u
"' "' e
lOO
eo
6
0
Mg acid orange 12 bound g-1 sample of freeze-dried smoked and unsmoked Coley fillets
IQ 3o +o So
mg acid orange 12 dye 1n 40 ml
- 10 3-
VNSMoKEo.
6Mo>eeo.
60
compounds (see section 2.9.2) are not able to bind with the dye
an~ons.
The DBC of both the unsmoked and smoked samples increased with
1ncrease in equilibrium dye concentration (EDC) until the dye
binding saturation plateau was reached (about 3.85 meq dye/litre
0.2M citric acid cf the dye isotherms in section 4.4.)
From the data on the dye binding saturation plateau, a tentative
procedure for the dye binding of smoked and unsmoked samples can
be devised.
•
- 104 -
4.8.0 Invest~gation of dye binding properties of fillets smoked over a period and block1ng or acylat1on of the -amino groups of the smoked and unsmoked fillets
The results in section 4.7.0 indicate that the smoked and
unsmoked samples reached the dye binding saturation plateau by
4.0 meq/litre dye solution. Accordingly this concentration was
used in all subsequent work to determine the dye binding properties
of the unsmoked controls and fillets smoked over 1, 3 and 5 h.
In order to follow the changes in the <-amino groups of lysine
during the smoking, in addition to the total basic res1dues (histidine.
arginine and reactive-lysine), blocking of the lysine side chains was
by methoxy carbonyl chloride acylation. These results obtained for
lysine can be compared with the results for lysine obtained by the
fDNB method in section 3.1.0.
4.8.1 Materials •
Eleven Coley fish were filleted and the fillets marked with
small coloured beads so that pairings could be maintained. One set
of 11 fillets were kept as unsmoked controls. from each, 2
successive approximately 0.5 to 1 cm layers were removed and freeze-
dried. Bones, scales and skin were carefully removed. The other
set of 11 fillets were smoked in the Tarry mini-k1ln as in section
4.4.1. After 1 h, 3 fillets were removed from the top tray; after
3 h 4 fillets from the middle tray and after 5 h, the last 4 fillets
on the bottom tray which was shifted up to middle position of the
kiln at 3 h. Temperature of smoking kiln was maintained at 115°.
After the smoked fillets were cooled, the layers were removed as
described for the unsmoked fillets (see fig. 4.2 overleaf). The
- 105 -

cut surface of fillet
upper smoked layer} ) )
lower smoked layer )
skin of fillet
- wire tray in kiln
layers were placed in the blast freezer and the frozen layers were
removed for analysis
freeze-dried. The samples were then ground in a hammer-mill to pass
through a sieve BS410 of 0.25 m~ aperture, defatted by diethyl ether
extraction in a soxhlet apparatus (twice with 100 ml diethyl ether)
0 and stored vacuum sealed in polythene bags at 4 C (as they were to
be used fairly rapidly over a short period of time, there was no
essential need to store them in the frozen state).
4.8.2 Investigation of dye binding values of unsmoked and smoked Coley f1llets (1, 3 and 5 h smoking time)
4.8.3 Materials
4.0 meq A0.12 dye/1 0,2M citric acid (1.40g
A0.12 dye + 42.03g citric acid monohydrate (AR) in
1 litre distilled water; glass beads 0.5 m~ diameter;
100 ml polythene centrifuge tubes with plastic caps.
4.8.4 Experimental procedure
i) approximately 0.15g of the sample (c. 140 mg protein)
prepared in section 4.8.1 was weighed accurately into
a 100 ml polythene centrifuge tube;
- 106 -
------ - ----------~~-------~
ii) glass beads (3 to 4) were added to each sample
in the centrifuge tube. A glass microfibre
filter paper Whatman GF/A was wetted with 0.2M
citric acid, drained and placed in (this is to
account for the c.2 ml citric acid in the GF/A
paper used in the blocking process);
iii) A0.12 dye (40 ml of 4.0 meq. A0.12 dye/litre
0.2M citric acid, i.e. 1.4g dye/litre or 56 mg
in 40 ml; compared to Hurrell and Carpenter
1975, 54.5 mg in 40 ml and Jones 1974, 54 mg
in 50 ml but they used different sample size,
Hurrell and Carpenter, 1975, c.5 mg lysine sample
and Jones, 1974, c.100 mg protein sample);
ivl the tubes were stoppered with the plastic caps
and mechanically shaken for 1 h;
v) the sample dye mixture was centrifuged at 2500
r.p.m. (1 ml of the supernatant was diluted to
10 ml with 0.2M citric acid, where necessary)
and the absorbance was read against 0.2M citric
acid on the SP500 at 482 nm using a 1 cm cuvette.
- 107 -
4.8.5 Results and discussions
The results are presented in Table 4.8.
-1 The DBC (dye binding capacity meq g sample) was calculated
and percentage loss in basic amino acid of the smoked layers
compared with the unsmoked controls were determ~ned from the O.D.
readings, using the calibration curve in section 4.1.2.
There was a increasing percentage loss of basic amino acids with
increased time of smoking. The upper layers of the smoked fillets
showed a greater loss in basic amino groups than the lower layers.
This was observed for all the smoked fillets of 1,3 and 5 h smoking
time.
There was a small loss of 2.49% (mean of the 2 layers) in basic I
amino groups in the upper and lower layers of the 1 h smoked fillets.
~s reported by Jones (1974), the early "Maillard" type compounds
are'still basic and will bind with the dye (see section 2.9.2). The
percentage loss in basic amino groups from the upper layers of the
3 h smoked fillets were significant from the unsmoked controls
(student 't' test= 4.88, F = 1.40, p = 0.01) )with a mean
of 9.16% loss in DBC, but the average % loss of both the upper and
lower layers showed a mean of 6.01%.
Greater loss in basic amino acids of both upper and lower layers
of the 5 h smoked fillets were observed with a mean of 17.85% for the
upper layers and a mean of 8.26% for the lower layers (3 samples as
the lower layers of the fourth sample was lost), hence the average
of both upper and lower layers showed a loss of 13.05%.
The final 2 hours of smoking produced a smaller loss of lysine
in the upper layers than the upper layers of the first 3 hours of
- 108 -
the smoking process. This could be because of:-
a) the smoke-protein interaction approaching saturat1on
towards the end of 5 h smoking;
b) the declining relative humidity and moisture content
of the surface layer, limiting adsorption and
damage towards the end of the process as reported
by Foster and Simpson (1961) for smoked fish;
cl combination of factors (a) and (b) above.
Caurie (1975) has shown that the amount of smoke adsorbed
increased with increasing temperature from 45° to 72° and depended
on the speed of smoke flow. When the oven was held smoke tight,
the amount of smoke adsorbed was limited and the drying process
was slow. When smoke was azlowed to escape rapidly with a high
air velocity, adsorption was rapid initially and gradually slowed
down as the fish flesh dried. Therefore, with high air velocity,
the drying process was rapid.
- 109 -
4.9.0 Blocking gr acylation gf the ~-NH2 groups of lysine by methoxy carbonyl chloride (methyl chloroformate)
4.9.1 Materials
Unsmoked control and smoked (1, 3 and 5 h) fillets of section
4.8.1., 3.2 meq A0.12 dye/litre 0.2M citric acid (1.12g dye/litre
0.2M citric acid);buffer 8% (w/v) NaHC03
- 8% (w/v) Na2co
3 solution
(19.5g NaHC03
+ 1g NaC03
in 250 ml distilled water), pH adjusted to
pH 8.5; methoxy carbonyl chloride (MCC).
4.9.2 Experimental procedure
i) freeze-dried defatted sample (0.15g)was weighed
into a 100 ml polythene centrifuge tube;
ii) sodium bicarbonate-sodium carbonate (prepared in
-section 3.1.0) buffer pH 8.5 (2 ml) was added and
the tube was shaken by hand to mix and left to
stand for 15 min to allow hydration of the samples
to take place;
iii) methoxy carbonyl chloride (0.5 to 1 ml) was added
by a graduated pipette attached to a pumpette
transfer was made under the fume hood as MCC is
lachrymatousl;
ivl four glass beads were added, the tube was stoppered
and mixture was vigorously shaken occas1onally over
20 min and filtered through a glass micro fibre
filter paper Whatman GF/A. The filtrate was washed
with 5 ml citric acid and allowed to drain. The
filter paper and its contents was carefully wrapped
and placed back into the 100 ml polythene centrifuge tube;
- 110-
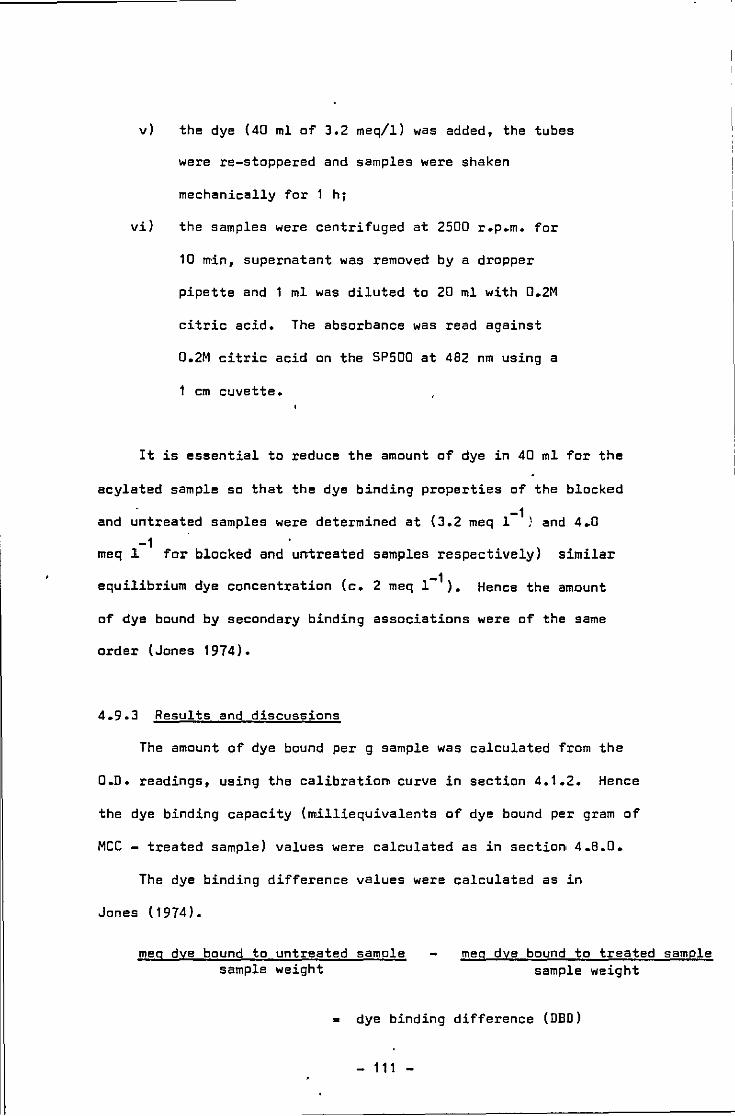
v) the dye (40 ml of 3.2 meq/1) was added, the tubes
were re-stoppered and samples were shaken
mechanically for 1 h;
vi) the samples were centrifuged at 2500 r.p.m. for
10 min, supernatant was removed by a dropper
pipette and 1 ml was diluted to 20 ml with 0,2M
citric acid. The absorbance was read against
0.2M citric acid on the SPSOO at 482 nm using a
1 cm cuvette.
It is essential to reduce the amount of dye in 40 ml for the
acylated sample so that the dye binding properties of the blocked
-1 and untreated samples were determined at (3.2 meq 1 ) and 4.0
-1 meq 1 for blocked and untreated
equilibrium dye concentration (c.
samples respectively) similar
-1 2 meq 1 ). Hence the amount
of dye bound by secondary binding associations were of the same
order (Jones 1974).
4.9.3 Results and discussions
The amount of dye bound per g sample was calculated from the
O.D. readings, using the calibration curve in section 4.1.2. Hence
the dye binding capacity (milliequivalents of dye bound per gram of
MCC - treated sample) values were calculated as in section, 4.8 .D.
The dye binding difference values were calculated as in
Jones (1974).
meg dye bound to untreated samole sample weight
meg dye bound to treated sample sample weight
= dye binding difference (DBD)
111

.
Table 4.8 Dye binding values of unacylated samples and DBD-lysine the samples treated with MCC compared with FDNB-reactive lvsine
Untreated samples MCC Treated samples FDNB-available lysine
Sample DBC_1 % loss DBD _1 mg_fysine % loss Average m9,11ysine multiplied % loss % loss
meq g in meq g g sample in % loss g sample by correc- in average of sample DBC sample lysine of 2 tion factor lysine 2 layers
layers
uu 1 1 .995 .616 90.02 '- 88.97 92.80 UL 1 1 .979 .614 69.76 89.65 93.50 su 1 1 .954 4.12 .567 85.82 4.66 3.30 82.07 69.95 3.07 SL 1 1 .971 0.82 .602 88.01 1.94 83.85 91.90 1. 71 2.39 uu 1 2 .998 .626 91.52 92.19 96.15 UL 1 2 1 .001 .632 92.40 92.14 96.10 su 1 2 .963 3.5 .608 88.90 2.86 2.14 84.77 92.91 3.31 SL 1 2 .994 0.69 .623 91.08 1.42 86.45 94.75 1.37 2.34 uu 1 3 1.015 .646 94.45 91,66 9~.60 UL 1 3 1.014 ,642 93.86 93.24 97.25 su 1 3 .963 5.12 .608 88.89 5,68 3,46 63.12 91 .1 0 4.70 3.40 SL 1 3 1 .007 0.69 .635 92.84 1.08 86.86 95.20 2.10 uu 3 1 1.008 .643 94.01 91.89 95.84 UL 3 1 1 .011 .649 94.88 91.84 95.79 su 3 1 .910 9. 72 .541 79.09 15.87 76.19 83.50 12.87 SL 3 1 .984 2.67 .619 90.50 4.61 10.24 82.99 90.96 5.04 8.95 uu 3 2 1.008 ,632- 92.40 92.04 96.00 UL 3 2 1.000 .621 90.79 92.12 95.08 su 3 2 .922 8.53 ,557 81,43 11.90 76.92 84.30 12.18 SL 3 2 .973 2.73 .597 67.28 3.86 7.88 79.74 87.40 6.07 10.12 uu 3 3 1.006 .616 90.06 89.96 93.83 UL 3 3 1 .013 .622 90.94 su 3 3 .911 9.44 .532 77.79 13.62 73.18 80.21 14.51 SL 3 3 .982 3.06 .596 67.14 4.18 6.90 79.79 87,45 6.79 10.65 uu 3 4 1.025 ,653 95.47 92.62 96.60 UL 3 4 1.028 ,656 95.91 92.14 96.10 su 3 4 .933 8.97 ,558 81.58 14.54 10.16 73.81 80.90 16.25 12.13 SL 3 4 .977 3.01 .618 90.35 5.79 80,66 88.40 3.0f
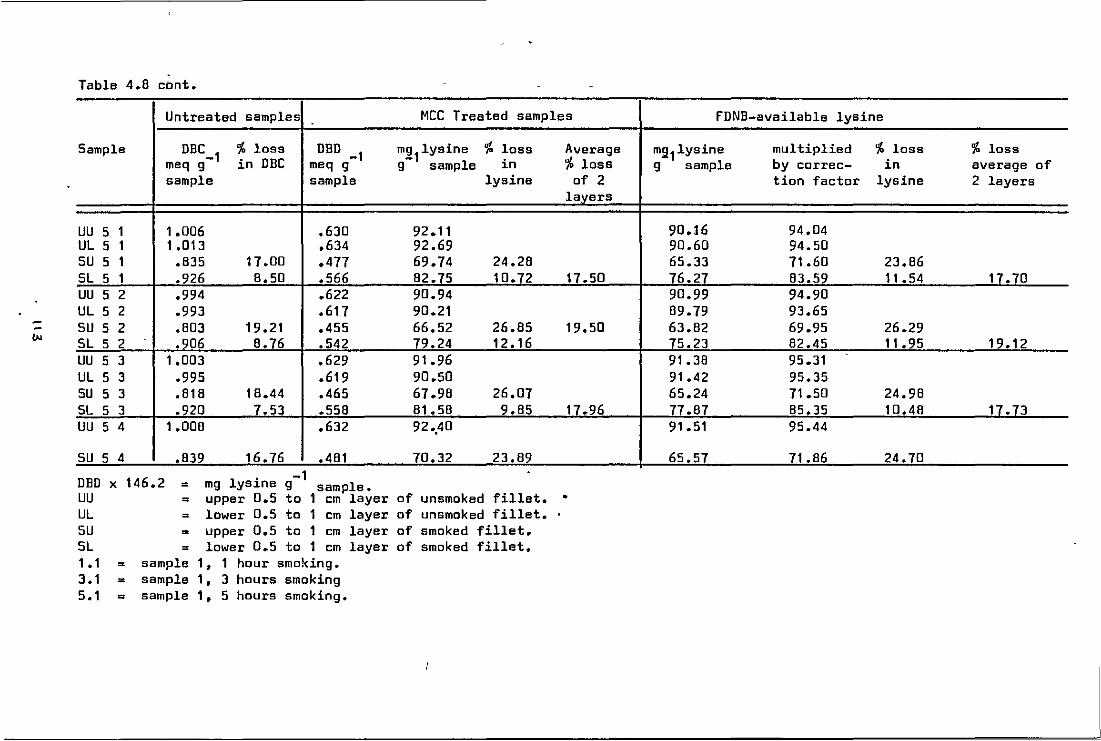
-Table 4.8 cont.
Untreated samples MCC Treated samples
Sample DBC _1
')I; loss DBD -1 m2
11ysine ~ loss Average
meq g in DBC meq g g sample in % loss sample sample lysine of 2
la.vers
uu 5 1 1.006 .630 92.11 UL 5 1 1 .013 .634 92.69 su 5 1 .835 17.00 .477 69.74 24.28 SL 5 1 .926 8.50 .566 82.75 10.72 17.50 uu 5 2 .994 .622 90.94 UL 5 2 .993 .617 90.21 su 5 2 .803 19.21 .455 66.52 26.85 19.50 SL 5 2 .906 8.76 .542 79.24 12.16 uu 5 3 1.003 .629 91.96 UL 5 3 .995 .619 90.50 su 5 3 .818 18.44 .465 67.98 26.07 5L 5 3 .920 7.53 .558 81.58 9.85 17.96 uu 5 4 1.008 .632 92.,40
su 5 4 .839 16.76 .481 70.32 23.89 -1 -
DBD uu UL su SL 1.1 3.1 5.1
x 146.2 = mg lysine g sample. = upper 0.5 to 1 cm layer of unsmoked fillet. •
lower 0.5 to 1 cm layer of unsmoked fillet. = upper 0.5 to 1 cm layer of smoked fillet.
lower 0.5 to 1 cm layer of smoked fillet. sample 1, 1 hour smoking.
= sample 1, 3 hours smoking = sample 1, 5 hours smoking.
FDNB-available lysine
m211ysine multiplied % loss % loss g sample by correc- in average of
tion factor lysine 2 layers
90.16 94.04 90.60 94.50 65.33 71.60 23.86 76.27 83.59 11.54 17.70 90.99 94.90 89.79 93.65 63.82 69.95 26.29 75.23 82.45 11.95 19.12 91.38 95.31 91.42 95.35 65.24 71.50 24.98 77.87 85.35 10.48 17.73 91 .51 95.44
65.57 71.86 24.70

The unsmaked, freeze-dried control fillets showed a DBD
(MCC)-lysine content average of 92.25 mg/g sample while fDNB-
reactive lysine average was 95.06 mg/g sample. Taaley and Lawrie
(1974) showed calculated values of 103.68 mg/g sample and
obtained 94.55 mg/g sample fDNB-lysine (average far fresh and frozen
raw Coley fillets, converted to dry matter basis, assuming BD%
water). This difference might reflect some lass of available
lysine during the acid hydrolysis of the protein or natural
variations.
With the 1 h smoked fillet layers, there is l~ttle lass of
fDNB-available lysine or lysine by dye binding difference (DBD),
giving an average (of the 2 layers of the 3 fillets of 2.71% and
2.97% respectively. Dsner and Johnson (1968) reported that
provided the temperature does not exceed 100°C and the period of
heating is not more than 1 h., there is little damage to protein.
The upper layer of the smoked 1 h Coley fillets showed a greater loss •
than the lower layer reflecting their relative exposure to heat and
smoke.
After 3 h smoking at 115° and at high relative humidity (wetted
mixture of hardwood and saftwaad sawdust was used), there was
significant average loss of 13.95% fDNB-lysine and of 13.98% DBD-
lysine from the upper smoked layers, while the loss from the .. ~ lower layers was relatively small, with lasses of 6.97% fDNB-lys~n~
and 4.61% DBD-lysine. The grand average lasses for bath layers of
4 fillets were 10.46% fDNB-lysine and 9.29% DBD-lysine.
There were large losses of lysine by bath methods with the fillets
- 114-
smoked for 5 h. The top layer showed average losses of 24.95%
FDNB-lysine and 25.27% DBD lysine, while the lower layers showed
average losses of 11.32% FDNB-lysine and 10.91% DBD lysine.
Taking all values' for smoked and unsmoked samples the DBD (MCC)
lysine values correlated well with FDNB-lysine values (r = 0.97
p = 0.01) and regression equat~on obtained is Y = 0.99BX -2.120
where Y = mg FDNB lysine and X = mg DBD (MCC) lysine.
- 115 -
,
4.9.4 Effects of smoke components
Dvorak and Vognarova (1965) suggested that short-time
smoking has no effect on the lysine ava1lability but loss was
evident after exposure to smoke for several hours or days.
They reported that with sausages hot smoked for a short time
(2-3.5 h maximum), the content of available lysine was reduced
by approximately and not more than 20~ and that formaldehyde might
be the most active smoke component in the reactions with the
e-amino group of lysine.
Chen and Issenberg (1972) obtained a loss of 44.5% FDNB
available lysine in 2-3 mm thick lean beef sirloin slices smoked
for 10 h at 65° and in the unsmoked controls, heat-treated for
10 h at 65° samples, a loss of 15.2~ FDNB-lysine was obtained,
clearly showing that loss of available lysine in smoked samples is
not by heat alone and that there is inter-reaction between the
€-amino groups of the protein and the smoke components. Chen and
Issenberg (1972) also showed by the effects of treat1ng meat homo
genate with smoke fractions, that the phenolic and neutral fract1ons
of the smoke components react with the ~-amino groups of the protein
and obtained 45% destruction of fDNB-available lysine by the neutral
fractions, 38% loss by the phenolic fractions and 14% by the acidic
fractions.
In the 5 h smoked samples (section 4.9.3) the greater loss of
available lysine in the surface layer compared with the lower layer
must reflect the interactions between the E -amino groups of lysine
with the smoke components in the su7face layer (see literature
review, section 2.2), while the deeper layers beneath the surface
could have suffered loss of available lysine by heat and drying
- 116-
process with "Maillard" type reactions and protein-protein inter
actions (see section 2.2).
Caurie (1975) smoked butterfish for 24 h at 45° and obtained
42% loss of lysine (for whole fish), and for 24 Hat 120°,
obtained 55.5% loss of lysine (for the whole fish). The African
fish Tilapia lidole, reported by Hoffman ~ al (1977) showed
approximately B% loss of FDNB-lysine in the whole fish tilapia
smoked at 75°, and 9% loss in FDNB-lysine in, the whole fish tilapia
smoked at 100°, both stored under nitrogen, while a sample of
I· lidole traditionally smoked for 4 h with 95° temperature
(recorded in the centre of fish), showed a loss of 6%, Sardinella
aurita, traditionally smoked for 36 h at temperature between 100°
to 112° (in wood fireclay-kilnsl showed 29% loss of FDNB-lysine.
4.9.5 Effect of protein-protein interaction
Carpenter~ al (1962) have shown that the small amount of
free and combined sugar in herring meal made from press cakes,
contribute only a small fraction of the major loss of available
lysine resulting from severe ov7r-heating of fish meal. It is known
that carbonyl-amino browning reactions are not stoichiometr~c, as the
first formed condensation products, after rearrangement or degradation'
can react with further molecules containing either carbonyl or amine
groups but the discrepancy between the amount of active carbonyl
groups available and potential amino acids is too large for this
mechanism to account solely for the loss in available lysine. Hence
other amino acids in side chains must be involved but lysine is
usually the first to be affected (Lea and Hannan 1950).
- 117 -
ford and Shorrock (1971) found 33.7% fall in fDNB-available
lysine with cod heated for 20 h at 135° in air. It must be
remembered that the amount of pentose (ribose), hexose phosphate and
fat in cod is very small and therefore could only amount for a small
part of the loss of lysine. Most of the loss must be from amino
acid cross-linkages in the denatured protein.
Hurrell and Carpenter (1975) obtained in bovine serum albumin,
heated for 8 h at 121°, a loss of 22.0% fDNB-lysine and in. defatted
chicken muscle heated for 2 h at 121°, a loss of 6.04% fDNB-lysine
and for the same defatted chicken muscle heated for 4 h at 121° a
loss of 11.76% fDNB-lysine. The destructive effect of heating
carbonyl or aldehydric groups from glucose or ribose is illustrated
by Hurrel~ and Carpenter (1975) when they heated albumin mix
(ovalbumin-lactalbumin, 3~2 w/w) with glucose for 15 min at 121°
and results showed a large loss of 88.00%.
4.9.6 Effect of fat and prote1n-protein interaction
Lea, Parr and Carpenter (1960) showed the effect of fat oxidation
products on lysine with cod muscle heated for 48 h at 37° w1th
pro pan al.
In the presence of propanal, lysine loss (fDNB-lysine) was about
33% higher than in the control sample to which no propanal was added.
Propanal seemed to react rapidly with dry cod muscle but the effect
was retarded by high moisture content. fresh herring meal and
pre-oxidised herring meal, heated in the laboratory in the absence
of oxygen for 30 h at 105° suffered available lysine losses of 19%
and 27% respectively. and for 30 h at 130°C, losses were 67% and 69%
respectively. Hence at high temperatures, rancid fat contributes
- 118-
significantly to loss of available lysine, One would also expect
the unsaturated lipids in fresh herring to become oxidised rapidly,
thus accounting for similar losses from fresh and rancid herring
samples after a long period of heating.
Tooley and Lawrie (1974) obtained mean loss of 17.9% fDNB
lysine in. fish samples (including Coley fillets) fried for 4 min
at 180° in fresh corn oil, ground nut oil and olive oil and a
greater loss of 28.9% fDNB-lysine when fried for 4 min at 180°
in thermally oxidised oil.
4.9.7 Effect of heating protein at high relative humidity
Miller (1956) reported that fish protein are more readily damaged
at high moisture content. Carpenter, Ellinger, Munro and Rolfe (1957)
obtained approximately 30% loss of available lysine in vacuum-dried
cod fillets brought up t~- 11% moisture, heated for 24 h at 105° in
the air, while a similar set of vacuum-dried cod fillets at 1.7 to
2.3% moisture level, heated for 31 h at 100°, suffered approximately
12% loss of lysine.
Carpenter, Morgan, Lea and Parr (1962) observed approximately
20% loss of lysine in freeze-dried herring press-cake (fat-free basis)
heated at 115° for 27 hat 11.8% moisture level and that for herring 0
press-cake (fat-free basis) heated at 130 for 2 h, amino acid
binding was found to be a maximum in the region of 4-12% moisture
content, while loss of lysine was appreciately less for the very
moist as well as for the driest samples.
Miller, Carpenter and Milner (1965) obtained 69% loss of avail-
able methionine and a similar loss for fDNB-available lysine when they
heated cod fillets at 14% moisture content at 116° for 27 h.
- 119 -
4.9.6 Effect of heating glucose or ribose (aldehyde groups) with proteil'll
Miller, Carpenter and Milner (1965) observed loss of about
15% and 20% FDNB-lysine when cod-glucose mixtures were heated at
45° and 55° respectively for 9 h'and when cod was heated with
10% glucose for 27 h at 65° and 14% moisture level, a loss of
46.5% FDNB-lysine was obtained. With low content of ribose as
in a vacuum-dried cod fillet 1. 7 to 2.3~~ moisture, heated at
100°C for 31 h, loss of lysine was about 12% (Carpenter,
Ell1nger, Munro and Rolfe 1957).
Carpenter, Morgan, Lea and Parr (1962) obtained about O.B
mole of lysine bound' per mole of ribose added, with bovine plasma
albumin heated with ribose at 85° for 1 h, but when heated alone
0 at 85 for 27 h, no detectable loss of lysine was obtained.
4.9.9 Some observations on the colour of the smoked fillets
The fillets smoked for 1 h were very moist and showed a range
of colour from lightly yellowish-brown to light orange-brown. The
top approximately 0.5 to 1 cm surface of fillet flesh was still
very "raw" and approximately 1 cm of the underlying layer was very
like the initial unsmoked fish fillet. The top approximately 0.5 to .
1 cm surface layer of the fillets of 3 h smoking time showed a
darker or deeper range of the colours above, from dark yellow and
orange to light brown and brown colour. The flesh showed signs of
"firming of muscles or having a slightly cooked appearance." The
top surface layer was slightly dry and lower layers still "raw" and
moist with a milky fluid exudate. After 5 h smoking at 115°, the top
- 120
------ ----------------------------
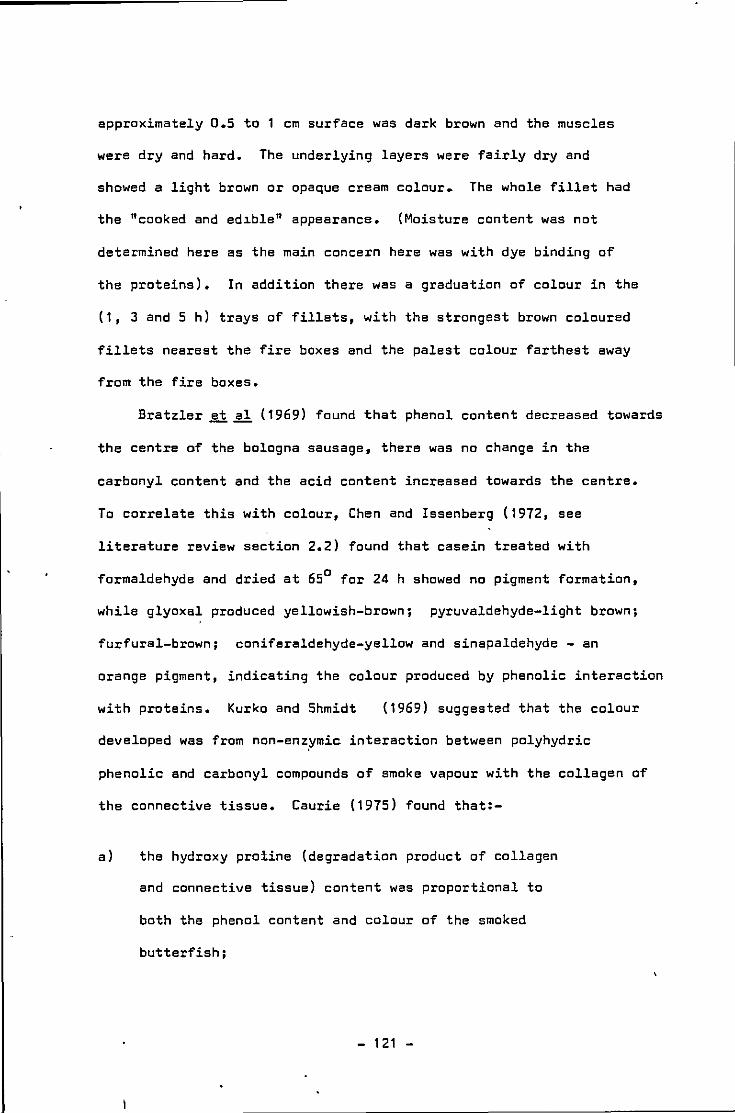
approximately 0.5 to 1 cm surface was dark brown and the muscles
were dry and hard. The underlying layers were fairly dry and
showed a light brown or opaque cream colour. The whole fillet had
the "cooked and ed1.bla" appearance. (Moisture content was not
determined here as the main concern here was with dye binding of
the proteins). In addition there was a graduation of colour in the
(1, 3 and 5 h) trays of fillets, with the strongest brown coloured
fillets nearest the fire boxes and the palest colour farthest away
from the fire boxes.
Bratzler ~ al (1969) found that phenol content decreased towards
the centra of the bologna sausage, there was no change in the
carbonyl content and the acid content increased towards the centre.
To correlate this with colour, Chen and Issenberg (1972, see
literature review section 2.2) found that casein treated with
formaldehyde and dried at 65° for 24 h showed no pigment formation,
while glyoxal produced yellowish-brown; pyruvaldehyde-light brown;
furfural-brown; coniferaldehyda-yellow and sinapaldehyde - an
orange pigment, indicating the colour produced by phenolic interaction
with proteins. Kurko and Shmidt (1969) suggested that the colour
developed was from non-anz.ymic interaction between polyhydric
phenolic and carbonyl compounds of smoke vapour with the collagen of
the connective tissue. Caurie (1975) found that:-
a) the hydroxy proline (degradation product of collagen
and connective tissue) content was proportional to
both the phenol content and colour of the smoked
butterfish;
- 121 -
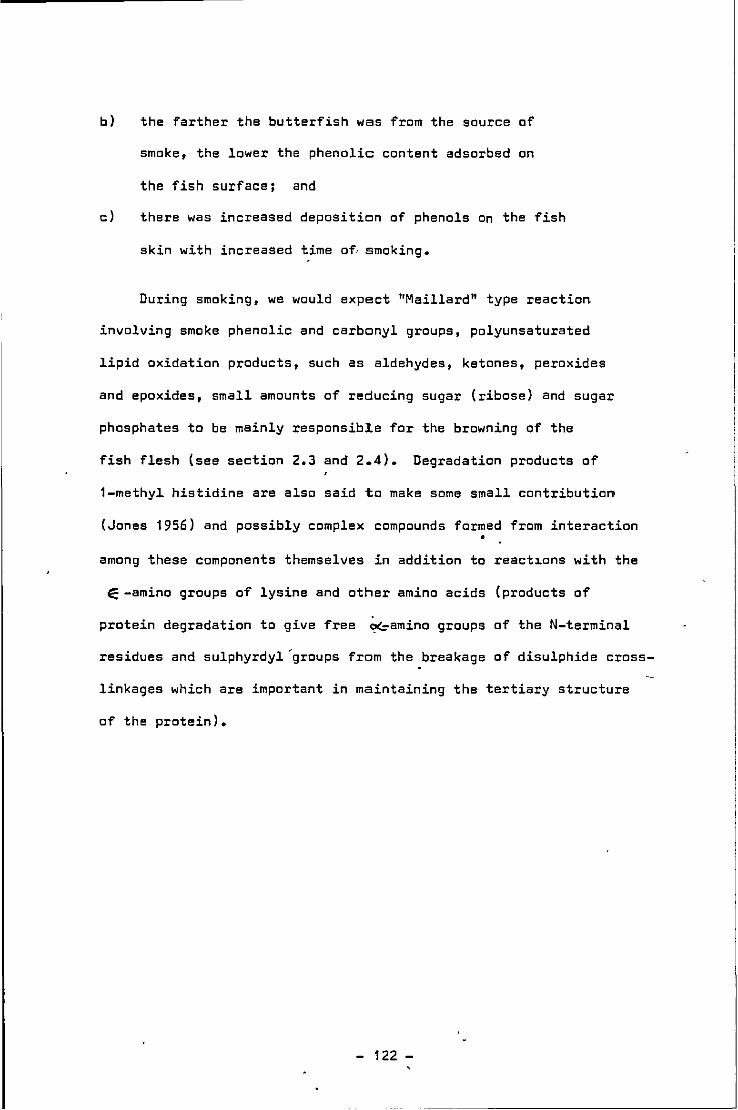
b) the farther the butterfish was from the source of
smoke, the lower the phenolic content adsorbed on
the fish surface; and
cl there was increased deposition of phenols on the fish
skin with increased time of, smoking.
During smoking, we would expect "Maillard" type reaction
involving smoke phenolic and carbonyl groups, polyunsaturated
lipid oxidation products, such as aldehydes, ketones, peroxides
and epoxides, small amounts of reducing sugar (ribose) and sugar
phosphates to be mainly responsib1e for the browning of the
fish flesh (see section 2.3 and 2.4). Degradation products of
1-methyl histidine are also said to make some small contribution
(Jones 1956) and possibly complex compounds formed from interaction •
among these components themselves in addition to react~ons with the
E-amino groups of lysine and other amino acids (products of
protein degradation to give free ~amino groups of the N-terminal
residues and sulphyrdyl 'groups from the breakage of disulphide cross-
linkages which are important in maintaining the tertiary structure
of the protein).
- 122
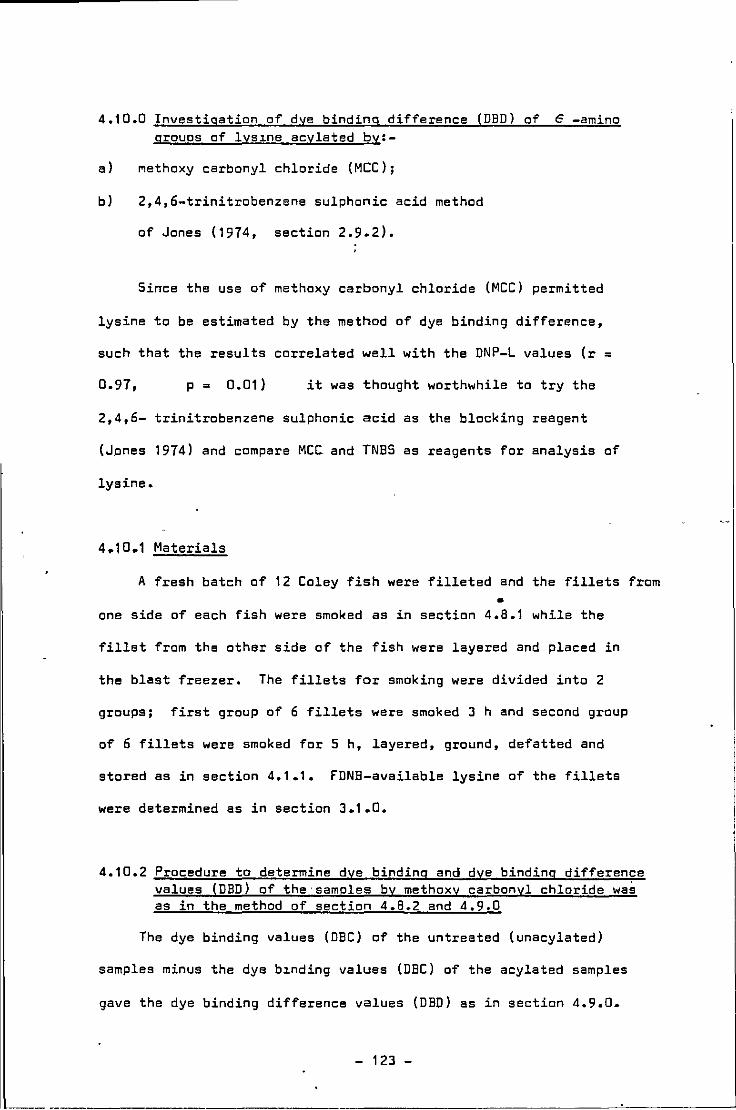
4.10.0 Investigation of dye binding difference (DBD) of e -amino groups of lys1ne acylated by:-
a) Methoxy carbonyl chloride (MCC);
b) 2,4,6-trinitrobenzene sulphonic acid method
of Jones (1974, section 2.9.2).
Since the use of methoxy carbonyl chloride (MCC) permitted
lysine to be estimated by the method of dye binding difference,
such that the results correlated well with the DNP-L values (r =
0.97, p = 0.01) it was thought worthwhile to try the
2,4,6- trinitrobenzene sulphonic acid as the blocking reagent
(Jones 1974) and compare MCC and TNBS as reagents for analysis of
lysine.
4.10.1 Materials
A fresh batch of 12 Coley fish were filleted and the fillets from •
one side of each fish were smoked as in section 4.8.1 while the
fillet from the other side of the fish were layered and placed in
the blast freezer. The fillets for smoking were divided into 2
groups; first group of 6 fillets were smoked J h and second group
of 6 fillets were smoked for 5 h, layered, ground, defatted and
stored as in section 4.1.1. FDNB-available lysine of the fillets
were determined as in section 3.1.0.
4.10.2 Procedure to determine dye binding and dye binding difference values (DBD) of the'samples by methoxy carbonyl chloride was as in the method of section 4.8.2 and 4.9.0
The dye binding values (DBC) of the untreated (unacylated)
samples minus the dye b1nding values (DBC) of the acylated samples
gave the dye binding difference values (DBD) as in section 4.9.0.
- 123 -
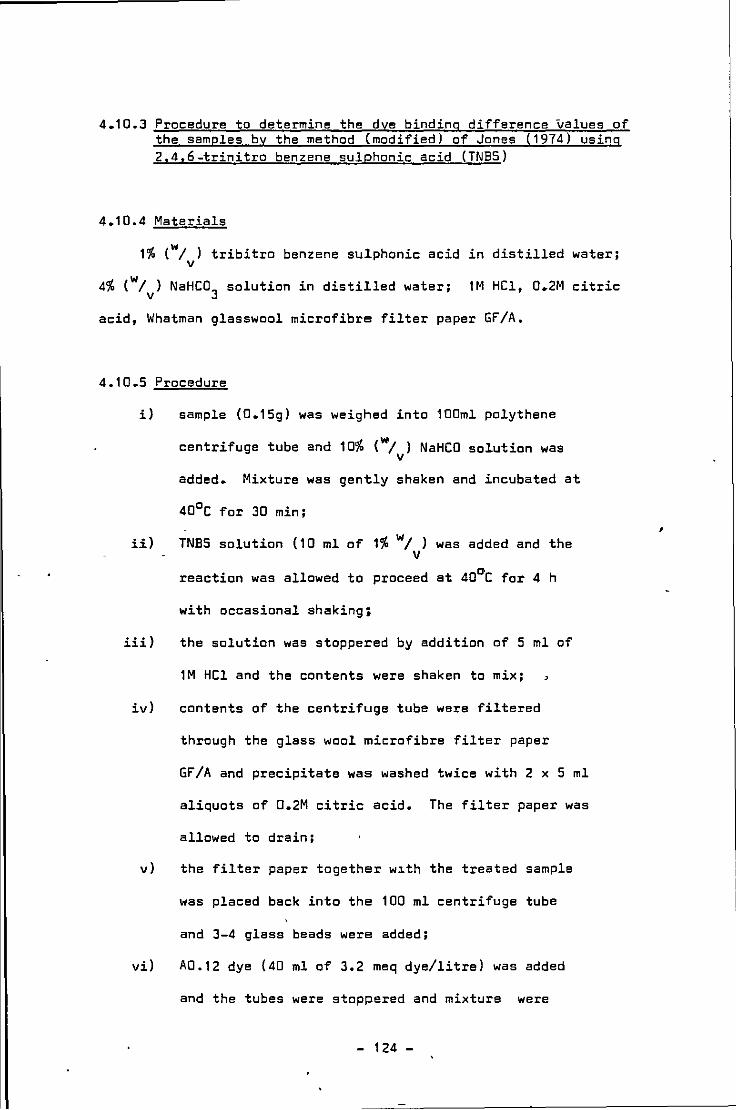
4.10.3 Procedure to determine the dye binding difference values of the samples by the method (modified) of Jones (1974) using 2.4,6-trinitro benzene sulphonic acid (TNBS)
4.10.4 Materials
1% (w/ ) tribitro benzene sulphonic acid in distilled water; V
4% (w/v) NaHC03
solution in distilled water; 1M HCl, 0.2M citric
acid, Whatman glasswool microfibre filter paper GF/A.
4.10.5 Procedure
i) sample (0.15g) was weighed into 100ml polythene
centrifuge tube and 10% (w/ ) NaHCO solution was V
added. Mixture was gently shaken and incubated at
40°C for 30 min;
ii) TNBS solution (10 ml of 1% w/ ) was added and the V
reaction was allowed to proceed at 40°C for 4 h
with occasional shaking;
iii) the solution was stoppered by addition of 5 ml of
1M HCl and the contents were shaken to mix;
iv) contents of the centrifuge tube were filtered
through the glass wool microfibre filter paper
GF/A and precipitate was washed twice with 2 x 5 ml
aliquots of 0.2M citric acid. The filter paper was
allowed to drain;
v) the filter paper together w~th the treated sample
was placed back into the 100 ml centrifuge tube
and 3-4 glass beads were added;
vi) A0.12 dye (40 ml of 3.2 meq dye/litre) was added
and the tubes were stoppered and mixture were
- 124-
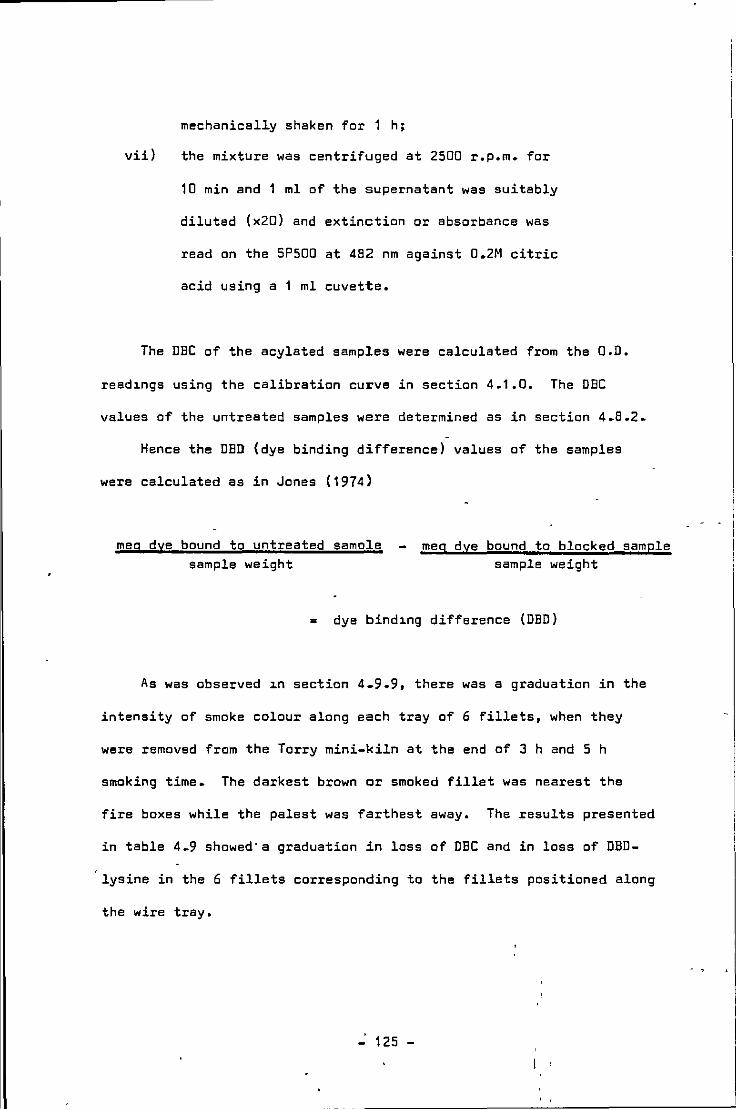
mechanically shaken for 1 h;
vii) the mixture was centrifuged at 2500 r.p.m. for
10 min and 1 ml of the supernatant was suitably
diluted (x20) and extinction or absorbance was
read on the SP500 at 482 nm against 0.2M citric
acid using a 1 ml cuvette.
The DBC of the acylated samples were calculated from the O.D.
read1ngs using the calibration curve in section 4.1.0. The DBC
values of the untreated samples were determined as in section 4.8.2.
Hence the DBD (dye binding difference) values of the samples
were calculated as in Jones (1974)
meg dye bound to untreated sample sample weight
meg dye bound to blocked sample sample weight
= dye bind1ng difference (DBD)
As was observed 1n section 4.9.9, there was a graduation in the
intensity of smoke colour along each tray of 6 fillets, when they
were removed from the Terry mini-kiln at the end of 3 h and 5 h
smoking time. The darkest brown or smoked fillet was nearest the
fire boxes while the palest was farthest away. The results presented
in table 4.9 showed' a graduation in loss of DBC and in loss of DBD-
lysine in the 6 fillets corresponding to the fillets positioned along
the wire tray.
- 125 -
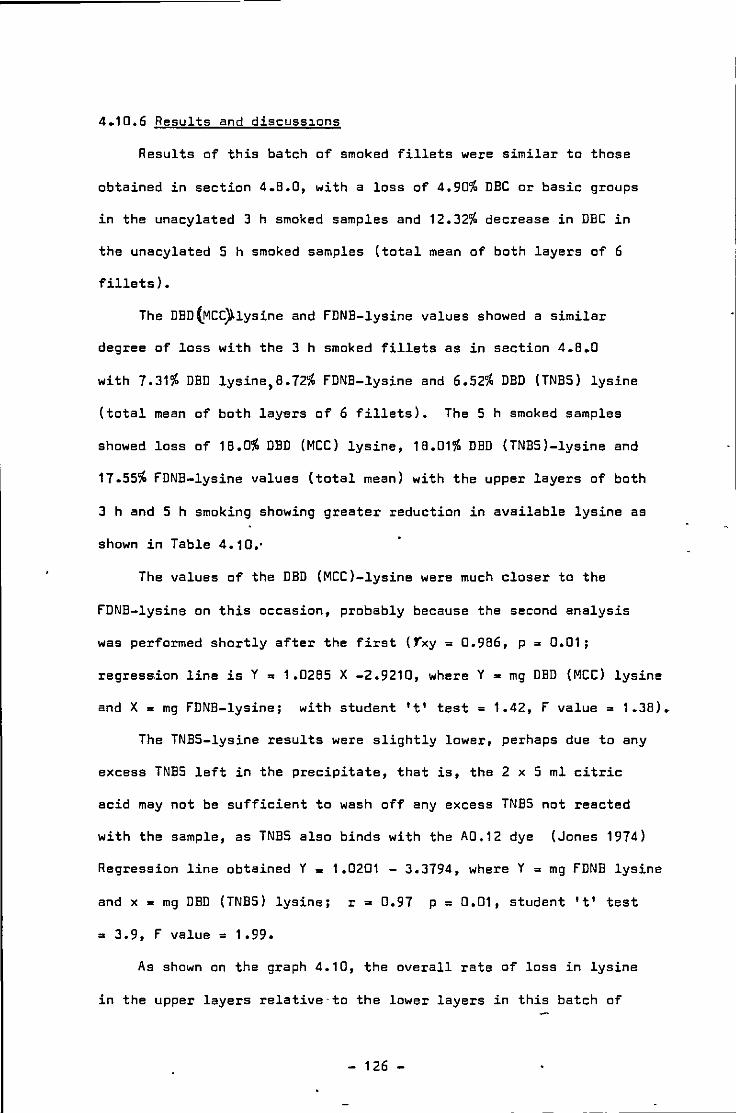
4.10.6 Results and discuss1ons
Results of this batch of smoked fillets were similar to those
obtained in section 4.8.0, with a loss of 4.90% DBC or basic groups
in the unacylated 3 h smoked samples and 12.32% decrease in DBC in
the unacylated 5 h smoked samples (total mean of both layers of 6
fillets).
The DBD(MCC)lysine and FDNB-lysine values showed a similar
degree of loss with the 3 h smoked fillets as in section 4.8.0
with 7.31% DBD lysine,8.72% FDNB-lysine and 6.52% DBD (TNBS) lysine
(total mean of both layers of 6 fillets). The 5 h smoked samples
showed loss of 18.0% DBD (MCC) lysine, 18.01% DBD (TNBS)-lysine and
17.55% FDNB-lysine values (total mean) with the upper layers of both
3 h and 5 h smoking showing greater reduction in available lysine as
shown in Table 4.10.·
The values of the DBD (MCC)-lysine were much closer to the
FDNB-lysine on this occasion, probably because the second analysis
was performed shortly after the first (Yxy ~ 0.986, p ~ 0,01;
regression line is Y ~ 1.0285 X -2.9210, where Y 2 mg DBD (MCC) lysine
and X= mg FDNB-lysine; with student 't' test= 1.42, F value= 1.38).
The TNBS-lysine results were slightly lower, perhaps due to any
excess TNBS left in the precipitate, that is, the 2 x 5 ml citric
acid may not be sufficient to wash off any excess TNBS not reacted
with the sample, as TNBS also binds with the A0.12 dye (Jones 1974)
Regression line obtained Y = 1.0201 - 3.3794, where Y = mg FDNB lysine
and x = mg DBD (TNB5) lysine; r = 0.97 p = 0,01, student 't' test
= 3.9, F value= 1.99.
As shown on the graph 4.10, the overall rate of loss in lysine
in the upper layers relative-to the lower layers in this batch of
- 126 -
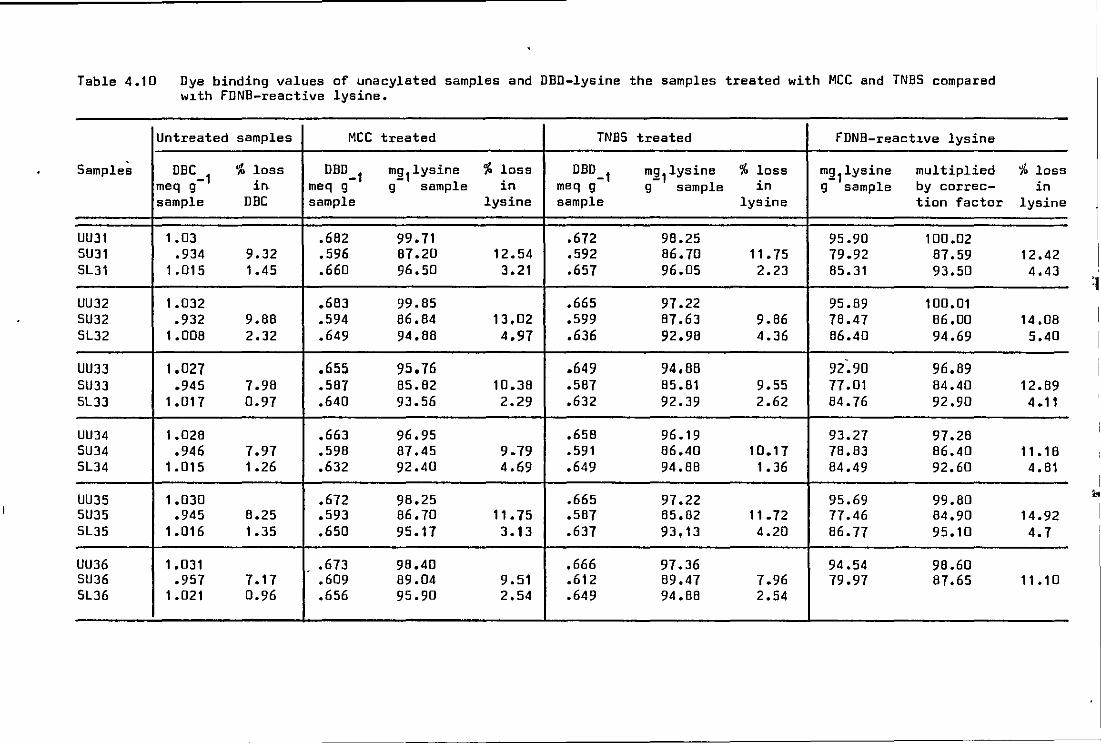
Table 4.10 Dye binding values of unacylated samples and DBD-lysine the samples treated with MCC and TNBS compared w1th FDNB-reactive lysine.
Untreated samples MCC treated TNBS treated FDNB-react1ve lysine
Sample~ DBC _1
% loss DBD_1 mlh lysine "/. loss DBD_1 m211ysine "/. loss m2 11ysine multiplied meq g in, meq g g sample in meq g g sample in g sample by correc-sample DBC sample lysine sample lysine tion factor
UU31 1.03 .662 99.71 .672 96.25 95.90 100.02 SU31 .934 9.32 .596 67.20 12.54 .592 66.70 11.75 79.92 67.59 SL31 1 • 015 1.45 .660 96.50 3.21 .657 96.05 2.23 65.31 93.50
UU32 1 .032 .663 99.65 .665 97.22 95.69 100.01 SUJ2 .932 9.66 .594 66.64 13,02 ,599 67,63 9.66 76.47 66,00 SL32 1.006 2.32 .649 94,66 4.97 .636 92.96 4.36 66.40 94.69
UU33 1,027 .655 95.76 .649 94.88 92~90 96,89 SU33 .945 7.96 .567 65.62 10.36 .567 65.61 9.55 77.01 64.40 SL33 1.017 0.97 .640 93.56 2.29 ,632 92.39 2.62 84.76 92.90
UU34 1.026 .663 96.95 .656 96.19 93.27 97.28 SU34 .946 7.97 .596 67.45 9.79 .591 66.40 10.17 76.63 86.40 SL34 1.015 1.26 .632 92.40 4.69 .649 94.88 1.36 84.49 92.60
UU35 1.030 .672 96.25 .665 97.22 95.69 99.60 SU35 .945 8.25 .593 86.70 11.75 .567 65.82 11.72 77.46 84.90 SL35 1.016 1.35 .650 95.17 3.13 .637 93,13 4.20 66.77 95.10
UU36 1 .031 .673 96.40 .666 97.36 94.54 98.60 SU36 .957 7.17 .609 69.04 9. 51 .612 69.47 7.96 79.97 67.65 SLJ6 1 .021 0.96 .656 95.90 2.54 .649 94.66 2.54
'}b loss in
lysine
12.42 4.43
14.06 5.40
12.89 4.11
11 • 18 4. 81
14.92 4.7
11.10
~
I
I
i
lo
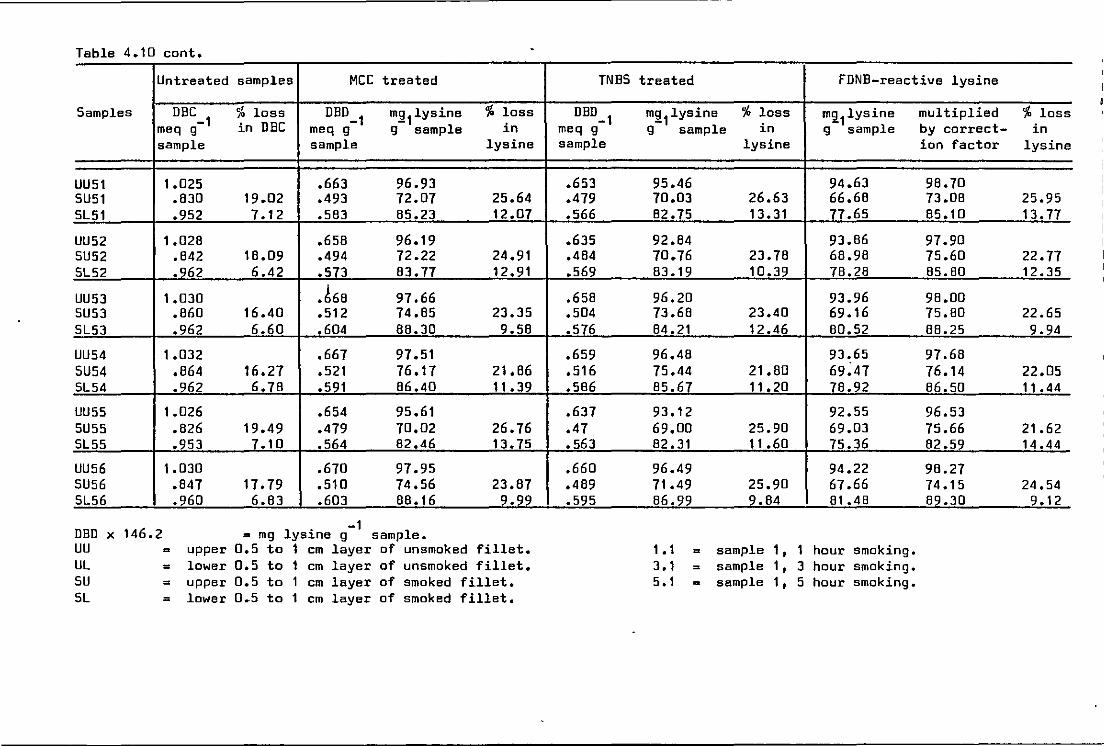
Table 4.10 cont.
Untreated samples MCC treated TNBS treated FDNB-reactive lysine
Samples DBC % loss DBD_1 ml! 1lysine % loss DBD_1 ml! 1lysine % loss m!i[1lysine multiplied % loss -1 meq g in DBC meq g g sample in meq g g sample in g sample by correct- in
sample sample lysine sample lysine ion factor lysine
UU51 1 .025 .663 96.93 .653 95.46 94.63 98.70 SU51 .830 19.02 .493 72.07 25.64 .479 70.03 26.63 66.68 73.08 25.95 SL51 .952 7.12 .583 85.23 12.07 .566 82.75 13.31 77.65 85.10 13.77
UU52 1.028 .658 96.19 .635 92.84 93.86 97.90 SU52 .842 18.09 .494 72.22 24.91 .484 70.76 23.78 68.98 75.60 22.77 SL52 .962 6.42 .573 83.77 12.91 .569 83.19 10.39 78.28 85.80 12.35
UU53 1.030 j68 97.66 .658 96.20 93.96 98.00 SU53 .860 16.40 .512 74.85 23.35 .504 73.68 23.40 69.16 75.80 22.65 SL53 .962 6.60 .604 88.30 9.58 .576 84.21 12.46 80.52 88.25 9.94
UU54 1 .032 .667 97.51 .659 96.48 93.65 97.68 5U54 .864 16.27 .521 76.17 21.86 .516 75.44 21.80 69:47 76.14 22.05 SL54 .962 6.78 .591 86.40 11 .39 ,586 85.67 11.20 78.92 86.50 11.44
UU55 1.026 .654 95.61 .637 93.12 92.55 96.53 SU55 .826 19.49 .479 70.02 26.76 .47 69,00 25.90 69.03 75.66 21.62 SL55 .953 7.10 .564 82.46 13.75 • 563 82.31 11.60 75.36 82.59 14.44
UU56 1.030 .670 97.95 .660 96.49 94.22 98.27 SU56 .847 17.79 .510 74.56 23.87 .489 71 .49 25.90 67.66 74.15 24.54 SL56 .960 6.83 .603 88.16 9.99 .595 86.99 9.84 81 .48 89.30 9.12
DBD X 146.2 = mg lysine g -1 sample.
uu = upper 0,5 to 1 cm layer of unsmoked fillet, 1 • 1 = sample 1 , 1 hour smoking. UL = lower 0,5 to 1 cm layer of unsmoked fillet, 3.1 = sample 1 , 3 hour smoking. su = upper 0.5 to 1 cm layer of smoked fillet, 5. 1 = sample 1 , 5 hour smoking. 5L = lower 0.5 to 1 cm layer of smoked fillet,

smoked fillets were similar to the first batch of smoked fillets
(section 4.8.0) with very high initial rate of lysine loss in the
first 3-4 has the surface muscle f-amine groups of lysine bind
with the smoke components etc (see section 4.8.0).
Gradually the rate decreased as the level of available lysine
fell (Bjarnason and Carpenter 1970). The rate of loss of lysine
in the deeper layers initially rose slowly and showed an 1ncrease
in rate when heated beyond 3 hours, that is, when the internal
temperature of the fillet rose.
As was observed in section 4.8.0, the smoke and heat distribution
in the Tarry mini-kiln was not uniform. The fillets nearest the 3
fire boxes suffered more smoke, heat and drying damage than the
fillets farthest away from the fire boxes.
- 127-
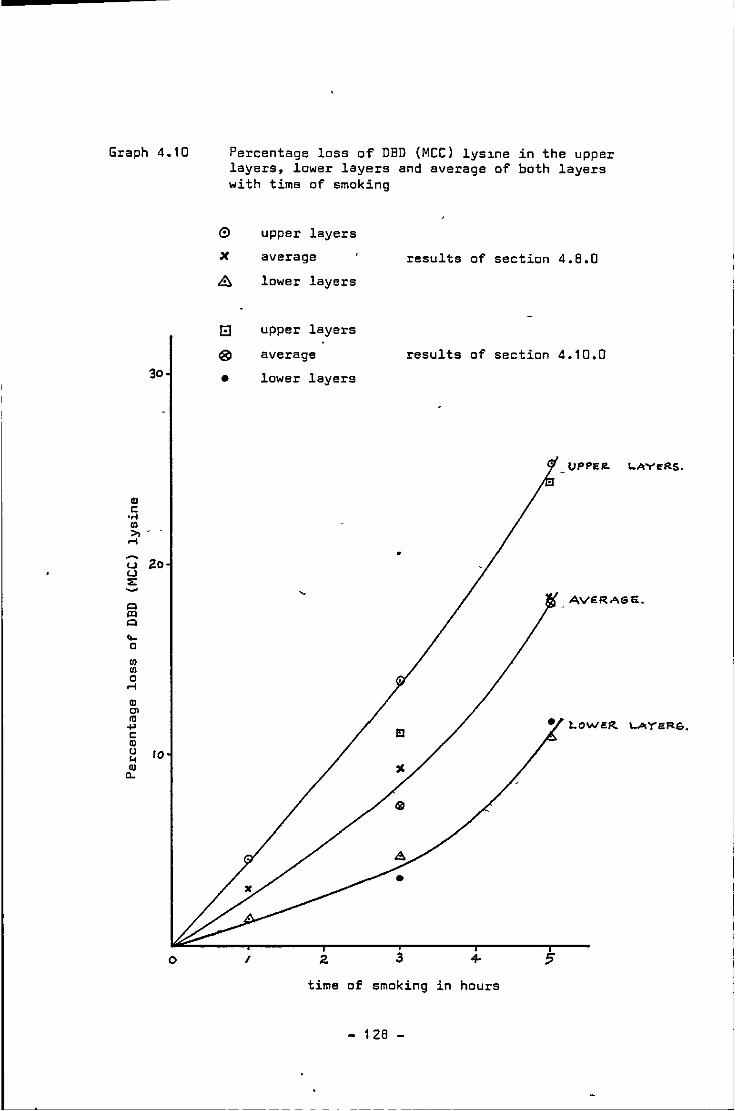
Graph 4.10
30
u 2o u ::;:
"' "" "' ... 0 ., ., 0
.....
" o> t1! ... c:
" u ... " 0..
10
0
Percentage loss oT DBD (MCC) lys~ne in the upper layers, lower layers and average of both layers with time of smoking
0 upper layers
X average results of section 4.8.0
~ lower layers
El upper layers
® average results of section 4.10.0
• lower layers
AV£RA6£.
e t.OWER I...A"J""ER& •
"
I + time of smoking in hours
- 128 -
---_________________ _j
'
4.11.0 General discuss2ons
The investigations here have been concerned pr2marily with the
feas2bility of dye binding procedures far the evaluation of lysine
content or protein quality in smoked fish. These investigations
have shown that dye b2nding can be applied to smoked fish.
From the results obtained, it has been found that acid aza
orange 12 dye should be used at 4.0 meq/litre and a dye:pratein
ratio of 0.38 .for the untreated samples and at 3.2 meq/litre for
the acylated samples. Comparison of the results in section 4.7.0
and 4.4.0 indicate that it is essential to have sufficient dye to
saturate the basic groups. The effects of smoked components and of
proteolysis during smoking on dye binding properties have been
investigated and it can be concluded that under the conditions
employed, neither caused significant interference. However very
high levels of smoke components in re~ation to dye (hence diethyl
ether extraction of smoked fish is necessary) or severe proteolysis
could interfere.
The results obtained far DBC and DBD (both by methaxy carbonyl
chloride and 2,4,6 trinitro benzene sulphonic acid) have been compared
with the established Carpenter's (1960) method, and it was observed
that smoke components interfere with the recovery of the dinitro-
phenylated lysine. However provided an allowance was made for this,
it was observed that a change in DBC (an estimation of histidine,
lysine and arginine) was parallaled by a change in the available
lysine by Carpenter's Method. (r ~ 0.968, p = 0.01). Lys2ne xy
estimated by DBD using methoxy carbonyl chloride (MCC) as blocking
agent was statistically indistinguishable from lysine estimated by
Carpenter's Method (F value= 1.37; Student 't' test= 1.42; r = xy
0.974 and p = 0.01). The use of 2,4,6-tr2n2tro benzene sulphonic acid
- 129 - '
as blocking agent gave a sl~ghtly lower lysine content than either
MCC or Carpenter's Method but the cause of this discrepancy was not
investigated.
Analysis of smoked fish showed that the lysine loss and the
total basic amino acid loss was progressive and concentrated in
the outer layer. Losses of up to 25.27% were observed in the most
exposed sections of the fillet, whereas the layer immed~ately below
did not exceed 14.44%. It follows, therefore, that the overall
reduction in N.P.U. will decrease as the fish fillet (or steak or
whole fish) thickness increases. Provided that the thicker material
can be adequately preserved, it follows that there are nutritional
advantages in using thicker raw material for smoking.
Dye binding procedure used to estimate the basic amino acids and
lysine content in a sample of animal or plant origin have the
advantages of being low cost, rapid throughput of samples to be
analysed and good reproducibility of results, compared to the more
laborious method of determining available lysine by the 1-fluoro-
2,4-dinitro benzene or the amino-analysis. The major problem in dye
binding with AD.12 dye (as w~th other methods is the var~ation in the
raw materials, particularly fish (which is affected by seasonal
variations, physiological conditions, species var~ation etc.).
- 130 -
4.11.1 Conclusion
1) lys1ne in smoked and unsmoked f1sh can be estimated
using acid orange 12 dye and methoxy carbonyl chlor1de
as the blocking reagent;
2) smoke damage in the fish fil~ets is substantially greater
at the surface than the centre and to minimise destruction
of lysine, thick fillets or whole fish should be used;
3) recovery of dinitro phenylated lysine in Carpenter's
method (1960) is affected by smoke components.
4.12.0 -Suggestions for Future Work
The dye binding procedures developed in this investigation
should be used to investigate more fully the effects of smoking
upon the available lysine content of smoked foods. There is a
need for more information about the behaviour of smoke components
and their reactivity with lysine and their generation and
deposition under different conditions of smoking. Such information
might permit lysine loss to be minimised while producing an
acceptable and stable product.
- 13f-
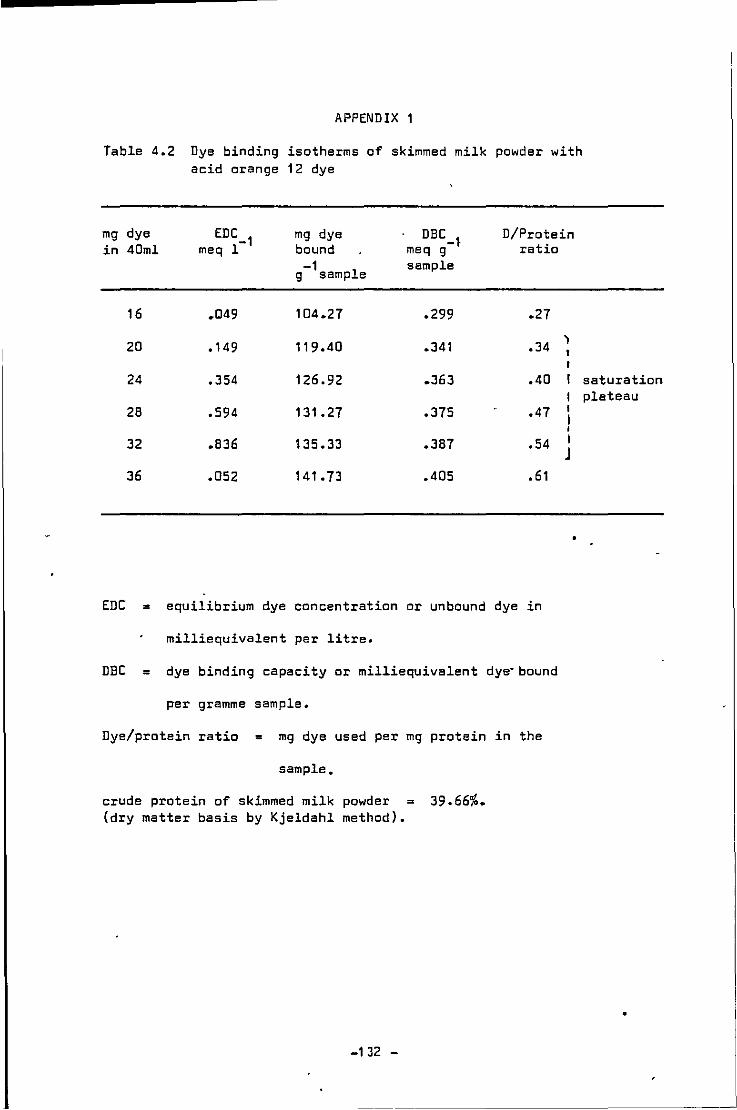
APPENDIX 1
Table 4.2 Dye binding isotherms of skimmed milk powder with acid orange 12 dye
mg dye EDC_ 1 mg dye DBC_1 D/Protein
in 40ml meq 1 bound meq g ratio -1 g sample
sample
16 .049 104.27 .299 .27
20 .149 119.40 .341 .34
24 .354 126.92 .363 .40
28 .594 131.27 .375 .47
32 .836 135.33 .387 .54
36 .052 141.73 .405 .61
EDC = equilibrium dye concentration or unbound dye in
milliequivalent per litre.
DBC = dye binding capacity or milliequivalent dye·bound
per gramme sample.
Dye/protein ratio = mg dye used per mg protein in the
sample.
crude protein of skimmed milk powder (dry matter basis by Kjeldahl method).
-132 -
39.66%.
)
I I I I
I J
saturation plateau
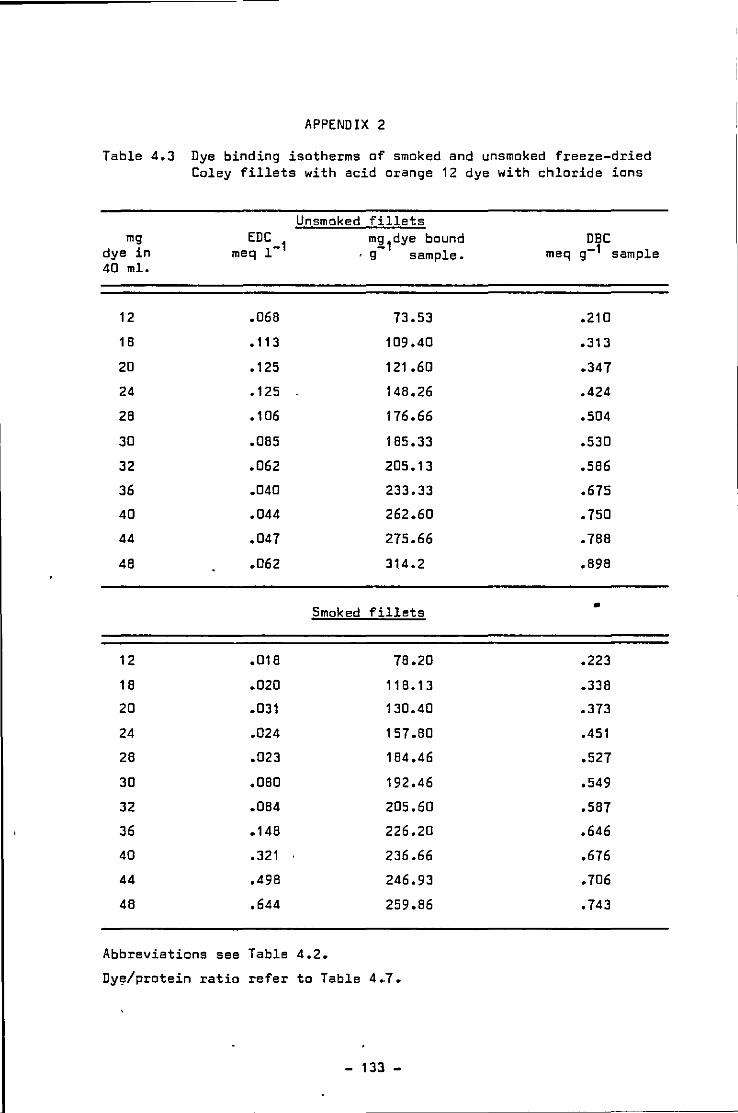
APPENDIX 2
Table 4.3 Dye binding isotherms of smoked and unsmoked freeze-dried Coley fillets with acid orange 12 dye with chloride ions
Unsmoked fillets mg EDC _
1 mg1dye bound dye in meq 1 · g sample. 40 ml.
12 .068 73.53
18 • 113 109.40
20 .125 121 .60
24 .125 148.26
28 .1 06 176.66
30 .085 185.33
32 .062 205.13
36 .040 233.33
40 .044 262.60
44 .047 275.66
48 .062 314.2
Smoked fillets
12 .018 78.20
18 .020 118.13
20 .031 130.40
24 .024 157.80
28 .023 184.46
30 .080 192.46
32 .084 205.60
36 .148 226.20
40 .321 236.66
44 .498 246.93
48 .644 259.86
Abbreviations see Table 4.2.
Dy~/protein ratio refer to Table 4.7.
- 133-
DBC meq g-1 sample
.210
.313
.347
.424
.504
.530
.586
.675
.750
.788
.898
•
.223
.338
.373
.451
.527
.549
.587
.646
.676
.706
.743
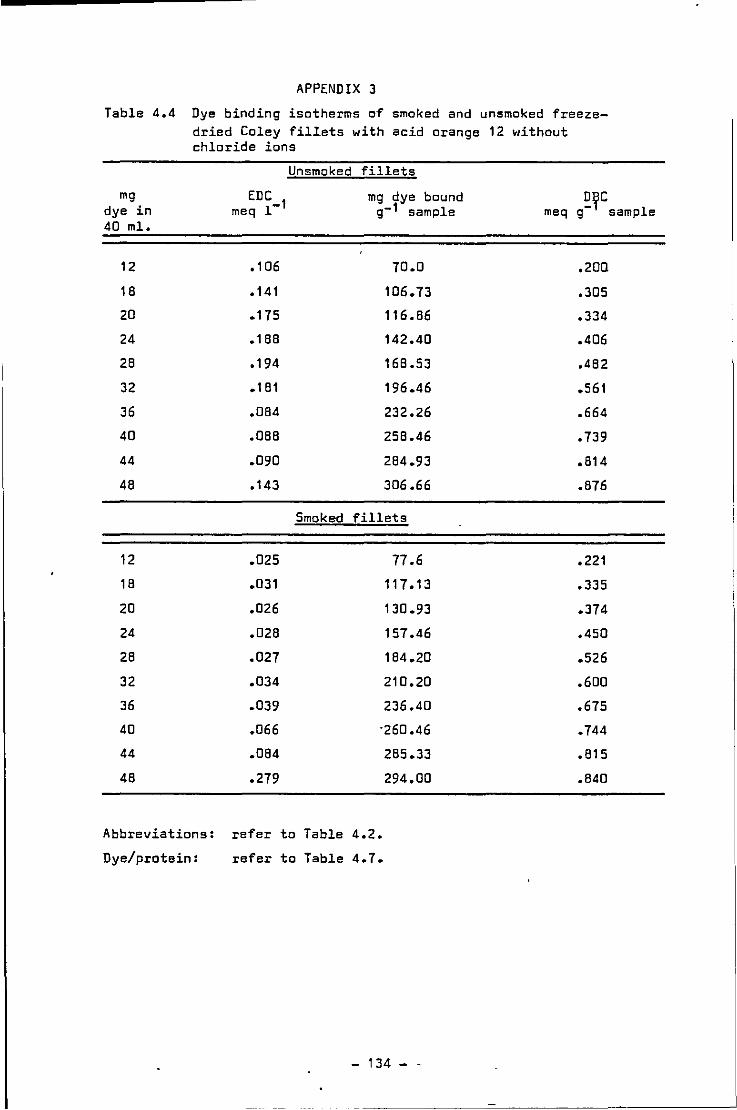
APPENDIX 3
Table 4.4 Dye binding isotherms of smoked and unsmoked freeze-dried Coley fill.ets with acid orange 12 without chloride ions
Unsmoked fillets
mg EDC _1 mg dye bound D~C
dye in meq 1 g-1 sample meq g- sample 40 m!.
12 .1 06 70.0 .200
18 .141 106.73 .305
20 .175 116.86 .334
24 .188 142.40 .406
28 .194 168.53 .482
32 .181 196.46 .561
36 .084 232.26 .664
40 .088 258.46 .739
44 .090 284.93 .814
48 .143 306.66 .876
Smoked fillets
12 .025 77.6 .221
18 .031 117.13 .335
20 .026 130.93 .374
24 .028 157.46 .450
28 .027 184.20 .526
32 .034 210.20 .600
36 .039 236.40 .675
40 .066 •260 .46 .744
44 .084 285.33 .815
48 .279 294.00 .840
Abbreviations: refer to Table 4.2.
Dye/protein: refer to Table 4.7.
- 134 - ~
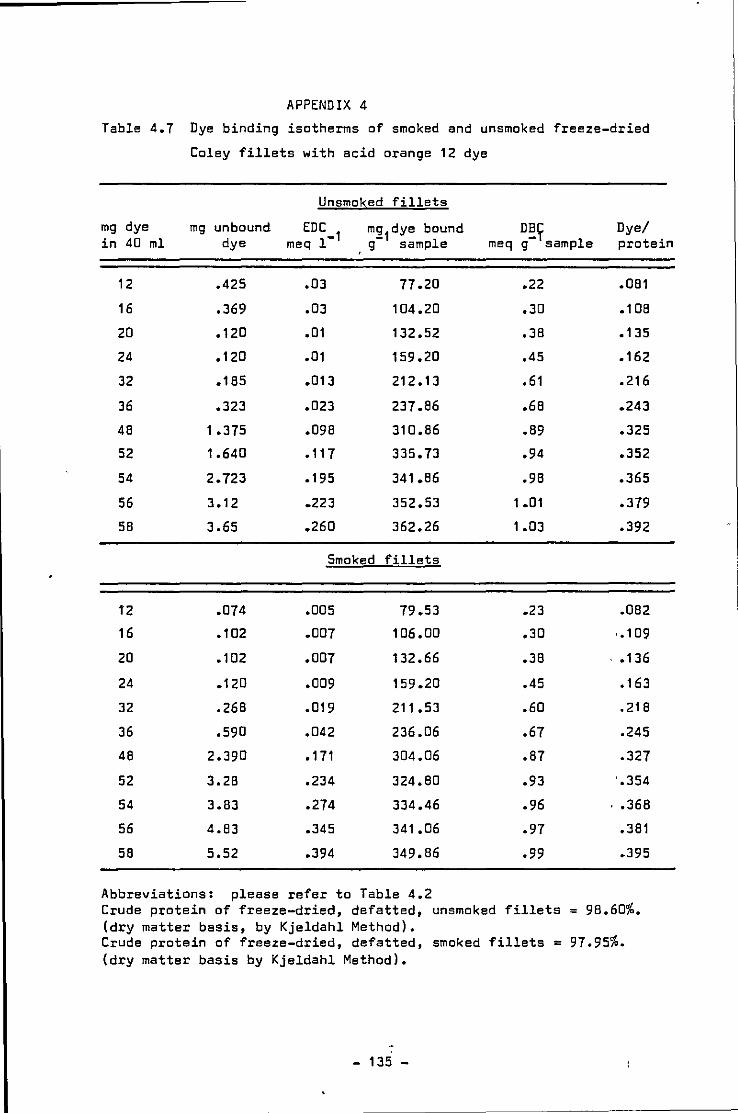
APPENDIX 4
Table 4.7 Dye binding isotherms of smoked and unsmoked freeze-dried
Coley fillets with acid orange 12 dye
mg dye in 40 ml
12
16
20
24
32
36
48
52
54
56
58
12
16
20
24
32
36
48
52
54
56
58
mg unbound dye
.425
.369
.120
.120
.185
.323
1 .375
1.640
2.723
3.12
3.65
.074
.1 02
.1 02
.120
.268
.590
2.390
3.28
3.83
4.83
5.52
Unsmoked fillets
EDC _1 meq 1
.03
.03
.01
.01
.013
.023
.098
.117
.195
.223
.260
m21dye bound
g sample
77.20
104.20
132.52
159.20
212. 13
237.86
310.86
335.73
341.86
352.53
362.26
Smoked fillets
.DOS
.007
.007
.009
.019
.042
• 171
.234
.274
.345
.394
79.53
106 .oo 132.66
159.20
211 • 53
236.06
304.06
324.80
334.46
341.06
349.86
Abbreviations: please refer to Table 4.2
D~l meq g sample
.22
.30
.38
.45
.61
.68
.89
.94
.98
1 .01
1.03
.23
.30
.38
.45
.60
.67
.87
.93
.96
.97
.99
Dye/ protein
.081
.1 08
.135
.162
.216
.243
.325
.352
.365
.379
.392
.• 082
.• 1 09
.• 136
.163
.218
.245
.327
.• 354
.• 368
• 381
.395
Crude protein of freeze-dried, defatted, unsmoked fillets = 98.60%. (dry matter basis, by Kjeldahl Method). Crude protein of freeze-dried, defatted, smoked fillets = 97.95%. (dry matter basis by Kjeldahl Method).
-- 135 -
References
Abrams A., Lowry, P.H. and Borsooh, H. (1955). "Preparation of 1-amino-1-deaxy-2-keto
hexoses from aldohexoses and amino ac1.ds." J., Am. Chem. Sac. 77, 4 794.
Anantharaman K. and Carpenter K.J. (1971). "Effects of heat processing on the Nutritive value of groundnut products." II IndJ.vidual Amino acids. J. Sci. fd. Agric. 1£, 412.
Anet E.f.L.J. (1960). "Degradation of carbohydrates I. Isolation of 3-deaxy hexosones". Aust. J. Chem. 1}, 396.
Anet.E.f.L.J. (1964). 3-deoxy glycosuloses (3-deoxy glycosones) and the degradation of carbohydrate." Advan. Carbohyd. Chem. 1.2., 181.
Ashworth, U.S., Seals R. and Erb R.E. (1910). "An improved procedure for the determination of milk proteins by dye binding." J. Dairy Sci. 43 (5). 614.
Ashworth, U.S. (1961 ). The choice of a primary standard for-the determination of milk protein by the dye binding method. J. Dairy Sci. 44, ( 6) , 1162.
Ashworth, U.S. and Chandry, M.A. (1962). "Dye binding capacity of milk proteins for amid a black 1 DB and Orange G." J. Dairy Sci. ~. 952-957.
Ashworth, U.S. (1966). "Determination of protein in dairy products by dye binding." J. Dairy Sci. ,!2_, (3) 133-137.
Ashworth U.S. (1971). "Protein in meat and eggs determined by dye binding." J. fd. Sci. ].§. (3) 509.
Ashworth, U.S. (1971). "Relation between the nutritive value of food proteins and their dye binding capacity." J. Dairy Sci. 2!, 752.
Asquith, R.S., Dtterburn, M.S., Buchanan J.H., Cole M., fletcher, J.C. and Gardner, K.L. (1970). Biochem. Biophys. Acta, ~. 342-348.
- 136 -
•
Bab, H., Matuno, N. and Nhzekis (1964). Cited Lakin, A.L. (1973) 179-193. "In Proteins in Human Nutrition (J.W. Porter and B.A, Rolls ed.) Acad. Press Lond.-NYP.
Baba, H. (1960). Annual report Institute of Nutrit~on, Tokyo, p.40.
Baily K. (1957). B~ochimica Biophysica Acta 24, 612.
Bate-Smith, E.C. (1948). "The Physiology and chem. of rigor mortis with specl.al reference to aging of beef," Fd. Res. J., 1.
Bird, J.'<I.C., Berg, T, Lysosomal enzymes in aquatic species.1. Distribution of particle properties of muscle lysosomes of the goldfish. Camp. Biochem, Physiol, 1Q, 457.
Bissett, H.M. and Tarr, H.L.A. (1954). Poultry Science, }1, 250.
Bjarnason, J. and Carpenter, K.J. (1970). "Mechnnism of heat damage in Proteins. 2. Chemical changes in pure proteins." Er, J. Nutr. l,.1 313-329.
Booth V.H. (1971). "Problems in the determination of FDNB available lysine." J. Sci, Fd. Agric, 1£, 658-665.
Boyne, A.W., Carpenter K.J. and Woodham A,A, (1961). Progress Report on an assessment of laboratory procedures suggested as indicators of protein quality in feeding stuffs. J, Sci. Fd. Agn 1£, 832-847.
Bratzler, L.J, and Harper, R.G. (1968). Proc, Europ Meeting Meat Res. Workers .!.!, 630.
Bratzler, L.J., Spooner, M.E., Weatherspoon, J.B. and Maxey, J.A. (1969). Smoke flavour as related to phenol. carbonyl and acid content of bologna." J. Fd. Sci. ].!, 146-148.
Bruno, D. and Carpenter, K.J. (1957). "A modifl.ed procedure for the estimat1on of available lysine in food protel.ns." Biochem. J, .§.!., 13 p.
- 137 -
Bunyan, J, and Price, S.A. (1960), nStudies on protein concentrates for animal feeding." J. Sci. Fd, Agric. Jl, 25-37.
Bunyan, J, and Woodham, A.A. (1964). "ProteJ.n quality of feeding stuffs - 2" Br. J. Nutr • .!..§., 537-544.
Buraczewski, 5, (1966). "Factors affectJ.ng amino acid levels in the blood." Ph.D. Thesis University of Reading.
Buraczewski, 5. Buraczewska, L, and Ford, J.E. (1967). Cite Ford J.E. 1973 in: Protein J.n Human Nutrition. (Porter, S.W. and Rolls, B.A. eds.) Acad. Press London and New York pp. 515-529.
Burgess, G.H.O. and Bannerman 1 A. Mck (1963). "Fish smoking A Torry kiln operator's Handbook." Edinburgh Her Majesty's Stationary DffJ.ce.
Buttkus, A. (1967). "The reaction of myosin with malonaldehyde." J. fd. ScJ.. .;g, 432.
- 138 -
•
Carpenter, K.J., Ellinger, G.M., Munro, M.I. and Rolfe E.J.C. (1957). Fish Products as prote~n supplement to cereals. Br. J. Nutr • .1.1 (2) 162-173.
Carpenter, K.J., Jones, W.L. and Mason, E.L. (1959). "A coloured reaction product from (im-DNP) histidine and methoxy carbonyl chloride" Biochem. J • .Il, 11-12,
Carpenter, K.J. (1960), "The estimation of available lysine in animal protein Foods" Biochem. J. 77, 604-610.
Carpenter, K.J., Morgan, C.B., Lea C.H. and Parr L.J. (1962). "Chemical and nutritional changes in stored herring meal 3. Effect of controlled moisture contents on the binding of amino acids in freeze-dried herring press cake and in related model systems." Br. J. Nutr, 1£ 451-464.
Carpenter, K.J. and Varnish, S.A. (1975). "Mechanisms of heat damaged protein." Br. J. Nutr. ]!, 325.
Caurie, M. (1975). "The improvel'lent in the technology and the subsequent stability of hot smoke fish curing in West Africa.
_Ph.D. Thesis, University of Rhode Island.
Chen, L.B. and Issenberg, P. (1972). "Interactions of some wood smoke components with
amino groups in protein. 11
J. Agric. Fd. Chem. lQ., 113.
Choppe, W. and Kratzer, F.H. (1963). "Methods for evaluating the quality of meat and bone meals." Poult, Sci. ~. 642-646.
Cole, S.J. (1967). "The Maillard Rx in food products, carbon dioxide production." J, Fd, Sci. 1£, 245.
Davies, T.W. and Edwards, R.A. (1966). "Methyl substituted pyrazines as voletile reaction products of heated aqueous aldose, amino acid mixtures." Chem. Ind. (London). p.2203.
Doerr, R.C., Wasserman, A.E. and Fiddler, w. (1966). "Composition of hickory sawdush smoke-low boiling const1tuents." J, Agric. Fd, Chem. 1!, 662-666.
Dolby, RM. (1961). "Dye-binding methods for estimation of~proteins in milk." J. Dairy Res, l!l. ( 1 ) , 43-55 ••
- 139 -
Donoso, G., Lewis, O.A.M., Miller, D.S. end Payne, P.A. (1962). Nutritive value of heated concentrate I. Effect at source of raw material and method of drying on protein• value for chickens and rats. J. Sci. Fd. Agric. Jl, 5.
Draudt, H.N. (1963). "The meat smoking process - A Review." Fd. Technol. Jl, 1557.
Dvorak, z. and Vognarova I. (1965). Available lysine in meat and meat products. J. Sci. Fd. Agric. 1965, 1.§., 305.
Duorak Z. (1968), "Availability of essential amino from proteins I. Beef serum albumin". J. Sci. Fd. Agric. j2, 71-76.
Erbersdobler, H., Dummer, H. and Zucker, H. (1969). Cited Ford, J.E. 1973. Proteins in Human Nutrition (Porter, J.W. and Rolls B.A. eds.) Academic Press, London and New York. p.515.
Food and Agriculture Organisation (1970). "Smoke curing of fish". f.A.D. Fish Rep. (88) 43.
Fiddler, W., Doerr, R.C., Wasserman, A.E. and Salay J.M. (1966). "Composition of hickory sawdust smoke Furans and phenols." J. Agric. Fd. Chem. 1!, 659.
Fiddler, W., Parker, W.E., Wasserman, A.S. and Doerr, R.C. (1967). "Thermal decomposition of ferulic acid." J. Agric. Fd. Chem. ~. 757.
Finlay, J.W. and Friedman, M. (1973). "Chemical methods for avaJ.lable lysine." Cereal Chem • .iQ., 101.
Ford, J.E. and Salter, D.N. (1966). Br. J. Nutr. 20, 843.
Ford, J.E. and Shorrock, C. (1971). "Mechanism of heat damaged proteins in the rat -Influence of heat damage on the excretion of amino acids and peptides in urine." Br. J. Nutr., 1.§., 311.
Ford, J.E. (1973). Some effects of processing on Nutritive Value in proteins in Human Nutrition. (Porter J.W. and Rolls B.A. eds.) Academic Press London and New York. p. 515.
- 140 -
foss Electric (1972). Measuring protein in alfalfa (Lucerne) and Grass pills with Prometer Mark II application No. 7. Hiller6d Denmark.
foster, W.W. and Simpson, T.H. (1961). "Studies of the smoking process for foods - The importance of vapours. 11
,
J. Sci. fd. Agric • .!.£, 363.
foster, vi.W., S~mpson, T.H. and Campbell D. (1961). "Studies of the smoking process for foods - The role of smoke particles." J. Sci. fd. Agric • .!.£, 635.
fraenkal-Conrat, H. and Cooper, M. (1944). "tlse of dyes for the determination of acid and basic groups in proteins." J. Biol. Chem. 154, 239.
freedman, R.B. and Rudds, G.K. (1968). "The reaction of 2,4,6 trinitrobenzene sulphonJ.c with amino acids, peptides and proteins." Biochem. J. 108, 383.
Goes, A.W. (1952). The thermal decomposition of wood." Wood Chemistry Vol. 2. 2nd edn. p. 826. Reinhold New York.
Gran~, N.H., Clerk, D.E. and Alburn, H.E. (1966). "Accelerated polymerisation of N-carboxy acid anhydrides in frozen dioxane." J. Amer. Chem. Soc.£[, 4071.
Habeeb, A.f.S.A. (1966).
amino
acid
"Determination of free amino groups in protein with trinitro benzene sulphonJ.c acid. Analyt. Biochem. lir 326-336.
Hagberg, A. and Karlsson, K.E. (1968). "Breeding for high protein content and quality in barley" fAO/IAEA Panel for "New approaches to breeding for plant protein improvement" at Rotanga Sweden.
Hamid, H.A. and Saffle, R.L. (1965). Isolation and Idenfication of the volatile fatty acids present in hJ.ckory sawdust smoke. J. food Sci. ]Q, 697.
- 141 -
Hamid, H.A. and Saffle, R.L. (1966). "The penetration depth of volatile fatty acids into fresh ham." F'd. Technol. l.Q., 224-225.
Harris, R.L. and Mattil, H.A. (1940). "The effect of hot alcohol on purified animal protel.ns." J. Biol. Chem. 132, 477.
Henry, K.M., Kon, S.K., Lea, C.H. and White, J.C. (1948). J. Dairy Res • .1.§., 292.
Henry, K.M. and Kon, S.K. (1950). Biochem. Biophys. Acta. 5, 455.
Hedge, J.E. (1953). "Chemistry of brewing reactions in model systems." J. Agric. F'd._Chem. ~. 928.
Hedge, J.E., F'isher, B.E. and Nelson, E.C. (1963). "Dicarbonyls, reductones and heterocyclics produced by the reaction of reducing sugars with secondary amine salts." Amer. Soc. Brewing Chem. Proc., p.84.
Hoffman, A., Barranco, A., F'rancis, B.J. and. Disney, J.G. (1977). "The effect of processing and storage upon the nutritive value of smoked fish from Africa." Tropical Scl.ence 12 (1) 41-53.
Halterman, A. (1960). The browning reaction Stavke 1£, 319-328.
Huang, F'.L. and Tappel, A.L. (1971). Action of Cathepsl.n C and D in protein hydrolysis. Biochem. Biophys. Acta. 236, 739.
Hurrell, R.F'. and Carpenter, K.J. (1975). The use of 3 dye binding procedures for the assessment of heat damage to food protein. Br. J. Nutr. J.l1 101.
Hurrell, R.F'. and Carpenter, K.J. (1976). An approach to the repid measurement of "reactl.ve" lysine in foods by dye binding. Proc. Br. Nutr. ]2., 23A-24A.
Husaini, S.A. and Cooper, G.E. (1957). "F'ractl.onation of wood smoke and the comparison of cheml.cal composition of sawdust and frict.1.on smokes .. " F'ood Technol. 11, 499-502.
- 142 -
Hymowitz, T., Collins, f.I. and Gilbons, S.J. (1969). "A modified dye binding method for estimating soya bean protein." Agron J • .2..1. (4), 601.
Issenberg, P., Kornre1ch, M.R. and Lustre, A.O. (1971). "Recovery of phenolic wood smoke components from smoked foods and model systems." J. food Sci. 1.§., 107-109.
Jacobsen, E.E., Moeller, A., Nielsen J.J., Schm1dtsdorff, N. and Weidner, K.E. (1972). "Evaluation of dye binding method as a tool for the practical check of f1shmeal quality." A/SN foss Electric, Hiller~d, Denmark.
Jones, N.R. (1956b). Biochem. J. g, 7.
Jones, N.R. (1959), "The free aa of fish II fresh skeletal muscle from lemon sole (Pleuronectes microcephalus)." J. Sci. fd. Agr • .!Q, 282.
Jones, N.R. (1962), "Browning reactions in dried fish products." Recent advances in food sci. vol. 2. pp. 74-80. (Hawthorn J. and Leitch J.M, eds.) London Butterworths.
Jones, G.P. (1974). "The use of dye-binding procedures for the evaluation of protein quality." Ph.D. Thesis, University of Reading.
Kakade, M.L. and Liener, I.E. (1969). "Determination of available lysine in proteins." Anal. Biochem. 27, 273.
Karel, M. and Labaza, T.P. (1968). "Non-enzymatic browning in model systems containing sucrose .. " J. Agric. food Chem. ,!i, 717.
Kato, H. (1962). "Chemical studies on amino-carbonyl reaction I isolation of 3-deoxy pentose and 3-deoxy hexosone formed by browning degradation of N-glycosides. Agric. Biol. Chem. ~. 187.
Kato, H. (1963). Chemical studies on amino-carbonyl 2XS. II Identification of D. glucosone formed by oxidative browning degradation of NO-glycosides Dgr. Biol. Chem, 27, 461.
- 143 -
Kim, K., Kurata, T. and Fujimaki, M. (1974). "Identification of flavour constituents in carbonyl, non-carbonyl, neutral a~d basic fractions of aqueous smoke condensates." Agric. B>.ol. Chem. 1§. ( 1 ) 53.
Knowles, M.E., G>.lbert, J. and McWeeny O.J. (1975). Phenols in smoked cured meat: phenolic composition of commercial lgd smoke prop~ and der>.ved bacon. J. Sci. Fd. Agric. 1.§., 189-196.
Koehler, P.E., Mason, M.E. and Newel!, J.A. (1969). "formation of pyrazine compounds in sugar-am1no acid model systems". J. Agric. Fd. Chem. fl, 393.
Kurko, V.(1959). "A rapid determination of the smoke phenols penetrating sausages."
•Mayason. Ind. SSSR. ]Q, 17.
Kurko, V. and Schmidt, T.A. (1969). "Interaction of carbonyl and reductone-like smoke components with amino acids." Proc. European Meeting of Meat Research Workers 15, 11, 67-11, 79 Summ. J1.1, 99.
Kwon, T.W., Mensel, D.B. and Dleott, H.S. (1965). "Reactivity of Malonaldehyde with food const>.tuents." J. Fd. Sci. JQ, 808.
Lakin, A.L. (1973a). "Evaluation of Protein quality by dye binding procedures." in Proteins in Human Nutrition. Porter and Rolls B.A. eds. Academic Press London and New York.
Lakin, A.L. (1973b). "The estimation of prate in and the evaluation of protein quality by dye-binding procedures." I.F.S.T. Proceedings f (2), 80-83.
Lakin, A.L. (1975). "The estimation of protein by dye binding pr>.ncipals and parameters. 11
J. Sci. Fd. Agric. 1.§., 549.
Laksesrela, B. (1958). J. Agric. Sci. i1,, 164.
Lea, C.H. and Hannan, R.S. (1949). "Studies of the reaction between proteins and reduc>.ng sugars in the dry state. I. The effect of act>.v>.ty of water, of pH and of temp. in the primary reaction between casein and glucose." Biochem. Biophy. Acta. ~. 313.
- 144 -
',
Lea, C.H. and Hannan, R.S. (1950). "Biochem. &. Nutritional significance of the reactions between proteins and reducing sugars." Nature (London) 165, 438.
Lea, C.H., Parr, L.J. and Carpenter, K.J. (1958). "Chemical and nutritional changes in stored herring meal." Br. J. Nutr • .!l, 297.
Lea, C.H. (1958). "Chemical changes in the preparation and storages of dehydrate food." Fundam. Aspects of Dehydration Foodstuff pap. conf. Aberdeen. p. 178.
Lea, C.H., Parr, L.J. and Carpenter, K.J. (1960). "Chemical and nutritional changes in stored herring meal- 2". Br. J. Nutr., .!.!, 91.
Lea, C.H., Parr, L.J. and Carpenter, K.J. (1962). "Chemical and nutritional changes in stored herring meal -3. Effect of heating at controlled moisture contents on the binding of amino acids in freezing dried herring press cake and in related model system." Br. J. rJutr. J.2., 451.
Listen, E.P. and French H.V. (1945). Factors effecting the deposition of smoke constituents on fish. J. Fish. Res. Bd. Canada, f, 338.
Love, J. and Bratzler, L.J. (1966).
Lustre,
"Tentative identification of carbonyl cpds in wood smoke by gas chromatography." J. Fd. Sci. ]l, 218.
A.O. and Issenberg, P. (1969). ·"Volatile components of hardwood sawdust smoke components of phenolic fraction." J. Agric. Fd. Chem. Jl, 1387.
Lustre, A.O. and Issenberg, P. (1970). "Phenolic components of smoked meat products." J. Agric. Fd. Chem • .1.§., (6) 1056.
Makinodan, Y. and Ikeda S. (1969). "Studies on fish muscle protease 2. purifJ.cation and properties of a proteinase active in slJ.ghtly alkaline pH range." Japanese Soc. Sci. Fisheries ]1, 749.
Matheson, N.A. (1968). J. Sci. Fd. Agric. li, 492.
- 145 -
Manron, J. (1970). Cited Ford J.E. 1973 in Proteins in Human Nutrition (J.W. Porter & B.A. Rolls eds.) Acad. Press, London and New York. p. 515.
McCain, G.R., Blumer, T.N., Craig, H.B. and Steel R.G. (1968). "Free amino acids in the ham muscle during successive aging per~ods and their relation to flavour." J. Food Sci. ..TI., 142.
Mecham, D.K. and Olcott, H.S. (1947). Ind. Eng. Chem. ]2, 1023.
Miller, D.S. (1956). "Nutr~ tive value of fish proteins. 11
J. Sci. Fd. Agric. 1, 337.
Miller, E., Carpenter, K.J. and Milner, C.K. (1965). "Availability of sulphur amino acids in protein foods (3) Chem & nutritional changes in heated cod.muscle. 11
Br. J. Nutr • .1.2., 547.
Moore, s. and Stein N.H. (1951). "Chromatography of amino acids on sulphonated polystyrene resins." J. Biol. Chem. 192 (2) 663.
Moran, E.T., Jensen, L.S. and McGinnis, J. (1963). "Dye binding by soyabean and fish meal as an index of quality." J. Nutr. 79, 239.
Mossberg, R. (1965). Some problems concerning the determination of protein by dye binding. Agr. Hort. genet, 1]., 206.
Mossberg, R. (1966). "Some analytical criteria of quality in Barley." Agr. Hort. genet. 24, 193.
Mossberg, R. (1968), F.A.D./I.A.E.A. Panel for New Approaches to Breeding for plant protein improvement. Rostanga Sweden, p. 151.
Mossberg, R. (1969). "Evaluation of protein quality by dye binding capacity. A tool in plant breeding". I.A.E.A. Symp. Vienna, P• 1S1.
Dusterhout, L.E., Grau, C.R. and Lundholm, B.D. (1959). "Biological availability of amino acids in fish meals and other protein sources." J. Nutr • .§.2., 65.
- 146 -
Partridge, s.r4. and Brimley, R.C. (1952). "Displacement chromatography of synthetic ion exchange resins B. A systematic method for the separation of amino acids. 11
Biochem. J. 21, 628.
Pearl, I.A. (1967). "The chem. of lignins." Edward Arnold (Publisher) Ltd. London. Marcel Dckker Inc. New York.
Pettet, A.E. and Lane, F.G. (1940). A study of the chemical composition of wood smoke. J. Soc. Chem. Ind. ~. 114.
Pictet, A. and Sarasin, J. (1968). Sur la distillation de la cellulose et l'amidon. sous pression redeiut, Helv. Ch~m. Acta I, 87.
Pisano, J.J., Finlayson, J.S. and Peyton, MP. (1969). Cited J.E. Ford in Protein in Human Nutrition (P S.W. and Rolls B.A. eds.) Acad. Press Lend. ~ N.Y. p. 515.
Pomeranz, Y. (1965). "Evaluation of factors affecting the determination' of nitrogen in soya products by biuret and Orange G dye binding method. J. fd. Sci. ]Q, 307.
Porter, R.W., Bratzler, L.J. and Pearson, A.M. (1964). Fractionation and study of cpds in wood smoke. J. Fd. Sci. ]Q, 615.
Potthast, K. (1977). "Determination of phenols in smoked meat products." Acta Alimentaria Polenica, 2 (3), 189.
Raa, J. and Gildberg, A. (1976). "Autolysis and proteolytic activity of cod viscera." J. fd. Technol. 1.1, 619.
Rao. S.R., Carter, F.L. and Frampton, V.L. (1963). "Determination of available lys~ne in oil seed meal proteins." Anal. Chem.].i (12) 1927.
Rawlins, C.L. and Schmidt, C.L.A. (1930). The mode of combination between certain dyes and gelatin granules." J. Biol. Chem • .§..§., 271.
Reynolds, T.M.L. (1970). fd. Technol. Aust. l£, 610 cited G. Knowles Chem. of smoked food. J. fd. Tech. ( 1975) .!Q, 245.
- 147 -
Roach, A.G., Sanderson, P. and Wi11iams, D.R. (1967). "Comparison of methods for the determination of available lysine value in animal and vegetable protein sources." J. Sci. Fd. Agnc • ..!.!l.o 274.
Robert, L. and Comte, P. (1966). Life Sci. 2 (II), 493.
Roma, C.R., Lakin, A.L. and Rolfe, E.J. (1975). "Properties of protein isolates prepared from ground seeds.I. Development and evaluation of a dye b~nding procedures for the measurement of protein solubility." J. Fd. Techno1. lQ, 541.
Ruiter, A. (1969). Conserve 1[, 63.
Ruiter, A. (1970). "Colour of protein surfaces by the act~on of smoke." Lebensm. Wiss. U. Techno1. ~ (5), 96.
Sandler, L. (19721. The application of dye binding techniques to South African fish meals." Rep. Fish1ng Ind. Res. Inst. Cape Town 1£, 32.
Sa~dler, L. and Warren, F.L. (1974). "Effect of Ethyl chloroformate on the dye b~nding capacity of protein." Analytical Chemistry~. 1670-1672.
Sanger, F. ( 1 945) • Biochem. J. ]2., 507.
Sasano, Y., Yoshiwara T. and Oki, T. (1966). Bulletin of the Japanese Society of Scientific Fisheries, ]!, 613.
Satake, K., Okuyama, T., Ohashi, M, and Shinoda, T. (1960). "The spectrophotometric determination of amine, amino acids and peptides with 2,4,6 trinitro benzene sulphonic acid." Japan J. Biochem. 47, 654.
Saunders, J. and Jervis, F. (1966). "The role of buffer salts in non-enzymic browning." J. Sci. fd. Agri., .!.I, 245.
Sharp, J.G. (1963). "Aspetic autolysis in rabbit and bovine muscle." J. Sci. Fd. Agric • .!.i, 466.
Shorrock, C. (1972). Ph.D. Thesis Univ. of Reading, England. Cited Ford J.E. 1973. Proteins in Human Nutrition (Porter J.W. and Rolls B.A. eds.) Academic Press London and New York.
- 146 -

Shram, E., Dustin, J.P., Moore, S. and Bigwood E.J. (1953). Analytica. Chim Acta. ~. 149.
Siebert, G. (1958). "Protein splitting enzyme activity of fish flash." Experimentia 1!, 65.
Simon, H. and Heuback, G. (1965). "formation of alicyclic and open chain nitrogenous reductions by the reaction of secondary amine salts on monosaccharides." Chem. Ber. ~. 3703.
Sinnhuber, R.D., Yu, T.C. and Chang Yu T.E. (1958). "Characterisation of the red pigment formed in the 2-thio barbituric acid determination of oxidative rancidity." fd. Res. 1.1, 624.
5okolovsky, M. Sadeh T., Patchornik, A.G. (1964). J. Amer. Chem. Soc • .!l.§., 1212.
Tarr, H.L.A. (1954). "The Maillard reaction in flesh food." food Technol. ]., 15.
Thurston, C. (1957) •. ' Commercial fish Rev • .12., (Sa) 7.
Tiglner, D.J. (1958). "Herstellung and anwendung des rancherrauches." fle~schwirtschaft, JJ!, 751.
Tiglner, D., Miler, K., Prominski J. and Darnowska G. (1962). "The influence of smoke production parameters upon its amount of phenolic and acid fraction." Symposium on advances in the engineering of the smoke curing process II. Internat~onal session Gdansk, Poland. p. 18. Yugoslow tlust of meet technol.
Tooley, P.J. and Lawrie R.A. (1974). "Effect of deep fat frying on the availability of lysine in fish fillets."
.J. fd. Technol. ~. 247.
Tucker, I.W. (1942). "Estimation of phenols in meat and fat." J. Ass. Official Anal. Chem.lj_, 779.
Udy, D.C. (1956a). "Estimation of protein in wheat and flour by ion-binding". Cereal Chem. 1.1 ( 3) 190.
Udy, D.C. (1956b). "A rapid method for estimating total prote~n ~n milk." Nature Lond. 178 (4528) 314.
- 149 -

Udy, D.C. (19S7). "Improved milling and c:o llec:tion of small samples for protein analysis by dye binding." Cereal Chem. ]i, 389.
Udy, D.C. (1971). "Improved dye method for estimating protein." J. Am. Ol.l Chem. Soc:. ~. 29A.
Udy, D.C. (1973). Cited in (Jones, G.P. 1974 "The use of dye binding procedure for the evaluation of protein quality". Ph.D. Thesis University ~f Reading.)
Underwood, J.C., Lento H.G. and Willits, C.D. (19S9). "Browning sugar solution 3. Effect of pH ion the colour produced in dilute glucose solutions containing amino acid with the group in different positions in the molecules," food Res.l.1,, 181.
Vic:kerstaff, T. (19S4). The physical chemistry of dyeing (2nd ed,) Published for I.C.I. by Oliver and Boyd, London and ~dinburgh.
Waibel, P.E. and Carpenter, K.J. (1972). "Mechanisms of heat damage in proteins 3. Studies with -( - 1 = g intamyll-L-lysine." Br. J. Nutr. 27, S09.
Wasserman, A.E. and fiddler, W. (1969). Proc:. of meat Indust. Res. Conference, 163.
Wasserman, A.E. (1966). "Organoleptic: evaluation of three phenols present in wood smoke." J. food Sc:i. 1.1., lOOS.
Weygand, f, (1940). "Uber N-glykoside I I. AmadoriUmlagerungen11 Ber. Dent. Chem. Ges • .ll. 12S9.
Wladyka, E.J. and Dawson, L.E. (1968). UEssential amino acid composition of chicken meat and drip after thirty and ninety days of frozen storage." J. fd, Sc:i. ].l, 4S3,
Ziemba, z. (1969a). "Role of tissue amino compounds and environmental variables in production of surface colouring during smoke curing of food products." Roc:znJ.ki Tec:hnologu Chemii Zywnosc:i, jd, 139.
- 1SO -

I! 1:
Ziemba, z. (1969b). "Role of chemical constituents of wood smoke in production of production." Zywnosci .1.2.,
surface colourLng of smoked food Roczniki Technologii Chemii 153.
- 151 -


![The Evening star.(Washington, DC) 1891-10-28 [p 7]. · ACMEWOLFFS BLACKING = ST M.Iwori 0, c=nnXRan ASHINELASTSAWEEK. LEATHERPRESERVER. AHANDSOMEPOLISH. ISWATER-PROOF. 20C.ABOTTLE](https://img.pdfslide.us/doc/110x75/5e5c1adb7d895d4c2178ed24/the-evening-starwashington-dc-1891-10-28-p-7-acmewolffs-blacking-st-miwori.jpg)

![[artigo] John Blacking - Some problems of theory and method in the study of musical change (1977)](https://img.pdfslide.us/doc/110x75/557207e4497959fc0b8bbc20/artigo-john-blacking-some-problems-of-theory-and-method-in-the-study-of-musical-change-1977.jpg)