Embed Size (px)
Citation preview

A CHAIR EMBEDDED WITH CAPACITIVE ELECTROCARDIOGRAPHY (ECG) FOR NON-
OBSTRUCTIVE CARDIAC HEALTH MONITORING IN THE HOME SETTING
by
JIANFENG QIU
A thesis submitted in conformity with the requirements for the degree of MHSC in Engineering in Clinical Settings
Institute of Biomaterials and Biomedical Engineering University of Toronto
© Copyright by Jianfeng Qiu 2015

ii
A Chair Embedded with Capacitive Electrocardiography (ECG) for
Non-Obstructive Cardiac Health Monitoring in the Home Setting
Jianfeng Qiu
MHsc in Engineering in Clinical Settings
Institute of Biomaterials and Biomedical Engineering
University of Toronto
2015
Abstract
Canada is faced with an ageing population, which requires long term health monitoring. Capacitive
electrocardiography (ECG) is considered a viable method of non-obstructive heart condition
monitoring, detecting ECG without directly attaching an electrode to the body. In this study, a
capacitive ECG chair is designed, implemented and verified. Furthermore, extensive experiments
were conducted to evaluate the output signal quality in various situations. These experiments shed
light on the impacts of different design parameters (such as electrode size, separation distance and
orientation) and clothing condition (such as clothing material and thickness) on the output signal
quality. Additionally, the sources of motion artifacts are identified and their influences on the ECG
signal are studied.

iii
Acknowledgments
First and utmost, I would like to thank Mr.Yang Youyi and Mr.Yao Yinqian, whom I met in the
Hong Kong Queen Elizabeth Hospital. What happened in their life inspired me to pursue a
healthcare engineering career.
I am particularly grateful to Prof. Alex Mihailidis for providing me the opportunity, unyielding
support and patient guidance during the entire Clinical Engineering program.
I also want to thank Prof. Sherry L. Grace and Prof. Tom Chau for being my committee members
and giving valuable advice on our project. Furthermore, my gratitude extends to Prof. Tony Easty
for being my external examiner.
Thesis review assistance provided by Dr.Amaya Arcelus and technical advice given by Mr. Isaac
Chang are much appreciated.
My special thanks to Miss. Christi She, Mrs. Ruikun She, Mr. Zhihui Qiu, Mrs. Bing Ye, Mr.
Yiwei Zhang, Mr. Zhongfa Liao, Mr. Jipeng Cheng, Miss. Yi Liao, Miss. Yiwen Lin.

iv
Table of Contents
Acknowledgments ..................................................................................................................... iii
Table of Contents ...................................................................................................................... iv
List of Tables .......................................................................................................................... viii
Glossary of Terms ..................................................................................................................... ix
List of Figures ............................................................................................................................ x
List of Appendices ................................................................................................................. xvii
1 Introduction ........................................................................................................................... 1
1.1 Ageing Society and Long Term Monitoring .................................................................... 1
1.2 Thesis Motivation and Objectives ................................................................................... 3
1.3 Electrical Activities of the Heart ..................................................................................... 6
1.4 Non-Obtrusive Physiological Monitoring ........................................................................ 8
2 ECG Analog Circuit Design and Implementation ................................................................. 12
2.1 Overall Architecture of Analog System ......................................................................... 13
2.2 Electrode Design and Implementation ........................................................................... 14
2.2.1 Introduction ....................................................................................................... 14
2.2.2 Noise Reduction by Active Shielding ................................................................ 16
2.2.3 Circuit Implementation ...................................................................................... 20
2.2.4 Skin-Electrode Interface Capacitance ................................................................ 21
2.2.5 Electrode Response to Motion Artifact .............................................................. 24
2.3 Analog Signal Conditioning Circuit Design and Implementation .................................. 29
2.3.1 Differential Amplifier (DA) .............................................................................. 29
2.3.2 Twin-T 60Hz Notch Filter ................................................................................. 32
2.3.3 Low pass Filter .................................................................................................. 34

v
2.3.4 Non-inverting Amplifier .................................................................................... 38
2.3.5 Analog Conditioning Circuit Implementation and Characterization ................... 38
2.4 The Driven-Right-Leg Noise Reduction Technique ....................................................... 41
2.4.1 Introduction ....................................................................................................... 41
2.4.2 Implementation ................................................................................................. 42
3 Digital Data Acquisition System .......................................................................................... 45
3.1 Analog-Digital-Converter (ADC) .................................................................................. 46
3.1.1 Introduction to AD7685 .................................................................................... 46
3.1.2 The Serial Peripheral Interface (SPI) ................................................................. 47
3.1.3 Embedded Software Driver for ADC ................................................................. 48
3.2 Accelerometer............................................................................................................... 50
3.2.1 Introduction to ADXL345 Accelerometer .......................................................... 50
3.2.2 The Inter-Integrated Circuit (I2C) Communication Protocol .............................. 51
3.2.3 Embedded Software Driver for Accelerometer .................................................. 52
3.3 Wi-Fi Module ............................................................................................................... 54
3.3.1 Introduction to the TCP/IP Protocol Stack and Wi-Fi Module ........................... 54
3.3.2 The Universal Asynchronous Receiver and Transmitter (UART)
Communication ................................................................................................. 57
3.4 ARM Central Controller ............................................................................................... 58
3.4.1 Introduction to EFM32WG Module ................................................................... 58
3.4.2 Embedded Software Implementation ................................................................. 58
3.5 Data Logging Server ..................................................................................................... 59
3.5.1 Server Architecture ........................................................................................... 59
3.5.2 Operation Flowchart and Implementation .......................................................... 60
4 Considerations on Embedding ECG Electrodes into a Chair ................................................. 62
4.1 Effects of Clothing on ECG Signal ............................................................................... 63

vi
4.1.1 Introduction ....................................................................................................... 63
4.1.2 Experiment ........................................................................................................ 65
4.1.3 Results .............................................................................................................. 68
4.1.4 Discussion ......................................................................................................... 71
4.2 Effects of Grounding Position on ECG Signals ............................................................. 73
4.2.1 Introduction ....................................................................................................... 73
4.2.2 Experiment ........................................................................................................ 75
4.2.3 Results .............................................................................................................. 77
4.2.4 Discussion ......................................................................................................... 80
4.3 Effects of Electrode Size on ECG Signal ....................................................................... 84
4.3.1 Introduction ....................................................................................................... 84
4.3.2 Experiment ........................................................................................................ 84
4.3.3 Results .............................................................................................................. 86
4.3.4 Discussion ......................................................................................................... 87
4.4 Effects of Electrode Separation on ECG Signal ............................................................. 89
4.4.1 Introduction ....................................................................................................... 89
4.4.2 Experiment ........................................................................................................ 89
4.4.3 Results .............................................................................................................. 90
4.4.4 Discussion ......................................................................................................... 92
4.5 Effects of Electrode Orientation on ECG Signal ............................................................ 95
4.5.1 Introduction ....................................................................................................... 95
4.5.2 Experiment ........................................................................................................ 95
4.5.3 Results .............................................................................................................. 96
4.5.4 Discussion ......................................................................................................... 98
5 Future Work and Conclusion .............................................................................................. 100
5.1 Future Work ................................................................................................................ 100

vii
5.1.1 Analog Circuit Design ...................................................................................... 100
5.1.2 Motion Artifact Removal.................................................................................. 101
5.1.3 Vital Signs Extraction ...................................................................................... 101
5.1.4 Generic User Trials .......................................................................................... 101
5.2 Limitations of Current Work ........................................................................................ 103
5.3 Conclusion ................................................................................................................... 104
6 Appendices ......................................................................................................................... 105
6.1 Appendix A : Numerical result tables in experiments ................................................... 105
6.2 Appendix B: Parameters of commercially available op-amp......................................... 107
6.3 Appendix C: Circuit schematic diagrams ..................................................................... 108
References ............................................................................................................................... 114

viii
List of Tables
Table 1 Population ageing among developed countries[1] .......................................................... 1
Table 2 Skin-electrode capacitance measurement result ............................................................ 23
Table 3 Distortion magnitude and recovery time after motion artifact injection ........................ 26
Table 4 Comparison among ZigBee, GSM, Wi-Fi and Bluetooth [70] ...................................... 55
Table 5 Permittivity of various materials .................................................................................. 64
Table 6 Tests cases to explore the impact of insulation clothes on output ECG waveform ........ 65
Table 7 Test cases for the various grounding methods and positions ......................................... 76
Table 8 Result table for ECG, BCG and ECG/BCG ratio for different electrode sizes ............. 105
Table 9 Result table for ECG output from different grounding scheme ................................... 105
Table 10 Result table for ECG output from different ECG electrode separations ( measured on a
33mmX33mm electrode) ........................................................................................................ 106
Table 11 Result table for ECG output from different ECG electrode orientations ( measured on a
33mmX33mm electrode) ........................................................................................................ 106
Table 12 Comparison on commercially available op-amps ..................................................... 107

ix
Glossary of Terms
CASES
accelerometer: a device that measures proper acceleration ...................................................................................... 28
action potential: A short-lasting event in which the electrical membrane potential of a cell rapidly rises and falls,
following a consistent trajectory. ............................................................................................................................. 6
active shield: A EMI shield that is driven by the output of an op-amp, and its potential varies along the signal. ...... 18
ADC: Analog to digital conversion, a process that converts analog signal into digital signal. ..................................... 12
BCG: Ballistocardiography, a technique for producing a graphical representation of repetitive motions of the
human body arising from the sudden ejection of blood into the great vessels with each heart beat. .................... 9
bias current: A small current flows into both inputs of the op-amp to bias the input transistors. ............................. 16
capacitive electrode: a sensor to collect electrical signal by capacitive coupling ....................................................... 12
CMRR: Common mode rejection ratio, the ratio of common mode gain to differential mode gain .......................... 30
common mode voltage: the component of an analog signal which is present with one sign on all considered
conductors .............................................................................................................................................................. 13
differential amplifier: a type of electronic amplifier that amplifies the difference between two voltages ................ 29
DRL:Driven Right Leg is a common mode noise removal technique by feeding back the amplified and inversed
common mode signal back to the body.................................................................................................................. 12
ECG: Electrocardiography, it is the recording of the electrical activity of the heart ............................................... 3, 12
open loop gain: The gain obtained when no feedback is used in the circuit .............................................................. 19
operational amplifier: a DC-coupled high-gain electronic voltage amplifier with a differential input and, usually, a
single-ended output ............................................................................................................................................... 16
oximeter: A device way to measure how much oxygen one's blood is carrying. .......................................................... 3
permittivity: A material property that expresses the force between two point charges in the material. .................. 21
power line noise: The EMI introduced by the power distribution system in a building. ............................................. 13

x
List of Figures
Figure 1.1 Demographic structure in Canada[2] .......................................................................... 1
Figure 1.2 Canadian population projection, children and seniors[4] ............................................ 2
Figure 1.3 Percentage of working Canadians[2] .......................................................................... 2
Figure 1.4 Canada healthcare spending and pension spending estimate[2] .................................. 2
Figure 1.5 Proportion of population with one or more chronic diseases, by selected age groups,
Canada, 2009[7] ......................................................................................................................... 2
Figure 1.6 Mortality by major causes and age groups, Canada, 2006 [7] ..................................... 4
Figure 1.7 Illustration on capacitive coupling ............................................................................. 5
Figure 1.8 Depolarization of cell membrane[19] ......................................................................... 6
Figure 1.9 Specialized conduction system of the heart[19] .......................................................... 7
Figure 1.10 Electrocardiogram leads [19] ................................................................................... 7
Figure 1.11 Electrocardiogram waveforms in lead II and electrical status of heart ...................... 8
Figure 2.1 Capacitive ECG system architecture ........................................................................ 13
Figure 2.2 Illustration of voltage sensing by an electrode .......................................................... 14
Figure 2.3 Equivalent circuit for wet electrode interface ........................................................... 15
Figure 2.4 Equivalent circuit for capacitive electrode interface ................................................. 15
Figure 2.5 Op-amp configured as voltage follower ................................................................... 16
Figure 2.6 Illustration of an active shield electrode ................................................................... 17
Figure 2.7 Schematic of electrode with active shield ................................................................. 18
Figure 2.8 Block diagram of a feedback system ........................................................................ 19

xi
Figure 2.9 Schematic for simulating open loop gain of actively shielded electrode ................... 20
Figure 2.10 Open loop gain and phase shift of the feedback circuit ........................................... 20
Figure 2.11 Implementation of electrode ( left to right: voltage buffer circuit, active shield, back
of electrode, front of electrode) ................................................................................................. 20
Figure 2.12 Electrode for testing the skin-electrode interface capacitance ................................. 22
Figure 2.13 Skin-electrode capacitance testing setting .............................................................. 22
Figure 2.14 Skin-electrode capacitance testing schematic ......................................................... 22
Figure 2.15 Skin-electrode capacitance testing sample result .................................................... 22
Figure 2.16 Schematic of the electrode circuit used in testing the motion artifact response ....... 25
Figure 2.17 Illustration of the experiment setting and motion artifact introduction .................... 26
Figure 2.18 Waveform of the electrode output after motion artifact injection ............................ 26
Figure 2.19 Analog signal conditioning block in the architecture .............................................. 29
Figure 2.20 Symbol for differential amplifier ........................................................................... 30
Figure 2.21 Differential mode and common mode of a signal pair ............................................ 30
Figure 2.22 Internal structure of INA2321 [58] ......................................................................... 31
Figure 2.23 Circuit diagram for a Twin-T notch filer ................................................................ 32
Figure 2.24 Simulation schematics for the 60Hz twin-T notch filter .......................................... 33
Figure 2.25 Simulated frequency response of the 60 Hz notch filter .......................................... 33
Figure 2.26 Comparison of the different types of low-pass filter [60] ....................................... 34
Figure 2.27 Basic unit of a 2nd order Sallen-Key low-pass filter ............................................... 35

xii
Figure 2.28 4th order Butterworth low-pass filter component values computed from WEBENCH
Designer ................................................................................................................................... 36
Figure 2.29 Simulation schematics for the 50Hz low-pass filter ................................................ 37
Figure 2.30 Simulated frequency response of the 50 Hz low-pass filter ..................................... 37
Figure 2.31Simulation schematics for the non-inverting amplifier ............................................ 38
Figure 2.32 Implementation of analog conditioning PCB .......................................................... 38
Figure 2.33 Gain of each filter stage ......................................................................................... 39
Figure 2.34 Phase shift of the entire system .............................................................................. 40
Figure 2.35 Illustration of the driven right leg technique ........................................................... 41
Figure 2.36 illustration on capacitive driven right leg technique ............................................... 41
Figure 2.37 Schematic for DRL circuit ..................................................................................... 42
Figure 2.38 Setting to evaluate the DRL performance ............................................................... 42
Figure 2.39 Modification to the analog conditioning board to test the DRL performance .......... 42
Figure 2.40 The noise measured at the output of differential amplifier. (Left) Floating ground,
(Middle) DRL with gain 0.08 and (Right) DRL with gain 101.4 ............................................... 43
Figure 2.41 DRL noise reduction performance vs feedback gain............................................... 44
Figure 3.1 Capacitive ECG system architecture (digital processing part) .................................. 45
Figure 3.2 Schematic of a typical AD7685 ADC[68] ................................................................ 46
Figure 3.3 Internal structure of the AD7685 (simplified) [68] ................................................... 46
Figure 3.4 Ideal analog to digital conversion curve for AD7685[68] ......................................... 47
Figure 3.5 Typical SPI topology [69] ........................................................................................ 48

xiii
Figure 3.6 Typical SPI waveforms [69] .................................................................................... 48
Figure 3.7 Physical connection between MCU and AD7685 [68] ............................................. 48
Figure 3.8 Communication waveform with AD7685 [68] ......................................................... 48
Figure 3.9 Illustration on accelerometer operation principle (from instrumentation.com) .......... 50
Figure 3.10 Accelerometer microstructure [71] ......................................................................... 50
Figure 3.11 Internal functional blocks of an accelerometer [72] ................................................ 50
Figure 3.12 Typical I2C topology [69] ...................................................................................... 51
Figure 3.13 Typical waveform and data format of the I2C protocol[69] .................................... 51
Figure 3.14 Physical connection between MCU and ADXL345[72] ......................................... 52
Figure 3.15 Communication between hosts via TCP/IP[74] ...................................................... 54
Figure 3.16 Data flow through the IP/TCP/Application layers[74] ............................................ 54
Figure 3.17 The HC 21 Wi-Fi Module ...................................................................................... 56
Figure 3.18 Configuration interface for HC-21 Wi-Fi module .................................................. 56
Figure 3.19 Typical UART connection ..................................................................................... 57
Figure 3.20 Typical UART data packets ................................................................................... 57
Figure 3.21 EFM32 development board .................................................................................... 58
Figure 3.22 Architecture of the digital embedded system .......................................................... 58
Figure 3.23 Server client model of a vital sign collection network ............................................ 59
Figure 3.24 Internal structure of a data logging server .............................................................. 59
Figure 3.25 Server operation flow chart .................................................................................... 60

xiv
Figure 3.26 ECG and acceleration data stream displayed in kst software .................................. 60
Figure 4.1 Dielectric constant of cotton yarn (Cotton 44%; air 56%) [80] ................................. 63
Figure 4.2 Variation of dielectric constant versus frequencies for various fiber materials at 65%
r.h. [80] .................................................................................................................................... 63
Figure 4.4 The first chair prototype used in measuring the impact of clothes on ECG ............... 65
Figure 4.5 Experiment scenario when evaluating the capacitive ECG with 2 layers of cotton ... 65
Figure 4.6 Selected test settings for evaluating the impact of clothes on ECG ........................... 66
Figure 4.7 Sample waveform with both ECG and BCG (resulted from 16 layers of cotton, holding
breath) ...................................................................................................................................... 66
Figure 4.8 Theoretical waveform of BCG [88] ......................................................................... 66
Figure 4.9 Inserting a piece of rubber foam (5.36mm) in between the subject and ECG electrodes
................................................................................................................................................. 68
Figure 4.10 The resulting waveform from inserting a piece of rubber foam in between the subject
and electrodes ........................................................................................................................... 68
Figure 4.11 Selected ECG waveforms from different insulation materials and thickness ........... 69
Figure 4.12 ECG R wave peak-peak values for different clothes materials and thickness .......... 69
Figure 4.13 BCG I-J amplitude for different clothes materials and thickness ............................ 70
Figure 4.14 ECG/BCG ratio for different clothes materials and thickness ................................. 71
Figure 4.15 Illustration the effect of grounding on practical measurement system ..................... 73
Figure 4.16 Illustration of an electrically floating body (left) and a capacitively grounded body
(right) ....................................................................................................................................... 73
Figure 4.17 Illustration body part impedance (courtesy to Biodat Research Group) .................. 75

xv
Figure 4.18 The experiment setting used to measure the impact of grounding position on the ECG
output ....................................................................................................................................... 75
Figure 4.19 Illustration of applying a direct ground to the subject’s neck .................................. 75
Figure 4.20 Illustration of applying a direct ground to the subject’s right foot ........................... 75
Figure 4.21 Baseline configuration (body floating) ................................................................... 77
Figure 4.22 Selected experiment result of placing a direct grounding to different body positions
(green: direct chest ECG; yellow: capacitive ECG)................................................................... 78
Figure 4.23 Comparison between direct (upper) and capacitive (lower) groundings at the right arm
................................................................................................................................................. 79
Figure 4.24 Comparison between direct (upper) and capacitive (lower) groundings at the back 79
Figure 4.25 Direct grounding to the right hand (left) ; grounding by direct contact with the right
hand and bare foot on the floor (right) ...................................................................................... 79
Figure 4.26 Electric field of the cardiac dipole ( courtesy to Augustus Waller , 1887 ) ............. 80
Figure 4.27 Electric Field when the neck is grounded (assuming adjacent potential lines have 0.1V
difference) ................................................................................................................................ 81
Figure 4.28 Electric field when the left waist is grounded (assuming adjacent potential lines have
0.1V difference) ........................................................................................................................ 81
Figure 4.29 Electric Field when the left waist is grounded (assuming the field is distorted by the
ground plate) ............................................................................................................................ 81
Figure 4.30 The experiment setting used to measure the impact of electrode size on the ECG
output ....................................................................................................................................... 84
Figure 4.31 Electrodes with different sizes ............................................................................... 85
Figure 4.32 Signal output evaluation for different electrode sizes (based on a pair of 33mmx33mm
electrodes) ................................................................................................................................ 87

xvi
Figure 4.33 The experiment setting used to measure the impact of electrode separation on the ECG
output ....................................................................................................................................... 89
Figure 4.34 Signal output evaluation for different electrode separations (based on a pair of
33mmx33mm electrodes) ........................................................................................................ 91
Figure 4.35 Illustration on the generation of common mode voltage via capacitive grounding .. 92
Figure 4.36 Illustration of the input voltages to the voltage buffers ........................................... 92
Figure 4.37 The experiment setting used to measure the impact of electrode orientation on the
ECG output .............................................................................................................................. 95
Figure 4.38 Signal output evaluation for different electrode orientations (based on a pair of
33mmx33mm electrodes) ......................................................................................................... 97
Figure 6.1 Schematic for electrode PCB ................................................................................. 108
Figure 6.2 Schematic for analog conditioning circuit (differential amplifier) .......................... 109
Figure 6.3 Schematic for analog conditioning circuit (filter series) ......................................... 110
Figure 6.4 Schematic for analog conditioning circuit (driven right leg) ................................... 111
Figure 6.5 Schematic for analog conditioning circuit (cower module) ..................................... 112
Figure 6.6 Schematic for ADC ............................................................................................... 113

xvii
List of Appendices
Appendix A Numerical result tables in experiment
Appendix B Parameters of commercially available op-amp
Appendix C Circuit schematic diagrams
1
1 Introduction
1.1 Ageing Society and Long Term Monitoring
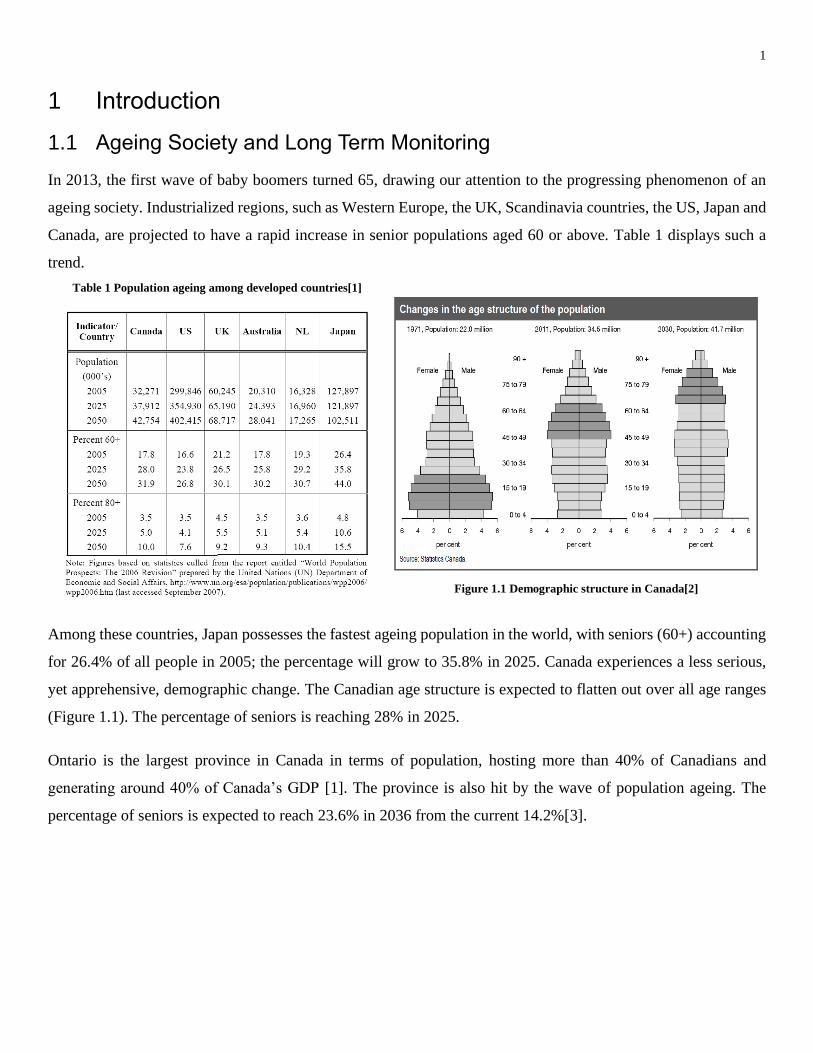
In 2013, the first wave of baby boomers turned 65, drawing our attention to the progressing phenomenon of an
ageing society. Industrialized regions, such as Western Europe, the UK, Scandinavia countries, the US, Japan and
Canada, are projected to have a rapid increase in senior populations aged 60 or above. Table 1 displays such a
trend.
Table 1 Population ageing among developed countries[1]
Figure 1.1 Demographic structure in Canada[2]
Among these countries, Japan possesses the fastest ageing population in the world, with seniors (60+) accounting
for 26.4% of all people in 2005; the percentage will grow to 35.8% in 2025. Canada experiences a less serious,
yet apprehensive, demographic change. The Canadian age structure is expected to flatten out over all age ranges
(Figure 1.1). The percentage of seniors is reaching 28% in 2025.
Ontario is the largest province in Canada in terms of population, hosting more than 40% of Canadians and
generating around 40% of Canada’s GDP [1]. The province is also hit by the wave of population ageing. The
percentage of seniors is expected to reach 23.6% in 2036 from the current 14.2%[3].

2
Figure 1.2 Canadian population projection, children
and seniors[4]
Figure 1.3 Percentage of working Canadians[2]
The implication for an ageing population is profound. From an economic point of view, there may be a decrease
in productivity when the senior workforce retires in the next few decades (Figure 1.2). With a working population
to senior ratio dropping by half (Figure 1.3), heavy social burden will be placed onto the working class. More
importantly, the healthcare spending will amount to 10% of Canada’s annual GDP (Figure 1.4), among which
60% is spent on the sickest 5% of senior people[5] and more than 75% is spent on chronic diseases
management[6]. Moreover, the population ageing situation and the healthcare cost challenge are not faced
exclusively by Canada; it is a global issue that crosses national boundaries and impacts a majority of developed
countries and some developing countries.
Figure 1.4 Canada healthcare spending and pension spending
estimate[2]
Figure 1.5 Proportion of population with one or more chronic diseases,
by selected age groups, Canada, 2009[7]
According to Public Health Agency of Canada [7], chronic diseases become one of the most serious problems for
the healthcare system. Statistics show that, in 2009, more than 89% of senior Canadians aged 65 or above had at
least one chronic disease (Figure 1.5). Seniors with chronic diseases, such as asthma, bronchitis, heart disease,
diabetes, high blood pressure, effect of a stroke, Alzheimer’s disease, etc, require regular body checkups.

3
Therefore, vital signs such as respiratory rate, heart rate, blood pressure or glucose, should be frequently measured
to manage the health condition of the seniors[8].
1.2 Thesis Motivation and Objectives
The ageing population and the prevalence of chronic diseases among seniors indicate a need for long term health
monitoring. To carry out long term and frequent health monitoring, currently seniors need to live in a nursing or
care facility to receive care from trained staff, or hire in-home caregivers. However, the supply of such resources
do not meet the demand of an aged society; moreover, there has already been a shortage of caregivers in North
America, reported by American Association of Retired Persons (AARP) [9] . At the same time, a survey [10]
indicates that more than 90% of seniors aged 65+ want to live with their family at their own home (also known
as “age in place”). The contradiction among the need for more frequent health monitoring, the emotional need
to age in place and the shortage of in-home caregivers calls for a new solution; a solution that reaches beyond the
current boundary of healthcare system and home; a solution that enables long term health monitoring at home.
One approach to enable long-term health monitoring at home utilizes wearable technologies, which rely on
devices attached to the body to monitor vital signs. Wearable health monitoring has been a widely attended topic
in recent years. In academia, research has been done extensively to invent wearable vital sign detectors. Taccini
et al. [11] developed conducting fabrics to make clothing that senses ECG. Muhlsteff et al. [12] built a belt that
was worn by a user to monitor ECG, heart rate and activity levels. Ng et al. [13] implemented a wearable device
called MediWatch to measure blood pressure. Yang et al. [14] successfully miniaturized the oximeter into a
wearable finger ring, which could be used to sense the blood oxygenation level. Huang et al.[15] made a yarn-
based piezo-resistive sensor that was embedded into clothing, which could measure the respiration rate of a user.
Besides academic research, many wearable products have been commercialized that have built-in health
monitoring functions. For example, the Samsung Galaxy Gear [16] has integrated pulse oximeter and heart rate
sensors; the first Apple Watch also included heart rate monitor and activity sensors.
Although wearable technologies promise a bright future in home based health monitoring, and tremendous
interests have been invested into wearable health monitoring, wearable devices suffer from the following
limitations. First, they need the user to wear them actively, which is challenging for seniors who suffer from
cognitive and memory impairments. Second, the wearable sensor needs to be attached to the body, which is
uncomfortable in many occasions. For example, few people wears a watch or tight clothes while they sleep. Third,
wearable sensors often need direct or indirect contact with the body, which poses hygiene problems to the user;
in rare cases [17], allergy to the wearable device has been reported. Finally, wearable technology alters the daily

4
behaviors of the user. For example, current wearable products need frequent battery charging, and the heart rate
monitor clothing needs special laundry techniques.
In light of the shortcomings of wearable health monitors, we propose to build a passive health monitor that
requires zero effort from the user. By zero effort, we mean that the user does not need to pay active attention to
the device during monitoring; the device requires no explicit feedback from the user, and therefore introduce
minimal behaviour modification to the user; in ideal situation, the user does not notice their existence[18]. One
approach to implement a zero effort system is by embedding sensors into furniture, such as a chair. Therefore, we
begin by embedding an ECG sensor into a chair, so that the ECG signal can be measured automatically while the
user is sitting in it.
Figure 1.6 Mortality by major causes and age groups, Canada, 2006 [7]
The ECG chair is selected for two reasons. First, according to the Public Health Agency of Canada [7], circulatory
diseases account for more than 28% of deaths in seniors aged 65+ (Figure 1.6); therefore, we choose ECG for
cardiac health monitoring. Second, people spend most of the time during the day sitting on a chair; for example
office workers spend most of their working hours sitting; also at home, people tend to sit to watch TV, operate
computers and play game consoles. Therefore, this research is focused on getting the ECG signal from a chair.

5
When the sensors are embedded into a chair, it means that electrodes do not have direct contact with the skin.
Therefore, the ECG signal needs to enter the measurement system through a barrier of clothes, in which case
capacitive sensing can be used to achieve ECG measurement.
Capacitive sensing refers to the technology that extracts signals through capacitive coupling. A simplified
illustration is shown in Figure 1.7. In capacitive coupling, a conducting electrode and the skin form a capacitor,
with clothes in between acting as a dielectric layer. Through coupling, alternating electrical signals can propagate
from the skin to the metal electrode through the insulating clothes, according to Faraday’s Law and Ampere’s
Law. In this way, we can obtain the ECG signal without the electrode being in direct contact with skin.
Figure 1.7 Illustration on capacitive coupling
In conducting the current research, my objective is to answer the following questions.
1) Is it possible to embed capacitive sensors into a chair so that the chair measures users’ heart rate with their
clothes on?
2) For a typical capacitive electrode, how do different clothing materials and electrode installation schemes
affect the ECG signal quality, in terms of relative strength of ECG signal to noise?
3) What is the origin of motion artifact, and how does motion artifact affect the ECG chair output?

6
1.3 Electrical Activities of the Heart
Figure 1.8 Depolarization of cell membrane[19]
The ECG has its origin in the bioelectrical mechanism used by the neurons to communicate signals. When a
neuron is at rest, the cell membrane separates the cell’s internal environment from the external. Since the cell
membrane is not highly permeable to the K+ and Na+ ions, these positively charged ions are blocked outside of
the cell. As a result, there are two layers of ions with opposite polarities built up across the cell membrane, giving
rise to a voltage potential across the membrane (approximately -70mV), which is called the rest potential (the left
image of Figure 1.8).
However, the charge distribution is not static. When stimulation arrives, ion channels open, and Na+ ions flood
into the cell. In the active area, the inner layer of the cell membrane becomes more positive than the outer layer,
thus the voltage potential across cell membrane becomes positive. In this case, the active area is depolarized (right
of Figure 1.8). The locally concentrated positive ions in the inner layer then start to spread towards inactive areas,
causing an electrical current flow. If there are other ion channels nearby, the propagating potential may be large
enough to trigger adjacent ion channels, inducing subsequent Na+ ions influx to sustain the further voltage
potential propagation; in this case, the voltage potential is called action potential. Finally, the excessive positive
ions from the inner layer will flow out from the cell, restoring the rest potential. The process by which the rest
potential is restored is called repolarization [19].

7
In the described manner, the electrical signal travels along a neuron network to control the contraction of cardiac
muscles. The heart has a delicate network of neurons to drive the entire cardiac cycle (Figure 1.9); these neurons
are divided into several groups, each of which controls a particular part of the heart. The activation of each of
the neuron groups will generate a current flow that is strong enough to reach the body surface. As the current
flows through two points of the body, it generates a voltage potential difference (also known as an ECG signal).
Figure 1.10 Electrocardiogram leads [19]
Because current is a vector quantity with both direction and magnitude, measuring the ECG by placing an
electrode pair at different locations or orientations results in different ECG morphology. A conventional electrode
placement scheme is shown in Figure 1.10.
Figure 1.9 Specialized conduction system of the heart[19]

8
Figure 1.11 Electrocardiogram waveforms in lead II and electrical status of heart
Figure 1.11 shows a lead II ECG waveform, whose corresponding heart activities during each phase in a cardiac
cycle are depicted below. Since the lead II configuration measures the electrical potential gradient from right arm
to left leg, the measurement result is positive when the current’s direction aligns along the right arm to left leg
direction.
At the start of a cardiac cycle, the sinoatrial (SA) node generates an electrical pulse, which propagates along the
interatrial pathway (forming the P Wave), causing atria to contract to pump blood into ventricles. When the active
potential passes through atrioventricular (AV) node, the signal encounters a delay, which allows the blood to
settle in the ventricle (P-Q Interval). Following the AV node, the action potential reaches the bundle of His, a
branch of which points towards the right ventricle, leading to a transient inversion of the current flow direction
(Q Dip). Afterwards, the action potential populates the entire ventricle through the Purkinje fibers to stimulate
ventricular contraction. In this phase, the potential current is the strongest in the cardiac cycle (R peak), therefore
the heart has the strongest contraction. Finally, the ventricular neuron network repolarizes, giving rise to the T
wave.
1.4 Non-Obtrusive Physiological Monitoring
There has been continuous effort in developing non-obtrusive heart rate monitor devices. By non-obtrusive
measurement, we mean that the measurement does not intervene in users’ daily lives, and ideally it does not
require direct contact with the body skin.
Yu et al. [20] utilized four radar transceivers to detect heart rate by Doppler Effect. In their study, the four
transceivers were arranged along four edges of a square with the user standing at the center. By detecting the
frequency changes of the reflected microwave due to tiny body movements, the heart rate was calculated.
Gault et al. [21] made use of a high speed infra-red camera to detect the heart rate. Through video recording, the
small temperature changes in facial vessels due to blood flow were extracted, based on which the heart rate was
obtained.

9
Sensiotech [22] developed a proprietary heart rate and respiration rate monitor based on wide-band radio. The
wide-band radio was put beneath the bed mattress and could measure the heart rate of the user lying on the bed.
Several other works estimated the heart rate from vibration signals. Orlewski et al. [23] embedded ferroelectric
film sensors into a driver seat, which converted the body vibration signals induced by the heartbeat into electrical
signals. The heart rate information could then be extracted from the Fast Fourier Transform (FFT) of the output
signal. Similarly, Klap et al. [24] embedded piezo-electric sensors into the bed mattress, from which the body
vibrations due to respiration, heart beat and movement could be acquired. Junnila et al.[25, 26] proposed a
polypropylene (PP) based sensor to obtain the ballistocardiography (BCG), from which the heart rate signal could
be acquired.
The above work measured the heart rate either remotely or indirectly through clothes. However, they were mainly
focused on the mechanical or thermal signal induced heart activity rather than the electrical signal (i.e.ECG).
Compared with ECG, which is commonly used in healthcare centers, the mechanical signals can provide similar
accuracy in estimating heart rate. However, ECG is valuable in certain applications, such as estimating the systolic
blood pressure[27].
To the author’s best knowledge, the most common interface to extract ECG from a human body without directly
attaching a pair of electrodes onto skin is capacitive coupling (Figure 1.7).
Initially, the concept of capacitive coupling was applied to dry ECG electrodes. The dry ECG electrode does not
require adhesive gel as an electricity-conducting agent; it uses the capacitive coupling principle to sense the ECG,
and the air gap between the electrode and skin serves as the dielectric material. Chung et al.[28] developed a waist
belt with a two-lead ECG and the electrodes were made of conductive fabric. The resulting ECG waveform was
clearly identifiable. Additionally, many studies [29-34] investigated the use of conducting fabric as dry electrodes;
some of them [31, 34] reported results that were comparable to traditional gelled electrodes. Fabric electrodes
were flexible, hence they were comfortable to wear. Another group of research on dry electrode ECG used metal
as conductor. Jeong et al. [35] built a chest belt with three silver-coated brass buttons. When the user wore the
chest belt, the buttons were pressed against the skin, forming a two-lead ECG. After processing the signal with
an adaptive filter, the output ECG was stable and clear. [36-39] implemented similar metal conductor-based dry
electrode ECG.
The dry electrode eliminates the need for conducting gel. As a result, it reduces the preparation time for ECG
measurement, avoids potential skin allergy to the gel and solves the gel drying problem during long time
monitoring. However, it has been reported [40] that dry electrodes actually rely on the sweat and moisture from

10
the skin to achieve high conductivity and good signal quality. Therefore, the issue of hygiene arises, as the
conducting fabric would absorb the skin perspiration, and it may not be able to sustain many washing cycles[41].
Another drawback of the dry electrode is the need for mechanical support to fix electrodes onto skin, and they
are, to some extent, as obstructive as gel electrode systems. Finally, there is a trade-off between user comfort and
signal quality; the tighter the belt becomes, the firmer the electrodes and skin contact, the more robust the system
is against motion artifact, but the less comfortable to wear.
In light of the shortcomings of dry electrodes, research effort started to focus on capacitive ECG, which was
enabled by the availability of ultra-low current noise op-amp recently. Chi et al. [42] did extensive research on
capacitive ECG. They also extended their ECG sensors to EEG monitoring [43, 44] and obtained high fidelity
signals. Sun et al.[45] developed similar capacitive ECG electrodes, and put them into comparison with clinical
ECG acquisition system. However, these studies [42-45] were mainly on wearable configuration, in which case
the users need to wear an elastic garment to maintain a stable and good capacitive coupling.
Another type of capacitive ECG embedded the ECG sensors into the environment, focusing on non-obtrusiveness
and long term vital signs monitoring. Wu et al. [46] placed large conductive fabrics beneath a sheet on the bed
to monitor ECG while the occupant was sleeping, achieving more than 95% accuracy in heartbeat detection. Kato
et al. [47] developed a similar system to detect infants’ ECG on a bed, and they designed the locations and shape
of the electrodes based on the pressure that a baby exerted onto the bed. Besides beds, chairs are attractive
locations to embed capacitive electrodes. Lim et al.[48] implemented a chair with capacitive ECG electrodes, and
the study also investigated the impact of Driven-Right-Leg (DRL) gain on the output noise level. Kim et al. [49]
built a capacitive ECG chair with similar electrode configuration as Lim et al., but they studied in details the
effect of different electrode-skin coupling capacitances on the power line noise output. Arcelus et al. [50]
implemented an active electrode design that can sense ECG capacitively, with heart rate inference accuracy being
around 98.8%.
The previous studies on capacitive ECG furniture provide evidence on the feasibility of acquiring ECG data while
the user is resting. However, several studies [48, 49] reported that power line noise was the major source of
electrical interference. Additionally, less physical constrains to the user results in larger motion artifact.
Despite of the proof of concept on sensing ECG with capacitive electrodes, few of the previous studies paid
attention to the effect of the clothes worn by the users or being padded upon the electrodes. Yet, system designers
do not have control over the thickness or material of the cloth being inserted between the skin and the electrode;

11
therefore it is important to characterize the impact of clothing material and thickness on the capacitive ECG
performance.
Additionally, little information was available in the literature on the design of capacitive electrode dimension and
its configuration. On the one hand, it is difficult for others to repeat the experiment. On the other hand, designers
would have a difficult time choosing the best configuration for their applications. Clearly, the material of the
electrode, size and orientation of the electrodes, do not only affect the electrical capacitance between the skin and
electrode, but also influent the user experience, system sensitivity to motion artifact, and the strength of the ECG
signal perceived at the points of contact.
The current thesis focuses on developing a capacitive ECG system that is embedded into a chair. Furthermore, a
thorough characterization of the electrical properties, as well as the impacts of clothing materials, electrode size
and configuration (i.e. separation distance and orientation) will be performed and documented to fill the gap left
in previous studies.
The rest of the document is organized as follows. Chapter 2 and Chapter 3 are dedicated to the development of a
capacitive ECG chair. Specifically, Chapter 2 introduces the background, concept, design and characterization of
the analog circuit of the system. Chapter 3 describes the digital systems, from background information to
implementation. Chapter 4 is dedicated to the implementation and characterization of the ECG chair. Finally,
Chapter 5 points out the future research directions and limitation of the capacitive ECG chair, and concludes the
thesis.
12
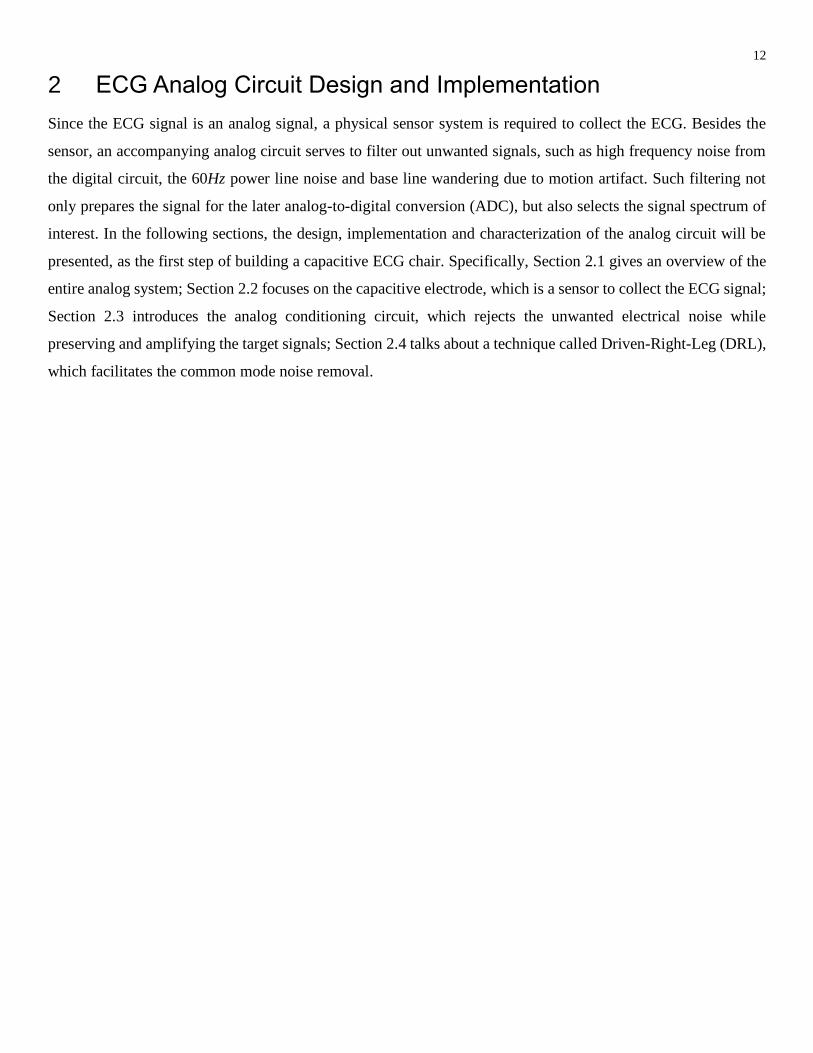
2 ECG Analog Circuit Design and Implementation
Since the ECG signal is an analog signal, a physical sensor system is required to collect the ECG. Besides the
sensor, an accompanying analog circuit serves to filter out unwanted signals, such as high frequency noise from
the digital circuit, the 60Hz power line noise and base line wandering due to motion artifact. Such filtering not
only prepares the signal for the later analog-to-digital conversion (ADC), but also selects the signal spectrum of
interest. In the following sections, the design, implementation and characterization of the analog circuit will be
presented, as the first step of building a capacitive ECG chair. Specifically, Section 2.1 gives an overview of the
entire analog system; Section 2.2 focuses on the capacitive electrode, which is a sensor to collect the ECG signal;
Section 2.3 introduces the analog conditioning circuit, which rejects the unwanted electrical noise while
preserving and amplifying the target signals; Section 2.4 talks about a technique called Driven-Right-Leg (DRL),
which facilitates the common mode noise removal.

13
2.1 Overall Architecture of Analog System
Figure 2.1 Capacitive ECG system architecture
The front end of the analog system, as shown in the shaded part of Figure 2.1 consists of a pair of capacitive
electrodes and a capacitive ground plate electrode. The capacitive electrodes (Section 2.2) sense the body surface
potential via capacitive coupling. Afterwards, the sensed signal is buffered by a low noise, high input impedance
operational amplifier. The operational amplifier serves as an interface between the body and the signal
conditioning circuit. It converts the high impedance of the electrode-skin interface into low output impedance of
the op-amp. The ground plate provides a reference voltage to the human body through capacitive coupling. For
the reasons discussed in Section 4.2.4, the ground plate is not connected to the zero volt ground; instead, it is DC
biased to a voltage of 3.3V. On the other hand, the ground plate can be connected to DRL, which feedbacks the
amplified and inverted common mode voltage collected from both capacitive electrodes. The DRL configuration
helps in suppressing the common mode noise such as the power line noise and motion artifact.
The signal output from the analog front end is fed into the signal conditioning system, which consists of a series
of analog filters and amplifiers. The first stage in the analog conditioning system is the differential amplifier
(Section 2.3.1), which amplifies the differential mode collected from the ECG sensing electrodes. Afterwards, the
signal goes through a 60Hz notch filter (Section 2.3.2) to filter out the power line noise. The next processing unit
is a low pass filter (Section 2.3.3) with cut-off frequency 50Hz. The final component in the analog signal
conditioning system is a non-inverting amplifier (Section 2.3.4) to scale up the signal to the supply voltage range.

14
2.2 Electrode Design and Implementation
2.2.1 Introduction
An electronic sensor converts the real world physical quantities, such as light, heat, sound and movement, into
electrical signals, which can be collected and processed by an electrical circuit [51]. In the case of ECG, the
physical quantity to be measured is the surface voltage potential generated by the heart. As the physical quantity
is already electrical, a pair of electrodes is sufficient in collecting the ECG signal and feeding it to the analog
signal processing circuit without additional sensors.
An electrode is used in the circuit to detect the electrical signal. Its basic operation is presented in Figure 2.2. In
the figure, 𝑉𝑎 is the body surface voltage, 𝑍𝑎 is the electrode body interface impedance as seen by the signal
source, and 𝑍𝑐 is the input impedance to the signal conditioning circuit.
Figure 2.2 Illustration of voltage sensing by an electrode
By applying the voltage dividing principle, the voltage at the input to the signal conditioning circuit can be
expressed by,
𝑉𝑎′ = 𝑉𝑎 ∗
𝑍𝑐
𝑍𝑎+𝑍𝑐. Equation 1
From Equation 1, we see that 𝑉𝑎′ → 𝑉𝑎 when 𝑍𝑐/𝑍𝑎 → ∞. Therefore, in order to maintain a strong output signal,
a measurement unit with large enough input impedance should be chosen based on the electrode-skin interface
properties. Therefore, an operational amplifier (op-amp) with large differential input impedance will be chosen
to implement the electrode buffer.
The most popular ECG electrodes are made of silver (Ag) coated with silver chloride (AgCl). They are attached
to the body with electrolytic gel, which is conductive to electricity. In this way, a low impedance electrode-skin
interface is created; as a result, the electrode can be directly connected to the input of a differential amplifier
(Section 2.3.1) without a buffering stage.

15
Figure 2.3 Equivalent circuit for wet electrode interface
The equivalent circuit of an Ag/AgCl electrode is shown in Figure 2.3. We assume that the ECG potential is
available at the stratum corneum layer of the skin, which has an equivalent resistance of 𝑅𝑠𝑐. The conductive gel
bridges the gap between the stratum corneum and the Ag/AgCl electrode. At the gel-electrode interface, there is
an electrical double layer of ions, due to dissolution and diffusion of the metal ions into the electrolytic gel. The
double layer introduces a voltage drop called half-cell potential at the gel-electrode interface. Since Ag/AgCl
induces a small half-cell potential, it is widely used for biopotential sensing electrodes. For an introduction to the
half-cell potential and the double layer, please refer to Grahame et al. [52]. On top of the electrolytic gel laid the
Ag/AgCl electrode, the electrode and the subsequent wiring altogether have resistance 𝑅𝑎, which is very small
(in the order of Ohm).
Figure 2.4 Equivalent circuit for capacitive electrode interface
Because of the inconvenience in setting up wet electrodes, and the tendency of gel to dry out during a long ECG
recording session, capacitive electrodes are investigated in this thesis. Different from gel electrodes, the capacitive
electrode is supposed to pick up the electrical signal from the stratum corneum layer across clothes. Without
conductive gel, there is no galvanic contact between the electrode and the skin. Instead, the electrode and skin
form a capacitor, with the cloth being the dielectric material. The equivalent circuit is shown in Figure 2.4 .
Without the conductive gel, there is no half-cell voltage drop. The interface becomes a capacitor, whose
capacitance depends on the clothing material and thickness, and generally in the order of pF.
Assuming that the capacitance is 20𝑝𝐹 and the electrode resistance is 5𝛺, the impedance of the electrode-skin
interface at ECG frequency (assuming to be 40Hz) is

16
𝑍𝑎 =1
𝑗𝑤𝐶𝑎+ 𝑅𝑎
= 5 − 2 ∗ 108𝑗
Equation 2
meaning that the interface impedance is significantly larger than that of gel electrodes. According to Equation 1,
the analog processing circuit should have an input impedance that is sufficiently larger than 𝑍𝑎 (i.e. in the 𝐺𝛺
range); some authors set the input impedance to be in excess of 𝑇𝛺 [44] to further increase the electrode sensitivity
(given the same current flow, higher impedance results in higher voltage). As such, a voltage buffer is needed to
provide large input impedance to maintain a voltage value seen by the analog circuit. An operational amplifier
(op-amp) configured as a voltage follower is used (Figure 2.5). For a detailed discussion on op-amp configuration,
please refer to Macini [53].
Figure 2.5 Op-amp configured as voltage follower
When the system is stabilized, a constant voltage appears across the electrode capacitor due to charge
accumulation. A voltage variation on the skin induces redistribution of charges on the electrode plate through a
capacitive coupling effect. For ECG, as its signal strength on the body surface is at the 1mV level, the electric
charge movement from the electrode to the op-amp is pretty small, but it can still be sensed by the op-amp due to
its high input impedance.
For a practical op-amp, there is a bias current flowing into the input terminal due to internal transistors mismatch
and finite input impedance. Such a bias current might overwhelm the small ECG signal current. Therefore, when
selecting operational amplifier, the input bias current needs to be as low as possible. Given high impedance and
low input bias current requirements, the LMP7701 was chosen for the implementation (Section 6.2).
2.2.2 Noise Reduction by Active Shielding
The voltage buffer shown in Figure 2.5 does not amplify the input signal, instead it serves as an impedance
converter that transforms the high skin-electrode interface impedance into low op-amp output impedance seen by
17
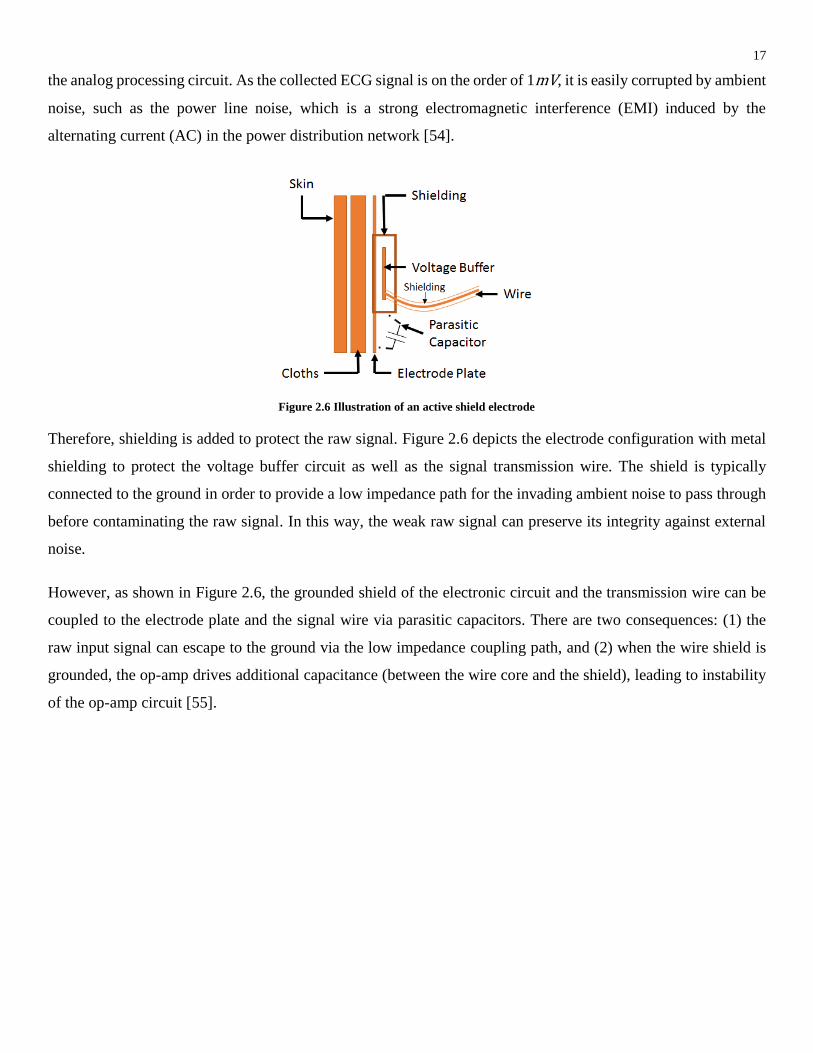
the analog processing circuit. As the collected ECG signal is on the order of 1mV, it is easily corrupted by ambient
noise, such as the power line noise, which is a strong electromagnetic interference (EMI) induced by the
alternating current (AC) in the power distribution network [54].
Figure 2.6 Illustration of an active shield electrode
Therefore, shielding is added to protect the raw signal. Figure 2.6 depicts the electrode configuration with metal
shielding to protect the voltage buffer circuit as well as the signal transmission wire. The shield is typically
connected to the ground in order to provide a low impedance path for the invading ambient noise to pass through
before contaminating the raw signal. In this way, the weak raw signal can preserve its integrity against external
noise.
However, as shown in Figure 2.6, the grounded shield of the electronic circuit and the transmission wire can be
coupled to the electrode plate and the signal wire via parasitic capacitors. There are two consequences: (1) the
raw input signal can escape to the ground via the low impedance coupling path, and (2) when the wire shield is
grounded, the op-amp drives additional capacitance (between the wire core and the shield), leading to instability
of the op-amp circuit [55].

18
Figure 2.7 Schematic of electrode with active shield
In order to mitigate the side effects of a grounded shield, the shield is connected to the output of the buffering op-
amp instead of ground. The configuration is illustrated in Figure 2.7, where the output of the first op-amp is
connected to the circuit shield and the transmission wire shield via a 100kΩ resistor. As the shield is driven by
the op-amp, it is called an active shield. As the potential of the active shield follows the change of op-amp output
(i.e. the potential of electrode plate and transmission wire core), the loading effect of the parasitic capacitor is
eliminated.
There is one problem rising from the active shielding scheme – stability. The active shield provides a path through
which the op-amp output is fed back to the electrode plate (i.e. the non-inverting input of the op-amp) via parasitic
capacitance. This is a positive feedback loop; therefore, there is a chance that the circuit can become unstable
[55].
To evaluate the stability, the loop gain of the circuit is evaluated. A generic feedback system is presented in Figure
2.8, where 𝐴 is the open loop gain and 𝛽 is the feedback gain. The input/output relationship is

19
Figure 2.8 Block diagram of a feedback system
expressed by the following equation,
𝑉𝑂𝑈𝑇 = 𝑉𝐼𝑁 ∗𝐴
1 + 𝐴𝛽
Equation 3
Note that both 𝐴 and 𝛽 are dependent on the signal frequency. At frequency when 𝐴𝛽 = −1, 𝑉𝑂𝑈𝑇 → ∞, the
system becomes unstable. Equivalently, the condition for system oscillation is that the open loop gain equals to
one when its phase shift is -1800. On the contrary, the phase angle from -1800 when the loop gain is unity is called
the phase margin. The larger the phase margin, the more stable the feedback system is. For a detailed discussion
on feedback and stability, please refer to [53].
In order to study the stability of the active shield electrode, the electrode circuit was simulated using pSpice on
the Cadence Capture CISTM software environment [56]. The circuit was modified as in Figure 2.9. The parasitic
capacitor between the circuit shield and the electrode plate was represented by 𝐶1, whose value was estimated as
930pF. At the same time, the electrode-skin interface was represented by 𝐶2, whose value was estimated as 185pF.
𝐿1 and 𝐶4 were added with extremely large values in order to maintain a normal DC bias while blocking the AC
components (i.e. opening the loop). As a result, we obtained the loop gain at the output from the first op-amp.
The gain and phase shift of the open loop are plotted in Figure 2.10.
From the simulation plot, we can see that when the gain is 0dB, the phase shift is approximately -3000, implying
a 1200 phase margin. Therefore, we can conclude that the active shield circuit is stable.

20
Figure 2.9 Schematic for simulating open loop gain of actively shielded electrode
Figure 2.10 Open loop gain and phase shift of the feedback circuit
2.2.3 Circuit Implementation
The complete circuit schematic is presented in Section 6.3.
Figure 2.11 Implementation of electrode ( left to right: voltage buffer circuit, active shield, back of electrode, front of electrode)

21
The actual electrode consisted of a voltage buffer printed-circuit-board (PCB) and an electrode plate. The
implementation is shown in Figure 2.11. A custom made PCB of dimension 4cm by 3cm was used to host the
voltage buffer. Additionally, a 3-axis accelerometer (Section 3.2) was embedded onto the electrode circuit to
detect the movement of the electrode. Because of the addition of the accelerometer, the PCB became a mixed
analog/digital circuit, special attention was paid to minimize the high frequency digital noise, such as separating
the digital ground from the analog ground.
The active shield was made by wrapping a piece of aluminum foil around the electrode circuit board. The
aluminum foil was then connected to the output of the op-amp. The entire circuit board was wrapped around by
a piece of insulating vinyl film, and embedded into the back of the electrode.
Aluminum was chosen as the surface material for the ECG electrode because of three reasons: (1) aluminum is a
good conductor; (2) aluminum is flexible and hence can deform into various shapes to fit the body contour; (3)
large size of aluminum sheets are available at low cost. Compared to copper, aluminum needs special welding to
be joint with other metal (such as copper wires). Therefore, in the current implementation, copper wires were
fixed onto the aluminum sheet with mechanical clapping.
The size of electrode was initially 220 mm by 135 mm. In further experiments, other electrode sizes were tested
to evaluate their ECG signal acquisition performance (Section 4.3).
2.2.4 Skin-Electrode Interface Capacitance
During the simulation (Section 2.2.2) and op-amp selection, the skin-electrode interface capacitance was a piece
of essential information. As pointed out in Section 2.2.1, the skin-electrode interface was indeed a capacitor with
the skin and electrode as the metal plates, and the clothing as the dielectric, in a classic parallel plate capacitor
model. For a parallel plate capacitor, the capacitance is given by
𝐶 =𝜖𝑚𝜖0𝐴
𝑑,
Equation 4
where 𝜖𝑚 is the relative dielectric constant (also known as “relative permittivity”) of the material, 𝜖0 is the
dielectric constant of the vacuum, 𝐴 is the overlapping area of the parallel electrode plates and 𝑑 is the separation
of the two electrode plates.
Although Equation 4 can be used to calculate the capacitance of the skin-electrode interface, the practical
capacitance values deviate from the calculated numbers due to several reasons, such as skin and the electrode not
being entirely parallel, environmental humidity, and the dielectric material not being uniform. Therefore, we set
off to measure the interface capacitance under different conditions (i.e. clothing thickness, pressing force).

22
2.2.4.1 Experiment
Figure 2.12 Electrode for testing the skin-electrode interface capacitance
Figure 2.13 Skin-electrode capacitance testing setting
Figure 2.14 Skin-electrode capacitance testing schematic
Figure 2.15 Skin-electrode capacitance testing sample result
In this experiment, a copper electrode (Figure 2.12 ) was made according to the description in Section 2.2.3, with
a size of 10 cm by 5 cm. Since we were measuring the skin-electrode interface, the voltage buffer was not used
in the experiment.
A copper plate was used in place of the skin to measure the interface capacitance, and an electrode was placed on
top of a copper board separated by a piece of cotton clothing. Our focus here was the interface capacitance, which
was determined from the overlapping area of the plates, separation distance and dielectric material (Equation 4).
Therefore, although the copper was different from the skin with regards to electrical resistivity and mechanical
properties, we used copper plates to measure the interface capacitance. Secondary differences (such as resistivity)
between skin and copper plate could be modeled by connecting extra resistors in series to the ideal capacitor. In
the experiment, the copper plate was grounded, and a square wave with magnitude 2V and 50% duty cycle was
injected to the electrode plate via a resistor 𝑅𝑎 = 1MΩ. The test scheme is illustrated in Figure 2.14.
An Agilent Digital Signal Oscilloscope (DSO6012A) wxas used to read the voltage potential at the electrode. The
skin-electrode interface and the resistor 𝑅𝑎 formed an RC circuit, which had a charging curve as shown in Figure
2.15. Assuming the electrode voltage at 𝑡 = 0 is 0, then the electrode potential at time 𝑡 is given by

23
𝑉𝑒𝑙𝑒𝑐𝑡𝑟𝑜𝑑𝑒 = (1 − 𝑒−
𝑡
𝑅𝑎𝐶) 𝑉𝑖𝑛, Equation 5
where 𝐶 is the skin-electrode capacitance, and 𝑉𝑖𝑛 is the injected square wave voltage. From Equation 5, we can
see that 𝑉𝑒𝑙𝑒𝑐𝑡𝑟𝑜𝑑𝑒 = 0.6332𝑉𝑖𝑛 when 𝑡 = 𝑅𝑎𝐶. Therefore, by finding 𝑡 at which the 𝑉𝑒𝑙𝑒𝑐𝑡𝑟𝑜𝑑𝑒 climbs to 63.32%
of its maximal value, we can obtain 𝐶. Figure 2.15 shows a scenario when we manually locate the 63.32% point.
During the measurement, a plastic mass with known weight was put on top of the upper copper plate to exert
pressure force. Since any metal objects will alter the measured capacitance by coupling with the upper copper,
the conventional weight mass was not used.
The experiment was repeated for different clothing layer counts and different pressing forces on the electrode
against the copper board.
2.2.4.2 Results
Table 2 Skin-electrode capacitance measurement result
The capacitance values of different layer counts and applied forces are shown in Table 2. Note that the capacitance
is measured with an electrode of size 10cm by 5cm. When using the capacitance results with other electrode sizes,
the value must be scaled according to the actual size.
2.2.4.3 Discussion
The main purpose of this experiment was to understand the skin-electrode interface capacitance, which provided
additional information on op-amp selection and electrode placement for building the first ECG chair prototype.
As we can see from Table 2, the capacitances cross all cases tested have values between 11pF to 124pF. This
means that at sub 100Hz frequency range, where the ECG signal lies [35, 57], the average impedance of the skin-
electrode interface is around 47𝑀𝛺 (at 50Hz). According to Equation 1, it indicates that an op-amp with an input
impedance of about 4.7𝐺𝛺 can collect 99% of the ECG signal power. Furthermore, higher input impedance can

24
further enhance the electrode sensitivity; because, given the current is changed by a fixed amount, higher input
impedance devices respond with a higher voltage change.
When a constant force is applied onto the electrode against the copper board, the capacitance decreases with an
increasing clothing layer count. However, this relationship is not linear as predicted by Equation 4. This is most
likely a result from the non-uniform distribution of the cotton thread and air gaps in the dielectric material.
Given the same cotton layer count, higher pressing forces on the electrode result in higher capacitance. This is
because the cotton clothing is compressed by the force, shortening the electrode-copper plate distance.
In order to maximize the skin-electrode capacitance, it is beneficial to put the electrodes at locations with the
largest pressure. The seat is an ideal location for electrodes because it supports most of the body weight.
2.2.5 Electrode Response to Motion Artifact
When the electrode and the skin are static with respect to each other, the coupling capacitance remains stable. In
response to a DC voltage offset, certain amount of electric charge accumulates at the electrode plate depending
on the coupling capacitance. However, when motion occurs between the electrode and skin, the coupling
capacitance is changed. Given a constant voltage 𝑉𝑖𝑛 applied across the skin-electrode interface, the change in
electric charge in response to the change in capacitance is expressed by Equation 6.
𝛥𝑄 = 𝛥𝐶 ∗ 𝑉 Equation 6
The redistribution of electric charge become a current flowing into the op-amp, where it is converted to a sensed
voltage. In this way, motions of the body introduce voltage at the op-amp input, causing motion artifact. To find
out the electrode’s response to motion artifact, the following experiment was carried out. The specific quantity to
investigate was the magnitude of disturbance voltage introduced in the voltage buffer op-amp, and the duration
of this disturbance before the electrode output re-stabilized.

25
2.2.5.1 Experiment
Figure 2.16 Schematic of the electrode circuit used in testing the motion artifact response
In this experiment, the electrode front end was the same as depicted previously in Figure 2.12. As we wanted to
test the stability of the voltage buffer, the buffering circuit was added according to the schematic in Figure 2.16.
In Figure 2.16, 𝐶2 represented the skin-electrode interface coupling capacitance, and 𝐶1 represented the parasitic
capacitance between the active shield and the electrode plate; both of the capacitance values in the schematic
were estimated values, and they were included for illustration purposes only.
The actively shielded electrode was placed on top of a copper board, separated by a layer of cotton clothing.
When the electrode was stabilized, it output a DC voltage of 2.5V due to the single polarity voltage supply at 5V.
A motion was induced to the electrode by pushing the electrode for a predefined displacement, as shown in Figure
2.17. The output from the voltage buffer circuit was recorded and analyzed through an Agilent DSO6012A digital
oscilloscope as shown in Figure 2.18. The waveform was then analyzed to obtain the output voltage distortion
amplitude and the signal recovery time. This step was repeated 10 times to obtain the average values of distortion
magnitude and recovery time.

26
Figure 2.17 Illustration of the experiment setting and motion
artifact introduction
Figure 2.18 Waveform of the electrode output after motion artifact
injection
This experiment was repeated for different displacement directions (horizontal or vertical), displacement distance,
and 𝑅2 setting. Changing 𝑅2 effectively changed the cut-off frequency of the high-pass filter consists of 𝑅2 and
𝐶3 in Figure 2.16. The result is shown in Table 3 in the next section.
2.2.5.2 Results
Table 3 Distortion magnitude and recovery time after motion artifact injection
From the results we can see that, given that all conditions remain constant, the distortion voltage amplitude
increases with larger displacement. For displacement larger than 2mm, the distortions reach the supply rail
voltage, which means that the output is cut-off to the op-amp supply voltage. Such non-linearity brings a loss to
the ECG information. Additionally, the recovery time of a stable buffer output signal increases with larger
displacement distance.

27
Given the same displacement distance and the same 𝑅2 value, the vertical motion artifact induced a larger voltage
distortion to the output, and it also took longer time for the signal to re-stabilize. The signal recovery time in the
vertical case was three times as long as the horizontal case.
A smaller 𝑅2 value provided a shorter signal recovery time for large displacement (>2mm). However, it does not
significantly reduce the distortion voltage magnitude.
2.2.5.3 Discussion
Referring to Figure 2.18, as soon as a motion artifact is induced to the electrode, the output voltage starts
fluctuating. The maximum distortion magnitude is positively correlated to the displacement distance, and it is
generally larger for vertical displacement than for horizontal displacement. However, the magnitude of the
distortion is minimally affected by the 𝑅2 value. This is because in the horizontal displacement, both the
overlapping area and the parallel plates distance remains mostly the same. In the vertical displacement, however,
capacitance changes with vertical displacement. According to Equation 4, and Equation 6, we infer that vertical
displacement causes larger voltage distortion to the buffer output.
After the initial voltage distortion onset, the buffer output oscillates. As time goes on, the magnitude of oscillation
reduces until the output returns to a stable stage. Because the voltage distortion due to motion artifact is transient,
the duration between motion artifact onset and the return to a stable stage is the recovery time for the electrode.
From the recovery time of the electrode, we can estimate the time required by the ECG chair to re-stabilize after
the motion artifact is brought about.
The recovery time is positively correlated to the displacement magnitude, and it is generally larger for vertical
displacement than horizontal displacement. An explanation to this is that vertical displacement introduces a larger
capacitance change. Additionally, it is because the mechanical vibration of the electrode is stronger and more
long-lasting when the electrode is lifted and dropped vertically. Therefore, the recovery time is correlated to the
damping rate of the mechanical vibration. This implies that making the electrode with a large damping rate can
reduce the recovery time after motion artifact distortion.
At the same time, we observed that reducing the resistance value 𝑅2 can lower the recovery time. As mentioned
briefly in Section 2.2.5.2, the 𝑅2 and 𝐶3 formed a high-pass RC filter. By reducing 𝑅2 , the cut-off frequency
increases, making the response rate higher. As such, the distortion oscillation dies down quicker.
In summary, this experiment provides the following insights in the design of electrodes and their voltage buffer.
(1) Moderately large motion artifact (i.e. displacement larger than 2 mm ) can saturate the op-amp output,

28
therefore we need a mechanism to annotate those signals that are seriously corrupted by motion artifact. As a
result, an accelerometer (Section 3.2) is included in the electrode circuit board to measure the motion level. (2)
The cut-off frequency of the high-pass filter consists of C3 and R2 needs to be around 1Hz. Therefore, R2 is
chosen to be1 𝑀𝛺, and C3 is chosen to be1𝑢𝐹. (3) The origin of large motion artifacts is the vertical displacement
from the electrode and it has a strong presence in the output signal.

29
2.3 Analog Signal Conditioning Circuit Design and Implementation
Figure 2.19 Analog signal conditioning block in the architecture
After the body surface potential is collected by the electrode and voltage buffer, it is fed into the analog signal
conditioning circuit as shown in Figure 2.19(shaded box). In the follow subsections, each module within the
analog signal conditioning is explained. The schematic diagram for the entire analog conditioning circuit can be
found in Section 6.3.
Note that the analog circuit is designed to operate with a single power supply at 5V. Compared to the dual power
supply scheme, where the signal can assume values from -5V to +5V, the single supply scheme has its signal
range from 0 to 5V. Although the single supply circuit design is more complicated, the system can then operate
on a single battery, making it portable.
2.3.1 Differential Amplifier (DA)
ECG signals are measured by subtracting the body surface potential at two points. In order to perform such an
analog signal subtraction, a differential amplifier is used. It is possible to build a differential amplifier with
discrete op-amps [53]. However, using an integrated differential amplifier leads to better symmetry between the
two signal paths, which minimizes the chance of system error. A typical differential amplifier has the symbol
representation shown in Figure 2.20, where the differential amp output is 𝑉𝑂𝑈𝑇 = 𝐺 ∗ (𝑉𝐴 − 𝑉𝐵).

30
Figure 2.20 Symbol for differential amplifier
Figure 2.21 Differential mode and common mode of a signal pair
A typical differential amplifier (DA) takes two signal inputs: the inverting signal (𝑉𝐵) and non-inverting signal
(𝑉𝐴), and its output is an amplified version of the difference between inputs. Most DAs have high gain on the
differential mode of the input signals, but they have high attenuation on the common mode of the signals.
A pair of signals can be decomposed into their common mode and differential mode components, as shown in
Figure 2.21.
Common mode is the common component of the signal pair, which can be calculated by
𝑉𝐶𝑀 =𝑉𝐴 + 𝑉𝐵
2
Equation 7
The differential mode is the residue by subtracting the common mode from the input signal. The differential
modes of either input signals have the same magnitude but opposite signs. The magnitude of the differential mode
is expressed by
𝑉𝐷𝑀 =|𝑉𝐴 − 𝑉𝐵|
2
Equation 8
As shown in Figure 2.21, each individual input signal can be expressed as the superposition of the common mode
and differential mode.
As mentioned earlier, DAs are highly sensitive to differential mode signals, while suppressing the common mode;
as a result, the output of the DA is an amplified version of the 𝑉𝐷𝑀. The ability of a DA to attenuate the common
mode is called the Common Mode Rejection Ratio (CMRR), defined by
𝐶𝑀𝑅𝑅 = 20 𝑙𝑜𝑔 (𝐺𝐷𝑀
𝐺𝐶𝑀),
Equation 9
where 𝐺𝐷𝑀 is the DA’s gain for the differential mode signal and 𝐺𝐶𝑀 is the gain for the common mode. The larger
the CMRR, the better the DA filter amplifies the difference between two signals.
The DA selected to receive the ECG electrode buffer output was the INA2321 from Texas Instruments. It has an
approximate CMRR of 94𝑑𝐵, input impedance of 10𝑇𝛺 and input bias current of 0.5𝑝𝐴[58]. Additionally, it
requires a single polarity voltage supply, which fits into our single supply design.

31
Figure 2.22 Internal structure of INA2321 [58]
Figure 2.22 depicts the internal structure of INA2321. It is configured with three non-inverting amplifiers. The
input and output relation of each stage is shown in the following equations.
𝑉𝐴1 = 𝑉𝐼𝑁− ∗ (1 +40
160) − 𝑉𝑟𝑒𝑓 ∗
40
160
𝑉𝐴2 = 𝑉𝐼𝑁+ ∗ (1 +160
40) − 𝑉𝐴1 ∗
160
40
𝑉𝑂𝑈𝑇 = 𝑉𝐴2 ∗ (1 +𝑅2
𝑅1) − 𝑉𝑟𝑒𝑓 ∗
𝑅2
𝑅1
Equation 10
From Equation 10, the output voltage can be further derived.
𝑉𝑜𝑢𝑡 = (𝑉𝐼𝑁+ − 𝑉𝐼𝑁−) ∗ (5 +5𝑅2
𝑅1)
Equation 11
At this stage, the gain of the differential signal is set to the lowest value (i.e. 5) to avoid amplifying the high
frequency noise components. It is achieved by shorting 𝑅2 while leaving 𝑅1 as an open circuit.

32
2.3.2 Twin-T 60Hz Notch Filter
Figure 2.23 Circuit diagram for a Twin-T notch filer
The signal coming out of the differential amplifier is contaminated by the 60Hz power line noise. In the home
setting, where appliances and lighting are powered by the 60Hz AC power, the power line voltage can intrude
into our measurement circuit as a form of electromagnetic interference (EMI) via capacitive coupling between
the power line and the circuit. Since the appliance supply voltage is 120𝑉𝑅𝑀𝑆, the power line noise can well
exceed the 5V supply voltage in our system if it is not removed before amplification.
A typical 60Hz noise removal method is notch filtering the signal. The twin-T notch filter shown in Figure 2.23
serves this function [59]. It is a combined low-pass and high-pass filter. The first “T” in the twin-T consists of
𝐶1,𝐶2 and 𝑅3, and it is a high-pass filter. The second “T” consists of 𝑅1, 𝑅2 and 𝐶3, which is a low pass filter. 𝑅4
and 𝑅5 create a mid-rail reference voltage from a single voltage supply, both of their resistances are equal to a
large value. The op-amp is a voltage follower, which buffers the filtered signal for the next conditioning stage.
The signal frequency to be notched out is determined from the circuit component values as
𝑓𝑛𝑜𝑡𝑐ℎ =1
2𝜋𝑅𝐶
𝐶 = 𝐶1 = 𝐶2 = 1/2𝐶3 𝑅 = 𝑅1 = 𝑅2 = 2𝑅3
Equation 12
For the full derivation of the notch frequency and setting the Q-factor of the circuit, please refer to [59].
For our application, we selected a high resistor value to limit the DC current flowing through the system.
Therefore we chose 𝑅 = 5.6𝑀𝛺 and 𝐶 = 470𝑝𝐹. The exact notch frequency 𝑓𝑛𝑜𝑡𝑐ℎ = 60.4692𝐻𝑧
The circuit design (Figure 2.24) was input to the Cadence Capture CISTM platform and its frequency response
was simulated using pSpice.

33
Figure 2.24 Simulation schematics for the 60Hz twin-T notch filter
Figure 2.25 Simulated frequency response of the 60 Hz notch filter
The simulation result shown in Figure 2.25 reveals that the notch filter offers an attenuation of about -40dB at
60Hz.

34
2.3.3 Low pass Filter
After the 60Hz noise is removed, the signal goes through a low pass filter, where the high frequency components
are removed. On the one hand, removing the noise produces a cleaner signal output; on the other hand, it is an
anti-aliasing measure to prepare the signal for analog to digital conversion.
Typically, a low pass filter removes high frequency components and preserves the low frequency ones. Its gain
is a function of signal frequency. In Figure 2.26 , four classes of low pass filter gain functions are illustrated.
These filters are in fifth order, meaning that their transfer functions have five poles. Depending on the location of
the poles in the s-plane, the filter assumes different transfer function characteristics.
Figure 2.26 Comparison of the different types of low-pass filter [60]
A Butterworth filter has its poles distributed uniformly along the circumference of a circle centered at the origin;
additionally, for a stable filter, the pole is distributed only on the left-hand-side of the s-plane. The major
advantage of the Butterworth is the maximally flat pass band gain and stop band attenuation. However, the
transition rate (also known as the “roll off rate”) from pass band to stop band is slow.
Chebyshev filters Type I has its poles distributed along an ellipse centered at s=0. Of course, for stability
consideration, all poles should be located on the left half of the s-plane. Chebyshev Type I has a narrow transition
band (i.e. fast roll off rate), but it also has ripples in the pass band. By manipulating the locations of poles and
zeros, the ripples can be moved to the stop band, in which case it becomes a Chebyshev Type II filter. Finally,
the general form of Butterworth and Chebyshev filter is the Elliptic filter, which has ripples both in pass-band
and stop-band, and they can be tuned separately. Sedra et al. [61] has discussed in details the mathematical
expressions of the transfer polynomials of the above filter types.
In this application, a Butterworth filter is attractive as it has maximally flat pass band and stop band characteristics,
which introduces the least distortion to the filtered signal.
According to [61] , the transfer polynomial for a 4th order Butterworth low-pass filter is expressed as follows:

35
𝐻(𝑠) =1
𝑐0 + 𝑐1𝑠 + 𝑐2𝑠2 + 𝑐3𝑠3 + 𝑐4𝑠4
𝑐0 = 1.0000000000 𝑐1 = 2.6131259298 𝑐2 = 3.4142135624 𝑐3 = 2.6131259298 𝑐4 = 1.0000000000
Equation 13
In Equation 13, 𝑠 = 𝜎 + 𝑗𝜔 is the complex variable in the s-plane, whose imaginary axis consists of frequency
values that are normalized against the cut-off frequency of the low pass filter. The coefficients of the denominator
are well tabulated in [62].
The next step of the filter design is to find a two terminal circuit network whose output/input relationship can be
mapped to that described in Equation 13. A commonly used circuit topology is the Sallen-Key Topology [63].
Figure 2.27 Basic unit of a 2nd order Sallen-Key low-pass filter
Depicted in Figure 2.27 is a basic unit of the 2nd Sallen-Key topology. Utilizing the feedback of an op-amp and
four passive components, this topology can construct a 2-pole system, whose transfer function is given as follows:
𝐻(𝑠) =𝐾
𝑠2+(𝑅1𝐶1+𝑅2𝐶1−𝑅1𝐶2(1−𝐾))𝜔𝑐𝑠+1,
𝐾 = 1 +𝑅4
𝑅3,
𝜔𝑐 =1
√𝑅1𝑅2𝐶1𝐶2.
Equation 14
In Equation 14, 𝑠 is a Laplace variable normalized against the cutoff frequency 𝜔𝑐, and 𝐾 is the circuit gain of
the system. A 4th order low pass filter can be created by cascading two stages of the low pass filter. The resulting
transfer function is expressed as

36
𝐻(𝑠) =𝐾
𝑠2+(𝑅1𝐶1+𝑅2𝐶1−𝑅1𝐶2(1−𝐾))𝜔𝑐𝑠+1∗
𝐾′
𝑠2+(𝑅1′𝐶1′+𝑅2′𝐶1′−𝑅1′𝐶2′(1−𝐾′))𝜔𝑐′𝑠+1,
𝐾 = 1 +𝑅4
𝑅3 , 𝐾′ = 1 +
𝑅4′
𝑅3′ ,
𝜔𝑐 =1
√𝑅1𝑅2𝐶1𝐶2=
1
√𝑅1′𝑅2′𝐶1′𝐶2′= 𝜔𝑐′.
Equation 15
Using Equation 15 and Equation 13, the passive component values can be determined. This process can be done
by some well-developed programs, such as MATLABTM or WEBENCHTM Designer. Before running the
program, we needed to set the cut-off frequency. As the frequency components of the QRS complex in an ECG
signal lie in the range between 1-30Hz [64], a low-pass filter with 50Hz cut-off frequency and pass-band gain of
10 was used. Moreover, the low-pass filter can help in rejecting the 60Hz power line noise and anti-aliasing the
signal (i.e. suppressing those signal frequencies beyond half of the digital sampling frequency, or 400Hz, as will
be discussed in Section 3.1).
Therefore, we substituted 𝜔𝑐 = 2𝜋 ∗ 50 and 𝐾 = 𝐾′ = √10 into Equation 15 and obtained the following
electronic component values, displayed in Figure 2.28.
Figure 2.28 4th order Butterworth low-pass filter component values computed from WEBENCH Designer
The exact components showed in Figure 2.28 were not generally available, therefore some of them were replaced
by their closest approximations, resulting in the schematic implementation displayed in Figure 2.29.

37
Figure 2.29 Simulation schematics for the 50Hz low-pass filter
The circuit was input into Cadence Capture CISTM [56] and simulated with pSpice. The results (Figure 2.30 )
showed that those signals within the pass-band had a 20dB boost, while those falling above 200Hz had a -40dB
attenuation.
Figure 2.30 Simulated frequency response of the 50 Hz low-pass filter

38
2.3.4 Non-inverting Amplifier
Up to this point, the input signal has gone through a differential amplifier, a 60 Hz notch filter and a 50Hz low-
pass filter. The signal received a combined amplification of 50, so a 1mV ECG signal is amplified to 50mV. As
the ADC takes in analog signals between 0 and 5V, we still need to scale up the low-pass filtered signal to make
full use of the dynamic range of the ADC. Considering the motion artifact can introduce a significant fluctuation
to the output signal, an 80% margin shall be left to prevent signal saturation. As a result, a gain of 20 is
implemented by a final stage non-inverting amplifier, scaling a 1mV signal to 1V.
The resulting non-inverting amplifier [53] was constructed by selecting the closest available components, and the
schematic is shown in Figure 2.31.
Figure 2.31Simulation schematics for the non-inverting amplifier
2.3.5 Analog Conditioning Circuit Implementation and Characterization
Figure 2.32 Implementation of analog conditioning PCB
The signal conditioning chain is implemented on a printed circuit board (PCB) according to the circuit schematic
included in Section 6.3. The finished board has dimensions of 10cm by 7.5cm, and it is shown in Figure 2.32
Implementation of analog conditioning PCB.

39
In order to validate the functionality of the analog conditioning filters, sine waves of different frequencies were
supplied to the input of the differential amplifier, and the output waveforms from each filter stage were captured.
By analyzing the output and input waveforms, we can obtain the filter gain and phase shift.
Specifically, sine waves of frequencies from 0 to 200Hz were generated by an Agilent 33220A signal generator,
and they were fed into the differential amplifier. Both the input and output waveforms of each filter were captured
by an Agilent DSO6012A oscilloscope. The resulting transfer functions of each filter stage as well as the overall
transfer function are plotted in Figure 2.32
Figure 2.33 Gain of each filter stage

40
Figure 2.34 Phase shift of the entire system
Each filter stage conditions signal as expected: the differential amplifier has a constant 30dB gain across the entire
input signal spectrum; the notch filter introduces an attenuation of almost -40dB to 60Hz signal; the low pass filter
gives a 20dB boost to its pass band signal while the gain starts to roll off at 50Hz. The overall gain across the
pass-band is 46dB in the pass-band and -15dB in the stop-band. The pass-band and stop-band difference is as high
as 61dB.
In terms of the phase shift, we observe that the phase function before 60Hz is quite linear with a slope of 50/Hz,
which is translated to a constant time domain delay of 13ms. A constant time delay means that the signal is not
temporally distorted.

41
2.4 The Driven-Right-Leg Noise Reduction Technique
2.4.1 Introduction
Linear filters reject signals of certain frequencies unselectively. For example, the notch filter described in Section
2.3.2 suppresses the 60Hz signal without questioning whether they are power line noise or normal ECG signal
component. Additionally, the attenuation of analog filter is not high enough to remove the 60Hz noise entirely.
In light of the above short comings, a noise reduction technique called the driven-right-leg (DRL) was developed
by Bruce et al.[65]. Instead of unselectively suppressing the signals at certain frequencies, DRL targets the
common mode signal from the two electrodes. Figure 2.35 provides an illustration on the DRL technique. When
the power line noise is coupled to the human body, it appears at both electrodes, becoming a common mode
voltage 𝑉𝑎. The DRL circuit then amplifies and reverses the polarity of the common mode signal; and the result
(−𝐺𝑉𝑎) is fed back to the human body. This negative feedback is supposed to reduce the common mode signal
until both the common mode and the DRL output become 0 (the right in Figure 2.35).
Figure 2.35 Illustration of the driven right leg technique
Figure 2.36 illustration on capacitive driven right leg technique
Traditionally, the DRL is implemented through a direct contact electrode. However, in our application, the
contacts with body are capacitive. Since the capacitive interface impedance is much higher than direct contact,
and it is more susceptible to motion artifact. Therefore, the DRL electrode plate was moved from the right leg to
the chair seat in our application, where the DRL is closer to the ECG electrode to enhance its common mode
rejection capability and the body weight exerts pressure onto the DRL electrode to prevent movement.
In similar projects, such as Lim et al.[48] and Kim et al.[49], the capacitive DRL technique was applied, and it
yielded positive outcomes.

42
2.4.2 Implementation
Figure 2.37 Schematic for DRL circuit
The circuit for DRL is shown in Figure 2.37. The common mode from both of the electrodes (i.e. DRLA in the
figure) is captured and buffered by a voltage follower implemented with an LMP7702 op-amp. Then the buffer
output is fed into an inverting amplifier with gain 20, which generates an inverted and amplified version of the
common mode signal. The output from the DRL drives an electrode that is embedded into the chair seat. Since
the coupling capacitance between the electrode and the human body is large, a 1𝑛𝐹 capacitor (i.e.C8) is added as
a dominating pole to prevent oscillation[58].
Figure 2.38 Setting to evaluate the DRL performance
Figure 2.39 Modification to the analog conditioning board to test the DRL
performance
In order to verify the efficacy of the DRL in reducing the power line noise, an experimental prototype was built
as shown in Figure 2.38. The prototype was a chair with the ECG electrodes embedded on the seat and the DRL
plate on the backrest. Additionally, the resistor R9 in Figure 2.37 was replaced by a potential meter as shown in
Figure 2.39 to adjust the DRL feedback gain.
Note that due to later experiment (Section 4.2) results, the ECG electrodes and DRL electrode will switch
positions in later prototypes; however, the result for the DRL performance in the current section is still valid.

43
Figure 2.40 The noise measured at the output of differential amplifier. (Left) Floating ground, (Middle) DRL with gain 0.08 and (Right)
DRL with gain 101.4
In the following experiment, we studied the relationship between DRL feedback gain and the power line noise
magnitude in the human body. A male subject of 26 years old with a body mass index (BMI) of 21 sat on the
ECG chair with his back leaning onto the chair back rest. Initially, the DRL/Ground plate was disconnected to
obtain the baseline, in which case the power line noise would be maximal. The output from the differential amp
(before the notch filtering) was probed with an Agilent DSO6012A oscilloscope. The noise peak-to-peak
magnitude and root-mean-square (RMS) values were measured using the built in function of the oscilloscope.
Furthermore, the frequency spectrum of the input signal was calculated by Fast-Fourier-Transform (FFT).
The previous step was repeated for the DRL with different feedback gains. For the entire experiment, the subject
wore a 100% cotton T-shirt and a pair of cotton jeans, and the test was performed in the Home Lab at Toronto
Rehabilitation Institute-UHN with all its lighting turned on.
Figure 2.40 shows a few samples of noise waveforms from the experiment. The baseline signal was noisy; the
spectrum analysis showed that the noise was mainly at 60Hz. By connecting the DRL, the 60Hz noise reduced by
around 8dB, even though the DRL feedback gain was as small as 0.08. In the case when the feedback gain was
100, the 60Hz noise almost disappeared.
Figure 2.41 plots the noise magnitude against different DRL feedback gain. Compared to floating ground or
grounded electrode, DRL offered the best noise reduction performance in all gain settings tested. The noise
reduction performance improved with larger feedback gain, however the improvement diminished as the gain
grew beyond 20. This diminishing effect is in line with findings by Lim et al.[48]. Due to this result, a feedback
gain of 20 was chosen, in order to maximally reduce 60Hz noise while preserving the ECG signal.

44
Figure 2.41 DRL noise reduction performance vs feedback gain

45
3 Digital Data Acquisition System
Figure 3.1 Capacitive ECG system architecture (digital processing part)
After the analog signal is collected, it needs to be digitized to be stored in a computer, where subsequent data
digital signal processing can happen. The digital data acquisition system enables the ECG chair to monitor and
record a user’s heart vital sign to a remote server. In this chapter, the process of digitizing, transmitting and
logging ECG data will be presented.
An analog-digital-converter (ADC) is the bridge connecting the analog and digital worlds. When the conditioned
analog signal goes through an ADC, it is converted into a digital representation, which is more robust to external
noise and suitable for long distance transmission. As such, an ADC was implemented on the signal conditioning
board (Figure 2.32) right after the analog processing circuit.
Starting with the ADC, the digital data acquisition system is highlighted in Figure 3.1. In the digital domain, an
embedded microcontroller unit (MCU) (Section 3.4) coordinates peripheral units, including the ADC (Section
3.1), Wi-Fi transmission (Section 3.3) and accelerometer (Section 3.2). The Wi-Fi module converts the data
stream into wireless signals and enables them in the internet protocol (IP) network. In a remote end, a data server
(Section 3.5) continuously captures the ECG chair data packets and stores them into a file.
The following sections will explain each of the digital modules as related to our ECG chair application.

46
3.1 Analog-Digital-Converter (ADC)
3.1.1 Introduction to AD7685
The ADC used in the current ECG chair is AD7685, which is a 16-bit ADC and uses a charge redistribution
successive approximation technique [66] to complete the digitization. It is a high speed device and able to sample
at a rate of 250k samples per second (sps).
Before setting the sampling rate for the ADC, we need to know about the analog frequency range of the signal.
The required ECG spectrum depends on the specific application. For example, medical diagnosis needs high level
of details, demanding a wide spectrum range (i.e. 1-100Hz) of ECG waveform; on the other hand, heart rate
detection needs far less details of the ECG signal, leading to a narrower spectrum range requirement (i.e. 1-35
Hz) [35, 46, 57, 67]. According to Nyquist-Shannon sampling theorem, the sampling rate of ADC should be at
least twice as large as the maximum analog frequency. Therefore a sampling rate of 200Hz is able to preserve
enough information of ECG for diagnostic purposes (i.e.100Hz). However, we chose the 400Hz sampling rate in
order to further protect the digitized signal against aliasing.
Figure 3.2 Schematic of a typical AD7685 ADC[68]
Figure 3.3 Internal structure of the AD7685 (simplified) [68]
A typical application scheme for the AD7685 is shown in Figure 3.2. A differential pair IN+ and IN- accepts
analog signal in the range of (0, 𝑉𝑟𝑒𝑓). Afterwards, the analog signal is sampled, and internal quantization occurs
to convert the analog value into a 16-bit binary number. The pins on the right in Figure 3.2 form a digital Serial
Peripheral Interface (SPI), through which the ADC is controlled and the digitized signal is read.

47
Figure 3.4 Ideal analog to digital conversion curve for AD7685[68]
The transfer curve from analog to digital is shown in Figure 3.4. Given the maximum input voltage is 5V, the
voltage amplitude that one least-significant-bit (LSB) represents is
𝛥𝑉 =5𝑉
216−1= 7.63 ∗ 10−5𝑉.
Equation 16
The conversion process involves two arrays of weighted capacitors connected to either end of a comparator, as
shown in
Figure 3.3[68]. During the sampling stage, the capacitors are connected to IN- and IN+, and they are charged to
the input signal voltage. In the conversion stage, a successive approximation algorithm controls all switches of
capacitors to toggle between 𝑉𝑟𝑒𝑓 and GND line. The toggling of switches makes the comparator input vary by
binary weighted voltage steps (𝑉𝑟𝑒𝑓/2, 𝑉𝑟𝑒𝑓/4, … , 𝑉𝑟𝑒𝑓/65536). The switching starts with the most significant
bit (MSB) and lasts until the comparator gets back to a balanced condition, when the resulting digital output is
determined by the on-off states of each capacitor.
For the details on the ADC operation and other ADC performance parameters, please refer to the product datasheet
[68].
3.1.2 The Serial Peripheral Interface (SPI)
The SPI was first introduced by Motorola as a communication protocol to transmit data between microprocessor
and its peripherals [69, 70].

48
Figure 3.5 Typical SPI topology [69]
Figure 3.6 Typical SPI waveforms [69]
The SPI protocol is a one-to-many protocol, with one master controlling multiple slaves (Figure 3.5). Each
communication channel requires four wires: SLCK transmits the clock signal, SS selects the target slave, MOSI
is the master-output-slave-input data line and MISO is the master-input-slave-output data line. A communication
session begins with the master lowering the target slave SS line (Figure 3.6); then the master supplies the clock
signal via SCLK, according to which data are transmitted on the MOSI or MISO line.
The transmission rate is set by the clock frequency on SCLK. The rising edge and falling edge of the clock mark
the data sampling time and bit transition time, respectively (Figure 3.6). There is no data rate limit, as long as the
clock is resolvable by the master and slave. Since the data sampling and transition are done according to a clock,
SPI is a kind of Universal Synchronous/Asynchronous Receiver and Transmitter (USART) communication.
Despite its high communication speed, the high wire-counts and the need for a dedicated I/O port for each SS line
are SPI’s drawbacks.
3.1.3 Embedded Software Driver for ADC
Figure 3.7 Physical connection between MCU and AD7685 [68]
Figure 3.8 Communication waveform with AD7685 [68]

49
In our ECG chair application, an EFM32WG990 micro-controller (Section 3.4) acts as a master to control the
ADC and read digitized data. The physical connection between the MCU and the ADC is displayed in Figure 3.7
[68], where differences in nomenclature are indicated for consistency. In the diagram, the MOSI line is not used;
the instructions sent from the MCU to the ADC are embedded into the communication waveforms on the existing
3 wires by adapting the original SPI protocol. The modification in waveforms are shown in Figure 3.8, where the
embedded custom command portion is highlighted in a darker shade and the standard SPI is highlighted in lighter
shade.
Before the data transmission, the MCU indicates the start of analog to digital conversion by lowering the SS line
(CNV). Upon receiving this signal, the ADC begins the conversion, and pulls down the MISO (SDO) line to
indicate the conversion finishes. Exchanging signals in this way enables the MCU to control the behavior of ADC.
However, this custom command is non-standard SPI, therefore, a separate driver is needed to implement this
signal sequence.
When the data is ready, the MCU can invoke a standard SPI function to readout the 16-bit digital data. The
implementation of the MCU to ADC communication is listed in the following pseudo code.
Listing 1 ADC driver code
function ADC_Read:
Reset all pins to default values
Output low at SS pin
Delay for 4 𝜇𝑠 1
Invoke SPI_Read function to read the ADC data
return the digitized value
1 The maximum conversion time is 3.2𝜇𝑠 according to [68]

50
3.2 Accelerometer
3.2.1 Introduction to ADXL345 Accelerometer
Figure 3.9 Illustration on accelerometer operation principle (from instrumentation.com)
Figure 3.10 Accelerometer microstructure [71]
Figure 3.11 Internal functional blocks of an accelerometer [72]
As mentioned in Section 2.2.5, the motion artifact sometimes saturated the op-amp, leading to a loss of
information. Relevant research [29, 36, 73] showed promising results in removing small motion artifact by

51
utilizing the acceleration information. Even if the motion artifact cannot be removed completely, having the
acceleration information can indicate the motion corruption level. Therefore an ADXL345 accelerometer was
integrated onto the electrode PCB.
Lying at the heart of an accelerometer is a micro-electromechanical system (MEMS) that senses accelerations.
Figure 3.9 illustrates such a system: at the center, there are two moveable plates (also known as “proof mass”)
suspended by two mechanical springs. The outward-stretching horizontal plates are attached to the proof mass.
Each of these plates are suspended between two fixed plates, forming two back-to-back capacitors (i.e. C1 and
C2). When there is acceleration along the direction of the spring, the spring is either compressed or stretched,
introducing displacement of the proof mass and hence changing the capacitance of C1 and C2. By sensing the
values of C1 and C2, the acceleration can be determined.
Figure 3.10 shows a microscopic picture of an actual accelerometer, in which the proof mass, fix plates and
capacitor plates are formed on a piece of silicon. The internal functional blocks of ADXL345 are shown in Figure
3.11. Besides the MEMS, it has also an on-chip ADC that outputs acceleration values in digital format [72], which
can be read using the Inter-Integrated Circuit (I2C) protocol.
3.2.2 The Inter-Integrated Circuit (I2C) Communication Protocol
Figure 3.12 Typical I2C topology [69]
Figure 3.13 Typical waveform and data format of the I2C protocol[69]
The I2C communication protocol was developed by Philips semiconductor to enable communication between ICs
[69]. I2C and SPI are the two de facto inter-chips communication protocols. Under I2C, one chip is connected to
another using 2 wires: SDA for data and address; SCL for the transmitting clock. The simplicity in physical
connection comes with a cost of higher handshaking overhead. For the current I2C standard, the maximum speed
is at 3.4Mb/s.

52
The master device begins a transmission by pulling down the SDA line, while the SCL line is kept high, as shown
in Figure 3.13. As soon as the transmission starts, the master transmits a clock signal, according to which the data
bits are sampled by the slave. Upon completion, the master holds the SCL high while pulling up the SDA to end
the transmission.
The data transmitted in between the start and stop indicators follows a certain format. The lower part of Figure
3.13 shows some essential elements inside a data packet: (1) the address of the slave, (2) the read/write indicator
bit, (3) the data byte and (4) the acknowledgement bit. For operation details, please refer to [69].
The master and slave roles are not fixed in the I2C architecture. Whichever device initiates the communication
by sending the start signal becomes the “master”, and the “slave” receives packets by listening to the address field
in the data. Therefore, I2C provides more flexibility for inter-device communication with lower wire counts than
SPI.
3.2.3 Embedded Software Driver for Accelerometer
Figure 3.14 Physical connection between MCU and ADXL345[72]
Figure 3.14 shows the physical connection between the ADXL345 and the MCU. The relevant pins on the MCU
are annotated with the I2C nomenclature to maintain consistency. The ADXL345 can be accessed by writing to
and reading from the relevant registers.
Listing 2 ADXL345 driver code
function ADXL_Initialize:
Read the device ID register to make sure it is physically connected
if (device is not connected)
return
Set the data rate to 400Hz by writing 0x0c to register BW_RATE
Set the full resolution, in 8g range by writing 0x0a to register DATA_FORMAT
Set the accelerometer into stream mode by writing 0x8F to register FIFO_CTL
Start the measurement by writing 0x08 to register POWER_CTL
Calibrate the accelerometer

53
function ADXL_Calibrate:
for each of the 3 axis
{ read in 32 samples
take the average of the 32 samples
load the averaged result into the offset cancellation register
}
function ADC_Read:
for each of the 3 axis
{
read the data from the sample register
}

54
3.3 Wi-Fi Module
3.3.1 Introduction to the TCP/IP Protocol Stack and Wi-Fi Module
Figure 3.15 Communication between hosts via TCP/IP[74]
Figure 3.16 Data flow through the IP/TCP/Application layers[74]
TCP/IP protocol stack is a widely used communication protocol stack to exchange information between
computing machines.
A typical conversation structure between two applications on two hosts is shown in Figure 3.15. Once a packet
is sent out by a host to the channel, the packet starts its journey to look for the destination by its Internet Protocol
(IP) address. The IP addresses is required by the IP layer to locate a host within a network. The IP layer guarantees
that a packet is sent to the target hosts; however, it is not responsible to eliminate packet loss or out-of-order
arrivals. To maintain the quality of data stream, the Transmission Control Protocol (TCP) requests for
retransmission of missing packets and keeps received packets in sequence.

55
An application running on the host machine accesses the TCP layer via a data structure called socket. A socket is
a file descriptor through which an application can read (write) the data from (to) TCP. From the application point
of view, retrieving data from a socket is nearly the same as reading data from a normal file. In the book by
Donahoo et al. [74], a comprehensive description on the TCP/IP protocol is available.
TCP/IP defines the communication on the network level. The physical level and data link level of the
communication is up to the specific implementation. Physically, the host can be connected to the routers via cable
or wireless radio. Even with the same radio channel, different modulation schemes and data link protocols give
rise to different wireless networks, for example ZigBee, Bluetooth and Wi-Fi.
Considering a chair should be moveable within the house, a wireless network is the best choice. Additionally,
based on Section 3.1, the data rate of an ECG chair is estimated as
400𝑠𝑎𝑚𝑝𝑙𝑒
𝑠𝑒𝑐∗ (16 ∗ 4 + 32)
𝑏𝑖𝑡
𝑠𝑎𝑚𝑝𝑙𝑒∗ 1.5 = 57600
𝑏𝑖𝑡
𝑠𝑒𝑐 .
Equation 17
In Equation 17, the constant 1.5 is a conservative estimation for communication overheads, which can be larger
in practice; 16 is the number of bits in each data element (i.e. acceleration X, Y, Z and the ECG magnitude); 32
is the number of bits for the dataset delimiters.
Table 4 lists a comparison among popular wireless standards. Since each ECG chair has data rate at around 8KB/s
(Equation 17), and there could be more than three ECG chairs in one home, the data rate requirement could be as
high as 32KB/s. Additionally, other smart home devices also stream data at a similar rate, which further increases
the bandwidth demand to several hundred KB/s. From Table 4, the data rate of ZigBee (20~250KB/s) does not
meet the requirement of a Smart Home with multiple data streams. Additionally, the network size (1-7) and
communication range (1-10+m) of Bluetooth limit future expansion of the network. As a result, Wi-Fi
communication is chosen for this application.
Table 4 Comparison among ZigBee, GSM, Wi-Fi and Bluetooth [75]

56
Figure 3.17 The HC 21 Wi-Fi Module
Figure 3.18 Configuration interface for HC-21 Wi-Fi module
The Wi-Fi module HC21 is adopted as the Wi-Fi transceiver for the ECG chair. The module provides pre-loaded
TCP/IP stack and a simple configuration interface (Figure 3.18). By setting the IP address and port number of the
remote server, the Wi-Fi module establishes a connection to the server. During operation, the HC21 transmits the
data it receives from the Universal Asynchronous Receiver and Transmitter (UART) port to the destination server
automatically.

57
3.3.2 The Universal Asynchronous Receiver and Transmitter (UART) Communication
Figure 3.19 Typical UART connection
Figure 3.20 Typical UART data packets
UART, unlike SPI and I2C, does not require a clock signal during transmission; therefore, it is named
asynchronous receiver and transmitter. A typical UART connection consists of 3 wires: MOSI is the master-out-
slave-in data line; MISO is the master-in-slave-out data line; GND is the common signal ground line. Despite the
notation, there is not one fixed “master” to control the transmission, but both parties can initiate the
communication.
Because there is no synchronizing clock signal, both parties involved in the UART communication need to agree
on the same baud rate by configuration. If the baud rates of the two devices do not match, the data will be
misinterpreted. Additionally, a start bit is needed to indicate the start of data transfer; correspondingly a stop bit
is needed when a data block is transferred (Figure 3.20). A data block consists of 8 bits, with an optional parity
bit. The number of data bits is not fixed, and it is subject to configuration [76].

58
3.4 ARM Central Controller
3.4.1 Introduction to EFM32WG Module
Figure 3.21 EFM32 development board
Figure 3.22 Architecture of the digital embedded system
The operations of the accelerometer, Wi-Fi and ADC need to be coordinated. Given the three different
communication protocols they use, an MCU with dedicated SPI, UART and I2C functional modules is
recommended. The EFM32WG990F256 MCU [77] by Silicon Laboratory is selected to act as a central
coordinator among the different peripheral modules.
3.4.2 Embedded Software Implementation
The MCU lies at the center of the digital embedded system architecture (Figure 3.22). In every sampling cycle,
the MCU fetches the data from the ADC and accelerometer. Then the retrieved data are delimited and stored in a
data structure consisting of the ECG value, Accelerometer (X, Y, Z -Axis) values. Afterwards, the data structure
is packed into a character string and sent to the Wi-Fi module, which relays the data to a remote data logging
server. Listing 3 shows the firmware pseudo code.
Listing 3 MCU controlling code
function MCU_Initialize:
Enable internal clock signals for relevant modules (such as MCU core, timer, USART, UART, I2C)
Enable the Input/Output pins for USART, UART and I2C modules
Configure the USART, UART and I2C (data rate, data format etc.)
Initialize USART, UART and I2C
Call ADXL_Initialize
Call ADXL_Calibrate
function MCU_FetchData:
Loop until errors:
Call ADC_Read
Store the data into ECG value variable
Call ADXL_Read
Store the data in ACCEL_X, ACCEL_Y, ACCEL_Z variables
Convert data into character string, add in delimiters at string boundaries
Send the data string out via UART
Delay a certain time DL1
1DL was determined empirically to ensure the loop happens at 400Hz

59
3.5 Data Logging Server
3.5.1 Server Architecture
Figure 3.23 Server client model of a vital sign collection
network
Figure 3.24 Internal structure of a data logging server
As the ECG chair will be a node in a smart home network, multiple vital sign sensors will be collecting the live
data simultaneously and storing then into a central database. In light of the heavy load of wireless data stream,
the Wi-Fi network is chosen instead of Bluetooth and ZigBee (Section 3.3.1). Additionally, most current homes
are equipped with a Wi-Fi router, which eliminates the need for additional receiving adapters.
The home sensor network is organized as in Figure 3.23. The ECG chair (as well as other sensor nodes) accesses
the Wi-Fi network via a Wi-Fi module (such as the HC-21 in Section 3.3 ). Data are sent over the wireless network
to the wireless access point, through which the data packet can reach the Wide Area Network (WAN). A data
logging server is the destination of these data packets. The server can be located locally at home or remotely in a
data center.
In the current study, a server application was developed to log the data stream from multiple sensors. The server
structure is shown in Figure 3.24. A data logging process is initiated for each of the data streams. Upon receiving
the data from the network host, the logging process delimits the packets, validates the data, converts the data
format and stores the data into a dedicated database.
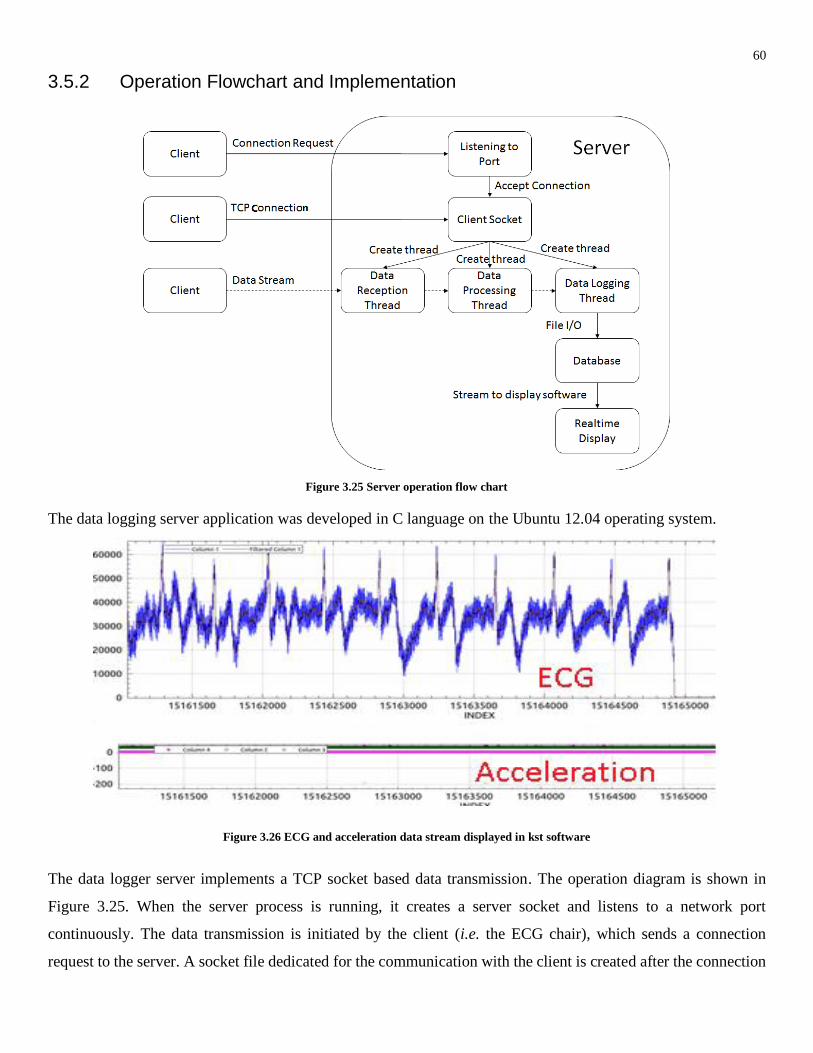
60
3.5.2 Operation Flowchart and Implementation
Figure 3.25 Server operation flow chart
The data logging server application was developed in C language on the Ubuntu 12.04 operating system.
Figure 3.26 ECG and acceleration data stream displayed in kst software
The data logger server implements a TCP socket based data transmission. The operation diagram is shown in
Figure 3.25. When the server process is running, it creates a server socket and listens to a network port
continuously. The data transmission is initiated by the client (i.e. the ECG chair), which sends a connection
request to the server. A socket file dedicated for the communication with the client is created after the connection

61
request is accepted. Then the server immediately creates three threads for data reception, data processing and
data logging using the pthread library [78]. Data stream from the client is received by the data reception thread,
which in turns passes the data to the data conversion thread. The data conversion thread delimits the data stream
into individual data value, and preps them into storage format. Lastly, the data logging thread performs the file
I/O to add data into a database. Optionally, the data recorded can be displayed in a third party plotting software
called Kst[79]. A sample display result is shown in Figure 3.26.
The three threads form a pipeline to process the incoming data simultaneously and continuously. When the TCP
link is broken, either because the client is shut down or the wireless connection is dropped, the three threads and
the client socket will be closed, and the server will return to the listening state, waiting for the next connection
request.

62
4 Considerations on Embedding ECG Electrodes into a Chair
Gel adhesive ECG electrodes and dry contact ECG electrodes have a relatively stable skin-electrode interface.
On the contrary, the capacitive electrodes are not fixed onto the skin, resulting in a more variable skin-electrode
interface and larger susceptibility to motion artifact. Furthermore, both the dielectric material (i.e. clothing) and
the coupling distance are variable with different users at different times. These factors render the capacitive
electrodes inherently unstable in the presence of motion artifact.
As the electrode-skin interface is the primary interface for the ECG signal acquisition system, the instability of
the capacitance will be reflected in a change of output reading. Therefore, it is important to understand the
capacitive electrode’s properties in different conditions, so as to predict its behavior under different
circumstances.
First, the main variable is clothing. Being able to sense the weak ECG through clothing is the major advantage of
the capacitive ECG over dry or gel adhesive electrodes. In a practical home environment, the clothing material
and its thickness changes with different occupants, different seasons and even different times of a day.
Consequently, the system performance has a high dynamic range. However, few previous projects on capacitive
ECG system studied this specific aspect. In this chapter, an experiment is carried out to study the effect of clothing
on the overall system performance.
Second, besides the clothing material and thickness, the electrode size, separation distance and orientation are the
three determinants of the electrode-skin interface. Proper placement of the electrodes can help reducing motion
artifact while capturing the strongest ECG signal. Similar to the case of clothing, few studies in the field has
covered the effects of electrode size, separation and orientation on ECG signal output. Most of the previous work
focused on a particular electrode configuration without specifying the reasons, thus making their designs hard to
repeat. Here, we conduct studies to evaluate the ECG quality under various electrode settings, shedding light onto
the geometric aspect of electrode design.
Finally, the effect of grounding position on the output signal is explored. In previous applications (i.e. gel
electrodes and dry electrodes), where the electrode-skin impedance is low, grounding provides a reference for
measurement. Most of these applications can still obtain a clear ECG signal with the grounding electrode
detached. In capacitive ECG, the grounding position and method are important, as it would change the output
ECG signal magnitude and polarity. Complementing previous work, the effect of grounding on the output ECG
signal will be investigated in this chapter.

63
4.1 Effects of Clothing on ECG Signal
4.1.1 Introduction
Clothes are the dielectric material determining the capacitance of the skin-electrode interface. When the distance
between skin and electrode is small, the skin-electrode interface can be modelled as a parallel plate capacitor,
whose capacitance is expressed by
𝐶 =𝜖0𝜖𝑚𝐴
𝑑 ,
Equation 18
where 𝜖0 = 8.85 ∗ 10−12 is the permittivity of vacuum space, 𝜖𝑚 is the relative permittivity of the dielectric
material between the parallel plates, 𝐴 is the overlapping area and 𝑑 is the separation distance between the plates.
If all else is constant, the coupling capacitance changes with the clothing material. The electrical properties of
various fabrics were well studied in the 1950s by Hearle [80] and others [81-83]. The relative permittivity values
of different materials in relation to various frequencies and relative humidity (r.h.) are shown in Figure 4.1, Figure
4.2 and Figure 4.3. A more thorough summary on electrical properties of fabrics is created by Hearle [80] and
presented in Table 5.
Figure 4.1 Dielectric constant of cotton yarn
(Cotton 44%; air 56%) [80] Figure 4.2 Variation of dielectric constant
versus frequencies for various fiber
materials at 65% r.h. [80]
Figure 4.3 Variation of relative permittivity with
moisture content of various fibres at 1 kHz [80]
As we can see from the above figures, the fabric permittivity decreases with increasing signal frequency and
decreasing humidity (moisture) content. Therefore, it is expected that the coupling capacitance of the skin-
electrode interface increases after a user sits long enough on the chair, when the sweat vapor penetrates the clothes,
resulting in a better signal quality. At the same time, comparing the relative permittivity values of various
materials in Table 5 and Figure 4.2 reveals that cotton and wool have larger permittivity values than polyester

64
and nylon. Furthermore, the moisture has a stronger impact on cotton and wool than on nylon and polyester.
Based on the above analysis, it is hypothesized that cotton and wool clothes give rise to a larger coupling
capacitance, and hence a better ECG signal than the polyester and nylon. Further studies on the electrical
properties of fabrics with respect to other parameters (such as temperature) are collected in [84].
Table 5 Permittivity of various materials
As the padding material on the electrode is one of the major variables during the use of capacitive ECG in the
home environment, it is highly important to understand how the system performance will respond to different
clothing material. However, previous work on capacitive ECG embedded into everyday items [42-44, 47, 85-87]
paid little attention to the effect of clothes on the skin-electrode interface. Therefore, an experiment is conducted
here to explore the extent to which the padding of clothing and its thickness affect the ECG output.

65
4.1.2 Experiment
Figure 4.4 The first chair prototype used in measuring the impact of
clothes on ECG
Figure 4.5 Experiment scenario when evaluating the capacitive
ECG with 2 layers of cotton
The experiment was conducted with the first chair prototype as shown in Figure 4.4, in which case the ECG
electrodes were placed on the seat and the grounding electrodes on the backrest and the armrest. The output
signals went through the analog conditioning circuit described in Section 2.3 and displayed on a digital
oscilloscope (Agilent DSO6012A). During the experiment, clothes of different materials and thicknesses were
placed on top of the ECG electrodes (Figure 4.5, Figure 4.6), and the subject (male, 26 years old, BMI 21) sat on
the clothes. In order to get a strong and consistent ECG signal among different test cases, the subject touched the
exposed ground pad with his right hand to achieve a stable grounding. When the ECG signal became stable, the
waveform was captured and analyzed.
Table 6 Tests cases to explore the impact of insulation clothes on output ECG waveform

66
The experiment was repeated for different materials and various thicknesses (Figure 4.6) as listed in Table 6.
Each case was repeated twice by the subject standing up and then sitting down again on the chair. A total of 20
heart beat cycles were captured and analyzed. In several cases, when the output was saturated by respiration
motion artifact, the waveforms before the final stage amplification (Section 2.3.4) were captured instead, in order
to observe the respiratory pattern. Additionally, the subject was asked to hold his breath until the output waveform
from the final stage amplification stabilized. These special cases were clearly indicated in Table 6.
Figure 4.6 Selected test settings for evaluating the impact of clothes on ECG
Figure 4.7 Sample waveform with both ECG and BCG (resulted
from 16 layers of cotton, holding breath)
Figure 4.8 Theoretical waveform of BCG [88]

67
From the collected waveforms, the QRS complexes were identified by matching the peaks with the direct chest
ECG reference. The magnitudes of the QRS complex from the capacitive ECG were measured and averaged to
obtain an estimate of the ECG strength.
In some cases, such as the one depicted in Figure 4.7, the output waveform was corrupted by motion artifact,
which were later shown to be the ballistocardiogram (BCG). The BCG is a recording of repetitive motion of the
human body arising from the sudden ejection of blood into the great vessels with each heartbeat. For reasons to
be explained in Section 4.1.4, the resulting waveform was a BCG superimposed onto an ECG [88, 89]. By
comparing Figure 4.7 with Figure 4.8, the characteristic features (e.g. H, I, J, K,L,M,N peaks) of a BCG can be
identified. To evaluate the magnitude of a BCG waveform, the I-J peak amplitudes were extracted and measured.
The relative strength of ECG and BCG was measured by a metric called the ECG/BCG ratio, defined as the
following,
𝐸𝐶𝐺
𝐵𝐶𝐺=
𝑉 𝐸𝐶𝐺 𝑅 𝑤𝑎𝑣𝑒
𝑉 𝐵𝐶𝐺 𝐼−𝐽 .
Equation 19
In the above equation, 𝑉𝐸𝐶𝐺 𝑅 𝑤𝑎𝑣𝑒 is the peak-to-peak value of the R wave, 𝑉𝐵𝐶𝐺 𝐼−𝐽 is the amplitude difference
of I peak and J peak.
For the cases where the respiration waveforms were captured, the peak to peak amplitudes of the waveform were
measured to estimate the strength of respiratory motion artifact. However, these respiratory amplitudes were
multiplied by the gain of the final stage amplifier when being compared to the ECG or BCG.
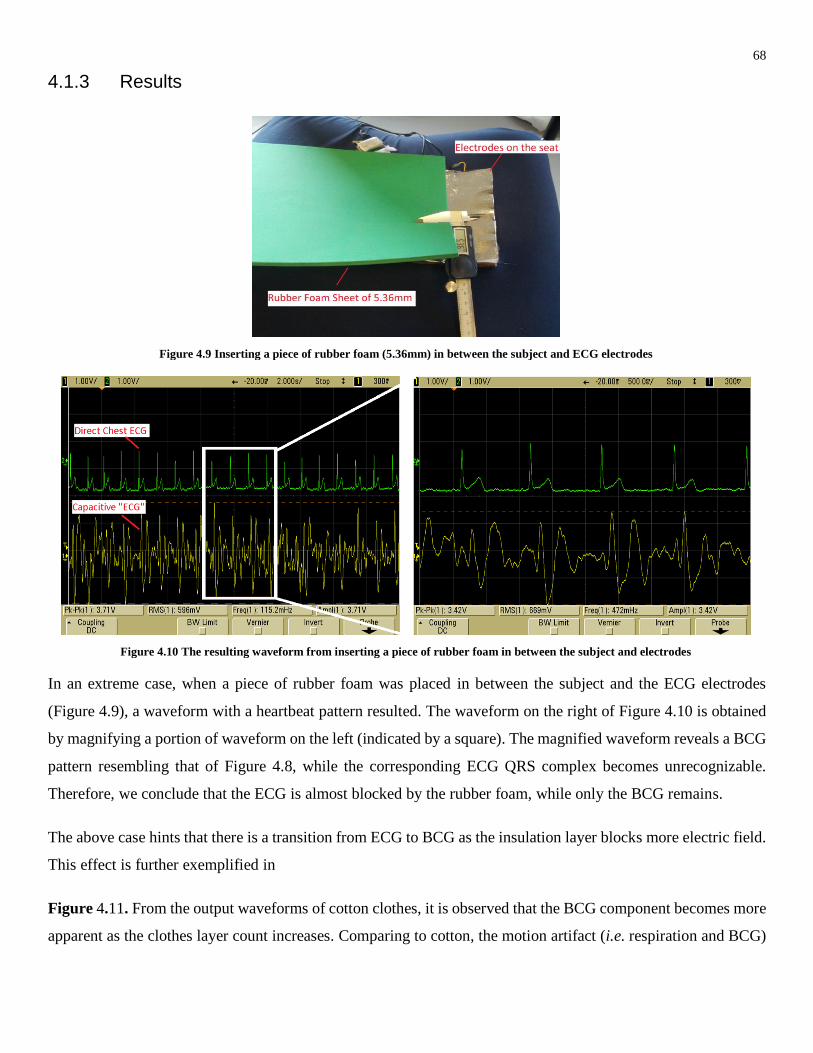
68
4.1.3 Results
Figure 4.9 Inserting a piece of rubber foam (5.36mm) in between the subject and ECG electrodes
Figure 4.10 The resulting waveform from inserting a piece of rubber foam in between the subject and electrodes
In an extreme case, when a piece of rubber foam was placed in between the subject and the ECG electrodes
(Figure 4.9), a waveform with a heartbeat pattern resulted. The waveform on the right of Figure 4.10 is obtained
by magnifying a portion of waveform on the left (indicated by a square). The magnified waveform reveals a BCG
pattern resembling that of Figure 4.8, while the corresponding ECG QRS complex becomes unrecognizable.
Therefore, we conclude that the ECG is almost blocked by the rubber foam, while only the BCG remains.
The above case hints that there is a transition from ECG to BCG as the insulation layer blocks more electric field.
This effect is further exemplified in
Figure 4.11. From the output waveforms of cotton clothes, it is observed that the BCG component becomes more
apparent as the clothes layer count increases. Comparing to cotton, the motion artifact (i.e. respiration and BCG)

69
becomes more significant with fewer layers of polyester. In the rubber foam case, the ECG is almost blocked, and
only the respiration and BCG motions remained.
Figure 4.12 ECG R wave peak-peak values for different clothes materials and thickness
Figure 4.11 Selected ECG waveforms from different insulation materials and thickness

70
Figure 4.12 depicts the ECG strength estimated from the R-peak values for different clothing material and
thickness. Except for the rubber foam, other clothes materials under test result in ECG R-peaks of comparable
magnitudes of about 3000mV. The ECG magnitude is much lower for the rubber foam. In most cases except silk
and wool (45%) +cotton (55%), the ECG magnitude decreases with increasing thickness.
Figure 4.13 plots the magnitude of the BCG component from the output waveform. In contrast to the R-peak
value plot, wool+polyacrylic gives rise to the largest BCG. Additionally, cotton, wool+cotton, rubber foam and
wool+polyacrylic assume an increasing trend with thicker clothes.
Figure 4.13 BCG I-J amplitude for different clothes materials and thickness
While Figure 4.13 and Figure 4.12 display the results from averaging 20 heart beat cycles, the slight differences
in subject posture among multiple tests cause random errors in the results. As each ECG and BCG result pair was
obtained from the same mechanical setting, it is reasonable to calculate the ratio between the two, and represent
the ECG signal quality in terms of an ECG/BCG ratio.

71
Figure 4.14 ECG/BCG ratio for different clothes materials and thickness
Figure 4.14 exhibits the ECG/BCG ratio for different clothing materials and thickness. Rubber foam has the
lowest ECG/BCG ratio due to a near zero ECG component. Wool+polyacrylic is next to the rubber foam as a
result of a large BCG component. Other materials (i.e. silk, cotton, polyester and wool+cotton) have ECG/BCG
ratios that are larger than unity, and the ratio decreases with larger thickness (except for two points in the silk
line). When the thickness is between 1mm and 10mm, the cotton and wool+cotton have larger ECG/BCG ratios
than other materials tested , meaning that both materials do not attenuate the ECG signal much while being
immune against motion artifact.
4.1.4 Discussion
From Figure 4.12, we can see that, given the same thickness larger than 1mm, silk, cotton and wool+cotton have
higher ECG amplitudes than wool+polyacrylic and polyester. Furthermore, the rubber foam results in the lowest
ECG amplitude. This coincides with the relative permittivity properties listed in Table 5. With lower relative
permittivity than cotton, the polyester blocks more ECG signal than cotton does. Although it is not shown in the
table, the permittivity of rubber foam [90] is around 2, the lowest of all materials tested. Therefore, we can infer
that given the same material thickness, the ECG amplitude is positively correlated to the relative permittivity of
the clothing material.
For the same material (e.g. cotton, polyester and wool+polyacrylic), the ECG amplitude decreases with additional
thickness. As the separation distance increases, the coupling capacitance decreases ( Equation 18), resulting in a
higher interface impedance and weaker input signal to the analog system. Certain materials, such as cotton, have

72
a stable performance across all thicknesses tested. This can be attributed to its supreme electrical permittivity,
especially within the humid local environment created by sweat vapor from the body.
The impacts of clothing thickness and material on BCG are shown in Figure 4.13. Unlike ECG, the BCG
magnitude is affected more by the clothing thickness than the permittivity, as the rubber foam line coincides with
the cotton line in the figure. The BCG magnitude generally rises with a thicker insulation layer. When the
thickness reaches a certain level, the BCG dominates the output signal.
Note that the above discussion is a first order observation. Three groups of factors have secondary effects on the
actual ECG output. First of all, the actual clothes are woven fabrics consisting of fiber threads and air gap. The
proportion of air gap in the fabrics is determined by the weaving technique and will affect the overall fabric
permittivity. However, such information on threads/air gap proportion is not available to the author. Second, as
shown in Figure 4.3, the permittivity is also greatly affected by moisture content, which is determined by an array
of other variables such as relative humidity of the environment, subject perspiration rate and temperature. Third,
the mechanical contact quality between the subject and the electrodes, which is affected by subject weight and
sitting posture.
In order to mitigate the influence of the mentioned variables which the author have no control over, the ECG/BCG
ratio is calculated as shown in Figure 4.14. The ECG/BCG ratio provides a common metric to evaluate the relative
strength of ECG and BCG, eliminating the random errors from each test.
From Figure 4.14, the ECG/BCG ratio decreases in most cases as the thickness increased. As mentioned before,
the increase in thickness weakens the coupling capacitance and the ECG signal. In the meantime, the BCG
increases with clothing thickness. The combination of the two effects result in a negative correlation between the
thickness and ECG/BCG ratio. Given the same thickness, the ECG/BCG ratio is positively correlated to the
permittivity.
In summary, this experiment provides insights to the research question on how different clothing material and
thickness affect the ECG signal quality. From the experimental results, we conclude that stronger ECG signals
result from clothing material with higher permittivity value and smaller thickness. Furthermore, a stronger
presence of motion artifact comes after a weaker ECG signal. At the same time, given the subject is not moving
intensively, the BCG and respiration wave are the major sources of motion artifact. Therefore, in achieving our
project goal of building a capacitive ECG chair, we need to be aware of the BCG and respiration waveform; a
clean ECG signal can be obtained by removing both types of motion artifact. This experiment also reveals an
opportunity for building a sensor system that senses ECG, BCG and respiration rate simultaneously.

73
4.2 Effects of Grounding Position on ECG Signals
4.2.1 Introduction
Grounding to a biopotential instrument is like the zero mark to a ruler. Without the zero mark, we are not able to
measure the absolute length of a line segment. Likewise, without the grounding, one cannot know the absolute
voltage (i.e. relative to the measurement system) of a point under test. Ideally, not knowing the absolute voltage
does not prevent obtaining the relative voltage difference between two points. However, the output from the
measurement system is bound by its supply voltage in practice. This means that when the absolute voltage of a
point exceeds the measurement supply voltage, the output will be capped to that voltage.
Figure 4.15 Illustration the effect of grounding on practical
measurement system
Figure 4.16 Illustration of an electrically floating body (left)
and a capacitively grounded body (right)
A situation when the grounding affects the body potential is shown in Figure 4.15. The body on the left is
electrically floating, in which case the overall voltage level is unknown. Assuming that overall body voltage is
5V, then the voltages at the neck and waist are 6.1V and 5.8V, which exceed the operation range of the sensor.
Consequently, the output from taking the difference between the two points is 0. On the contrary, when the body
is grounded, as illustrated in the right of Figure 4.15, the body potential is pulled down to zero, giving the correct
potential difference of 0.3V. In this example, we see how grounding the body can give an absolute reference to
the body potential.
A question naturally arises on how to determine the body potential when the body is not grounded. The answer
to this question lies in the left of Figure 4.16. Standing in a physical environment, the body is coupled to the
power line and to the earth ground via capacitors 𝐶𝑎 and 𝐶𝑏. Theoretically, assuming the body does not have
excessive charge and no other couplings exist, the body potential can be calculated by
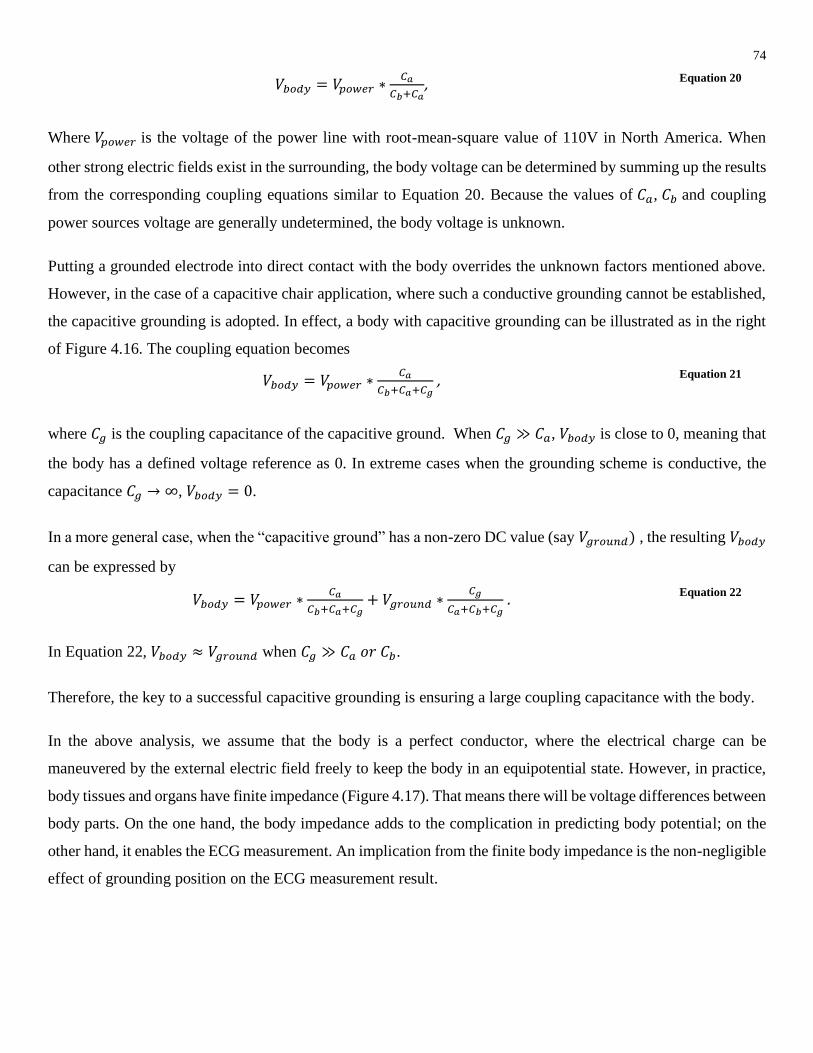
74
𝑉𝑏𝑜𝑑𝑦 = 𝑉𝑝𝑜𝑤𝑒𝑟 ∗𝐶𝑎
𝐶𝑏+𝐶𝑎, Equation 20
Where 𝑉𝑝𝑜𝑤𝑒𝑟 is the voltage of the power line with root-mean-square value of 110V in North America. When
other strong electric fields exist in the surrounding, the body voltage can be determined by summing up the results
from the corresponding coupling equations similar to Equation 20. Because the values of 𝐶𝑎, 𝐶𝑏 and coupling
power sources voltage are generally undetermined, the body voltage is unknown.
Putting a grounded electrode into direct contact with the body overrides the unknown factors mentioned above.
However, in the case of a capacitive chair application, where such a conductive grounding cannot be established,
the capacitive grounding is adopted. In effect, a body with capacitive grounding can be illustrated as in the right
of Figure 4.16. The coupling equation becomes
𝑉𝑏𝑜𝑑𝑦 = 𝑉𝑝𝑜𝑤𝑒𝑟 ∗𝐶𝑎
𝐶𝑏+𝐶𝑎+𝐶𝑔 , Equation 21
where 𝐶𝑔 is the coupling capacitance of the capacitive ground. When 𝐶𝑔 ≫ 𝐶𝑎, 𝑉𝑏𝑜𝑑𝑦 is close to 0, meaning that
the body has a defined voltage reference as 0. In extreme cases when the grounding scheme is conductive, the
capacitance 𝐶𝑔 → ∞, 𝑉𝑏𝑜𝑑𝑦 = 0.
In a more general case, when the “capacitive ground” has a non-zero DC value (say 𝑉𝑔𝑟𝑜𝑢𝑛𝑑) , the resulting 𝑉𝑏𝑜𝑑𝑦
can be expressed by
𝑉𝑏𝑜𝑑𝑦 = 𝑉𝑝𝑜𝑤𝑒𝑟 ∗𝐶𝑎
𝐶𝑏+𝐶𝑎+𝐶𝑔+ 𝑉𝑔𝑟𝑜𝑢𝑛𝑑 ∗
𝐶𝑔
𝐶𝑎+𝐶𝑏+𝐶𝑔 .
Equation 22
In Equation 22, 𝑉𝑏𝑜𝑑𝑦 ≈ 𝑉𝑔𝑟𝑜𝑢𝑛𝑑 when 𝐶𝑔 ≫ 𝐶𝑎 𝑜𝑟 𝐶𝑏.
Therefore, the key to a successful capacitive grounding is ensuring a large coupling capacitance with the body.
In the above analysis, we assume that the body is a perfect conductor, where the electrical charge can be
maneuvered by the external electric field freely to keep the body in an equipotential state. However, in practice,
body tissues and organs have finite impedance (Figure 4.17). That means there will be voltage differences between
body parts. On the one hand, the body impedance adds to the complication in predicting body potential; on the
other hand, it enables the ECG measurement. An implication from the finite body impedance is the non-negligible
effect of grounding position on the ECG measurement result.

75
Figure 4.17 Illustration body part impedance (courtesy to Biodat Research Group)
In the following section, an experiment is presented to reveal the effect of different grounding positions on the
capacitive ECG signal. Additionally, the effect of capacitive grounding and some special grounding cases will be
explored.
4.2.2 Experiment
Figure 4.18 The experiment setting used to measure the
impact of grounding position on the ECG output Figure 4.19 Illustration of
applying a direct ground to the
subject’s neck
Figure 4.20 Illustration of applying a
direct ground to the subject’s right foot
An experiment was conducted with the first chair prototype as shown in Figure 4.18 , in which the ECG electrodes
were placed on the seat and the grounding electrodes were placed on the backrest and the armrest. Both the ECG
electrodes and the back rest grounding were covered by one layer of cotton clothes. The output signals were
processed by the analog conditioning circuit described in Section 2.3 and displayed on a digital oscilloscope
(Agilent DSO6012A). During the experiment, the subject (male, 26 years old, BMI: 21) wore a 100% cotton T-
shirt and a pair of cotton jeans.

76
Table 7 Test cases for the various grounding methods and positions
The experiment was split into three parts. First, the subject sat onto the capacitive ECG chair with a piece of
grounded aluminum directly attached to different parts of the body. For example, Figure 4.19 shows the scenario
when the neck is grounded; similarly, Figure 4.20 illustrates the scenario when the right foot is grounded. In the
second part of the experiment, the ECG resulting from capacitive grounding and direct grounding were compared.
In the last part of the experiment, the special case of grounding by resting a bare foot onto the floor was evaluated.
All test cases are summarized in Table 7.
The subject sat on the chair and the ECG waveforms from the capacitive electrodes and direct chest contact were
captured after it stabilized. A total of 20 cardiac cycles were captured in each case, from which the ECG magnitude
was estimated by averaging the peak-to-peak values of the QRS complex.

77
4.2.3 Results
Figure 4.21 Baseline configuration (body floating)
The baseline result with the body ungrounded (i.e. electrically floating) is shown in Figure 4.21. In the figure we
can see that the baseline output is corrupted by the 60Hz noise. Additionally, a BCG waveform similar to that in
Figure 4.8 is observable while the ECG waveform is not identifiable. Therefore, the BCG dominates the output
signal when the body is not grounded.
The results from the first part of the experiment are shown in Figure 4.22, in which different parts of the body
were connected to the ground via direct contact. The estimated R-peak amplitudes are noted next to the waveform
picture. Comparing the output ECG on the left of Figure 4.22, the R-peak amplitude decreases as the grounding
location moves lower down the body. When the grounding pad reaches the feet, the ECG signal is not identifiable
anymore. At the same time, the 60Hz noise becomes more apparent as the ECG components become weaker.
Additionally, the result on the right column of Figure 4.22 shows that the ECG output changes its polarity when
moving from the left side of the waist to the right.

78
Figure 4.22 Selected experiment result of placing a direct grounding to different body positions (green: direct chest ECG; yellow:
capacitive ECG)
The results from the second part of the experiment (Figure 4.23, Figure 4.24) show that capacitive grounding
generally produces a smaller ECG output, while the motion artifact in each waveform is more apparent.

79
Figure 4.23 Comparison between direct (upper) and capacitive
(lower) groundings at the right arm
Figure 4.24 Comparison between direct (upper) and capacitive
(lower) groundings at the back
Figure 4.25 Direct grounding to the right hand (left) ; grounding by direct contact with the right hand and bare foot on the floor (right)
Finally, some special grounding cases were investigated by having the subject place his bare foot on the floor in
the third part of the experiment. The result in Figure 4.25 shows that resting the bare foot on the floor has the
same effect as grounding the right foot with aluminum. Moreover, when the right hand and right foot were
respectively grounded by the aluminum pad and the floor, the foot on the floor had a dominating effect,
suppressing the ECG signal and leaving behind the 60Hz and digital system noise.
For a complete result summary table, please refer to Table 9 in Appendix A :

80
4.2.4 Discussion
As related to the thesis, this experiment shows that different grounding schemes—i.e. grounding positions,
grounding modes (e.g. direct, capacitive and foot resting on floor), will affect the ECG signal quality. The details
of how the grounding scheme changes the output ECG waveform are explained below.
Comparing the results in Figure 4.21 and Figure 4.22, we can see that direct grounding can help suppress the
60Hz noise. Referring to Figure 4.16, one explanation can be arrived with Equation 20. When the body is not
directly connected to ground, the 60Hz power line noise is coupled to the body via 𝐶𝑎 and 𝐶𝑏. As the electrical
appliances are ubiquitous, 𝐶𝑎 becomes sufficiently large and the 60Hz noise dominates the body voltage level,
which appears as the common mode signal to the analog differential amplifier. Although the differential amplifier
has a large common mode rejection ratio (CMRR) that is at least -96dB, the power line noise has a way to sneak
into the system (to be explained in 4.4.4) and appears in the output signal. When a direct ground is attached to
the body, the body voltage can be described by Equation 21 with 𝐶𝑔 → ∞. As a result, the 60Hz power line noise
does not remain in the body voltage output.
Figure 4.22 reveals that the ECG signal output decreases as the contact point goes lower. This is a piece of
evidence that the system output is affected by the grounding position. It also reflects that the human body cannot
be treated as a conductor; instead, the body has non-zero internal impedance and electric field. Figure 4.26 shows
a plot of the internal electric field generated by the cardiac dipole. In the figure, lines indicated with a are the
positive potential lines, and those indicated with b and c are negative potential lines and current flow lines,
respectively. By measuring the ECG, we are actually measuring the electric potential difference across two
electric potential lines.
Figure 4.26 Electric field of the cardiac dipole ( courtesy to Augustus Waller , 1887 )
The effect of placing a direct ground on the body is pulling the potential at the point towards zero. For example,
when the ground is placed at the neck, the electrical potential distribution is depicted in Figure 4.27. Assuming
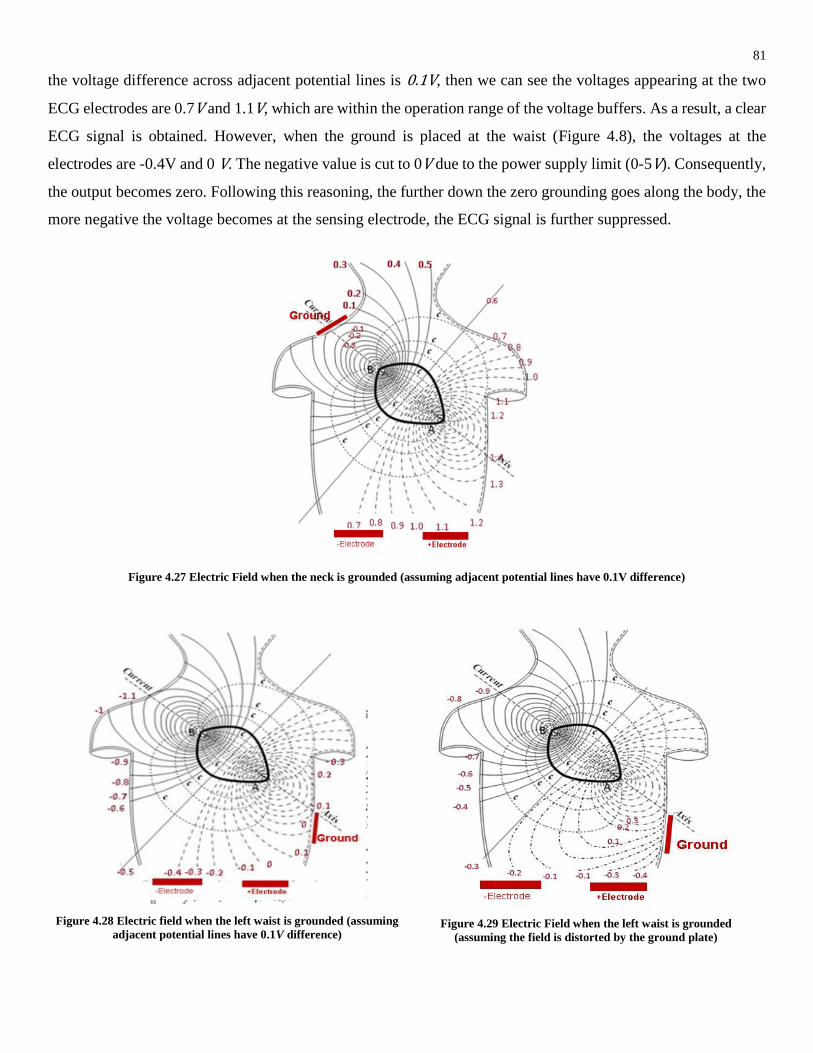
81
the voltage difference across adjacent potential lines is 0.1V, then we can see the voltages appearing at the two
ECG electrodes are 0.7V and 1.1V, which are within the operation range of the voltage buffers. As a result, a clear
ECG signal is obtained. However, when the ground is placed at the waist (Figure 4.8), the voltages at the
electrodes are -0.4V and 0 V. The negative value is cut to 0V due to the power supply limit (0-5V). Consequently,
the output becomes zero. Following this reasoning, the further down the zero grounding goes along the body, the
more negative the voltage becomes at the sensing electrode, the ECG signal is further suppressed.
Figure 4.27 Electric Field when the neck is grounded (assuming adjacent potential lines have 0.1V difference)
Figure 4.28 Electric field when the left waist is grounded (assuming
adjacent potential lines have 0.1V difference)
Figure 4.29 Electric Field when the left waist is grounded
(assuming the field is distorted by the ground plate)

82
The above analysis implies that applying a positive DC bias to the grounding electrode can help in preserving the
ECG output. Equation 22 describes the body voltage resulting from a positively biased grounding. When 𝐶𝑔 is
large enough and the 𝑉𝑔𝑟𝑜𝑢𝑛𝑑 is appropriately chosen, the electrical potential at the ECG electrodes can be set
into the operating range of the analog circuit. This provides theoretical support for later experiments in Section
4.3, Section 4.4 and Section 4.5, where the grounding electrode is placed lower than the ECG electrodes, and it
has a 3.3V voltage bias.
Figure 4.22 also reveals that moving the grounding electrode from the right waist area to the left changes the ECG
polarity. Had the body internal electric field remained static, the electric potential difference between two points
would have stayed the same regardless of the absolute voltage value set by the grounding reference. The result
hints that the internal electric field was altered by the grounding electrode, so that the relative voltage potential
difference changed sign at the ECG sensing electrodes. An illustrative altered electric field is depicted in.
Comparing the output from direct and capacitive grounding in Figure 4.23 and Figure 4.24 leads to two
observations. Firstly, the ECG signal from direct grounding is larger than that of capacitive grounding. Secondly,
the motion artifact, such as BCG, is larger in the capacitive grounding case.
The decrease in ECG magnitude by capacitive grounding may have originated from a less directed electric field
in the body. As mentioned previously, direct grounding could alter the internal electric field of the body. By
providing a low impedance path, the direct ground was able to attract and concentrate electric field, resulting in
a more directed field and a stronger ECG vector.
The increase in BCG magnitude could be explained with Equation 21 and Equation 23. The vibration of the body
simultaneously changes the coupling distance between the grounding electrode and skin, hence altering the
coupling capacitance 𝐶𝑔. The change in 𝐶𝑔 leads to fluctuation of the body voltage 𝑉𝑏𝑜𝑑𝑦, creating a common
mode voltage as seen by the two ECG electrodes. This common mode voltage sneaks through the analog
conditioning system in the same way power line noise does. For example, if 𝐶𝑔 changes by a proportion Δ𝑐, then
we have
𝑉′𝑏𝑜𝑑𝑦 = 𝑉𝑝𝑜𝑤𝑒𝑟 ∗𝐶𝑎
𝐶𝑏 + 𝐶𝑎 + 𝐶𝑔 ∗ (1 + 𝛥𝑐)≈ 𝑉𝑝𝑜𝑤𝑒𝑟 ∗
𝐶𝑎
𝐶𝑔 ∗ (1 + 𝛥𝑐)
≈ 𝑉𝑝𝑜𝑤𝑒𝑟 ∗𝐶𝑎
𝐶𝑔
(1 − 𝛥𝑐) = (1 − 𝛥𝑐)𝑉𝑏𝑜𝑑𝑦
Equation 23
This means that the change in coupling ground capacitance is translated into the body potential variation. For
direct grounding, 𝑉𝑏𝑜𝑑𝑦 → 0 𝑎𝑠 𝐶𝑔 → ∞, therefore, the body potential is more stable in the presence of motion
artifact.

83
Based on the above analysis, in order to preserve the ECG signal and suppress the BCG while the grounding is
capacitively applied, we need a large (high 𝐶𝑔) and stable (small Δ𝑐) grounding electrode. A good location for
the grounding pad is on the seat where the subject can sit firmly onto a large electrode. As for the ECG sensing
electrodes, a reasonable placement location is on the back rest; the proximity to the heart ensures that a sufficiently
strong and unaltered cardiac electric field can be captured by the electrodes.
As for the third part of experiment, a combination of hand and foot grounding was investigated. Figure 4.25 shows
that a bare foot resting on the floor has the same grounding effect as directly touching a grounded aluminum pad
(Figure 4.20). Although the foot-floor contact was separated by the insulating corneous and paint, the effect of
resting the foot on the ground overrides the direct ground from the right hand. This, on the one hand, is caused
by electric potential dropping below zero due to the grounded foot (). It was also caused by the internal electric
field being diluted when bifurcating towards two low-impedance paths. The result sheds light on the case when a
subject sits on an ECG chair with her bare foot resting on the floor, in which case the output ECG could be small
in magnitude.

84
4.3 Effects of Electrode Size on ECG Signal
4.3.1 Introduction
In capacitive ECG, the weak ECG signal is picked up by the capacitive electrodes through clothes via capacitive
coupling. The capacitance of the electrode-skin interface can be described by Equation 18. The overlapping area
determines the coupling capacitance. The larger the electrode area, the larger the coupling capacitance becomes,
hence the voltage buffer can collect more power.
At the same time, the electrode itself collects the average skin potential. If the surface voltages on the skin are
linearly distributed, the average value equals the voltage value right beneath the electrode center. On the contrary,
if the surface potentials are not linearly distributed, the average value may not be the same as that beneath the
electrode center.
Intuitively, large electrodes could provide better ECG acquisition outcome than small ones. Firstly, a large
covering area means that the electrodes have a higher chance to couple with the subject body. Secondly, given
the same motion displacement, larger electrodes have a smaller percentage change in capacitance, which
(according to Equation 23) introduces less common mode noise.
In the following subsections, an experiment is presented that evaluates the ECG acquisition performance of
different electrode sizes.
4.3.2 Experiment
Figure 4.30 The experiment setting used to measure the impact of electrode size on the ECG output
Based on the reasoning provided in Section 4.2.4, the ECG chair configuration used in this experiment had the
ECG electrodes installed on the back rest and the grounding electrode on the seat. During the experiment, a subject
(male, 26 years old, BMI 21) sat on the chair with a natural posture. The output signals were processed by the

85
analog conditioning circuit described in Section 2.3 and captured by a digital oscilloscope (Agilent DSO6012A)
from which the output waveform was characterized.
Initially the ground plate was connected to a 3.3V DC voltage for the reasons given in Section 4.2.4 and it was
capacitively coupled to the subject body. After acquiring the output waveform for 20 stable heart beat cycles, the
ground plate was connected to the driven right leg circuit with 20 feedback gain (as suggested in Section 2.3.5).
Another stable output waveform of 20 heart beat cycles was captured.
Figure 4.31 Electrodes with different sizes
The above procedures were repeated for different electrode sizes (e.g. 33x33mm2, 55x67mm2, 110x67mm2,
220x135mm2 ) as shown in Figure 4.31. The largest electrodes were not used, because they did not fit the chair.
When changing the configuration, the centers of the electrodes retained their separation distance of 14.5cm
(Figure 4.30) as well as their location at the back rest.
Throughout the entire experiment, the subject wore a 100% cotton T-shirt and a pair of cotton jeans. At the same
time, the subject recorded a direct chest contact ECG which served as the reference ECG. Additionally, when the
motion artifact from respiration became too large, the subject held his breath to ensure the ECG could be captured
from the output of the final stage amplification. The respiration motion artifact was then measured at the input
before the final stage signal amplification.

86
4.3.3 Results

87
Figure 4.32 Signal output evaluation for different electrode sizes (based on a pair of 33mmx33mm electrodes)
The results shown in Figure 4.32 indicate that the ECG signal and motion signal (BCG and respiration) are larger
in magnitude when the ground plate is connected to the 3.3V DC. While the ECG/BCG ratios are comparable
between the DC biased and DRL configurations; the ECG/BCG curves in both cases reaches the local maximum
at an electrode size of 110x67mm2 .
In terms of the ECG signal, the size of the electrode does not greatly affect its magnitude when the chair is
configured in DC biased grounding. On the contrary, the ECG signal increases with size when the DRL is used.
For BCG, the DC biased grounding leads to a decrease in magnitude with increasing electrode size. The DRL,
on the other hand, gives rise to an increasing trend for the BCG with respect to electrode area.
Regarding to respiration rate, the DC biased ground results in a much larger respiration artifact than DRL does.
For DRL, the respiration waveform amplitude assumes a convex morphology, having the local minimum at an
electrode size 110x67mm2.
4.3.4 Discussion
The presented experiment was conducted with the following research goals in mind: (1) selecting an appropriate
electrode size for the ECG chair and (2) evaluating how two of the capacitive ECG configuration parameters,
namely electrode size and grounding scheme, affect the ECG signal acquiring performance.
Although the sitting posture of the subject differed in each trial, adding random errors to the result, the calculation
of ECG/BCG ratio eliminates the errors, because this ratio is calculated on a per heart beat cycle basis. From the
ECG/BCG ratio, we see that the electrode size of 110x67mm2 leads to the best signal quality. Meanwhile, the

88
DRL configuration give the lowest respiratory motion artifact level. Therefore, based on this set of results, the
110x67mm2 is the candidate for our capacitive chair.
Comparing both lines in the ECG R-peak plot in Figure 4.32 reveals that DC biased capacitive grounding leads
to higher ECG (i.e. R-peak) amplitudes than the DRL. As we know from Section 2.4, DRL suppresses the
common mode signal by injecting an inverted signal back to the body. However, due to the mismatch of the two
ECG sensing electrode paths, a portion of the differential mode signal (e.g. the ECG ) transforms into common
mode and is fed into the DRL circuit. The DRL circuit then inverts, amplifies and feedbacks the common mode
ECG, suppressing overall ECG level.
From Figure 4.32, we can also see that the ECG in the DRL configuration increases with electrode size, while a
similar effect doesn’t appear in the DC biased grounding configuration. This was due to a reduction in the DRL
feedback output, reflecting a drop in the common mode input to DRL. Multiple reasons can lead to a decrease in
common mode input. One of the reasons can be the percentage mismatch of the two pre-amp paths becoming
smaller when the electrodes are larger, resulting in a smaller portion of differential mode being converted into
common mode.
The above reasoning can be applied to the BCG and respiration artifact. Firstly, the negative feedback of the
common mode signal suppresses the motion artifact, resulting in a smaller motion artifact amplitude than the DC
biased grounding configuration. Secondly, we note that there is a differential mode component in the motion
artifact due to an asymmetrical displacement of the torso. With larger electrodes (i.e. 220x135mm2), less
differential motion artifact is converted to the common mode at the input of the DRL. Consequently, the motion
artifact became apparent in the case of larger electrodes.
Different from the ECG, the BCG and respiration patterns are initially large when the electrode size is small.
Additionally, the BCG and respiration waveforms in the DC biased ground configuration share the same pattern
as the DRL. This implied that the differential mode of the motion artifact is large when the electrode size is small.
The reasons behind this could be: (1) smaller electrodes provide weaker physical contact with the body; (2)
smaller electrodes do not average out the motion artifact (due to asymmetrical body displacement) as much as
large electrodes; (3) the same amount of distance change gives rise to larger capacitance change for small
electrodes, leading to a larger analog output fluctuation.
As related to the thesis, it can be inferred from the experiment results and discussion that electrode size affects
the ECG signal quality. It is a result of changing ECG signal strength and motion artifact component amplitude.

89
4.4 Effects of Electrode Separation on ECG Signal
4.4.1 Introduction
The ECG electrodes measure the voltage potential difference between two points on the body. If the electrodes
are placed along the direction of the electric field, a larger electrode separation results in a larger electric potential
difference, hence a stronger ECG output.
However, there are other factors to consider when determining the optimum electrode separation. One factor is
the sensitivity to motion artifacts. When the electrodes are physically close to each other, the changes of coupling
capacitance between the body and electrodes are roughly the same, in which case the motion artifact appears as a
common mode signal. When the electrodes are physically far apart, the motion sensed by the two electrodes are
different, rendering the motion artifact in differential mode and corrupting the analog output signal.
In order to find the relationship between ECG, BCG, respiration waveform and electrode placement distance, the
following experiment was conducted. The smallest electrodes (33x33mm2 ) were used, because they could
accommodate the widest separation range.
4.4.2 Experiment
Figure 4.33 The experiment setting used to measure the impact of electrode separation on the ECG output
Based on the reasoning provided in Section 4.2.4, the ECG chair configuration used in this experiment had the
ECG electrodes installed on the back rest and the grounding electrode on the seat. During the experiment, a subject
(male, 26 years old, BMI 21) sat on the chair with a natural posture. The output signals were processed by the
analog conditioning circuit described in Section 2.3 and captured by a digital oscilloscope (Agilent DSO6012A)
from which the output waveform was characterized.
Initially, the ground plate was connected to a 3.3V DC voltage for the reasons given in Section4.2.4, and
capacitively coupled to the subject body. After acquiring the output waveform for 20 stable heart beat cycles, the
ground plate was connected to the driven right leg circuit with 20 feedback gain (as suggested in Section 2.3.5).
Another stable output waveform of 20 heart beat cycles was collected.

90
The above procedures were repeated for different electrode separation distances (e.g. 10mm, 35mm, 50mm,
80mm, 110mm and 145mm. When changing the configuration, the centers of the electrodes retained their height
on the back rest.
Throughout the entire experiment the subject wore a 100% cotton T-shirt and a pair of cotton jeans. At the same
time, the subject recorded a direct chest contact ECG which served as the reference ECG. Additionally, when the
motion artifact from respiration became too large, the subject held his breath to ensure the ECG could be captured
from the output of the final stage amplification. The respiration motion artifact was then measured at the input
before the final stage signal amplification.
4.4.3 Results

91
Figure 4.34 Signal output evaluation for different electrode separations (based on a pair of 33mmx33mm electrodes)
From the results presented in Figure 4.34, we can see that the ECG signal strength is generally invariant across
different electrode separations, in both the biased DC and the DRL cases. Additionally, the biased DC ECG output
is bigger than the DRL configuration.
Similarly, the BCG remains roughly the same across all electrode separations tested for both biased DC grounding
and DRL configuration. The DRL configuration suppresses the BCG noticeably. The BCG signal is around 5
times as large as the ECG signal.
With regards to the respiration waveform, the DC biased configuration levels off, while it increases with
separation distance in the DRL configuration. As we can see from the plot, the DRL respiration amplitude starts
to rise at 80mm.

92
The ECG/BCG ratio oscillates between 0.1 and 0.6 in most cases. The ECG/BCG ratio assumes its maximum
value 0.6 at 35mm separation, while a local maximum appears at 50mm separation for the DRL case.
4.4.4 Discussion
The presented experiment was conducted with the following research goals in mind: (1) selecting an appropriate
electrode separation for the ECG chair and (2) evaluating how the two of the capacitive ECG configuration
parameters, namely electrode separation and grounding scheme, affect the ECG signal acquiring performance.
Figure 4.35 Illustration on the generation of common mode voltage via capacitive grounding
Figure 4.36 Illustration of the input voltages to the voltage buffers
One prominent feature from the plots (Figure 4.34) is that the DRL configuration reduced all signals (ECG, BCG
and respiration) by more than 10 times.
For the ECG case, two reasons may cause such a signal reduction.
Firstly, the capacitive ground may cause the ECG to become a common mode to the measuring system. Capacitive
grounding provides a high-pass connection to the measuring system ground. When the electrical pulse is generated
from the heart (in low frequency range), it charges the body-ground coupling capacitor, lifting the entire body
voltage and hence presenting the ECG as a common mode signal to both ECG leads. The situation is illustrated
in Figure 4.35.

93
Secondly, the mismatch of the two ECG electrode paths partially transformed the differential mode into common
mode. As shown in Figure 4.36, let 𝑍𝑎 and 𝑍𝑏 denote the impedance of the skin-electrode interface, 𝑍𝑐 denote
the input impedance of the operational amplifier. We then have
𝑉𝑎′ = 𝑉𝑎 ∗
𝑍𝑎
𝑍𝑎+𝑍𝑐,
Equation 24
𝑉𝑏′ = 𝑉𝑏 ∗
𝑍𝑏
𝑍𝑏+𝑍𝑐,
Equation 25
Given 𝑉𝑎 and 𝑉𝑏 are in differential mode (𝑉𝑎 + 𝑉𝑏 = 0), and the signal paths are perfectly matched (𝑍𝑎 = 𝑍𝑏), we
have 𝑉𝑎′ and 𝑉𝑏′ being in differential mode (𝑉𝑎
′ + 𝑉𝑏′ = 0).
However when there is mismatch between the two signal paths, a non-zero common mode arises, which is
expressed in
Equation 26.
𝐶𝑀𝑉𝑎′,𝑉𝑏′ =1
2(𝑉𝑎
′ + 𝑉𝑏′)
=1
2(𝑉𝑎 ∗
𝑍𝑎
𝑍𝑎 + 𝑍𝑐+ 𝑉𝑏 ∗
𝑍𝑏
𝑍𝑏 + 𝑍𝑐)
=1
2(
(𝑉𝑎 + 𝑉𝑏)𝑍𝑎𝑍𝑏 + 𝑉𝑎𝑍𝑎𝑍𝑐 + 𝑉𝑏𝑍𝑏𝑍𝑐
(𝑍𝑎 + 𝑍𝑐)(𝑍𝑏 + 𝑍𝑐))
=𝑍𝑐(𝑍𝑎 − 𝑍𝑏)
2(𝑍𝑎 + 𝑍𝑐)(𝑍𝑏 + 𝑍𝑐)𝑉𝑘
Equation 26
We have shown that, when 𝑍𝑎 ≠ 𝑍𝑏, a pair of differential signals can produce a non-zero common mode signal
given by Equation 26, assuming 𝑉𝑎 = −𝑉𝑏 = 𝑉𝑘 . Similarly, differential mode signals can be converted into
common mode due to signal paths mismatch.
For the above two reasons, a portion of differential ECG signal may appear as common mode signal, and it is
suppressed by the DRL circuit feedback.
Regarding the BCG and respiration rate, they are mainly common mode; therefore their magnitudes are well
suppressed by the DRL feedback.
The ECG signal strength shown in Figure 4.34 is not significantly changed by the electrode separation, which is
not in line with the prediction made in Section 4.4.1. One explanation is that the internal electric field generated
by the cardiac dipole is mainly vertical, therefore the horizontal separation does not have a large impact on the
measured ECG amplitude. Meanwhile, placing the capacitive ground plate on the seat may reinforce the vertical
component of the cardiac electric field.

94
For the motion artifact, such as respiration waveform, the DRL result exhibits a growing trend with electrode
separation. However, the respiration magnitude of the DC biased grounding does not change significantly. It
reflects that larger electrode separation has smaller the respiratory (common mode) signal, because DRL
suppresses common mode input. The grounded mode configuration has a stable motion artifact magnitude, which
shows that the differential component of the motion artifact does not increase drastically with separation distance.
Finally, the study into the ECG/BCG ratio reveals that the relative strength between ECG and BCG remains stable
within 0.1 to 0.6 across all separations tested except for the 145mm case. For the electrode of size 33x33mm2, the
motion artifact is larger than the ECG signal, rendering the QRS complex difficult to extract. However, the
extraction of the heart rate feature can be accomplished by recognizing the BCG pattern. Based on the ECG/BCG
ratio plot, we choose an electrode separation of 35mm for our ECG chairunder DRL scheme because (1) the DRL
has better motion artifact suppression capabilities and (2) the ECG/BCG ratio is higher than that of the DC biased
grounding scheme.
From the above discussion, we see that the ECG signal strength is weakly affected by the electrodes separation,
and there is no monotonic relationship between the ECG signal and electrode separation distance. However, we
do see an increase in respiration motion artifact in DRL mode along with an larger electrode separation. Therefore,
the ECG signal quality is affected by the electrodes separation distance.

95
4.5 Effects of Electrode Orientation on ECG Signal
4.5.1 Introduction
The source of ECG is the cardiac dipole induced by the heart contraction activities. Because the electric field
dipole is a vector field with both magnitude and direction, the orientation of the ECG sensing electrodes could
have a non-negligible impact on the measured signal strength. Theoretically, when the sensing electrodes align
with the cardiac dipole (assuming there is no internal electric field distortion), the sensed ECG signal is the
strongest. However, due to practical constraints, the strongest ECG signal may be obtained from a different
orientation than the cardiac dipole. The reasons may include (1) the internal electric field is distorted by the
ground plate; (2) the mismatch of the electrode characteristic introduces conversion from common mode to
differential mode, and vice versa; (3) the inhomogeneity and non-uniform shape of the human torso brings a
mismatch between the cardiac dipole orientation and the surface voltage orientation[91].
The motion artifact as sensed by the electrodes may be different in different orientations as well. For example,
the BCG is generated from the pulsation of the heart contraction. The tiny body vibration is a compounded result
from the heart motion, distribution of blood mass within the body, acceleration and deceleration of the blood
flow. The direction of these mechanical motions determines the electrode orientation with which to capture the
strongest/weakest mechanical signal. A similar argument can be applied to the respiration motion artifact as well.
The following experiment aims at finding the relationship between ECG, BCG, respiration waveform and the
electrode orientation. A total of 3 orientations (0o, 45o and 90o) were tested with the smallest electrode
(33x33mm2). The smallest electrode was chosen because of its flexibility in configuration compared with larger
electrodes
4.5.2 Experiment
Figure 4.37 The experiment setting used to measure the impact of electrode orientation on the ECG output
Based on the reasoning provided in Section 4.2.4, the ECG chair configuration used in this experiment had the
ECG electrodes installed on the backrest and the grounding electrode on the seat. The smallest pair of electrodes

96
was used due to it configuration flexibility. During the experiment, a male subject (aged 26 years old, BMI:21)
sat on the chair with a natural posture. The output signals were processed by the analog conditioning circuit
described in Section 2.3 and captured by a digital oscilloscope (Agilent DSO6012A) from which the output
waveform was characterized.
Initially, the ground plate was connected to a 3.3V DC voltage for the reasons given in Section 4.2.4, and it was
capacitively coupled to the subject body. After acquiring the output waveform for 20 stable heart beat cycles, the
ground plate was connected to the driven right leg circuit, with a feedback gain of 20(as suggested in Section
2.3.5). Another stable output waveform of 20 heart beat cycles was collected.
The above procedures were repeated for different electrode orientations (e.g. 0o, 45o and 90o) while maintaining
a fixed electrode separation of 145mm.
Throughout the entire experiment, the subject wore a 100% cotton T-shirt and a pair of cotton jeans. At the same
time, the subject recorded a direct chest contact ECG, which served as the reference ECG. Additionally, when the
motion artifact from respiration became too large, the subject held his breath to ensure the ECG could be captured
from the output of the final stage amplification. The respiration motion artifact was then be measured at the input
before the final stage signal amplification.
4.5.3 Results

97
Figure 4.38 Signal output evaluation for different electrode orientations (based on a pair of 33mmx33mm electrodes)

98
From the result plotted in Figure 4.38, we can observe the non-negligible impact brought by the orientation on
measurement outcome.
Comparing individual plots, the DC biased grounding configuration generally provides higher signal strength
than the DRL configuration. The reason was explained in Section 4.4.4. The ECG/BCG ratio plots have
comparable magnitudes for both direct grounded and DRL configurations because the ratio was calculated from
every cardiac cycle.
On the ECG plot, the ECG strength doubles when the orientation changes from 00 to 450. The ECG amplitude
remains roughly the same when rotating from 450 to 900 for DC biased ground.
A trend similar to ECG is identified in BCG, with 450 having the largest BCG magnitude in both DC biased
ground and DRL configurations.
For respiration, the DRL and DC biased grounding configurations have opposite results. As the orientation raises
from 00 to 450, the peak to peak value of respiration doubles for the DC biased grounding, while it is reduced by
more than 10 times for the DRL. Both DRL and DC biased grounding maintain the same respiration output
magnitude when the electrodes are rotated from 450 to 900.
In terms of ECG/BCG ratio, the DRL exceeds the DC biased ground configuration at 450; but the reverse is true
for 00 and 900.
4.5.4 Discussion
The presented experiment was conducted with the following research goals in mind: (1) selecting an appropriate
electrodes orientation for the ECG chair and (2) evaluating how the two of the capacitive ECG configuration
parameters, namely electrode orientation and grounding scheme, affect the ECG signal acquiring performance.
The ECG plot in Figure 4.38 shows that the maximum value can be obtained at a 450 electrode orientation. This
reflects the largest body surface voltage drop happens along the 450 direction from the horizontal direction, which
is close to the general physiological orientation of heart. Increasing from 450 towards 900, the DC biased ECG
maintains roughly the same magnitude, which means that the vertical component of the ECG is larger than the
horizontal component. The aggregated cardiac dipole lies within the 450 to 900 range. This echoes to the argument
in Section 4.4.4 about the horizontal ECG component being close to zero. However, the reason why the DRL
line drops back down is mainly due to a large common mode component captured at this location, which is greatly
suppressed by the DRL circuit.

99
The same trend as ECG appears in the BCG plot, with the BCG reaching its maximal magnitude at 450. For
normal individuals, the heart is orientated with its long axis (the line connecting the ventricular septum and the
cardiac apex) 450 to the left of the sagittal plane [92]. Therefore, the contraction of the ventricle introduces a
mechanical thrust to the body along the 450 direction, leading to a strong BCG.
The branching in the respiration magnitudes between the two grounding schemes reflects the relative strength
between the differential and common mode of the respiratory motion artifact. In a breathing action, the middle
part of the torso, where the rib cage expands and contracts, moves more than the upper part. Consequently, when
placing the electrodes vertically (i.e. 900), the lower electrode moves more than the upper electrode. From the
discrepancy, a large differential mode noise arises, leading to a large respiratory signal output. At the same time,
a larger differential mode might be transferred to the common mode (Equation 26), resulting in a larger
suppression by the DRL.
Therefore, we have proved that the ECG signal quality is affected by the electrode orientation. The orientation of
the electrodes not only determines the ECG strength, but also affect the motion artifact components.

100
5 Future Work and Conclusion
In this work, a capacitive ECG chair was built and tested. From the presented experiments, we have proven that
it is possible to embed a capacitive sensor into a chair to collect cardiac activity patterns of a person sitting on the
chair. Given that (1) the insulating cloth layer is thin cotton with high dielectric constant, (2) the electrodes are of
medium size (110 X 67 mm2), separated by around 30 mm and oriented in 45o direction (with the electrode close
to the heart positioning lower) and (3) the DRL scheme is adopted, the QRS complex can be clearly differentiated
from noise (e.g. motion artifacts) and used to detect heart rate.
Additionally, several experiments have been conducted to evaluate the ECG chair performance in different
configurations such as different clothing material, clothing thickness, grounding scheme, electrode size, electrode
separation distance and electrode orientation. These configuration parameters affect not only the strength of the
collected ECG signal, but also the relative amplitudes between ECG and motion artifact. These experiments also
provide evidence of the origin of motion artifacts in the system and obtain a set of parameters that minimizes the
motion artifact with regard to the ECG/BCG ratio.
The study described in this thesis lays a foundation on the capacitive ECG chair from which future researchers
can get a better understanding of the principle and mechanisms behind the “magic” of capacitive sensing. Also,
it is a foundation on which further research can be conducted to expand the system, both from hardware and
software perspectives. Future work for this project is described in Section 5.1; and Section 5.3 points out the
limitations of the current work and Section 5.3 concludes the thesis.
5.1 Future Work
5.1.1 Analog Circuit Design
Currently, the electrodes are made of aluminum sheets, which are inexpensive and highly conductive. At the same
time, other electrode materials such as conductive fabrics and polymers may be able to enhance the user
experience by providing a flexible and soft interface. Therefore, it would be informative to conduct tests and
make comparisons between different electrode materials.
In terms of the electrode voltage buffer, better fabrication techniques can be developed to make the two electrode
paths closer to identical. In this way, less differential signal (e.g. ECG signal) is converted to common mode, and
suppressed by the DRL circuit. Meanwhile, fewer common mode signals (e.g. motion artifact) are converted to
differential mode and corrupt the output.

101
In the analog conditioning circuit, the overall gain could be tuned lower. As shown in Section 4.1.3, some clothing
material and thicknesses will introduce large motion artifact such as respiration. These motion artifact will saturate
the op-amp, losing information such as the ECG and BCG. To accommodate such situations, the overall gain
could be lower to prevent saturation. Similarly, the supply voltage range can be increased to maximize output
signal swing range. If the gain of the conditioning circuit is lower, then the resolution of the ADC shall be higher
to protect the signal against quantization noise.
5.1.2 Motion Artifact Removal
Motion artifacts are an inherent problem with embedded capacitive ECG because the user is not mechanically
confined to a fix position. Therefore, we need methods to make the system robust to motion artifacts.
First, the recovery time from motion artifact disturbance should be shortened to minimize its impact. Fast recovery
time can be achieved by adding a dynamic path to shunt the motion artifact current to ground, and prevent it from
entering the analog conditioning system during high motion periods.
Second, digital post-processing of the corrupted signal is necessary to recover the ECG signal. Extensive research
has been conducted to remove motion artifacts digitally for gelled or dry electrodes. For example, Yang et al.
[73] and Peng et al.[29]used an accelerometer output to flag those corrupted signals and prevent it from being fed
into the heart beat detection algorithm. Jeong et al.[35] adopted a Wiener adaptive filter (i.e. least mean square)
to digitally estimate the original signal using the moving average version of the corrupted signal as a reference.
Hyejung et al.[93], Pandey et al.[94], Velazquez et al.[95] and Raya et al.[96] applied similar methods in digitally
filtering out the motion artifact.
5.1.3 Vital Signs Extraction
Depending on the signal quality, vital sign extraction can be done either by open source pattern discovery libraries
[97] or by custom made software packages.
As seen in Chapter 4, there is a coexistence of ECG, BCG and respiration signals in the output waveform.
Therefore, custom digital algorithms can be developed to separate the three. To the author’s best knowledge, few
previous publications have carried out similar studies.
5.1.4 Generic User Trials
The experiments conducted in this study explored the ECG chair characteristic by performing tests on the same
subject. In order to generalize the result, a reasonable next step is to perform a trial of the device on a real users—

102
i.e. older adults. To the author’s best knowledge, very few past projects on capacitive ECG have obtained
generalized testing results. For example, the capacitive ECG bed developed by Kato et al.[47] was tested on four
infants, yet only one waveform of a successful case was presented graphically without much details; the capacitive
ECG chair developed by Lim et al. [48, 98] was tested on a single subject; Amaya et al. [50] performed a test of
their capacitive electrodes on two subjects, from which the heart rate measurement was extracted and compared
with a gold standard. Therefore, it would be beneficial to evaluate the current device on a larger user population.
A future experiment should consist of two parts in order to further characterize the ECG chair. The experiment
was conducted on multiple healthy subjects, with an aim to investigate the performance changes in response to
subject gender, body measure (i.e. BMI) and movement level.
In the first section, 10 healthy subjects (5 males, 5 females) will be recruited, whose BMIs range between 18 and
30. Ideally, the BMIs of subjects span the mentioned range evenly. In this experiment, every subject is required
to observe the following instructions: (1) wear the same single layer cotton clothes and pants, (2) sit in the chair
still, with the back leaning onto the chair backrest and (3) wear a gold standard ECG measurement instrument.
This section restricts the independent variables to BMI and gender. As pointed out by Nasir et al.[99], the surface
ECG voltage potential is affected by body BMI. Moreover, different body BMIs are likely to influence the skin-
electrode interface quality (e.g. contact area and contact pressure). This section reveals the chair performance
over various user BMIs. During the experiment, the outputs of the ECG chair and the ground truth are captured
and compared in real-time using an oscilloscope. From the result, the ECG amplitude, BCG amplitude, respiratory
wave amplitude and ECG/BCG ratio are extracted and plotted against BMIs. The data capturing and processing
are the same as described in Section 4.1.2.
In the second section of the experiment, the same set of subjects are required to act according to the following
instructions: (1) wear the same single layer cotton clothes and pants, (2) wear a gold standard ECG measurement
instrument and (3) perform the a sequence of activities, including surfing the Internet on a desktop computer,
eating snacks, drinking water, playing games on a mobile, each of these activities lasts for 5 minutes. Outputs
from both the ECG chair and ground truth are collected using a digital oscilloscope. From the result, the peak-to-
peak values of the motion artifact and the ECG R peak amplitudes are extracted. This experiment section is
focused on the extent to which motion artifact interferes the signal and how fast the system can recovered from
motion disturbance.
In the above experiment, the sample size is proposed to be 20, as a reasonable recruitment target. Due to a lack
of similar experiment results, we cannot estimate the population variance and mean of the dependent variables
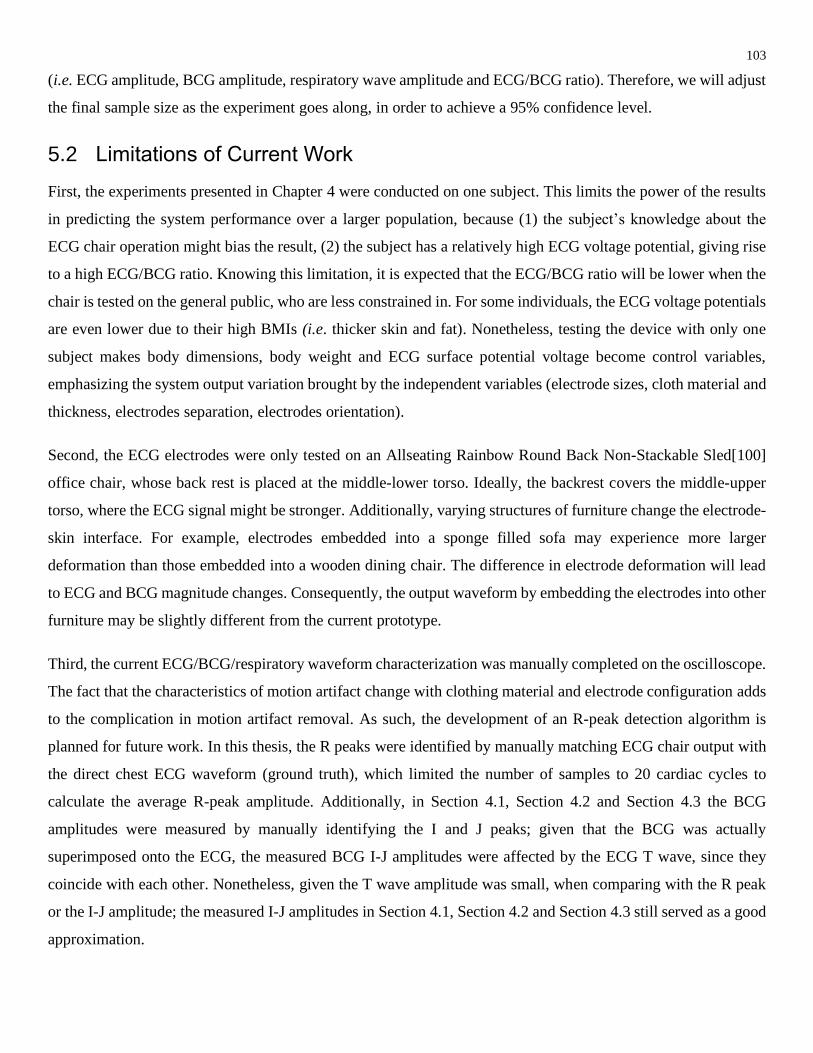
103
(i.e. ECG amplitude, BCG amplitude, respiratory wave amplitude and ECG/BCG ratio). Therefore, we will adjust
the final sample size as the experiment goes along, in order to achieve a 95% confidence level.
5.2 Limitations of Current Work
First, the experiments presented in Chapter 4 were conducted on one subject. This limits the power of the results
in predicting the system performance over a larger population, because (1) the subject’s knowledge about the
ECG chair operation might bias the result, (2) the subject has a relatively high ECG voltage potential, giving rise
to a high ECG/BCG ratio. Knowing this limitation, it is expected that the ECG/BCG ratio will be lower when the
chair is tested on the general public, who are less constrained in. For some individuals, the ECG voltage potentials
are even lower due to their high BMIs (i.e. thicker skin and fat). Nonetheless, testing the device with only one
subject makes body dimensions, body weight and ECG surface potential voltage become control variables,
emphasizing the system output variation brought by the independent variables (electrode sizes, cloth material and
thickness, electrodes separation, electrodes orientation).
Second, the ECG electrodes were only tested on an Allseating Rainbow Round Back Non-Stackable Sled[100]
office chair, whose back rest is placed at the middle-lower torso. Ideally, the backrest covers the middle-upper
torso, where the ECG signal might be stronger. Additionally, varying structures of furniture change the electrode-
skin interface. For example, electrodes embedded into a sponge filled sofa may experience more larger
deformation than those embedded into a wooden dining chair. The difference in electrode deformation will lead
to ECG and BCG magnitude changes. Consequently, the output waveform by embedding the electrodes into other
furniture may be slightly different from the current prototype.
Third, the current ECG/BCG/respiratory waveform characterization was manually completed on the oscilloscope.
The fact that the characteristics of motion artifact change with clothing material and electrode configuration adds
to the complication in motion artifact removal. As such, the development of an R-peak detection algorithm is
planned for future work. In this thesis, the R peaks were identified by manually matching ECG chair output with
the direct chest ECG waveform (ground truth), which limited the number of samples to 20 cardiac cycles to
calculate the average R-peak amplitude. Additionally, in Section 4.1, Section 4.2 and Section 4.3 the BCG
amplitudes were measured by manually identifying the I and J peaks; given that the BCG was actually
superimposed onto the ECG, the measured BCG I-J amplitudes were affected by the ECG T wave, since they
coincide with each other. Nonetheless, given the T wave amplitude was small, when comparing with the R peak
or the I-J amplitude; the measured I-J amplitudes in Section 4.1, Section 4.2 and Section 4.3 still served as a good
approximation.

104
Finally, from a system prospective, a limitation is the motion artifact. Embedding sensors into the environment
to detect ECG inherently is susceptible to motion artifact, as there is no mechanism to prevent relative movement
between human body and the sensor. In a less serious case, the motion artifacts follow cardiac rhythm and
breathing pattern, which is not too large but can be used for vital signs (e.g. heart rate, breathing rate and blood
pressure) extraction. In other cases (e.g. users changing their posture and talking loudly), the motion artifact
becomes so large and irregular that the vital sign information is lost. As a result, motion artifact is a major
limitation of the system. However, when the user sits still and becomes silent again, the large irregular motion
artifact dies down and the ECG signal recovers from the transient disturbance. Therefore, the ECG chair is a
promising option for long term, unconstraint heart rate monitoring of the senior people, whose daily activity level
is low.
5.3 Conclusion
In this study, a working prototype of a capacitive ECG chair is designed and constructed using a pair of ECG
electrodes and one DRL ground plate. The prototype consists of a pair of capacitive electrodes, an analog signal
processing circuit, a digital acquisition system and a piece of data acquisition software. The prototype is able to
acquire ECG signals with 2 layers of cotton clothes separation and the output waveform is comparable to that of
a direct chest ECG. From the ECG and heart cycle pattern, a heart rate detection algorithm can be developed to
measure the heart rate. This proves that collecting ECG signals from capacitive electrodes embedded in a chair is
feasible.
Furthermore, five tests were carried out on the ECG chair prototype to investigate the impact of clothing material,
clothing thickness, electrode size, electrode separation and electrode orientation on the resulting output signal.
This serves as a unique contribution to the research community and later system designers. Results show that the
motion artifacts (e.g. BCG) increase with increasing clothing thickness and decreasing material permittivity,
while the reverse is true for ECG. From the ECG/BCG ratio results, an optimal configuration of electrode was
found to have a size of 11x6.6 cm2, separation of 30mm, and orientation at a 45 0.
Motion artifact causes the strongest interference to ECG measurement. When a user initiates a large motion, such
as changing posture, the induced motion artifact will saturate the system output until the signal is recovered after
a few seconds. For small motion artifacts, such as BCG and respiration, they appear as voltage distortion
superimposed onto the ECG waveform.

105
6 Appendices
6.1 Appendix A : Numerical result tables in experiments Table 8 Result table for ECG, BCG and ECG/BCG ratio for different electrode sizes
Table 9 Result table for ECG output from different grounding scheme

106
Table 10 Result table for ECG output from different ECG electrode separations ( measured on a 33mmX33mm electrode)
Table 11 Result table for ECG output from different ECG electrode orientations ( measured on a 33mmX33mm electrode)

107
6.2 Appendix B: Parameters of commercially available op-amp Table 12 Comparison on commercially available op-amps

108
6.3 Appendix C: Circuit schematic diagrams
Figure 6.1 Schematic for electrode PCB

109
Figure 6.2 Schematic for analog conditioning circuit (differential amplifier)

110
Figure 6.3 Schematic for analog conditioning circuit (filter series)

111
Figure 6.4 Schematic for analog conditioning circuit (driven right leg)

112
Figure 6.5 Schematic for analog conditioning circuit (cower module)

113
Figure 6.6 Schematic for ADC

114
References
[1] R. MERCADO, A. PÁEZ, D. M. SCOTT, K. B. NEWBOLD, AND P. KANAROGLOU, "TRANSPORT POLICY IN
AGING SOCIETIES: AN INTERNATIONAL COMPARISON AND IMPLICATIONS FOR CANADA," OPEN
TRANSPORTATION JOURNAL, VOL. 1, PP. 1-13, 2007.
[2] D. O. F. CANADA. (2012, 01 OCT). ECONOMIC AND FISCAL IMPLICATIONS OF CANADA'S AGING
POPULATION. AVAILABLE: HTTP://WWW.FIN.GC.CA/PUB/EFICAP-REBVPC/REPORT-RAPPORT-ENG.ASP
[3] S. CANADA, "CANADIANS IN CONTEXT - AGEING POPULATION," STATISTICS CANADA, OTTAWA2011.
[4] S. CANADA, "CANADA YEAR BOOK," ED. OTTAWA: STATISTICAL CANADA, 2010, P. 315.
[5] S. CANADA, "CENSUS 2011 CANADA," 2011.
[6] L. MEARIAN. (2013, 01 OCT). IN-HOME HEALTH MONITORING TO LEAP SIX-FOLD BY 2017. AVAILABLE:
HTTP://WWW.COMPUTERWORLD.COM/ARTICLE/2494451/HEALTHCARE-IT/IN-HOME-HEALTH-MONITORING-
TO-LEAP-SIX-FOLD-BY-2017.HTML
[7] D. BUTLER-JONES, "REPORT ON THE STATE OF PUBLIC HEALTH IN CANADA 2010," PUBLIC HEALTH
AGENCY OF CANADA2010.
[8] M. CHAN, E. CAMPO, D. ESTÈVE, AND J.-Y. FOURNIOLS, "SMART HOMES — CURRENT FEATURES AND
FUTURE PERSPECTIVES," MATURITAS, VOL. 64, PP. 90-97, 10/20/ 2009.
[9] D. REDFOOT, L. FEINBERG, AND A. HOUSER, "THE AGING OF THE BABY BOOM AND THE GROWING CARE
GAP: A LOOK AT FUTURE DECLINES IN THE AVAILABILITY OF FAMILY CAREGIVERS," AARP PUBLIC
POLICY INSTITUTE, AUGUST, 2013.
[10] N. FARBER, D. SHINKLE, J. LYNOTT, W. FOX-GRAGE, AND R. HARRELL, AGING IN PLACE: A STATE SURVEY
OF LIVABILITY POLICIES AND PRACTICES, 2011.
[11] N. TACCINI, G. LORIGA, A. DITTMAR, AND R. PARADISO, "KNITTED INCLUDES FOR HEALTH MONITORING,"
IN ENGINEERING IN MEDICINE AND BIOLOGY SOCIETY, 2004. IEMBS '04. 26TH ANNUAL INTERNATIONAL
CONFERENCE OF THE IEEE, 2004, PP. 2165-2168.
[12] J. MUHLSTEFF, I. O. SUCH, R. SCHMIDT, M. PERKUHN, H. REITER, J. LAUTER, ET AL., "WEARABLE
APPROACH FOR CONTINUOUS ECG - AND ACTIVITY PATIENT-MONITORING," IN ENGINEERING IN MEDICINE
AND BIOLOGY SOCIETY, 2004. IEMBS '04. 26TH ANNUAL INTERNATIONAL CONFERENCE OF THE IEEE,
2004, PP. 2184-2187.
[13] K. G. NG, J.-H. TING CM FAU - YEO, K.-W. YEO JH FAU - SIM, W.-L. SIM KW FAU - PEH, N.-H. PEH WL
FAU - CHUA, N.-K. CHUA NH FAU - CHUA, ET AL., "PROGRESS ON THE DEVELOPMENT OF THE MEDIWATCH
AMBULATORY BLOOD PRESSURE MONITOR AND RELATED DEVICES," 20040616 DCOM- 20050216.
[14] B.-H. YANG AND S. RHEE, "DEVELOPMENT OF THE RING SENSOR FOR HEALTHCARE AUTOMATION,"
ROBOTICS AND AUTONOMOUS SYSTEMS, VOL. 30, PP. 273-281, 2/29/ 2000.
[15] C.-T. HUANG, C.-L. SHEN, C.-F. TANG, AND S.-H. CHANG, "A WEARABLE YARN-BASED PIEZO-RESISTIVE
SENSOR," SENSORS AND ACTUATORS A: PHYSICAL, VOL. 141, PP. 396-403, 2/15/ 2008.

115
[16] SAMSUNG. (2014). SAMSUNG GEAR FIT AVAILABLE:
HTTP://WWW.SAMSUNG.COM/CA/CONSUMER/MOBILE/GALAXY-GEAR/GALAXY-GEAR/SM-R3500ZKAXAC
[17] T. STENOVEC, "SOME FITBIT FORCE OWNERS COMPLAIN OF SEVERE SKIN IRRITATION," IN
HUFFINGTONPOST.COM, ED.
[18] A. MIHAILIDIS, J. BOGER, J. HOEY, AND T. JIANCARO, "ZERO EFFORT TECHNOLOGIES: CONSIDERATIONS,
CHALLENGES, AND USE IN HEALTH, WELLNESS, AND REHABILITATION," SYNTHESIS LECTURES ON ASSISTIVE,
REHABILITATIVE, AND HEALTH-PRESERVING TECHNOLOGIES, VOL. 1, PP. 1-94, 2011.
[19] L. SHERWOOD. (2004). HUMAN PHYSIOLOGY : FROM CELLS TO SYSTEMS (5TH ED.).
[20] Y. XIAOGANG, L. CHANGZHI, AND L. JENSHAN, "TWO-DIMENSIONAL NONCONTACT VITAL SIGN DETECTION
USING DOPPLER RADAR ARRAY APPROACH," 2011 IEEE MTT-S INTERNATIONAL MICROWAVE SYMPOSIUM,
PP. 1-4, 2011.
[21] T. R. GAULT, N. BLUMENTHAL, A. A. FARAG, AND T. STARR, "EXTRACTION OF THE SUPERFICIAL FACIAL
VASCULATURE, VITAL SIGNS WAVEFORMS AND RATES USING THERMAL IMAGING," IN COMPUTER VISION
AND PATTERN RECOGNITION WORKSHOPS (CVPRW), 2010 IEEE COMPUTER SOCIETY CONFERENCE ON,
2010, PP. 1-8.
[22] R. ARKIN. VIRTUAL MEDIAL ASSISTANT. AVAILABLE: HTTP://SENSIOTEC.COM/SENSIOTEC-LEADERSHIP-
TEAM/
[23] P. ORLEWSKI, L. FEDERSPIEL, M. CUDDIHY, M. RAO, AND S. FUKS, "ADVANCED OCCUPANT DETECTION
SYSTEM: DETECTION OF HUMAN VITAL SIGNS BY SEAT-EMBEDDED FERROELECTRIC FILM SENSORS AND BY
VIBRATION ANALYSIS," NATIONAL HIGHWAY TRAFFIC SAFETY ADMINISTRATION, HTTP://WWW. NRD.
NHTSA. DOT. GOV/PDF/ESV/ESV22/SESSION, VOL. 203.
[24] T. KLAP AND Z. SHINAR, "USING PIEZOELECTRIC SENSOR FOR CONTINUOUS-CONTACT-FREE MONITORING OF
HEART AND RESPIRATION RATES IN REAL-LIFE HOSPITAL SETTINGS," IN COMPUTING IN CARDIOLOGY
CONFERENCE (CINC), 2013, 2013, PP. 671-674.
[25] S. JUNNILA, A. AKHBARDEH, L. C. BARNA, I. DEFEE, AND A. VARRI, "A WIRELESS
BALLISTOCARDIOGRAPHIC CHAIR," IN ENGINEERING IN MEDICINE AND BIOLOGY SOCIETY, 2006. EMBS
'06. 28TH ANNUAL INTERNATIONAL CONFERENCE OF THE IEEE, 2006, PP. 5932-5935.
[26] T. KOIVISTOINEN, A. JUNNILA S FAU - VARRI, T. VARRI A FAU - KOOBI, AND T. KOOBI, "A NEW METHOD
FOR MEASURING THE BALLISTOCARDIOGRAM USING EMFI SENSORS IN A NORMAL CHAIR," 20070202
DCOM- 20070918.
[27] J. H. SHIN, K. S. LEE KM FAU - PARK, AND K. S. PARK, "NON-CONSTRAINED MONITORING OF SYSTOLIC
BLOOD PRESSURE ON A WEIGHING SCALE," 20090624 DCOM- 20090915.
[28] W.-Y. CHUNG, Y.-D. LEE, AND S.-J. JUNG, "A WIRELESS SENSOR NETWORK COMPATIBLE WEARABLE U-
HEALTHCARE MONITORING SYSTEM USING INTEGRATED ECG, ACCELEROMETER AND SPO 2," IN
ENGINEERING IN MEDICINE AND BIOLOGY SOCIETY, 2008. EMBS 2008. 30TH ANNUAL INTERNATIONAL
CONFERENCE OF THE IEEE, 2008, PP. 1529-1532.

116
[29] P. MEIRAN, W. TIANDONG, H. GUANGSHU, AND Z. HUI, "A WEARABLE HEART RATE BELT FOR AMBULANT
ECG MONITORING," IN E-HEALTH NETWORKING, APPLICATIONS AND SERVICES (HEALTHCOM), 2012 IEEE
14TH INTERNATIONAL CONFERENCE ON, 2012, PP. 371-374.
[30] C. R. MERRITT, H. T. NAGLE, AND E. GRANT, "FABRIC-BASED ACTIVE ELECTRODE DESIGN AND
FABRICATION FOR HEALTH MONITORING CLOTHING," INFORMATION TECHNOLOGY IN BIOMEDICINE, IEEE
TRANSACTIONS ON, VOL. 13, PP. 274-280, 2009.
[31] B. TAJI, S. SHIRMOHAMMADI, V. GROZA, AND M. BOLIC, "AN ECG MONITORING SYSTEM USING
CONDUCTIVE FABRIC," IN MEDICAL MEASUREMENTS AND APPLICATIONS PROCEEDINGS (MEMEA), 2013
IEEE INTERNATIONAL SYMPOSIUM ON, 2013, PP. 309-314.
[32] M. A. MESTROVIC, R. J. N. HELMER, L. KYRATZIS, AND D. KUMAR, "PRELIMINARY STUDY OF DRY KNITTED
FABRIC ELECTRODES FOR PHYSIOLOGICAL MONITORING," IN INTELLIGENT SENSORS, SENSOR NETWORKS
AND INFORMATION, 2007. ISSNIP 2007. 3RD INTERNATIONAL CONFERENCE ON, 2007, PP. 601-606.
[33] I. TONG, Y. SUN, K. TAE EUI, W. HUN, K. KAP JIN, W. EUNG JE, ET AL., "NANOFIBER WEB TEXTILE DRY
ELECTRODES FOR LONG-TERM BIOPOTENTIAL RECORDING," BIOMEDICAL CIRCUITS AND SYSTEMS, IEEE
TRANSACTIONS ON, VOL. 7, PP. 204-211, 2013.
[34] E. VALCHINOV, A. RUTKOVSKIS, AND N. PALLIKARAKIS, "WIRELESS DRY-CONTACT BIOPOTENTIAL
ELECTRODE," IN E-HEALTH AND BIOENGINEERING CONFERENCE (EHB), 2011, 2011, PP. 1-4.
[35] J. DO-UN AND K. SE-JIN, "DEVELOPMENT OF A TECHNIQUE FOR CANCELLING MOTION ARTIFACT IN
AMBULATORY ECG MONITORING SYSTEM," IN CONVERGENCE AND HYBRID INFORMATION TECHNOLOGY,
2008. ICCIT '08. THIRD INTERNATIONAL CONFERENCE ON, 2008, PP. 954-961.
[36] J. OTTENBACHER, M. KIRST, L. JATOBA, M. HUFLEJT, U. GROSSMANN, AND W. STORK, "RELIABLE MOTION
ARTIFACT DETECTION FOR ECG MONITORING SYSTEMS WITH DRY ELECTRODES," IN ENGINEERING IN
MEDICINE AND BIOLOGY SOCIETY, 2008. EMBS 2008. 30TH ANNUAL INTERNATIONAL CONFERENCE OF
THE IEEE, 2008, PP. 1695-1698.
[37] D. DOBREV, "TWO-ELECTRODE LOW SUPPLY VOLTAGE ELECTROCARDIOGRAM SIGNAL AMPLIFIER,"
MEDICAL AND BIOLOGICAL ENGINEERING AND COMPUTING, VOL. 42, PP. 272-276, 2004.
[38] W. Y. WONG, R. SUDIRMAN, N. H. MAHMOOD, S. Z. TUMARI, AND N. SAMAD, "STUDY OF ENVIRONMENT
BASED CONDITION OF ELECTROMAGNETIC INTERFERENCE DURING ECG ACQUISITION," IN BIOMEDICAL
ENGINEERING (ICOBE), 2012 INTERNATIONAL CONFERENCE ON, 2012, PP. 579-584.
[39] J. HAE-KYUNG AND J. DO-UN, "DEVELOPMENT OF WEARABLE ECG MEASUREMENT SYSTEM USING EMD
FOR MOTION ARTIFACT REMOVAL," IN COMPUTING AND CONVERGENCE TECHNOLOGY (ICCCT), 2012 7TH
INTERNATIONAL CONFERENCE ON, 2012, PP. 299-304.
[40] J. G. WEBSTER, MEDICAL INSTRUMENTATION APPLICATION AND DESIGN, 4TH EDITION: WILEY GLOBAL
EDUCATION, 2009.
[41] N. BHAT, D. SESHADRI, AND S. RADHAKRISHNAN, "PREPARATION, CHARACTERIZATION, AND
PERFORMANCE OF CONDUCTIVE FABRICS: COTTON+ PANI," TEXTILE RESEARCH JOURNAL, VOL. 74, PP. 155-
166, 2004.

117
[42] Y. M. CHI, J. TZYY-PING, AND G. CAUWENBERGHS, "DRY-CONTACT AND NONCONTACT BIOPOTENTIAL
ELECTRODES: METHODOLOGICAL REVIEW," BIOMEDICAL ENGINEERING, IEEE REVIEWS IN, VOL. 3, PP. 106-
119, 2010.
[43] Y. M. CHI AND G. CAUWENBERGHS, "MICROPOWER NON-CONTACT EEG ELECTRODE WITH ACTIVE
COMMON-MODE NOISE SUPPRESSION AND INPUT CAPACITANCE CANCELLATION," IN ENGINEERING IN
MEDICINE AND BIOLOGY SOCIETY, 2009. EMBC 2009. ANNUAL INTERNATIONAL CONFERENCE OF THE
IEEE, PP. 4218-4221.
[44] Y. M. CHI, S. R. DEISS, AND G. CAUWENBERGHS, "NON-CONTACT LOW POWER EEG/ECG ELECTRODE FOR
HIGH DENSITY WEARABLE BIOPOTENTIAL SENSOR NETWORKS," IN WEARABLE AND IMPLANTABLE BODY
SENSOR NETWORKS, 2009. BSN 2009. SIXTH INTERNATIONAL WORKSHOP ON, PP. 246-250.
[45] S. YE, Y. XIONG, AND J. BERILLA, "AN INNOVATIVE NON-INVASIVE ECG SENSOR AND COMPARISON STUDY
WITH CLINIC SYSTEM," IN BIOENGINEERING CONFERENCE (NEBEC), 2013 39TH ANNUAL NORTHEAST,
2013, PP. 163-164.
[46] K.-F. WU AND Y.-T. ZHANG, "CONTACTLESS AND CONTINUOUS MONITORING OF HEART ELECTRIC
ACTIVITIES THROUGH CLOTHES ON A SLEEPING BED," IN INFORMATION TECHNOLOGY AND APPLICATIONS IN
BIOMEDICINE, 2008. ITAB 2008. INTERNATIONAL CONFERENCE ON, 2008, PP. 282-285.
[47] T. KATO, A. UENO, S. KATAOKA, H. HOSHINO, AND Y. ISHIYAMA, "AN APPLICATION OF CAPACITIVE
ELECTRODE FOR DETECTING ELECTROCARDIOGRAM OF NEONATES AND INFANTS," IN ENGINEERING IN
MEDICINE AND BIOLOGY SOCIETY, 2006. EMBS '06. 28TH ANNUAL INTERNATIONAL CONFERENCE OF THE
IEEE, 2006, PP. 916-919.
[48] L. YONG GYU, C. GIH SUNG, AND P. KWANG-SUK, "CAPACITIVE DRIVEN-RIGHT-LEG GROUNDING IN
INDIRECT-CONTACT ECG MEASUREMENT," IN ENGINEERING IN MEDICINE AND BIOLOGY SOCIETY (EMBC),
2010 ANNUAL INTERNATIONAL CONFERENCE OF THE IEEE, 2010, PP. 1250-1253.
[49] K. KO KEUN, L. YONG KYU, AND P. KWANG-SUK, "COMMON MODE NOISE CANCELLATION FOR
ELECTRICALLY NON-CONTACT ECG MEASUREMENT SYSTEM ON A CHAIR," IN ENGINEERING IN MEDICINE
AND BIOLOGY SOCIETY, 2005. IEEE-EMBS 2005. 27TH ANNUAL INTERNATIONAL CONFERENCE OF THE,
2005, PP. 5881-5883.
[50] A. ARCELUS, M. SARDAR, AND A. MIHAILIDIS, "DESIGN OF A CAPACITIVE ECG SENSOR FOR UNOBTRUSIVE
HEART RATE MEASUREMENTS," IN INSTRUMENTATION AND MEASUREMENT TECHNOLOGY CONFERENCE
(I2MTC), 2013 IEEE INTERNATIONAL, 2013, PP. 407-410.
[51] ANONYMOUS. (SEP-20). SENSOR. AVAILABLE: HTTP://EN.WIKIPEDIA.ORG/WIKI/SENSOR
[52] D. C. GRAHAME, "THE ELECTRICAL DOUBLE LAYER AND THE THEORY OF ELECTROCAPILLARITY,"
CHEMICAL REVIEWS, VOL. 41, PP. 441-501, 1947/12/01 1947.
[53] R. MANCINI, OP AMPS FOR EVERYONE: ELSEVIER, 2003.
[54] D. V. BATORSKY AND M. E. BURKE, "1980 BELL SYSTEM NOISE SURVEY OF THE LOOP PLANT," AT&T BELL
LABORATORIES TECHNICAL JOURNAL, VOL. 63, PP. 775-818, 1984.

118
[55] F. REVERTER, X. J. LI, AND G. C. M. MEIJER, "STABILITY AND ACCURACY OF ACTIVE SHIELDING FOR
GROUNDED CAPACITIVE SENSORS," MEASUREMENT SCIENCE & TECHNOLOGY, VOL. 17, PP. 2884-2890, NOV
2006.
[56] CADENCE. (SEP-21). CADENCE SCHEMATIC CAPTURE DATA SHEET. AVAILABLE:
HTTP://WWW.CADENCE.COM/RL/RESOURCES/DATASHEETS/7440_SCHEMATIC_CAPTURE_DS_FNL.PDF
[57] J.-W. LEE AND G.-K. LEE, "DESIGN OF AN ADAPTIVE FILTER WITH A DYNAMIC STRUCTURE FOR ECG SIGNAL
PROCESSING," INTERNATIONAL JOURNAL OF CONTROL, AUTOMATION, AND SYSTEMS, VOL. 3, PP. 137-142,
2005.
[58] B.-B. PRODUCTS, "MICROPOWER, SINGLE-SUPPLY, CMO INSTRUMENTATION AMPLIFIER," 2006.
[59] B. CARTER, "A SINGLE-SUPPLY OP-AMP CIRCUIT COLLECTION," TEXAS INSTRUMENTS LITERATURE,
NUMBER SLOA058, 2000.
[60] ANONYMOUS. (SEP-21). BUTTERWORTH FILTER. AVAILABLE:
HTTP://EN.WIKIPEDIA.ORG/WIKI/BUTTERWORTH_FILTER
[61] A. S. SEDRA AND P. O. BRACKETT, FILTER THEORY AND DESIGN : ACTIVE AND PASSIVE. CHAMPAIGN, ILL.:
MATRIX PUBLISHERS, 1978.
[62] C. BOND, "BUTTERWORTH FILTERS - POLYNOMIALS, POLES AND CIRCUIT ELEMENTS," 2003.
[63] J. KARKI, "ANALYSIS OF THE SALLEN-KEY ARCHITECTURE," TEXAS INSTRUMENTS, 1999.
[64] W. DE ARMAS, "DESIGN OF A NON-INTRUSIVE 2-LEAD ECG SYSTEM USING THE ACTIVE INSULATED
ELECTRODE," 2010.
[65] B. B. WINTER AND J. G. WEBSTER, "DRIVEN-RIGHT-LEG CIRCUIT DESIGN," BIOMEDICAL ENGINEERING,
IEEE TRANSACTIONS ON, VOL. BME-30, PP. 62-66, 1983.
[66] M. MURNANE AND C. AUGUSTA, "UNDERSTANDING PULSAR ADC SUPPORT CIRCUITRY."
[67] N. V. THAKOR, J. G. WEBSTER, AND W. J. TOMPKINS, "ESTIMATION OF QRS COMPLEX POWER SPECTRA
FOR DESIGN OF A QRS FILTER," IEEE TRANSACTIONS ON BIOMEDICAL ENGINEERING, VOL. BME-31, PP.
702-706, 1984.
[68] A. DEVICES, "AD7685 DATASHEET," ED, 2007.
[69] F. LEENS, "AN INTRODUCTION TO I 2 C AND SPI PROTOCOLS," INSTRUMENTATION & MEASUREMENT
MAGAZINE, IEEE, VOL. 12, PP. 8-13, 2009.
[70] A. DEVICES, "INTERFACING TO HIGH SPEED ADCS VIA SPI, APPLICATION NOTE AN-877, REV," ED: A.
[71] S. J. DIXON-WARREN. (2011, SEP-21). LOOKING INSIDE THE HI TECHNIC NXT ACCELEROMETER FOR
LEGO. AVAILABLE: HTTP://MEMSBLOG.WORDPRESS.COM/2011/01/05/CHIPWORKS-2/
[72] A. DEVICES, "ADXL345 DATASHEET," USA: ANALOG DEVICES, 2010.

119
[73] Y. CHANG-MING, W. CHIH-CHUNG, C. CHUN-MEI, AND Y. TZU-LIN, "VEHICLE DRIVER'S ECG AND SITTING
POSTURE MONITORING SYSTEM," IN INFORMATION TECHNOLOGY AND APPLICATIONS IN BIOMEDICINE,
2009. ITAB 2009. 9TH INTERNATIONAL CONFERENCE ON, 2009, PP. 1-4.
[74] M. J. DONAHOO AND K. L. CALVERT, TCP/IP SOCKETS IN C: PRACTICAL GUIDE FOR PROGRAMMERS:
MORGAN KAUFMANN PUBLISHERS, 2001.
[75] Z. ALLIANCE, "HOW DOES ZIGBEE COMPARE TO OTHER WIRELESS STANDARDS?," ED: ZIGBEE ALLIANCE,
2014.
[76] B.CUZEAU. (2009, A.L.S.E APPLICATION NOTE RS232 BASICS. AVAILABLE: HTTP://WWW.ALSE-
FR.COM/ARCHIVE/ALSE_RS232.PDF
[77] S. LABS, EFM32WG REFERENCE MANUAL, 2014.
[78] C. S. LLC, M. L. MITCHELL, A. SAMUEL, AND J. OLDHAM, ADVANCED LINUX PROGRAMMING: PEARSON
EDUCATION, 2001.
[79] KST. (07 OCT). KST - VISUALIZE YOUR DATA. AVAILABLE: HTTPS://KST-PLOT.KDE.ORG/
[80] J. W. S. HEARLE, "CAPACITY, DIELECTRIC CONSTANT, AND POWER FACTOR OF FIBER ASSEMBLIES,"
TEXTILE RESEARCH JOURNAL, VOL. 24, PP. 307-321, 1954.
[81] C. KIRKWOOD, N. S. KENDRICK, AND H. BROWN, "MEASUREMENT OF DIELECTRIC CONSTANT AND
DISSIPATION FACTOR OF RAW COTTONS," TEXTILE RESEARCH JOURNAL, VOL. 24, PP. 841-847, 1954.
[82] J. E. ALGIE, "DIELECTRIC CONSTANT AND CONDUCTANCE CHANGES IN WOOL FIBERS PRODUCED BY STEP
CHANGES IN THE RELATIVE HUMIDITY," TEXTILE RESEARCH JOURNAL, VOL. 34, PP. 477-486, 1964.
[83] W. L. BALLS. (1915). DEVELOPMENT AND PROPERTIES OF RAW COTTON. AVAILABLE:
HTTP://MYACCESS.LIBRARY.UTORONTO.CA/LOGIN?URL=HTTP://WWW.GLOBALCOMMODITIES.AMDIGITAL.C
O.UK/DOCUMENTS/DETAILS/BL_B_MP_10
[84] W. E. MORTON, J. W. S. HEARLE, AND TEXTILE INSTITUTE (MANCHESTER ENGLAND), PHYSICAL
PROPERTIES OF TEXTILE FIBRES, 3RD ED. MANCHESTER, U.K.: TEXTILE INSTITUTE, 1993.
[85] B. HYUN JAE, C. GIH SUNG, K. KO KEUN, AND P. KWANG SUK, "A SMART HEALTH MONITORING CHAIR
FOR NONINTRUSIVE MEASUREMENT OF BIOLOGICAL SIGNALS," IEEE TRANSACTIONS ON INFORMATION
TECHNOLOGY IN BIOMEDICINE, VOL. 16, PP. 150-158, 2012.
[86] K. KO KEUN, L. YONG KYU, AND P. KWANG-SUK, "COMMON MODE NOISE CANCELLATION FOR
ELECTRICALLY NON-CONTACT ECG MEASUREMENT SYSTEM ON A CHAIR," IN ENGINEERING IN MEDICINE
AND BIOLOGY SOCIETY, 2005. IEEE-EMBS 2005. 27TH ANNUAL INTERNATIONAL CONFERENCE OF THE,
PP. 5881-5883.
[87] Y. KIM, H. BAEK, J. KIM, H. LEE, J. CHOI, AND K. PARK, "HELMET-BASED PHYSIOLOGICAL SIGNAL
MONITORING SYSTEM," EUROPEAN JOURNAL OF APPLIED PHYSIOLOGY, VOL. 105, PP. 365-372, 2009.
[88] A. M. WEISSLER, NONINVASIVE CARDIOLOGY. NEW YORK: GRUNE & STRATTON, 1974.

120
[89] C. T. REVIEWS, E-STUDY GUIDE FOR PHYSICS, CHAPTERS 1-17, VOL. 1, TEXTBOOK BY JOHN D CUTNELL:
PHYSICS, PHYSICS: CRAM101, 2013.
[90] E. C. M. PRODUCTS, "<DIELECTRIC-CHART.PDF>," D. M. C.-L. L. D. O. C. MATERIALS, ED., ED.
[91] D. SALU Y FAU - LAUGHLIN, J. LAUGHLIN D FAU - ROGERS, M. ROGERS J FAU - MARCUS, AND M. MARCUS,
"EFFECTS OF THE VOLUME CONDUCTOR ON THE APPARENT ORIENTATION OF A KNOWN CARDIAC DIPOLE,"
19780814 DCOM- 19780814.
[92] "THE CARDIAC POSITION AND AXIS ORIENTATION," IN ECHOCARDIOGRAPHIC ANATOMY IN THE FETUS, ED:
SPRINGER MILAN, 2008, PP. 29-37.
[93] K. HYEJUNG, K. SUNYOUNG, N. VAN HELLEPUTTE, T. BERSET, G. DI, I. ROMERO, ET AL., "MOTION
ARTIFACT REMOVAL USING CASCADE ADAPTIVE FILTERING FOR AMBULATORY ECG MONITORING SYSTEM,"
IN BIOMEDICAL CIRCUITS AND SYSTEMS CONFERENCE (BIOCAS), 2012 IEEE, 2012, PP. 160-163.
[94] V. K. PANDEY, "ADAPTIVE FILTERING FOR BASELINE WANDER REMOVAL IN ECG," IN INFORMATION
TECHNOLOGY AND APPLICATIONS IN BIOMEDICINE (ITAB), 2010 10TH IEEE INTERNATIONAL
CONFERENCE ON, 2010, PP. 1-4.
[95] R. VELAZQUEZ, "AN OPTIMAL ADAPTIVE FILTERING APPROACH FOR STRESS-TESTS MOTION ARTIFACTS
REMOVAL: APPLICATION ON AN ECG FOR TELEDIAGNOSIS," IN SIGNAL PROCESSING, 2002 6TH
INTERNATIONAL CONFERENCE ON, 2002, PP. 1504-1507 VOL.2.
[96] M. A. RAYA AND L. G. SISON, "ADAPTIVE NOISE CANCELLING OF MOTION ARTIFACT IN STRESS ECG
SIGNALS USING ACCELEROMETER," IN ENGINEERING IN MEDICINE AND BIOLOGY, 2002. 24TH ANNUAL
CONFERENCE AND THE ANNUAL FALL MEETING OF THE BIOMEDICAL ENGINEERING SOCIETY EMBS/BMES
CONFERENCE, 2002. PROCEEDINGS OF THE SECOND JOINT, 2002, PP. 1756-1757 VOL.2.
[97] PHYSIONET.ORG. (2013). THE WFDB SOFTWARE PACKAGE. AVAILABLE:
HTTP://WWW.PHYSIONET.ORG/PHYSIOTOOLS/WFDB.SHTML#LIBRARY
[98] L. YONG GYU, K. KO KEUN, AND P. SUK, "ECG MEASUREMENT ON A CHAIR WITHOUT CONDUCTIVE
CONTACT," BIOMEDICAL ENGINEERING, IEEE TRANSACTIONS ON, VOL. 53, PP. 956-959, 2006.
[99] J. M. NASIR, B. J. RUBAL, S. O. JONES, AND A. D. SHAH, "THE EFFECTS OF BODY MASS INDEX ON SURFACE
ELECTROCARDIOGRAMS IN YOUNG ADULTS," JOURNAL OF ELECTROCARDIOLOGY, VOL. 45, PP. 646-651, 11//
2012.
[100] ALLSEATING. (2014, 01 OCT). RAINBOW ROUND BACK NON-STACKABLE SLED. AVAILABLE:
HTTP://WWW.ALLSEATING.COM/PRODUCTS/RAINBOW-ROUND-BACK-NON-STACKABLE-SLED


![Electrocardiography (ECG) Sensor Data Sheet · 2016-07-31 · Electrocardiography (ECG) Sensor Data Sheet ! PAGE 2 OF 2 !! TRANSFER FUNCTION [-1.5!", 1.5!"] !"#!=!"# 2! − 1 2.!""!!"#!"#!"=!"#!.1000](https://img.pdfslide.us/doc/110x75/5e34e5659e84cf20cf77d72a/electrocardiography-ecg-sensor-data-sheet-2016-07-31-electrocardiography-ecg.jpg)