Embed Size (px)
Citation preview
A Century of Work and A Century of Work and LeisureLeisure
by by
Valerie A. RameyValerie A. Ramey
andand
Neville FrancisNeville Francis
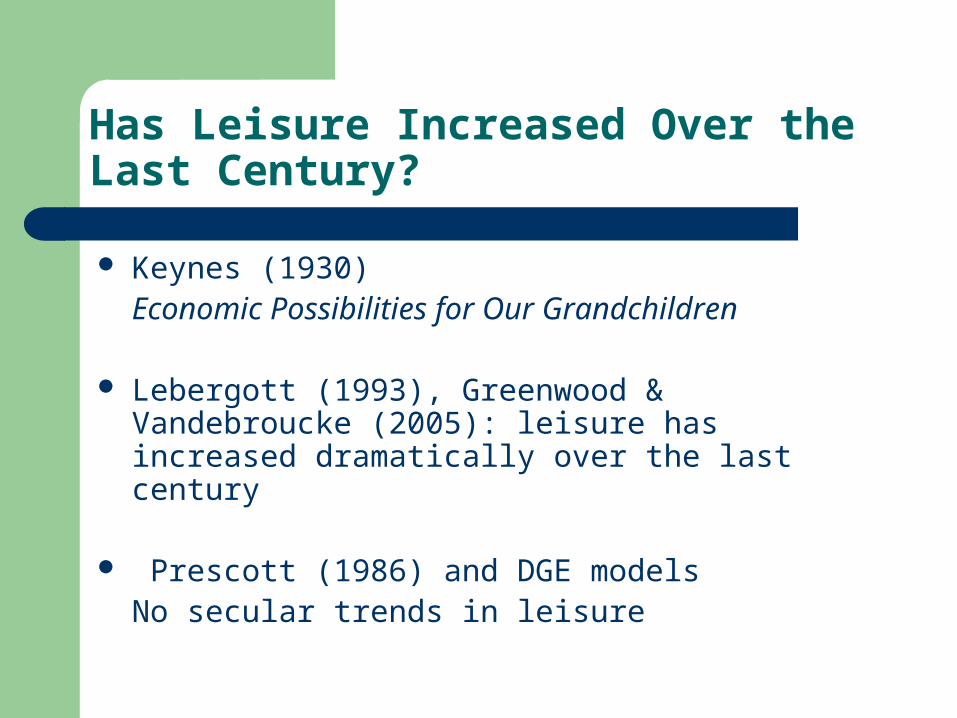
Has Leisure Increased Over the Last Century?
Keynes (1930)Economic Possibilities for Our Grandchildren
Lebergott (1993), Greenwood & Vandebroucke (2005): leisure has increased dramatically over the last century
Prescott (1986) and DGE modelsNo secular trends in leisure
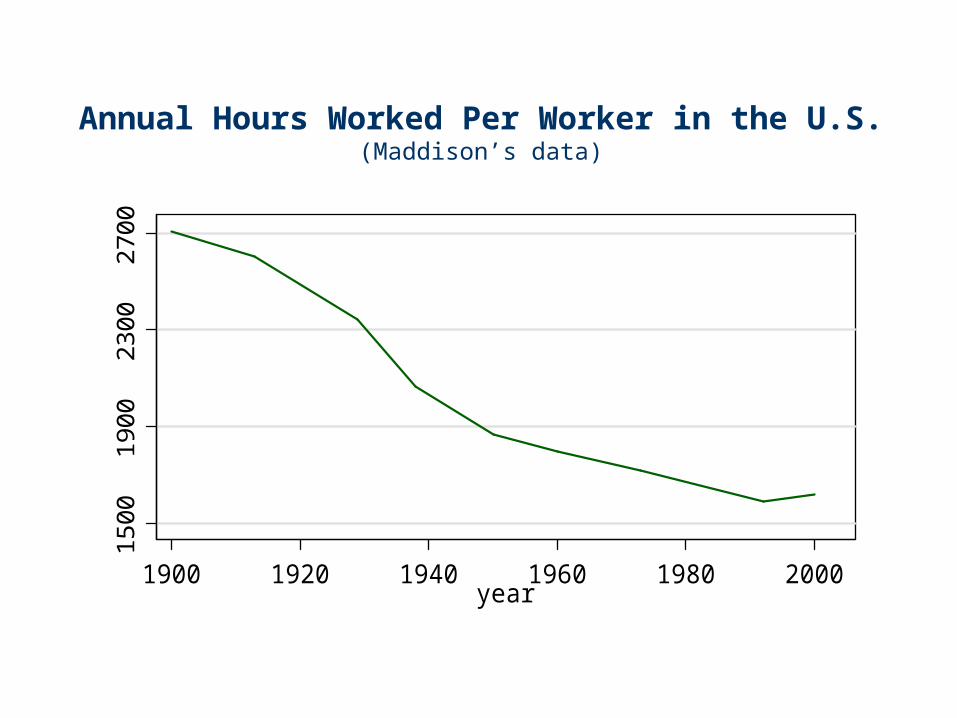
Annual Hours Worked Per Worker in the U.S.(Maddison’s data)
1500
1900
2300
2700
1900 1920 1940 1960 1980 2000year
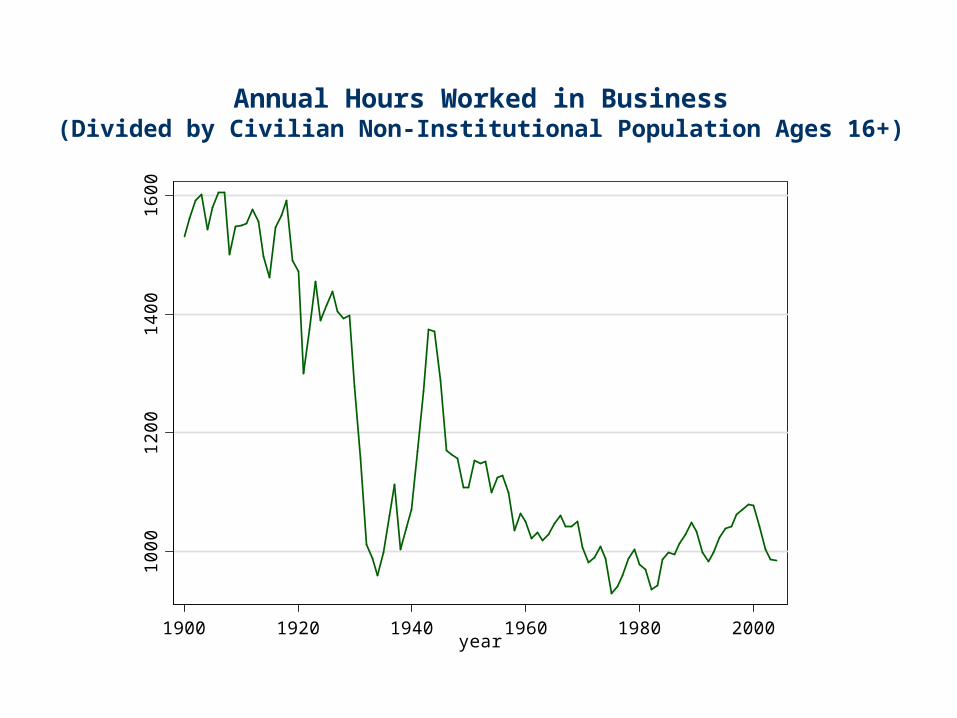
Annual Hours Worked in Business(Divided by Civilian Non-Institutional Population Ages 16+)
1000
1200
1400
1600
1900 1920 1940 1960 1980 2000year
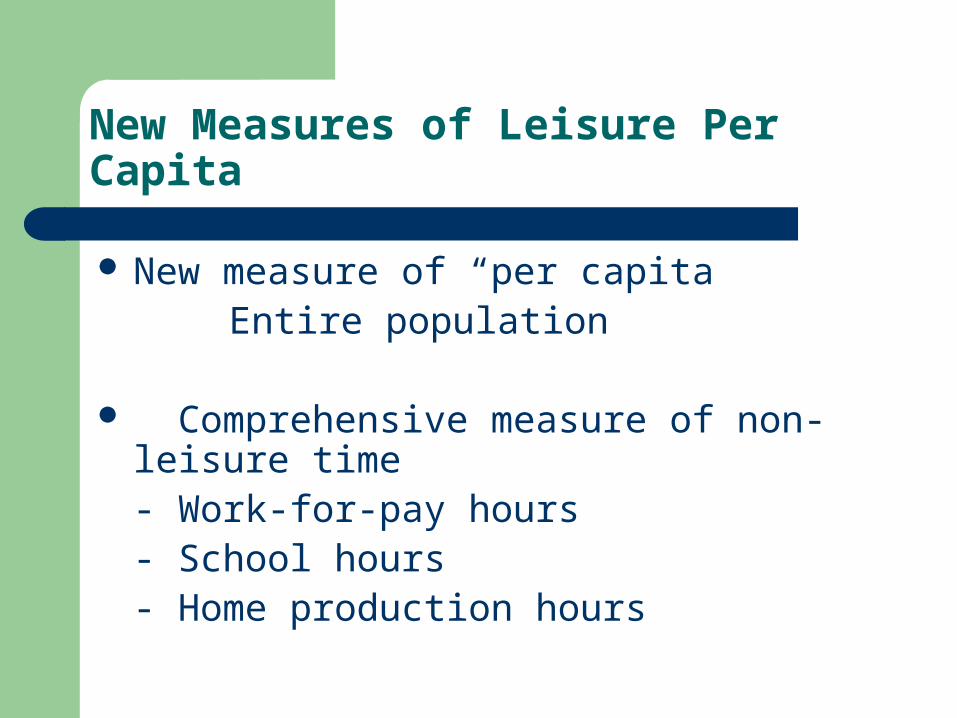
New Measures of Leisure Per Capita
New measure of “per capita”Entire population
Comprehensive measure of non-leisure time- Work-for-pay hours- School hours- Home production hours

How Should We Measure “Per Capita?”
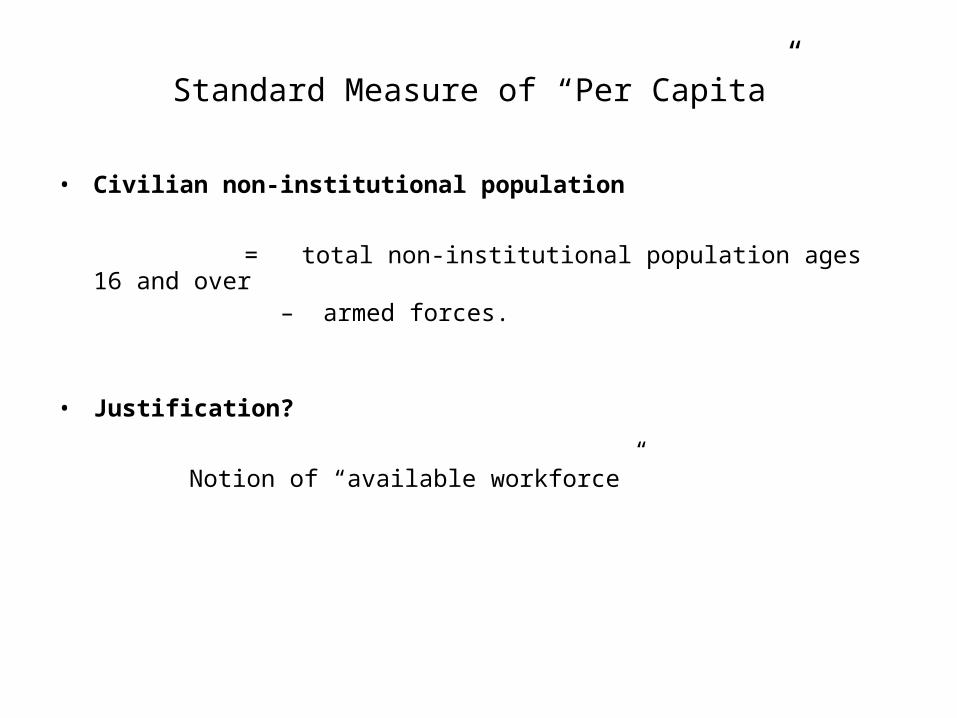
Standard Measure of “Per Capita”
• Civilian non-institutional population
= total non-institutional population ages 16 and over – armed forces.
• Justification?
Notion of “available workforce”
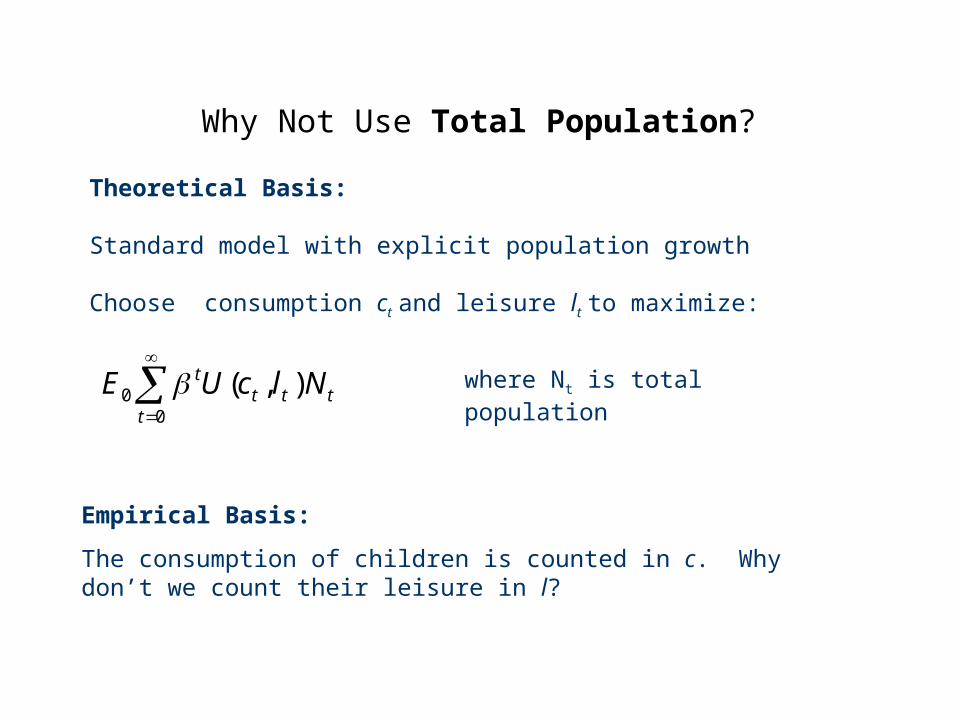
Why Not Use Total Population?
00 ),(t
tttt NlcUE
Theoretical Basis:
Standard model with explicit population growth
Choose consumption ct and leisure lt to maximize:
Empirical Basis:
The consumption of children is counted in c. Why don’t we count their leisure in l?
where Nt is total population
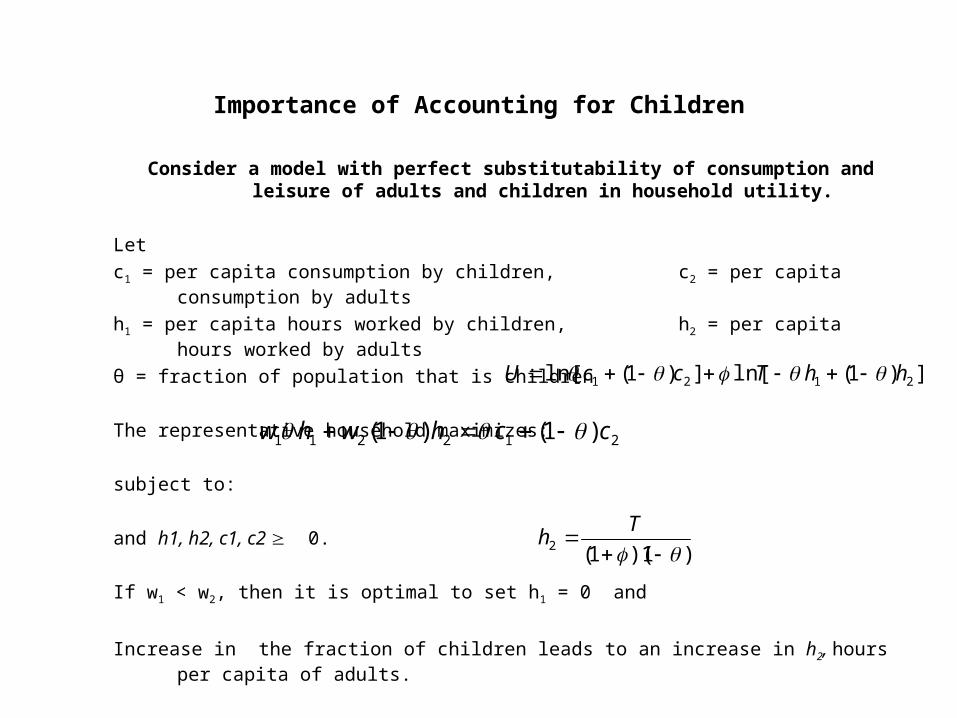
Importance of Accounting for Children
Consider a model with perfect substitutability of consumption and leisure of adults and children in household utility.
Let
c1 = per capita consumption by children, c2 = per capita consumption by adults
h1 = per capita hours worked by children, h2 = per capita hours worked by adults
θ = fraction of population that is children
The representative household maximizes:
subject to:
and h1, h2, c1, c2 0.
If w1 < w2, then it is optimal to set h1 = 0 and
Increase in the fraction of children leads to an increase in h2, hours per capita of adults.
Thus, adult time use is affected by the presence of dependents with lower productivity.
])1(ln[])1(ln[ 2121 hhTccU
212211 )1()1( cchwhw
)1)(1(2
Th
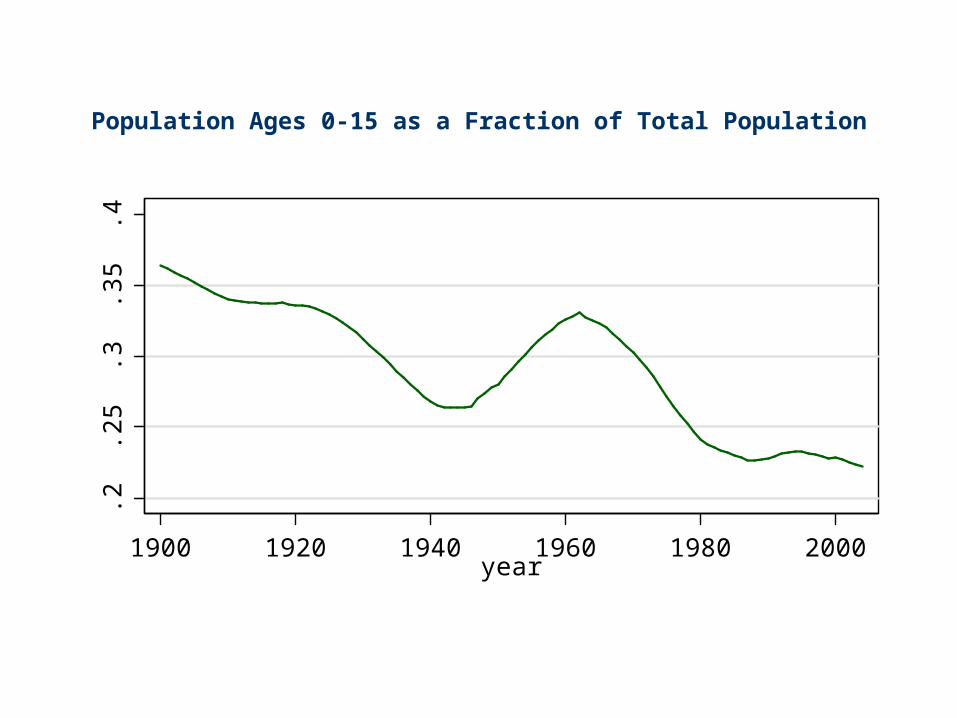
Population Ages 0-15 as a Fraction of Total Population.2
.25
.3.3
5.4
1900 1920 1940 1960 1980 2000year
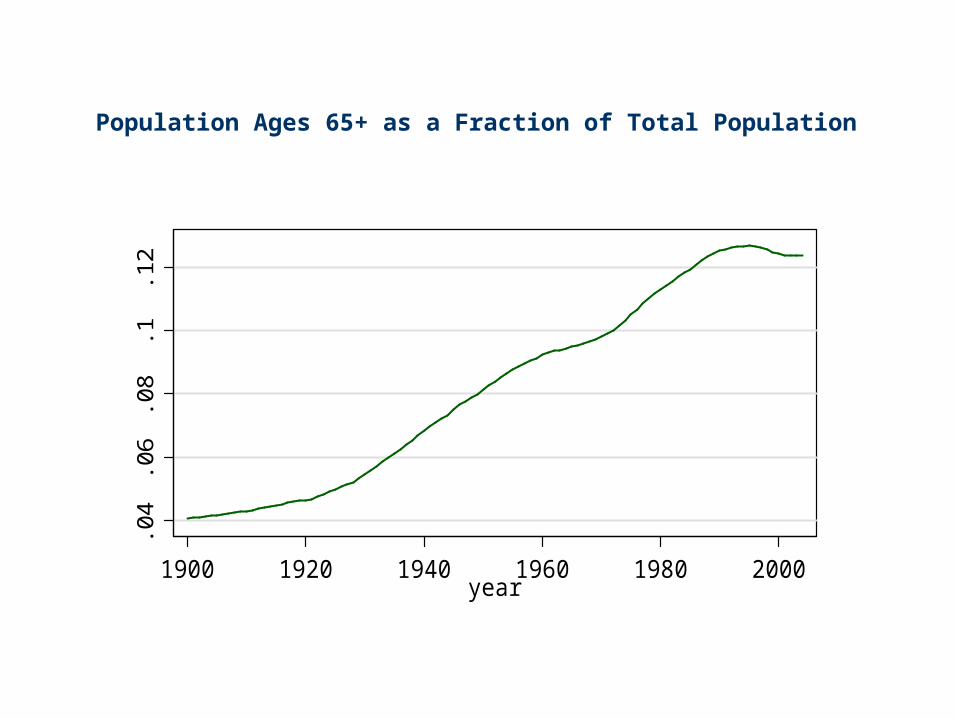
Population Ages 65+ as a Fraction of Total Population.0
4.0
6.0
8.1
.12
1900 1920 1940 1960 1980 2000year
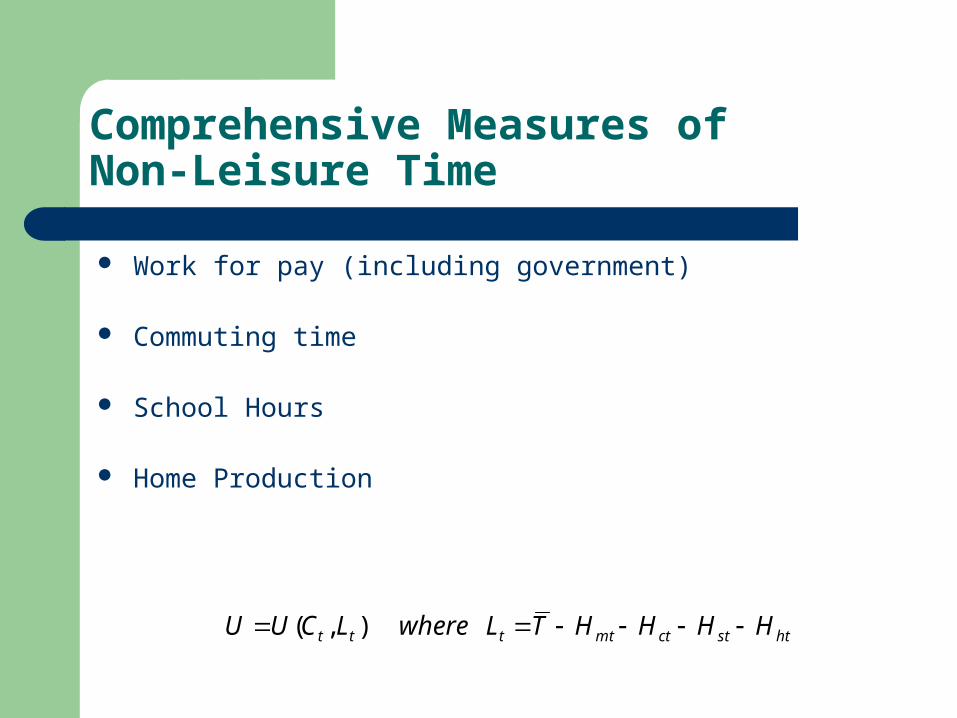
Comprehensive Measures ofNon-Leisure Time
Work for pay (including government) Commuting time
School Hours Home Production
htstctmtttt HHHHTLwhereLCUU ),(
What is Leisure?
Hawrylshyn (1971) distinguishes leisure from household work by defining household work activities as “those economic services produced in the household and outside the market, but which could be produced by a third person hired on the market without changing the utility to members of the household.”
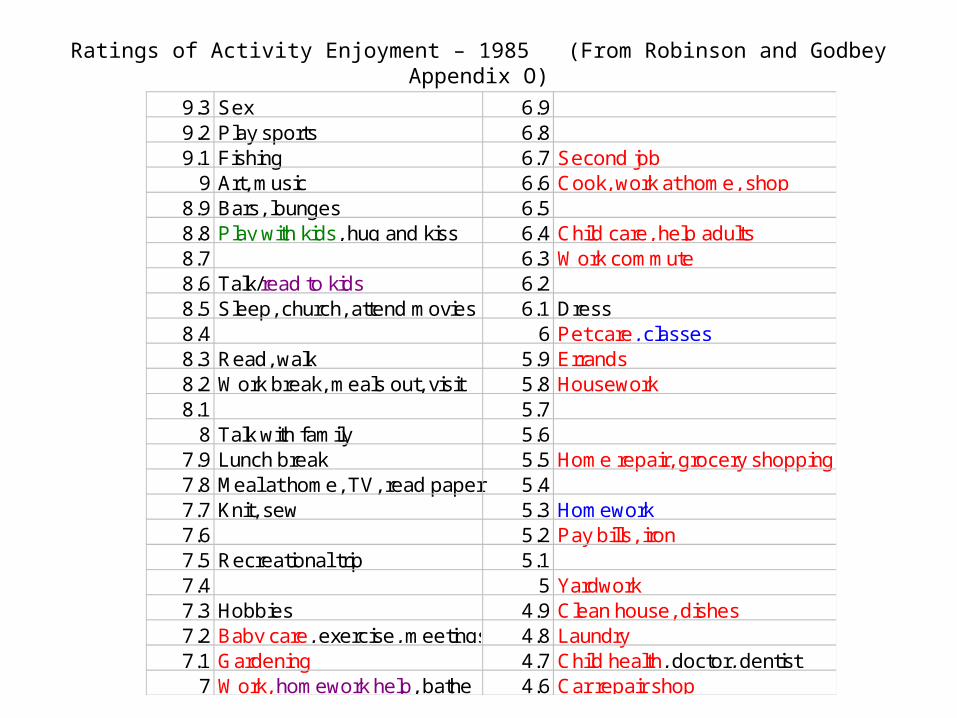
Ratings of Activity Enjoyment – 1985 (From Robinson and Godbey Appendix O)
9.3 Sex 6.99.2 Play sports 6.89.1 Fishing 6.7 Second job
9 Art, music 6.6 Cook, work at home, shop8.9 Bars, lounges 6.58.8 Play with kids, hug and kiss 6.4 Child care, help adults8.7 6.3 Work commute8.6 Talk/read to kids 6.28.5 Sleep, church, attend movies 6.1 Dress8.4 6 Pet care, classes8.3 Read, walk 5.9 Errands8.2 Work break, meals out, visit 5.8 Housework8.1 5.7
8 Talk with family 5.67.9 Lunch break 5.5 Home repair, grocery shopping7.8 Meal at home, TV, read paper 5.47.7 Knit, sew 5.3 Homework7.6 5.2 Pay bills, iron7.5 Recreational trip 5.17.4 5 Yardwork7.3 Hobbies 4.9 Clean house, dishes7.2 Baby care, exercise, meetings 4.8 Laundry7.1 Gardening 4.7 Child health, doctor, dentist
7 Work, homework help, bathe 4.6 Car repair shop
Accounting for Hours Worked for Pay
The standard RBC measure excludes hours worked in government (civilian and military).
Is that important for trends?
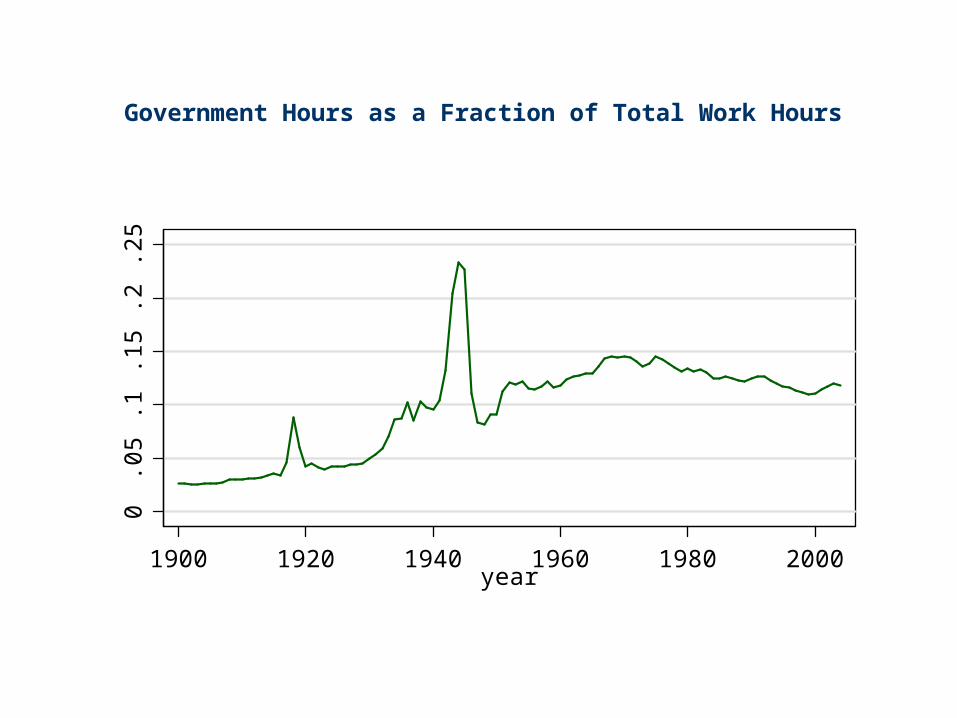
Government Hours as a Fraction of Total Work Hours0
.05
.1.1
5.2
.25
1900 1920 1940 1960 1980 2000year
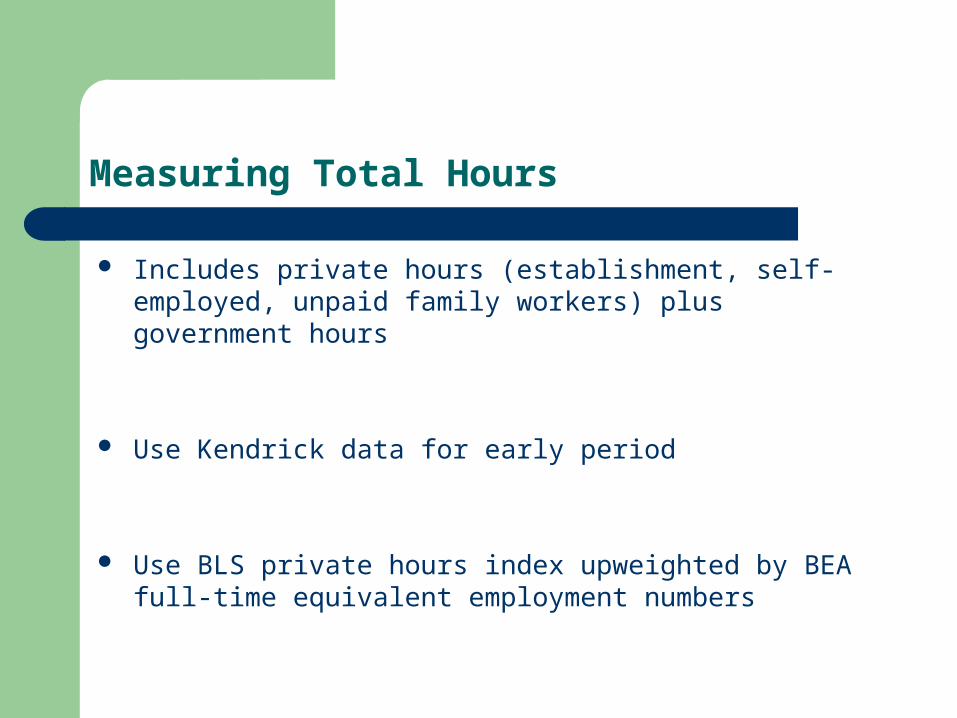
Measuring Total Hours
Includes private hours (establishment, self-employed, unpaid family workers) plus government hours
Use Kendrick data for early period
Use BLS private hours index upweighted by BEA full-time
equivalent employment numbers
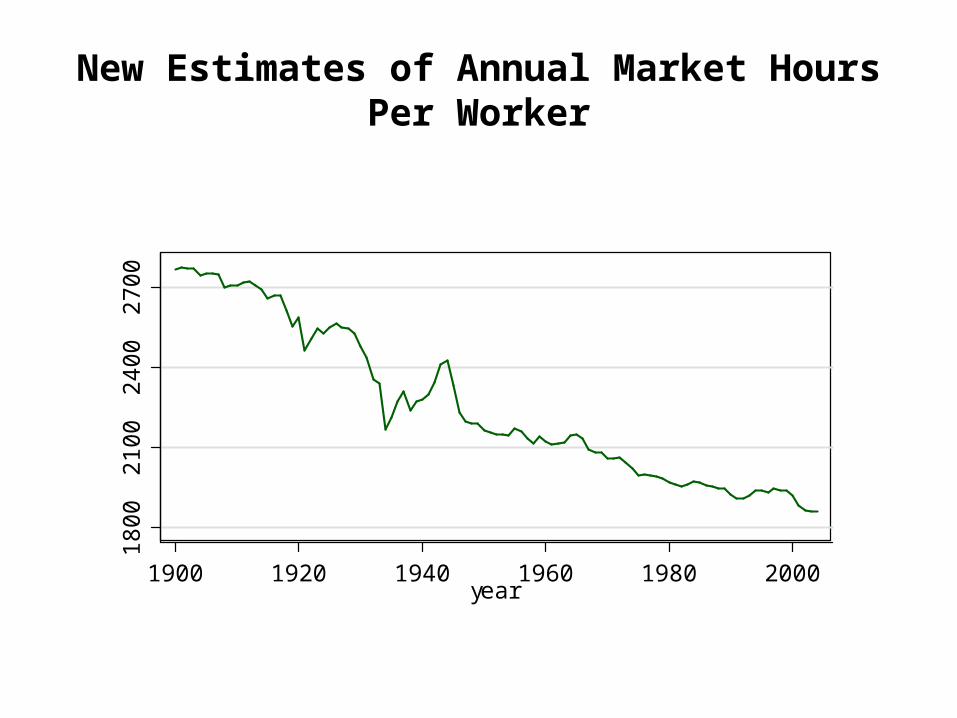
New Estimates of Annual Market Hours Per Worker
18
00
21
00
24
00
27
00
1900 1920 1940 1960 1980 2000year
Commuting Time• Time diary estimates from 1965 – 2003 suggest commute times are
a relatively constant 10 % of hours worked. • Scant evidence early in the century
- Average commute distances for shorterurban workers, farmers
- But modes of urban transportation were slower- Hours per worker, days per week
• Rodrigue (2004) argues time spent commuting for urban workers
was relatively constant over 20th Century • We assume commute time is 10% of hours worked for entire
century

Accounting for Hours Spent in School
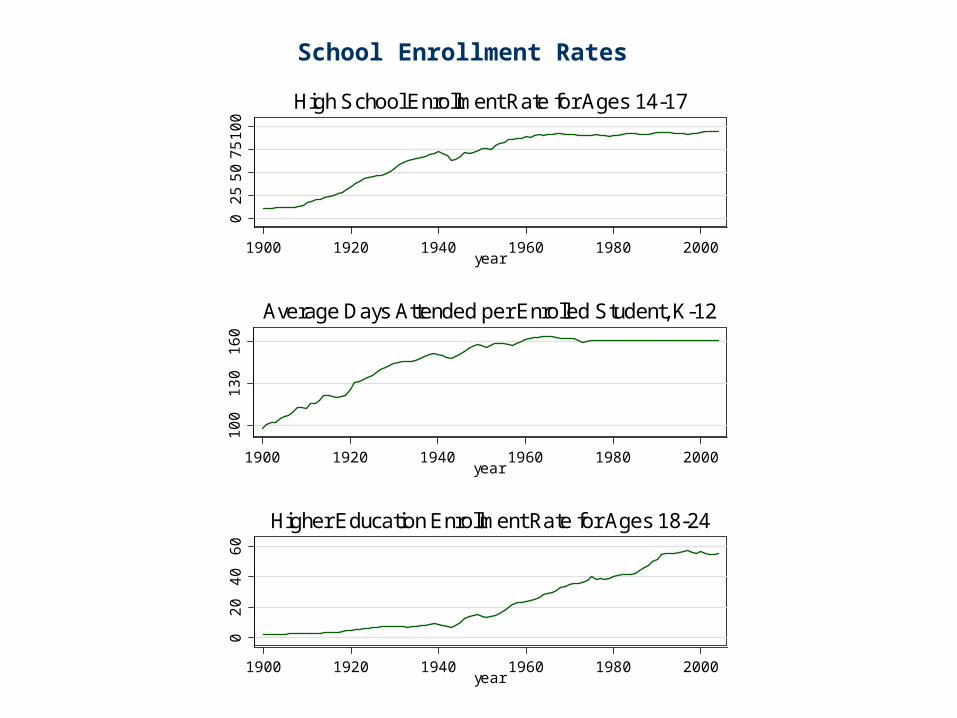
School Enrollment Rates
02
55
07
51
00
1900 1920 1940 1960 1980 2000year
High School Enrollment Rate for Ages 14-17
10
01
30
16
0
1900 1920 1940 1960 1980 2000year
Average Days Attended per Enrolled Student, K-12
02
04
06
0
1900 1920 1940 1960 1980 2000year
Higher Education Enrollment Rate for Ages 18-24
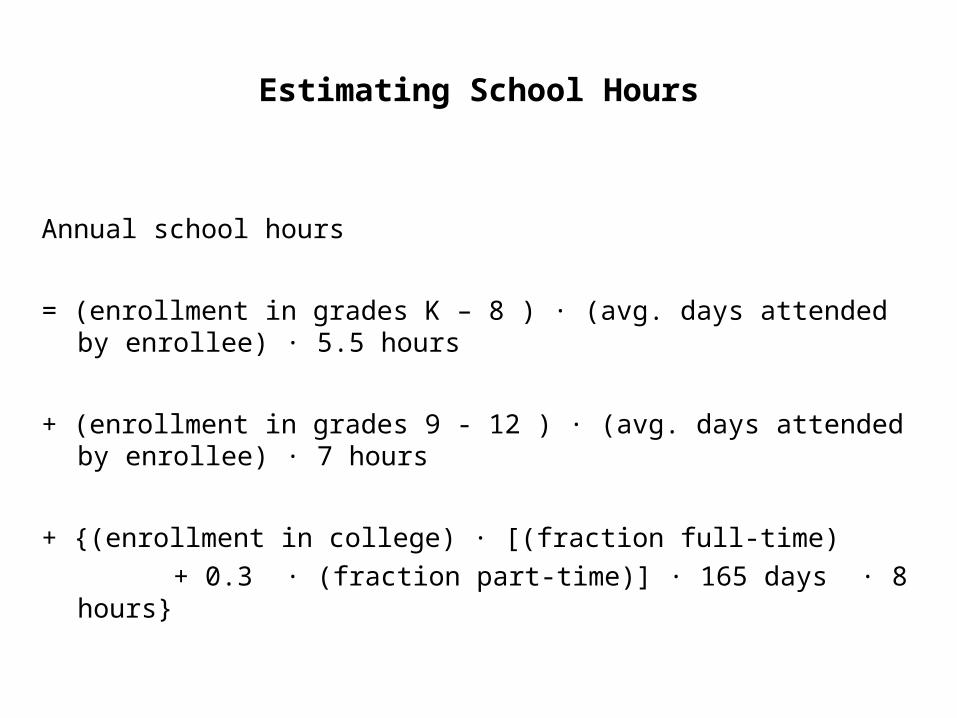
Estimating School Hours
Annual school hours
= (enrollment in grades K – 8 ) ∙ (avg. days attended by enrollee) ∙ 5.5 hours
+ (enrollment in grades 9 - 12 ) ∙ (avg. days attended by enrollee) ∙ 7 hours
+ {(enrollment in college) ∙ [(fraction full-time)
+ 0.3 ∙ (fraction part-time)] ∙ 165 days ∙ 8 hours}
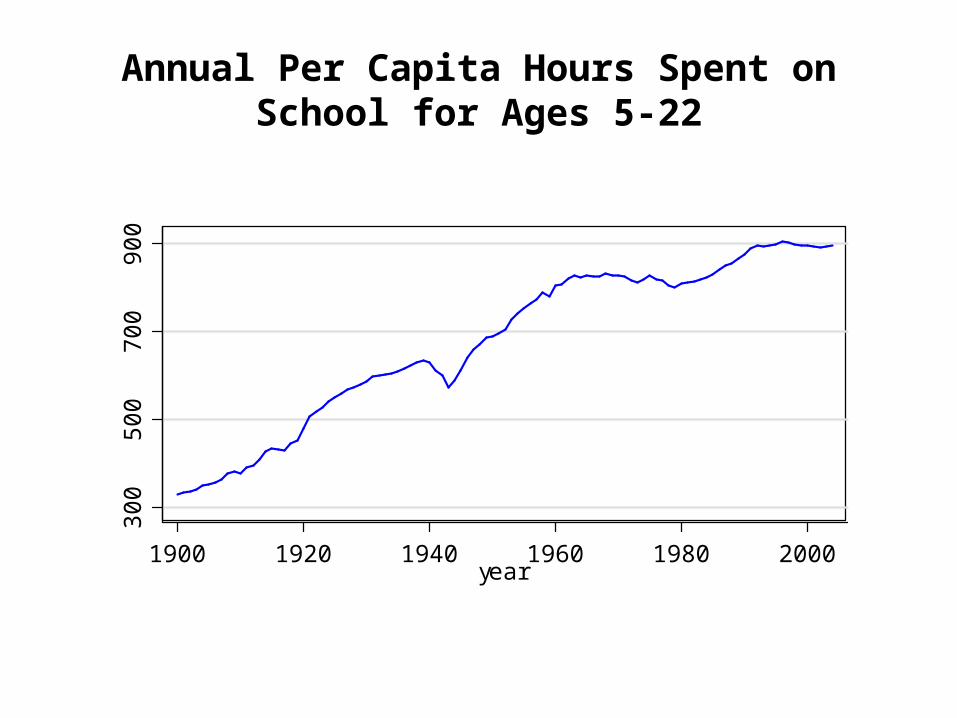
Annual Per Capita Hours Spent on School for Ages 5-22
30
05
00
70
09
00
1900 1920 1940 1960 1980 2000year
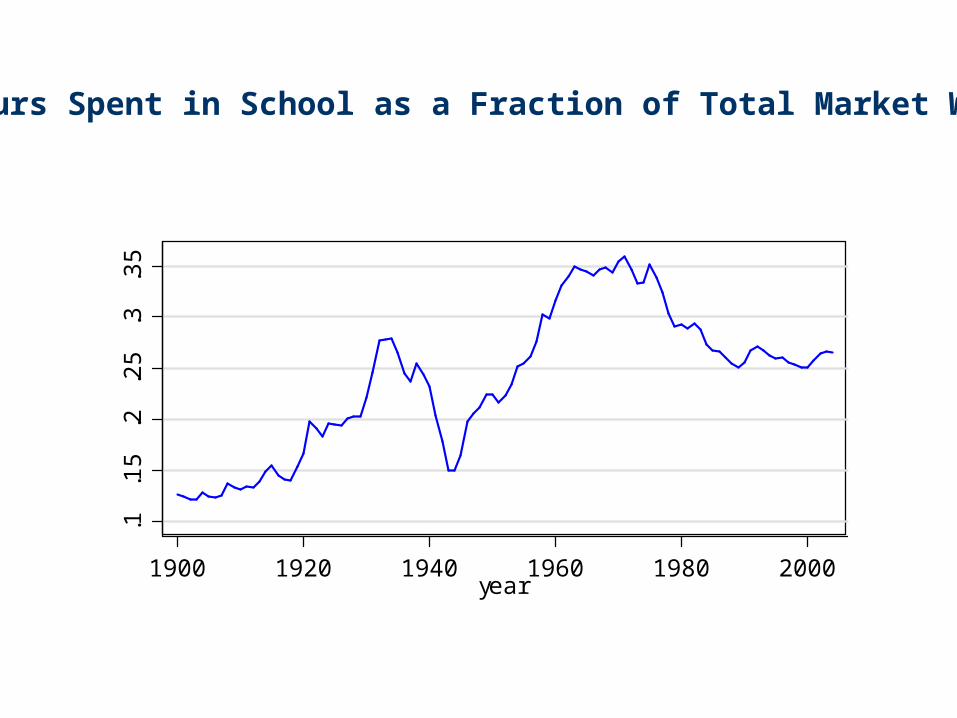
Hours Spent in School as a Fraction of Total Market Work.1
.15
.2.2
5.3
.35
1900 1920 1940 1960 1980 2000year
Accounting for Hours Spent in Home Production
Conventional Wisdom
“The diffusion of household utilities and appliances dramatically reduced the hours spent in household chores.”
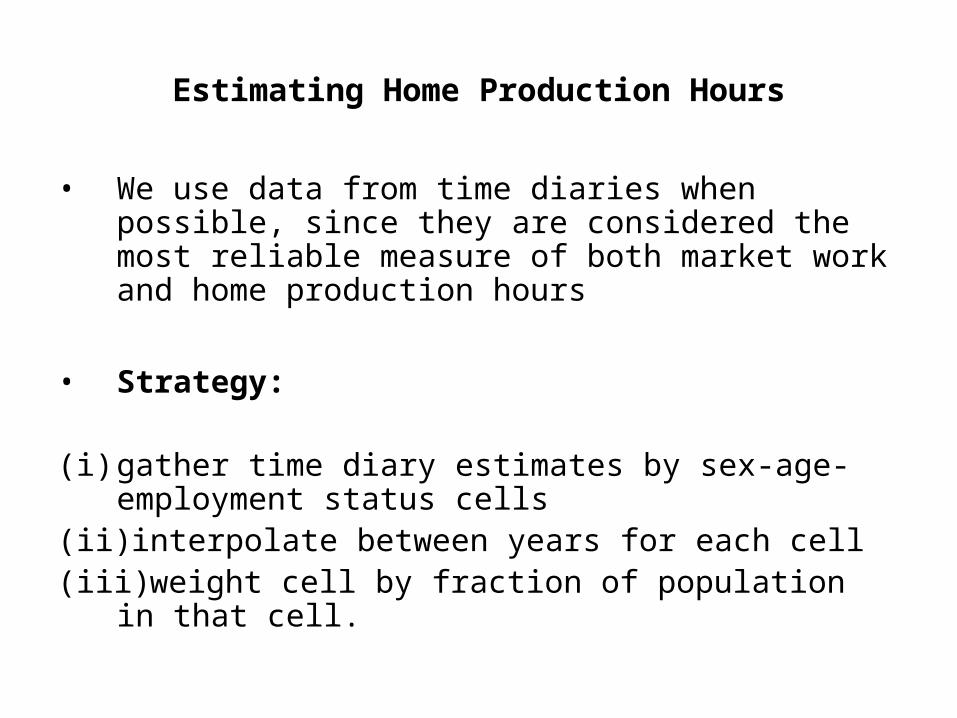
Estimating Home Production Hours
• We use data from time diaries when possible, since they are considered the most reliable measure of both market work and home production hours
• Strategy:
(i) gather time diary estimates by sex-age-employment status cells
(ii) interpolate between years for each cell(iii) weight cell by fraction of population in that cell.
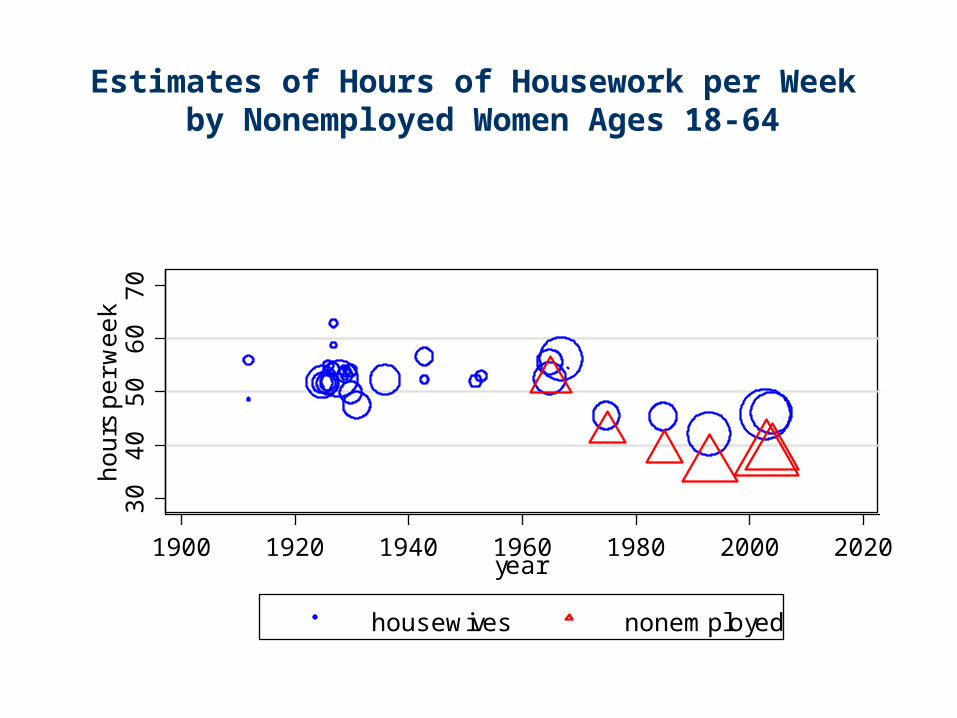
Estimates of Hours of Housework per Week by Nonemployed Women Ages 18-64
30
40
50
60
70
ho
urs
pe
r w
ee
k
1900 1920 1940 1960 1980 2000 2020year
housewives nonemployed
Are the Early Studies Representative?
Samples were not nationally representative Urban samples tended to have above average
income But most samples were rural, which had less access
to electricity, market goods, etc. Evidence suggests that poor urban households did
not do more housework – “being poor meant being dirty”, relied on “bakery bread.”
Bryant (1996) adjusts for non-representativeness. Our estimates are consistent with his.
Why Didn’t the Diffusion of AppliancesReduce Housework?
• Appliances replaced low-wage immigrant labor
• Decline in “maiden aunts”
% of nonemployed women living in other’s house with no children of own: 18% in 1900, 7.6% in 1960.
• Cross-section and time series studies on appliances: more appliances lead to more household production output
• Betty Friedan (1963) The Feminine Mystique
• Mokyr (2000): Revolution in sanitation, germ theory of disease and
nutrition theory increased demand for cleanliness just as appliances were diffusing
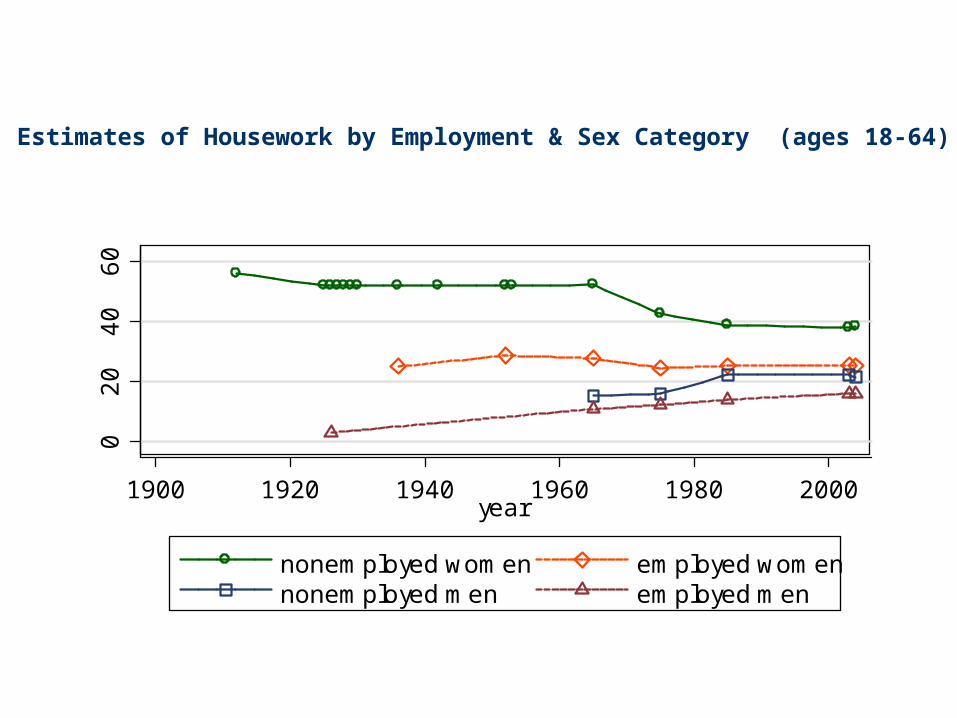
Estimates of Housework by Employment & Sex Category (ages 18-64)0
20
40
60
1900 1920 1940 1960 1980 2000year
nonemployed women employed womennonemployed men employed men
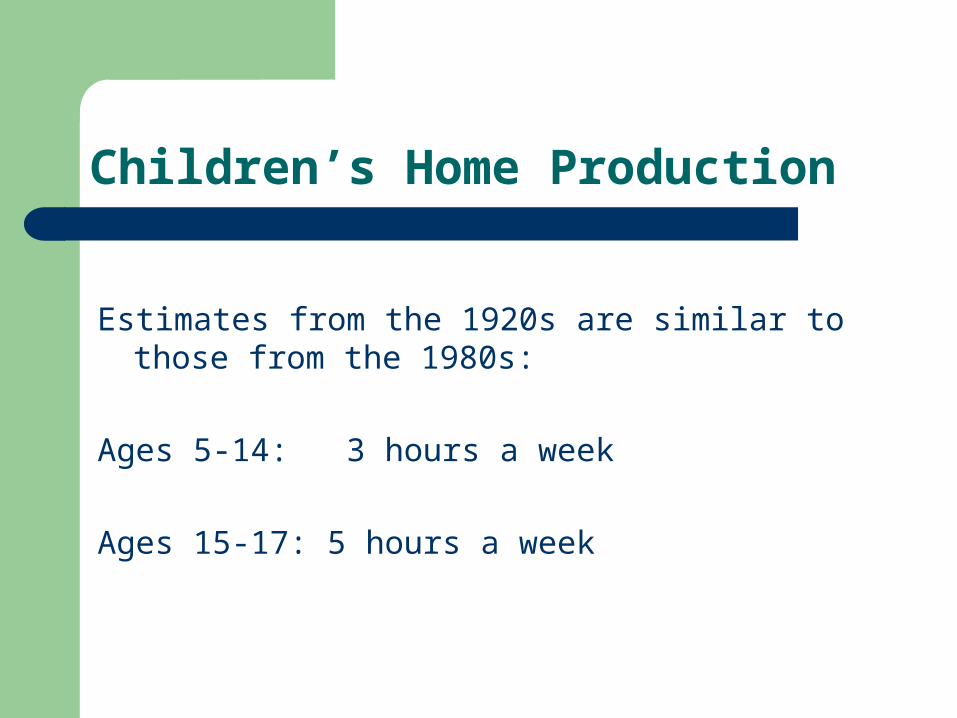
Children’s Home Production
Estimates from the 1920s are similar to those from the 1980s:
Ages 5-14: 3 hours a week
Ages 15-17: 5 hours a week
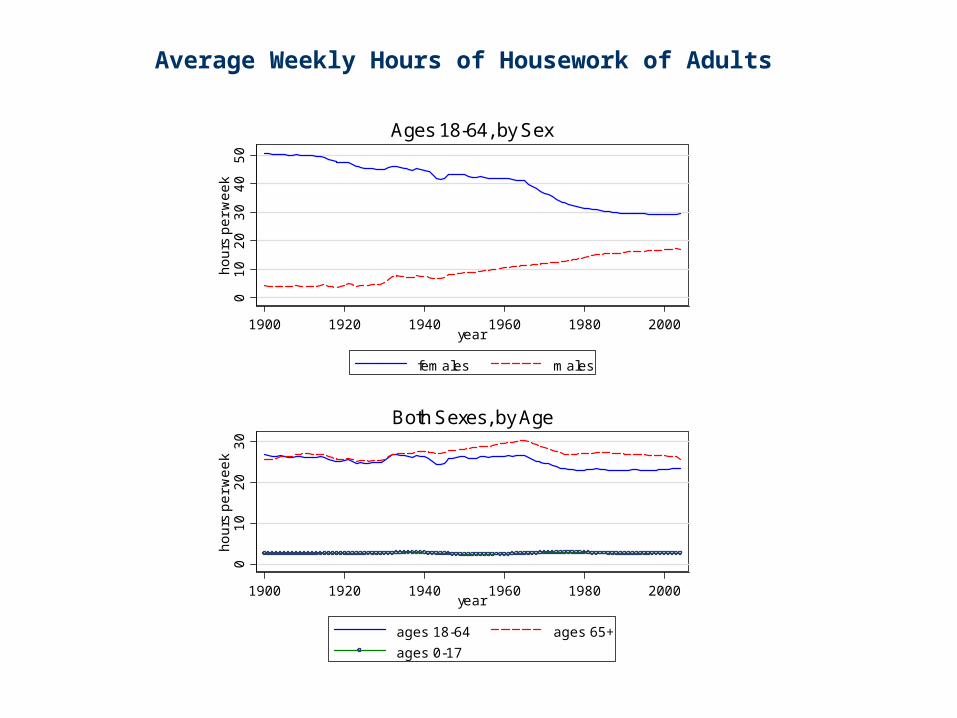
Average Weekly Hours of Housework of Adults
01
02
03
04
05
0h
ou
rs p
er
we
ek
1900 1920 1940 1960 1980 2000year
females males
Ages 18-64, by Sex
01
02
03
0h
ou
rs p
er
we
ek
1900 1920 1940 1960 1980 2000year
ages 18-64 ages 65+
ages 0-17
Both Sexes, by Age
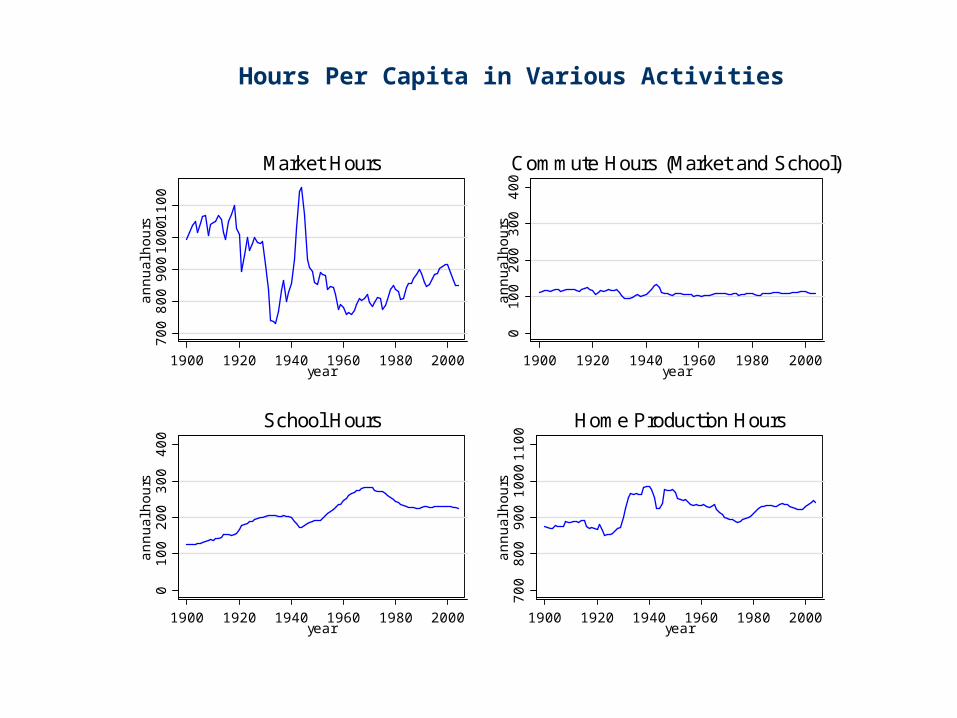
Hours Per Capita in Various Activities
70
08
00
90
01
00
011
00
an
nu
al h
ou
rs
1900 1920 1940 1960 1980 2000year
Market Hours
01
00
20
03
00
40
0a
nn
ua
l ho
urs
1900 1920 1940 1960 1980 2000year
Commute Hours (Market and School)0
10
02
00
30
04
00
an
nu
al h
ou
rs
1900 1920 1940 1960 1980 2000year
School Hours
70
08
00
90
01
00
01
10
0a
nn
ua
l ho
urs
1900 1920 1940 1960 1980 2000year
Home Production Hours
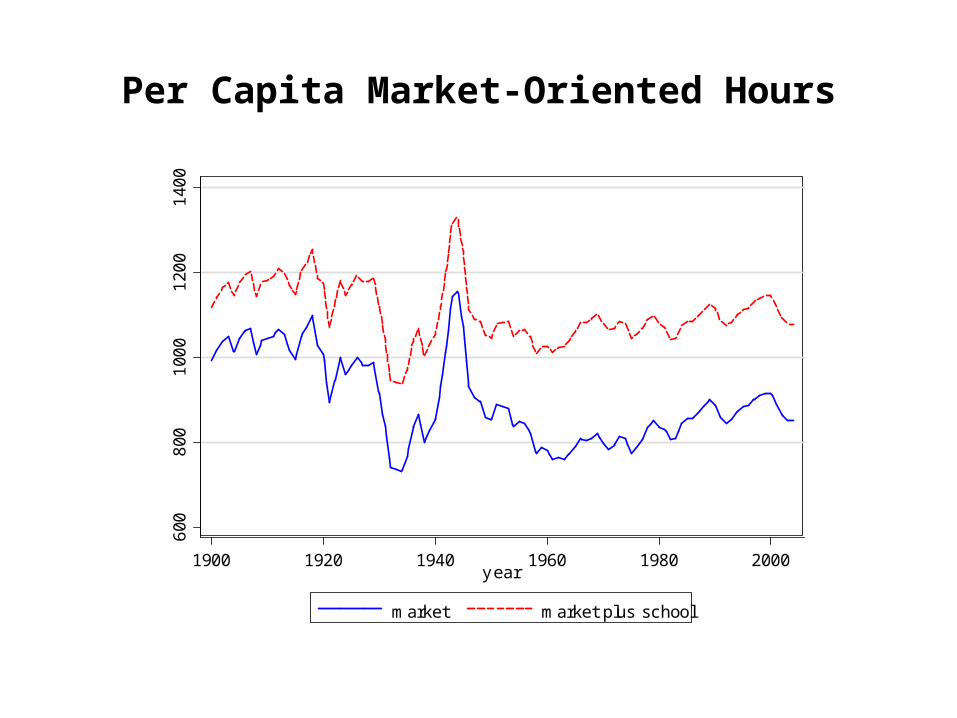
Per Capita Market-Oriented Hours
600
800
100
01
200
140
0
1900 1920 1940 1960 1980 2000y ear
market market plus school
Measuring Leisure
Time endowment is 24 hours per day, 365 days per year
Most personal care time ranks high on enjoyment index (sleeping, eating), so we do not subtract it from leisure
Personal care time is relatively constant at 75 hours per week
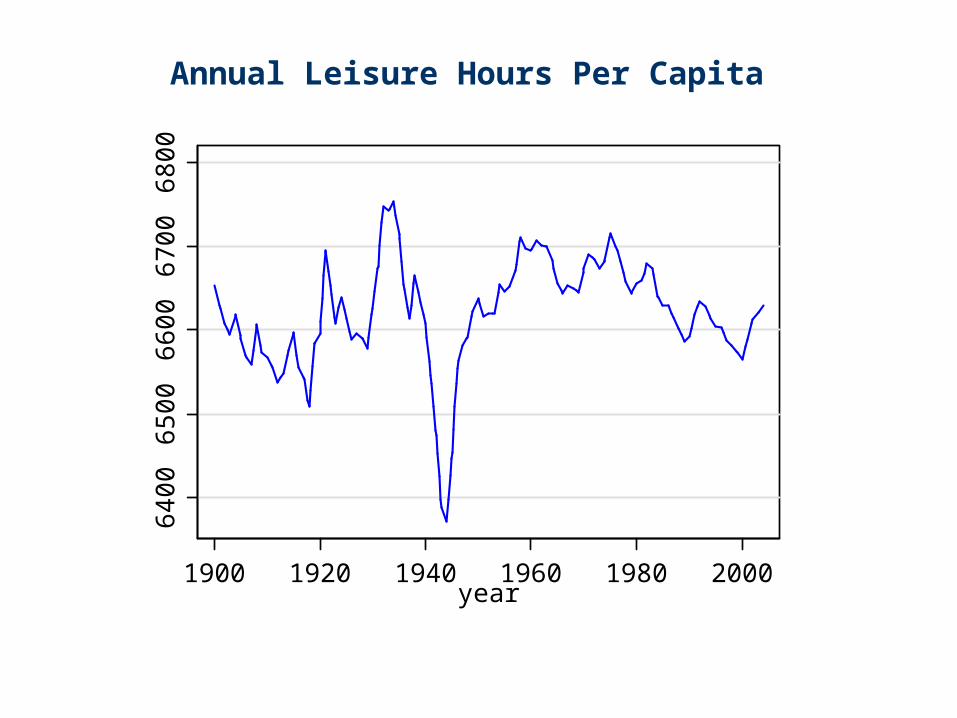
Annual Leisure Hours Per Capita
64
00
65
00
66
00
67
00
68
00
1900 1920 1940 1960 1980 2000year
Conclusions
New measures suggest leisure per capita now is about equal to leisure per capita in 1900
Our results are different from the standard ones because we track the leisure of the entire population and we don’t count schooling as leisure.
Keynes prediction has not come true yet for the US