Embed Size (px)
Citation preview
1
SPANISH HERITAGE LANGUAGE DEVELOPMENT: A CAUSAL-COMPARATIVE
STUDY EXPLORING THE DIFFERENTIAL EFFECTS OF HERITAGE VERSUS
FOREIGN LANGUAGE CURRICULUM
by
Sara Mariel Beaudrie
_____________________Copyright © Sara Mariel Beaudrie 2006
A Dissertation Submitted to the Faculty of the
INTERDISCIPLINARY PROGRAM INSECOND LANGUAGE ACQUISITION AND TEACHING
In Partial Fulfillment of the RequirementsFor the Degree of
DOCTOR OF PHILOSOPHY
In the Graduate College
THE UNIVERSITY OF ARIZONA
2 0 0 6
2
THE UNIVERSITY OF ARIZONAGRADUATE COLLEGE
As members of the Dissertation Committee, we certify that we have read the
dissertation prepared by Sara Mariel Beaudrie entitled “Spanish Heritage Language
Development: A Causal-Comparative Study Exploring the Differential Effects of
Heritage Versus Foreign Language Curriculum” and recommend that it be accepted as
fulfilling the dissertation requirement for the
Degree of Doctor of Philosophy
_______________________________________________________________________ Date: 7-28-06Dr. Robert Ariew
_______________________________________________________________________ Date: 7-28-06Dr. Beatrice Dupuy
_______________________________________________________________________ Date: 7-28-06Dr. Peter Ecke
Final approval and acceptance of this dissertation is contingent upon the candidate’ssubmission of the final copies of the dissertation to the Graduate College.
I hereby certify that I have read this dissertation prepared under my direction andrecommend that it be accepted as fulfilling the dissertation requirement.
________________________________________________ Date: 7-28-06Dissertation Director: Dr. Robert Ariew
3
STATEMENT BY AUTHOR
This dissertation has been submitted in partial fulfillment of requirements for anadvanced degree at The University of Arizona and is deposited in the University Libraryto be made available to borrowers under rules of the Library.
Brief quotations from this dissertation are allowable without special permission,provided that accurate acknowledgment of source is made. Requests for permission forextended quotation from or reproduction of this manuscript in whole or in part may begranted by the copyright holder.
SIGNED: Sara Mariel Beaudrie
4
ACKNOWLEDGEMENTS
This endeavor would not have been possible without the help of my professors,colleagues, friends, and family. My most sincere thanks go to my dissertation committee:My chair, Dr. Robert Ariew, for his constant support, advice, and mentorship and forguiding me to discover where my interests lied at the beginning of this process; my othercommittee members, Dr. Dupuy and Dr. Ecke, for their valuable insights and support. Iwould also like to give them my thanks for being willing to read my dissertation in such ashort period of time.
I also would like to acknowledge the financial support of the MarshallFoundation, whose fellowship award allowed me to focus all of my time on completingthis project. A special thanks as well to the University of Arizona Graduate College whosupported my dissertation research with a grant.
I also want to recognize all the professors who assisted me throughout mygraduate studies, especially Glenn Martínez, who guided me through the initial stages ofthis project and served as a mentor while I learned more about heritage languageinstruction, and Dr. Rudy Troike, who encouraged me to further pursue my graduatestudies.
Throughout this year-long project, there are several people who were invaluablein ensuring the successful and timely completion of the study. I would like express mygratitude to Mark Bryant, who helped in all technical aspects of my dissertation,especially in the creation of the online surveys, and to Justin Lebreck, who created theprogram for data analysis and assisted me with all related technical questions. Finally, myspecial thanks go to Mark Borgstrom for his invaluable statistical guidance.
I am especially indebted to all the students who agreed to participate in this studyand volunteer their own time to complete the tasks. Special thanks are also due to theinstructors in the Spanish department that opened the doors to their classrooms andallowed me to work with their students. My deepest appreciation to my SLAT friend,Cindy Ducar, for her incredible friendship and for our many stimulating discussions thathelped me grow as a researcher and teaching professional. Also, to Alan Brown and GregThompson, my fellow students and friends who were the best student mentors, andNolvia Cortez, whose laughter and friendship made my years in this program moreenjoyable.
Finally, my deepest gratitude goes to my family. My husband, Alan, for standingby me throughout this process. Without his unwavering love, constant support, and faithin me, I would not be at the stage I am today. My sister, Silvia, for her assistance andfriendship. I am so lucky to have a twin sister like her! My beloved daughter, Jesica, forher willingness to sacrifice our time together so I could devote the necessary attention tomy studies. She makes me so proud in everything she does. This accomplishment alsobelongs to all of you!
5
DEDICATION
To my family,
Alan, Jesica, and Silvia,
Your endless love, patience, and support helped me realize my dreams
To all Hispanic students,
especially those struggling to overcome many societal, cultural, and economic obstacles
to obtain a degree, let nothing stop you
6
TABLE OF CONTENTS
LIST OF TABLES............................................................................................................ 11
LIST OF FIGURES .......................................................................................................... 16
ABSTRACT...................................................................................................................... 17
CHAPTER 1 ..................................................................................................................... 19
Introduction to the Study .............................................................................................. 19
Background of the Study .............................................................................................. 20
Rationale for the Study ................................................................................................. 23
Research Questions....................................................................................................... 30
Significance of the Study.............................................................................................. 31
Definition of Terms....................................................................................................... 32
Overview of the Dissertation ........................................................................................ 38
CHAPTER 2: REVIEW OF THE LITERATURE ........................................................... 40
Introduction................................................................................................................... 40
Overview of the Field ................................................................................................... 42
Receptive Bilinguals ..................................................................................................... 47
Maintenance and Shift .................................................................................................. 51
Introduction............................................................................................................... 52
Language maintenance sources: Family, community, and education....................... 52
Benefits of language maintenance and development................................................ 54
Spanish language maintenance in the United States................................................. 56
Language attrition ..................................................................................................... 59
7
TABLE OF CONTENTS - Continued
Language Recovery ...................................................................................................... 73
Heritage Language Learners in the FL Classroom ....................................................... 75
Conclusion .................................................................................................................... 79
CHAPTER 3: METHODOLOGY .................................................................................... 80
Introduction................................................................................................................... 80
Research Setting............................................................................................................ 82
SHL programs in the American Southwest .............................................................. 82
The HL program at the University of Arizona.......................................................... 87
The FL and HL Curriculum of Spanish 102 and 103 ............................................... 91
Foreign language instructors..................................................................................... 97
The heritage language instructor............................................................................... 98
Subjects ..................................................................................................................... 98
Research Design.......................................................................................................... 107
Research Procedures ................................................................................................... 108
Data Collection Instruments ....................................................................................... 109
Online questionnaires.............................................................................................. 109
Tasks ....................................................................................................................... 111
Data Analysis .............................................................................................................. 114
Data coding procedures for oral and written samples............................................. 115
Language fluency.................................................................................................... 115
Language complexity.............................................................................................. 118
8
TABLE OF CONTENTS - Continued
Accuracy ................................................................................................................. 119
Conclusion .................................................................................................................. 120
CHAPTER 4: RESULTS................................................................................................ 121
Descriptive Information on the Sample Population.................................................... 122
Research Question 1: Student Profiles (1-a)............................................................... 123
Students’ language and cultural background .......................................................... 123
Family language background.................................................................................. 126
Childhood contact with Spanish ............................................................................. 128
Listening to Spanish during childhood ................................................................... 129
Contact with Spanish media and print during childhood........................................ 134
Current Spanish language use................................................................................. 135
Current contact with Spanish media and print ........................................................ 138
Language preference............................................................................................... 139
Research Question 1: Student Profiles (1-b)............................................................... 140
Research Question 1: Student Profiles (1-c)............................................................... 145
Summary of Findings for Research Question 1.......................................................... 148
Research Question 2: Differential Gains (2-a)............................................................ 150
Written-Elicitation Tasks ............................................................................................ 150
Independent coding for reliability checks............................................................... 151
Fluency.................................................................................................................... 152
Complexity.............................................................................................................. 158
9
TABLE OF CONTENTS- Continued
Accuracy ................................................................................................................. 166
Summary of significant results for factors and interaction effects in the written-
elicitation tasks........................................................................................................ 171
Oral-Elicitation Tasks ................................................................................................. 172
Independent coding for reliability checks............................................................... 172
Fluency.................................................................................................................... 173
Complexity.............................................................................................................. 181
Accuracy. ................................................................................................................ 189
Summary of significant results for factors and interaction effects in the oral-
elicitation tasks........................................................................................................ 195
Summary of Findings for Research Question 2.a ....................................................... 196
Research Question 2: Differential Gains (2-b) ........................................................... 197
Summary of Findings for Research Question 2.b....................................................... 210
Research Question 3 ................................................................................................... 211
Summary of Findings for Research Question 3.......................................................... 214
Research Question 4: Students’ Perceptions and Satisfaction (4.a) ........................... 215
Research Question 4: Students’ Perceptions and Satisfaction (4.b) ........................... 217
Summary of Findings for Research Question 4.......................................................... 229
CHAPTER 5: DISCUSSION AND CONCLUSIONS................................................... 231
HL Learners’ Profile ................................................................................................... 231
10
TABLE OF CONTENTS - Continued
Differential Gains in Language Development and other Language-Related Variables
after One Semester of Instruction ............................................................................... 235
Linguistic Differences between Heritage and Foreign Language Learners................ 240
Student’ Level of Satisfaction and their Perceptions on FL and HL curriculum........ 242
Conclusions and Pedagogical Implications ................................................................ 244
Limitations of the Study.............................................................................................. 255
Future Research .......................................................................................................... 256
Final Thoughts ............................................................................................................ 257
APPENDICES ................................................................................................................ 260
Appendix A: Distribution of SHL courses in four-year colleges and universities in the
American Southwest ................................................................................................... 260
Appendix B: Survey used by the College of Humanities to identify HL learners...... 266
Appendix C: First online questionnaire-written version............................................. 267
Appendix D: Second online questionnaire-written version ........................................ 274
Appendix E: Oral-elicitation task ............................................................................... 279
Appendix F: Written-elicitation task .......................................................................... 281
Appendix G: Written sample from a HL student in the HL course ............................ 283
Appendix H: Oral sample from a HL student in the FL course.................................. 285
REFERENCES ............................................................................................................... 287
11
LIST OF TABLES
Table 3.1 SHL courses offered in Arizona ....................................................................... 83
Table 3.2 SHL courses offered in California .................................................................... 83
Table 3.3 SHL courses offered in Colorado ..................................................................... 84
Table 3.4 SHL courses offered in Nevada ........................................................................ 84
Table 3.5 SHL courses offered in New Mexico ............................................................... 84
Table 3.6 SHL courses offered in Oklahoma.................................................................... 85
Table 3.7 SHL courses offered in Texas........................................................................... 85
Table 3.8 SHL courses offered in the American Southwest............................................. 86
Table 3.9 Course descriptions for SHL courses at the University of Arizona.................. 88
Table 3.10 Courses in the FL and HL track at the University of Arizona........................ 89
Table 3.11 Course objectives for Spanish 103 and Spanish 102 ...................................... 92
Table 3.12 Course objectives for Spanish 103 and Spanish 102 at the University ofArizona.............................................................................................................................. 92
Table 3.13 Course topics for Spanish 103 and Spanish 102 at the University ofArizona.............................................................................................................................. 94
Table 3.14 Grammar topics for Spanish 103 and Spanish 102 at the University ofArizona.............................................................................................................................. 95
Table 3.15 Point distribution for written tests in Spanish 103 and Spanish 102 at theUniversity of Arizona ....................................................................................................... 96
Table 3.16 Listening scores for students in Spanish 103 at the University of Arizona.. 100
Table 3.17 Descriptive statistics for the listening scores for students in Spanish 103at the University of Arizona............................................................................................ 101
Table 3.18 Survey results for students in Spanish 103 at the University of Arizona ..... 102
12
LIST OF TABLES - Continued
Table 3.19 Descriptive statistics for survey results for students in Spanish 103 at theUniversity of Arizona ..................................................................................................... 103
Table 3.20 Listening and survey results for HL students in Spanish 102 at the Universityof Arizona ....................................................................................................................... 104
Table 3.21 Listening and survey results for HL students in Spanish 102 at the Universityof Arizona ....................................................................................................................... 105
Table 3.22 Listening and survey results for students in Spanish 103 at the University ofArizona............................................................................................................................ 106
Table 3.23 Summary of data collection procedures........................................................ 109
Table 3.24 List of categories for the first online questionnaire ...................................... 110
Table 3.25 List of categories and items for the second online questionnaire ................. 110
Table 3.26 List of tasks used in the study....................................................................... 114
Table 4.1 Languages spoken by parents ......................................................................... 126
Table 4.2 Language used to address students by family members ................................. 127
Table 4.3 Speaking habits in Spanish during childhood................................................. 129
Table 4.4 Frequency means for listening during childhood ........................................... 130
Table 4.5 Frequency means for contact in Spanish with community and friends duringchildhood......................................................................................................................... 131
Table 4.6 Contact with Spanish media and print during childhood................................ 135
Table 4.7 Frequencies for current speaking habits with family members ...................... 136
Table 4.8 Speaking habits with friends and the community........................................... 137
Table 4.9 Current contact with Spanish media and print................................................ 138
Table 4.10 Language preference with bilingual and monolingual Spanish speakers ..... 139
13
LIST OF TABLES - Continued
Table 4.11 Purposes for taking a Spanish class .............................................................. 140
Table 4.12 Student attitudes with respect to the Spanish language-Part 1 ..................... 141
Table 4.13 Student attitudes with respect to the Spanish language-Part 2 ..................... 144
Table 4.14 Means and standard deviations for group comparisons among profile variables......................................................................................................................................... 145
Table 4.15 Analysis of Variance results for profile variables ........................................ 146
Table 4.16 Pair-wise comparisons for three groups for profile variables....................... 147
Table 4.17 Interrater reliability checks for written samples ........................................... 151
Table 4.18 Analysis of Variance for fluency indicators in written output...................... 152
Table 4.19 Descriptive statistics for fluency indicators in written output ...................... 156
Table 4.20 Analysis of Variance results for complexity indicators in written output .... 158
Table 4.21 Descriptive statistics for complexity indicators in written output ................ 160
Table 4.22 Descriptive statistics for tense distribution in written output ....................... 162
Table 4.23 Analysis of Variance results for accuracy indicators in written output........ 166
Table 4.24 Descriptive statistics for accuracy indicators in written output .................... 169
Table 4.25 Significant results for written output ............................................................ 171
Table 4.26 Interrater reliability checks for oral samples ................................................ 173
Table 4.27 Analysis of Variance for fluency indicators in oral output........................... 174
Table 4.28 Summary of significance in pair-wise comparisons for group differences offluency in oral output ...................................................................................................... 177
Table 4.29 Descriptive statistics for fluency indicators in oral output ........................... 178
14
LIST OF TABLES - Continued
Table 4.30 Analysis of Variance results for complexity indicators in oral output ......... 182
Table 4.31 Descriptive statistics for complexity indicators in oral output ..................... 184
Table 4.32 Descriptive statistics for tense distribution in oral output ............................ 185
Table 4.33 ANOVA results for accuracy indicators in oral output ................................ 190
Table 4.34 Descriptive statistics for percentages in accuracy indicators in oral output . 192
Table 4.35 Significant results for oral-elicitation tasks .................................................. 195
Table 4.36 Comparisons for descriptive data on language attitudes at the beginning andend of the semester.......................................................................................................... 198
Table 4.37 Descriptive statistics for Spanish use and listening at the beginning and end ofthe semester..................................................................................................................... 199
Table 4.38 Descriptive statistics for change in language use ......................................... 201
Table 4.39 Descriptive statistics for student perceptions on change in language use .... 202
Table 4.40 Descriptive statistics for students’ self-confidence ...................................... 203
Table 4.41 Descriptive data for self-evaluation of speaking, listening, reading, andwriting abilities ............................................................................................................... 204
Table 4.42 Analysis of Variance for language related variables .................................... 207
Table 4.43 Pair-wise comparisons of group differences on language-related variables. 209
Table 4.44 Results for students’ degree of accentedness................................................ 213
Table 4.45 Students’ satisfaction with the course curriculum ........................................ 215
Table 4.46 Students’ feelings towards culture in the FL course..................................... 218
Table 4.47 Students’ feelings towards the treatment of culture in the HL course.......... 220
Table 4.48 Students’ feelings towards the Spanish variety in the FL course ................. 220
15
LIST OF TABLES - Continued
Table 4.49 Students’ feelings towards the Spanish variety in the HL course................. 222
Table 4.50 Students’ feelings towards grammar in the FL course ................................. 223
Table 4.51 Students’ feelings towards the need for speaking opportunities in the FLcourse .............................................................................................................................. 224
Table 4.52 Students’ feelings towards speaking opportunities in the HL course........... 225
Table 4.53 Students’ feelings in the HL course with respect to other students .............. 225
Table 4.54 Students’ feelings in the FL course with respect to other students............... 227
16
LIST OF FIGURES
Figure 4.1 Percentages of students’ choices for cultural identity descriptors................. 125
Figure 4.2 Family contact with Spanish ......................................................................... 128
Figure 4.3 Summary of the students’ contact with Spanish during childhood ............... 132
Figure 4.4 Summary of students’ current contact with Spanish ..................................... 138
Figure 4.5 Self-evaluation of Spanish language abilities................................................ 206
Figure 4.6 Summary of students’ satisfaction with their Spanish language course........ 217
17
ABSTRACT
Dual tracks – for Foreign (FL) and Heritage languages (HL) – in Spanish
language programs are becoming increasingly common in U.S. higher education
institutions, although most only offer HL courses for intermediate and/or advanced
learners. Few universities have incorporated specialized courses for receptive bilinguals
into their programs. Contradictory arguments can be found in the HL education literature
regarding the type of curriculum (FL or HL) that would best serve the pedagogical needs
of these students (Carreira, 2004; Lipski, 1996; Potowski, 2005).
This study attempts to offer insights into this discussion by examining the effects
of these two types of curricula on the written and oral language development of three
groups of learners: two groups of HL learners enrolled in HL and FL courses, and a
group of FL learners taking the same FL courses. The purpose of this study is four-fold:
1) delineate a profile of receptive bilinguals; 2) measure changes in oral and written
production and other language-related variables after one semester of instruction; 3)
examine the students’ level of satisfaction with the language curriculum; and 4) uncover
linguistic differences between FL and HL learners. The data collection consisted of series
of written and oral-elicitation tasks and online questionnaires at the beginning and end of
the semester.
The results showed that all groups made significant gains in writing fluency and
complexity but only the HL group in the HL course significantly improved their writing
accuracy. Both HL groups made greater gains in oral fluency and complexity than the FL
group but the HL group in the HL course outperformed both groups in syntactic
18
complexity gains. The HL group in the HL course showed the highest level of
satisfaction and the greatest improvement in self-confidence and language attitudes but
no differences in language use outside the classroom and self-evaluation of language
abilities. The results offer implications for the inclusion of receptive bilinguals in HL
programs, their language placement, and pedagogical and curricular practices most
suitable for these students in the HL classroom.
19
“It is just as scandalous and injurious to waste “native” language resources as towaste our air, water, mineral, animal, and various non-linguistic human resources. How
long must languages and cultures be trivialized if they are learned at home, in infancy andchildhood, and only respected if they are acquired later, during adulthood, when they are
usually learned less well and at much greater cost in competence, time, and money?”(Fishman, 2004, p. 417)
CHAPTER 1
Introduction to the Study
Spanish language programs across the United States are increasingly offering
specialized language courses for heritage language (HL) learners. These new courses
have been created partly in response to the widely-accepted belief that this population has
unique language needs and abilities that can not be appropriately addressed in regular
foreign language (FL) courses. However, a subset of this group, receptive bilinguals,
lacks this consensus. It is still a controversy whether they have unique language needs
that require separate courses from FL learners. Their low-level language competencies
have rendered them practically invisible to researchers and language professionals in
heritage language education (HLE), generally resulting in their placement in beginners’
FL courses.
These learners’ language competencies are the result of extensive periods of
minimal productive language use coupled with continued receptive use. As a
consequence, they possess considerable receptive or passive knowledge of the language
but limited productive competencies. Their production, however, may sometimes be
difficult to assess due to the psychological constraints that frequently inhibit these
learners’ use of the language. The role that passive knowledge plays on their language
recovery and development process in the language classroom has yet to be determined.
20
Some other unanswered questions specifically relevant to receptive bilinguals are: what is
the role of the language classroom in their language development and maintenance, what
is the kind of curriculum that best serves their linguistic, cultural, and emotional needs,
and what is the role of passive knowledge in their language development process in a
classroom context.
The present study attempts to fill this gap in the research by examining the
Spanish language development and speed of learning progress of receptive bilinguals.
More specifically, it examines the role the type of curriculum plays in their language
development process by assessing the effects of two different types of curricula on the
students’ language accuracy, complexity and fluency, as well as on their Spanish
language attitudes, language use, self-confidence, and self-assessment after one semester
of instruction. This line of research is essential in the search for sound pedagogical
choices to meet the language, cultural, and affective needs of this growing population of
HL students in the language classroom.
Background of the Study
Maintaining a minority language poses major challenges in typical language
contact situations, where there exists an unequal power relationship between two or more
languages. As Thomason (2001) explains, “intense pressure from a dominant group most
often leads to bilingualism among subordinate groups who speak other languages, and
this asymmetrical bilingualism very often results, sooner or later, in language shift…” (p.
9). Indeed, research indicates that language shift occurs very rapidly after three or four
generations, generally following the same pattern: the first generation of immigrants is
21
monolingual in the minority language, the second generation is bilingual, and the
subsequent generations are monolingual in the dominant language (Fishman, 1964).
Traditionally in the United States, education and language policies have failed to
offset this rapid pattern of language shift; in fact, these policies have frequently
reinforced the English-speaking hegemony prevalent in the U.S. Such ideology
establishes English as the rightful language of the country and, consequently, the one that
immigrants should acquire, even at the expense of losing their native languages (García,
2003). Perpetuating this ideology, the majority of bilingual programs in the U.S. have
repeatedly adopted a subtractive model of bilingualism1 in which non-English speakers
receive education in the minority language on a transitional basis until they are ready to
participate in mainstream classes instructed exclusively in English (August & Hakuta,
1997). This ideology comes from a language-as-problem orientation which endorses the
belief that language minority speakers have a “handicap to be overcome” (Ruiz, 1988, p.
7) with the right kind of schooling; i.e: one that focuses on mastering English
competencies. Alternatives to this ideology are the language-as-right and language-as-
resource orientations to language planning (see Ruiz, 1988). The former supports the idea
that any individual has a right to their own language (Committee on the CCCC Language
Statement (1978, as cited in Ruiz, 1988). The latter upholds the view that languages are
valuable national resources that need to be preserved and developed and also recognizes
that both minority and majority languages are equal in the social, educational, and
economic contexts (Ruiz, 1988).
1 See Lambert (1975) for descriptions of subtractive and additive models of bilingualism
22
Following a language-as-resource orientation, researchers and language
professionals are increasingly concerned with language maintenance and development
issues. This revival of interest is due, at least in part, to the recognition that there are so
many rich languages and cultures under the threat of being displaced by the supremacy of
“linguas francas” that only world-wide concerted efforts by societies which fully embrace
the benefits of heritage language maintenance can ensure their preservation (García,
2003).
Minority language, or heritage language (HL), preservation brings about
invaluable benefits both at the individual and societal level. For the individual, HL
maintenance presents cognitive advantages (Hakuta, 1986), better communication with
families and the HL community (Wong-Filmore, 1991), and, in many cases, the
resolution of ethnic identity conflicts (Tse, 1998b). At the societal level, bilingualism, far
from bringing about political and economic problems2 (Fishman, 1991), provides
practical benefits in areas of national interest such as business, trade, national security,
diplomacy, and the like.
Whether language maintenance of minority languages is fostered as a national
resource (Ruiz, 1988) or as a legitimate right of heritage communities who have “the
natural and legal right to fight discrimination on the basis of language” (Ortega, 1999), it
is clear that there are increasing national efforts to preserve heritage languages. As the
report of the first Research Priorities Conference states, “conserving this resource is a
2 Fishman examined the impact of 230 potential predictors of civil strife and economic well-being in 170countries. The results of this analysis suggest that multilingualism is not one of the cause for political oreconomic problems (Fishman, 1990, cited in Krashen, 1998a, p. 6).
23
matter of urgency not only for the nation, but also for individuals, families, and
communities. The urgency involves matters of cultural understanding, identity, equitable
access to social services, and social justice as well as cognitive issues related to the
achievement of higher level competencies (University of California, 2001, p. 5).
This study represents an attempt to join existing nation-wide efforts towards
language shift reversal, development, and maintenance. The failure of current bilingual
programs to achieve heritage language maintenance has resulted, at least in part, in the
need to offer HL courses in secondary and post-secondary contexts to meet the unique
needs of an ever-increasing population of students. This study focuses specifically on
receptive bilinguals of a HL, typically third- and fourth-generation students who may
possess distinctive strengths and needs that are at present poorly understood. Therefore,
this study seeks to explore their language production and development as well as gain
insights in to ways of redressing the destructive consequences of the linguistic and
cultural assimilation these individuals have undergone.
Rationale for the Study
The Hispanic student population in American secondary and post-secondary
institutions has expanded at a staggering rate in recent years; from 1990 to 2000, the size
of this population grew by 40% (Potowski & Carreira, 2004). The desire to accommodate
the specific language-learning needs of this population has led to the incorporation of
Spanish for heritage language (SHL) learners, Spanish for bilinguals or Spanish for
Native Speakers (SNS) courses into Spanish programs’ course offerings. Even though the
number of SHL programs is on the rise across the U.S., the increase has not paralleled the
24
population growth (Potowski & Carreira, 2004). A recent study conducted by Ingold et
al. (2002) in post-secondary institutions found that only 17.8% of the responding
language programs offered courses for HL learners. Even in institutions where there is a
need to accommodate HL learners, respondents cited obstacles such as insufficient
enrollments and lack of funding and trained faculty as some of the challenges that are
presently limiting the development or expansion of their HL tracks. Based on these
findings, it is reasonable to assume that there still may be a significant portion of the HL
student population whose unique language needs are not being addressed, having
oftentimes no other option than to be mixed in with FL learners in beginning,
intermediate, or advanced FL courses.
This practice stands in sharp contrast to what has been suggested in the HL
literature. HLE specialists have long advocated for the creation of a separate place for HL
learners within Spanish programs, claiming that the linguistic, academic, and affective
needs of HL learners cannot be properly addressed in FL courses (Faltis, 1990). They
insist that Spanish programs should offer two separate tracks: a HL track, which
frequently follows a student-centered curriculum aimed at maximizing learners’ strengths
while targeting their specific needs, and a FL track, which follows a curriculum that
assumes no prior language or cultural background (FL track). According to LeBlanc and
Lally (1997), one of the problems of not offering separate classes for HL learners is
spending time and limited funds inefficiently to teach HL learners skills they may have
already acquired. Yet a more critical problem is that FL classes may not address HL
25
students’ language, affective, and culture learning needs, assuming these classes offer no
accommodations for HL learners.
Even programs that do offer specialized classes for HL learners do not do so for
all HL learners. These learners have a wide range of language proficiencies. The most
widely used definition of the HL learner (Valdés’s, 1995) includes individuals with a
wide range of language abilities falling in a continuum ranging from receptive skills in a
regional variety of Spanish to productive skills in a prestige variety. Despite the inclusion
of receptive bilinguals at a conceptual level, the need for separate HL classes for those
who fall towards the lower end does not enjoy the same level of acceptance. Indeed, an
analysis of SHL programs reveals that their presence is alarmingly limited. In an
investigation undertaken by the author into Spanish programs offered by 166 universities
in the American Southwest, it was found that out of 67 Spanish programs offering HL
courses, only 7 institutions, or 10%, currently provide Spanish courses for receptive
bilingual students. The rest of the universities offered from 1 to 5 courses for HL learners
with intermediate or advanced listening and oral proficiency in the language. Thus, these
preliminary results show a tendency to exclude receptive bilinguals from university SHL
programs (see chapter 3, section ‘SHL programs in the American Southwest’, for a more
detailed description of the results of this investigation).
In the HLE field, there is also some controversy as to their inclusion in HL
programs. From a language proficiency perspective, Potowski (2005) has suggested that
their low-level productive abilities in the language may indicate that they should be
placed in the FL classroom. As she explains, “Los alumnos que han adquirido un sistema
26
extremadamente reducido del español (por ejemplo los que Lipski, 1993, llama los
“bilingües transicionales”) quizás se beneficiarían más de un curso de español como
L23.” “The students who have acquired an extremely reduced Spanish system, for
example the ones that Lipski, 1993, calls ‘transitional bilinguals’, perhaps would benefit
more from a Spanish as a second language course” (Potowski, 2005, p. 5, my translation).
In addition, Lipski (1993), with perhaps a narrow view of the curricular content of the HL
course, questions the inclusion of transitional bilinguals in SNS classes, arguing that
these classes focus on the teaching of standard spelling, eradication of Anglicisms, and
elimination of archaic forms, which may not be relevant or beneficial for these learners
who still need to develop their language skills. Lipski admits, however, that transitional
bilinguals4 have linguistic abilities that are different from those of native speakers and
resemble more closely those of FL learners. At the same time, he acknowledges that these
students are superior to all FL learners with the exception of those FL learners with more
advanced proficiency. The FL classroom, Lipski suggests, may not be the ideal learning
environment for these students who usually resent the dominant focus on grammatical
structures and may have difficulty dealing with such concepts, which results in boredom
and utter failure.
From an affective perspective, Carreira (2004) argues that even though
receptive bilinguals may have linguistic needs that resemble those of FL learners, they
also possess affective, identity and intellectual needs that are rarely addressed in the FL
3 L2 stands for second language.4 Individuals who can understand all varieties of the language and can carry out conversations althoughwith many errors. In some respects, this population is similar to the population under investigation in thisstudy although transitional bilinguals, as described by Lipski (1993), may be at a higher point of thebilingual continuum with respect to both receptive and productive abilities in Spanish.
27
classroom. She suggests that placing these students in the FL track does nothing else than
negate their HL identity. FL courses can only “exacerbate feelings of insecurity and
outsider status in these students” (Carreira, 2004, p. 15).
The disagreement over the inclusion or exclusion of receptive bilinguals in SHL
programs highlights a key issue that still remains to be explored, namely, the minimum
level of language competence for students to benefit from a HL course (Alonso, 1997;
Carreira 2004). As Carreira points out, “the dividing line should be drawn between
students who benefit from being in SNS courses and those who would do better in SLA5
courses” (Carreira, 2004, p.15). Learners with a heritage motivation but no linguistic
abilities in the language (see Van Deusen, 2001) have already been excluded from HL
programs, mainly for pedagogical considerations.
Receptive bilinguals, however, present additional complications for the existing
exclusionary policies within HL programs. Determining the most appropriate line of
separation will allow program administrators, practitioners and researchers alike to make
more sound pedagogical and curricular choices when determining who to accept or leave
out from HL classes. The main goal for HL curriculum development should be to include
all HL learners whose language learning needs cannot be fully addressed in the FL
classroom and who possess abilities that may otherwise be wasted in such a class. In
order to achieve this goal, it is absolutely essential to determine the differential benefits
of a foreign versus a heritage language curriculum for this population of students through
empirical studies.
5 SLA stands for second language acquisition
28
Researchers and HL programs alike cannot afford to continue overlooking this
population in light of the current demographic trends. Carreira (2003) notes that this
population will continue to increase dramatically in the next few decades. Even now the
number of these students appears to be by no means insignificant; over ten years ago,
Lipski (1993) suggested that the number of transitional bilinguals in certain areas had
outnumbered fluent bilinguals.
A remaining issue that merits further investigation is the precise learning gains
that HL learners can obtain from a HL curriculum (Pino and Pino, 2000). The benefits of
having differentiated courses for HL learners have been assumed but not substantiated by
empirical studies that can attest to any learning gains. In fact, it is unclear at this point the
extent to which the language classroom can contribute towards the language maintenance
of minority students. Practitioners especially, remain optimistic in their belief that
Spanish classes in both high schools and colleges can make a contribution in the
maintenance of the Spanish of second and third generation students (Valdés, 2001).
However, several language maintenance specialists are more pessimistic in that regard.
Valdés (1995) cautions us of the limited power the classroom can exert against the
assimilative pressures of the society. Fishman (1991) also considers the community and
family as the entities with the most crucial role in maintaining a minority language, with
the school only having a minor role in reversing language shift. The impact of the
language classroom on language development and maintenance still needs to be
ascertained through empirical research.
29
Another concern relevant to the population in this study is the language recovery
of receptive bilinguals. The literature on language recovery as a process of bilingualism is
scant at this point (Uribe de Kellet, 2002). The study of the process of language recovery
can make a significant contribution in understanding the language development and
language reconstruction in bilingual individuals. If we seek to understand the processes
involved in language change, it is imperative to study language recovery in order to
obtain a ‘comprehensive account of language progression and regression’ (Hansen, 1999,
p. 4, as cited in Uribe de Kellet, 2002).”
In summary, the increasing population of Hispanic students has heightened the
need for specialized HL courses to offer more options for students with a more suitable
curriculum from that of FL courses. While Spanish programs are increasingly
incorporating these changes, not all HL learners appear to be able to participate in these
courses. Receptive bilinguals, a growing section of HL learners, continue to be placed in
FL courses in many programs, perhaps due to a lack of understanding of their language
needs. Clearly, neither the HL professional literature nor Spanish language programs
show consensus on whether to include these learners in their programs. In addition, the
HL literature has overwhelmingly focused on more proficient HL learners with very little
attention to students with limited proficiency in the language (Pino & Pino, 2000). Some
of the issues that deserve further exploration are the minimum level of competence
necessary to benefit from HL courses, the role of the language curriculum in the language
development of receptive bilinguals, the establishment of the kind of curriculum that best
serves the linguistic and affective needs of this population of students, and the language
30
learning process that receptive bilinguals go through as they experience recontact with
the language in a classroom context.
The present study attempts to fill this gap in the research by examining the
Spanish language development of a group of HL learners that possess strong receptive
proficiencies in the language but limited productive abilities. This study examines the
role that the language classroom plays in their language development process by
assessing the effects of two different types of curricula on the students’ language
accuracy, complexity and fluency, as well as on their attitudes and use of Spanish after
one semester of instruction. Further, this study explores the potential of the language
classroom as a language development and maintenance agent in a socio-political context
where English is the dominant and privileged language and Spanish is the minority, less
valued language. To examine the above mentioned issues, this study will be guided by
the following research questions.
Research Questions
1) What is the linguistic and cultural profile of SHL learners enrolled in the
SFL and SHL tracks?
1.a What is their family’s cultural and language background, their owncultural and language background, their childhood contact withSpanish, and their current Spanish/English language use andpreference?
1.b What is their motivation to study Spanish and their attitudestowards the Spanish language?
31
1.c Are there any profile differences between the SHL learnersenrolled in the SHL track and the SFL track? How do they differfrom SFL learners in the SFL track?
2) What differential gains are there between the SHL learners enrolled in the SHL
track, those SHL learners enrolled in the SFL track and SFL learners
enrolled in the SFL track after one semester of instruction?
2.a To what extent do the students differ in their language outputdevelopment in measures of fluency, accuracy, and complexity?
2.b What differences are there with respect to Spanish languageattitude, amount of language use, confidence, and self-assessment oflanguage competencies?
3) What are some of the linguistic differences between the groups of SHL and
SFL learners?
4) What are the students’ perceptions of their Spanish language course?
4.a What is the level of satisfaction of the three different groups withthe course content and materials?
4.b To what extent does the SFL or SHL curriculum meet the needs ofSHL learners as perceived by the students?
Significance of the Study
This study explores the language development of a growing population of
receptive bilinguals whose pedagogical needs are not clearly understood at the moment.
This sector of the HL population has been heavily underrepresented in the HL literature.
A clear understanding of the identity, cultural, affective, and linguistic needs of these
students will allow for a more effective curriculum implementation and language
instruction for these students. In an era where education has moved towards a student-
32
centered approach, the distinctive needs of a substantial portion of the HL population
cannot continue to go unmet. This study will help provide insights on language placement
issues by helping to draw a more definite dividing line between students who should
enroll in HL and FL programs within Spanish language programs.
This study will also shed light on receptive bilinguals’ linguistic development and
their speed of learning in a classroom context, thus making a contribution to our
understanding of language change in bilingual individuals. More specifically, the role of
passive knowledge in different aspects of language development will be explored in this
study. Overall, this study seeks to examine how the language classroom can contribute to
the development and maintenance efforts of heritage languages, recognizing them as
invaluable community and national resources that need to be preserved and treasured.
Definition of Terms
Being that HLE is a relatively new field of inquiry, many terms are constantly
being defined and redefined as our understanding of essential concepts is enhanced by the
latest scholarship. Hence, it is considered essential to offer definitions of the important
terms that will be used throughout this dissertation.
Heritage languages:
The label “heritage languages” is currently used to refer to colonial, indigenous,
and immigrant languages (Wiley, 2001). Colonial languages refer to the language spoken
by earlier groups of settlers in the U.S. such as Germans, French, Spanish, and Dutch.
Indigenous languages include all languages spoken by Native American tribes such as
Navajo, Lakota, and Maori. Lastly, immigrant languages stand for the languages spoken
33
by older and newer groups of immigrants to the US including Spanish, Chinese,
Japanese, Korean, and Russian. Although the label “heritage languages” is currently the
most widely used in American settings, many other terms can be found in the literature
including “native languages”, “home languages”, “community languages”, “ancestral
languages” “minority languages”, “immigrant and aboriginal languages”, and “languages
of origin”.
The heritage language learner:
Defining the HL learner still remains a difficult task primarily due to the diverse
nature of the HL population that necessarily makes it difficult to compromise between the
inclusion and exclusion policies most proposed definitions entail. The broadest and most
inclusive definition was advanced by Fishman (2001) who asserts that heritage languages
are those languages other than English that have a particular family relevance to the
learner (p. 81). This definition includes individuals who may have no functional ability in
the HL. Valdés (1995), on the other hand, put forward a proficiency-based definition,
currently being used extensively in pedagogical contexts. A HL learner is an individual
who has been brought up in a home where a language other than English is spoken and
who speaks or merely understands the language and is, to various degrees, bilingual. This
definition clearly excludes learners with a HL background but no linguistic abilities in the
language. These students with no linguistic background and perhaps a more remote
connection to the heritage culture can be distinguished with the label proposed by Van
Deusen-Scholl (1998, as cited in Van Deusen, 2001), learners with a “heritage
motivation”. At the same time, Valdés’ definition excludes learners with linguistic
34
abilities but no home HL background. Draper and Hicks (2001) expand on this definition
by stating that the HL learner “refers to someone who has had exposure to a non-English
language outside the formal education system” (emphasis added). They add, “it most
often refers to someone with a home background in the language, but may refer to anyone
who has had indepth exposure to another language” (Draper & Hicks, 2000, p. 19). This
pedagogically relevant but still inclusive definition of the HL learner will be adopted in
this study. Such definition of a heritage learner is proficiency-based and includes learners
with various degrees of bilingualism, from those who have receptive skills in the
language to those who are proficient in informal and formal varieties of the HL. It also
includes learners who have been exposed to the HL in the home or in contexts outside of
the education system.
The term “heritage language learner” has been widely adopted in the U.S. over
other previously-used terms such as “native speaker”, “quasi-bilingual speaker”, “semi-
speaker”, “minority language speaker”, “residual speaker”, and “home-background
speaker”. “Heritage language” carries a positive tone that affords connections to past
traditions and ancestral languages (Wiley & Valdés, 2000) and leaves behind the negative
or exclusive connotations of prior terms.
Heritage language programs:
A language program has been broadly defined by Lynch (1996) as any
instructional sequence, ranging from a language workshop to an established set of
courses. A heritage language program, then, refers to any instructional sequence
specifically designed to revitalize, develop, or maintain a heritage language. Examples of
35
heritage language programs are after-school heritage classes, Saturday heritage classes,
primary, secondary or university courses, etc. Heritage language programs are not a new
occurrence in the American context; they have a long standing tradition in the United
States dating as far back as to the early days of the inception of this country (Crawford,
1991).
Bilingualism:
It is the “ability to use two or more languages sufficiently to carry on a limited
casual conversation” (Myers-Scotton, 2006). In this definition, bilingualism is not
restricted to the use of any specific variety of a certain language nor is it limited to
speaking but is also open to listening, reading or writing. The bilingual individual, on the
other hand, is a person that has more than one competence and who has some degree of
functionality in two languages (Valdés, 1988).
The bilingual range:
Valdés (1995) advanced the notion that bilingual proficiency falls on a continuum
of varied skills in two languages. She defines the concept as “the continuum of linguistic
abilities and communicative strategies that an individual may access in one or the other of
his or her two languages at a specific moment, for a particular purpose, in a particular
setting, with particular interlocutors” (p. 316, 1995). The bilingual speakers’ language
abilities, then, consist of a range of competencies spread over two languages with
strengths and weaknesses that vary with each individual for each particular linguistic
context. One of the main implications of viewing the bilingual proficiency as a
continuum of bilingual skills is that it debunks the notion of a balanced bilingual, a
36
phenomenon that, according to Valdés (2001), is a popular myth that is impossible to
encounter in the real world.
Receptive bilinguals:
These individuals, primarily due to infrequent use of their productive skills in the
language, have developed a receptive ability in the language which allows them to
comprehend oral and perhaps written language but have significantly more difficulties
when producing the language (Myers-Scotton, 2006). These individuals exhibit receptive
proficiencies in their HL which are stronger than the receptive proficiencies acquired by
beginning and perhaps intermediate learners of a FL (Valdés, 2005). Productively they
can perform satisfactorily in a very basic, everyday conversation in the language that can
be compared to a novice-high level of the ACTFL standards for FL learners. Receptively
they can comprehend input at a low-intermediate or mid-intermediate level, based on the
Contextualized Listening Assessment (CoLA) of the Minnesota Language Proficiency
Assessment (MLPA). It should be noted that these levels were designed for FL learners,
not HL learners, and are used here for the reader to have a point of reference of where to
place this group of students.
Another term that is often employed to describe these individuals is passive
bilinguals, which makes reference to an earlier understanding of the receptive abilities as
passive skills. It is important to keep in mind, however, the dynamic nature of language
and language change. The concept of receptive bilingualism should be understood as a
continuum of bilingual abilities with receptive abilities being stronger than productive
ones in most contexts.
37
Language loss:
It is a general term used to refer the decline of language proficiency of a first or
second language. Seliger and Vago (1991) describe language loss as the “disintegration
or attrition of the structure of a first language in contact situations with a second
language” (p. 3).
Language attrition:
Language attrition can be defined as “the gradual loss of a language by an
individual” (Schmid, 2002). From a psycholinguistic perspective, language attrition is
considered a difficulty in retrieval rather than total loss (Hakuta & D’Andrea, 1992).
Language shift:
Language shift refers to the decline of L1 proficiency at the group level. As such,
it refers to an intergenerational process in which a language is imperfectly transmitted
from one generation to the next (de Bot, 2002, p. 255).
Language maintenance:
It is used to refer to the positive or neutral counterpart of language shift or
attrition and it can refer to both the group and individual level (Wass, 1993).
Language development:
The gradual expansion in complexity and meaning of symbols and sounds as
perceived and interpreted by the individual through the learning process. Language
development, rather than language acquisition, will be used to refer to the language
recovery of receptive bilinguals. The mere fact that individuals are recovering part of
their language production abilities suggests that their language acquisition has already
38
taken place at some point. Therefore, language development indicates expansion of skills
rather than acquisition of abilities that may have been acquired at a prior point in time.
Language recovery:
It refers to the counterpart process to language attrition or language loss in
bilingual individuals. Due to changes in the amount of exposure to the first language, the
lost language skills are reactivated or relearned as the contact increases (Uribe de Kellet,
2002).
Language and ethnic group attitudes
The most comprehensive definition of attitude has been put forward by Allport
(1954, cited in Gardner, 1982) who defined it as “a mental and neural state of readiness,
organized through experience, exerting a directive or dynamic influence upon the
individual’s response to all objects and situations with which it is related” (p.45). This
definition highlights the power of attitudes to influence behavior rather than determine it
(Gardner, 1982). Language attitude refers to “any affective factors related to language,
including language study and one’s own language ability” while ethnic group attitudes
consists of “the attitudinal outcomes relating to an individual’s ethnic/language minority
group and/or other ethnic/language groups” (Tse, 1998b, p.53).
Overview of the Dissertation
After having presented the background, rationale, and significance of the present
study, the remainder of the chapters will contain the following information. In chapter 2 a
review of the relevant literature is surveyed. First, an overview of the major issues in the
HL field is presented. Second, existing literature on receptive bilinguals is offered. Next,
39
major issues in language maintenance and shift relevant to this study are addressed
including language maintenance sources, the benefits of language maintenance, and
language maintenance of Spanish in the United States. The next section is devoted to a
review of language loss studies from a linguistic, psycholinguistic, and sociolinguistic
perspective. Last, a review of studies on language recovery and HL learners in the FL
classroom is offered. Chapter 3 provides information on the research methodologies of
this study. It begins with a detailed explanation of the broad and narrow research setting,
a comparative analysis of the HL and FL curriculum, the HL and FL instructors, and the
selection of subjects. The next section is devoted to an overview of the research design
and procedures, and data collection instruments. The chapter ends with a description of
the data coding and analysis procedures adopted for this study. Chapter 4 presents the
results for each question in the study together with a summary of findings. Finally,
chapter 5 contains a discussion for each of the questions, conclusions and pedagogical
implications, as well as limitations of the study and suggestions for future research.
40
CHAPTER 2: REVIEW OF THE LITERATURE
Introduction
Although interest in the teaching of heritage languages can be traced back to the
early 1930’s, significant attention to the field was not given until the late 1970’s and 80’s,
when HLE began making its way as a distinct focus area within foreign language
education (FLE) (Valdés, 1997). It was not until recently, however, that an explosive
growth in interest in HLE took place (Carreira, 2004; Colombi & Alarcón, 1997;
Krashen, Tse, & McQuillan, 1998; Lynch, 2003; Martínez, 2003; Peyton, Ranard, &
McGinnis, 2001; Potowski, 2001, 2002, 2003, 2005; Roca & Colombi, 2003; Valdés,
1992, 1995, 1997, 2001, 2005; Villa, 1996; Webb & Miller, 2000). Several forces have
come together to heighten the need for further scholarship in this field: the increasing
numbers of HL learner enrollments in language classes in secondary and post-secondary
institutions, the prominent presence of Spanish in the U.S., and an increasing nation-wide
interest in the less commonly taught languages and endangered languages. At the heart of
this growth lies the belief that heritage languages are valuable national language
resources that should be appreciated and developed.
Numerous efforts have been undertaken in recent years to direct the profession’s
attention to a broad array of outstanding concerns in HLE. Initiatives such as the Heritage
Language Research Priority Conference (2000), the National Heritage Languages in
America Conference (1999, 2002), the UC Consortium Summer Institute on Heritage
Languages (2002), and the creation of the Heritage Language Journal have all
contributed to bring HLE issues to the forefront of discussion. These conferences
41
established a research agenda aimed at expanding HL resources in the U.S. and
promoting HL language maintenance and development. The most pressing research gaps
that have been identified fall in the areas of HL demographic data, HL methodologies,
HL curriculum, materials and program development, HL pedagogy and effective teaching
practices, HL assessment, HL loss and issues related to languages in contact, and
sociolinguistic and linguistic descriptions of HL varieties (Wiley & Valdés, 2000). This
study will make a contribution to several of these areas including HL pedagogy, HL
development, and HL curriculum and program development.
This chapter offers a literature review of the scholarship that informs the research
questions guiding the study. The interdisciplinary-based review is drawn from several
fields of study including sociolinguistics, linguistics, psycholinguistics, bilingualism, and
HL pedagogy. The review consists of a broad overview of the most salient issues in the
literature on HLE, followed by a review of published studies on receptive bilinguals.
Next, a discussion of minority language maintenance in the U.S. is presented in order to
understand the contextual and sociolinguistic issues surrounding the linguistic reality of
the population under investigation. Then, a review of the language processes of attrition
and recovery is offered to shed light on the complexities inherent in this population’s
bilingualism and serve as background to understand their language development. The last
section provides a survey of the existing literature on HL learners in the language
classroom.
42
Overview of the Field
A major development in the Spanish as a heritage language (SHL) field has been
the delineation of the HL learner profile, which has led to a better understanding of the
unique characteristics of this population of students (Cano & Dolores, 2004; Campbell,
1996; Carreira, 2003; Draper & Hicks, 2000; Valdés, 1997, 2000; Walki, 1997). This
research has consistently shown the immense diversity of the population as manifested in
two broad areas: language proficiency and academic skills. Valdés (1997) identifies eight
types of bilingual students that vary along two continuums: language proficiency and
academic skills. With respect to the former, Hispanic speakers can vary from fluent
speakers of a prestigious variety of Spanish to learners who have receptive competencies
in a home or community variety of Spanish. Regarding the latter, students’ abilities can
range from good academic skills in one or both languages to minimal academic skills in
both languages. The typical bilingual patterns in the U.S., according to Valdés (2001),
may vary but generally fall into three patterns. HL learners can be 1) third- or fourth-
generation, U.S.-born Hispanic students who may be receptive bilinguals; 2) first- or
second-generation bilinguals who have varying degrees of competence in English and
Spanish but generally have few literacy skills in Spanish; and 3) recent immigrants to the
United States who are Spanish dominant with varying degrees of English proficiency and
literacy skills in Spanish. On top of this diversity, additional variation is added when one
considers different geographical regions in the U.S. For example, while Southwest
Spanish is frequently associated with societal stigma and its speakers are sometimes
43
stigmatized; Spanish in Miami plays an important socioeconomic role and its speakers
suffer less stigmatization (Carreira, 2003).
Based on marketing surveys, census data and sociolinguistic studies of Hispanics
in the U.S., Carreira’s (2003) article provides an overview of what the future holds for
SHL learners in the U.S. in four areas: 1) Spanish language proficiency, 2) academic
skills in Spanish, 3) perceived value and prestige of Spanish, and 4) the diversity of U.S.
Hispanics. Regarding language proficiency and academic skills, Carreira concludes that
the decrease in the number of foreign-born Hispanics will lead to an increase in the
number of students with low to intermediate proficiency of Spanish. This increase may
only be ameliorated by the rising importance of the Spanish language media, which may
also contribute to a decrease in the number of students with receptive skills in rural
varieties of Spanish. This prediction has direct implications for the significance of my
study since it predicts that the number of receptive bilinguals will continue to grow in the
near future. Further, students may have had more exposure to different varieties of
Spanish outside of their home environment because of their contact with the Spanish
media. In addition, religious programs and parental instruction are predicted to play a role
in the biliteracy development of Hispanic bilinguals.
Carreira’s predictions on Hispanic students’ language and culture attitudes are
also positive. A national survey found that three-quarters of U.S. Hispanic teenagers find
the Hispanic culture cool and hip and identify it with their home culture. In addition, the
majority of Latinos under the age of 35 (69%) think of themselves as Latinos or
Hispanic; this stands in sharp contrast with Latinos over that age who prefer to see
44
themselves as American. Carreira concludes that a major characteristic of young
Hispanics and today’s HL learners is a pride in their cultural roots and acceptance by
mainstream Americans, which presents a striking contrast with earlier generations of
students who felt the pain of discrimination and were punished for using Spanish.
The studies that explored the profile of HL learners have provided valuable
insights into understanding the great diversity that characterizes this population; however,
these studies fail to delve into the particular characteristics of different groups of HL
learners with specific language proficiencies. The present study takes a step forward in
this direction by exploring the profile of a subgroup of HL learners: receptive bilinguals
in the American Southwest. It specifically examines their family and cultural
background, as well as their patterns of language use together with their attitudes toward
their language and culture.
In HL pedagogy, four main goals have been proposed for HL instruction: 1)
Spanish language maintenance, 2) acquisition of the prestige variety of Spanish, 3)
expansion of bilingual range, and 4) transfer of literacy skills (Valdés, 1995, 1997, 2001).
One of them, the acquisition of a prestige variety of the HL, has attracted the most
attention of researchers and practitioners alike. Discussions, however, have not focused
on principles and theories of second variety acquisition, but rather, on the role of the
second variety in the HL classroom. More specifically, a large amount of literature has
been devoted to the heated controversy on the role of vernacular and standard varieties of
Spanish in the classroom (Aparicio, 1993; Bernal-Henríquez & Hernández-Chávez, 2003;
Carreira 2000; Danesi, 1986; Fairclough, 2001; García & Otheguy, 1997; Gutiérrez 1997;
45
Hidalgo, 1990, 1997; Martínez, 2003; Porras, 1997; Torreblanca, 1997; Villa 1996).
While all researchers agree that the home variety of Spanish needs to be valued and
respected in the classroom, some propose the teaching of the standard variety of Spanish
as the main goal of HL instruction (Valdés 1997; Valdés, 2001), although the selection of
the standard variety to be used for instruction is highly problematic. At the other end of
the spectrum, opposing researchers contend that there is a need to help learners maintain
and develop the vernacular variety, asserting that it is “crucial for the ethnoidentity of the
students and for their sense of being part of a community: it is the indispensable link
between their culture and the history if his people” (Bernal-Enríquez & Hernández-
Chávez, 2003, p. 108, my translation).
Yet other researchers support a middle-ground position that upholds that students
should be exposed to both their home and standard varieties of Spanish. Supporting this
position, Martínez (2003) argues for a Critical Based Dialect Awareness (CBDA)
approach to HL instruction. According to Martínez, students should be in direct contact
with both types of varieties of Spanish in and outside the classroom, while at the same
time being made aware of the social and political dimensions of such varieties and their
uses. Students will thus be equipped with the sociolinguistic awareness that will allow
them to make appropriate linguistic choices as to the variety of Spanish they would like
to adopt in each specific context (see also Leeman, 2005). The issues on this debate are
particularly relevant to the present study. Receptive bilinguals are frequently familiar
with their home or local variety of Spanish. It is important to examine their attitudes
toward their own and more formal varieties of Spanish as well as their reaction to the
46
language variety adopted in their language classroom.
Another major focus within the HLE literature has been the exploration of
strategies to develop the HL learners’ Spanish bi/literacy skills (Acevedo, 2003; Achugar,
2003; Colombi, 2003; Pucci, 2003; Schwartz, 2003). Since HL learners’ participation in
formal literacy events in Spanish is frequently minimal, their abilities to read or write in
academic Spanish are relatively low when compared to their oral and listening skills,
especially in the case of beginning and intermediate-level HL learners. Scholars have
advocated the use of the learners’ home literacy as a starting point to promote literacy
development for academic purposes (Mercado, 2003). Colombi (2003) proposes a
functional approach to the study of biliteracy for advanced HL learners, following
Halliday’s framework of functional systemic linguistics. This approach views language
as being immersed in social contexts while at the same time having a primary role in
constructing social contexts. In Colombi’s biliteracy program, students learn to develop
their academic registers, deconstruct relevant genres, construct texts with their functional
components (introduction, development and conclusion), and incorporate process-writing
steps such as drafting, revision and editing of texts. According to Colombi (2003), the
deconstruction and analysis of the different genres allows students to “break through the
myths about the difficulty of learning to write” (p. 91). Chevalier (2004) has put forward
a similar proposal of a pedagogical model of literacy development for HL learners with
no or limited writing ability but higher productive skills in the language. Writing in HL
development has been studied with students that already possess strong abilities in the
language and need to expand their written proficiencies. The role of writing in the
47
language development in bilinguals with low oral proficiencies has not been examined
yet.
This overview has provided a brief summary of the most salient issues and
scholarly work conducted in the field of HLE. As a relatively new field, HLE has made
considerable progress in terms of defining the population and their unique language
abilities, reaching a consensus on the importance of promoting both home and academic
varieties of Spanish in the classroom, and examining possible avenues for effective
literacy instruction. In spite of the contributions made to HLE, one cannot fail to notice
the gaps that still exist. Areas such as HL pedagogy, HL curriculum implementation and
development, HL program administration, HL acquisition and development, and HL
placement and assessment remain largely unexplored. The present study seeks to make a
contribution in some of these areas: HL pedagogy, HL curriculum and HL acquisition
and development.
Receptive Bilinguals
This study focuses on HL learners who are receptive bilinguals. The purpose of
this section is to review the small number of articles that are currently available about this
population of students in an effort to synthesize what is currently known about these
learners and their unique situation. Most discussions have thus far centered on
understanding the language abilities of receptive bilinguals coupled with their affective
and linguistics needs.
Valdés (2005) discusses the proficiencies of receptive bilinguals and asserts that
these students possess a C-representation (Clark, 2003, as cited in Valdés, 2005) for
48
language comprehension that enables them to parse the input they receive into
meaningful units. According to Clark (2003), the C-representation6 is necessarily
different from the P-representation7 required for production. The asymmetry between
comprehension and production was shown in a study with two-year-olds that found that
out of 80 items, the children could understand 61% but could only produce 37% (Goldin-
Meadow, Seligman & Gelman, 1976, as cited in Clark, 2003). Valdés (2005) calls for
more research to obtain a better understanding of comprehension and production
grammars, arguing that only such understanding will enable us to develop pedagogical
approaches for these students. Further, more research is necessary before the existence of
two separate representations for production and comprehension can be claimed. The
asymmetry between these two language abilities may be due to an increased difficulty to
access language structures and lexical items for production and the interference of more
automatized access routes for a more dominant language, English in this case (Ecke,
personal communication).
Valdés (2005) posits four areas in need of more research in relation to receptive
bilinguals:
“a) how and why these two types of knowledge systems develop independentlyb) how comprehension and production grammars are relatedc) whether the presence of comprehension grammars supports the acquisition of
production grammars in specific waysd) whether these individuals are more similar to L2 learners than to L1
speakers.”
(Valdés, 2005, p. 419)
6 C-representation refers to the internal representation for language comprehension that consists of form-meaning entries in the mental lexicon (Clark, 2003).7 P-representation refers to the mental representation for language production.
49
Although existing research has yet to address Valdés’s first three questions, the
last question has been discussed by a number of researchers. Carreira (2004) identifies
two main reasons why receptive bilinguals (HL learners type four in her scale) are
different from FL learners and, therefore, need to receive specialized language
instruction. First, these students possess identity and self-esteem needs that should be
sufficiently addressed in the language classroom. Second, they have listening abilities
and some knowledge of the language and culture that differentiates them from the FL
learner. These unique characteristics require specialized instruction that should
incorporate methodologies in both second language acquisition and heritage language
acquisition. The author calls for the creation of a learning environment where receptive
bilinguals can become classroom resources so that their heritage identity and their
knowledge are recognized and valued (Incorporate Lynch 2003). Using these learners as
classroom resources, however, has been found to be a dangerous teaching tool. Students
frequently resent the pressure to perform and the expectation of being the classroom
expert (Potowski, 2002).
Beaudrie and Ducar (2005) contend that receptive bilinguals should have a place
in HL programs given that their attitudes, needs and cultural background parallel those of
more advanced students in university HL programs. The authors conducted a study with
20 participants from a beginning level SHL class in the southwestern United States. The
students, all receptive bilinguals, were asked to respond about their Spanish language
contact, language and culture attitudes, and linguistic behaviors. One of the major
findings was that the majority of the students rarely use Spanish with family members
50
such as parents, grandparents or relatives. Despite their lack of productive use, it was
found they have plenty of opportunities to hear Spanish on a daily basis. The students
overwhelmingly expressed a lack of confidence in two main areas: their own language
competence and their variety of Spanish. Their major goals for taking Spanish classes
were to become fluent in the language for both intrinsic and extrinsic reasons.
Although this research highlights the different affective and cultural needs
receptive bilinguals have, the linguistic aspect of HL development in this population,
however, still needs to be explored to determine whether they would benefit from a HL or
FL curriculum based on their linguistic abilities. Lipski (1986, 1996) conducted research
on the linguistic competence of a related population: vestigial Spanish speakers or
transitional bilinguals. These individuals are typically learners who have experienced a
displacement toward English, resulting in an unbalanced linguistic competence tipping
towards receptive knowledge in Spanish. Although these individuals are in some ways
similar to receptive bilinguals, they appear to have more extensive receptive and
productive abilities in the language. Lipski (1986) analyzed the speech of American
vestigial individuals of Cuban, Mexican, and Puerto Rican origin. He found the following
characteristics:
1. A reduction in the morphology of the verbal system: Mostly infinitiveforms use with a lot of instability of person/number agreement;
2. A reduction in the noun/adjective morphology: lack of gender agreement;3. A reduction of the prepositional series: elimination of prepositions such as
a, en, de;4. Elimination of syntactic complexity: loss of complex sentences, relative
pronouns use;5. Wrong use of indefinite and definite articles;6. Overuse of personal pronouns.
51
Lynch compares the language production of these individuals to the speech of the
pidginized varieties of Afrohispanic Spanish of centuries ago and finds striking
similarities. The author stresses that the Spanish spoken by these individuals should not
be considered representative of the Spanish spoken in the U.S. These individuals
represent only a section of Spanish speakers in the U.S. who have undergone special
circumstances that differentiate from the rest of the speakers in this country. Similar
studies focusing on linguistic descriptions of the language competencies of receptive
bilinguals are essential to understand their production grammar. In addition, in order to
gain a full understanding of the profile of receptive bilinguals, it is fundamental to first
examine the sociolinguistic, psycholinguistic, and linguistic circumstances that have
helped shape their reality. To that effect, the remainder of this chapter offers relevant
research, theories, and explications on language maintenance and shift, language attrition
and recovery, and students’ perspectives about the language classroom.
Maintenance and Shift
HL learners today are second-, third-, fourth-, or fifth-generation students who
come to the classroom as English dominant speakers and have considerable difficulty
maintaining their HL. The language classroom then assumes increasing responsibilities in
the HL maintenance of minority students. This section will introduce work in the areas of
language maintenance and shift, the role of education, communities, and families on
language maintenance, the benefits of language maintenance, and Spanish language
maintenance in the U.S.
52
Introduction
In contexts where two or more languages are in contact, especially where there is
an unequal power relationship between these languages, a shift to the dominant language
is a normal occurrence while language maintenance appears to be more rare (Krashen,
1996). As Valdés (1995) points out, even in contexts where bilingualism at the societal
level is stable, individual bilingualism across generations is not. The bulk of research in
language maintenance consistently suggests that the shift to the dominant language is
frequently completed within three generations (Fishman, 1991; Myers-Scotton, 2006).
The rate of these downward patterns of language shift, however, cannot be seen as a
single descending line; rather, it should be conceived as a variant path with ups and
downs, largely dependent on the specific contextual, cultural, and socio-political reality
of each community (Fishman, 2004). Despite the fluctuating patterns of language change,
research consistently shows that language shift seems to be inevitable unless considerable
efforts are made both at the individual and societal levels (Fishman, 1964).
Language maintenance sources: Family, community, and education
Fishman (1991) argues that intergenerational mother tongue transmission has a
primary role in language maintenance efforts since it is one of the most powerful
language maintenance agents. On the other hand, Bills (2005) contends that relegating
Spanish to home use confines the language to its death. Instead, he argues in favor of
expanding the linguistic network8 of minorities to the larger community. Citing Silva-
8 See Milroy, L. (1980).
53
Corvalán (2001), he explains that the solidarity of the community can cancel out the
external assimilationist effects and promote the prestige of the minority language.
Similarly, García (2003) highlights the function of both the home and the community in
HL maintenance and suggests that for language maintenance to occur both institutions
need to be involved.
Education is yet another source of minority language maintenance. In fact, it is
widely believed that Spanish classes in both high schools and colleges can make a
contribution to the maintenance of the Spanish of second- and third-generation students
(Valdés, 2001). Researchers such as Baker (2003), however, caution us of the over-
optimism often placed on the benefits of language programs for language maintenance,
language revitalization and reversing language shift. He states that language acquisition
planning through bilingual education is an essential tool for language revival but is not
enough in and of itself. As he states, “while bilingual education has an important role in
language reproduction, and without bilingual education a minority language may not be
able to survive except through intense religious usage, bilingual education cannot deliver
language maintenance by itself” (Baker, 2003, p. 96). However, it is crucial to keep in
mind that bilingual programs in the U.S. have frequently adopted a model of subtractive
bilingualism where English proficiency is the primary goal of instruction to the detriment
of the first language (Ruiz, 1988). These types of bilingual programs fail to address the
language maintenance needs of HL learners, resulting in an increased need for HL classes
at the secondary and post-secondary level.
54
It is evident that, as Draper and Hicks (2000) state, the maintenance of a HL
requires the coming together of several forces. It “cannot be achieved by the heritage
language learners alone. The community, teachers, and parents all need to be involved to
ensure that the first language is not lost” (p. 17). The extent to which HL classes in both
high schools and colleges can make a contribution to the maintenance of Spanish is not
clear at this point. Although researchers and practitioners alike have remained optimistic
in this matter, only empirical research in this area can shed light on the impact of
education on HL maintenance.
Benefits of language maintenance and development
Maintaining a minority language while developing proficiency in the dominant
language necessarily entails becoming bilingual. The key issue is that while subtractive
bilingualism will threaten language maintenance; additive bilingualism will be of great
benefit for the maintenance of the minority language. Typical transitional bilingual
programs focus on the teaching of English at the expense of the first language (Ruiz,
1988). The most perplexing paradox is that being bilingual, in the case of minority
students, carries a negative attitude towards this kind of “folk bilingualism”, which only
signifies being part of the lower class (Porter, 1990). In sharp contrast, elite bilingualism
–the privilege of a selected few- enjoys a positive attitude (Porter, 1990).
Despite the negative attitudes frequently attached to folk bilingualism, substantial
research on the advantages of bilingualism has been conducted over the last 50 years
comparing monolinguals to bilingual children. One of the major findings about the
55
benefits of bilingualism is that proficiency in two or more languages may provide an
individual with increased levels of cognitive flexibility. As early as 1962, Peal and
Lambert conducted a study comparing monolingual and bilingual children and found that
bilinguals had an advantage in mental flexibility, better skills for concept formation, and
a wider range of mental abilities. Evidence was also found for benefits of bilingualism on
reasoning abilities among children such as nonverbal problem solving skills, divergent
thinking skills, and field independence (Cummings, 1976). Hakuta and Díaz’s study
(1985) lent further support to this line of research by providing evidence that bilingualism
afforded benefits on general cognitive abilities including divergent thinking, spatial
abilities, and creativity. Bilingualism also has a social function. Thompson (1973, in
Ruiz, 1988) and Sharp (1978, in Ruiz, 1988) argue that language raises an awareness that
there are other ways of thinking and living besides one’s own. Although there is general
consensus on the beneficial effects of bilingualism, there is still controversy on the
educational circumstances that would make the positive advantages of bilingualism
possible (Hakuta, 1990).
Despite the controversy surrounding bilingual education, overall academic
success has been consistently linked to bilingualism (Cummins & Nakajima, 1987;
Fernandez & Nielsen, 1986; Nielsen & Lerner, 1986; Swain & Lapkin, 1981). Krashen
(1998a) synthesizes the literature and concludes that studies have shown that as long as
English language development takes place, HL development is related to greater
academic achievement with no adverse effects. Additionally, proficiency in a HL was
56
found to have a positive correlation with the overall psychological well-being of the
student, including self-esteem and self confidence (Huang, 1995; García, 1985).
Competency in a HL language is also beneficial for families. HL learners often
report that being able to speak the HL allows them to reconnect with their family and
their cultural heritage (García, 2003; Beaudrie & Ducar, 2005). On the other hand, losing
the HL may bring isolation from the family and isolation from the community members
of the same ethnic group (Krashen, 1998a). This study explores the students’ perceptions
about the benefits of bilingualism, along with their feelings towards the importance of
maintaining Spanish while acquiring English.
At the societal level, multilingualism and bilingualism are in the best interest for
any nation. Contrary to concerns expressed by opposers to bilingualism, “there is ample
empirical evidence that multilingualism does not lead to increased social strife nor to
lowered per-capita gross national product” (Fishman, 2004, p. 420). On the contrary,
linguistic pluralism provides practical benefits in areas of national interest such as
business, trade, national security, armed forces, diplomacy, and the like. As Peale (1991)
states, “at no time in history has our nation needed more linguistic capital than now” (p.
447). Spanish is not only one of the numerous heritage languages spoken in the U.S. but
also the second in importance after English (Peale, 1991).
Spanish language maintenance in the United States
In the United States, Spanish may appear to enjoy a special status due to the large
and increasing size of the Spanish-speaking population and the constant immigration of
57
Spanish speakers (MacGregor, 2005). For language maintenance though, these factors
can be misleading and should not be used as an indication that the language is being
maintained (Bills, 2005). In fact, some researchers have hypothesized that were the
Mexican-American border to be closed, Spanish would disappear from the American
scene just as fast as other minority languages do in most other places (McGregor, 2005;
Bills, 2005).
Numerous studies that examine Spanish language maintenance in the U.S.
corroborate the potential validity of this hypothesis. In effect, the case of Spanish is no
different from that of other heritage languages, as it too is frequently lost by the third
generation (Bills, 2005). In his article, Bills reviews relevant studies that indicate that this
same pattern of loss holds for the three majority Hispanic groups. Numerous studies on
Puerto Rican groups in the U.S. suggest that language shift to English in Puerto Rican
communities is happening at the normal rate of three generations (Fishman, Cooper &
Ma, 1971; Zentella, 1997, Torres, 1997; García, Morín & Rivera, 2001; as cited in Bills,
2005). For Cubans, although fewer studies have been conducted, the results are parallel;
for example, García and Otheguy (1988) found that second-generation Cubans use
English as their preferred language in the same way Puerto Ricans and Mexicans do.
For Mexican-Americans, a similar pattern is taking place mainly due to a lack of
intergenerational transmittance of the HL (Bills, 2005). Ramírez (1992), for example,
found a decline in Spanish language use when he compared children to adults in ten cities
throughout the U.S. A point of relevance here is the crucial role that children appear to
play in the language choice of the family. As Myers-Scotton (2006) observes, “in many
58
communities where a language shift is underway, the L1 is still maintained in the home.
But children, not the elders, can be primary in deciding on the home language in
immigrant families” (p. 100).
Socioeconomic status also seems to play at least some role in Spanish language
maintenance. Amastae (1982, cited in Hidalgo, 1993) conducted a study on language
maintenance and shift in border areas. He found that while there was a shift from English
to Spanish among Mexican-Americans outside the home, there was a subsequent shift
from English to Spanish once the desired socioeconomic status was reached. Middle-
class Mexican-Americans appear to value Spanish more than lower-class individuals,
who may see Spanish as an obstacle to reaching economic prosperity. This finding may
be helpful in understanding the motivation of many receptive bilinguals to regain their
language abilities by attending language courses. Their stable socio-economic status and
English language competence may explain their interest in becoming proficient in
Spanish.
In summary, research on individual bilingualism consistently shows that there are
personal, family, and societal benefits to maintaining a HL. Despite these benefits, shift
from Spanish to English is frequently complete after the third generation. The
sociolinguistic motives behind this shift will be explored in the next section. For now it
will suffice to say that only the coming together of families, communities, societies, and
schools can have the necessary strength to reverse this pattern. Whereas Spanish
education has positioned itself as a powerful maintenance agent, this claim requires
further investigation. The present study provides additional insight into the role of
59
Spanish education in the language development of receptive bilinguals and the specific
curriculum that most benefits that development. In addition, by examining language use
patterns before and after instruction, it also provides a glimpse into the potential of
Spanish classes to initiate changes in language use patterns that promise to be more
favorable towards language maintenance.
Language attrition
As language use patterns change in each individual, language maintenance and
attrition is of crucial importance in understanding the bilingual competencies of the
minority speaker. This section attempts to elucidate this process by reviewing studies on
language loss from various perspectives in three main fields: linguistics,
psycholinguistics, and sociolinguists. From a linguistic perspective, studies have
examined ‘what is being lost’; from a psycholinguistic and neurolinguistic perspective,
studies have investigated ‘how it is lost’. Lastly, from a sociolinguistic, sociologic, and
anthropologic perspective, studies have examined ‘why it is lost’ (de Bot, 1999).
Linguistic accounts of language loss
Linguistic descriptions of language loss indicate that the process, far from being
arbitrary or idiosyncratic, is one which exhibits a high degree of regularity (Hernández-
Chávez, 1993, p. 61). It has also been found to be a selective process affecting some
linguistic domains in the language more than others at any given time (Montrul, 2004).
The major areas that have been analyzed and found to be more susceptible to language
loss are the morphology and verbal systems and the lexicon. Similarly, at the skills level,
60
some linguistic skills are retained better than others. Indeed, Hansen (1999) finds, for
example, that ‘measurement of attrition in productive skills consistently shows more
attrition than measurement of recognition skills’ (p. 14). Furthermore, Yoshitomi (1992)
points out that phonological skills are maintained better than lexical or grammatical
skills, receptive skills better than productive, metalinguistic skills better than linguistic
skills, listening skills better than reading skills, and semantics/vocabulary skills better
than reading skills (Yoshitomi, 1992, p. 296).
Let us now look at the linguistic systems that appear to be most affected by
language attrition: the morphology and verbal system and the lexicon. Research has
found preliminary evidence for the following changes in the former (Schmid, 2002):
1. loss of case-marking
2. loss of gender marking and adjective/noun congruence
3. a reduction in allomorphic variation
4. a movement from inflectional devices and allomorphic variation towards
more regularized or analytic forms
5. a trend towards periphrastic constructions
6. grammatical relations tend to be encoded less by bound morphemes and
more by lexemes (Schmid, 2002, p. 34).
The studies conducted so far in morphology do not present conclusive evidence,
but rather, they show trends that call for further research before any conclusive
conclusions can be drawn. It is clear, however, that this area is more susceptible to loss
since it does not lend itself easily to the use of avoidance strategies (Schmid, 2002). Also,
61
as the lexical morphology model (Bybee’s, 1985) illustrates, verb morphology that does
not carry meaning is more likely to undergo loss. This prediction was confirmed by a
study conducted by Anderson (2001), who concluded that morphological markings not
essential for verb meaning are more susceptible to loss. This dissertation continues this
line of investigation by approaching these issues in a different manner. It examines how
linguistic systems are affected by language attrition or passive use by analyzing which
aspects of language development correspond to a normal speed and which correspond to
a faster speed of learning. This will provide an insight into the role of passive knowledge
or retention in language development.
With respect to the lexicon, Schmid (2002) presents at least two areas that are
most affected by language loss:
1. Specificity of meaning (also called semantic extension, semantic transfer or
loanshift) refers to the extension of the meaning of a word in the base language to the
second language, resulting in the word being used inappropriately in non-bilingual
contexts. In some cases, calques are produced; that is, a morpheme-by-morpheme
translation of a phrase in the base language. Another type of process is the use of a base
language item which is homophonous with a word in the second language but has a
different meaning in monolingual varieties of the second language. The meaning in the
base language is then transferred to the second language.
2) Loss of lexical richness refers to a reduction in the number of items in the
lexicon; this is especially true for low frequency words. Because of the difficulties
62
associated with investigating this phenomenon, it has not yet been extensively researched
(Schmid, 2002).
As evidenced from the studies described above, research from a linguistic
perspective has focused on what is being lost in comparison to a monolingual variety.
Considerably less research has concentrated on what is being retained. In the study of
receptive bilinguals, a change of emphasis on the aspects being retained may become
critical since many features have either been lost or never been acquired, making such a
focus absolutely necessary. Another problem with current research is its exclusive focus
on the analysis of errors. As Schmid points out (2002), this type of methodologies may
provide a skewed picture of what the individual is capable of doing, for example, using
avoidance strategies to make up for what has been lost.
Psycholinguistic accounts of language loss
From a psycholinguistic perspective, language attrition can be explained by the
weakening of the links between knowledge nodes in memory, which decline with time as
a consequence of a decrease in use (de Bot, 2001). For many, however, this does not
mean that the information is lost. Research on the psychology of memory indicates that
learned information remains stored in memory forever (de Bot, 2001). It is simply a
reduction in accessibility due to a decrease in activation levels based on the frequency
and recency of usage (Ecke, 2004). This hypothesis has direct implications for language
recovery since difficulty in accessing information does not equal loss of information and
could potentially be recovered at a later time (Ecke, 2004). For example, de Bot and
Stoessel (2000) found that knowledge of languages that have been learned 30 years
63
before was still available and could be retrieved given the appropriate retrieval methods.
In addition, it was found that a limited amount of contact is not enough to reactivate
knowledge; though knowledge is still present, it takes effort to turn this dormant
knowledge into usable knowledge produced fluently again. In certain cases, knowledge
may become so difficult to access that is beyond reach and for practical purposes lost (De
Bot & Hulsen, 2002). In de Bot’s model (2001) of language loss, language use (i.e.:
language input and output) is the determining variable for both intragenerational attrition
and intergenerational shift. According to the author, there is a direct relation between the
amount of language contact and loss.
Both input, output, and frequency are crucial factors in language acquisition (de
Bot, 2001). Language acquisition research largely indicates that comprehensible input is
one of the facilitative factors in acquisition although it is not a necessary condition for
acquisition nor does it guarantee that acquisition will take place (Ellis, 1994). As de Bot
(2001) states, input does not equal intake and may not always be used to restructure the
language system. Output, on the other hand, can force learners to move from semantic
processing, necessary in comprehension, to syntactic processing, necessary for
production (Swain, 1995). Swain (1995) distinguishes at least four independent roles for
output. One of them, hypothesis testing, provides opportunities for learners to make use
of their linguistic resources by allowing learners to test their hypotheses about language
and try them out when they are communicating. The second role of output is “noticing”.
When learners are communicating, they may notice a problem or a gap that they have
when they compare the meanings they are trying to convey and the language they can
64
produce. This conscious awareness will trigger “cognitive processes which might
generate linguistic knowledge that is new for learners” (Swain, 1995, p. 126). The third
role for output is metalinguistic, which refers to those moments when learners use output
to reflect upon language. When learners are negotiating meaning during interaction, they
sometimes discuss language forms using language in the negotiation. The fourth role is to
provide learners with opportunities for practice and fluency enhancement. Lastly,
frequency is yet another major factor. As Ellis (1999, as cited in de Bot, 2001) indicates,
one encounter with a lexical item is not enough; repeated exposure is absolutely
necessary for acquisition to take place. This study explores the impact of childhood and
current language contact on language retention and will provide further evidence to de
Bot’s language use model for language loss.
Four hypotheses that have been put forward to explain or describe the language
attrition process will now be reviewed: 1) the regression hypothesis, 2) the interlanguage
hypothesis, 3) the language change hypothesis, and 4) code-switching.
The regression hypothesis, dating as far back as Jakobson (1941/68), views
language attrition as a parallel process to language acquisition but in reverse order; for
example, more complex structures, which are normally acquired later, will be the first to
disappear in situations of language attrition. On the other hand, those aspects acquired
first will be more resistant to attrition. For linguistic skills, receptive skills (listening and
reading) come prior than productive skills (speaking and writing) in language acquisition
and therefore recede first in attrition. It appears to be easier to find empirical support at a
skills level; however, at the intralinguistic level (morphology, syntax, lexicon),
65
documenting a reverse process in attrition has proven to be considerably more difficult,
partially because universal acquisition stages have been determined for only a restricted
number of linguistic structures (de Bot, 2001). On the contrary, some studies found that
attriters reached a stage not found in first language acquisition (Jordens, 1986).
The interference hypothesis: In language contact situations, changes in the
linguistic system of one language may result when one language takes over the other.
Research has found evidence for this hypothesis in the lexicon but not in syntax, where
linguistic changes have been found to be motivated not only from external factors but
also from internal ones (Seliger and Vago, 1991). Mixed results have been found in
research examining this hypothesis (see page 15).
The language change hypothesis: Processes observed in language attrition (i.e.:
reduced lexicon with only high frequency items) are also found in processes of language
change within communities or individuals. Language loss seems to be, however, a sped
up process of language change. “(Several studies have borne out this prediction.)”
Code-switching refers to the use of more than one language by the same speaker
in the same turn of speech and it has been linked to language loss. This type of
compensatory code-switching can be a predecessor of language attrition when it takes
place in situations that are not called for by external factors such as interlocutor, topic, or
cultural environments. However, as Schmid (2002) states, it is uncertain whether code-
switching presents evidence for attrition. At the word level, for example, the use of the
L2 item may not mean the speaker has lost the equivalent L1 item or even that she cannot
access it. The individual might also feel that the L2 item is more adequate for a particular
66
context (Schmid, 2002). In his study on the role of New Mexican Spanish, Hernández-
Chávez (1990, as cited in Hernández-Chávez, 1993) found that the use of code-switching
responded to cultural ties to the English culture rather than to a lack of lexical knowledge.
At the intrasentential level, Poplack (1980) explains that code-switching indicates
balanced-bilingualism rather than language loss. While some studies show that
suppressing the first language to avoid code-switching contributes to language
maintenance, others suggest that code-switching actually contributes to language
maintenance (Ecke, 2004). Clearly, only future research examining the relationship
between code-switching and language loss will help determine whether code-switching is
a precursor of language loss.
For situations of language contact, the study of language loss in second-, third-,
and fourth-generation bilinguals is further complicated by the fact that it is difficult to
determine whether a linguistic item has been learned and forgotten, or it has never been
acquired. Three mechanisms appear to be involved in the loss or partial acquisition of a
language: 1) a dilated learning characterized by structures learned at a slower pace than
usual; 2) interrupted learning or loss by which an individual ceases the acquisition
process; and 3) forgetting of previously acquired structures or vocabulary items (Bernal-
Enríquez & Hernández-Chávez, 2003, p. 103). In the case of HL competence, certain
previously acquired linguistic structures can be re-accessed with proper amounts of input
and opportunities for practice; others may have never been acquired and need to be
learned fresh.
67
Sociolinguistic perspectives to language loss
Examining the reasons behind language shift has occupied researchers in
sociolinguistics for more than forty years. A number of factors have been found to
influence language shift to the majority language. However, while many factors have
been found to have an impact on the degree of HL language maintenance or shift, the
extent of the influence each factor exercises has not been easy to determine and varies
from community to community (Myers-Scotton, 2006). These factors can be divided into
internal factors, which refer to the ones that come from within the minority group or
individual, and external factors, which refer to the influence of outside forces (Bills,
2005).
Internal factors for language shift.
1. Desire for integration into mainstream culture: Individuals may often
have a strong desire to integrate into the majority culture, which can lead to rejections of
their heritage culture and a resulting abandonment of their culture and language
(Krashen, 1998b).
2. Internal racism (Bills, 2005): Many Hispanic communities are often
prejudiced towards other Hispanic communities from either inside or outside the U.S.
Attitudinal studies have found that American Hispanics suffer discrimination both when
visiting the Spanish-speaking country of origin or in the U.S. from other Hispanic
communities. This feeling may contribute to the alienation of Hispanic communities and
oftentimes the rejection of Spanish (Bills, 2005). Another form of internal racism is the
one experienced by learners who have not completely acquired the HL and who often
68
receive negative reactions from more advanced native speakers such as ridicule and
correction; this leads to the learners’ developing language shyness which manifests in a
reluctance to use the HL (Bills, 2005; Krashen, 1998b). As Zentella (1997), points out
“Latinos who end up convinced that their Spanish is bad or ‘mata’ or ‘killed’ rush to
adopt English and eventually do kill off their Spanish” (p.180, as cited in Bills, 2005).
3. Language loyalty refers to the tendency to maintain one’s language more
than the norm, not for practical reasons, but because the language is of special importance
for the identity of the individual (Fishman, 1991, as cited in Hinton, 2003). In her
research on language maintenance in Chula Vista, a border town in California, Hidalgo
(1993) confirmed the close link that exists between language loyalty and maintenance.
4. Ethnic-identity development (Tse, 1998a). Tse integrated components of
several existing models into one model of ethnic-identity development that consists of
four stages:
a. Unawareness: Usually brief, it is a stage at which minority groups lack
awareness of their minority status.
b. Ethnic ambivalence/evasion: Stage when individuals show either
ambivalent or negative feelings for their own ethnic culture and prefer to identify with the
dominant societal group.
c. Ethnic emergence: Stage in which the individual begins to associate with
their ethnic culture, which leads to embrace the culture at times but yet favoring the main
culture.
69
d. Ethnic identity incorporation: Stage where the ethnic identity conflicts are
resolved and the individual accepts their belonging to the ethnic group and acquires an
improved self-image (Tse, 1998a, p. 16).
The stages, however, are suggestive of possible phases that individuals may go
through with no rigidity. Depending on the context, one or two stages may be skipped;
for example, in cases where individuals have strong ethnic ties who may never go
through the first three stages. Likewise, some individuals may only experience stages one
and two and never arrive at the third and fourth level. This model can be used to make
predictions about HL development arguing that it is more prone to take place if the
individual is past stage two, has possibilities to receive comprehensible input and the HL
is valued among the members of the ethnic group (Tse, 1998a).
5. Sociohistorical linguistic factors (Bernal-Enríquez, 2005): These refer to
the individual’s personal socio-history. Bernal-Enríquez’s analysis of the results from a
survey with 201 participants from New Mexico showed that the individual’s experience
with Spanish and English during childhood has a direct impact on language maintenance.
Three different factors negatively affected the individual’s ability in Spanish:
a. Home use of English or both English and Spanish, since Spanish use is not
extensive enough during the critical years of language acquisition;
b. Early use of English, which also reduces Spanish use because it competes
with English during the critical years of language acquisition;
c. English-only education, since Spanish use is limited during the years
where academic skills in Spanish could be developed.
70
6) Ethnolinguistic Attitudes:
Research on the role of ethnolinguistic attitudes toward the HL and the Spanish
classroom indicates that attitudes are an influential factor that may determine, to some
extent, the individual’s linguistic choices. As Allard and Landry (1992) maintain, the
individual’s cognitive disposition – language related beliefs, attitudes and values – is
forged in the individual’s network of linguistic contacts. This disposition, according to
the authors, directly affects the individuals’ choices to maintain, decrease or expand their
network in each language. As the authors state, “language aptitudes and competencies
and the cognitive-affective disposition toward ethnolinguistic aspects will have an impact
upon language learning and behavior and ultimately on language maintenance and loss”
(Allard and Landry, 1992, p. 173).
Tse (1998b) corroborates such claims in her synthesis of studies on
ethnolinguistic attitudes by concluding that HL acquisition “is facilitated when an
individual has positive attitudes toward the language, feels positively about the ethnic
group in which he or she is a member, and ultimately feels that these associations result
in an overall satisfactory self-evaluation” (Tse, forthcoming, as cited in Tse, 1998b, p.
52). These conclusions, however, only pertain to a group of the HL population since all
of the studies reviewed focus on elementary school children rather than teenagers or
adults. This study fills a gap in the literature by addressing these same issues in the
university context.
Andrew Lynch (2003), on the other hand, downplays the role of ethnolinguistic
attitudes and argues that the degree of contact with the HL in the case of HL learners may
71
have a stronger influence on their language development or maintenance, perhaps
stronger than that of attitudinal factors. According to Lynch, there are HL speakers who
have negative attitudes toward their HL but nonetheless possess high levels of
proficiency in the language. Extensive contact with the language, therefore, appears to be
a powerful tool in favor of language maintenance regardless of the individual attitudes.
More perplexing, perhaps, is the fact that there are HL learners who show a positive
attitude towards maintaining their language but continue to use English predominantly in
their family and social lives (Lynch, 2003).
The arguments presented here show that ethnolinguistic attitudes do play a role in
language maintenance, although the presence of language choice may also be important.
If students are surrounded by frequent situations where they have no choice but to speak
Spanish, their attitudes may not play such a crucial role. When students are constantly
surrounded by situations where they have a choice as to the language to use, language
attitudes may play a bigger role in determining the language use of the HL learner. These
issues are unresolved at present and will remain so until future research that examines the
distinctive role of attitudes and language choice is conducted.
External factors to language shift.
1. The assimilation pressure (Bills, 2005): Given that the generalized
ideology in the U.S. is that being “American” requires speaking English, there is an
enormous pressure on immigrants to speak English in order to become ‘Americanized’.
2. National racist movements (Bills, 2005): Movements such as English
Only and No child left behind are the creation of assimilationists who promote English as
72
the official language of the United States and attempt to eradicate Spanish (Pomerantz,
2002). Further, these movements discourage minority language maintenance by opposing
HL maintenance programs such as bilingual education (Schmid, 2002).
3. Socioeconomic factors: Studies have consistently shown that maintenance
of Spanish is positively correlated with low income and lower levels of education. On the
other hand, the higher the education and the income, the lower the use of Spanish that
was found (Bills, 2005).
4. Ethnolinguistic vitality, a model initially put forward by Giles, Bourhis
and Taylor (1977), measures the sociological variables that make up the group’s vitality
such as the status of the group, their institutional support, and the number of speakers.
Subjective ethnolinguistic vitality refers to how one group sees itself with respect to other
groups. As Myers-Scotton (2006) explains, there are two components to this model: at a
sociological level, the ethnolinguistic vitality establishes the opportunities afforded to its
members for speech events in the HL. At a psychological level, the beliefs within the
subjective ethnolinguistic vitality will have a bearing on the group members’ language
use patterns. The claim of this model is that without such vitality, it is very difficult for a
linguistic minority to continue to exist.
5. Inadequacy of formal language classes (Krashen, 2000, p. 441) and lack
of good HL programs (Krashen, 1996). This factor refers mostly to the lack of sufficient
HL language programs in secondary and post-secondary institutions. As a result, many
HL learners take language courses in the FL track. Krashen (2000) explains how painful
the HL learners’ experience in the FL classroom can be. These classes often focus on the
73
conscious learning of grammar. While FL learners can be adept in dealing with these
concepts, HL learners are frequently at a loss with this approach to learning a language.
This experience can have demoralizing results for the HL learner, who may feel
inadequate at her/his HL (Potowski, 2002). Even HL programs that do exist today are not
without difficulties. Cantoni (1997) reports some of the problems that compromise the
success of HL programs: lack of trained HL teachers, isolation of HL courses from the
rest of the curriculum, and lack of commitment to systematically promote linguistic
diversity on the part of language departments.
In summary, linguistic accounts of language loss have documented the systematic
changes and processes that the morphology, syntax and the lexicon domains undergo.
Characterizing language loss as a selective process is of crucial importance in
understanding the linguistic situation of receptive bilinguals and their different strengths
and weaknesses in their language competence. Psycholinguistic perspectives have
provided evidence that language loss does not equal erasure but merely deactivation.
Sufficient amounts of language recontact could help students transform passive into
active knowledge. Sociolinguistic accounts make it clear that both internal and external
factors combine to affect the language maintenance of a HL.
Language Recovery
As a counterpart of language attrition, language recovery is a natural process
within bilingualism. Bilingualism has been described as a cyclical process in which
individuals go through different stages of attrition and recovery, or expansion and
reduction of their bilingual abilities, depending on the patterns of change in language use
74
they engage in (Silva-Corvalán, 2001). Despite the widespread interest in bilingualism,
language recovery has not received sufficient attention from scholars (Uribe de Kellet,
2002). This process is of crucial importance to fully understand individual bilingualism.
As Hansen (1999) points out, without understanding language recovery, it is impossible
to understand the language change patterns of language progression and regression in
individual bilingualism.
Another related area that has been overlooked by studies in the field is the role of
passive bilingualism in language recovery and development (Uribe de Kellet, 2002). As
she explains, long-term memory contains two types of knowledge: recognition (or
passive knowledge) and recall (or active knowledge). Words may be recognized but not
recalled. The interesting question that still remains to be answered is what it takes to
transform passive knowledge into active knowledge. In her study on language recovery,
Uribe de Kellet found that recontact with the minority language allows the bilingual
individual to reactivate passive knowledge. She conducted a case study with a six-year-
old Spanish/English bilingual child that returned to a Spanish-speaking country after
living in an English speaking country. The child was fluent in Spanish before starting
school but retained only comprehension ability in the language once she became English
dominant. In the Spanish speaking country, the child engaged in communication mostly
with Spanish monolinguals. The analysis of the child’s language recovery showed that
she attained active production of the language after 17 days and full command of the
language with no English interference after 28 days. Being a case study, conclusions
75
from it cannot be generalized to the bilingual population. However, the results are
interesting and the topic merits future research.
An issue that remains unclear at this point is the role that external and internal
factors play in language reactivation. Clyne (1992) maintains that ethnic revivals and
other phenomena can lead to “revitalization” and passivization to “reactivation” once the
psychological or sociological reasons for a shifting subside (p. 18). Psychological factors
also complicate the assessment of the abilities of passive bilinguals, especially because
the lack of productive use of an individual may be an indication that the learner either
cannot produce any language or refuses to speak it.
Heritage Language Learners in the FL Classroom
This last section of the literature review offers an overview of studies that have
focused on HL learners in the language classroom, as this dissertation study aims to
continue in that line of research. Although the literature on HL learners in the language
classroom is scant at this point, studies are beginning to appear examining the students’
linguistic and cultural attitudes, motivation, language use patterns, and perceptions of
their Spanish and the Spanish language classroom. Angela Felix (2004) conducted her
dissertation research on the experiences of 39 adult HL learners enrolled in a traditional
FL classroom for English speakers. Students participated in questionnaires, interviews
and group discussions about their experiences with the Spanish language and their
learning in a FL context. The results show that students view Spanish differently
depending on the context of use. Outside the language classroom, Spanish is restricted to
a working class identity and is viewed as a private language mainly for informal use with
76
family members. In the classroom, students revealed cultural motivations for studying the
language given their needs to reconnect with their family and heritage. Regularly,
students are used as classroom experts with little attention devoted to their own language
needs such as literacy development. A number of students expressed having feelings of
inadequacy and embarrassment as they were confronted with preconceptions and high
expectations from their peers. The author concludes that the FL classroom limits the HL
learners’ activities to the ones designed for FL learners and neglects their own needs.
Similar results were found in the study conducted by Potowski (2002). She
surveyed 25 university SHL learners about their course selection and their Spanish
learning experiences through a questionnaire and focus interviews. These students,
enrolled in either the SFL track or the SHL track, reported discontent about their
instructors’ higher expectations for them; in many cases, instructors used them as experts
by asking questions or their dialect’s translation for vocabulary items. These expectations
place too much pressure on the students and intensify their already negative self-
perceptions of their Spanish. Many participants self-evaluated their Spanish variety as
poor due to the limited literacy instruction they had received in the language and the low
education and socioeconomic status of their families. They also regarded the Spanish
variety from Spain to be more proper and educated. Students particularly resented the
instructors’ corrections over their Spanish, which very often involved corrections over the
non-standard forms in their variety of Spanish. Yet, students found themselves at an
advantage over their SFL peers in the areas of fluency, pronunciation and comprehension.
They found disadvantages though, in the areas of grammar rules and often received lower
77
grades than SFL learners. The two main conclusions of the study offered by the author
are that HL learners feel inferior to their FL classmates despite their high level of
proficiency and students see the instructors’ corrections as an indication of their poor
proficiency in Spanish. This may have direct implications for their language and cultural
identity.
Contradicting results were found by Beckstead and Toribio (2003) who conducted
a study that examined 28 SHL learners’ history, attitudes, use, and other cultural aspects
in a junior high school in California. This four-part study involved qualitative and
quantitative components that included extensive analysis of the students’ language
background, self-reported language proficiency and use, language attitude and their
motivation toward the Spanish and English languages. The attitudinal component of the
survey found that students find learning English necessary for academic and professional
success while they consider Spanish maintenance essential for their identity. They also
understand the need to learn academic content in Spanish to master the core curriculum.
These results, however, should be interpreted with caution since the sample population
was drawn from ESL classes. These students, mostly Spanish dominant, are probably
different with respect to their attitudes, values, and language use from HL students taking
Spanish classes who are English-dominant. Further, a majority of the students have spent
at least half of their lives in a Spanish-speaking country, given that 21 of the students had
a length of residence from .4 to 7 years while only 4 were born in the U.S. These
characteristics should be kept in mind when determining the applicability of these results
for the rest of the population of HL learners.
78
A recent newspaper article discusses the emotional struggles Hispanic students go
through as non-speakers of Spanish and learning in FL classes. Wingett and Meléndez
(2003) report on the emotional problems that English-only speaking Latinos living in
Arizona frequently experience. As one student commented: "Sometimes I'm looked down
upon by people who speak Spanish from my neighborhood," …"It's like I'm less of a
Chicano than them because I don't speak the language." The authors note that one of the
main barriers for these students, eager to reconnect with their Latino culture, is their lack
of proficiency in Spanish. “Many Latinos said the price they pay for not speaking
Spanish is high. They have fewer job opportunities; broken ties with their culture; an
inability to speak with grandparents; and feelings of shame and embarrassment when
taking Spanish 101.”
The studies surveyed overwhelmingly show that HL learners have a low-self
esteem about their Spanish competencies and negative attitudes toward their Spanish
variety. This disposition does not bode well for the learners’ maintenance of Spanish if it
translates into a very restricted use of Spanish outside of class. On the other hand,
students’ motivation to learn Spanish has surfaced in all studies as well as their rich
environment full of opportunities for contact with the language. It still remains to be seen
how these factors combine to determine the learners’ linguistic choices in and outside of
the classroom. The FL classroom appears to be, at least from a students’ perspective, an
inadequate learning environment to fulfill their affective and language needs.
79
Conclusion
The review of the literature presented in this chapter shows that the HLE field is
in its infancy at this point. While many areas still need to be explored, two lines of
research are of crucial importance to ensure the effective implementation of the new HL
courses that are being created throughout the United States: HL pedagogy and HL
development. These two last areas have received scant attention from HLE researchers,
who have concentrated predominantly on sociolinguistic and literacy issues. This study
attempts to make a contribution by examining the pedagogical needs of receptive
bilinguals who are taking Spanish language courses. It will also examine their language
development and assess the effects of two types of curriculum in that development. The
next chapter presents a detailed account of the design of the study, its subjects, the data
collection instruments, and the coding and analysis procedures that will be used to
examine the data.
80
CHAPTER 3: METHODOLOGY
Introduction
As stated in chapter 1, the purpose of the present study is to determine the effects
of two different types of curricula on the HL learners’ linguistic development and other
language related variables. More specifically, this study seeks to examine if there are any
differences between SHL learners enrolled in the HL track, those enrolled in the FL track,
and FL learners enrolled in the FL track with respect to gains in linguistic development,
language attitude, amount of language use, self-confidence, and self-assessment of their
language competencies after one semester of language instruction. Furthermore, the
present study attempts to examine the linguistic differences between HL and FL learners.
In addition, the learners’ perceptions as to how the FL or HL curriculum has met their
learning needs together with their level of satisfaction with the language course will be
analyzed. The following research questions, presented in chapter 1, are repeated here:
1. What is the linguistic and cultural profile of SHL learners enrolled in the
SFL and SHL tracks?
1.a What is their family’s cultural and language background, theirown cultural and language background, their childhood contact withSpanish, and their current Spanish/English language use andpreference?
1.b What is their motivation to study Spanish and their attitudestowards the Spanish language?
1.c Are there any profile differences between the SHL learnersenrolled in the SHL track and the SFL track? How do they differfrom SFL learners in the SFL track?
81
2. What differential gains are there between the SHL learners enrolled in the
SHL track, those SHL learners enrolled in the SFL track and SFL learners
enrolled in the SFL track after one semester of instruction?
2.a To what extent do the students differ in their language outputdevelopment in measures of fluency, accuracy, and complexity?
2.b What differences are there with respect to Spanish languageattitude, amount of language use, confidence, and self-assessment oflanguage competencies?
3. What are some of the linguistic differences between the groups of SHL
and SFL learners?
4. What are the students’ perceptions of their Spanish language course?
4.a What is the level of satisfaction of the three different groups withthe course content and materials?
4.b To what extent does the SFL or SHL curriculum meet the needsof SHL learners as perceived by the students?
The remainder of this chapter provides a detailed description of the research
setting for this study. It begins with an overview of HL programs in the American
Southwest to provide a broader context for the HL program at the University of Arizona.
It then describes the specific setting of the study through a detailed depiction of the HL
program and the HL and FL tracks at the university. This section concludes with a
detailed description of the curriculum for the courses involved in this study: Spanish 102
in the FL track and Spanish 103 in the HL track. The next section deals with the subjects
in this study and the selection criteria established for student participation. The following
section focuses on the research design, including the research procedures, and data
82
collection instruments. The last section is concerned with the data coding procedures to
be used to analyze the language samples.
Research Setting
SHL programs in the American Southwest
An analysis of the number of SHL courses offered by colleges and universities in
the American Southwest was undertaken in an effort to determine the distribution of
schools that offer specialized Spanish courses for HL learners, including courses for
receptive bilinguals. States included as part of the American Southwest were Arizona,
California, Colorado, Nevada, New Mexico, Oklahoma, Texas and Utah. University
selection was based on Carnegie Foundation Classification as of the year 2000. Only
four-year institutions classified as BA AA, BA Gen, BA LA, MA I, MA II, Dr Ext and
Dr Int were included. The colleges and universities used in the study had to have a
Hispanic population of at least 5% of total enrollment at the undergraduate level. The
majority of the statistics for undergraduate enrollment population and ethnicity
percentage were based on information provided to U.S. News and World Report for the
2003-2004 academic year, with the remaining figures obtained from various internet
sources.
An extensive web search of language and Spanish department websites as well as
school course catalogs was performed to find Spanish language courses for HL learners.
Only courses that stated to be for HL learners (and all its various denominations) were
included. All universities surveyed had comprehensive course catalogs so it is assumed
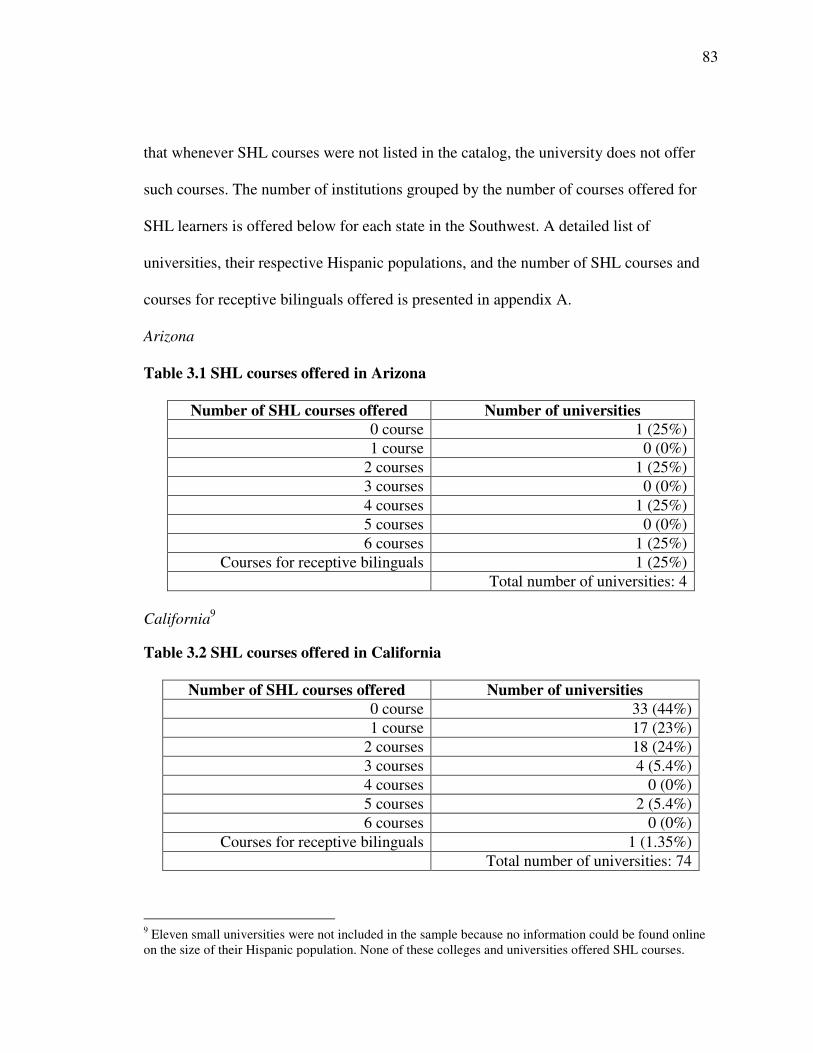
83
that whenever SHL courses were not listed in the catalog, the university does not offer
such courses. The number of institutions grouped by the number of courses offered for
SHL learners is offered below for each state in the Southwest. A detailed list of
universities, their respective Hispanic populations, and the number of SHL courses and
courses for receptive bilinguals offered is presented in appendix A.
Arizona
Table 3.1 SHL courses offered in Arizona
Number of SHL courses offered Number of universities0 course 1 (25%)1 course 0 (0%)
2 courses 1 (25%)3 courses 0 (0%)4 courses 1 (25%)5 courses 0 (0%)6 courses 1 (25%)
Courses for receptive bilinguals 1 (25%)Total number of universities: 4
California9
Table 3.2 SHL courses offered in California
Number of SHL courses offered Number of universities0 course 33 (44%)1 course 17 (23%)
2 courses 18 (24%)3 courses 4 (5.4%)4 courses 0 (0%)5 courses 2 (5.4%)6 courses 0 (0%)
Courses for receptive bilinguals 1 (1.35%)Total number of universities: 74
9 Eleven small universities were not included in the sample because no information could be found onlineon the size of their Hispanic population. None of these colleges and universities offered SHL courses.
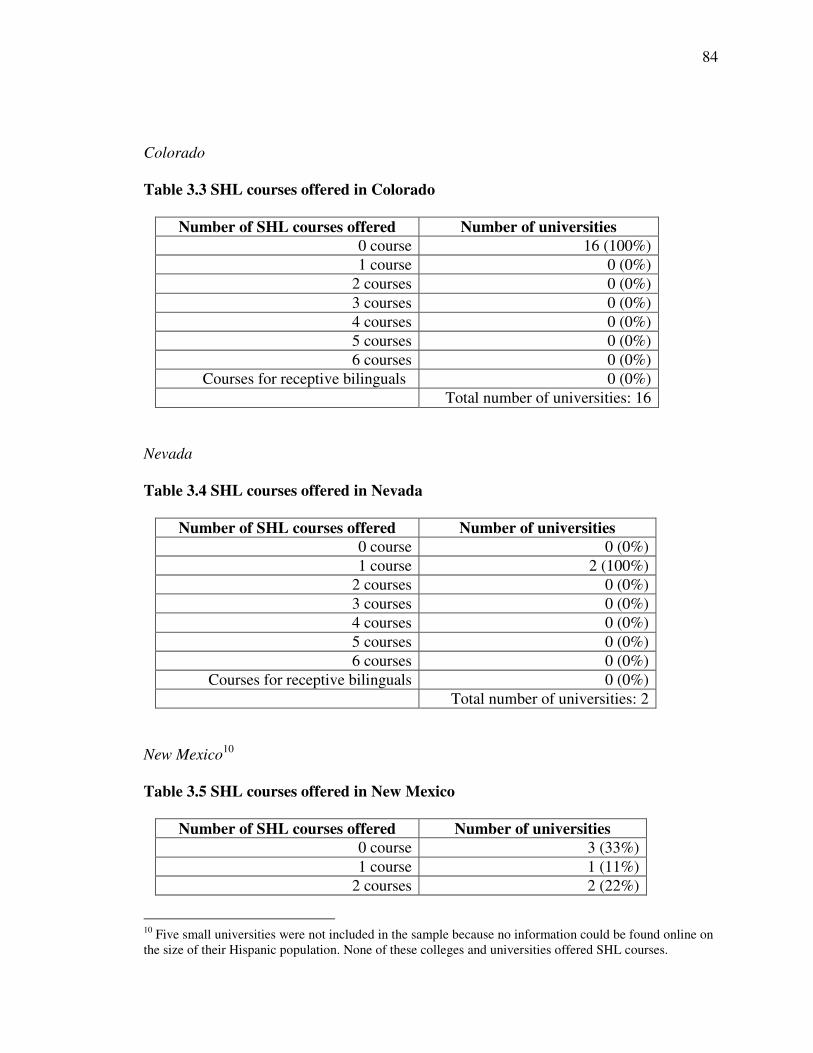
84
Colorado
Table 3.3 SHL courses offered in Colorado
Number of SHL courses offered Number of universities0 course 16 (100%)1 course 0 (0%)
2 courses 0 (0%)3 courses 0 (0%)4 courses 0 (0%)5 courses 0 (0%)6 courses 0 (0%)
Courses for receptive bilinguals 0 (0%)Total number of universities: 16
Nevada
Table 3.4 SHL courses offered in Nevada
Number of SHL courses offered Number of universities0 course 0 (0%)1 course 2 (100%)
2 courses 0 (0%)3 courses 0 (0%)4 courses 0 (0%)5 courses 0 (0%)6 courses 0 (0%)
Courses for receptive bilinguals 0 (0%)Total number of universities: 2
New Mexico10
Table 3.5 SHL courses offered in New Mexico
Number of SHL courses offered Number of universities0 course 3 (33%)1 course 1 (11%)
2 courses 2 (22%)
10 Five small universities were not included in the sample because no information could be found online onthe size of their Hispanic population. None of these colleges and universities offered SHL courses.
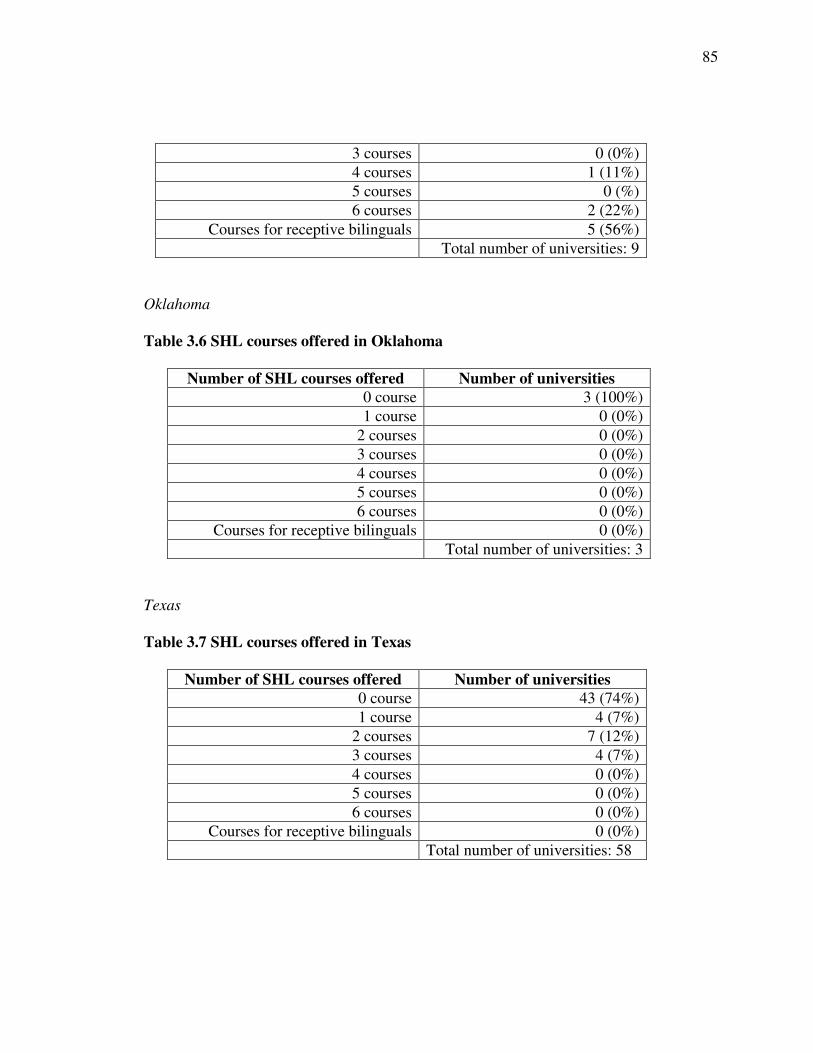
85
3 courses 0 (0%)4 courses 1 (11%)5 courses 0 (%)6 courses 2 (22%)
Courses for receptive bilinguals 5 (56%)Total number of universities: 9
Oklahoma
Table 3.6 SHL courses offered in Oklahoma
Number of SHL courses offered Number of universities0 course 3 (100%)1 course 0 (0%)
2 courses 0 (0%)3 courses 0 (0%)4 courses 0 (0%)5 courses 0 (0%)6 courses 0 (0%)
Courses for receptive bilinguals 0 (0%)Total number of universities: 3
Texas
Table 3.7 SHL courses offered in Texas
Number of SHL courses offered Number of universities0 course 43 (74%)1 course 4 (7%)
2 courses 7 (12%)3 courses 4 (7%)4 courses 0 (0%)5 courses 0 (0%)6 courses 0 (0%)
Courses for receptive bilinguals 0 (0%)Total number of universities: 58
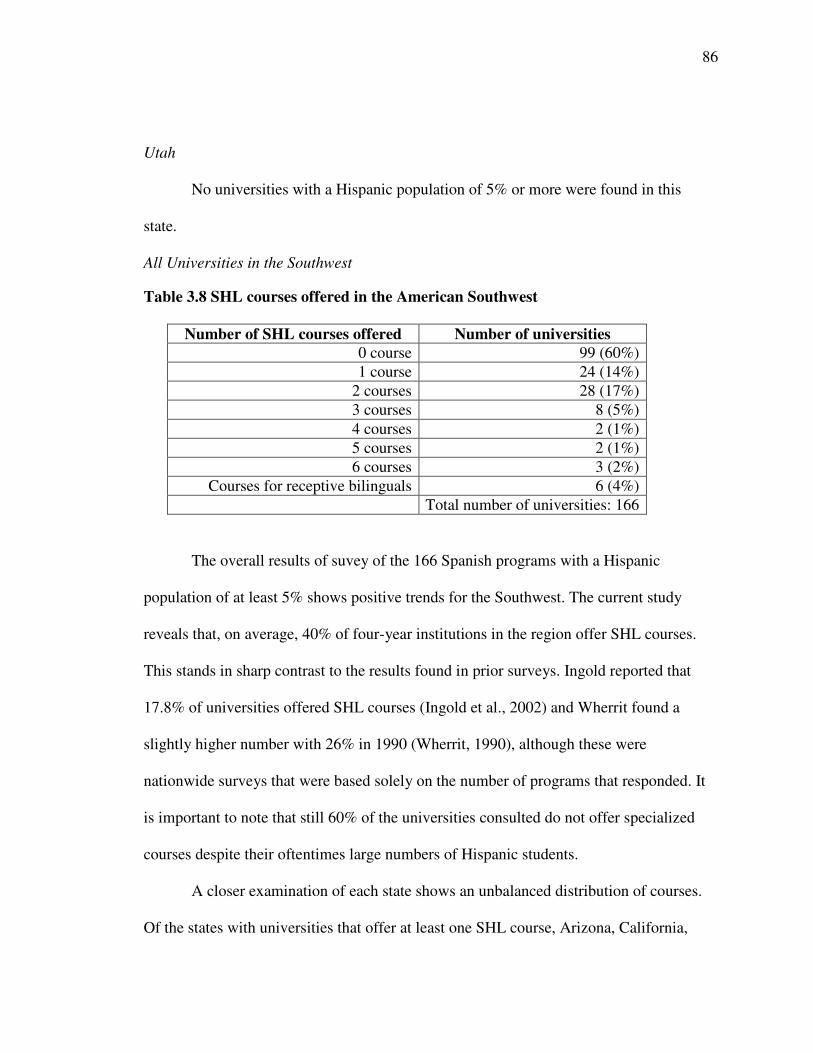
86
Utah
No universities with a Hispanic population of 5% or more were found in this
state.
All Universities in the Southwest
Table 3.8 SHL courses offered in the American Southwest
Number of SHL courses offered Number of universities0 course 99 (60%)1 course 24 (14%)
2 courses 28 (17%)3 courses 8 (5%)4 courses 2 (1%)5 courses 2 (1%)6 courses 3 (2%)
Courses for receptive bilinguals 6 (4%)Total number of universities: 166
The overall results of suvey of the 166 Spanish programs with a Hispanic
population of at least 5% shows positive trends for the Southwest. The current study
reveals that, on average, 40% of four-year institutions in the region offer SHL courses.
This stands in sharp contrast to the results found in prior surveys. Ingold reported that
17.8% of universities offered SHL courses (Ingold et al., 2002) and Wherrit found a
slightly higher number with 26% in 1990 (Wherrit, 1990), although these were
nationwide surveys that were based solely on the number of programs that responded. It
is important to note that still 60% of the universities consulted do not offer specialized
courses despite their oftentimes large numbers of Hispanic students.
A closer examination of each state shows an unbalanced distribution of courses.
Of the states with universities that offer at least one SHL course, Arizona, California,
87
Nevada, and New Mexico rank at the top with 75%, 77%, 100%, and 77% respectively.
On the other hand, Colorado, Oklahoma, and Texas lie far behind in their SHL course
offerings with 0% for both Colorado and Oklahoma and 36% for Texas. A look at the
diversity of courses offered shows that a majority of universities offer 2 courses (17%),
followed by universities offering 1 course (14%). Universities offering a more diverse
curriculum for HL learners are the minority with only 5% offering 3 courses, 1 %
offering 4 courses, 1% offering 5, and 2% offering 6.
An interesting finding is that the offering of an SHL course does not necessarily
correspond with the number of Hispanic students enrolled at the university. For example,
there are at least 11 universities with less than 260 Hispanic students in Arizona,
California, New Mexico, and Texas that offer at least one course. On the contrary, there
are at least 9 universities with more than 2000 Hispanic students that do not offer courses
at all. The commitment to meet the special language needs of the Hispanic population
does not seem to be influenced by the presence of large numbers of students. Other
factors may be at play such as the availability of funding, trained instructors, and interest
in taking Spanish classes from Hispanic students (Ingold et al., 2002).
Regarding specialized courses for receptive bilinguals results are less positive in
the Southwest. Only seven of the 67 universities that offer SHL courses provide
specialized instruction for bilingual students with receptive abilities in the language.
The HL program at the University of Arizona
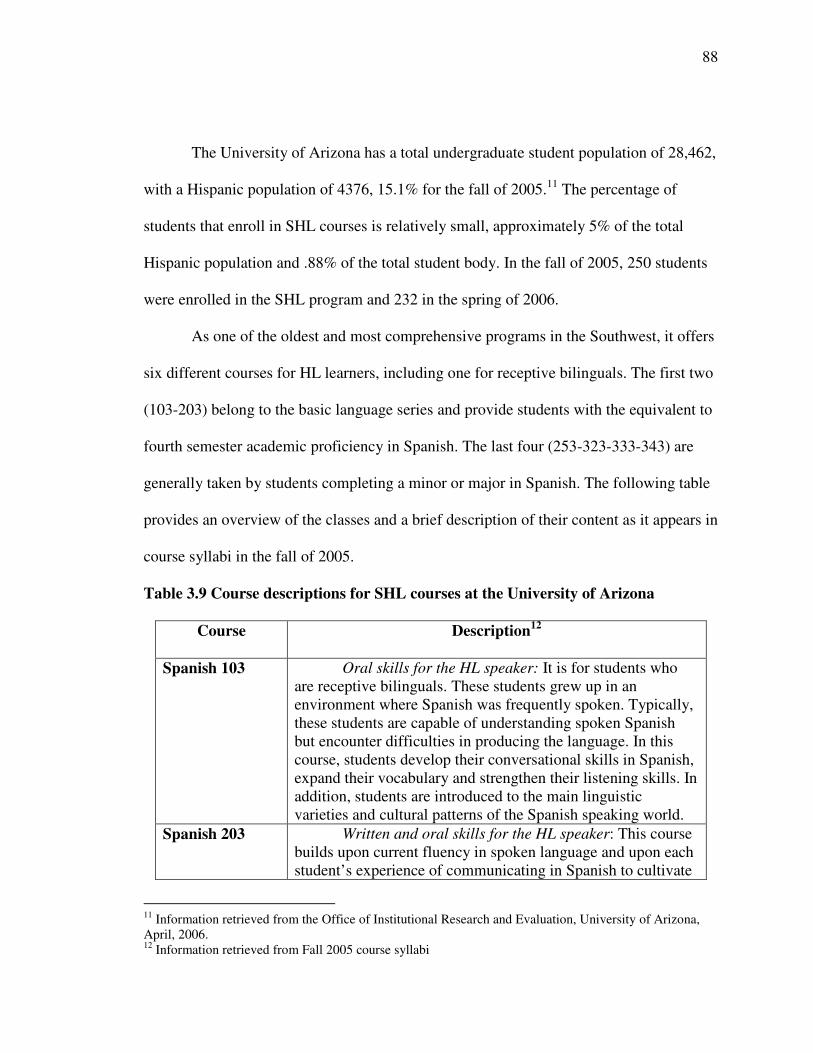
88
The University of Arizona has a total undergraduate student population of 28,462,
with a Hispanic population of 4376, 15.1% for the fall of 2005.11 The percentage of
students that enroll in SHL courses is relatively small, approximately 5% of the total
Hispanic population and .88% of the total student body. In the fall of 2005, 250 students
were enrolled in the SHL program and 232 in the spring of 2006.
As one of the oldest and most comprehensive programs in the Southwest, it offers
six different courses for HL learners, including one for receptive bilinguals. The first two
(103-203) belong to the basic language series and provide students with the equivalent to
fourth semester academic proficiency in Spanish. The last four (253-323-333-343) are
generally taken by students completing a minor or major in Spanish. The following table
provides an overview of the classes and a brief description of their content as it appears in
course syllabi in the fall of 2005.
Table 3.9 Course descriptions for SHL courses at the University of Arizona
Course Description12
Spanish 103 Oral skills for the HL speaker: It is for students whoare receptive bilinguals. These students grew up in anenvironment where Spanish was frequently spoken. Typically,these students are capable of understanding spoken Spanishbut encounter difficulties in producing the language. In thiscourse, students develop their conversational skills in Spanish,expand their vocabulary and strengthen their listening skills. Inaddition, students are introduced to the main linguisticvarieties and cultural patterns of the Spanish speaking world.
Spanish 203 Written and oral skills for the HL speaker: This coursebuilds upon current fluency in spoken language and upon eachstudent’s experience of communicating in Spanish to cultivate
11 Information retrieved from the Office of Institutional Research and Evaluation, University of Arizona,April, 2006.12 Information retrieved from Fall 2005 course syllabi
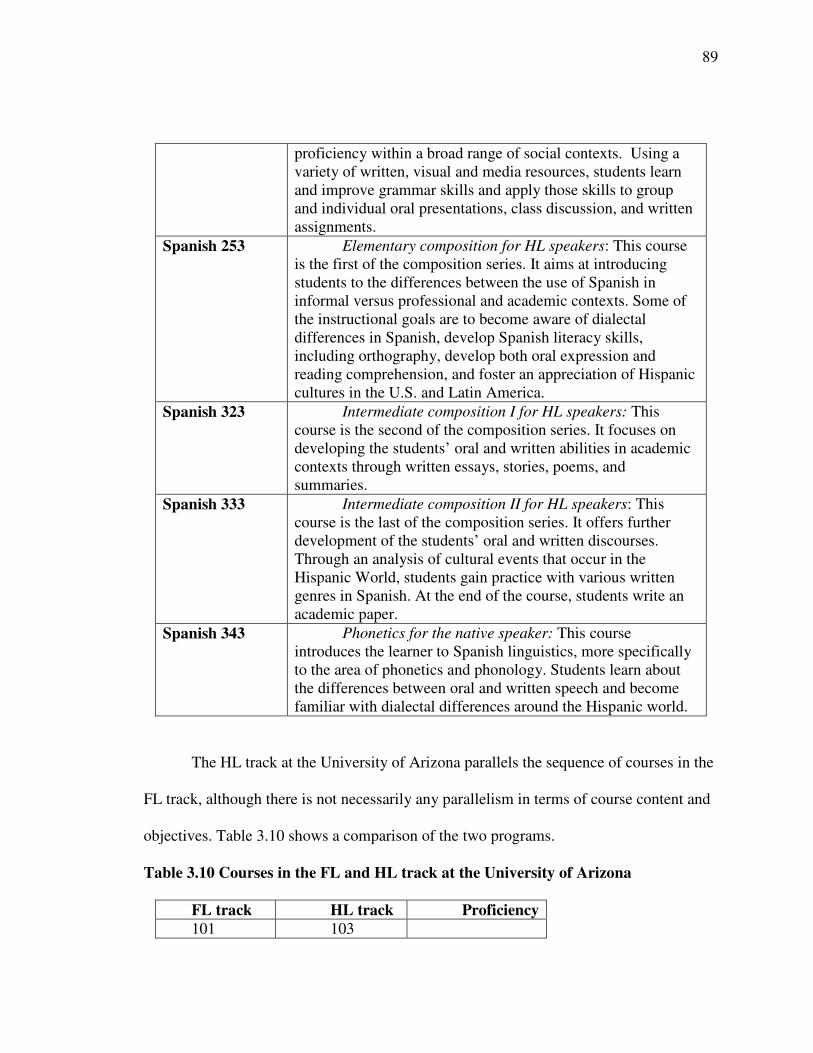
89
proficiency within a broad range of social contexts. Using avariety of written, visual and media resources, students learnand improve grammar skills and apply those skills to groupand individual oral presentations, class discussion, and writtenassignments.
Spanish 253 Elementary composition for HL speakers: This courseis the first of the composition series. It aims at introducingstudents to the differences between the use of Spanish ininformal versus professional and academic contexts. Some ofthe instructional goals are to become aware of dialectaldifferences in Spanish, develop Spanish literacy skills,including orthography, develop both oral expression andreading comprehension, and foster an appreciation of Hispaniccultures in the U.S. and Latin America.
Spanish 323 Intermediate composition I for HL speakers: Thiscourse is the second of the composition series. It focuses ondeveloping the students’ oral and written abilities in academiccontexts through written essays, stories, poems, andsummaries.
Spanish 333 Intermediate composition II for HL speakers: Thiscourse is the last of the composition series. It offers furtherdevelopment of the students’ oral and written discourses.Through an analysis of cultural events that occur in theHispanic World, students gain practice with various writtengenres in Spanish. At the end of the course, students write anacademic paper.
Spanish 343 Phonetics for the native speaker: This courseintroduces the learner to Spanish linguistics, more specificallyto the area of phonetics and phonology. Students learn aboutthe differences between oral and written speech and becomefamiliar with dialectal differences around the Hispanic world.
The HL track at the University of Arizona parallels the sequence of courses in the
FL track, although there is not necessarily any parallelism in terms of course content and
objectives. Table 3.10 shows a comparison of the two programs.
Table 3.10 Courses in the FL and HL track at the University of Arizona
FL track HL track Proficiency101 103
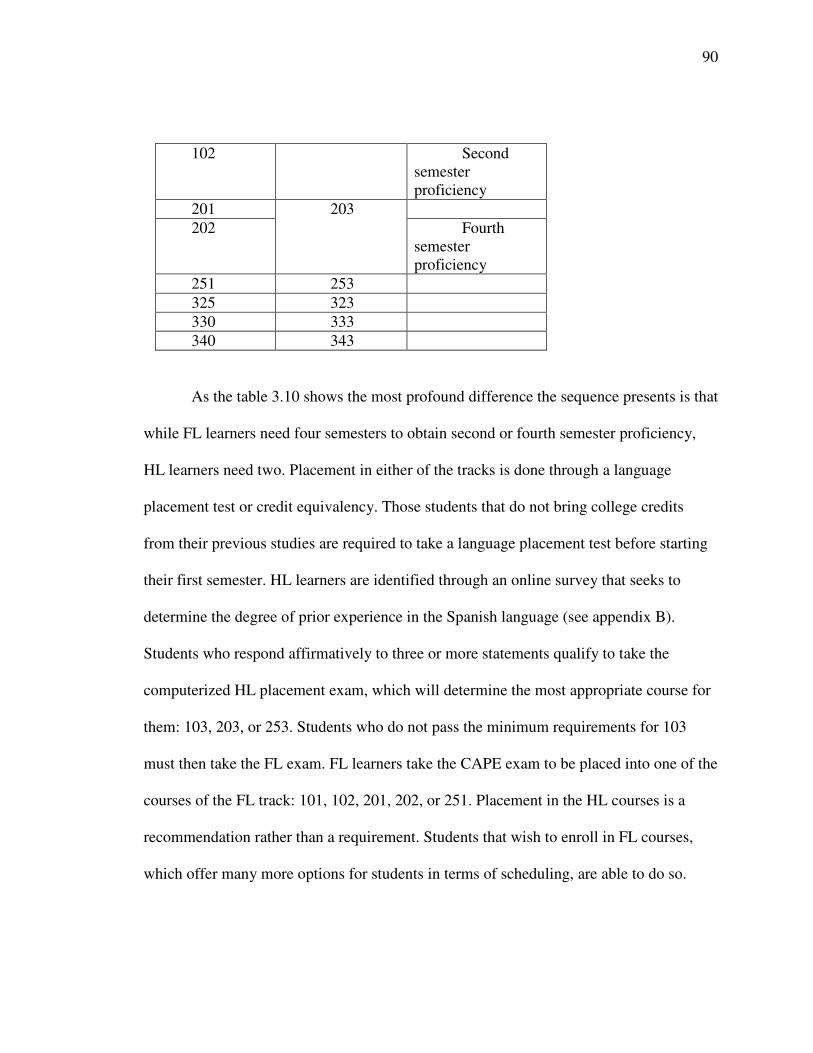
90
102 Secondsemesterproficiency
201202
203Fourth
semesterproficiency
251 253325 323330 333340 343
As the table 3.10 shows the most profound difference the sequence presents is that
while FL learners need four semesters to obtain second or fourth semester proficiency,
HL learners need two. Placement in either of the tracks is done through a language
placement test or credit equivalency. Those students that do not bring college credits
from their previous studies are required to take a language placement test before starting
their first semester. HL learners are identified through an online survey that seeks to
determine the degree of prior experience in the Spanish language (see appendix B).
Students who respond affirmatively to three or more statements qualify to take the
computerized HL placement exam, which will determine the most appropriate course for
them: 103, 203, or 253. Students who do not pass the minimum requirements for 103
must then take the FL exam. FL learners take the CAPE exam to be placed into one of the
courses of the FL track: 101, 102, 201, 202, or 251. Placement in the HL courses is a
recommendation rather than a requirement. Students that wish to enroll in FL courses,
which offer many more options for students in terms of scheduling, are able to do so.
91
The FL and HL Curriculum of Spanish 102 and 103
It is essential for this study to determine the curricular differences between the FL
and HL courses before the results can be interpreted. To this end, an analysis of four
different sources was conducted to establish major differences: course syllabi, course
tests, course information online, and interviews with one teacher in each of the tracks.
The following section addresses differences in course objectives, course requirements,
course and grammar topics, and course tests.
Spanish 103 (HL track) uses the book for HL learners El mundo 21 hispano, a
textbook originally designed for FL learners and later adapted for HL learners, and
Spanish 102 uses ¡Dímelo tú!, a textbook for FL learners. One section of Spanish 103
was offered in the fall of 2005 and one was offered in the spring of 2006. For Spanish
102, however, 62 sections were offered in the fall and 38 in the spring. All sections of
Spanish 102 have a common curriculum, including a common day-by-day list of
assignments, topics, grammar structures, and number of book and workbook pages to be
covered for each unit. These guidelines are mandatory and are determined by the Spanish
department. In addition, all sections give common written tests that are also designed and
distributed by the department. Instructors do not see the test until the day they administer
it. The centralized approach that has been adopted for this course considerably reduces
variation among sections. The potential differences that may exist among the various
sections of a same course are lessened by the strict unification of expectations,
guidelines, requirements, and assignments. The close adherence from each instructor to
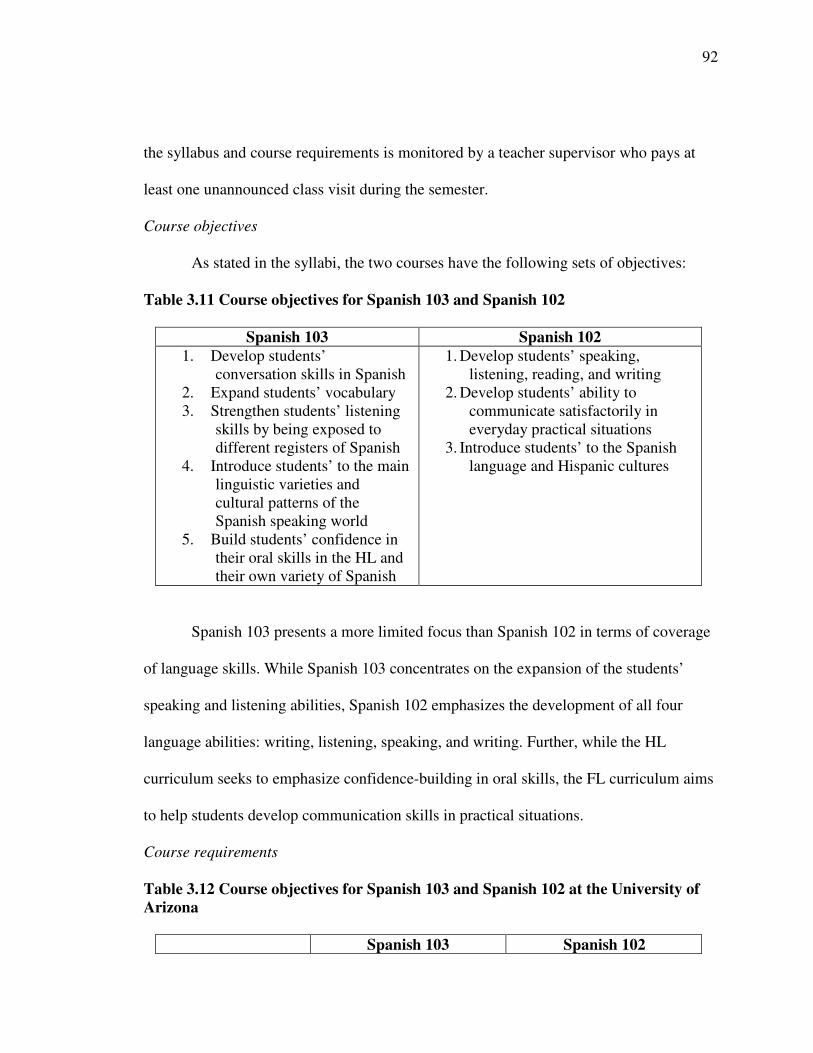
92
the syllabus and course requirements is monitored by a teacher supervisor who pays at
least one unannounced class visit during the semester.
Course objectives
As stated in the syllabi, the two courses have the following sets of objectives:
Table 3.11 Course objectives for Spanish 103 and Spanish 102
Spanish 103 Spanish 1021. Develop students’
conversation skills in Spanish2. Expand students’ vocabulary3. Strengthen students’ listening
skills by being exposed todifferent registers of Spanish
4. Introduce students’ to the mainlinguistic varieties andcultural patterns of theSpanish speaking world
5. Build students’ confidence intheir oral skills in the HL andtheir own variety of Spanish
1. Develop students’ speaking,listening, reading, and writing
2. Develop students’ ability tocommunicate satisfactorily ineveryday practical situations
3. Introduce students’ to the Spanishlanguage and Hispanic cultures
Spanish 103 presents a more limited focus than Spanish 102 in terms of coverage
of language skills. While Spanish 103 concentrates on the expansion of the students’
speaking and listening abilities, Spanish 102 emphasizes the development of all four
language abilities: writing, listening, speaking, and writing. Further, while the HL
curriculum seeks to emphasize confidence-building in oral skills, the FL curriculum aims
to help students develop communication skills in practical situations.
Course requirements
Table 3.12 Course objectives for Spanish 103 and Spanish 102 at the University ofArizona
Spanish 103 Spanish 102
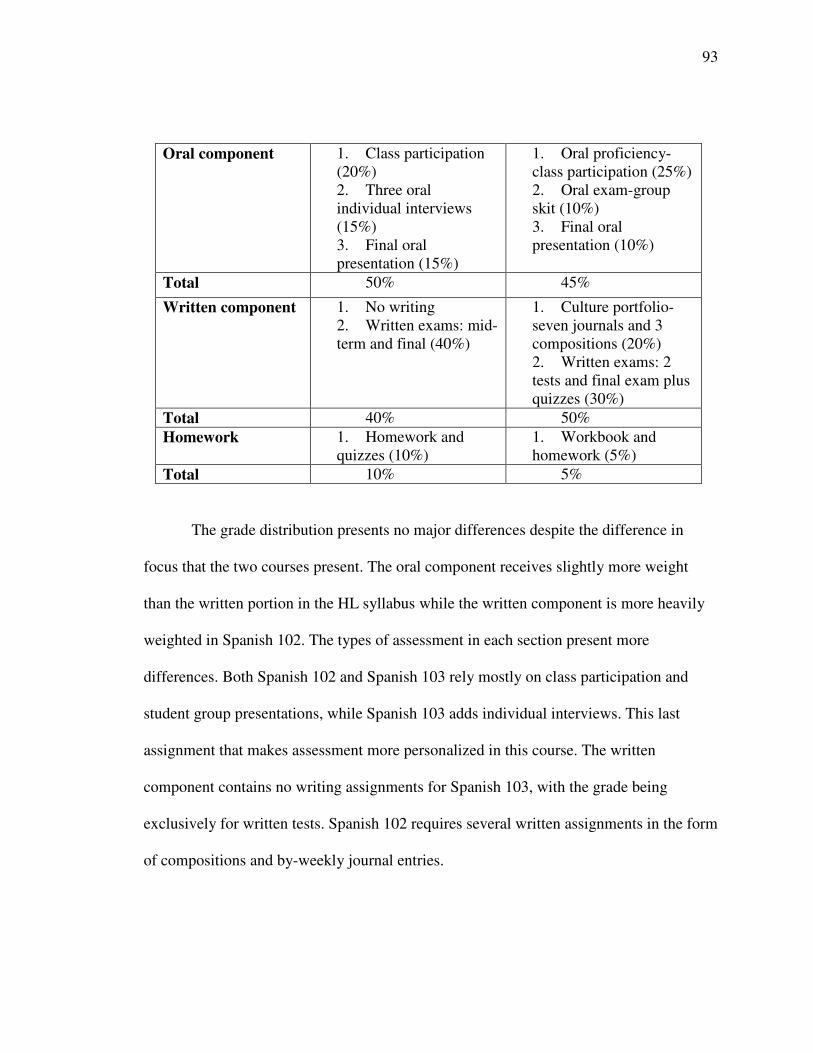
93
Oral component 1. Class participation(20%)2. Three oralindividual interviews(15%)3. Final oralpresentation (15%)
1. Oral proficiency-class participation (25%)2. Oral exam-groupskit (10%)3. Final oralpresentation (10%)
Total 50% 45%
Written component 1. No writing2. Written exams: mid-term and final (40%)
1. Culture portfolio-seven journals and 3compositions (20%)2. Written exams: 2tests and final exam plusquizzes (30%)
Total 40% 50%Homework 1. Homework and
quizzes (10%)1. Workbook andhomework (5%)
Total 10% 5%
The grade distribution presents no major differences despite the difference in
focus that the two courses present. The oral component receives slightly more weight
than the written portion in the HL syllabus while the written component is more heavily
weighted in Spanish 102. The types of assessment in each section present more
differences. Both Spanish 102 and Spanish 103 rely mostly on class participation and
student group presentations, while Spanish 103 adds individual interviews. This last
assignment that makes assessment more personalized in this course. The written
component contains no writing assignments for Spanish 103, with the grade being
exclusively for written tests. Spanish 102 requires several written assignments in the form
of compositions and by-weekly journal entries.
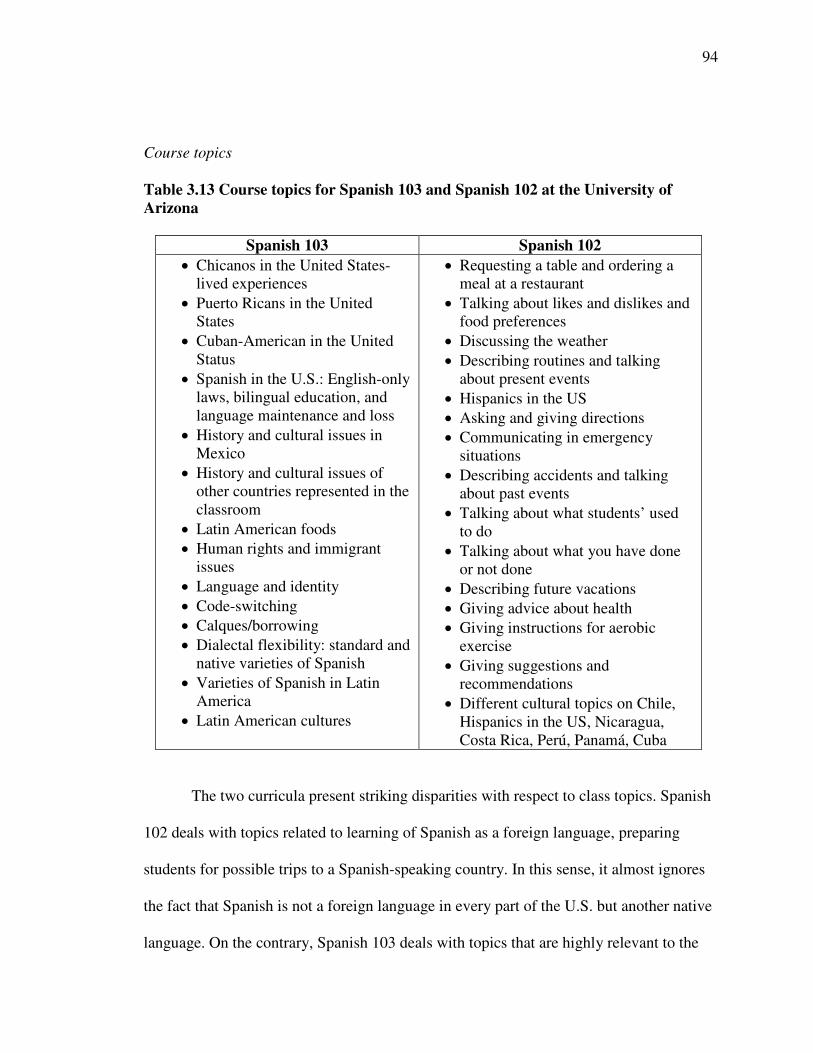
94
Course topics
Table 3.13 Course topics for Spanish 103 and Spanish 102 at the University ofArizona
Spanish 103 Spanish 102• Chicanos in the United States-
lived experiences• Puerto Ricans in the United
States• Cuban-American in the United
Status• Spanish in the U.S.: English-only
laws, bilingual education, andlanguage maintenance and loss
• History and cultural issues inMexico
• History and cultural issues ofother countries represented in theclassroom
• Latin American foods• Human rights and immigrant
issues• Language and identity• Code-switching• Calques/borrowing• Dialectal flexibility: standard and
native varieties of Spanish• Varieties of Spanish in Latin
America• Latin American cultures
• Requesting a table and ordering ameal at a restaurant
• Talking about likes and dislikes andfood preferences
• Discussing the weather• Describing routines and talking
about present events• Hispanics in the US• Asking and giving directions• Communicating in emergency
situations• Describing accidents and talking
about past events• Talking about what students’ used
to do• Talking about what you have done
or not done• Describing future vacations• Giving advice about health• Giving instructions for aerobic
exercise• Giving suggestions and
recommendations• Different cultural topics on Chile,
Hispanics in the US, Nicaragua,Costa Rica, Perú, Panamá, Cuba
The two curricula present striking disparities with respect to class topics. Spanish
102 deals with topics related to learning of Spanish as a foreign language, preparing
students for possible trips to a Spanish-speaking country. In this sense, it almost ignores
the fact that Spanish is not a foreign language in every part of the U.S. but another native
language. On the contrary, Spanish 103 deals with topics that are highly relevant to the
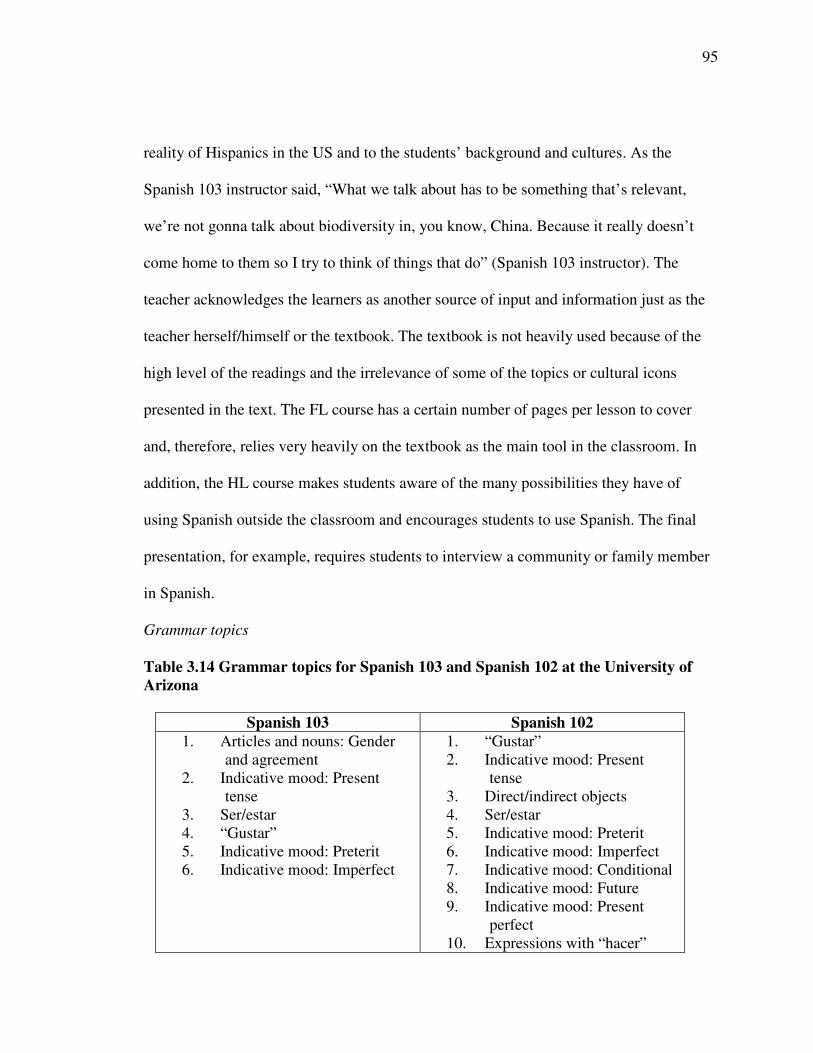
95
reality of Hispanics in the US and to the students’ background and cultures. As the
Spanish 103 instructor said, “What we talk about has to be something that’s relevant,
we’re not gonna talk about biodiversity in, you know, China. Because it really doesn’t
come home to them so I try to think of things that do” (Spanish 103 instructor). The
teacher acknowledges the learners as another source of input and information just as the
teacher herself/himself or the textbook. The textbook is not heavily used because of the
high level of the readings and the irrelevance of some of the topics or cultural icons
presented in the text. The FL course has a certain number of pages per lesson to cover
and, therefore, relies very heavily on the textbook as the main tool in the classroom. In
addition, the HL course makes students aware of the many possibilities they have of
using Spanish outside the classroom and encourages students to use Spanish. The final
presentation, for example, requires students to interview a community or family member
in Spanish.
Grammar topics
Table 3.14 Grammar topics for Spanish 103 and Spanish 102 at the University ofArizona
Spanish 103 Spanish 1021. Articles and nouns: Gender
and agreement2. Indicative mood: Present
tense3. Ser/estar4. “Gustar”5. Indicative mood: Preterit6. Indicative mood: Imperfect
1. “Gustar”2. Indicative mood: Present
tense3. Direct/indirect objects4. Ser/estar5. Indicative mood: Preterit6. Indicative mood: Imperfect7. Indicative mood: Conditional8. Indicative mood: Future9. Indicative mood: Present
perfect10. Expressions with “hacer”
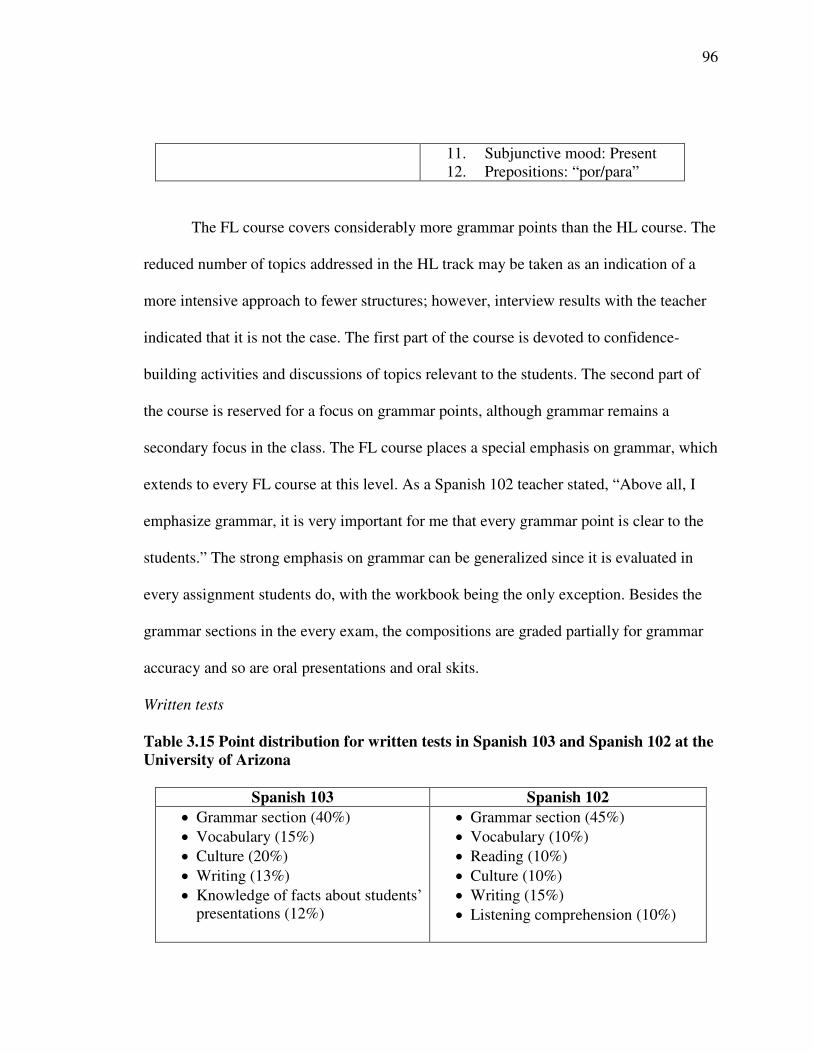
96
11. Subjunctive mood: Present12. Prepositions: “por/para”
The FL course covers considerably more grammar points than the HL course. The
reduced number of topics addressed in the HL track may be taken as an indication of a
more intensive approach to fewer structures; however, interview results with the teacher
indicated that it is not the case. The first part of the course is devoted to confidence-
building activities and discussions of topics relevant to the students. The second part of
the course is reserved for a focus on grammar points, although grammar remains a
secondary focus in the class. The FL course places a special emphasis on grammar, which
extends to every FL course at this level. As a Spanish 102 teacher stated, “Above all, I
emphasize grammar, it is very important for me that every grammar point is clear to the
students.” The strong emphasis on grammar can be generalized since it is evaluated in
every assignment students do, with the workbook being the only exception. Besides the
grammar sections in the every exam, the compositions are graded partially for grammar
accuracy and so are oral presentations and oral skits.
Written tests
Table 3.15 Point distribution for written tests in Spanish 103 and Spanish 102 at theUniversity of Arizona
Spanish 103 Spanish 102• Grammar section (40%)• Vocabulary (15%)• Culture (20%)• Writing (13%)• Knowledge of facts about students’
presentations (12%)
• Grammar section (45%)• Vocabulary (10%)• Reading (10%)• Culture (10%)• Writing (15%)• Listening comprehension (10%)
97
The topics and format of the written test is a point of similarity between the two
tracks. The only difference is the lack of a reading section in the Spanish 103 test. In
addition, the format of each section is strikingly similar. Grammar is tested through fill-
in-the-blanks exercises, culture through multiple choice or true-or-false exercises, and
vocabulary through matching activities. The 103 test includes more question-answer
exercises for grammar testing than the 102 test.
The comparative analysis of the curriculum of the HL and FL course shows that
the main difference between Spanish 103 and 102 lies in the perspective adopted for each
class. While the FL course presents the culture as a foreign culture and practices the
language from a foreigner or tourist perspective, Spanish 103 teaches cultures and
language situations from an insider perspective. It addresses topics that are relevant to the
students’ backgrounds and uses the textbook as another tool in the class and not as the
main instructional material. The students themselves and the cultural and language
knowledge they bring to the classroom are another important teaching tool in the class.
Spanish 102 relies more heavily on the textbook and the teaching of grammar while
practicing the four language skills.
Foreign language instructors
For this study, the subjects taking the FL course were enrolled in 12 different
Spanish 102 sections taught by 12 instructors. Among these instructors, there were 7
native-speakers and 5 non-native speakers, either master’s or PhD students in Second
Language Acquisition and Teaching, Hispanic Linguistics, Literature, Border Studies,
98
Fine Arts, Ecology, and Latin American Studies. All of them had prior experience
teaching the same course: five of them taught it once before, three of them taught it twice
before and four of them taught it three or more times. None of them had experience
teaching HL courses and reported making no differentiations in the classroom to
accommodate HL learners. Several of them reported using a variety of activities to
accommodate the students’ different learning styles in classroom activities. All
instructors had FL teaching experience that ranged from 3 months to 29 years.
The heritage language instructor
The HL instructor is a Ph.D. student in Second Language Acquisition and
Teaching (SLAT) who is a native speaker of Mexican origin and a HL learner. The same
instructor taught the class during the fall semester of 2005, when the first data collection
phase began, and the spring of 2006. This instructor had taught Spanish 103 once prior to
the fall of 2005. In addition, the instructor had three years of Spanish as a FL teaching
experience and 13 years of English as a FL teaching experience. The instructor reported
having received no formal training in HL pedagogy but having read articles on HL
teaching and learning and received academic training in second language acquisition,
bilingualism, and second language teaching methodology.
Subjects
This study engaged subjects enrolled in basic Spanish courses at the University of
Arizona (102 or 103). These classes met four times a week for 50 minutes per day from
Monday through Thursday. Three groups of subjects participated in this study that took
99
place during the Fall of 2005 and Spring of 2006. The first group of subjects consisted of
HL learners enrolled in Spanish 103, the HL course (HLH group). The second was
comprised of students enrolled in Spanish 102, the FL course (HLF group) and the third,
FL learners enrolled in the same Spanish 102 classes (FLF group). Students in the HLH
group were enrolled in one of two courses (one offered in the fall semester and one in the
spring semester). Students in groups 1 and 2 were enrolled in one of the multiple sections
offered of Spanish 102 by the university.
Selection criteria
The comparative nature of this study called for the establishment of very precise
selection criteria that would allow for the creation of homogenous comparison groups of
HL learners. Learners in Spanish 103 had been placed into the HL program by a survey
and a subsequent placement exam or by consent of the instructor. It was necessary then to
find comparable students that were taking Spanish 102. In order to identify them, the
selection process took place in two phases. During the first phase, students in all 102
classes were asked to complete a 5-minute survey designed to identify HL learners (see
appendix B). This survey is the same used in the College of Humanities for the language
placement examination to identify HL learners and is therefore the same survey students
in Spanish 103 took to be placed in this course. The students initially identified as
possible HL learners qualified for the second phase.
During the second phase, students were selected on the basis of two criteria that
when combined, sought to identify HL learners that would be suitable candidates for
taking Spanish 103. The two sets of criteria were: 1) listening proficiency; and 2) early
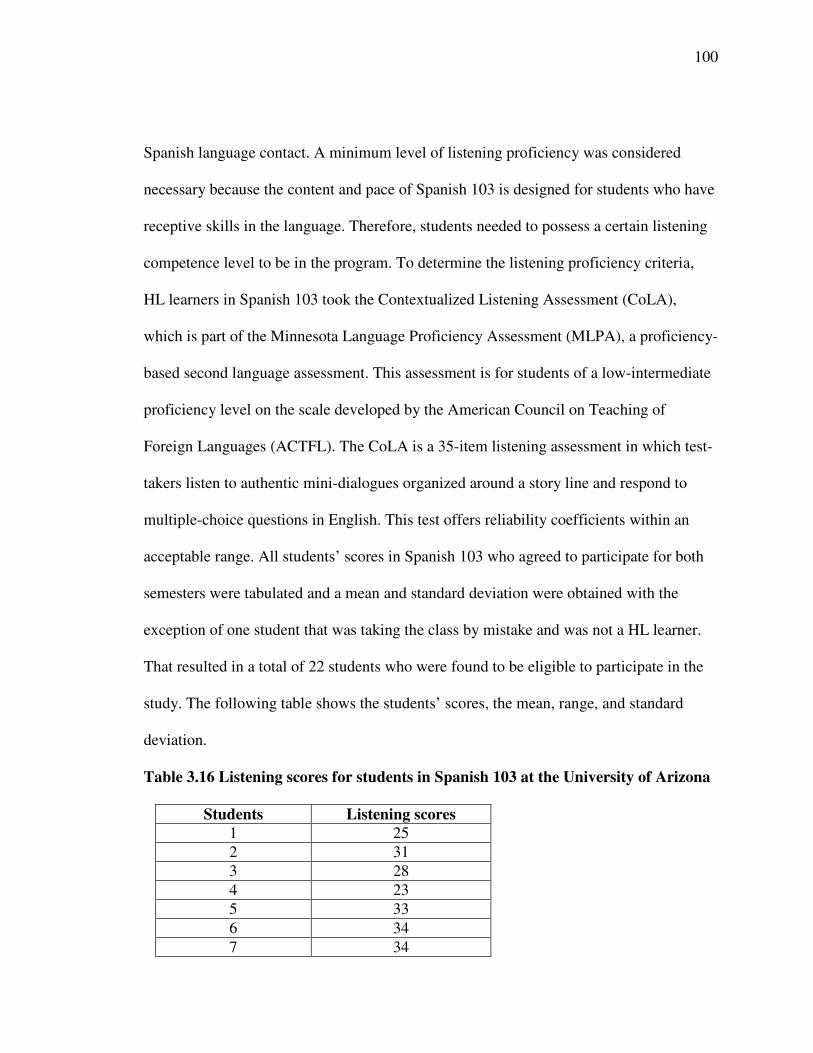
100
Spanish language contact. A minimum level of listening proficiency was considered
necessary because the content and pace of Spanish 103 is designed for students who have
receptive skills in the language. Therefore, students needed to possess a certain listening
competence level to be in the program. To determine the listening proficiency criteria,
HL learners in Spanish 103 took the Contextualized Listening Assessment (CoLA),
which is part of the Minnesota Language Proficiency Assessment (MLPA), a proficiency-
based second language assessment. This assessment is for students of a low-intermediate
proficiency level on the scale developed by the American Council on Teaching of
Foreign Languages (ACTFL). The CoLA is a 35-item listening assessment in which test-
takers listen to authentic mini-dialogues organized around a story line and respond to
multiple-choice questions in English. This test offers reliability coefficients within an
acceptable range. All students’ scores in Spanish 103 who agreed to participate for both
semesters were tabulated and a mean and standard deviation were obtained with the
exception of one student that was taking the class by mistake and was not a HL learner.
That resulted in a total of 22 students who were found to be eligible to participate in the
study. The following table shows the students’ scores, the mean, range, and standard
deviation.
Table 3.16 Listening scores for students in Spanish 103 at the University of Arizona
Students Listening scores1 252 313 284 235 336 347 34
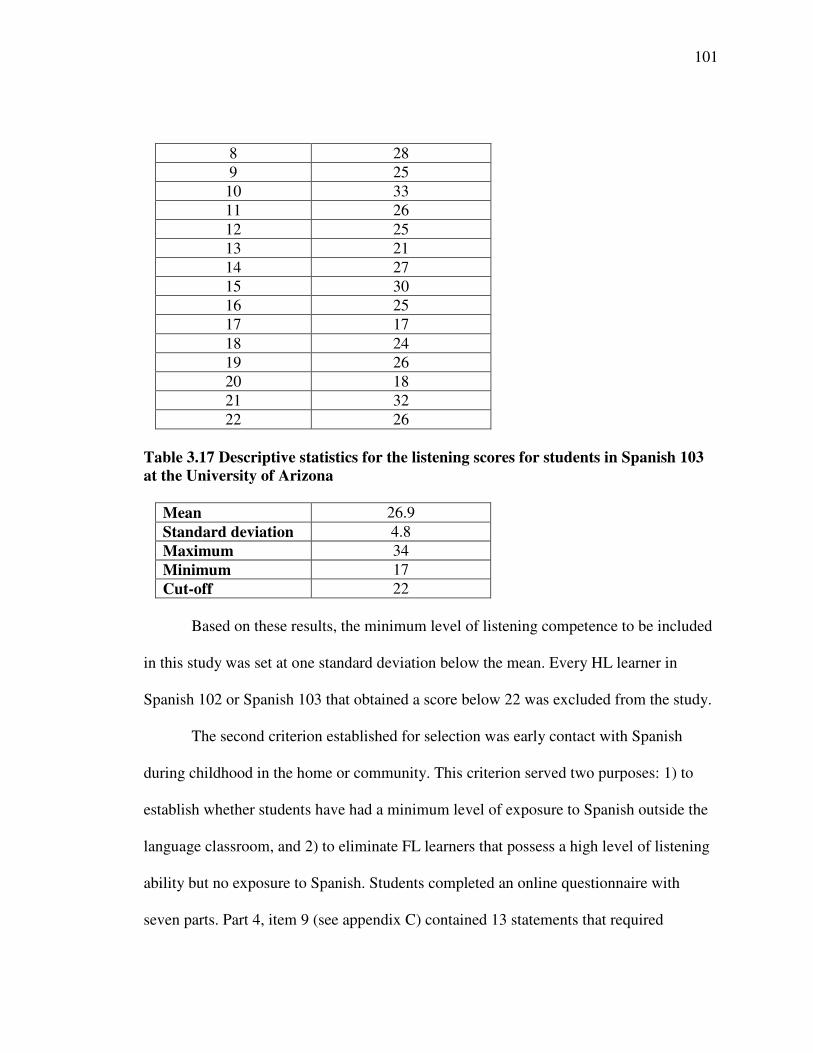
101
8 289 2510 3311 2612 2513 2114 2715 3016 2517 1718 2419 2620 1821 3222 26
Table 3.17 Descriptive statistics for the listening scores for students in Spanish 103at the University of Arizona
Mean 26.9Standard deviation 4.8Maximum 34Minimum 17Cut-off 22
Based on these results, the minimum level of listening competence to be included
in this study was set at one standard deviation below the mean. Every HL learner in
Spanish 102 or Spanish 103 that obtained a score below 22 was excluded from the study.
The second criterion established for selection was early contact with Spanish
during childhood in the home or community. This criterion served two purposes: 1) to
establish whether students have had a minimum level of exposure to Spanish outside the
language classroom, and 2) to eliminate FL learners that possess a high level of listening
ability but no exposure to Spanish. Students completed an online questionnaire with
seven parts. Part 4, item 9 (see appendix C) contained 13 statements that required
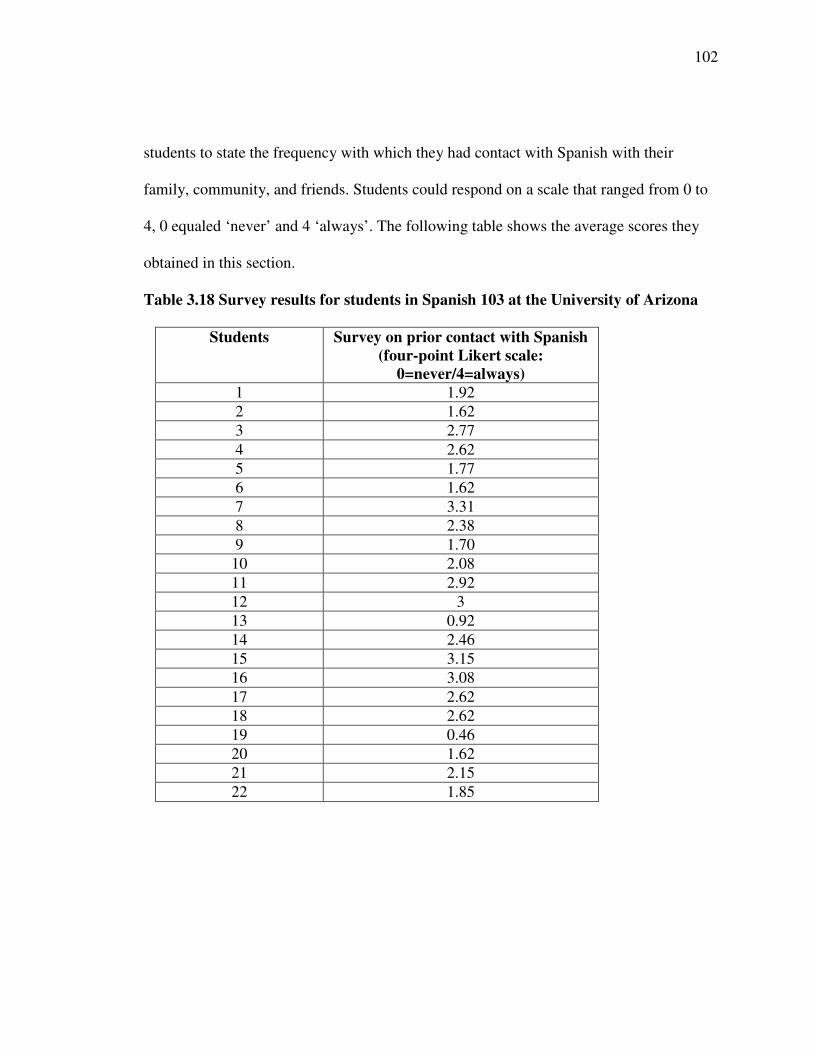
102
students to state the frequency with which they had contact with Spanish with their
family, community, and friends. Students could respond on a scale that ranged from 0 to
4, 0 equaled ‘never’ and 4 ‘always’. The following table shows the average scores they
obtained in this section.
Table 3.18 Survey results for students in Spanish 103 at the University of Arizona
Students Survey on prior contact with Spanish(four-point Likert scale:
0=never/4=always)1 1.922 1.623 2.774 2.625 1.776 1.627 3.318 2.389 1.7010 2.0811 2.9212 313 0.9214 2.4615 3.1516 3.0817 2.6218 2.6219 0.4620 1.6221 2.1522 1.85
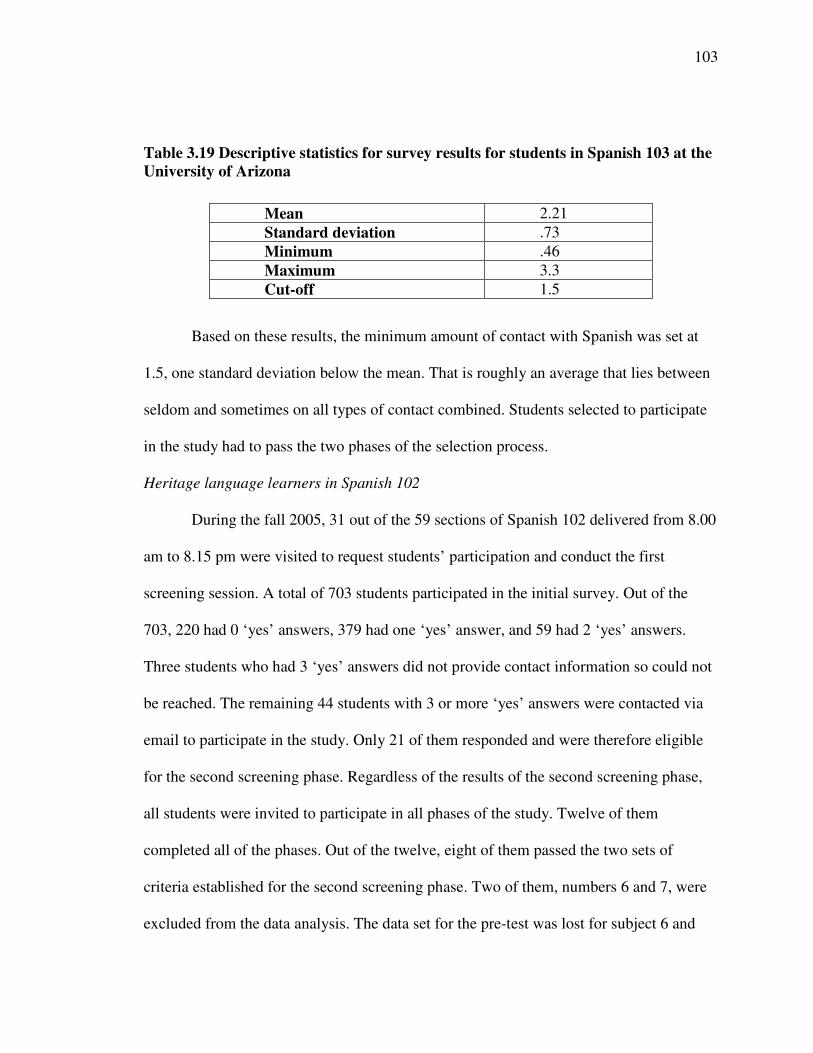
103
Table 3.19 Descriptive statistics for survey results for students in Spanish 103 at theUniversity of Arizona
Based on these results, the minimum amount of contact with Spanish was set at
1.5, one standard deviation below the mean. That is roughly an average that lies between
seldom and sometimes on all types of contact combined. Students selected to participate
in the study had to pass the two phases of the selection process.
Heritage language learners in Spanish 102
During the fall 2005, 31 out of the 59 sections of Spanish 102 delivered from 8.00
am to 8.15 pm were visited to request students’ participation and conduct the first
screening session. A total of 703 students participated in the initial survey. Out of the
703, 220 had 0 ‘yes’ answers, 379 had one ‘yes’ answer, and 59 had 2 ‘yes’ answers.
Three students who had 3 ‘yes’ answers did not provide contact information so could not
be reached. The remaining 44 students with 3 or more ‘yes’ answers were contacted via
email to participate in the study. Only 21 of them responded and were therefore eligible
for the second screening phase. Regardless of the results of the second screening phase,
all students were invited to participate in all phases of the study. Twelve of them
completed all of the phases. Out of the twelve, eight of them passed the two sets of
criteria established for the second screening phase. Two of them, numbers 6 and 7, were
excluded from the data analysis. The data set for the pre-test was lost for subject 6 and
Mean 2.21Standard deviation .73Minimum .46Maximum 3.3Cut-off 1.5
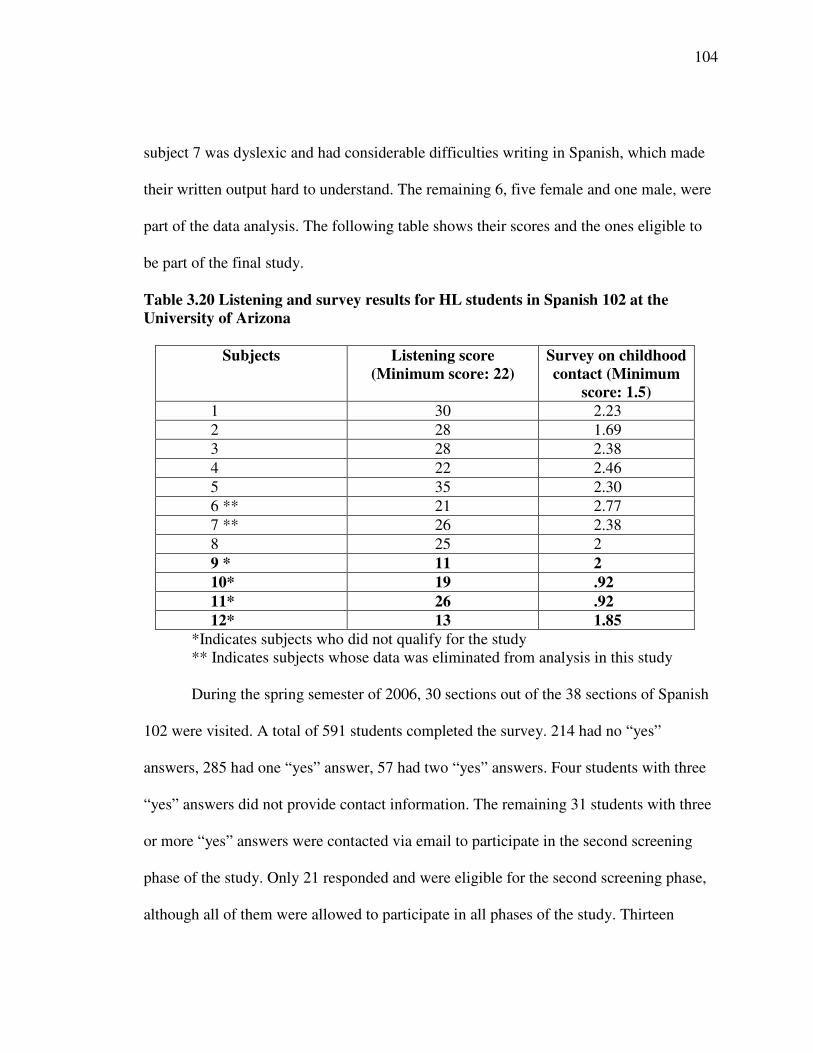
104
subject 7 was dyslexic and had considerable difficulties writing in Spanish, which made
their written output hard to understand. The remaining 6, five female and one male, were
part of the data analysis. The following table shows their scores and the ones eligible to
be part of the final study.
Table 3.20 Listening and survey results for HL students in Spanish 102 at theUniversity of Arizona
Subjects Listening score(Minimum score: 22)
Survey on childhoodcontact (Minimum
score: 1.5)1 30 2.232 28 1.693 28 2.384 22 2.465 35 2.306 ** 21 2.777 ** 26 2.388 25 29 * 11 210* 19 .9211* 26 .9212* 13 1.85
*Indicates subjects who did not qualify for the study** Indicates subjects whose data was eliminated from analysis in this study
During the spring semester of 2006, 30 sections out of the 38 sections of Spanish
102 were visited. A total of 591 students completed the survey. 214 had no “yes”
answers, 285 had one “yes” answer, 57 had two “yes” answers. Four students with three
“yes” answers did not provide contact information. The remaining 31 students with three
or more “yes” answers were contacted via email to participate in the second screening
phase of the study. Only 21 responded and were eligible for the second screening phase,
although all of them were allowed to participate in all phases of the study. Thirteen
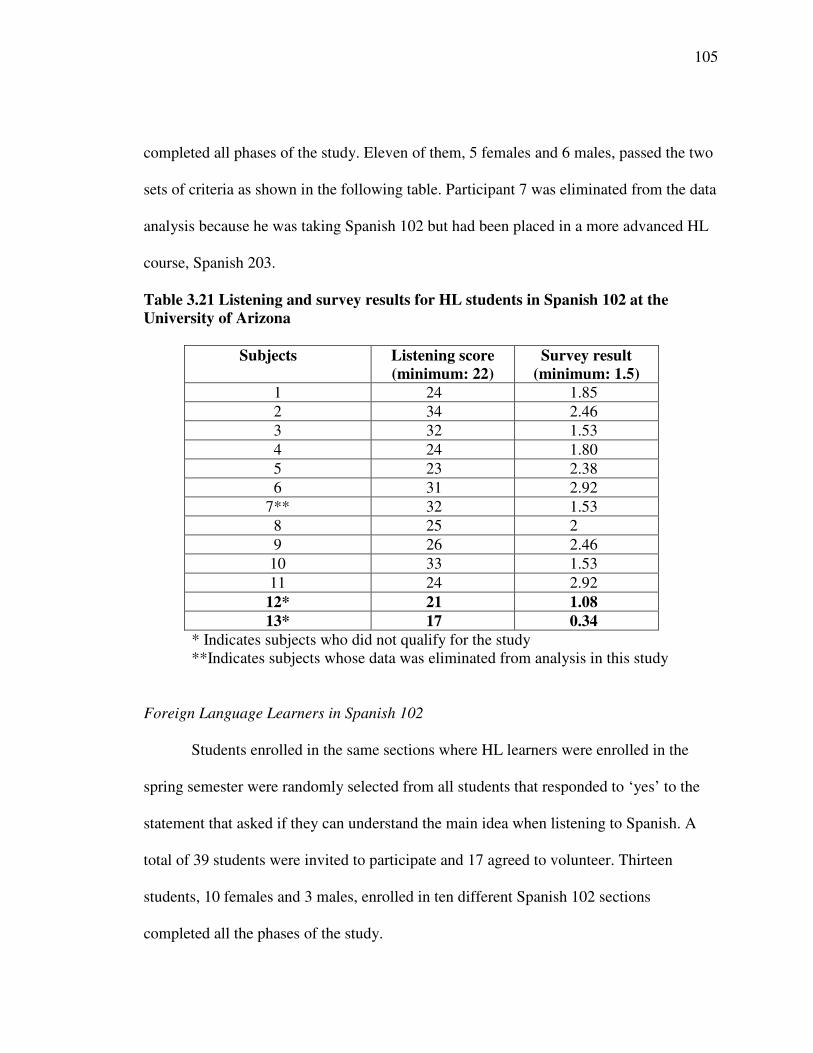
105
completed all phases of the study. Eleven of them, 5 females and 6 males, passed the two
sets of criteria as shown in the following table. Participant 7 was eliminated from the data
analysis because he was taking Spanish 102 but had been placed in a more advanced HL
course, Spanish 203.
Table 3.21 Listening and survey results for HL students in Spanish 102 at theUniversity of Arizona
Subjects Listening score(minimum: 22)
Survey result(minimum: 1.5)
1 24 1.852 34 2.463 32 1.534 24 1.805 23 2.386 31 2.92
7** 32 1.538 25 29 26 2.4610 33 1.5311 24 2.9212* 21 1.0813* 17 0.34
* Indicates subjects who did not qualify for the study**Indicates subjects whose data was eliminated from analysis in this study
Foreign Language Learners in Spanish 102
Students enrolled in the same sections where HL learners were enrolled in the
spring semester were randomly selected from all students that responded to ‘yes’ to the
statement that asked if they can understand the main idea when listening to Spanish. A
total of 39 students were invited to participate and 17 agreed to volunteer. Thirteen
students, 10 females and 3 males, enrolled in ten different Spanish 102 sections
completed all the phases of the study.
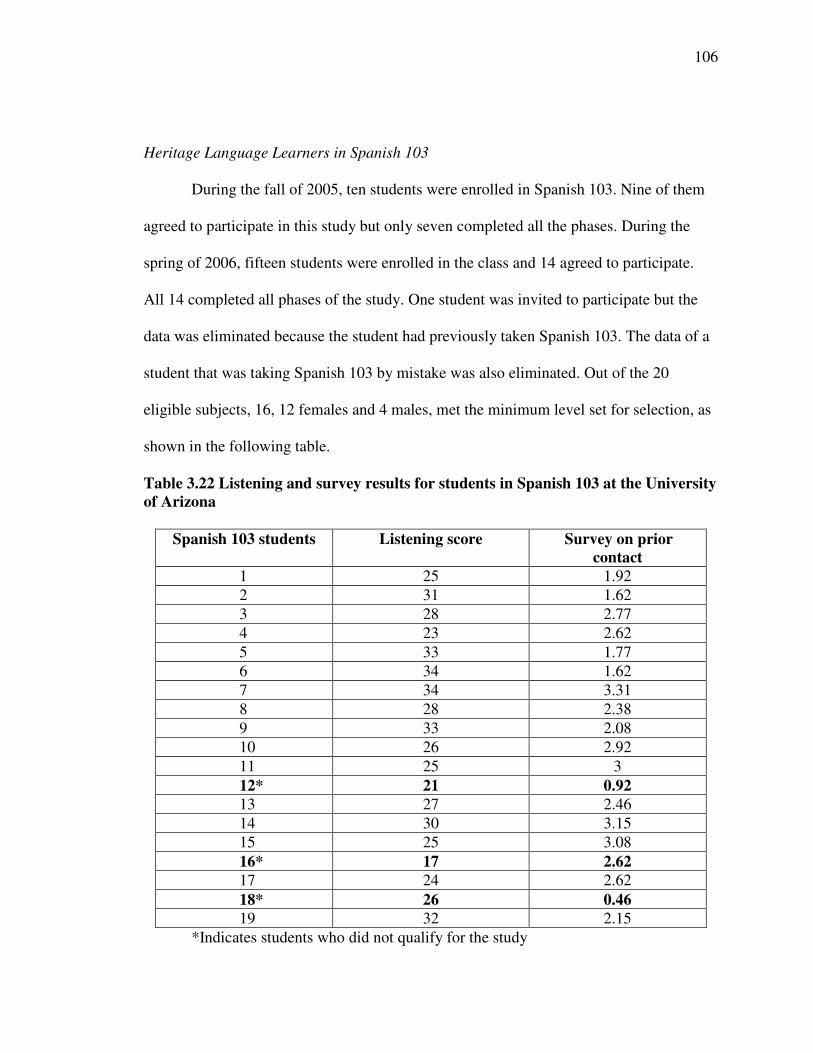
106
Heritage Language Learners in Spanish 103
During the fall of 2005, ten students were enrolled in Spanish 103. Nine of them
agreed to participate in this study but only seven completed all the phases. During the
spring of 2006, fifteen students were enrolled in the class and 14 agreed to participate.
All 14 completed all phases of the study. One student was invited to participate but the
data was eliminated because the student had previously taken Spanish 103. The data of a
student that was taking Spanish 103 by mistake was also eliminated. Out of the 20
eligible subjects, 16, 12 females and 4 males, met the minimum level set for selection, as
shown in the following table.
Table 3.22 Listening and survey results for students in Spanish 103 at the Universityof Arizona
Spanish 103 students Listening score Survey on priorcontact
1 25 1.922 31 1.623 28 2.774 23 2.625 33 1.776 34 1.627 34 3.318 28 2.389 33 2.0810 26 2.9211 25 312* 21 0.9213 27 2.4614 30 3.1515 25 3.0816* 17 2.6217 24 2.6218* 26 0.4619 32 2.15
*Indicates students who did not qualify for the study
107
Research Design
This study employs a causal-comparative research method in order to answer the
research questions. Causal-comparative research examines the differences between two
or more groups on one or more variables with no intervention of the researcher other than
what is necessary for the data collection (Wallen & Fraenkel, 2001). In this sense, causal-
comparative study differs from experimental research in that the researcher does not
create the difference between the groups but examines, in this case, the pre-existing
curricular differentiation between FL and HL courses and its effects on the students’
language development. Like experimental research, it attempts to identify cause-effect
relationships between variables but cannot provide true experimental data (Gay &
Airasian, 2003). This research method was selected because HL learners could not be
assigned to different treatments due to logical and ethical barriers. It would not be
possible to group together HL learners and design a course with a FL curriculum to
compare it with a group of HL learners following a HL curriculum for this experiment.
The comparison groups were three: a group of HL students enrolled in the HL track in
Spanish 103 (HLH group), a group of HL learners enrolled in the FL track in Spanish 102
(HLF group) and a third group, used as a control group, comprised of FL students
enrolled in the FL track in Spanish 102 (FLF group). The independent variable in this
study is the type of class students are enrolled (FL track or HL track) and the dependent
variables are multiple, including oral language development, written language
development, amount of language use, language attitudes, self-evaluation of language
abilities, and self-confidence. These variables were measured with pre-and post
108
instruments. The data from the first dependant variable, language development, was
analyzed using using a three-way mixed ANOVA with two levels of task (task 1 and task
2; within subjects), two levels of time (beginning and end; within subjects) as
independent variables, and 3 levels of group (HLH group: HL in Span103, HLF group:
HL in Span102; and FLF group: FL in Span102; between subjects). The rest of the
variables were analyzed with one-way analysis of variance (ANOVA).
Research Procedures
The study took place during the fall semester of 2005 and the spring semester of
2006 at the University of Arizona. No curricular changes were made from one semester
to the next. During the preliminary phase of the study, students in 61 sections of Spanish
102 were asked to complete a background survey to identify HL learners (see appendix
B). This constituted the first phase of the selection process. The second phase took place
when subjects completed the first online questionnaire. The data collection proceeded in
two phases. The first phase took place during the third week of the semester. All pre-
selected subjects met individually with the researcher in a small isolated room to
complete the pre-test. It consisted of two oral and written-elicitation tasks, a listening test,
and an online questionnaire. The final phase took place during the sixteenth week of the
semester. Subjects completed two oral and written-elicitation tasks and filled out a
second online questionnaire. All subjects in this study participated voluntarily and
received extra class participation points for their participation. Table 3.23 shows a
summary of the data collection procedures:
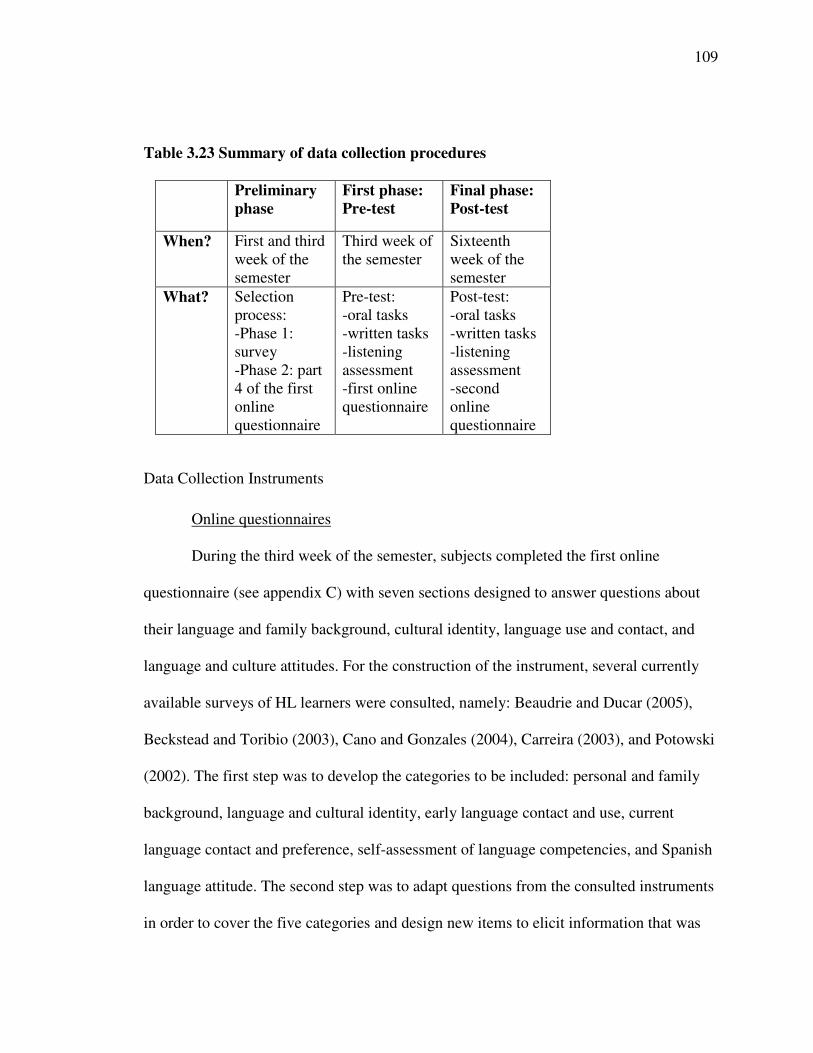
109
Table 3.23 Summary of data collection procedures
Preliminaryphase
First phase:Pre-test
Final phase:Post-test
When? First and thirdweek of thesemester
Third week ofthe semester
Sixteenthweek of thesemester
What? Selectionprocess:-Phase 1:survey-Phase 2: part4 of the firstonlinequestionnaire
Pre-test:-oral tasks-written tasks-listeningassessment-first onlinequestionnaire
Post-test:-oral tasks-written tasks-listeningassessment-secondonlinequestionnaire
Data Collection Instruments
Online questionnaires
During the third week of the semester, subjects completed the first online
questionnaire (see appendix C) with seven sections designed to answer questions about
their language and family background, cultural identity, language use and contact, and
language and culture attitudes. For the construction of the instrument, several currently
available surveys of HL learners were consulted, namely: Beaudrie and Ducar (2005),
Beckstead and Toribio (2003), Cano and Gonzales (2004), Carreira (2003), and Potowski
(2002). The first step was to develop the categories to be included: personal and family
background, language and cultural identity, early language contact and use, current
language contact and preference, self-assessment of language competencies, and Spanish
language attitude. The second step was to adapt questions from the consulted instruments
in order to cover the five categories and design new items to elicit information that was
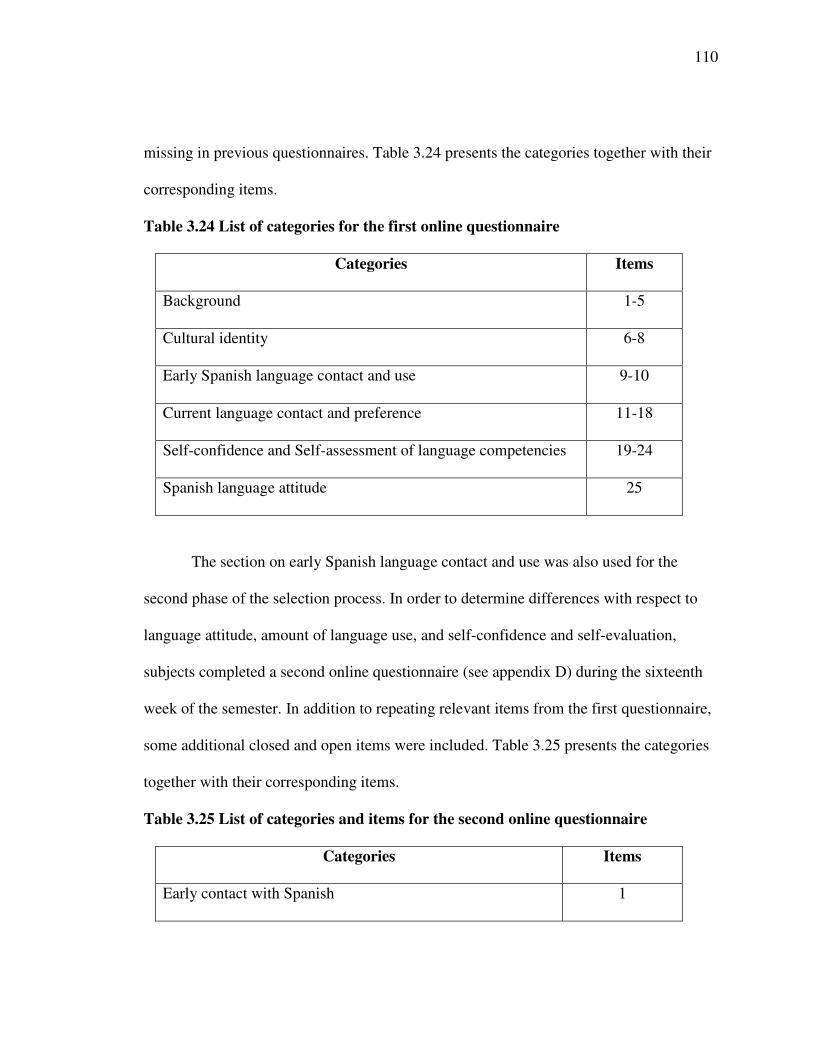
110
missing in previous questionnaires. Table 3.24 presents the categories together with their
corresponding items.
Table 3.24 List of categories for the first online questionnaire
Categories Items
Background 1-5
Cultural identity 6-8
Early Spanish language contact and use 9-10
Current language contact and preference 11-18
Self-confidence and Self-assessment of language competencies 19-24
Spanish language attitude 25
The section on early Spanish language contact and use was also used for the
second phase of the selection process. In order to determine differences with respect to
language attitude, amount of language use, and self-confidence and self-evaluation,
subjects completed a second online questionnaire (see appendix D) during the sixteenth
week of the semester. In addition to repeating relevant items from the first questionnaire,
some additional closed and open items were included. Table 3.25 presents the categories
together with their corresponding items.
Table 3.25 List of categories and items for the second online questionnaire
Categories Items
Early contact with Spanish 1
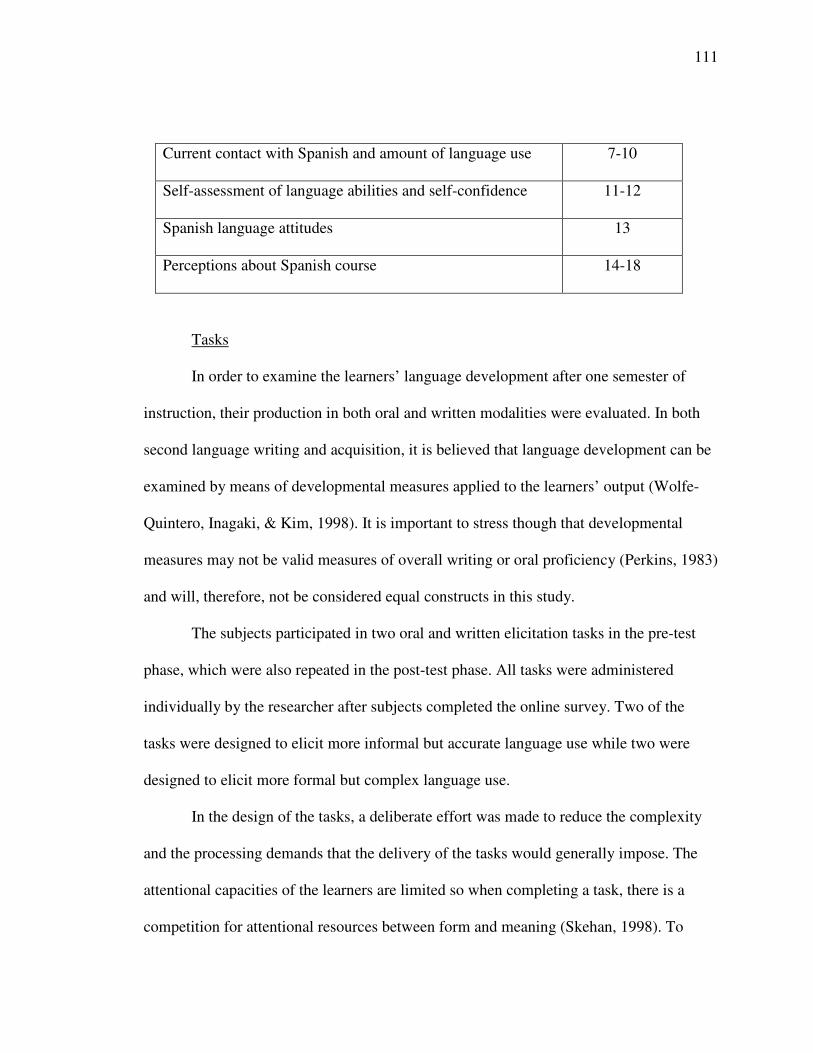
111
Current contact with Spanish and amount of language use 7-10
Self-assessment of language abilities and self-confidence 11-12
Spanish language attitudes 13
Perceptions about Spanish course 14-18
Tasks
In order to examine the learners’ language development after one semester of
instruction, their production in both oral and written modalities were evaluated. In both
second language writing and acquisition, it is believed that language development can be
examined by means of developmental measures applied to the learners’ output (Wolfe-
Quintero, Inagaki, & Kim, 1998). It is important to stress though that developmental
measures may not be valid measures of overall writing or oral proficiency (Perkins, 1983)
and will, therefore, not be considered equal constructs in this study.
The subjects participated in two oral and written elicitation tasks in the pre-test
phase, which were also repeated in the post-test phase. All tasks were administered
individually by the researcher after subjects completed the online survey. Two of the
tasks were designed to elicit more informal but accurate language use while two were
designed to elicit more formal but complex language use.
In the design of the tasks, a deliberate effort was made to reduce the complexity
and the processing demands that the delivery of the tasks would generally impose. The
attentional capacities of the learners are limited so when completing a task, there is a
competition for attentional resources between form and meaning (Skehan, 1998). To
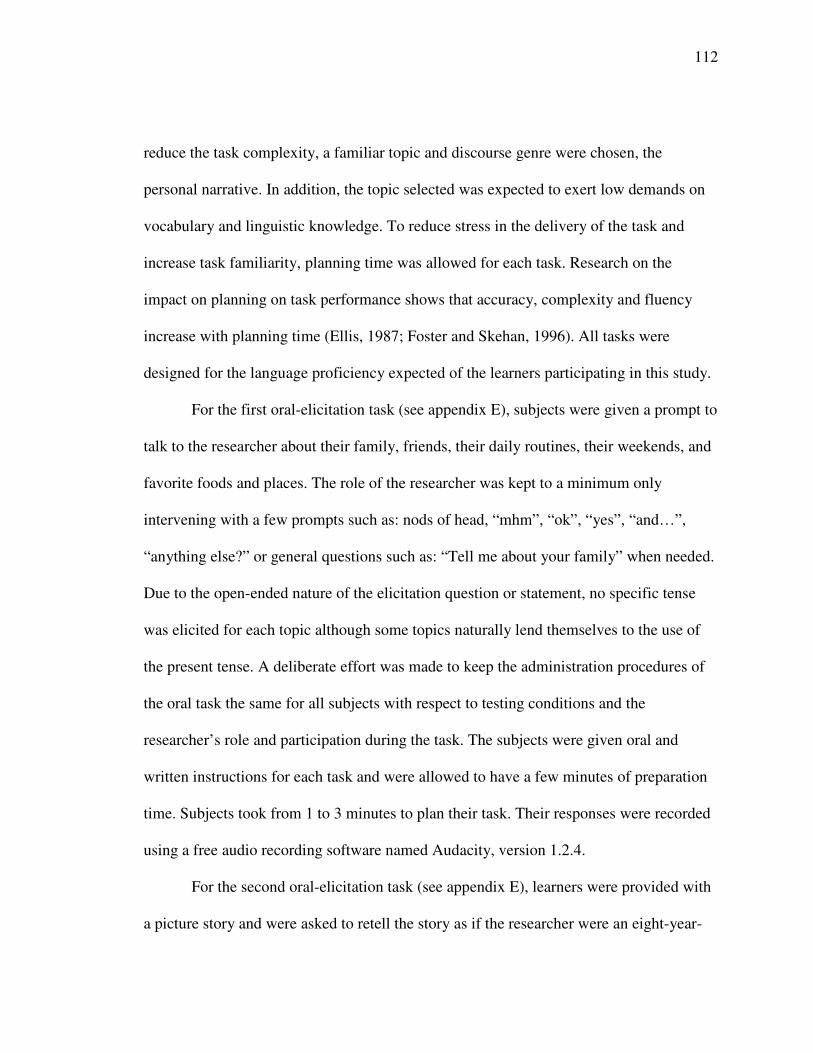
112
reduce the task complexity, a familiar topic and discourse genre were chosen, the
personal narrative. In addition, the topic selected was expected to exert low demands on
vocabulary and linguistic knowledge. To reduce stress in the delivery of the task and
increase task familiarity, planning time was allowed for each task. Research on the
impact on planning on task performance shows that accuracy, complexity and fluency
increase with planning time (Ellis, 1987; Foster and Skehan, 1996). All tasks were
designed for the language proficiency expected of the learners participating in this study.
For the first oral-elicitation task (see appendix E), subjects were given a prompt to
talk to the researcher about their family, friends, their daily routines, their weekends, and
favorite foods and places. The role of the researcher was kept to a minimum only
intervening with a few prompts such as: nods of head, “mhm”, “ok”, “yes”, “and…”,
“anything else?” or general questions such as: “Tell me about your family” when needed.
Due to the open-ended nature of the elicitation question or statement, no specific tense
was elicited for each topic although some topics naturally lend themselves to the use of
the present tense. A deliberate effort was made to keep the administration procedures of
the oral task the same for all subjects with respect to testing conditions and the
researcher’s role and participation during the task. The subjects were given oral and
written instructions for each task and were allowed to have a few minutes of preparation
time. Subjects took from 1 to 3 minutes to plan their task. Their responses were recorded
using a free audio recording software named Audacity, version 1.2.4.
For the second oral-elicitation task (see appendix E), learners were provided with
a picture story and were asked to retell the story as if the researcher were an eight-year-
113
old child. They were instructed to look at the whole story first and then go back to each
individual picture while telling the story. This task was chosen to elicit a
descriptive/narrative piece from the students with a restricted format to allow for
comparable responses. The picture story chosen was a storybook without words, Frog
goes to dinner? by Mercer Mayer (1974). It is a story about a family that goes to dinner
to an upscale restaurant which is spoiled by the son’s pet frog who sneaks in with them in
the boy’s pocket. This story and other similar stories about a frog have been used in
previous studies to elicit oral narratives from children (Haritos & Nelson, 2001) and
children, adolescents and adults (Berman & Slobin, 1994) and written narratives (Slobin,
1996).
For the written-elicitation tasks – part one and two – (see appendix F), learners
were provided with a writing prompt to elicit a personal narrative and a story book to
elicit a narrative piece. An effort was made to keep the oral and written tasks formats the
same. The picture story chosen was another wordless storybook in the same series, One
frog too many by Mercer Mayer and Marianna Mayer (1969). This story is the simplest
among these storybooks and was considered appropriate for the level of the students. It is
about a boy who received a little frog for his birthday. The boy's current pet frog thinks
that the new frog is one frog too many. The boy keeps scolding the frog for trying to get
rid of the new frog several times until one time, the frog kicks the little frog out of a boat
and it gets lost. After the sadness of having lost the pet, the little frog reappears to the
happiness of everybody, including the boy’s pet frog. The personal narrative consists of a
letter-writing activity where students write to an imaginary friend they have not seen for a
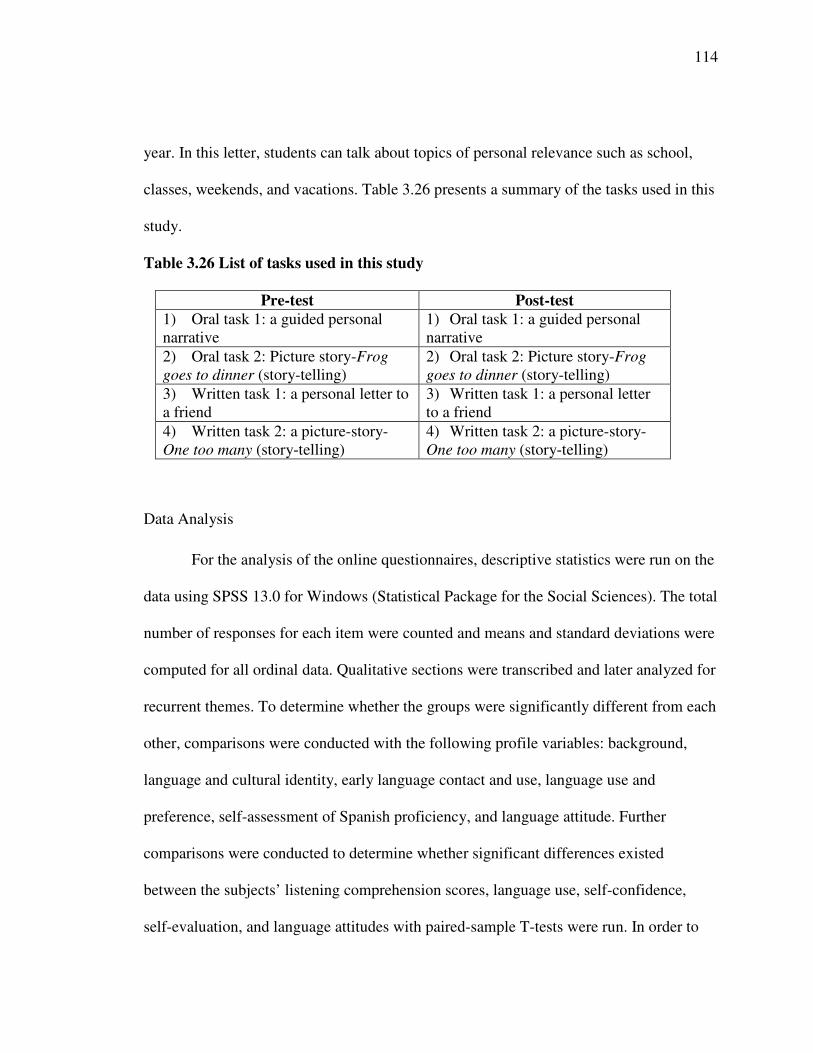
114
year. In this letter, students can talk about topics of personal relevance such as school,
classes, weekends, and vacations. Table 3.26 presents a summary of the tasks used in this
study.
Table 3.26 List of tasks used in this study
Pre-test Post-test1) Oral task 1: a guided personalnarrative
1) Oral task 1: a guided personalnarrative
2) Oral task 2: Picture story-Froggoes to dinner (story-telling)
2) Oral task 2: Picture story-Froggoes to dinner (story-telling)
3) Written task 1: a personal letter toa friend
3) Written task 1: a personal letterto a friend
4) Written task 2: a picture-story-One too many (story-telling)
4) Written task 2: a picture-story-One too many (story-telling)
Data Analysis
For the analysis of the online questionnaires, descriptive statistics were run on the
data using SPSS 13.0 for Windows (Statistical Package for the Social Sciences). The total
number of responses for each item were counted and means and standard deviations were
computed for all ordinal data. Qualitative sections were transcribed and later analyzed for
recurrent themes. To determine whether the groups were significantly different from each
other, comparisons were conducted with the following profile variables: background,
language and cultural identity, early language contact and use, language use and
preference, self-assessment of Spanish proficiency, and language attitude. Further
comparisons were conducted to determine whether significant differences existed
between the subjects’ listening comprehension scores, language use, self-confidence,
self-evaluation, and language attitudes with paired-sample T-tests were run. In order to
115
analyze the learners’ language development over one semester of instruction, the samples
from the oral and written language tasks from the beginning and end of the semester were
submitted to linguistic analysis.
Data coding procedures for oral and written samples
Oral and written samples were submitted to a developmental index analysis. This
analysis examined fluency, accuracy, and complexity measures, following the assumption
that language development entails growth, among other things, in these three constructs.
Language development will manifest in more fluent production, with fewer errors, and
more grammatically and lexically complex sentences. Such constructs have been
extensively used in second language acquisition studies to measure the effect of program,
task, feedback, planning, audience, topic, and time (Wolfe-Quintero, Inagaki, & Kim,
1998).
Language fluency
Fluency refers to the degree of control in accessing language knowledge.
Language development then entails an increased level of control and, therefore, more
fluent language production (Wolfe-Quintero, Inagaki, & Kim, 1998, p. 4). Both written
and oral samples were coded for the amount of output production to obtain a measure of
language productivity. It is assumed that when students are given the same task to
complete at different points in time, increased language productivity will be reflective of
language growth. Two relevant measures were calculated: total number of T-units and
mean length of T-units (MLT-unit). The total number of words was not included in the
116
analysis due its low reliability as a measure of development (Wolfe-Quintero & Kim,
1998). The T-unit (minimal terminable unit) is the shortest unit which a sentence can be
reduced to and consists of one independent clause together with whatever dependent
clauses are attached to it (Hunt, 1965). This unit has the advantage of differentiating
complex from compound sentences since compound sentences form different T-units.
The following is an example from the written samples:
c. / “Yo tengo cinco clases” /. (1 T-unit)
d. / “Es un escuela muy grande” /, / “pero me gusta” /. (2 T-units)
e. / “Yo no sabía que ella me garró un carro” /. (2 T-units)
Both a count of T-units with no English words and T-units with only one English
word or compound phrase were obtained. Examples of coumpound phrases are ‘orange
chicken’, ‘ended up’, ‘pop out’, ‘grad school’. Clarifications in English such as ‘Voy a
extranar [miss you]’ were not taken into account to the T-unit analysis or proper names in
English such as Attorney general’s office, Rec center, Student Union. All T-units with
more than 2 English words were excluded in this count.
The protocol for the T-unit segmentation followed the guidelines established by
Ortega Alvarez-Osorio’s study (2000). What follows is a list of relevant guidelines for
this particular study:
1. Spanish is a pro-drop language so each main verb regardless of the
presence of an overt subject was considered to form its own T-unit.
117
2. Independent non-target-like clauses were also included in the analysis as
T-units. For example: ‘ellos también muy ocupados con escuela’, ‘sábado y domingo,
relajar con mis amigos.’
3. Indirect reported speech was included within the T-unit whereas direct
reported speech formed its own T-unit.
a. 1 t-unit: / “ y la papá del niño le dijo que se fuera a su recámara” /
b. 2 t-units: / ‘El papá dice al niño’ / / ‘vas a su [room]’ /
4. Subordinate clauses lacking a relative pronoun were counted as part of its
corresponding T-unit. For example: ‘Tengo un hermano se llama Kevin’
For spoken discourse, the T-unit has often been considered a less useful unit of
analysis because it fails to include “naturally and typically occurring phenomena in
spoken language” (Crookes, 1990; Foster & Skehan, 1996). However, in the oral samples
of this study, oral discourse was primarily monologic and consisted of few elliptic
utterances, leading to the decision that the same unit of analysis was to be used for
written and oral samples.
The MLT-unit was another fluency measure obtained. This measure has
traditionally been used as a measure of language complexity; however, as Wolfe-
Quintero, Inagaki, and Kim (1998) suggest, length measures such as the MLT do not
discriminate among the ways in which length is achieved. Therefore, a measure of the
length of T-unit represents a more accurate measure of fluency rather than complexity.
For this measure, T-units with one English word were included to capture more of the
learners’ production. The MLT was calculated by obtaining the total number of T-units
118
per text with only one English word and dividing it by the total number of words
produced in each text. In addition, percentages of English words used per sample were
obtained.
For oral fluency, in addition to the measures obtained for written fluency, the
speech rate was utilized since several studies have found it to be a reliable measure of
learner fluency (Kormos & Dénes, 2004, system). It was calculated by counting the total
number of valid Spanish words produced and dividing it by the total amount of time used
to complete the task in seconds. This number was then multiplied by 60 to obtain a figure
of words per minute. To obtain the number of valid Spanish words, pruning was
performed of the following instances:
1. repetitions: ‘y cuando la mujer come el ensalada, (2) mira mira Maria.
2. False starts: ‘Ella está muy ti tem temendo temiendo de Maria’
3. Self-corrections: ‘Todos los personas en la en el restaurante’
4. Hesitations: ah, eh, mmm, etc.
Language complexity
Complexity refers to the use of a wide range of structures and vocabulary in
language production (Lennon, 1990, p. 330). Increased complexity will result in more
elaborate language, reflected in augmented syntactic complexity and variety, and a more
diverse lexical repertoire. Two measures were used to analyze the complexity of the
samples produced by subjects in this study: lexical richness and syntactic complexity. A
measure of lexical complexity was obtained by measuring the type-token ratio, which is a
ratio of the number of different words by the total number of words (Nation, 2001).
119
Because this measure is sensitive to the length of the text, samples of equal length were
used to calculate this ratio. The sample length was the lowest number of words produced
by any of the students. The data was submitted to a transcript analysis tool which
automatically divides the total number of different words by the total number of words
written uniquely for this study in the College of Humanities. Misspelled words and
singular and plural forms of a same word are all counted as different words by the
program.
For syntactic complexity, the depth of clause and the tense/aspect use complexity
were analyzed. Syntactic complexity was measured by the subordinate clause index
(Hunt, 1965, 1970), which is the number of clauses per T-unit. This measure of depth of
clause was examined in order to determine if increases in length were the result of
increased subordination. In addition, the tense/aspect use complexity was measured to
obtain an index of progress in the range of structures or linguistic repertoire of the
students. The tense/aspect use complexity was analyzed by counting the increase or
decrease in the number and types of structures in the subjects’ production. The following
structures were coded: 1) ser, 2) estar, 3) present, 4) preterit, 5) imperfect, 6) new tense.
New tense refers to any tense not included in the first five items such as the subjunctive,
the future tense, and the conditional.
Accuracy
One of the most widely used indexes of language output development and
accuracy is the error-free T-unit. This index takes into account the length and accuracy of
120
the sample and quantifies development towards target-like production (Bardovi-Harlig &
Bofman, 1989). For this particular study, due to the low-level proficiency of learners and
the short span of time between the pre- and post-tests, this type of measure was not
considered appropriate since such an index requires the inclusion of all types of errors
that do not achieve target-like production. Learners at this level are likely to make either
a syntactic, morphological, or lexical error of some kind in most T-units they produce.
Instead, the output was analyzed for accuracy within the verb and noun phrase. The
number of attempts to use each verb tense were extracted and counted. Tokens of verbs
for each participant were coded and counted for subject-verb agreement accuracy. The
counting was done with a java program especially written to count the number of
instances for each structure. The noun phrase was analyzed for gender and number
agreement between the noun and all its determiners. In addition, this analysis included
instances of gender and number agreement of adjectives used predicatively.
Conclusion
This chapter has described the broad and narrow setting of this study and how the
subjects were selected. It also explained the research design and procedures along with
the data collection instruments that were chosen to answer the questions guiding the
study. In addition, it outlined the data analysis and coding procedures that were used to
examine the data. The next chapter describes the statistical analyses that were applied to
the data in more detail and presents the results of the questions outlined in chapter 1.
121
CHAPTER 4: RESULTS
This chapter presents the findings of each of the research questions guiding this
study. The purpose of the study was to compare the effects of a heritage versus a FL
curriculum on the language development and other language-related variables of HL
learners. The overarching purpose of the study was to determine the type of curriculum
that best meets the language and affective needs of HL learners and uncover the
similarities and differences between HL and FL learners. The research questions posed
for this investigation are the following:
1) What are the linguistic and cultural profiles of SHL learners enrolled in the
SFL and SHL tracks?
1.a What is their family’s cultural and language background, their owncultural and language background, their childhood contact with Spanish,and their current Spanish/English language use and preference?
1.b What is their motivation to study Spanish and their attitudes towardsthe Spanish language?
1.c Are there any profile differences between the HL learners enrolled inthe HL track and the FL track? How do they differ from FL learners in theFL track?
2) What differential gains are there between the SHL learners enrolled in the
SHL track, those SHL learners enrolled in the SFL track and SFL learners
enrolled in the SFL track after one semester of instruction?
2.a To what extent do the students differ in their language outputdevelopment in measures of fluency, accuracy, and complexity?
122
2.b What differences are there with respect to Spanish language attitude,amount of language use, confidence, and self-assessment of languagecompetencies?
3) What are some of the language differences between the groups of SHL and
SFL learners?
4) What are the students’ perceptions of their Spanish language course?
4.a What is the level of satisfaction of the three different groups with thecourse content and materials?
4.b To what extent does the SFL or SHL curriculum meet the needs ofSHL learners as perceived by the students?
Descriptive Information on the Sample Population
The study involved 45 learners of Spanish divided into three groups. The HLH
group consisted of SHL learners enrolled in the SHL course, the HLF group comprised
SHL learners in SFL courses, and the FLF group was made up of SFL learners in the
same SFL courses.
Among the 45 students, there were 33 females and 12 males. Their age range
spanned from 18 to 36 with a mean of 19.78. The mode was 18 since the majority of the
students were of that age (55.6%). The group ranging from 19 to 21 years of age
comprised 33.4% of the sample. The group ranging from 22 to 36 accounts for the
remaining 11%. As far as the students’ current class standing at the university, 30
(66.7%) were freshmen, 4 (8.9%) were sophomores, 6 (13.3%) were juniors, 1 (2.2%) a
senior, 2 (4.4%) were graduate students, and 2 (4.4%) were non-degree seeking students.
Overall, the sample population appears to be typical of a beginning-level course at the
123
university where the majority of students are 18-year-old freshmen. Female students,
however, appear to be overrepresented in this study.
Research Question 1: Student Profiles (1-a)
1) What are the linguistic and cultural profiles of SHL learners enrolled inthe SFL and SHL tracks?
1.a What is their family’s cultural and language background, their owncultural and language background, their childhood contact with Spanish,and their current Spanish/English language use and preference?
This first question focuses on constructing a profile of the SHL population in this
study. To that effect, students completed parts I and II of the first online questionnaire
(see appendix C). The answers to the survey provided by both the HLH group and HLF
were analyzed and are presented below.
Students’ language and cultural background
All 32 HL learners (from the HLH and HLF groups) were born in the United
States and only 3 lived abroad. Two of them lived in Mexico; one for a month and the
other one for two months. The third lived in Puerto Rico for 4 years but attended an
American school and had minimal contact with Spanish-speaking friends. When asked
about the immigration history of their family to the US, none of them reported being first-
generation immigrants, that is, born outside the US. Only 7 of them (22%) reported being
second-generation Americans (their parents were the first to immigrate), another 8 (25%)
reported being third-generation Americans (their grandparents immigrated to the US),
and 8 (25%) reported being fourth-generation in the US (their great-grandparents
124
immigrated to the US). The remaining 9 students were not sure about who immigrated to
the US, which may indicate that the first immigrants to this country in their families were
beyond the third generation. The family origin of the students was predominantly
Mexican, with 29 (91%) students having roots in that country and only 3 in different
Latin American countries: Perú, Honduras, and Guatemala.
In the first online questionnaire, students were asked to choose the descriptor that
best represented their cultural identity out of a list of seven items: Hispanic, Mexican,
American, Hispanic American, Mexican-American, Chicano/Chicana, and Latino/Latina.
The majority of the students preferred the option Mexican-American (18: 56.25%), with
Hispanic taking a second place (8: 25%). The rest of the students opted for Mexican (3:
9.38%), Hispanic American (2: 6.25%), and Chicano (1: 3.13%). Figure 4.1 shows the
distribution of descriptors chosen by each subject to represent themselves.
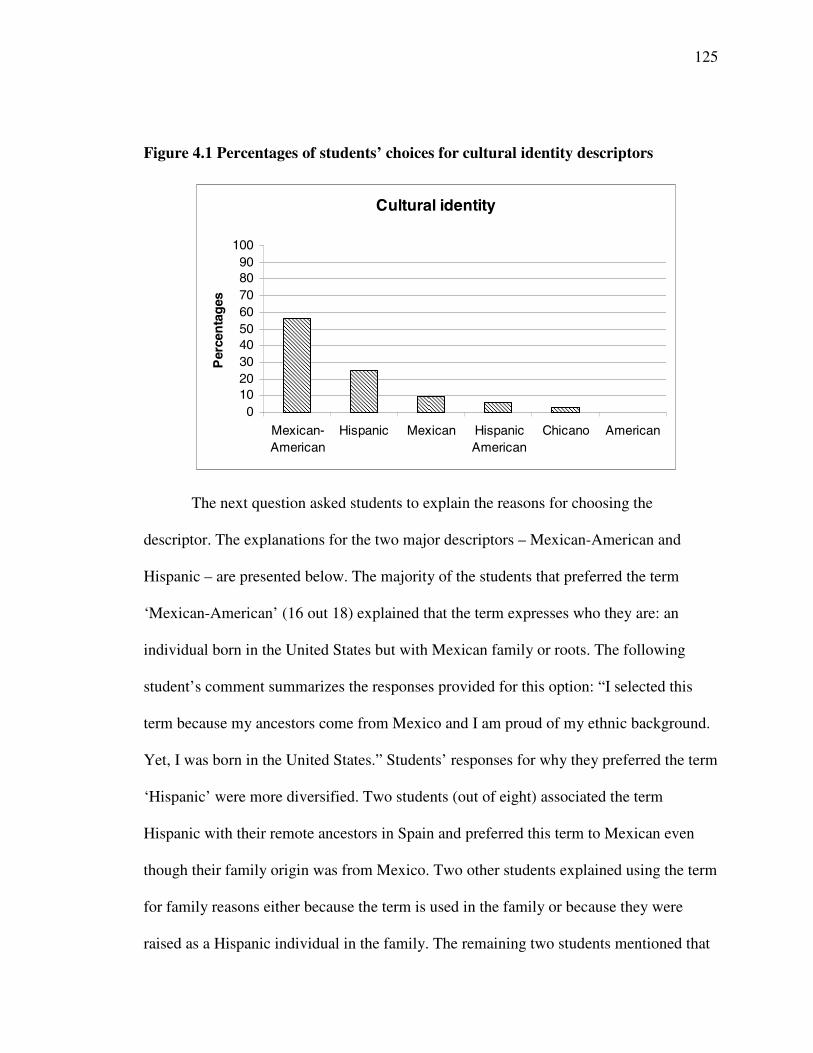
125
Figure 4.1 Percentages of students’ choices for cultural identity descriptors
Cultural identity
0102030405060708090
100
Mexican-American
Hispanic Mexican HispanicAmerican
Chicano American
Per
cen
tag
es
The next question asked students to explain the reasons for choosing the
descriptor. The explanations for the two major descriptors – Mexican-American and
Hispanic – are presented below. The majority of the students that preferred the term
‘Mexican-American’ (16 out 18) explained that the term expresses who they are: an
individual born in the United States but with Mexican family or roots. The following
student’s comment summarizes the responses provided for this option: “I selected this
term because my ancestors come from Mexico and I am proud of my ethnic background.
Yet, I was born in the United States.” Students’ responses for why they preferred the term
‘Hispanic’ were more diversified. Two students (out of eight) associated the term
Hispanic with their remote ancestors in Spain and preferred this term to Mexican even
though their family origin was from Mexico. Two other students explained using the term
for family reasons either because the term is used in the family or because they were
raised as a Hispanic individual in the family. The remaining two students mentioned that
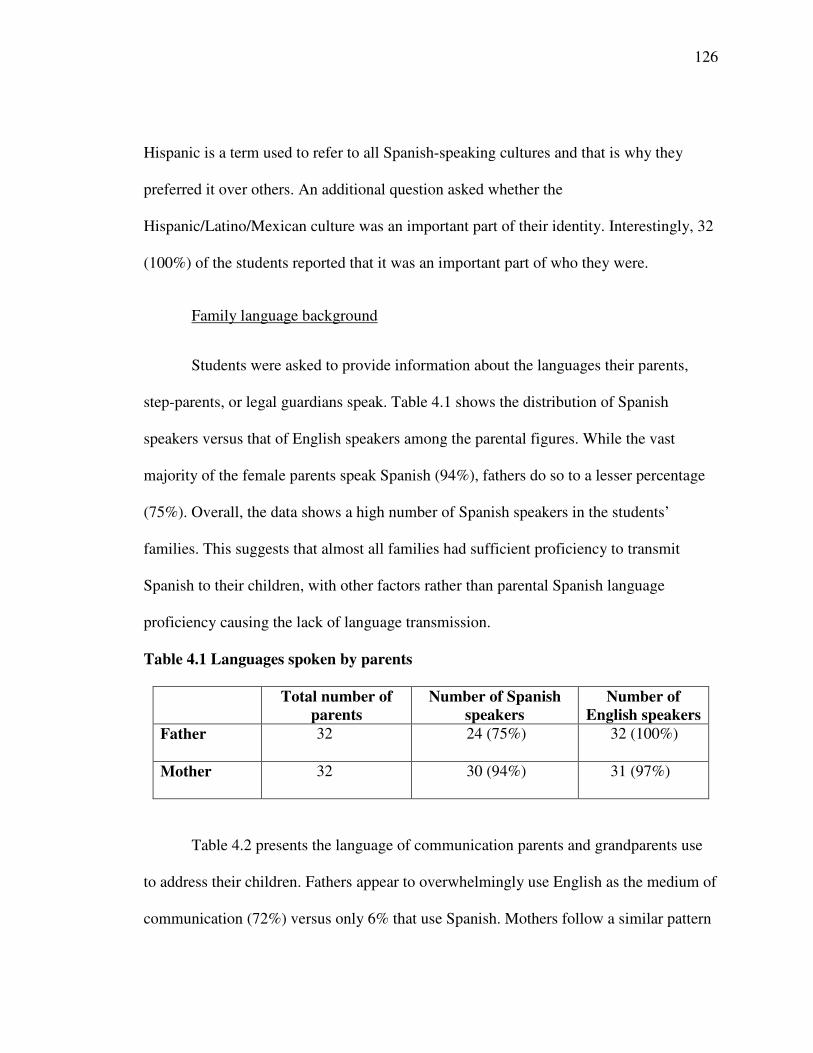
126
Hispanic is a term used to refer to all Spanish-speaking cultures and that is why they
preferred it over others. An additional question asked whether the
Hispanic/Latino/Mexican culture was an important part of their identity. Interestingly, 32
(100%) of the students reported that it was an important part of who they were.
Family language background
Students were asked to provide information about the languages their parents,
step-parents, or legal guardians speak. Table 4.1 shows the distribution of Spanish
speakers versus that of English speakers among the parental figures. While the vast
majority of the female parents speak Spanish (94%), fathers do so to a lesser percentage
(75%). Overall, the data shows a high number of Spanish speakers in the students’
families. This suggests that almost all families had sufficient proficiency to transmit
Spanish to their children, with other factors rather than parental Spanish language
proficiency causing the lack of language transmission.
Table 4.1 Languages spoken by parents
Total number ofparents
Number of Spanishspeakers
Number ofEnglish speakers
Father 32 24 (75%) 32 (100%)
Mother 32 30 (94%) 31 (97%)
Table 4.2 presents the language of communication parents and grandparents use
to address their children. Fathers appear to overwhelmingly use English as the medium of
communication (72%) versus only 6% that use Spanish. Mothers follow a similar pattern
127
with 66% using English and only 16% using Spanish. For the grandparents, the number
that prefers English as the medium of communication decreases by over a half. The
majority of grandparents use either both English and Spanish (28% and 22%) or Spanish
(31% and 31%).
Table 4.2 Language used to address students by family members
MostlyEnglish (1)
Both Englishand Spanish(2)
MostlySpanish (3)
Notapplicable(4)
Father, stepfatheror male guardian
23 (72%) 5 (16%) 2 (6%) 2 (6%)
Mother, stepmotheror female guardian
21 (66%) 6 (19%) 5 (16%) 0 (0%)*
Grandparent(s)(mother's side):
11 (34%) 9 (28%) 10 (31%) 2 (6%) *
Grandparent(s)(father's side)
8 (25%) 7 (22%) 10 (31%) 7 (23%) *
*All percentages were rounded up, total percentage does not equal 100%
Figure 4.2 shows the languages used to address the learners by family members
and clearly illustrates the discrepancy between parents and grandparents. The former use
primarily English to communicate with their children, while the latter use both English
and Spanish or mostly Spanish. Based on the students’ qualitative comments on their
language background, most of their grandparents spoke little English, which may be the
most important factor in explaining why a majority of them used Spanish as their primary
language of communication with their grandchildren.
128
Figure 4.2 Family contact with Spanish
1=Mostly English; 2=Both English and Spanish; 3=Mostly Spanish; 4=Not
Applicable
Family contact with Spanish
0102030405060708090
100
1 2 3 4
Contact
Per
cen
tag
eso
ffa
mily
mem
ber
s Father
Mother
Grandparents 1
Grandparents 2
Childhood contact with Spanish
The frequency of contact with Spanish during childhood was investigated in an
effort to further understand the type of contact that students experienced outside the
classroom. This section presents the means and standard deviations for all students
surveyed. Table 4.3 compares the frequency of the students’ speaking behaviors in
Spanish and/or English with different family members.
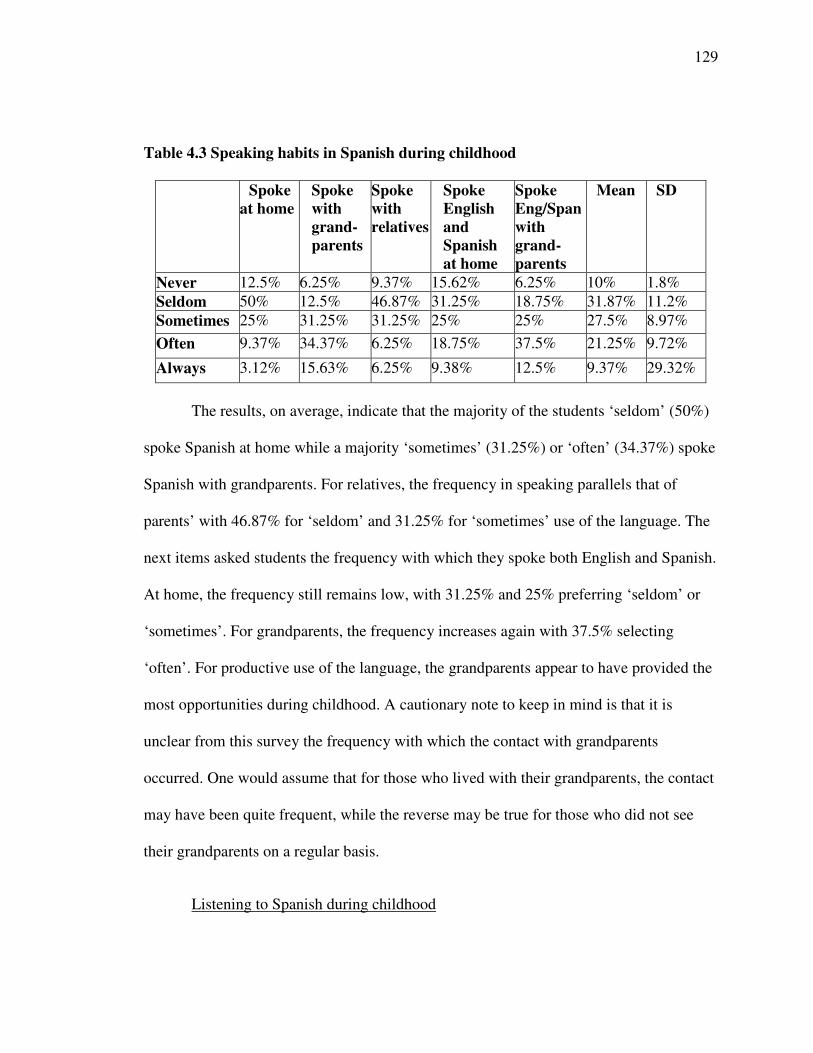
129
Table 4.3 Speaking habits in Spanish during childhood
Spokeat home
Spokewithgrand-parents
Spokewithrelatives
SpokeEnglishandSpanishat home
SpokeEng/Spanwithgrand-parents
Mean SD
Never 12.5% 6.25% 9.37% 15.62% 6.25% 10% 1.8%Seldom 50% 12.5% 46.87% 31.25% 18.75% 31.87% 11.2%Sometimes 25% 31.25% 31.25% 25% 25% 27.5% 8.97%
Often 9.37% 34.37% 6.25% 18.75% 37.5% 21.25% 9.72%
Always 3.12% 15.63% 6.25% 9.38% 12.5% 9.37% 29.32%
The results, on average, indicate that the majority of the students ‘seldom’ (50%)
spoke Spanish at home while a majority ‘sometimes’ (31.25%) or ‘often’ (34.37%) spoke
Spanish with grandparents. For relatives, the frequency in speaking parallels that of
parents’ with 46.87% for ‘seldom’ and 31.25% for ‘sometimes’ use of the language. The
next items asked students the frequency with which they spoke both English and Spanish.
At home, the frequency still remains low, with 31.25% and 25% preferring ‘seldom’ or
‘sometimes’. For grandparents, the frequency increases again with 37.5% selecting
‘often’. For productive use of the language, the grandparents appear to have provided the
most opportunities during childhood. A cautionary note to keep in mind is that it is
unclear from this survey the frequency with which the contact with grandparents
occurred. One would assume that for those who lived with their grandparents, the contact
may have been quite frequent, while the reverse may be true for those who did not see
their grandparents on a regular basis.
Listening to Spanish during childhood
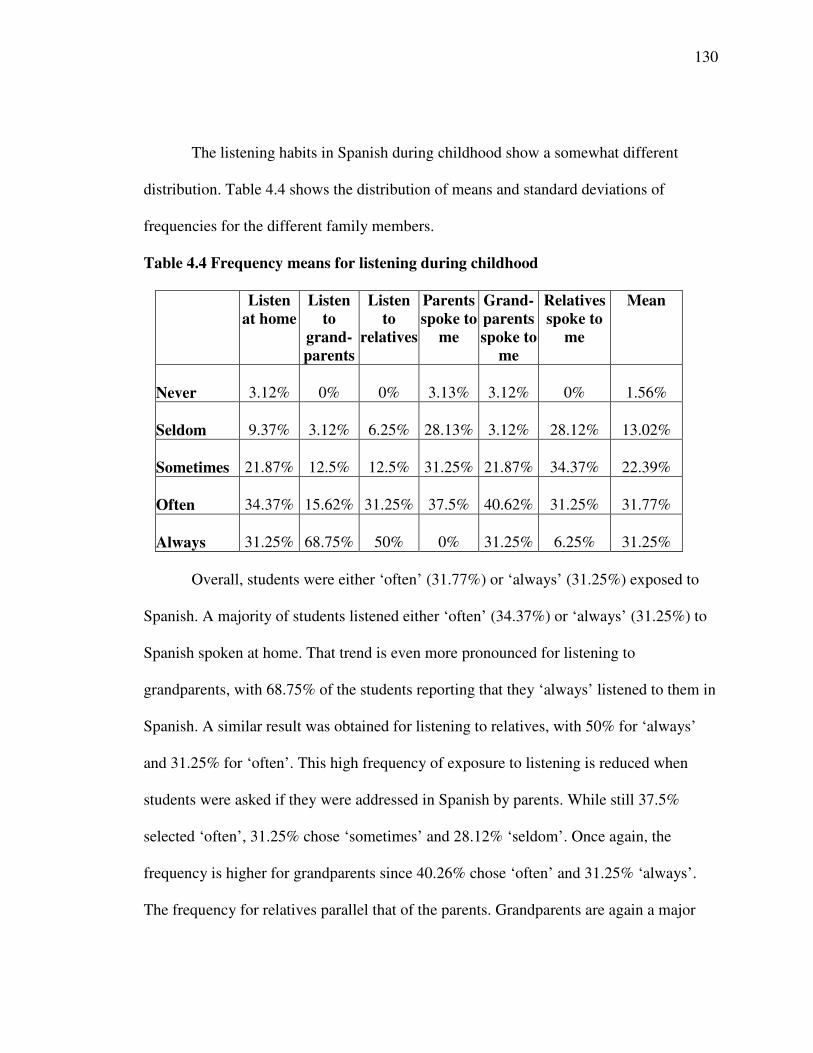
130
The listening habits in Spanish during childhood show a somewhat different
distribution. Table 4.4 shows the distribution of means and standard deviations of
frequencies for the different family members.
Table 4.4 Frequency means for listening during childhood
Listenat home
Listento
grand-parents
Listento
relatives
Parentsspoke to
me
Grand-parentsspoke to
me
Relativesspoke to
me
Mean
Never 3.12% 0% 0% 3.13% 3.12% 0% 1.56%
Seldom 9.37% 3.12% 6.25% 28.13% 3.12% 28.12% 13.02%
Sometimes 21.87% 12.5% 12.5% 31.25% 21.87% 34.37% 22.39%
Often 34.37% 15.62% 31.25% 37.5% 40.62% 31.25% 31.77%
Always 31.25% 68.75% 50% 0% 31.25% 6.25% 31.25%
Overall, students were either ‘often’ (31.77%) or ‘always’ (31.25%) exposed to
Spanish. A majority of students listened either ‘often’ (34.37%) or ‘always’ (31.25%) to
Spanish spoken at home. That trend is even more pronounced for listening to
grandparents, with 68.75% of the students reporting that they ‘always’ listened to them in
Spanish. A similar result was obtained for listening to relatives, with 50% for ‘always’
and 31.25% for ‘often’. This high frequency of exposure to listening is reduced when
students were asked if they were addressed in Spanish by parents. While still 37.5%
selected ‘often’, 31.25% chose ‘sometimes’ and 28.12% ‘seldom’. Once again, the
frequency is higher for grandparents since 40.26% chose ‘often’ and 31.25% ‘always’.
The frequency for relatives parallel that of the parents. Grandparents are again a major
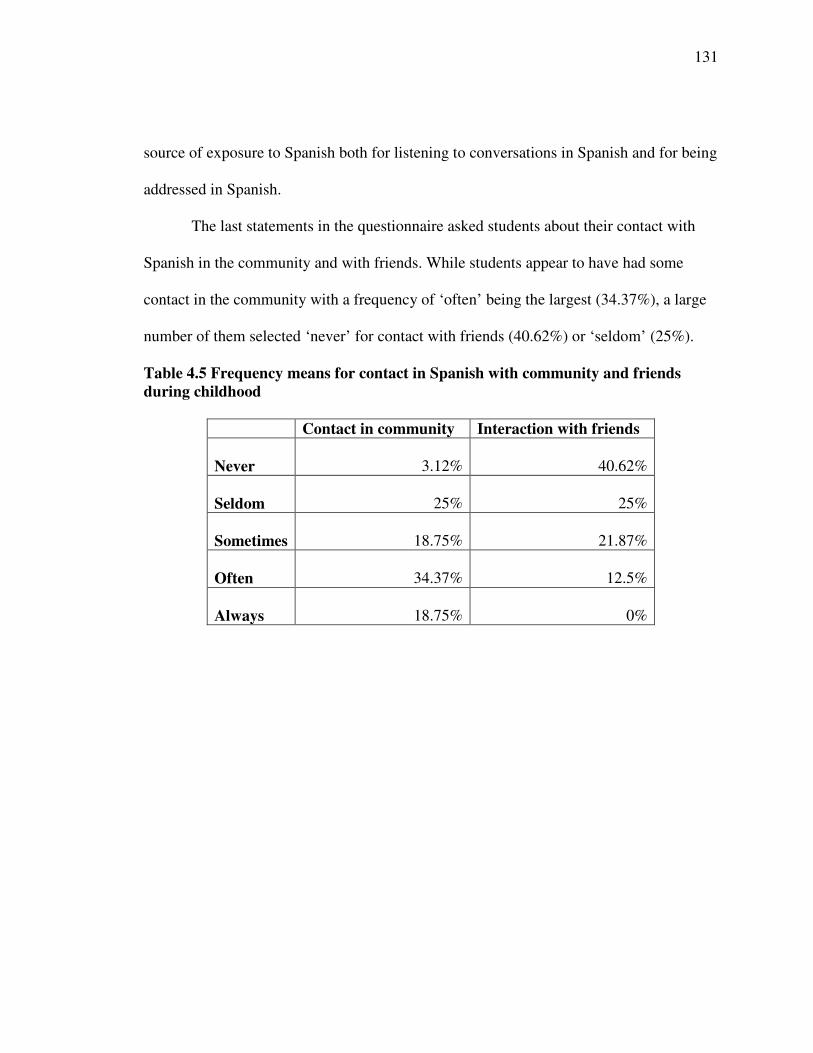
131
source of exposure to Spanish both for listening to conversations in Spanish and for being
addressed in Spanish.
The last statements in the questionnaire asked students about their contact with
Spanish in the community and with friends. While students appear to have had some
contact in the community with a frequency of ‘often’ being the largest (34.37%), a large
number of them selected ‘never’ for contact with friends (40.62%) or ‘seldom’ (25%).
Table 4.5 Frequency means for contact in Spanish with community and friendsduring childhood
Contact in community Interaction with friends
Never 3.12% 40.62%
Seldom 25% 25%
Sometimes 18.75% 21.87%
Often 34.37% 12.5%
Always 18.75% 0%
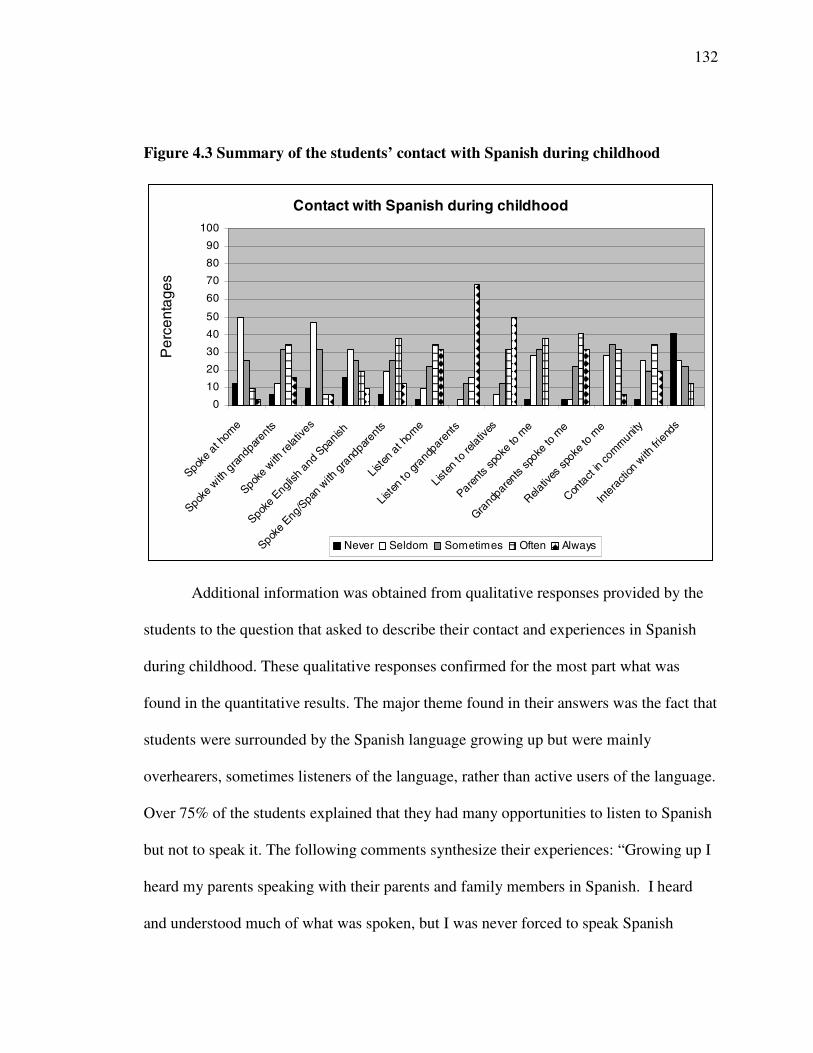
132
Figure 4.3 Summary of the students’ contact with Spanish during childhood
Contact with Spanish during childhood
0
10
20
30
40
50
60
70
80
90
100
Spoke
at hom
e
Spoke
withgra
ndpar
ents
Spoke
withre
latives
Spoke
English
andSpa
nish
Spoke
Eng/S
panwith
grand
parents
Listen
at hom
e
Listen
togr
andpar
ents
Listen
tore
lativ
es
Parents
spok
eto
me
Grandp
aren
tssp
oketo
me
Relativ
essp
oke to
me
Conta
ctin
com
munit
y
Intera
ction
withfri
ends
Per
cent
ages
Never Seldom Sometimes Often Always
Additional information was obtained from qualitative responses provided by the
students to the question that asked to describe their contact and experiences in Spanish
during childhood. These qualitative responses confirmed for the most part what was
found in the quantitative results. The major theme found in their answers was the fact that
students were surrounded by the Spanish language growing up but were mainly
overhearers, sometimes listeners of the language, rather than active users of the language.
Over 75% of the students explained that they had many opportunities to listen to Spanish
but not to speak it. The following comments synthesize their experiences: “Growing up I
heard my parents speaking with their parents and family members in Spanish. I heard
and understood much of what was spoken, but I was never forced to speak Spanish
133
myself” (Student in Spanish 103). “My mother never spoke Spanish to me at home but
we would always visit my grandmother and I would hear her and my mother speak
Spanish” (Student in Spanish103). “My mother and father are both native Spanish
speakers and they would often speak Spanish to each other and other relatives, but they
never spoke Spanish directly to me or my two brothers” (Student in Spanish 102). Over
half of the students expressed having overheard their parents or grandparents speaking
the language but never have been spoken to in Spanish by parents. Several students
(25%) also reported being more fluent in Spanish when they were children than now,
either fully fluent (half of them), or having the ability to understand a lot more or simply
know a lot more. “I spoke Spanish fluently until the age of seven. At this age I overheard
my grandmother speaking English and from there on I dropped Spanish and started using
English”; “As a child I feel I was more fluent”; “was fluent as a child but then my mother
started speaking English to me to learn English better then I forgot how to speak Spanish.
I understand half of what is said in Spanish but not a strong speaker of it.”
The qualitative student responses also confirmed the quantitative results that
indicated that the grandparents had been the main source of Spanish input for students.
Although a large number of students did not mention the circumstances or the people
with whom their contact with Spanish took place, 25% of the students mentioned their
grandparents as being the main source. The following are some of the students’
comments. “The contact that I had with Spanish as a child came mostly from my
grandparents, mainly on my father's side, since they spoke very little English I had to be
able to at least have a general understanding of what they were saying. So it was my
134
grandparents who had a greater influence on my speaking or understanding Spanish at
all”; “When I was a child, I was around Spanish with my grandparents. My grandmother
speaks mostly Spanish and she used to baby-sit me everyday before I started school while
my parents had to work.”
The last theme that appeared in the student responses was the fact that even
though they had opportunities to listen to Spanish, they were never expected or forced to
speak Spanish. “My parents never made an effort to make sure that we spoke the
language. My father was learning to speak English, so we had to help him, even if it
meant us only speaking English.” “When I was a child, I heard Spanish being spoken all
the time. My parents would speak to us children in Spanish, however we were never
expected to reply in Spanish.” “I hear Spanish almost everyday but I don’t have to speak
it because most of my family knows how to speak English also.”
Contact with Spanish media and print during childhood
Section IV in the first online questionnaire sought to determine the amount of
contact with Spanish students had beyond interactions with family members, friends, and
the community. To this effect, the questionnaire requested information on the students’
early contact with media and print in Spanish. Table 4.6 shows the number of students as
well as the percentages they represent of the total number of students that watched TV,
read, listened to the radio and music, as well as the amount of time they spent on each
activity.
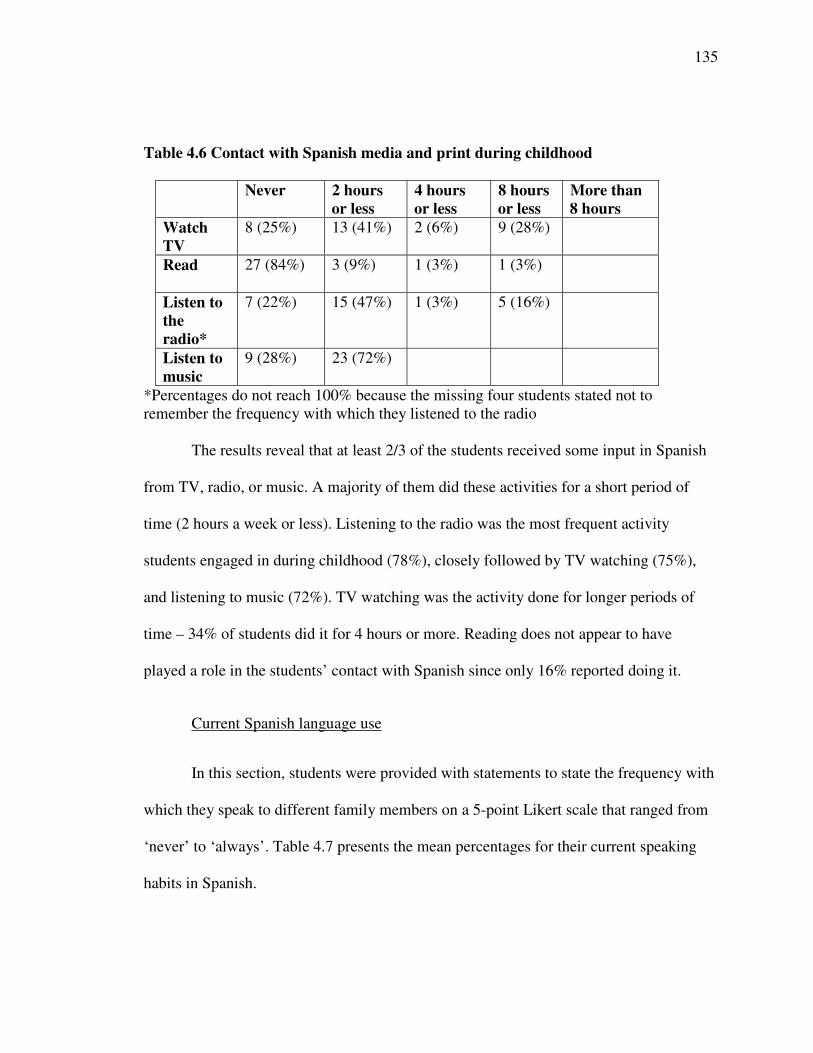
135
Table 4.6 Contact with Spanish media and print during childhood
Never 2 hoursor less
4 hoursor less
8 hoursor less
More than8 hours
WatchTV
8 (25%) 13 (41%) 2 (6%) 9 (28%)
Read 27 (84%) 3 (9%) 1 (3%) 1 (3%)
Listen totheradio*
7 (22%) 15 (47%) 1 (3%) 5 (16%)
Listen tomusic
9 (28%) 23 (72%)
*Percentages do not reach 100% because the missing four students stated not toremember the frequency with which they listened to the radio
The results reveal that at least 2/3 of the students received some input in Spanish
from TV, radio, or music. A majority of them did these activities for a short period of
time (2 hours a week or less). Listening to the radio was the most frequent activity
students engaged in during childhood (78%), closely followed by TV watching (75%),
and listening to music (72%). TV watching was the activity done for longer periods of
time – 34% of students did it for 4 hours or more. Reading does not appear to have
played a role in the students’ contact with Spanish since only 16% reported doing it.
Current Spanish language use
In this section, students were provided with statements to state the frequency with
which they speak to different family members on a 5-point Likert scale that ranged from
‘never’ to ‘always’. Table 4.7 presents the mean percentages for their current speaking
habits in Spanish.
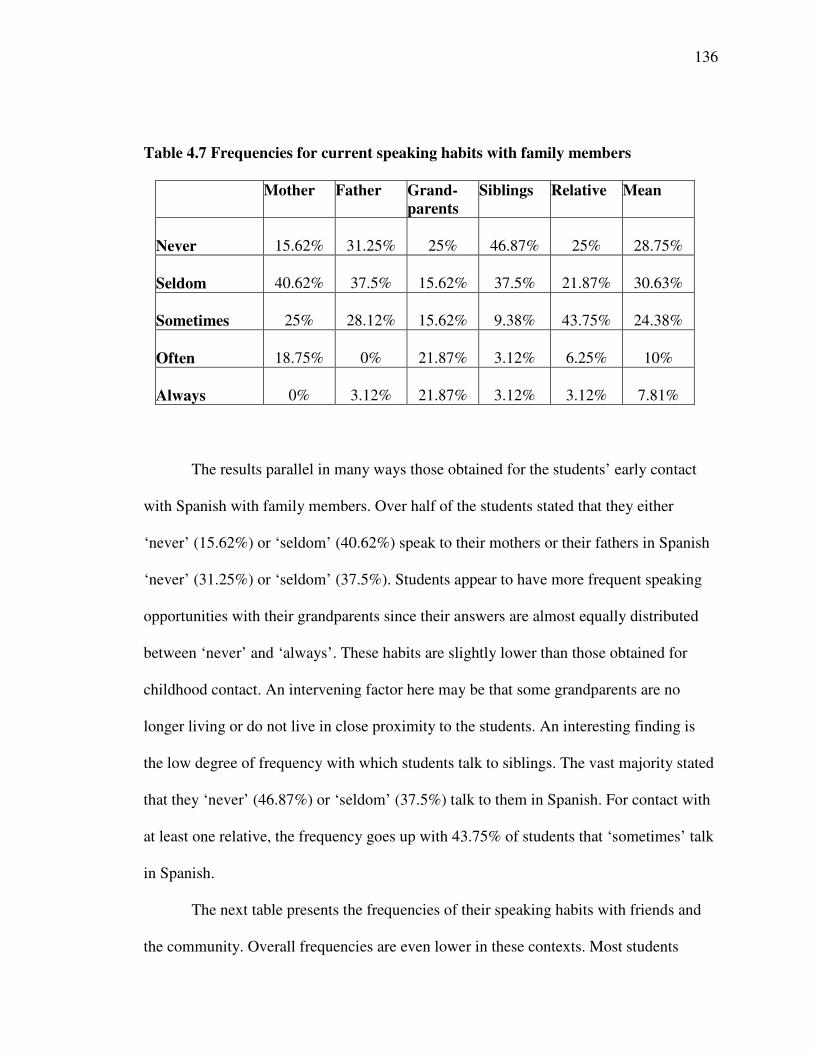
136
Table 4.7 Frequencies for current speaking habits with family members
Mother Father Grand-parents
Siblings Relative Mean
Never 15.62% 31.25% 25% 46.87% 25% 28.75%
Seldom 40.62% 37.5% 15.62% 37.5% 21.87% 30.63%
Sometimes 25% 28.12% 15.62% 9.38% 43.75% 24.38%
Often 18.75% 0% 21.87% 3.12% 6.25% 10%
Always 0% 3.12% 21.87% 3.12% 3.12% 7.81%
The results parallel in many ways those obtained for the students’ early contact
with Spanish with family members. Over half of the students stated that they either
‘never’ (15.62%) or ‘seldom’ (40.62%) speak to their mothers or their fathers in Spanish
‘never’ (31.25%) or ‘seldom’ (37.5%). Students appear to have more frequent speaking
opportunities with their grandparents since their answers are almost equally distributed
between ‘never’ and ‘always’. These habits are slightly lower than those obtained for
childhood contact. An intervening factor here may be that some grandparents are no
longer living or do not live in close proximity to the students. An interesting finding is
the low degree of frequency with which students talk to siblings. The vast majority stated
that they ‘never’ (46.87%) or ‘seldom’ (37.5%) talk to them in Spanish. For contact with
at least one relative, the frequency goes up with 43.75% of students that ‘sometimes’ talk
in Spanish.
The next table presents the frequencies of their speaking habits with friends and
the community. Overall frequencies are even lower in these contexts. Most students
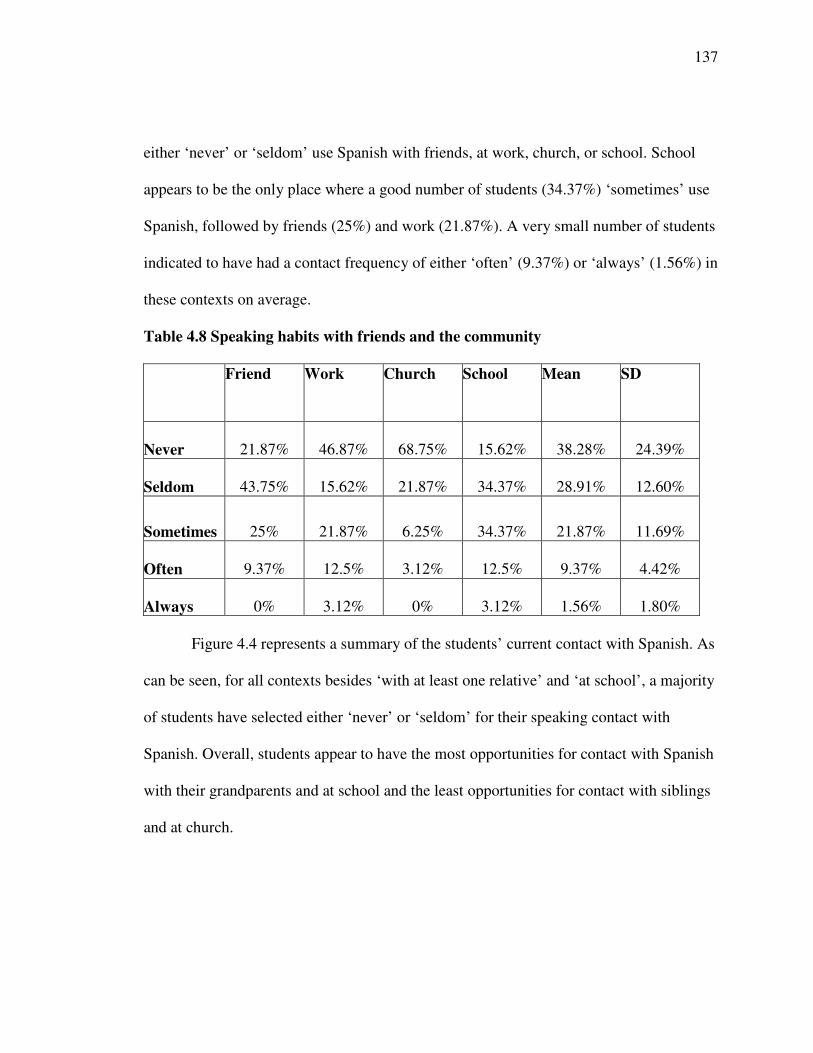
137
either ‘never’ or ‘seldom’ use Spanish with friends, at work, church, or school. School
appears to be the only place where a good number of students (34.37%) ‘sometimes’ use
Spanish, followed by friends (25%) and work (21.87%). A very small number of students
indicated to have had a contact frequency of either ‘often’ (9.37%) or ‘always’ (1.56%) in
these contexts on average.
Table 4.8 Speaking habits with friends and the community
Friend Work Church School Mean SD
Never 21.87% 46.87% 68.75% 15.62% 38.28% 24.39%
Seldom 43.75% 15.62% 21.87% 34.37% 28.91% 12.60%
Sometimes 25% 21.87% 6.25% 34.37% 21.87% 11.69%
Often 9.37% 12.5% 3.12% 12.5% 9.37% 4.42%
Always 0% 3.12% 0% 3.12% 1.56% 1.80%
Figure 4.4 represents a summary of the students’ current contact with Spanish. As
can be seen, for all contexts besides ‘with at least one relative’ and ‘at school’, a majority
of students have selected either ‘never’ or ‘seldom’ for their speaking contact with
Spanish. Overall, students appear to have the most opportunities for contact with Spanish
with their grandparents and at school and the least opportunities for contact with siblings
and at church.
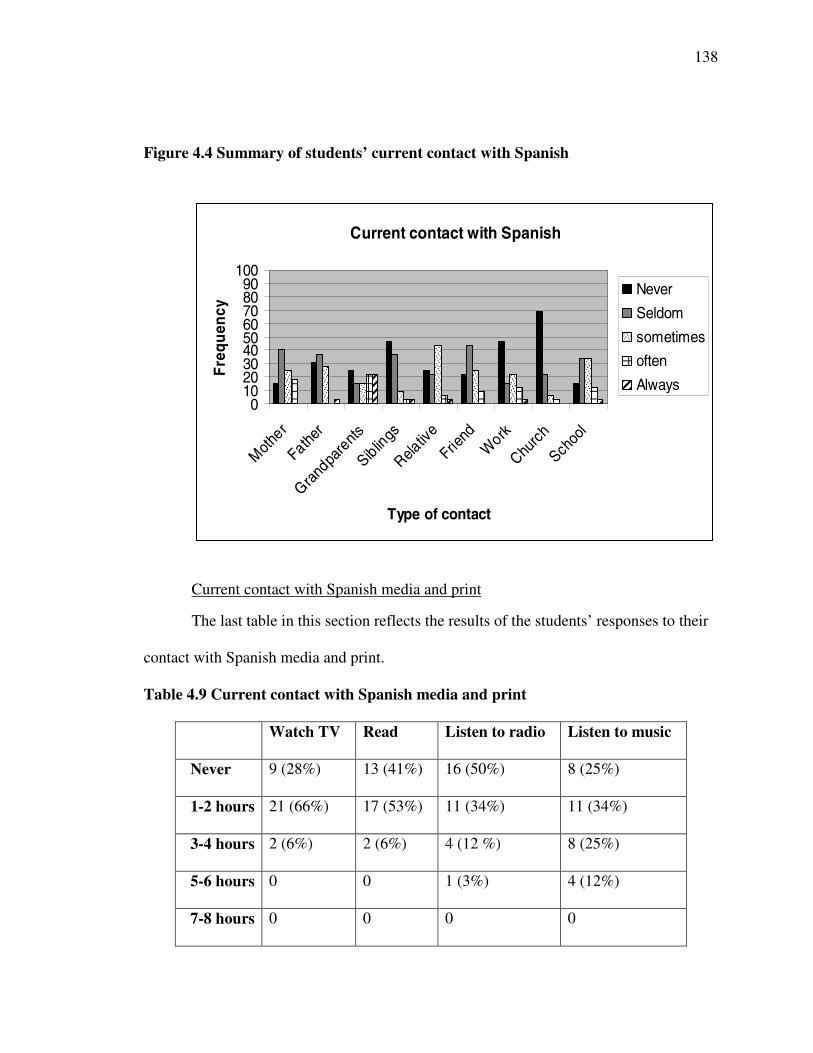
138
Figure 4.4 Summary of students’ current contact with Spanish
Current contact with Spanish
0102030405060708090
100
Moth
er
Father
Grand
pare
nts
Siblings
Relativ
e
Friend
Work
Churc
h
Schoo
l
Type of contact
Fre
quen
cy
Never
Seldom
sometimes
often
Always
Current contact with Spanish media and print
The last table in this section reflects the results of the students’ responses to their
contact with Spanish media and print.
Table 4.9 Current contact with Spanish media and print
Watch TV Read Listen to radio Listen to music
Never 9 (28%) 13 (41%) 16 (50%) 8 (25%)
1-2 hours 21 (66%) 17 (53%) 11 (34%) 11 (34%)
3-4 hours 2 (6%) 2 (6%) 4 (12 %) 8 (25%)
5-6 hours 0 0 1 (3%) 4 (12%)
7-8 hours 0 0 0 0
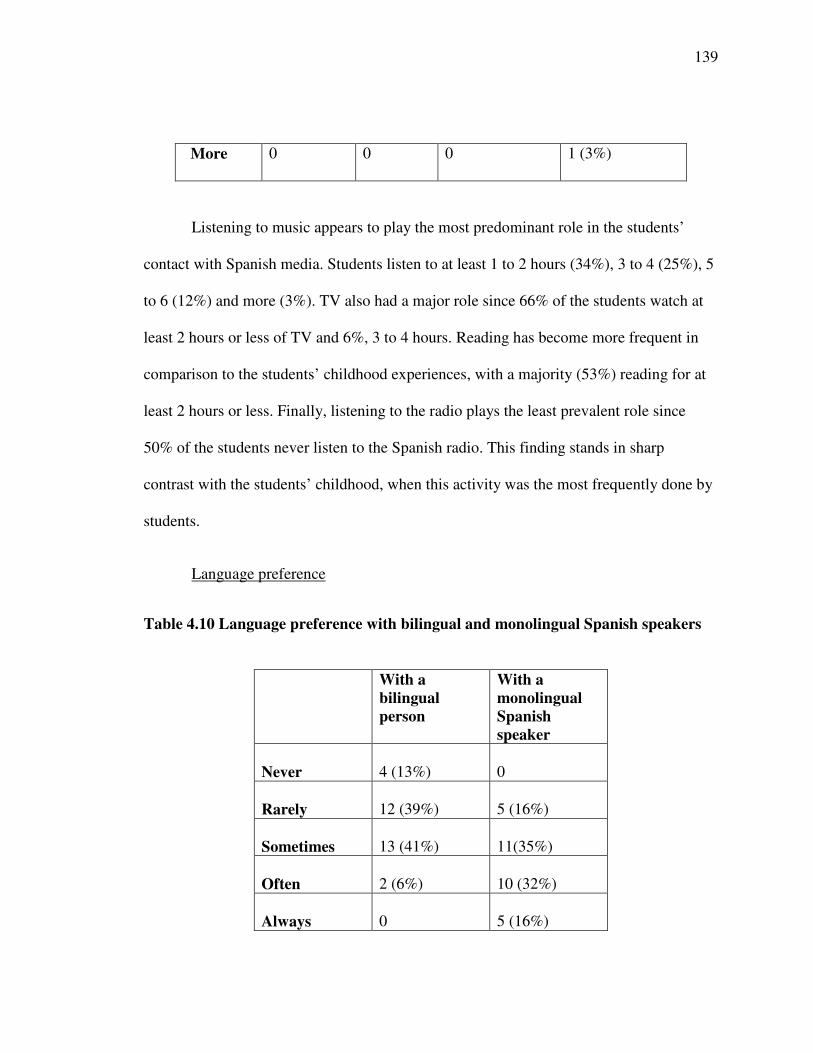
139
More 0 0 0 1 (3%)
Listening to music appears to play the most predominant role in the students’
contact with Spanish media. Students listen to at least 1 to 2 hours (34%), 3 to 4 (25%), 5
to 6 (12%) and more (3%). TV also had a major role since 66% of the students watch at
least 2 hours or less of TV and 6%, 3 to 4 hours. Reading has become more frequent in
comparison to the students’ childhood experiences, with a majority (53%) reading for at
least 2 hours or less. Finally, listening to the radio plays the least prevalent role since
50% of the students never listen to the Spanish radio. This finding stands in sharp
contrast with the students’ childhood, when this activity was the most frequently done by
students.
Language preference
Table 4.10 Language preference with bilingual and monolingual Spanish speakers
With abilingualperson
With amonolingualSpanishspeaker
Never 4 (13%) 0
Rarely 12 (39%) 5 (16%)
Sometimes 13 (41%) 11(35%)
Often 2 (6%) 10 (32%)
Always 0 5 (16%)
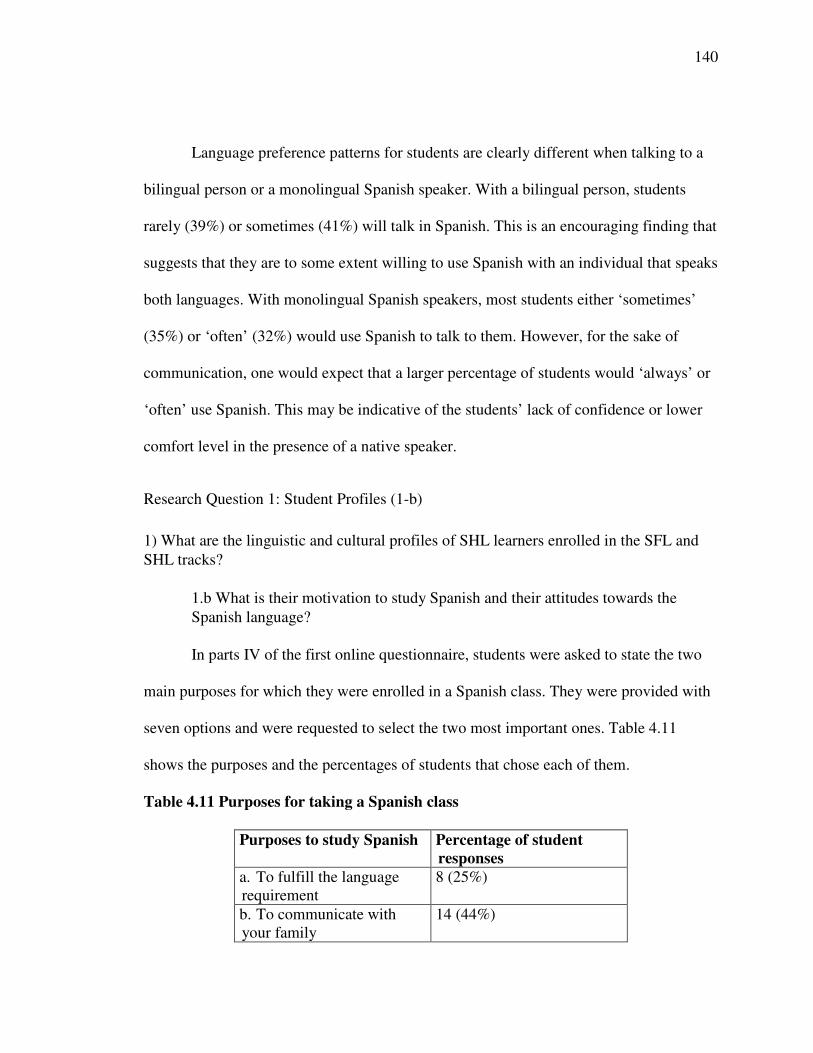
140
Language preference patterns for students are clearly different when talking to a
bilingual person or a monolingual Spanish speaker. With a bilingual person, students
rarely (39%) or sometimes (41%) will talk in Spanish. This is an encouraging finding that
suggests that they are to some extent willing to use Spanish with an individual that speaks
both languages. With monolingual Spanish speakers, most students either ‘sometimes’
(35%) or ‘often’ (32%) would use Spanish to talk to them. However, for the sake of
communication, one would expect that a larger percentage of students would ‘always’ or
‘often’ use Spanish. This may be indicative of the students’ lack of confidence or lower
comfort level in the presence of a native speaker.
Research Question 1: Student Profiles (1-b)
1) What are the linguistic and cultural profiles of SHL learners enrolled in the SFL andSHL tracks?
1.b What is their motivation to study Spanish and their attitudes towards theSpanish language?
In parts IV of the first online questionnaire, students were asked to state the two
main purposes for which they were enrolled in a Spanish class. They were provided with
seven options and were requested to select the two most important ones. Table 4.11
shows the purposes and the percentages of students that chose each of them.
Table 4.11 Purposes for taking a Spanish class
Purposes to study Spanish Percentage of studentresponses
a. To fulfill the languagerequirement
8 (25%)
b. To communicate withyour family
14 (44%)
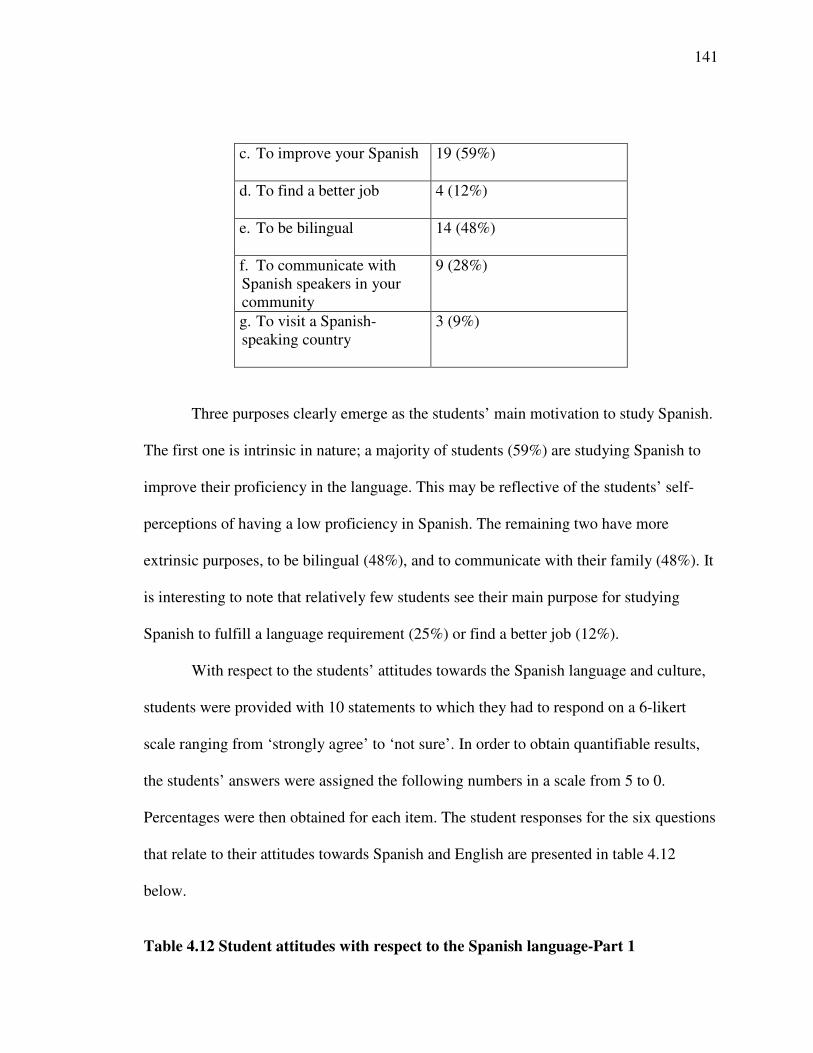
141
c. To improve your Spanish 19 (59%)
d. To find a better job 4 (12%)
e. To be bilingual 14 (48%)
f. To communicate withSpanish speakers in yourcommunity
9 (28%)
g. To visit a Spanish-speaking country
3 (9%)
Three purposes clearly emerge as the students’ main motivation to study Spanish.
The first one is intrinsic in nature; a majority of students (59%) are studying Spanish to
improve their proficiency in the language. This may be reflective of the students’ self-
perceptions of having a low proficiency in Spanish. The remaining two have more
extrinsic purposes, to be bilingual (48%), and to communicate with their family (48%). It
is interesting to note that relatively few students see their main purpose for studying
Spanish to fulfill a language requirement (25%) or find a better job (12%).
With respect to the students’ attitudes towards the Spanish language and culture,
students were provided with 10 statements to which they had to respond on a 6-likert
scale ranging from ‘strongly agree’ to ‘not sure’. In order to obtain quantifiable results,
the students’ answers were assigned the following numbers in a scale from 5 to 0.
Percentages were then obtained for each item. The student responses for the six questions
that relate to their attitudes towards Spanish and English are presented in table 4.12
below.
Table 4.12 Student attitudes with respect to the Spanish language-Part 1
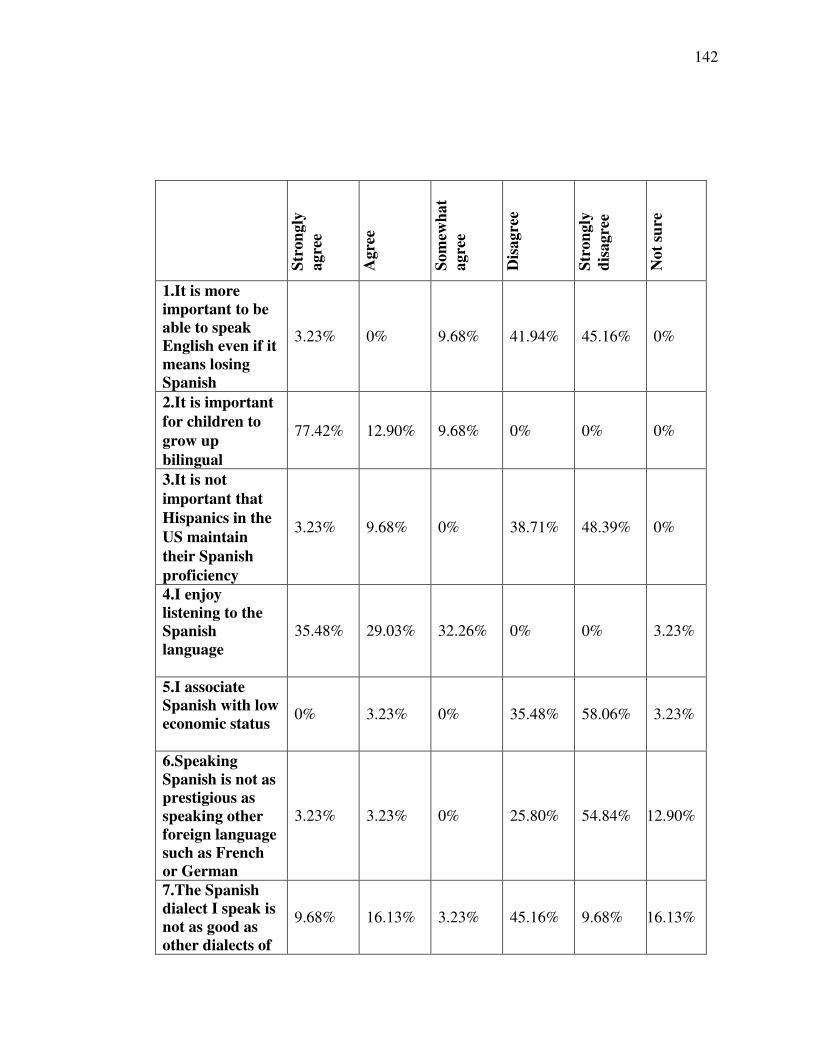
142
Stro
ngly
agre
e
Agr
ee
Som
ewha
tag
ree
Dis
agre
e
Stro
ngly
disa
gree
Not
sure
1.It is moreimportant to beable to speakEnglish even if itmeans losingSpanish
3.23% 0% 9.68% 41.94% 45.16% 0%
2.It is importantfor children togrow upbilingual
77.42% 12.90% 9.68% 0% 0% 0%
3.It is notimportant thatHispanics in theUS maintaintheir Spanishproficiency
3.23% 9.68% 0% 38.71% 48.39% 0%
4.I enjoylistening to theSpanishlanguage
35.48% 29.03% 32.26% 0% 0% 3.23%
5.I associateSpanish with loweconomic status
0% 3.23% 0% 35.48% 58.06% 3.23%
6.SpeakingSpanish is not asprestigious asspeaking otherforeign languagesuch as Frenchor German
3.23% 3.23% 0% 25.80% 54.84% 12.90%
7.The Spanishdialect I speak isnot as good asother dialects of
9.68% 16.13% 3.23% 45.16% 9.68% 16.13%
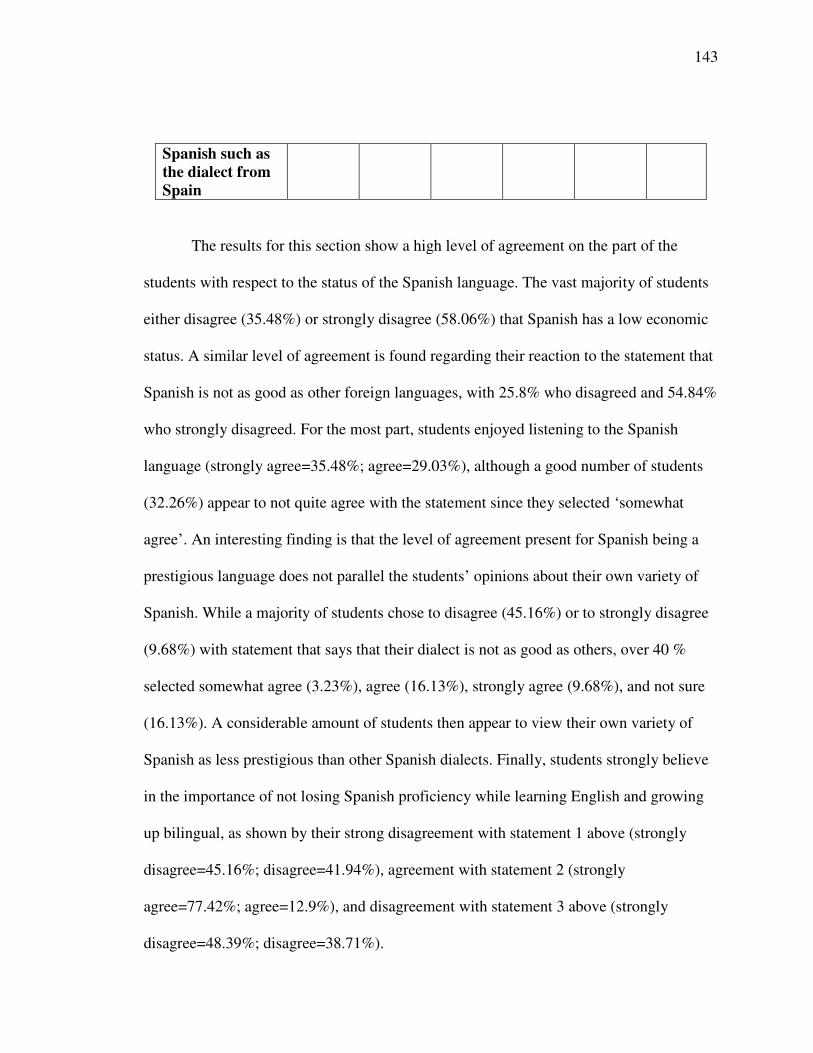
143
Spanish such asthe dialect fromSpain
The results for this section show a high level of agreement on the part of the
students with respect to the status of the Spanish language. The vast majority of students
either disagree (35.48%) or strongly disagree (58.06%) that Spanish has a low economic
status. A similar level of agreement is found regarding their reaction to the statement that
Spanish is not as good as other foreign languages, with 25.8% who disagreed and 54.84%
who strongly disagreed. For the most part, students enjoyed listening to the Spanish
language (strongly agree=35.48%; agree=29.03%), although a good number of students
(32.26%) appear to not quite agree with the statement since they selected ‘somewhat
agree’. An interesting finding is that the level of agreement present for Spanish being a
prestigious language does not parallel the students’ opinions about their own variety of
Spanish. While a majority of students chose to disagree (45.16%) or to strongly disagree
(9.68%) with statement that says that their dialect is not as good as others, over 40 %
selected somewhat agree (3.23%), agree (16.13%), strongly agree (9.68%), and not sure
(16.13%). A considerable amount of students then appear to view their own variety of
Spanish as less prestigious than other Spanish dialects. Finally, students strongly believe
in the importance of not losing Spanish proficiency while learning English and growing
up bilingual, as shown by their strong disagreement with statement 1 above (strongly
disagree=45.16%; disagree=41.94%), agreement with statement 2 (strongly
agree=77.42%; agree=12.9%), and disagreement with statement 3 above (strongly
disagree=48.39%; disagree=38.71%).
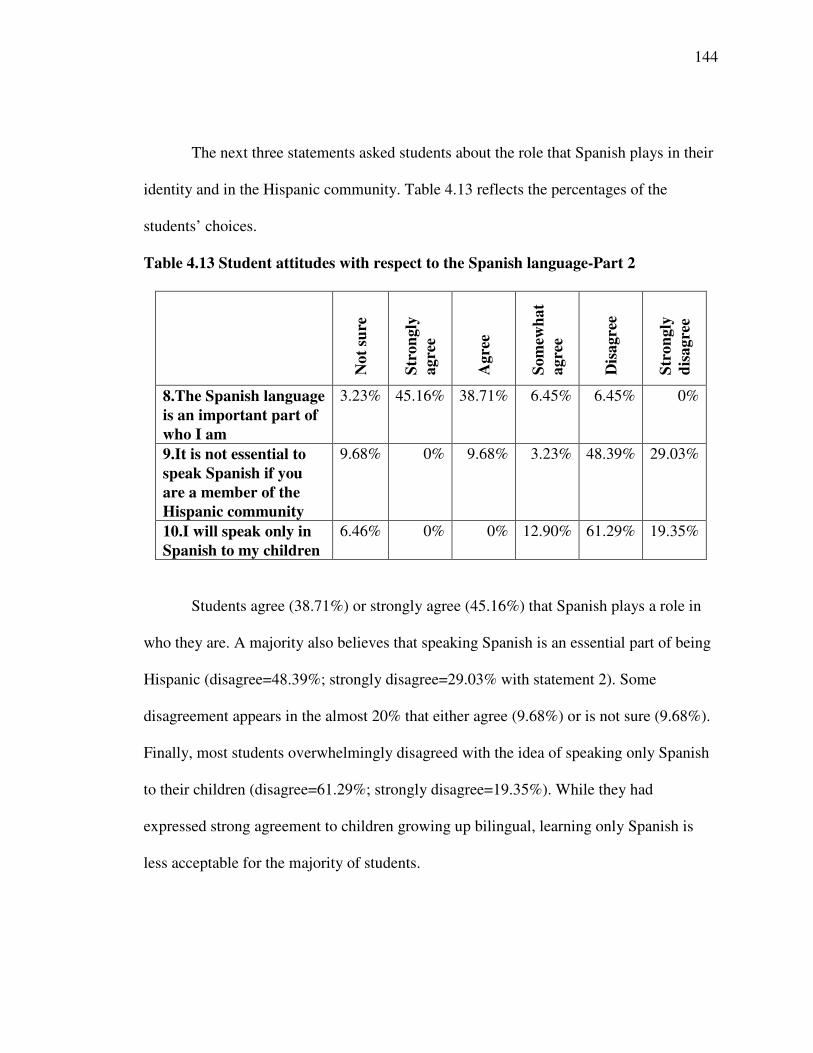
144
The next three statements asked students about the role that Spanish plays in their
identity and in the Hispanic community. Table 4.13 reflects the percentages of the
students’ choices.
Table 4.13 Student attitudes with respect to the Spanish language-Part 2
Not
sure
Stro
ngly
agre
e
Agr
ee
Som
ewha
tag
ree
Dis
agre
e
Stro
ngly
disa
gree
8.The Spanish languageis an important part ofwho I am
3.23% 45.16% 38.71% 6.45% 6.45% 0%
9.It is not essential tospeak Spanish if youare a member of theHispanic community
9.68% 0% 9.68% 3.23% 48.39% 29.03%
10.I will speak only inSpanish to my children
6.46% 0% 0% 12.90% 61.29% 19.35%
Students agree (38.71%) or strongly agree (45.16%) that Spanish plays a role in
who they are. A majority also believes that speaking Spanish is an essential part of being
Hispanic (disagree=48.39%; strongly disagree=29.03% with statement 2). Some
disagreement appears in the almost 20% that either agree (9.68%) or is not sure (9.68%).
Finally, most students overwhelmingly disagreed with the idea of speaking only Spanish
to their children (disagree=61.29%; strongly disagree=19.35%). While they had
expressed strong agreement to children growing up bilingual, learning only Spanish is
less acceptable for the majority of students.
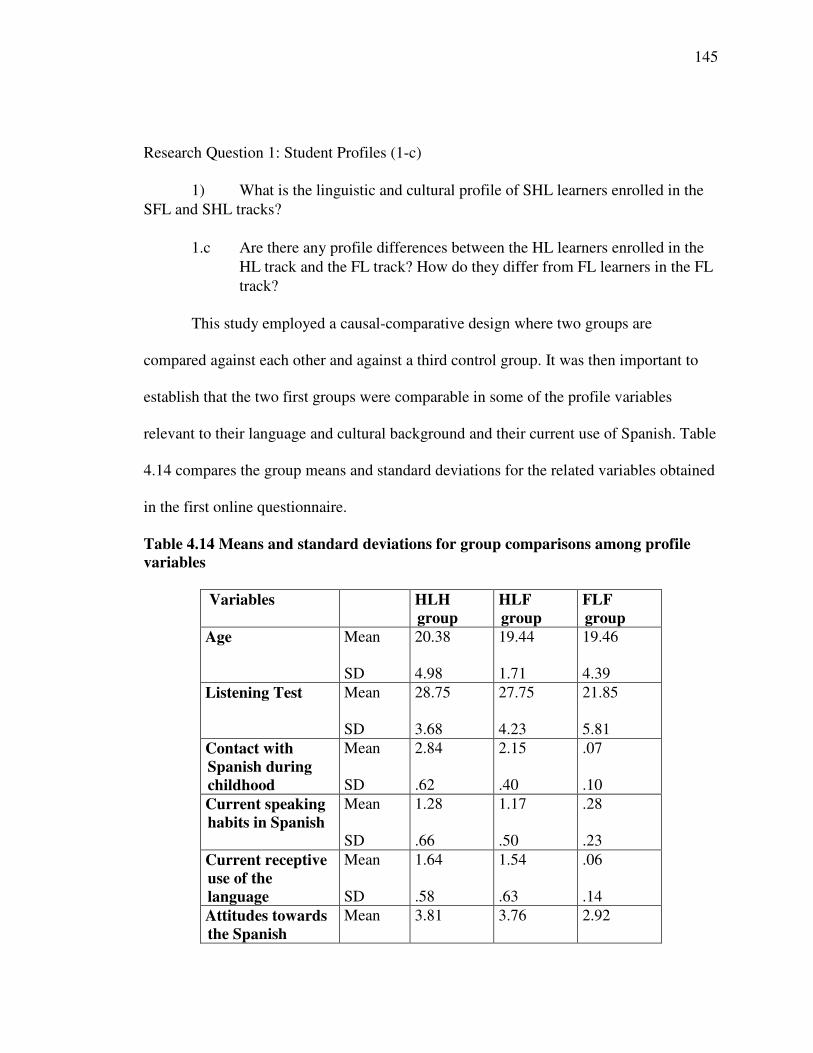
145
Research Question 1: Student Profiles (1-c)
1) What is the linguistic and cultural profile of SHL learners enrolled in theSFL and SHL tracks?
1.c Are there any profile differences between the HL learners enrolled in theHL track and the FL track? How do they differ from FL learners in the FLtrack?
This study employed a causal-comparative design where two groups are
compared against each other and against a third control group. It was then important to
establish that the two first groups were comparable in some of the profile variables
relevant to their language and cultural background and their current use of Spanish. Table
4.14 compares the group means and standard deviations for the related variables obtained
in the first online questionnaire.
Table 4.14 Means and standard deviations for group comparisons among profilevariables
Variables HLHgroup
HLFgroup
FLFgroup
Age Mean
SD
20.38
4.98
19.44
1.71
19.46
4.39Listening Test Mean
SD
28.75
3.68
27.75
4.23
21.85
5.81Contact withSpanish duringchildhood
Mean
SD
2.84
.62
2.15
.40
.07
.10Current speakinghabits in Spanish
Mean
SD
1.28
.66
1.17
.50
.28
.23Current receptiveuse of thelanguage
Mean
SD
1.64
.58
1.54
.63
.06
.14Attitudes towardsthe Spanish
Mean 3.81 3.76 2.92
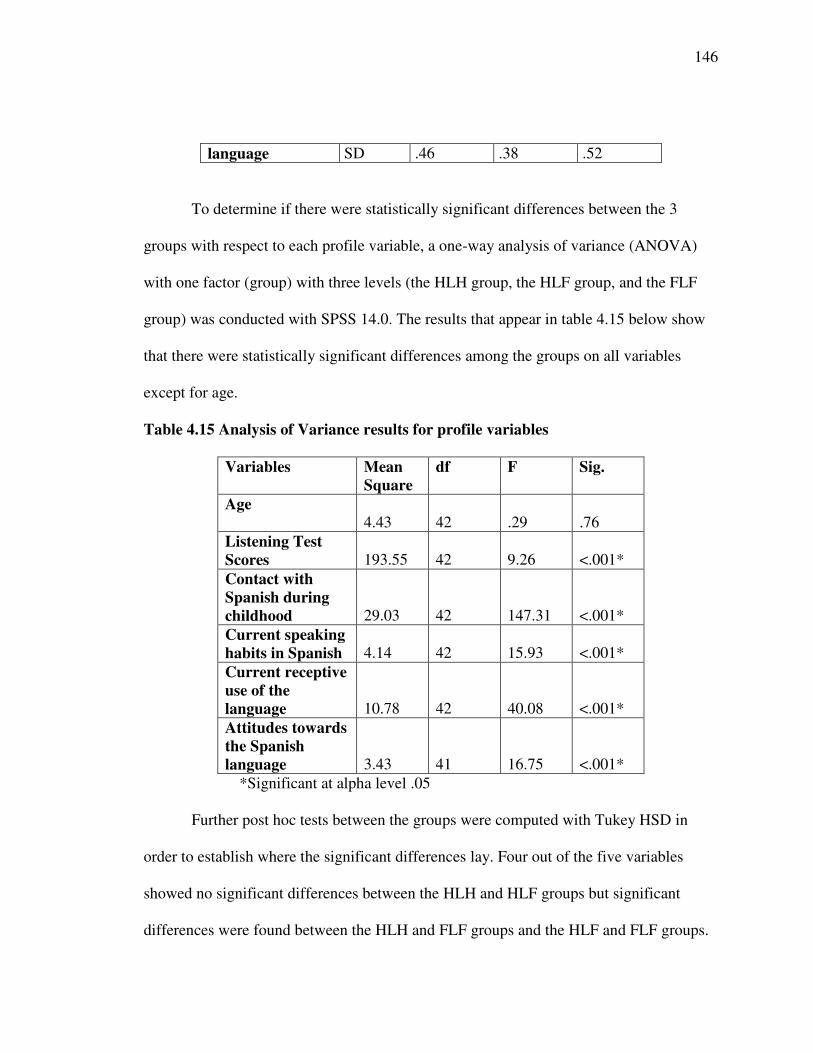
146
language SD .46 .38 .52
To determine if there were statistically significant differences between the 3
groups with respect to each profile variable, a one-way analysis of variance (ANOVA)
with one factor (group) with three levels (the HLH group, the HLF group, and the FLF
group) was conducted with SPSS 14.0. The results that appear in table 4.15 below show
that there were statistically significant differences among the groups on all variables
except for age.
Table 4.15 Analysis of Variance results for profile variables
Variables MeanSquare
df F Sig.
Age4.43 42 .29 .76
Listening TestScores 193.55 42 9.26 <.001*Contact withSpanish duringchildhood 29.03 42 147.31 <.001*Current speakinghabits in Spanish 4.14 42 15.93 <.001*Current receptiveuse of thelanguage 10.78 42 40.08 <.001*Attitudes towardsthe Spanishlanguage 3.43 41 16.75 <.001*
*Significant at alpha level .05
Further post hoc tests between the groups were computed with Tukey HSD in
order to establish where the significant differences lay. Four out of the five variables
showed no significant differences between the HLH and HLF groups but significant
differences were found between the HLH and FLF groups and the HLF and FLF groups.
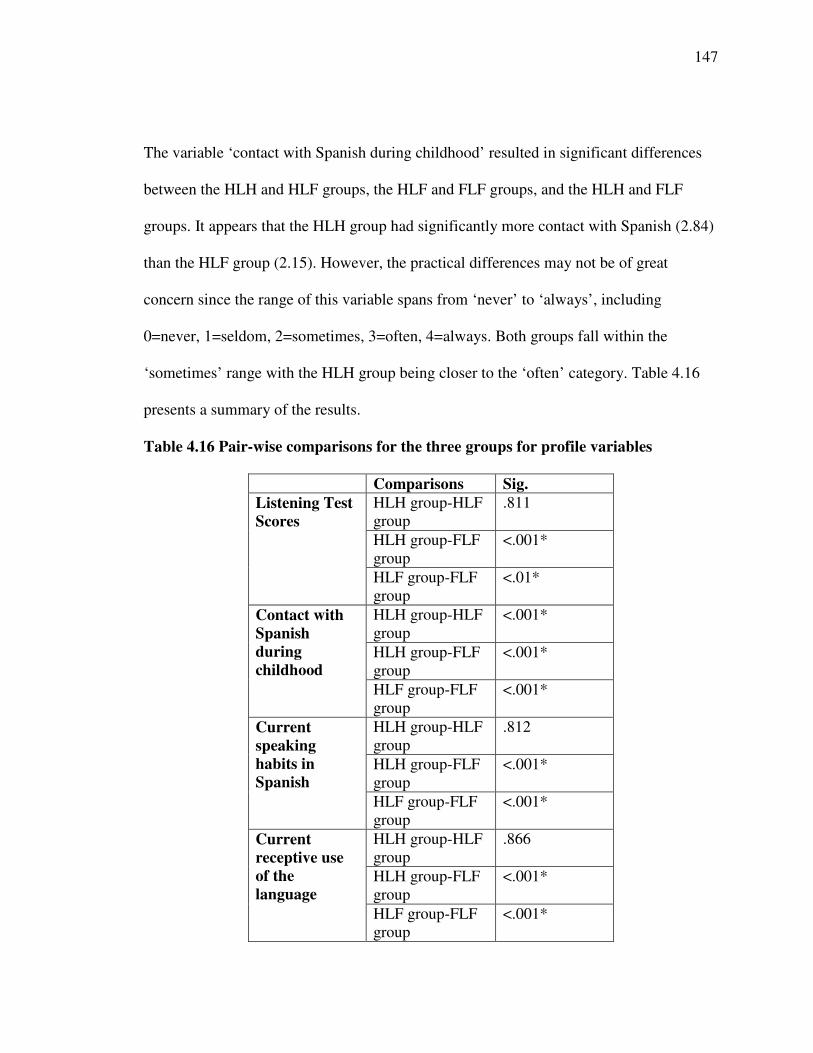
147
The variable ‘contact with Spanish during childhood’ resulted in significant differences
between the HLH and HLF groups, the HLF and FLF groups, and the HLH and FLF
groups. It appears that the HLH group had significantly more contact with Spanish (2.84)
than the HLF group (2.15). However, the practical differences may not be of great
concern since the range of this variable spans from ‘never’ to ‘always’, including
0=never, 1=seldom, 2=sometimes, 3=often, 4=always. Both groups fall within the
‘sometimes’ range with the HLH group being closer to the ‘often’ category. Table 4.16
presents a summary of the results.
Table 4.16 Pair-wise comparisons for the three groups for profile variables
Comparisons Sig.HLH group-HLFgroup
.811
HLH group-FLFgroup
<.001*
Listening TestScores
HLF group-FLFgroup
<.01*
HLH group-HLFgroup
<.001*
HLH group-FLFgroup
<.001*
Contact withSpanishduringchildhood
HLF group-FLFgroup
<.001*
HLH group-HLFgroup
.812
HLH group-FLFgroup
<.001*
Currentspeakinghabits inSpanish
HLF group-FLFgroup
<.001*
HLH group-HLFgroup
.866
HLH group-FLFgroup
<.001*
Currentreceptive useof thelanguage
HLF group-FLFgroup
<.001*
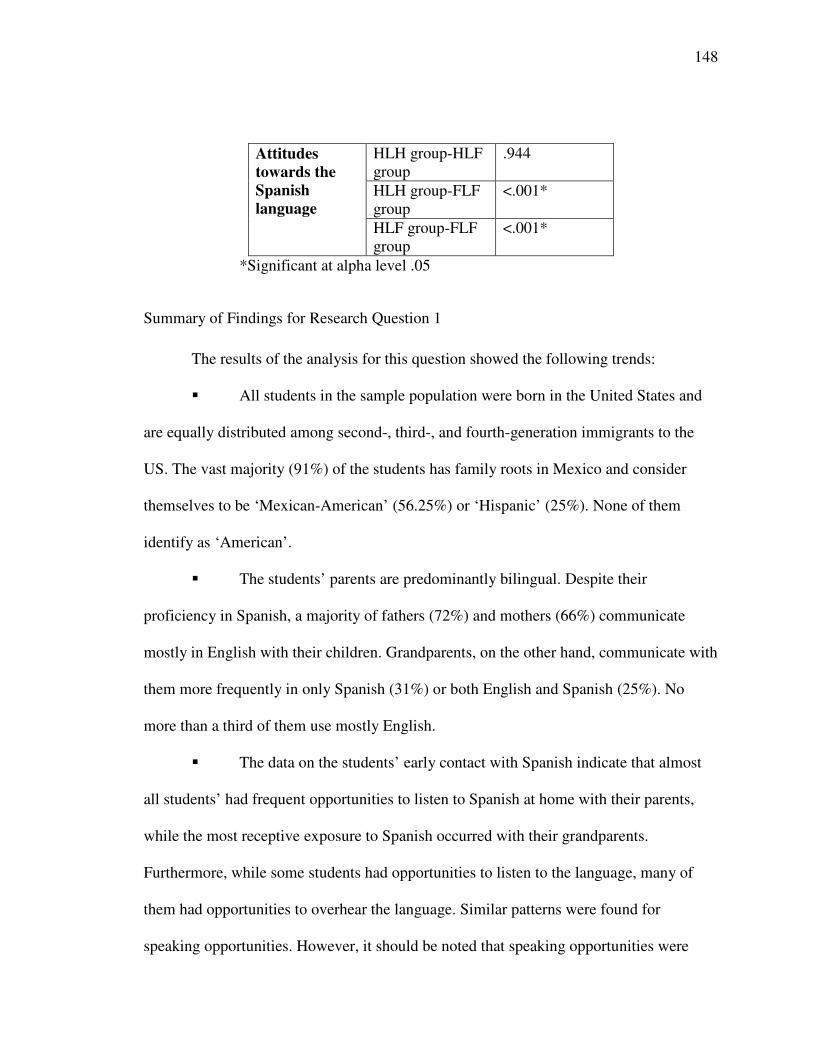
148
HLH group-HLFgroup
.944
HLH group-FLFgroup
<.001*
Attitudestowards theSpanishlanguage
HLF group-FLFgroup
<.001*
*Significant at alpha level .05
Summary of Findings for Research Question 1
The results of the analysis for this question showed the following trends:
� All students in the sample population were born in the United States and
are equally distributed among second-, third-, and fourth-generation immigrants to the
US. The vast majority (91%) of the students has family roots in Mexico and consider
themselves to be ‘Mexican-American’ (56.25%) or ‘Hispanic’ (25%). None of them
identify as ‘American’.
� The students’ parents are predominantly bilingual. Despite their
proficiency in Spanish, a majority of fathers (72%) and mothers (66%) communicate
mostly in English with their children. Grandparents, on the other hand, communicate with
them more frequently in only Spanish (31%) or both English and Spanish (25%). No
more than a third of them use mostly English.
� The data on the students’ early contact with Spanish indicate that almost
all students’ had frequent opportunities to listen to Spanish at home with their parents,
while the most receptive exposure to Spanish occurred with their grandparents.
Furthermore, while some students had opportunities to listen to the language, many of
them had opportunities to overhear the language. Similar patterns were found for
speaking opportunities. However, it should be noted that speaking opportunities were
149
fewer with parents but more frequent with grandparents in comparison with listening
opportunities. Friends and the community offered minimal chances for students to use the
language. Their exposure to Spanish media also played a role for a majority of students,
though the amount of contact with TV, radio, and music was quite minimal. The results
for their current contact with Spanish parallels in many ways their early contact
experiences. Students have the most opportunities for contact with Spanish with their
grandparents and at school and the least opportunities for contact with siblings and at
church. Spanish media continues to play some role in the students’ contact with Spanish,
especially music, TV, and reading.
� The students’ main motivations to learn Spanish are to improve their
proficiency in Spanish, to be bilingual, and to communicate with their family. Their
attitudes toward the Spanish language are positive. They do not associate Spanish with a
low status or having less prestige than other foreign languages. Their attitudes are less
positive with regard to their own variety of Spanish. Also, while they all highly value
being bilingual, they disagreed about raising their children monolingual in Spanish.
Finally, students believe that speaking Spanish is an important part of being Hispanic.
The results of a group comparison among different variables, including age, listening
scores, contact with Spanish during childhood, current speaking contact with Spanish,
current receptive contact with the language, and attitudes towards Spanish, showed that,
with the exception of age, there are significant differences between the two HL groups
and the FL group. There were no differences, however, between the two HL groups in all

150
variables except one, a slightly higher contact with Spanish during childhood for the
HLH group.
Research Question 2: Differential Gains (2-a)
2) What differential gains are there between the HL learners enrolled in the HL
track, those HL learners enrolled in the FL track and FL learners enrolled in the FL track
after one semester of instruction?
2.a To what extent do the students differ in their language outputdevelopment in measures of fluency, accuracy, and complexity?
The study involves two types of elicitation tasks: written and oral, with two tasks
each. The results for each sets of tasks – two oral and two written – will be presented
separately. The first oral-elicitation task (task 1) consisted of a guided personal narrative
and the second oral-elicitation task was a story-telling (task 2). The first written-
elicitation task comprised a personal letter-writing and the second one a story-telling
activity. The same tasks were used for the beginning and end of the semester.
Written-Elicitation Tasks
Three measures of language development in writing were analyzed to answer this
question: fluency, accuracy, and complexity in each the two tasks at the beginning and
end of the semester. A total of 45 subjects (HLH group=16; HLF group=16, and FLF
group=13) participated in these tasks. One subject in the HLF group did not complete the
second task so only the results for task 1 were analyzed. The total amount of student
production resulted in a corpus of 25,079 of words (see appendix F for a sample of a
subject’s writing from the HLH group).
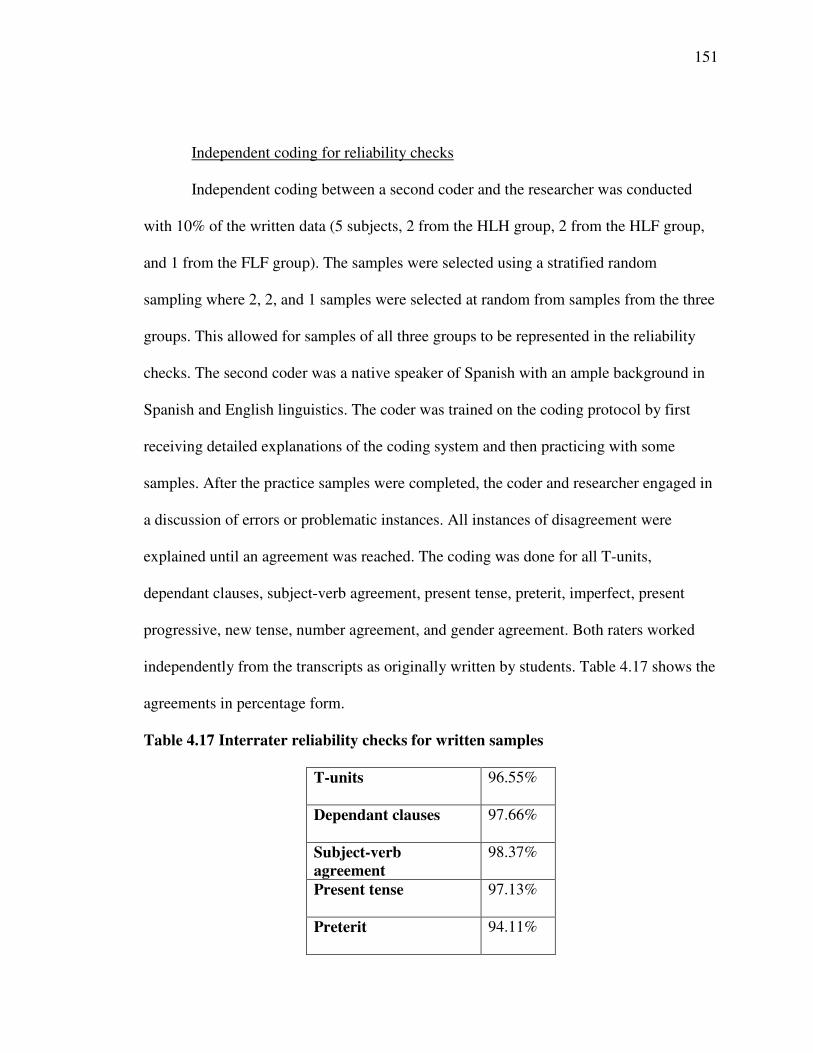
151
Independent coding for reliability checks
Independent coding between a second coder and the researcher was conducted
with 10% of the written data (5 subjects, 2 from the HLH group, 2 from the HLF group,
and 1 from the FLF group). The samples were selected using a stratified random
sampling where 2, 2, and 1 samples were selected at random from samples from the three
groups. This allowed for samples of all three groups to be represented in the reliability
checks. The second coder was a native speaker of Spanish with an ample background in
Spanish and English linguistics. The coder was trained on the coding protocol by first
receiving detailed explanations of the coding system and then practicing with some
samples. After the practice samples were completed, the coder and researcher engaged in
a discussion of errors or problematic instances. All instances of disagreement were
explained until an agreement was reached. The coding was done for all T-units,
dependant clauses, subject-verb agreement, present tense, preterit, imperfect, present
progressive, new tense, number agreement, and gender agreement. Both raters worked
independently from the transcripts as originally written by students. Table 4.17 shows the
agreements in percentage form.
Table 4.17 Interrater reliability checks for written samples
T-units 96.55%
Dependant clauses 97.66%
Subject-verbagreement
98.37%
Present tense 97.13%
Preterit 94.11%
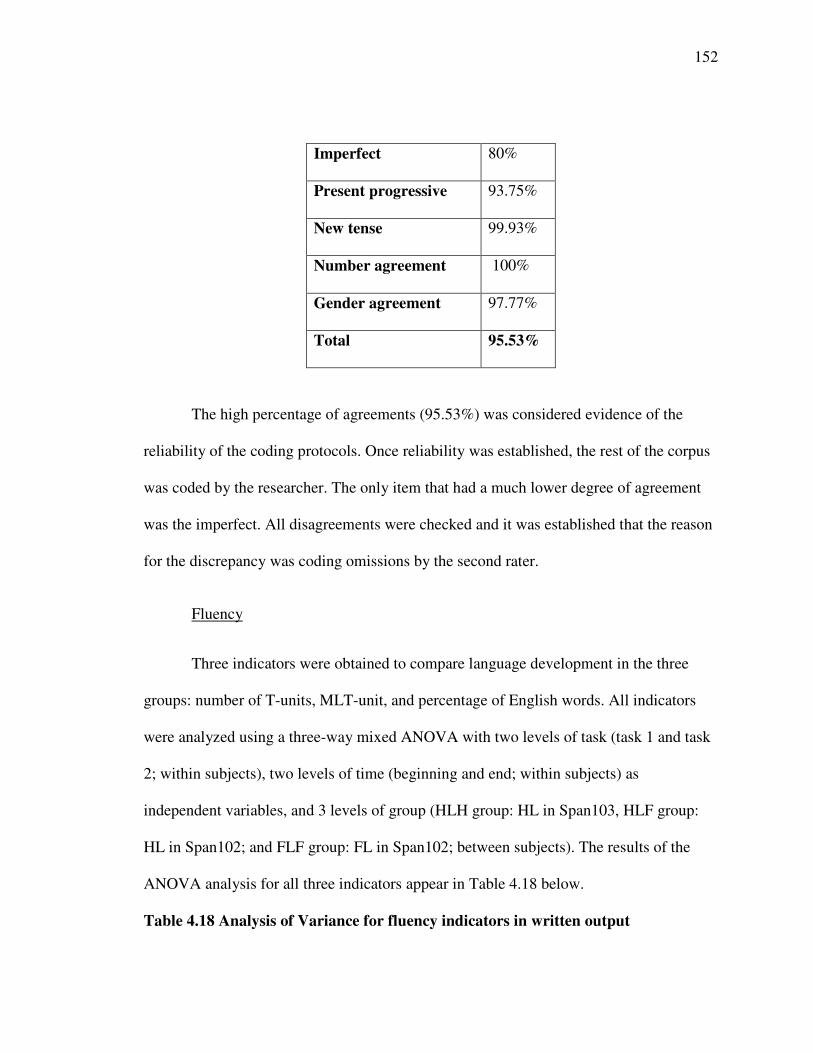
152
Imperfect 80%
Present progressive 93.75%
New tense 99.93%
Number agreement 100%
Gender agreement 97.77%
Total 95.53%
The high percentage of agreements (95.53%) was considered evidence of the
reliability of the coding protocols. Once reliability was established, the rest of the corpus
was coded by the researcher. The only item that had a much lower degree of agreement
was the imperfect. All disagreements were checked and it was established that the reason
for the discrepancy was coding omissions by the second rater.
Fluency
Three indicators were obtained to compare language development in the three
groups: number of T-units, MLT-unit, and percentage of English words. All indicators
were analyzed using a three-way mixed ANOVA with two levels of task (task 1 and task
2; within subjects), two levels of time (beginning and end; within subjects) as
independent variables, and 3 levels of group (HLH group: HL in Span103, HLF group:
HL in Span102; and FLF group: FL in Span102; between subjects). The results of the
ANOVA analysis for all three indicators appear in Table 4.18 below.
Table 4.18 Analysis of Variance for fluency indicators in written output
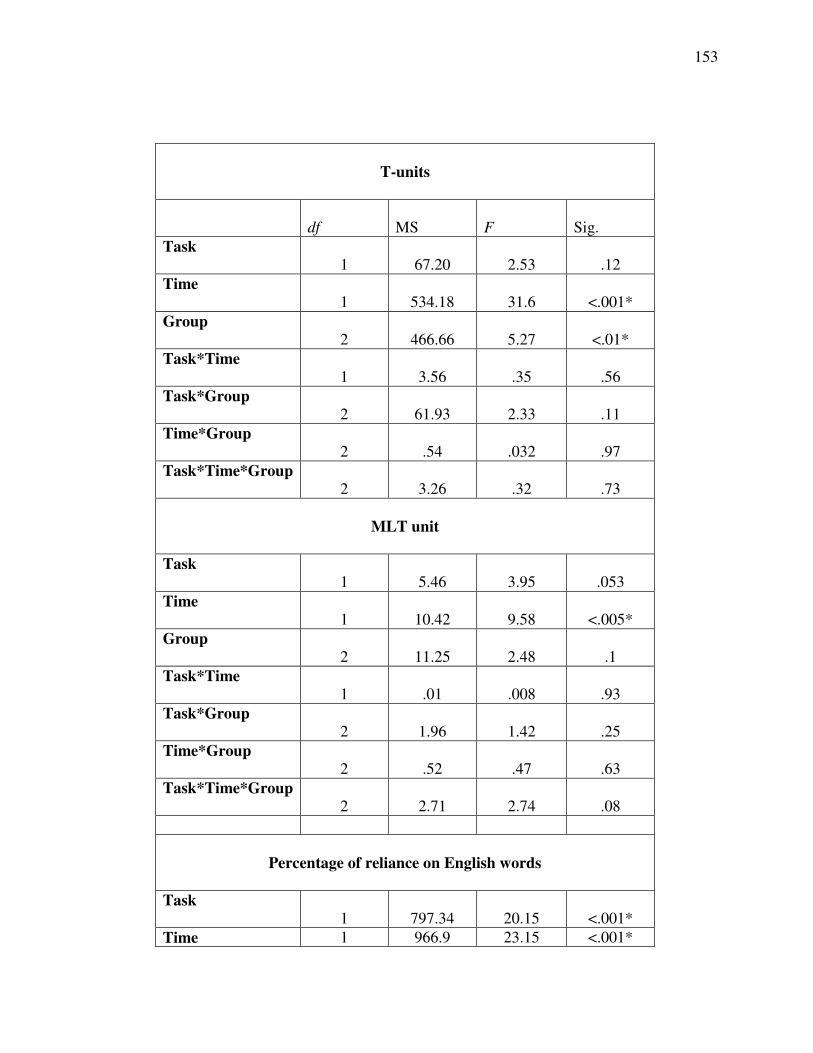
153
T-units
df MS F Sig.Task
1 67.20 2.53 .12Time
1 534.18 31.6 <.001*Group
2 466.66 5.27 <.01*Task*Time
1 3.56 .35 .56Task*Group
2 61.93 2.33 .11Time*Group
2 .54 .032 .97Task*Time*Group
2 3.26 .32 .73
MLT unit
Task1 5.46 3.95 .053
Time1 10.42 9.58 <.005*
Group2 11.25 2.48 .1
Task*Time1 .01 .008 .93
Task*Group2 1.96 1.42 .25
Time*Group2 .52 .47 .63
Task*Time*Group2 2.71 2.74 .08
Percentage of reliance on English words
Task1 797.34 20.15 <.001*
Time 1 966.9 23.15 <.001*
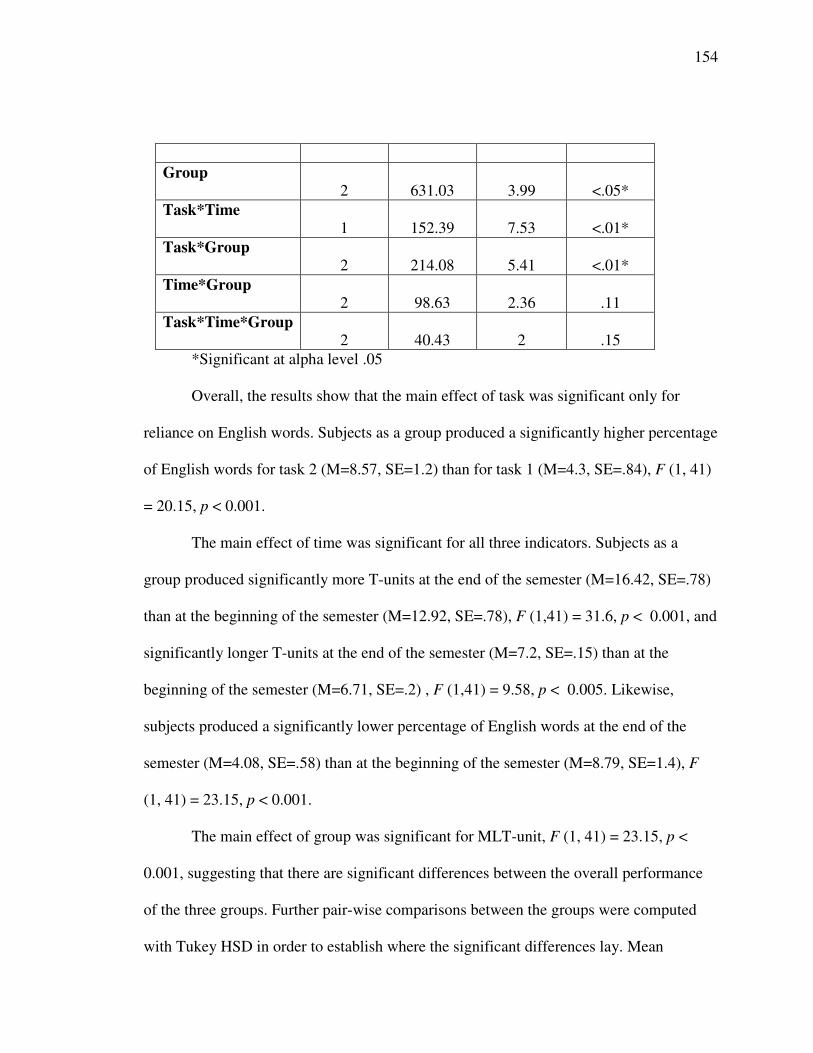
154
Group2 631.03 3.99 <.05*
Task*Time1 152.39 7.53 <.01*
Task*Group2 214.08 5.41 <.01*
Time*Group2 98.63 2.36 .11
Task*Time*Group2 40.43 2 .15
*Significant at alpha level .05
Overall, the results show that the main effect of task was significant only for
reliance on English words. Subjects as a group produced a significantly higher percentage
of English words for task 2 (M=8.57, SE=1.2) than for task 1 (M=4.3, SE=.84), F (1, 41)
= 20.15, p < 0.001.
The main effect of time was significant for all three indicators. Subjects as a
group produced significantly more T-units at the end of the semester (M=16.42, SE=.78)
than at the beginning of the semester (M=12.92, SE=.78), F (1,41) = 31.6, p < 0.001, and
significantly longer T-units at the end of the semester (M=7.2, SE=.15) than at the
beginning of the semester (M=6.71, SE=.2) , F (1,41) = 9.58, p < 0.005. Likewise,
subjects produced a significantly lower percentage of English words at the end of the
semester (M=4.08, SE=.58) than at the beginning of the semester (M=8.79, SE=1.4), F
(1, 41) = 23.15, p < 0.001.
The main effect of group was significant for MLT-unit, F (1, 41) = 23.15, p <
0.001, suggesting that there are significant differences between the overall performance
of the three groups. Further pair-wise comparisons between the groups were computed
with Tukey HSD in order to establish where the significant differences lay. Mean
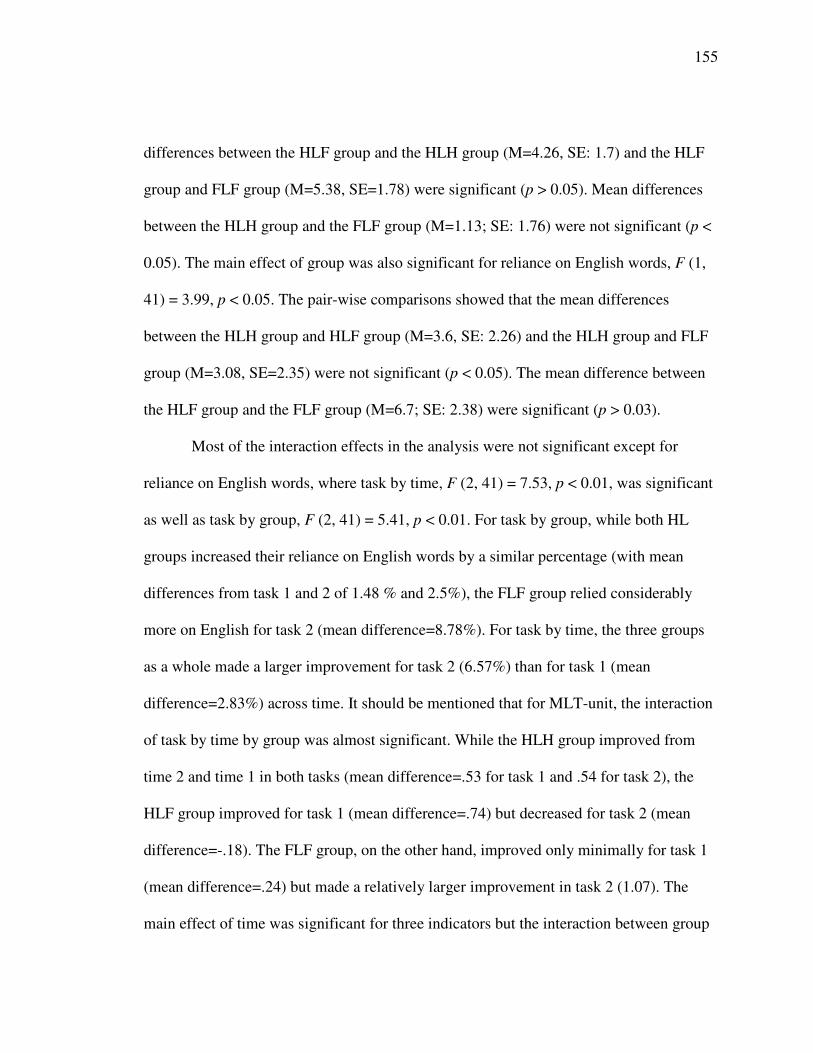
155
differences between the HLF group and the HLH group (M=4.26, SE: 1.7) and the HLF
group and FLF group (M=5.38, SE=1.78) were significant (p > 0.05). Mean differences
between the HLH group and the FLF group (M=1.13; SE: 1.76) were not significant (p <
0.05). The main effect of group was also significant for reliance on English words, F (1,
41) = 3.99, p < 0.05. The pair-wise comparisons showed that the mean differences
between the HLH group and HLF group (M=3.6, SE: 2.26) and the HLH group and FLF
group (M=3.08, SE=2.35) were not significant (p < 0.05). The mean difference between
the HLF group and the FLF group (M=6.7; SE: 2.38) were significant (p > 0.03).
Most of the interaction effects in the analysis were not significant except for
reliance on English words, where task by time, F (2, 41) = 7.53, p < 0.01, was significant
as well as task by group, F (2, 41) = 5.41, p < 0.01. For task by group, while both HL
groups increased their reliance on English words by a similar percentage (with mean
differences from task 1 and 2 of 1.48 % and 2.5%), the FLF group relied considerably
more on English for task 2 (mean difference=8.78%). For task by time, the three groups
as a whole made a larger improvement for task 2 (6.57%) than for task 1 (mean
difference=2.83%) across time. It should be mentioned that for MLT-unit, the interaction
of task by time by group was almost significant. While the HLH group improved from
time 2 and time 1 in both tasks (mean difference=.53 for task 1 and .54 for task 2), the
HLF group improved for task 1 (mean difference=.74) but decreased for task 2 (mean
difference=-.18). The FLF group, on the other hand, improved only minimally for task 1
(mean difference=.24) but made a relatively larger improvement in task 2 (1.07). The
main effect of time was significant for three indicators but the interaction between group
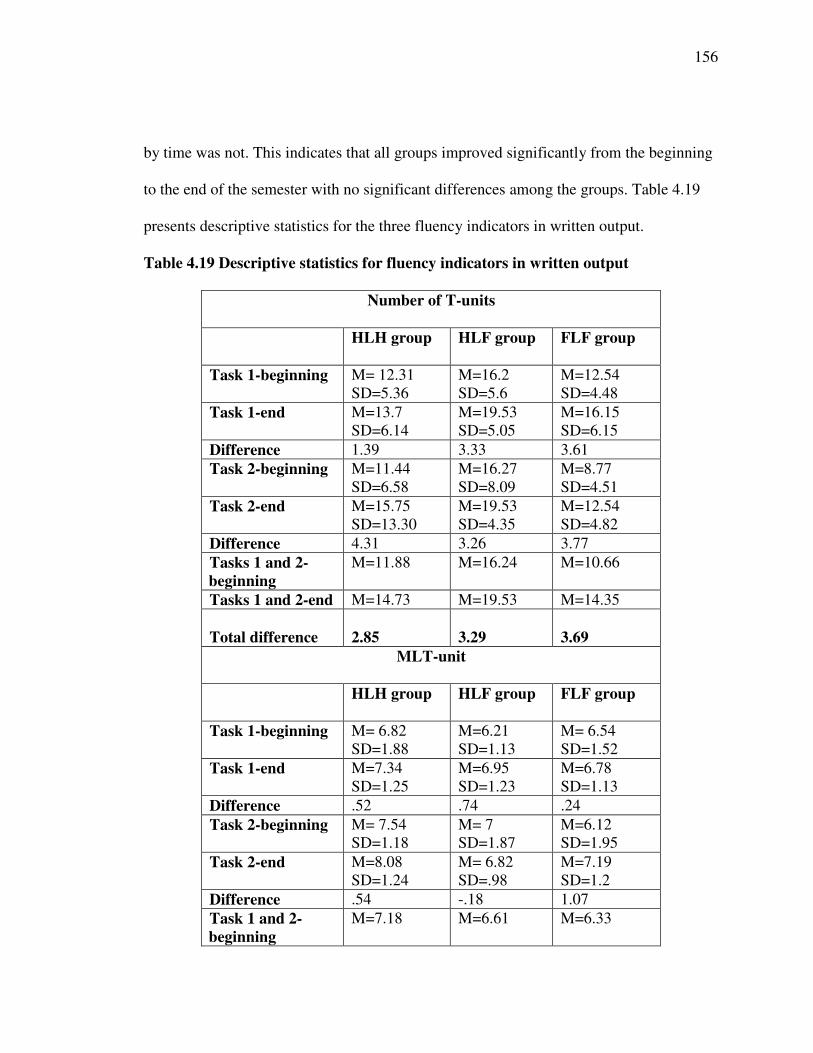
156
by time was not. This indicates that all groups improved significantly from the beginning
to the end of the semester with no significant differences among the groups. Table 4.19
presents descriptive statistics for the three fluency indicators in written output.
Table 4.19 Descriptive statistics for fluency indicators in written output
Number of T-units
HLH group HLF group FLF group
Task 1-beginning M= 12.31SD=5.36
M=16.2SD=5.6
M=12.54SD=4.48
Task 1-end M=13.7SD=6.14
M=19.53SD=5.05
M=16.15SD=6.15
Difference 1.39 3.33 3.61Task 2-beginning M=11.44
SD=6.58M=16.27SD=8.09
M=8.77SD=4.51
Task 2-end M=15.75SD=13.30
M=19.53SD=4.35
M=12.54SD=4.82
Difference 4.31 3.26 3.77Tasks 1 and 2-beginning
M=11.88 M=16.24 M=10.66
Tasks 1 and 2-end M=14.73 M=19.53 M=14.35
Total difference 2.85 3.29 3.69MLT-unit
HLH group HLF group FLF group
Task 1-beginning M= 6.82SD=1.88
M=6.21SD=1.13
M= 6.54SD=1.52
Task 1-end M=7.34SD=1.25
M=6.95SD=1.23
M=6.78SD=1.13
Difference .52 .74 .24Task 2-beginning M= 7.54
SD=1.18M= 7SD=1.87
M=6.12SD=1.95
Task 2-end M=8.08SD=1.24
M= 6.82SD=.98
M=7.19SD=1.2
Difference .54 -.18 1.07Task 1 and 2-beginning
M=7.18 M=6.61 M=6.33
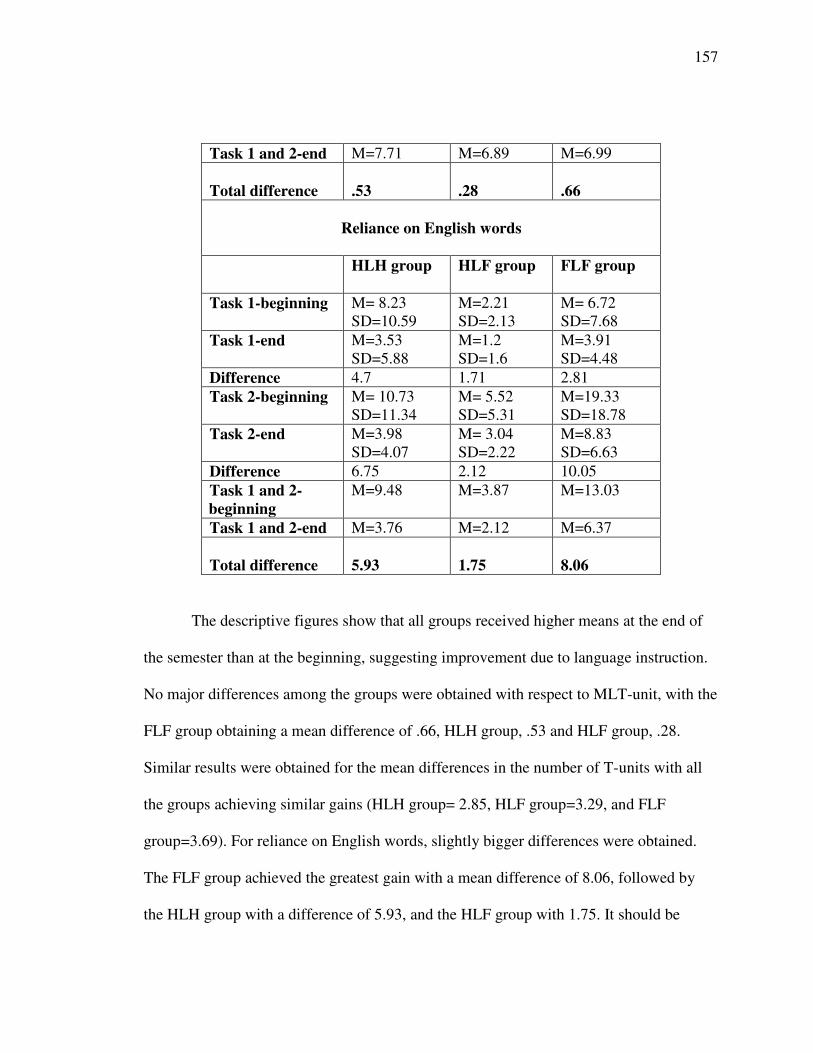
157
Task 1 and 2-end M=7.71 M=6.89 M=6.99
Total difference .53 .28 .66
Reliance on English words
HLH group HLF group FLF group
Task 1-beginning M= 8.23SD=10.59
M=2.21SD=2.13
M= 6.72SD=7.68
Task 1-end M=3.53SD=5.88
M=1.2SD=1.6
M=3.91SD=4.48
Difference 4.7 1.71 2.81Task 2-beginning M= 10.73
SD=11.34M= 5.52SD=5.31
M=19.33SD=18.78
Task 2-end M=3.98SD=4.07
M= 3.04SD=2.22
M=8.83SD=6.63
Difference 6.75 2.12 10.05Task 1 and 2-beginning
M=9.48 M=3.87 M=13.03
Task 1 and 2-end M=3.76 M=2.12 M=6.37
Total difference 5.93 1.75 8.06
The descriptive figures show that all groups received higher means at the end of
the semester than at the beginning, suggesting improvement due to language instruction.
No major differences among the groups were obtained with respect to MLT-unit, with the
FLF group obtaining a mean difference of .66, HLH group, .53 and HLF group, .28.
Similar results were obtained for the mean differences in the number of T-units with all
the groups achieving similar gains (HLH group= 2.85, HLF group=3.29, and FLF
group=3.69). For reliance on English words, slightly bigger differences were obtained.
The FLF group achieved the greatest gain with a mean difference of 8.06, followed by
the HLH group with a difference of 5.93, and the HLF group with 1.75. It should be
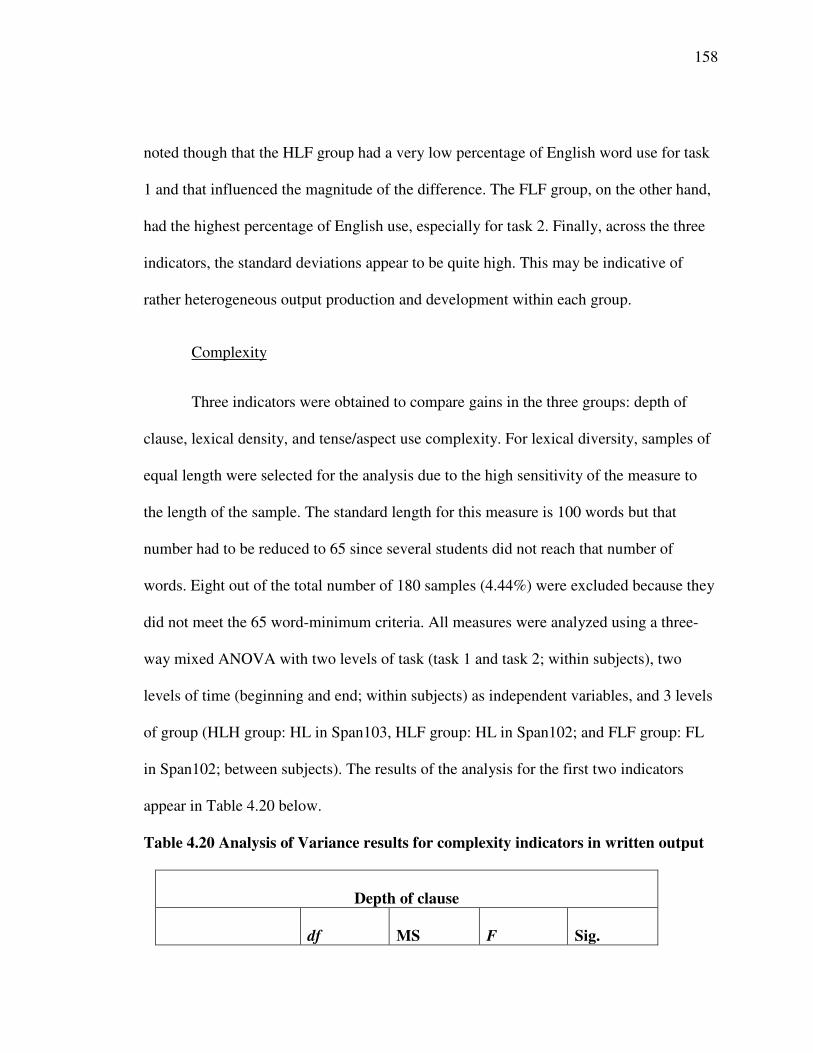
158
noted though that the HLF group had a very low percentage of English word use for task
1 and that influenced the magnitude of the difference. The FLF group, on the other hand,
had the highest percentage of English use, especially for task 2. Finally, across the three
indicators, the standard deviations appear to be quite high. This may be indicative of
rather heterogeneous output production and development within each group.
Complexity
Three indicators were obtained to compare gains in the three groups: depth of
clause, lexical density, and tense/aspect use complexity. For lexical diversity, samples of
equal length were selected for the analysis due to the high sensitivity of the measure to
the length of the sample. The standard length for this measure is 100 words but that
number had to be reduced to 65 since several students did not reach that number of
words. Eight out of the total number of 180 samples (4.44%) were excluded because they
did not meet the 65 word-minimum criteria. All measures were analyzed using a three-
way mixed ANOVA with two levels of task (task 1 and task 2; within subjects), two
levels of time (beginning and end; within subjects) as independent variables, and 3 levels
of group (HLH group: HL in Span103, HLF group: HL in Span102; and FLF group: FL
in Span102; between subjects). The results of the analysis for the first two indicators
appear in Table 4.20 below.
Table 4.20 Analysis of Variance results for complexity indicators in written output
Depth of clause
df MS F Sig.
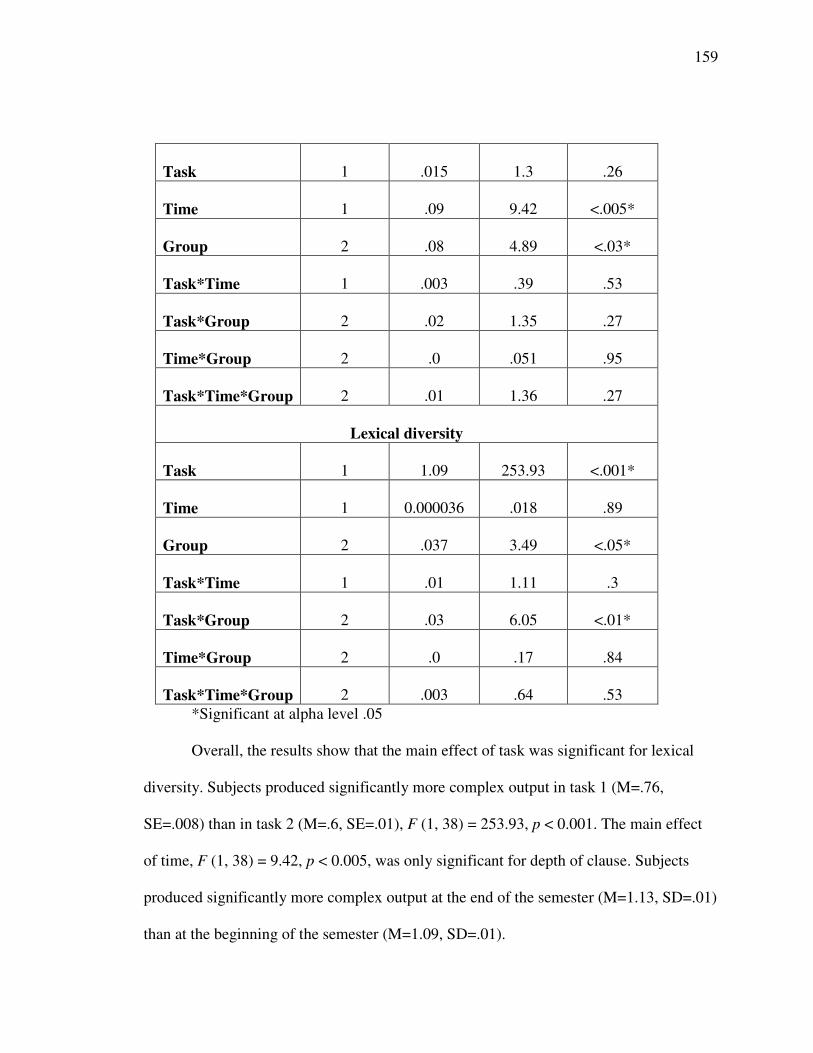
159
Task 1 .015 1.3 .26
Time 1 .09 9.42 <.005*
Group 2 .08 4.89 <.03*
Task*Time 1 .003 .39 .53
Task*Group 2 .02 1.35 .27
Time*Group 2 .0 .051 .95
Task*Time*Group 2 .01 1.36 .27
Lexical diversity
Task 1 1.09 253.93 <.001*
Time 1 0.000036 .018 .89
Group 2 .037 3.49 <.05*
Task*Time 1 .01 1.11 .3
Task*Group 2 .03 6.05 <.01*
Time*Group 2 .0 .17 .84
Task*Time*Group 2 .003 .64 .53*Significant at alpha level .05
Overall, the results show that the main effect of task was significant for lexical
diversity. Subjects produced significantly more complex output in task 1 (M=.76,
SE=.008) than in task 2 (M=.6, SE=.01), F (1, 38) = 253.93, p < 0.001. The main effect
of time, F (1, 38) = 9.42, p < 0.005, was only significant for depth of clause. Subjects
produced significantly more complex output at the end of the semester (M=1.13, SD=.01)
than at the beginning of the semester (M=1.09, SD=.01).
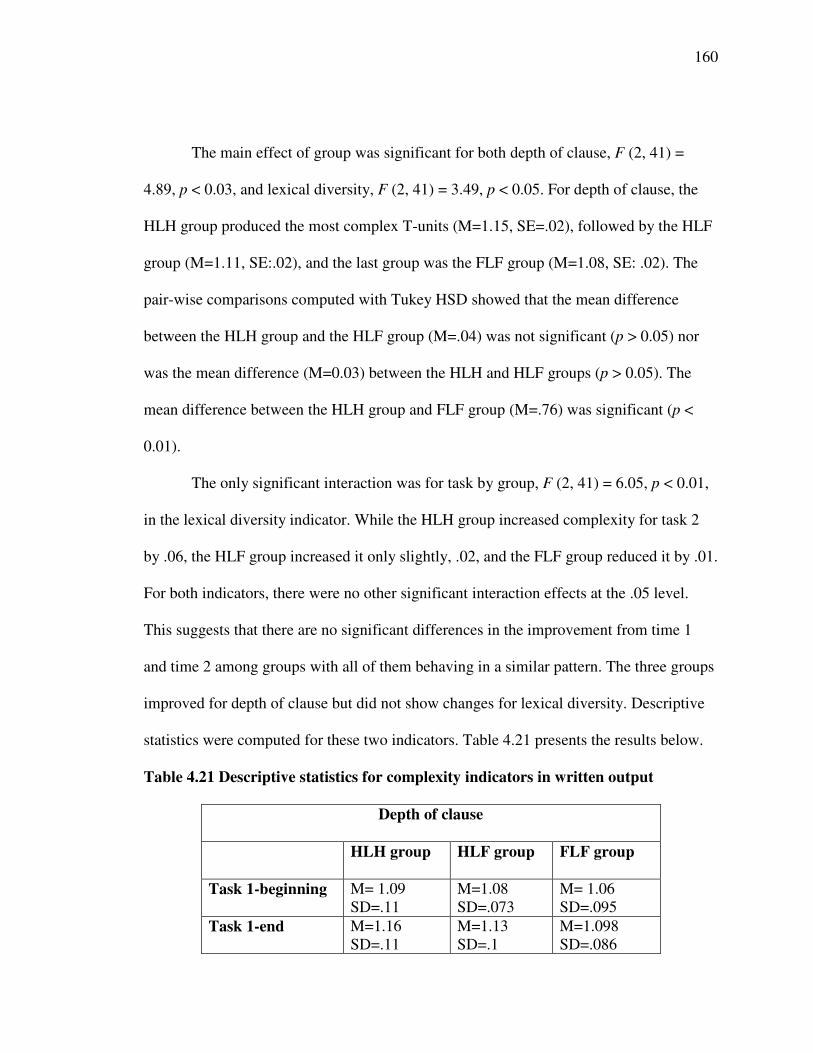
160
The main effect of group was significant for both depth of clause, F (2, 41) =
4.89, p < 0.03, and lexical diversity, F (2, 41) = 3.49, p < 0.05. For depth of clause, the
HLH group produced the most complex T-units (M=1.15, SE=.02), followed by the HLF
group (M=1.11, SE:.02), and the last group was the FLF group (M=1.08, SE: .02). The
pair-wise comparisons computed with Tukey HSD showed that the mean difference
between the HLH group and the HLF group (M=.04) was not significant (p > 0.05) nor
was the mean difference (M=0.03) between the HLH and HLF groups (p > 0.05). The
mean difference between the HLH group and FLF group (M=.76) was significant (p <
0.01).
The only significant interaction was for task by group, F (2, 41) = 6.05, p < 0.01,
in the lexical diversity indicator. While the HLH group increased complexity for task 2
by .06, the HLF group increased it only slightly, .02, and the FLF group reduced it by .01.
For both indicators, there were no other significant interaction effects at the .05 level.
This suggests that there are no significant differences in the improvement from time 1
and time 2 among groups with all of them behaving in a similar pattern. The three groups
improved for depth of clause but did not show changes for lexical diversity. Descriptive
statistics were computed for these two indicators. Table 4.21 presents the results below.
Table 4.21 Descriptive statistics for complexity indicators in written output
Depth of clause
HLH group HLF group FLF group
Task 1-beginning M= 1.09SD=.11
M=1.08SD=.073
M= 1.06SD=.095
Task 1-end M=1.16SD=.11
M=1.13SD=.1
M=1.098SD=.086
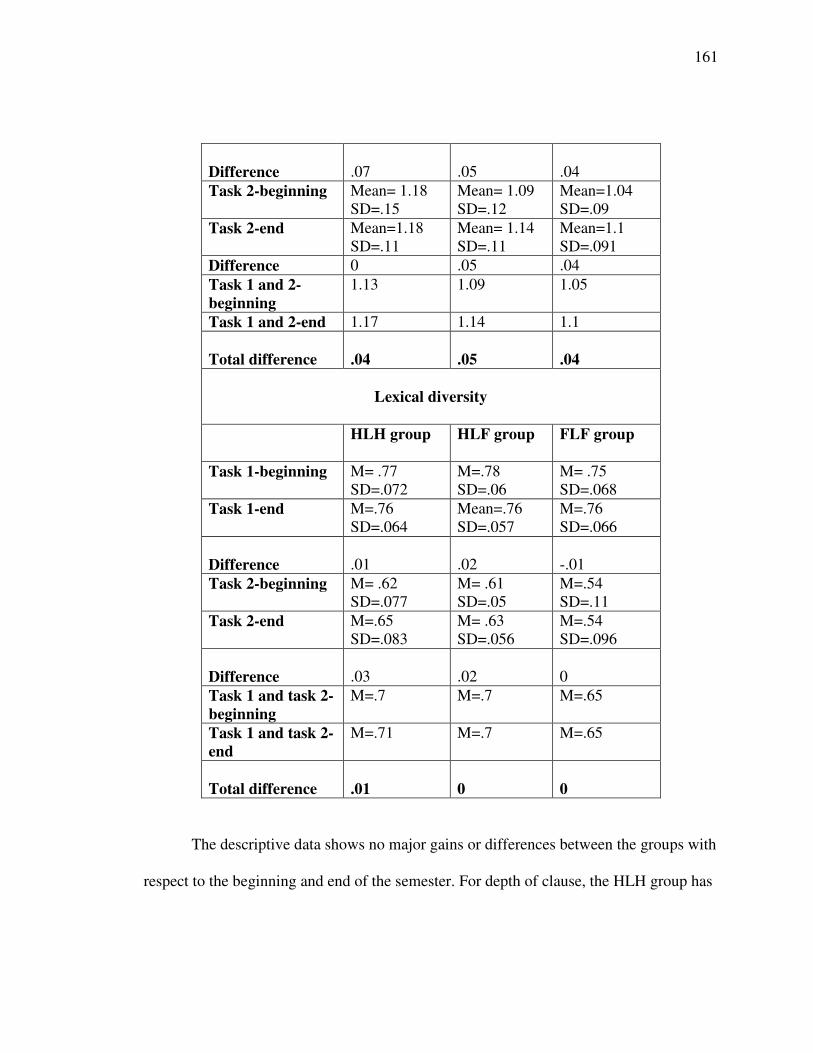
161
Difference .07 .05 .04Task 2-beginning Mean= 1.18
SD=.15Mean= 1.09SD=.12
Mean=1.04SD=.09
Task 2-end Mean=1.18SD=.11
Mean= 1.14SD=.11
Mean=1.1SD=.091
Difference 0 .05 .04Task 1 and 2-beginning
1.13 1.09 1.05
Task 1 and 2-end 1.17 1.14 1.1
Total difference .04 .05 .04
Lexical diversity
HLH group HLF group FLF group
Task 1-beginning M= .77SD=.072
M=.78SD=.06
M= .75SD=.068
Task 1-end M=.76SD=.064
Mean=.76SD=.057
M=.76SD=.066
Difference .01 .02 -.01Task 2-beginning M= .62
SD=.077M= .61SD=.05
M=.54SD=.11
Task 2-end M=.65SD=.083
M= .63SD=.056
M=.54SD=.096
Difference .03 .02 0Task 1 and task 2-beginning
M=.7 M=.7 M=.65
Task 1 and task 2-end
M=.71 M=.7 M=.65
Total difference .01 0 0
The descriptive data shows no major gains or differences between the groups with
respect to the beginning and end of the semester. For depth of clause, the HLH group has
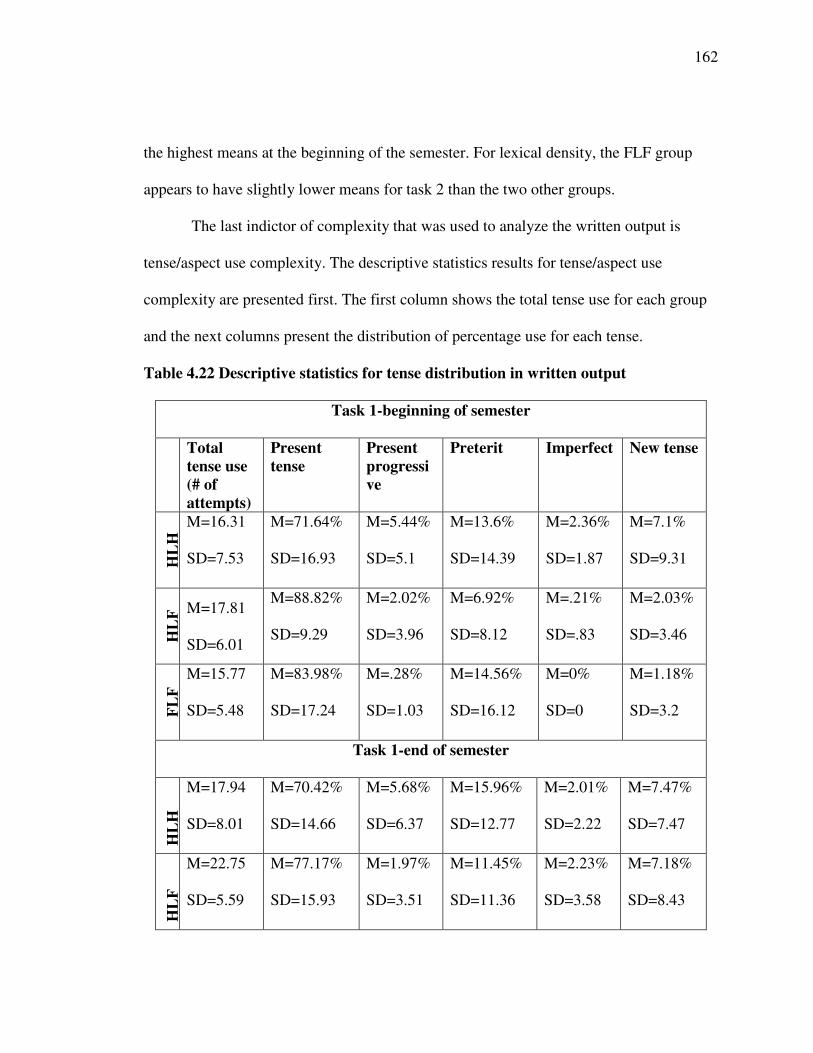
162
the highest means at the beginning of the semester. For lexical density, the FLF group
appears to have slightly lower means for task 2 than the two other groups.
The last indictor of complexity that was used to analyze the written output is
tense/aspect use complexity. The descriptive statistics results for tense/aspect use
complexity are presented first. The first column shows the total tense use for each group
and the next columns present the distribution of percentage use for each tense.
Table 4.22 Descriptive statistics for tense distribution in written output
Task 1-beginning of semester
Totaltense use(# ofattempts)
Presenttense
Presentprogressive
Preterit Imperfect New tense
HL
H
M=16.31
SD=7.53
M=71.64%
SD=16.93
M=5.44%
SD=5.1
M=13.6%
SD=14.39
M=2.36%
SD=1.87
M=7.1%
SD=9.31
HL
F M=17.81
SD=6.01
M=88.82%
SD=9.29
M=2.02%
SD=3.96
M=6.92%
SD=8.12
M=.21%
SD=.83
M=2.03%
SD=3.46
FL
F
M=15.77
SD=5.48
M=83.98%
SD=17.24
M=.28%
SD=1.03
M=14.56%
SD=16.12
M=0%
SD=0
M=1.18%
SD=3.2
Task 1-end of semester
HL
H
M=17.94
SD=8.01
M=70.42%
SD=14.66
M=5.68%
SD=6.37
M=15.96%
SD=12.77
M=2.01%
SD=2.22
M=7.47%
SD=7.47
HL
F
M=22.75
SD=5.59
M=77.17%
SD=15.93
M=1.97%
SD=3.51
M=11.45%
SD=11.36
M=2.23%
SD=3.58
M=7.18%
SD=8.43
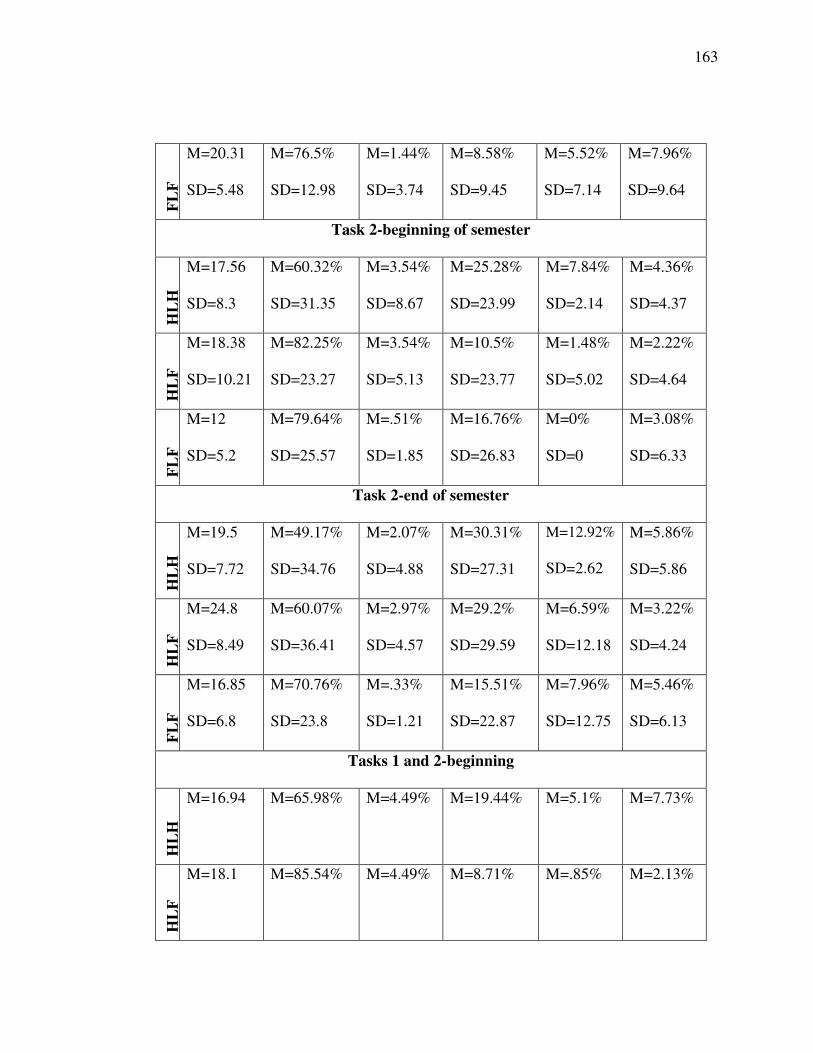
163
FL
FM=20.31
SD=5.48
M=76.5%
SD=12.98
M=1.44%
SD=3.74
M=8.58%
SD=9.45
M=5.52%
SD=7.14
M=7.96%
SD=9.64
Task 2-beginning of semester
HL
H
M=17.56
SD=8.3
M=60.32%
SD=31.35
M=3.54%
SD=8.67
M=25.28%
SD=23.99
M=7.84%
SD=2.14
M=4.36%
SD=4.37
HL
F
M=18.38
SD=10.21
M=82.25%
SD=23.27
M=3.54%
SD=5.13
M=10.5%
SD=23.77
M=1.48%
SD=5.02
M=2.22%
SD=4.64
FL
F
M=12
SD=5.2
M=79.64%
SD=25.57
M=.51%
SD=1.85
M=16.76%
SD=26.83
M=0%
SD=0
M=3.08%
SD=6.33
Task 2-end of semester
HL
H
M=19.5
SD=7.72
M=49.17%
SD=34.76
M=2.07%
SD=4.88
M=30.31%
SD=27.31
M=12.92%
SD=2.62
M=5.86%
SD=5.86
HL
F
M=24.8
SD=8.49
M=60.07%
SD=36.41
M=2.97%
SD=4.57
M=29.2%
SD=29.59
M=6.59%
SD=12.18
M=3.22%
SD=4.24
FL
F
M=16.85
SD=6.8
M=70.76%
SD=23.8
M=.33%
SD=1.21
M=15.51%
SD=22.87
M=7.96%
SD=12.75
M=5.46%
SD=6.13
Tasks 1 and 2-beginning
HL
H
M=16.94 M=65.98% M=4.49% M=19.44% M=5.1% M=7.73%
HL
F
M=18.1 M=85.54% M=4.49% M=8.71% M=.85% M=2.13%
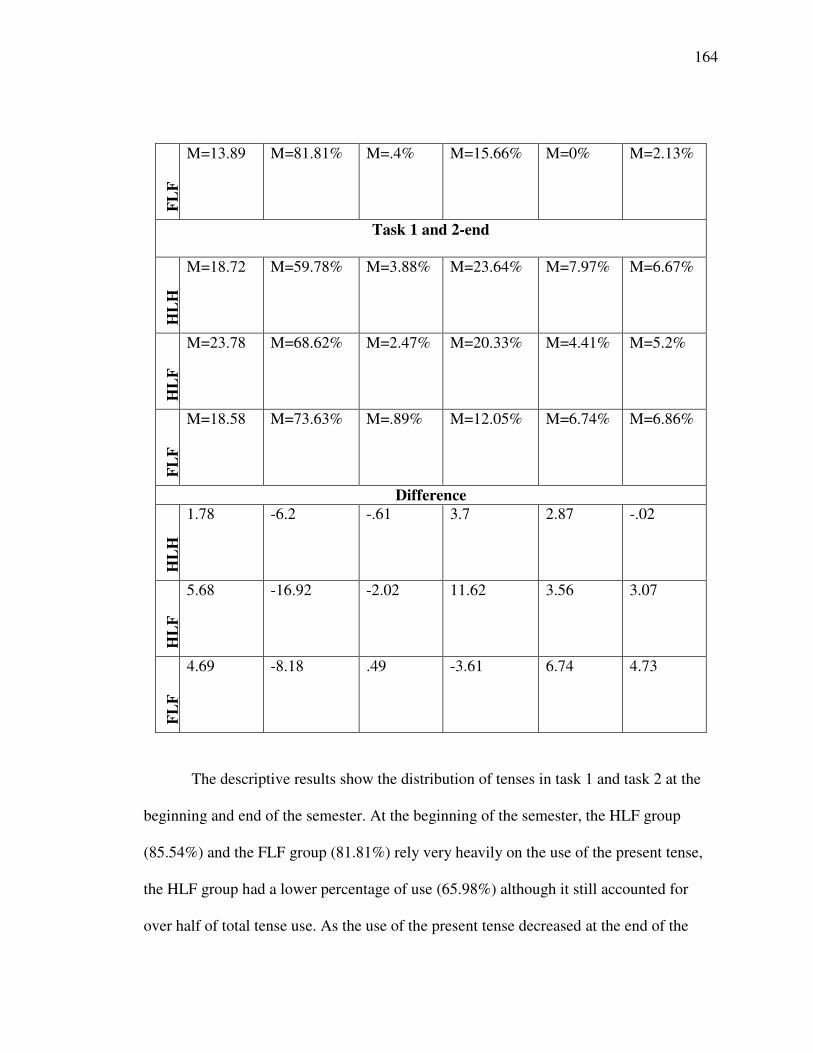
164
FL
FM=13.89 M=81.81% M=.4% M=15.66% M=0% M=2.13%
Task 1 and 2-end
HL
H
M=18.72 M=59.78% M=3.88% M=23.64% M=7.97% M=6.67%
HL
F
M=23.78 M=68.62% M=2.47% M=20.33% M=4.41% M=5.2%
FL
F
M=18.58 M=73.63% M=.89% M=12.05% M=6.74% M=6.86%
Difference
HL
H
1.78 -6.2 -.61 3.7 2.87 -.02
HL
F
5.68 -16.92 -2.02 11.62 3.56 3.07
FL
F
4.69 -8.18 .49 -3.61 6.74 4.73
The descriptive results show the distribution of tenses in task 1 and task 2 at the
beginning and end of the semester. At the beginning of the semester, the HLF group
(85.54%) and the FLF group (81.81%) rely very heavily on the use of the present tense,
the HLF group had a lower percentage of use (65.98%) although it still accounted for
over half of total tense use. As the use of the present tense decreased at the end of the
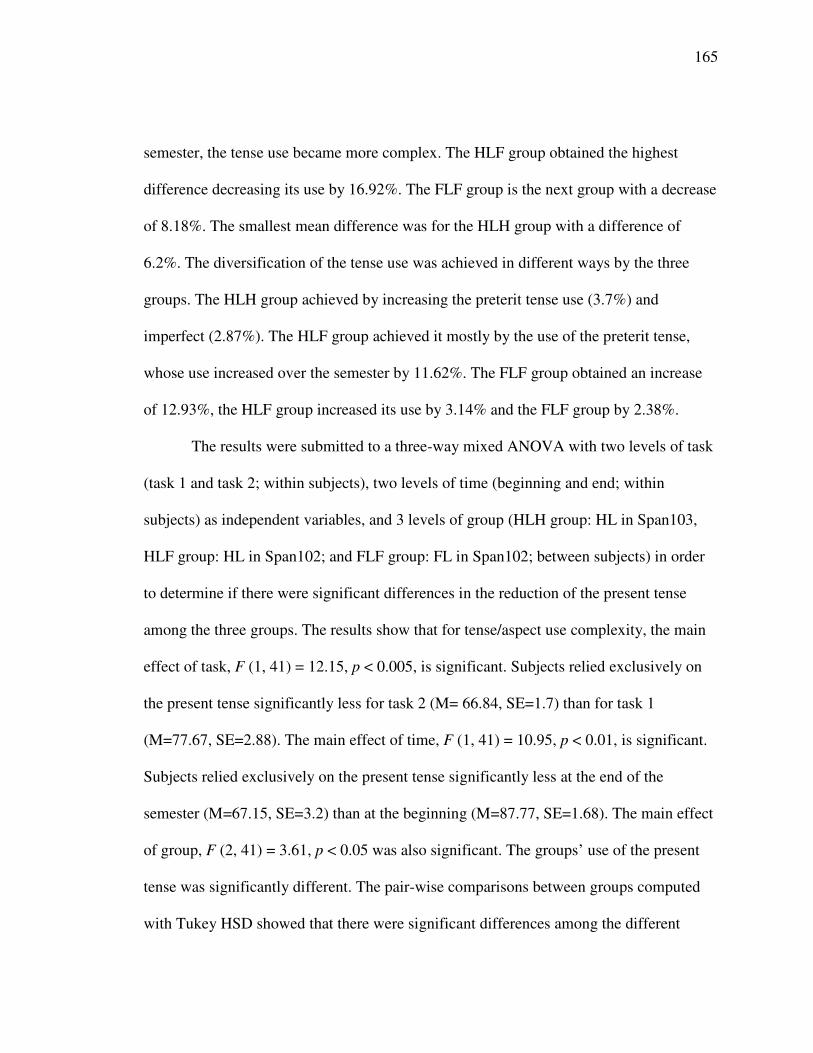
165
semester, the tense use became more complex. The HLF group obtained the highest
difference decreasing its use by 16.92%. The FLF group is the next group with a decrease
of 8.18%. The smallest mean difference was for the HLH group with a difference of
6.2%. The diversification of the tense use was achieved in different ways by the three
groups. The HLH group achieved by increasing the preterit tense use (3.7%) and
imperfect (2.87%). The HLF group achieved it mostly by the use of the preterit tense,
whose use increased over the semester by 11.62%. The FLF group obtained an increase
of 12.93%, the HLF group increased its use by 3.14% and the FLF group by 2.38%.
The results were submitted to a three-way mixed ANOVA with two levels of task
(task 1 and task 2; within subjects), two levels of time (beginning and end; within
subjects) as independent variables, and 3 levels of group (HLH group: HL in Span103,
HLF group: HL in Span102; and FLF group: FL in Span102; between subjects) in order
to determine if there were significant differences in the reduction of the present tense
among the three groups. The results show that for tense/aspect use complexity, the main
effect of task, F (1, 41) = 12.15, p < 0.005, is significant. Subjects relied exclusively on
the present tense significantly less for task 2 (M= 66.84, SE=1.7) than for task 1
(M=77.67, SE=2.88). The main effect of time, F (1, 41) = 10.95, p < 0.01, is significant.
Subjects relied exclusively on the present tense significantly less at the end of the
semester (M=67.15, SE=3.2) than at the beginning (M=87.77, SE=1.68). The main effect
of group, F (2, 41) = 3.61, p < 0.05 was also significant. The groups’ use of the present
tense was significantly different. The pair-wise comparisons between groups computed
with Tukey HSD showed that there were significant differences among the different
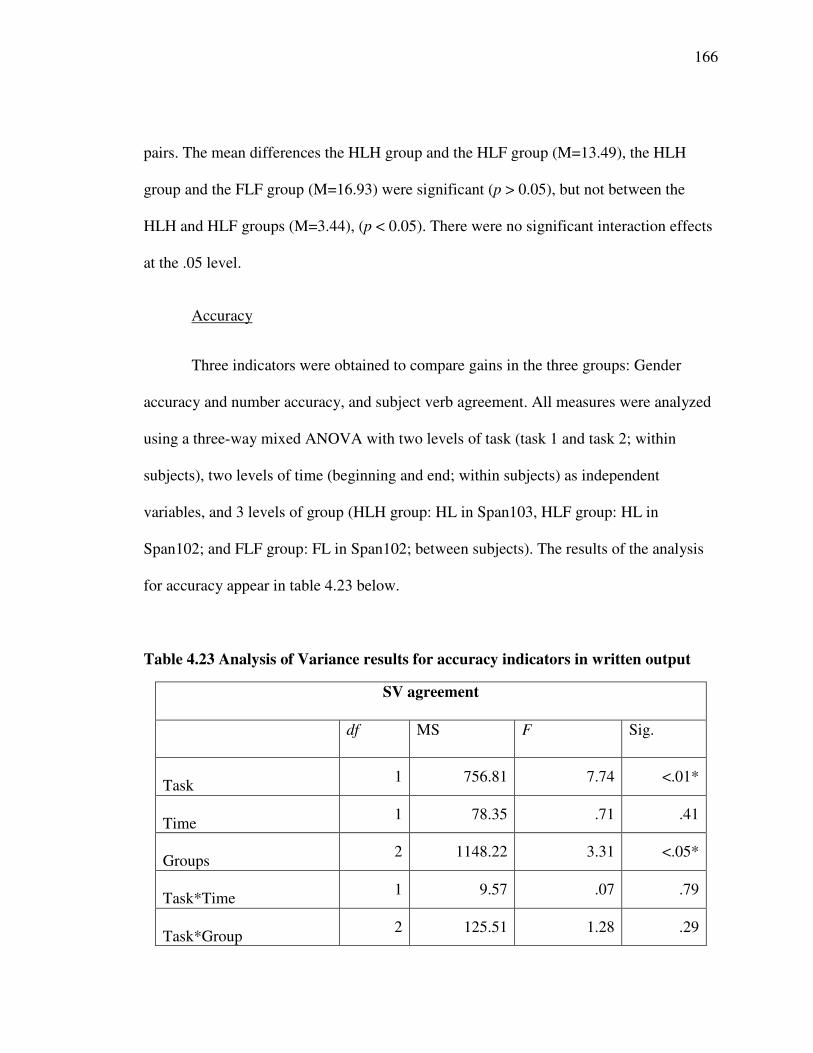
166
pairs. The mean differences the HLH group and the HLF group (M=13.49), the HLH
group and the FLF group (M=16.93) were significant (p > 0.05), but not between the
HLH and HLF groups (M=3.44), (p < 0.05). There were no significant interaction effects
at the .05 level.
Accuracy
Three indicators were obtained to compare gains in the three groups: Gender
accuracy and number accuracy, and subject verb agreement. All measures were analyzed
using a three-way mixed ANOVA with two levels of task (task 1 and task 2; within
subjects), two levels of time (beginning and end; within subjects) as independent
variables, and 3 levels of group (HLH group: HL in Span103, HLF group: HL in
Span102; and FLF group: FL in Span102; between subjects). The results of the analysis
for accuracy appear in table 4.23 below.
Table 4.23 Analysis of Variance results for accuracy indicators in written output
SV agreement
df MS F Sig.
Task1 756.81 7.74 <.01*
Time1 78.35 .71 .41
Groups2 1148.22 3.31 <.05*
Task*Time1 9.57 .07 .79
Task*Group2 125.51 1.28 .29
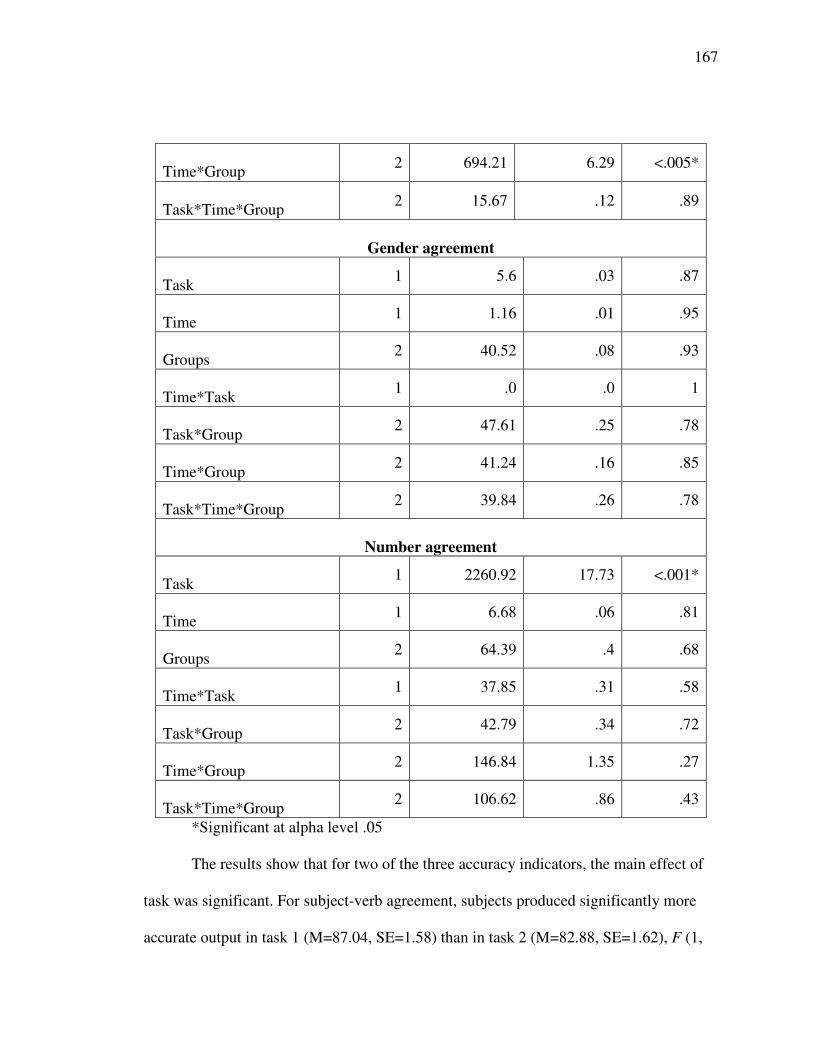
167
Time*Group2 694.21 6.29 <.005*
Task*Time*Group2 15.67 .12 .89
Gender agreement
Task1 5.6 .03 .87
Time1 1.16 .01 .95
Groups2 40.52 .08 .93
Time*Task1 .0 .0 1
Task*Group2 47.61 .25 .78
Time*Group2 41.24 .16 .85
Task*Time*Group2 39.84 .26 .78
Number agreement
Task1 2260.92 17.73 <.001*
Time1 6.68 .06 .81
Groups2 64.39 .4 .68
Time*Task1 37.85 .31 .58
Task*Group2 42.79 .34 .72
Time*Group2 146.84 1.35 .27
Task*Time*Group2 106.62 .86 .43
*Significant at alpha level .05
The results show that for two of the three accuracy indicators, the main effect of
task was significant. For subject-verb agreement, subjects produced significantly more
accurate output in task 1 (M=87.04, SE=1.58) than in task 2 (M=82.88, SE=1.62), F (1,
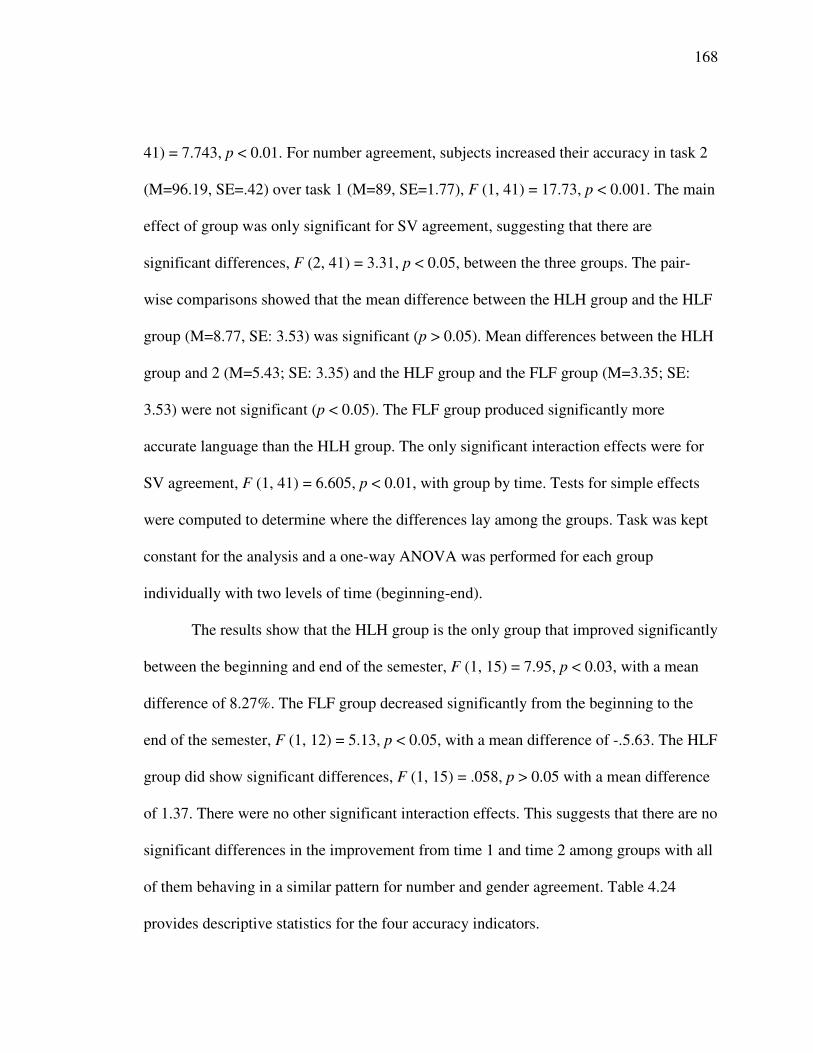
168
41) = 7.743, p < 0.01. For number agreement, subjects increased their accuracy in task 2
(M=96.19, SE=.42) over task 1 (M=89, SE=1.77), F (1, 41) = 17.73, p < 0.001. The main
effect of group was only significant for SV agreement, suggesting that there are
significant differences, F (2, 41) = 3.31, p < 0.05, between the three groups. The pair-
wise comparisons showed that the mean difference between the HLH group and the HLF
group (M=8.77, SE: 3.53) was significant (p > 0.05). Mean differences between the HLH
group and 2 (M=5.43; SE: 3.35) and the HLF group and the FLF group (M=3.35; SE:
3.53) were not significant (p < 0.05). The FLF group produced significantly more
accurate language than the HLH group. The only significant interaction effects were for
SV agreement, F (1, 41) = 6.605, p < 0.01, with group by time. Tests for simple effects
were computed to determine where the differences lay among the groups. Task was kept
constant for the analysis and a one-way ANOVA was performed for each group
individually with two levels of time (beginning-end).
The results show that the HLH group is the only group that improved significantly
between the beginning and end of the semester, F (1, 15) = 7.95, p < 0.03, with a mean
difference of 8.27%. The FLF group decreased significantly from the beginning to the
end of the semester, F (1, 12) = 5.13, p < 0.05, with a mean difference of -.5.63. The HLF
group did show significant differences, F (1, 15) = .058, p > 0.05 with a mean difference
of 1.37. There were no other significant interaction effects. This suggests that there are no
significant differences in the improvement from time 1 and time 2 among groups with all
of them behaving in a similar pattern for number and gender agreement. Table 4.24
provides descriptive statistics for the four accuracy indicators.
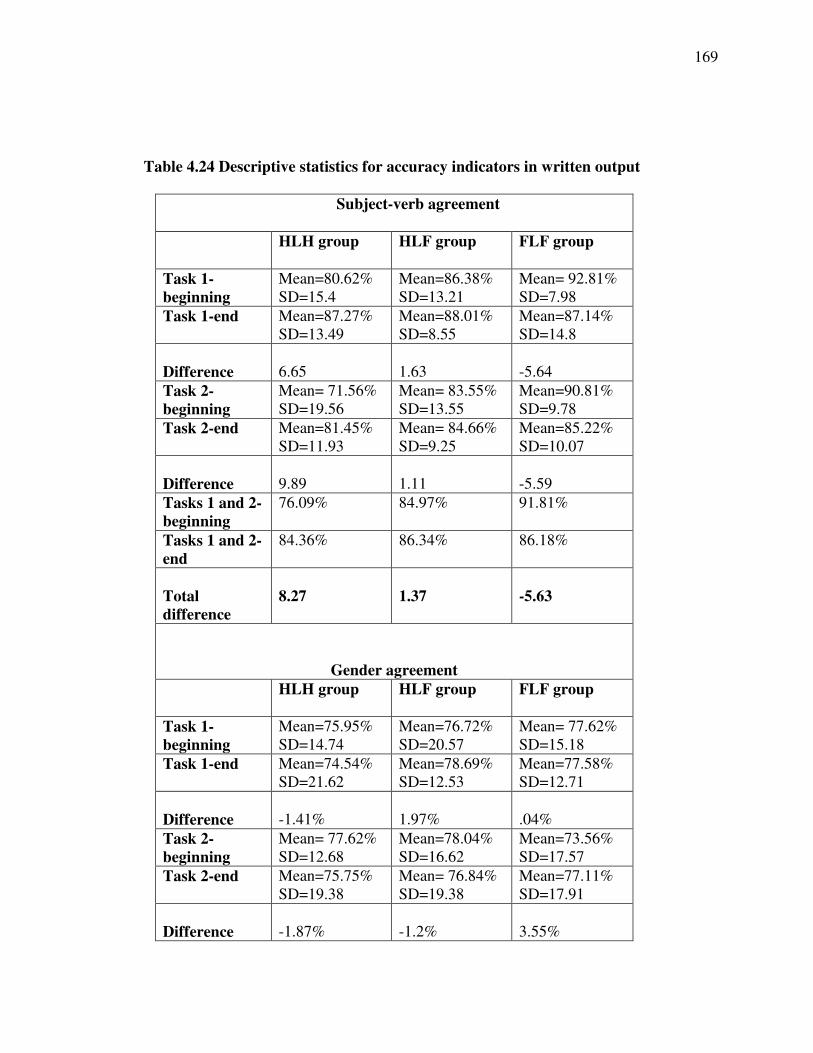
169
Table 4.24 Descriptive statistics for accuracy indicators in written output
Subject-verb agreement
HLH group HLF group FLF group
Task 1-beginning
Mean=80.62%SD=15.4
Mean=86.38%SD=13.21
Mean= 92.81%SD=7.98
Task 1-end Mean=87.27%SD=13.49
Mean=88.01%SD=8.55
Mean=87.14%SD=14.8
Difference 6.65 1.63 -5.64Task 2-beginning
Mean= 71.56%SD=19.56
Mean= 83.55%SD=13.55
Mean=90.81%SD=9.78
Task 2-end Mean=81.45%SD=11.93
Mean= 84.66%SD=9.25
Mean=85.22%SD=10.07
Difference 9.89 1.11 -5.59Tasks 1 and 2-beginning
76.09% 84.97% 91.81%
Tasks 1 and 2-end
84.36% 86.34% 86.18%
Totaldifference
8.27 1.37 -5.63
Gender agreementHLH group HLF group FLF group
Task 1-beginning
Mean=75.95%SD=14.74
Mean=76.72%SD=20.57
Mean= 77.62%SD=15.18
Task 1-end Mean=74.54%SD=21.62
Mean=78.69%SD=12.53
Mean=77.58%SD=12.71
Difference -1.41% 1.97% .04%Task 2-beginning
Mean= 77.62%SD=12.68
Mean=78.04%SD=16.62
Mean=73.56%SD=17.57
Task 2-end Mean=75.75%SD=19.38
Mean= 76.84%SD=19.38
Mean=77.11%SD=17.91
Difference -1.87% -1.2% 3.55%
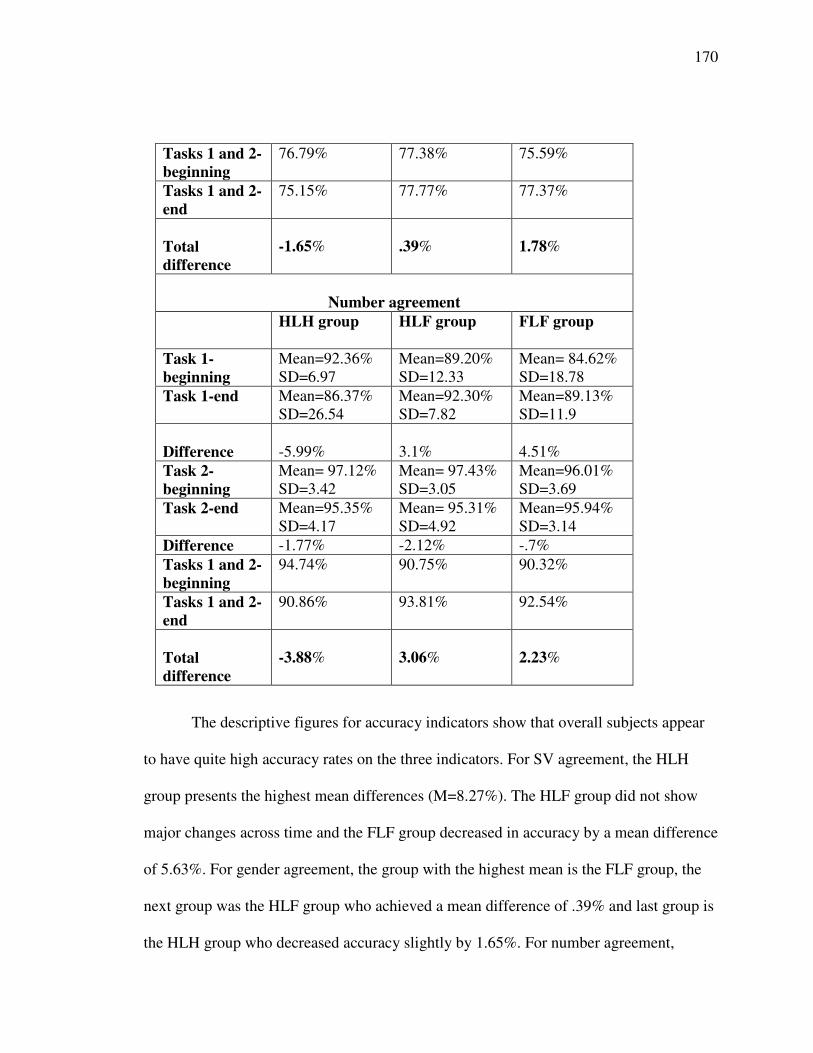
170
Tasks 1 and 2-beginning
76.79% 77.38% 75.59%
Tasks 1 and 2-end
75.15% 77.77% 77.37%
Totaldifference
-1.65% .39% 1.78%
Number agreementHLH group HLF group FLF group
Task 1-beginning
Mean=92.36%SD=6.97
Mean=89.20%SD=12.33
Mean= 84.62%SD=18.78
Task 1-end Mean=86.37%SD=26.54
Mean=92.30%SD=7.82
Mean=89.13%SD=11.9
Difference -5.99% 3.1% 4.51%Task 2-beginning
Mean= 97.12%SD=3.42
Mean= 97.43%SD=3.05
Mean=96.01%SD=3.69
Task 2-end Mean=95.35%SD=4.17
Mean= 95.31%SD=4.92
Mean=95.94%SD=3.14
Difference -1.77% -2.12% -.7%Tasks 1 and 2-beginning
94.74% 90.75% 90.32%
Tasks 1 and 2-end
90.86% 93.81% 92.54%
Totaldifference
-3.88% 3.06% 2.23%
The descriptive figures for accuracy indicators show that overall subjects appear
to have quite high accuracy rates on the three indicators. For SV agreement, the HLH
group presents the highest mean differences (M=8.27%). The HLF group did not show
major changes across time and the FLF group decreased in accuracy by a mean difference
of 5.63%. For gender agreement, the group with the highest mean is the FLF group, the
next group was the HLF group who achieved a mean difference of .39% and last group is
the HLH group who decreased accuracy slightly by 1.65%. For number agreement,
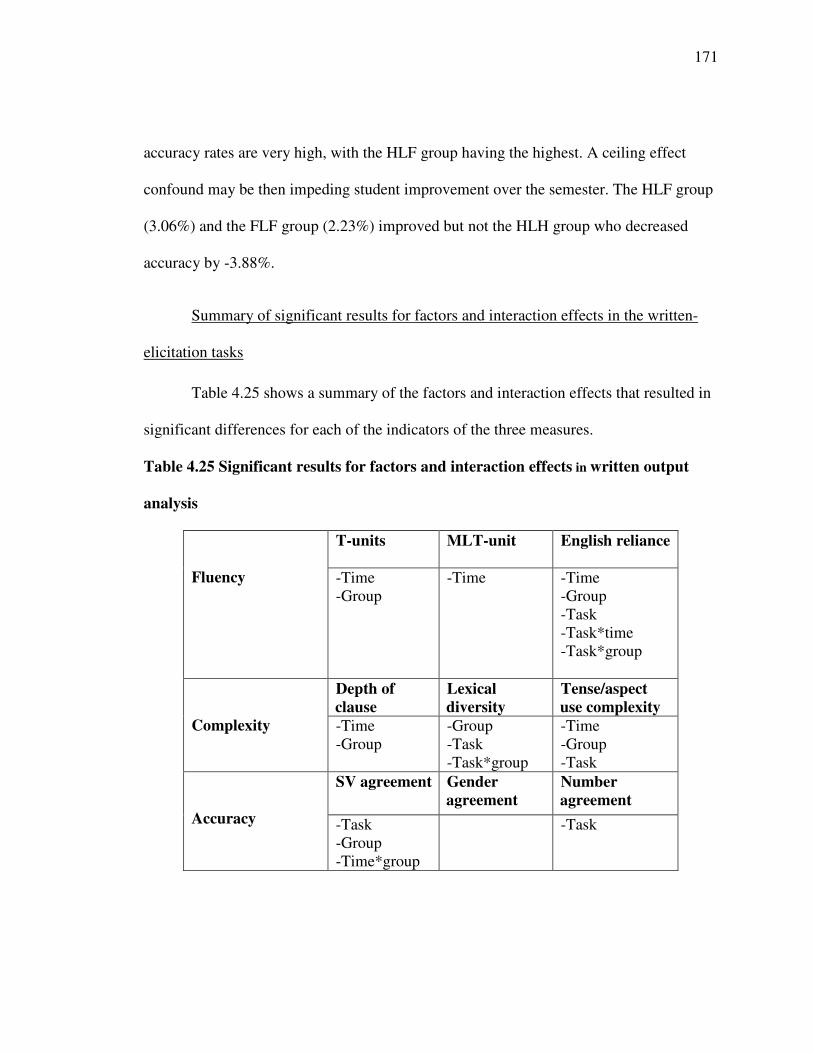
171
accuracy rates are very high, with the HLF group having the highest. A ceiling effect
confound may be then impeding student improvement over the semester. The HLF group
(3.06%) and the FLF group (2.23%) improved but not the HLH group who decreased
accuracy by -3.88%.
Summary of significant results for factors and interaction effects in the written-
elicitation tasks
Table 4.25 shows a summary of the factors and interaction effects that resulted in
significant differences for each of the indicators of the three measures.
Table 4.25 Significant results for factors and interaction effects in written output
analysis
T-units MLT-unit English reliance
Fluency -Time-Group
-Time -Time-Group-Task-Task*time-Task*group
Depth ofclause
Lexicaldiversity
Tense/aspectuse complexity
Complexity -Time-Group
-Group-Task-Task*group
-Time-Group-Task
SV agreement Genderagreement
Numberagreement
Accuracy -Task-Group-Time*group
-Task
172
Oral-Elicitation Tasks
Three measures of language development were analyzed for this question:
fluency, accuracy, and complexity. A total of 45 subjects (HLH group=16; HLF
group=16, and FLF group=13) participated in these tasks. One subject’s data file from the
last group was lost due to technical problems with the digital recording that made an
accurate transcription of the student’s production impossible. Another student did not
complete all oral tasks so the data was removed. That resulted in a total number of 43
subjects (HLH group: N=16; HLF group: N=15; FLF group: N=12). The total amount of
student production resulted in a corpus of valid words of 42,102 (see appendix G for a
sample of the output produced by a subject in the HLH group). This corpus was coded for
different indicators to measure the subjects’ fluency, accuracy, and complexity.
Independent coding for reliability checks
Independent coding between a second coder and the researcher was again
conducted with 10% of the oral data (5 subjects, 2 from the HLH group, 2 from the HLF
group, and 1 from the FLF group). The samples were selected using a stratified sampling
where 2, 2, and 1 were selected at random from samples from the three groups. The
coding was done for all T-units, dependant clauses, subject-verb agreement, present
tense, preterit, imperfect, present progressive, new tense, number agreement, and gender
agreement. Table 4.26 presents the number of agreements in percentage form.
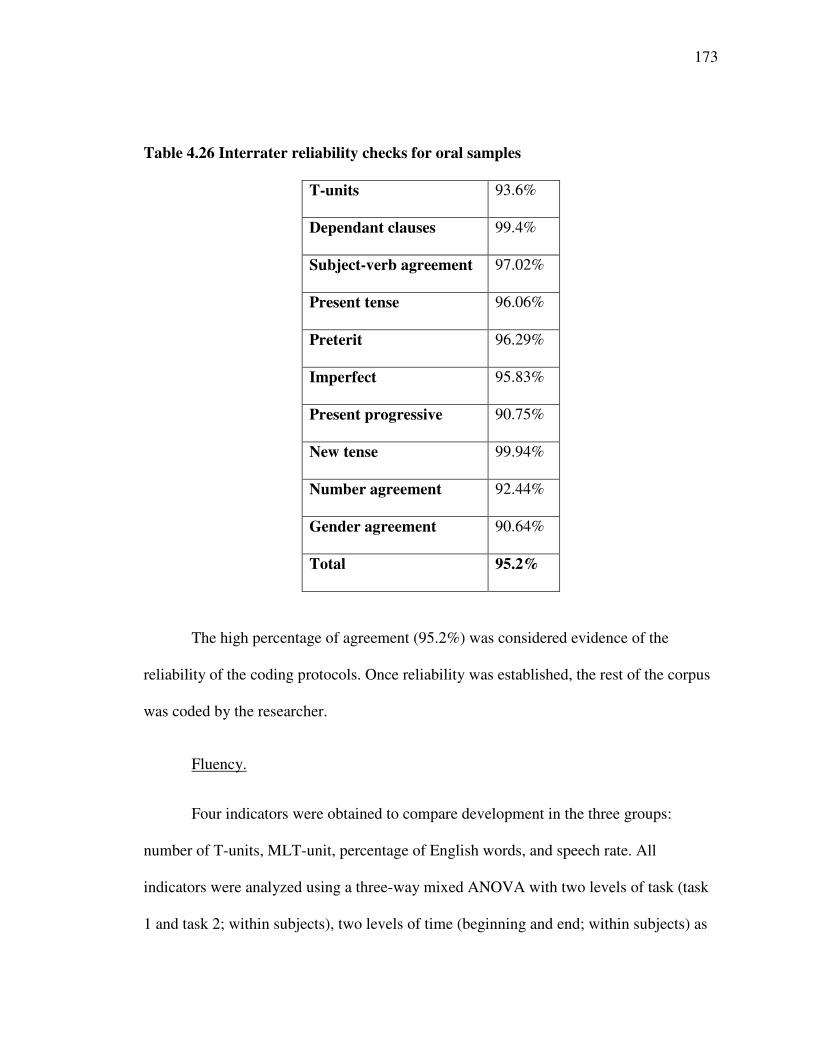
173
Table 4.26 Interrater reliability checks for oral samples
T-units 93.6%
Dependant clauses 99.4%
Subject-verb agreement 97.02%
Present tense 96.06%
Preterit 96.29%
Imperfect 95.83%
Present progressive 90.75%
New tense 99.94%
Number agreement 92.44%
Gender agreement 90.64%
Total 95.2%
The high percentage of agreement (95.2%) was considered evidence of the
reliability of the coding protocols. Once reliability was established, the rest of the corpus
was coded by the researcher.
Fluency.
Four indicators were obtained to compare development in the three groups:
number of T-units, MLT-unit, percentage of English words, and speech rate. All
indicators were analyzed using a three-way mixed ANOVA with two levels of task (task
1 and task 2; within subjects), two levels of time (beginning and end; within subjects) as
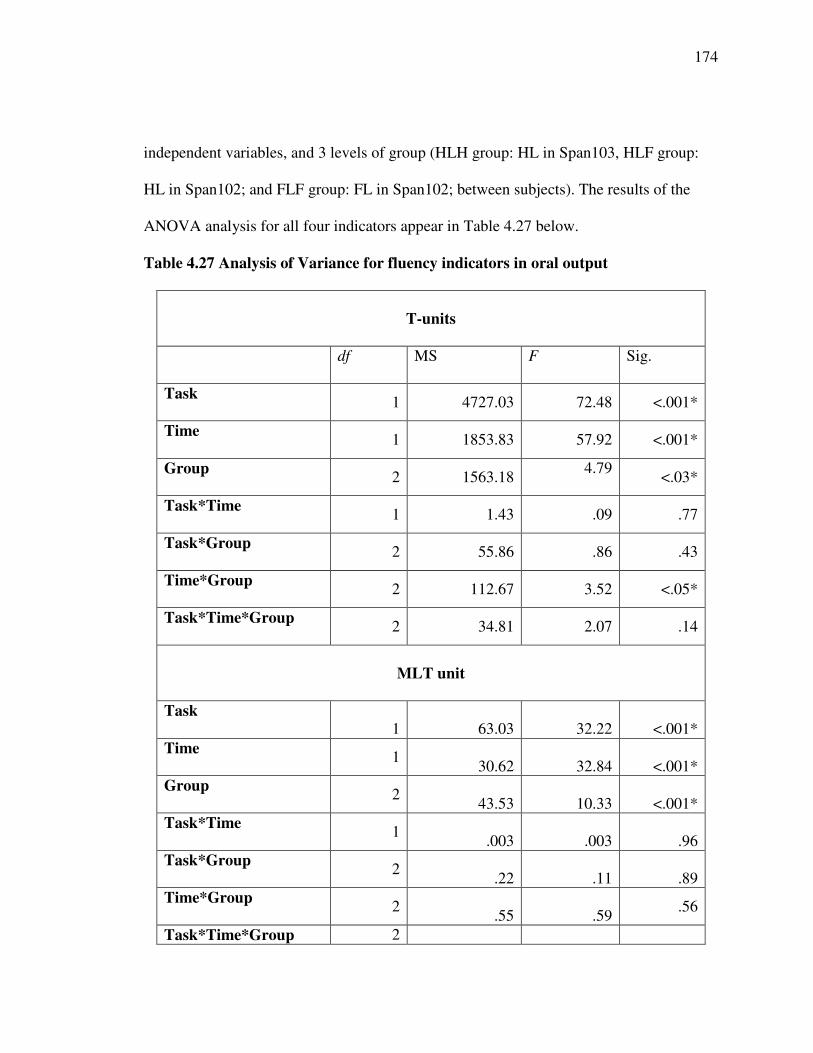
174
independent variables, and 3 levels of group (HLH group: HL in Span103, HLF group:
HL in Span102; and FLF group: FL in Span102; between subjects). The results of the
ANOVA analysis for all four indicators appear in Table 4.27 below.
Table 4.27 Analysis of Variance for fluency indicators in oral output
T-units
df MS F Sig.
Task 1 4727.03 72.48 <.001*
Time 1 1853.83 57.92 <.001*
Group 2 1563.184.79
<.03*
Task*Time 1 1.43 .09 .77
Task*Group 2 55.86 .86 .43
Time*Group 2 112.67 3.52 <.05*
Task*Time*Group 2 34.81 2.07 .14
MLT unit
Task1 63.03 32.22 <.001*
Time 130.62 32.84 <.001*
Group 243.53 10.33 <.001*
Task*Time 1.003 .003 .96
Task*Group 2.22 .11 .89
Time*Group 2.55 .59
.56
Task*Time*Group 2
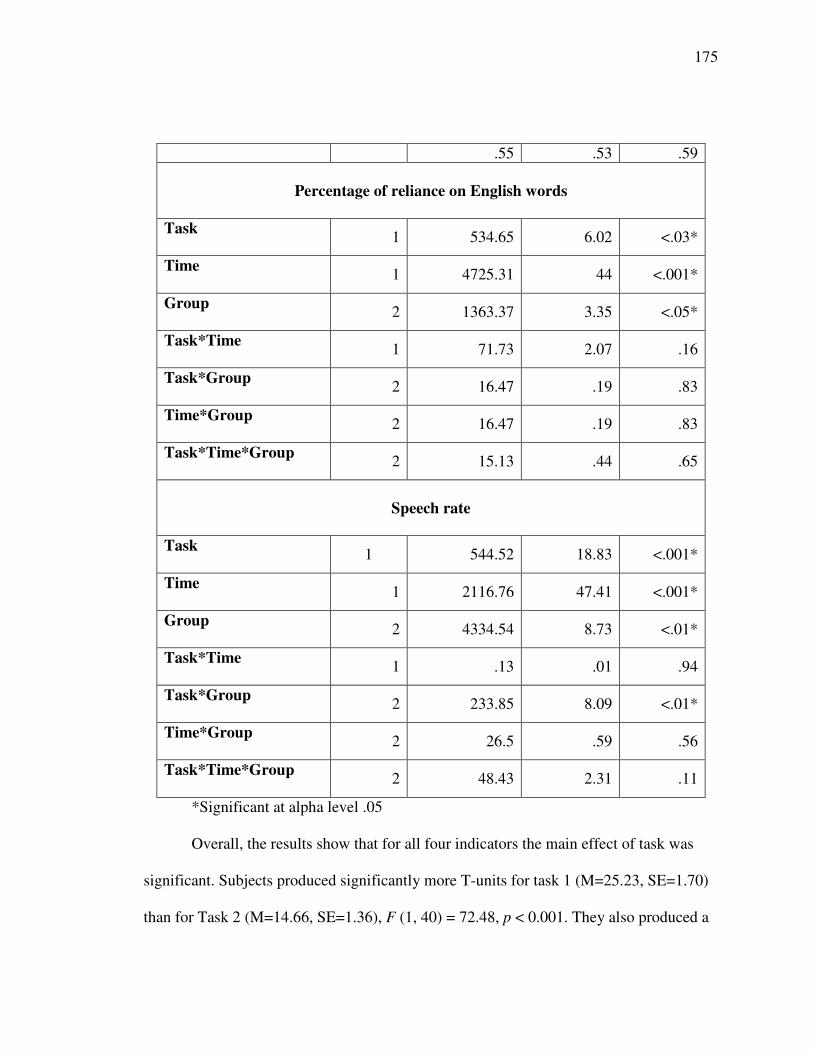
175
.55 .53 .59
Percentage of reliance on English words
Task 1 534.65 6.02 <.03*
Time 1 4725.31 44 <.001*
Group 2 1363.37 3.35 <.05*
Task*Time 1 71.73 2.07 .16
Task*Group 2 16.47 .19 .83
Time*Group 2 16.47 .19 .83
Task*Time*Group 2 15.13 .44 .65
Speech rate
Task 1 544.52 18.83 <.001*
Time 1 2116.76 47.41 <.001*
Group 2 4334.54 8.73 <.01*
Task*Time 1 .13 .01 .94
Task*Group 2 233.85 8.09 <.01*
Time*Group 2 26.5 .59 .56
Task*Time*Group 2 48.43 2.31 .11
*Significant at alpha level .05
Overall, the results show that for all four indicators the main effect of task was
significant. Subjects produced significantly more T-units for task 1 (M=25.23, SE=1.70)
than for Task 2 (M=14.66, SE=1.36), F (1, 40) = 72.48, p < 0.001. They also produced a
176
significantly higher number of words per minute for task 1 (M=37.87, SE=1.7) and for
task 2 (M=34.25, SE=1.8), F (1, 39) = 18.829, p < 0.001. On the contrary, they produced
significantly longer T-units for task 2 (M=7.6, SE=.21) than for task 1 (M=6.33, SE=.17),
F (1, 40) = 37.234, p < 0.001 as well as a significantly higher percentage of English
words for task 2 (M=16.64, SE=1.9) and for task 1 (M=13.09, SE=1.5), F (1, 40) = 6.024,
p < 0.05.
The main effect of time was also significant for the four indicators. Subjects as a
group produced significantly more T-units at the end of the semester (M=23.26,
SE=1.54) than at the beginning of the semester (M=16.64, SE=1.4), F (1,41) = 57.92, p <
0.001 and significantly longer T-units at the end of the semester (M=7.37, SE=.17) than
at the beginning of the semester (M=6.52, SE=.18) , F (1,40) = 49.63, p < 0.001.
Subjects also produced significantly fewer English words at the end of the semester
(M=9.58, SE=1.07) than at the beginning of the semester (M=20.15, SE=2.22), F (1,40)
= 33.91, p < 0.01. For speech rate13, subjects produced significantly more words per
minute at the end of the semester (M=39.62, SE=1.87) than at the beginning of the
semester (M=32.49, SE=1.74), F (1, 39) = 44, p < 0.001.
The main effect of group was also significant for all four indicators, suggesting
that there are significant differences among the three groups regarding their fluency.
Further pair-wise comparisons between the groups were computed with Tukey HSD in
order to establish where the significant differences lay. For T-units, mean differences
13Speech rate: The analysis for speech rate was performed with 42 students. One students’ data from the HLH group
was accidently deleted after being transcribed and was no longer available for the speech rate analysis.
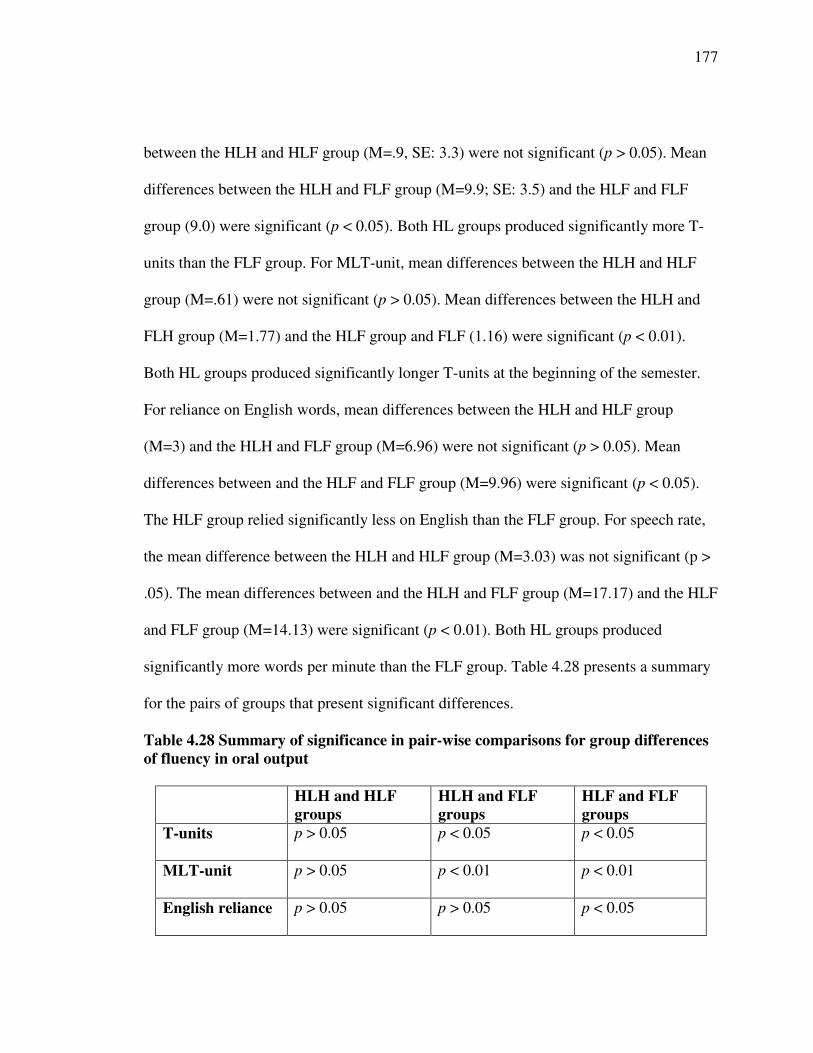
177
between the HLH and HLF group (M=.9, SE: 3.3) were not significant (p > 0.05). Mean
differences between the HLH and FLF group (M=9.9; SE: 3.5) and the HLF and FLF
group (9.0) were significant (p < 0.05). Both HL groups produced significantly more T-
units than the FLF group. For MLT-unit, mean differences between the HLH and HLF
group (M=.61) were not significant (p > 0.05). Mean differences between the HLH and
FLH group (M=1.77) and the HLF group and FLF (1.16) were significant (p < 0.01).
Both HL groups produced significantly longer T-units at the beginning of the semester.
For reliance on English words, mean differences between the HLH and HLF group
(M=3) and the HLH and FLF group (M=6.96) were not significant (p > 0.05). Mean
differences between and the HLF and FLF group (M=9.96) were significant (p < 0.05).
The HLF group relied significantly less on English than the FLF group. For speech rate,
the mean difference between the HLH and HLF group (M=3.03) was not significant (p >
.05). The mean differences between and the HLH and FLF group (M=17.17) and the HLF
and FLF group (M=14.13) were significant (p < 0.01). Both HL groups produced
significantly more words per minute than the FLF group. Table 4.28 presents a summary
for the pairs of groups that present significant differences.
Table 4.28 Summary of significance in pair-wise comparisons for group differencesof fluency in oral output
HLH and HLFgroups
HLH and FLFgroups
HLF and FLFgroups
T-units p > 0.05 p < 0.05 p < 0.05
MLT-unit p > 0.05 p < 0.01 p < 0.01
English reliance p > 0.05 p > 0.05 p < 0.05
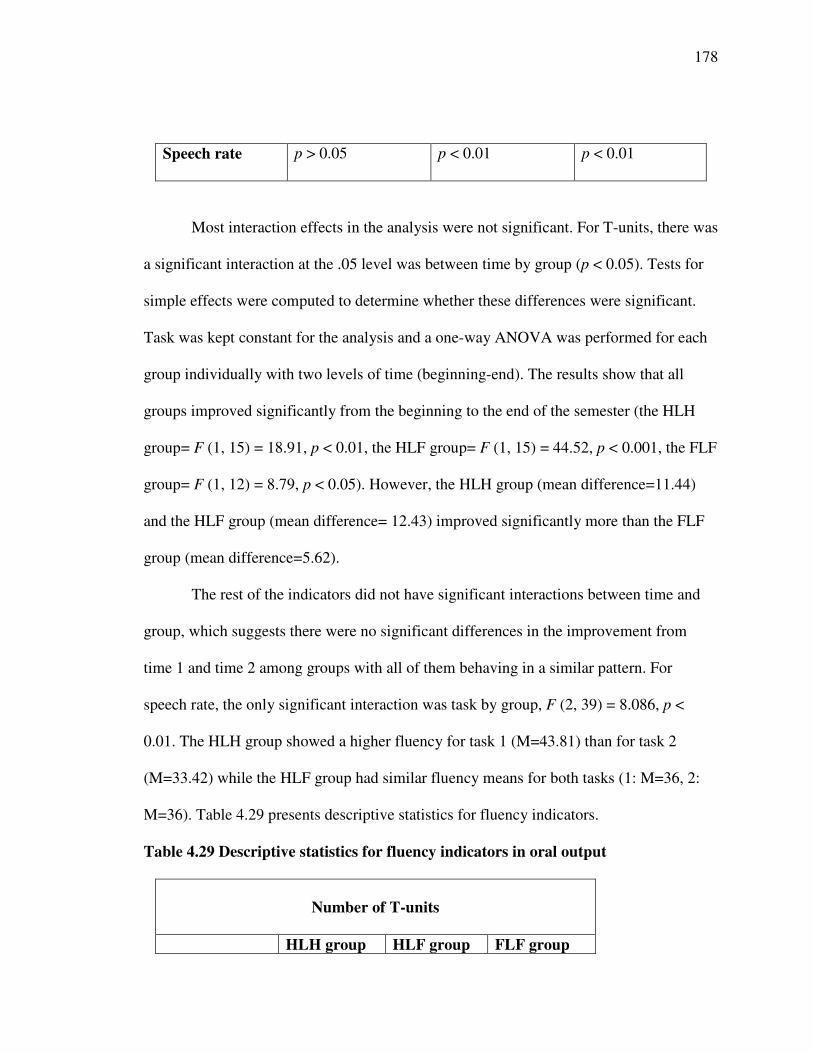
178
Speech rate p > 0.05 p < 0.01 p < 0.01
Most interaction effects in the analysis were not significant. For T-units, there was
a significant interaction at the .05 level was between time by group (p < 0.05). Tests for
simple effects were computed to determine whether these differences were significant.
Task was kept constant for the analysis and a one-way ANOVA was performed for each
group individually with two levels of time (beginning-end). The results show that all
groups improved significantly from the beginning to the end of the semester (the HLH
group= F (1, 15) = 18.91, p < 0.01, the HLF group= F (1, 15) = 44.52, p < 0.001, the FLF
group= F (1, 12) = 8.79, p < 0.05). However, the HLH group (mean difference=11.44)
and the HLF group (mean difference= 12.43) improved significantly more than the FLF
group (mean difference=5.62).
The rest of the indicators did not have significant interactions between time and
group, which suggests there were no significant differences in the improvement from
time 1 and time 2 among groups with all of them behaving in a similar pattern. For
speech rate, the only significant interaction was task by group, F (2, 39) = 8.086, p <
0.01. The HLH group showed a higher fluency for task 1 (M=43.81) than for task 2
(M=33.42) while the HLF group had similar fluency means for both tasks (1: M=36, 2:
M=36). Table 4.29 presents descriptive statistics for fluency indicators.
Table 4.29 Descriptive statistics for fluency indicators in oral output
Number of T-units
HLH group HLF group FLF group
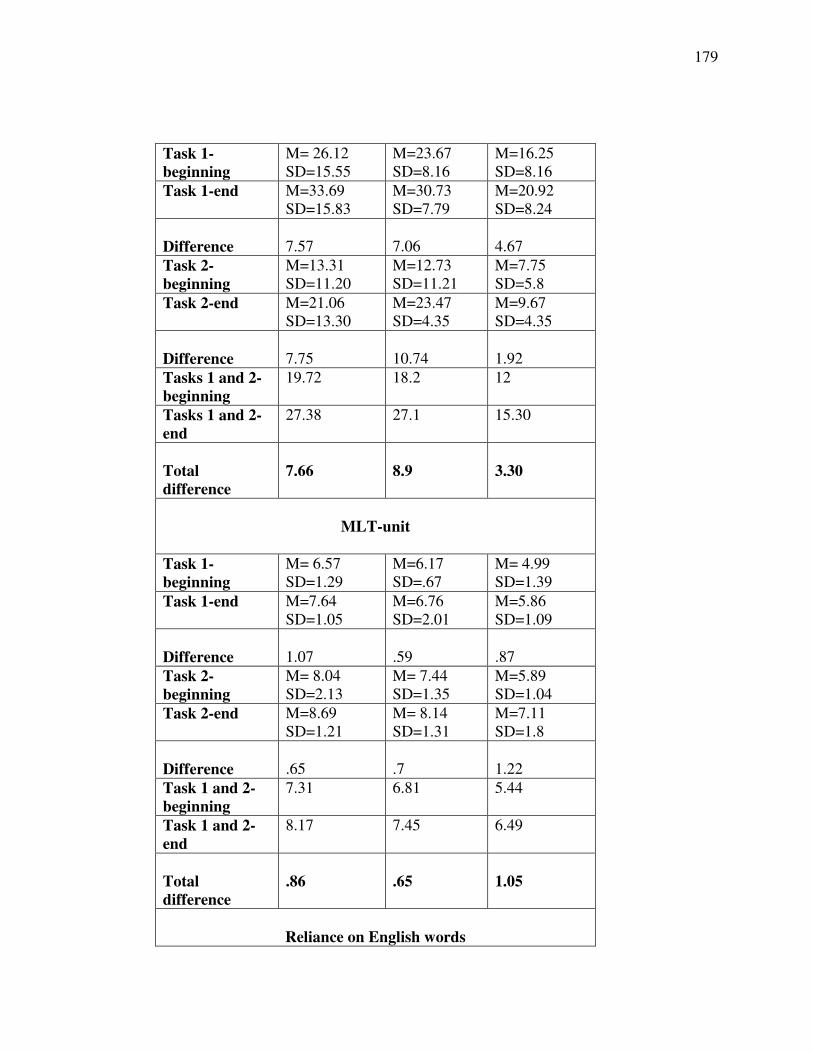
179
Task 1-beginning
M= 26.12SD=15.55
M=23.67SD=8.16
M=16.25SD=8.16
Task 1-end M=33.69SD=15.83
M=30.73SD=7.79
M=20.92SD=8.24
Difference 7.57 7.06 4.67Task 2-beginning
M=13.31SD=11.20
M=12.73SD=11.21
M=7.75SD=5.8
Task 2-end M=21.06SD=13.30
M=23.47SD=4.35
M=9.67SD=4.35
Difference 7.75 10.74 1.92Tasks 1 and 2-beginning
19.72 18.2 12
Tasks 1 and 2-end
27.38 27.1 15.30
Totaldifference
7.66 8.9 3.30
MLT-unit
Task 1-beginning
M= 6.57SD=1.29
M=6.17SD=.67
M= 4.99SD=1.39
Task 1-end M=7.64SD=1.05
M=6.76SD=2.01
M=5.86SD=1.09
Difference 1.07 .59 .87Task 2-beginning
M= 8.04SD=2.13
M= 7.44SD=1.35
M=5.89SD=1.04
Task 2-end M=8.69SD=1.21
M= 8.14SD=1.31
M=7.11SD=1.8
Difference .65 .7 1.22Task 1 and 2-beginning
7.31 6.81 5.44
Task 1 and 2-end
8.17 7.45 6.49
Totaldifference
.86 .65 1.05
Reliance on English words
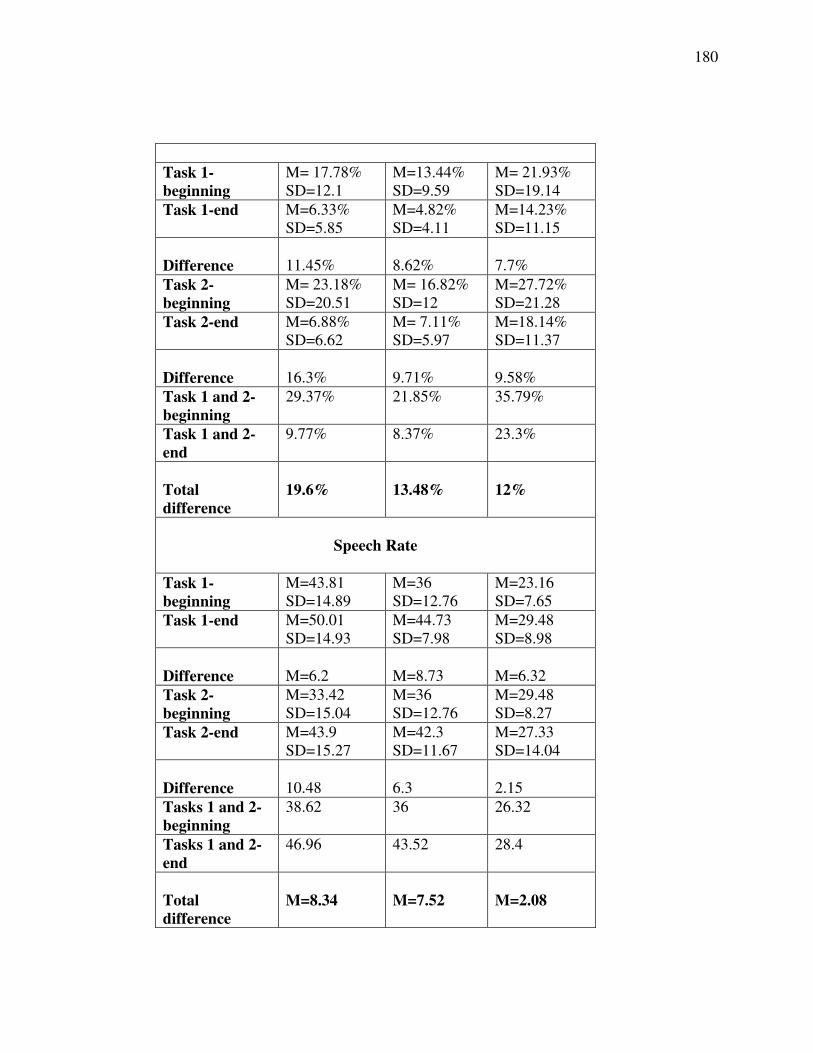
180
Task 1-beginning
M= 17.78%SD=12.1
M=13.44%SD=9.59
M= 21.93%SD=19.14
Task 1-end M=6.33%SD=5.85
M=4.82%SD=4.11
M=14.23%SD=11.15
Difference 11.45% 8.62% 7.7%Task 2-beginning
M= 23.18%SD=20.51
M= 16.82%SD=12
M=27.72%SD=21.28
Task 2-end M=6.88%SD=6.62
M= 7.11%SD=5.97
M=18.14%SD=11.37
Difference 16.3% 9.71% 9.58%Task 1 and 2-beginning
29.37% 21.85% 35.79%
Task 1 and 2-end
9.77% 8.37% 23.3%
Totaldifference
19.6% 13.48% 12%
Speech Rate
Task 1-beginning
M=43.81SD=14.89
M=36SD=12.76
M=23.16SD=7.65
Task 1-end M=50.01SD=14.93
M=44.73SD=7.98
M=29.48SD=8.98
Difference M=6.2 M=8.73 M=6.32Task 2-beginning
M=33.42SD=15.04
M=36SD=12.76
M=29.48SD=8.27
Task 2-end M=43.9SD=15.27
M=42.3SD=11.67
M=27.33SD=14.04
Difference 10.48 6.3 2.15Tasks 1 and 2-beginning
38.62 36 26.32
Tasks 1 and 2-end
46.96 43.52 28.4
Totaldifference
M=8.34 M=7.52 M=2.08
181
The descriptive figures show that all groups received higher means at the end of
the semester than at the beginning, suggesting improvement due to language instruction
(see appendix for graphs with means of all indicators). The HLH group received the
highest means on three of the four fluency indicators (T-units, MLT-unit, and speech
rate) at the beginning of the semester (see table 4.29, task 1 and 2-beginning). The HLF
group obtained higher means for one measure (number of T-units). The highest mean
difference among the groups was achieved for speech rate, where the HLH group
achieved a mean difference of 6.26 over the FLF group and .82 over the HLF group.
English reliance on words came next, where the HLH group obtained a gain difference of
6.18 over the HLF group and 7.6 over the FLF group. The HLF group obtained a mean
difference of 5.6 over the FLF group and 1.24 over the HLH group. No major differences
among the groups were obtained with respect to MLT-unit, with the HLH group
obtaining a mean difference of .86, the HLF group .65, and the FLF group 1.05. Finally,
across the four indicators, the standard deviations appear to be quite high. This may be
indicative of a heterogeneous output production and development within each group.
Complexity.
Three indicators were obtained to compare gains in the three groups: Depth of
clause, lexical diversity, and tense/aspect use complexity. For lexical diversity, samples
of equal length were selected for the analysis due to the high sensitivity of the measure to
the length of the sample. The standard length for this measure is 100 words but that
number had to be reduced to 85 since several students did not reach that number of
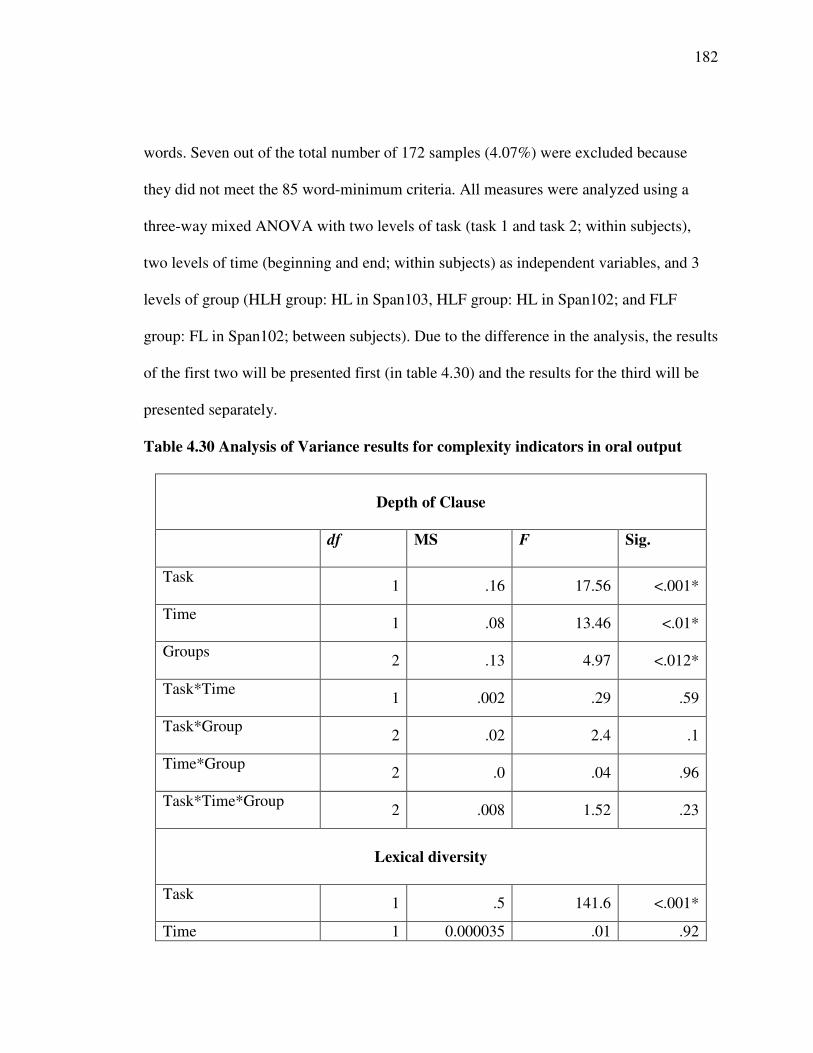
182
words. Seven out of the total number of 172 samples (4.07%) were excluded because
they did not meet the 85 word-minimum criteria. All measures were analyzed using a
three-way mixed ANOVA with two levels of task (task 1 and task 2; within subjects),
two levels of time (beginning and end; within subjects) as independent variables, and 3
levels of group (HLH group: HL in Span103, HLF group: HL in Span102; and FLF
group: FL in Span102; between subjects). Due to the difference in the analysis, the results
of the first two will be presented first (in table 4.30) and the results for the third will be
presented separately.
Table 4.30 Analysis of Variance results for complexity indicators in oral output
Depth of Clause
df MS F Sig.
Task1 .16 17.56 <.001*
Time1 .08 13.46 <.01*
Groups2 .13 4.97 <.012*
Task*Time1 .002 .29 .59
Task*Group2 .02 2.4 .1
Time*Group2 .0 .04 .96
Task*Time*Group2 .008 1.52 .23
Lexical diversity
Task1 .5 141.6 <.001*
Time 1 0.000035 .01 .92
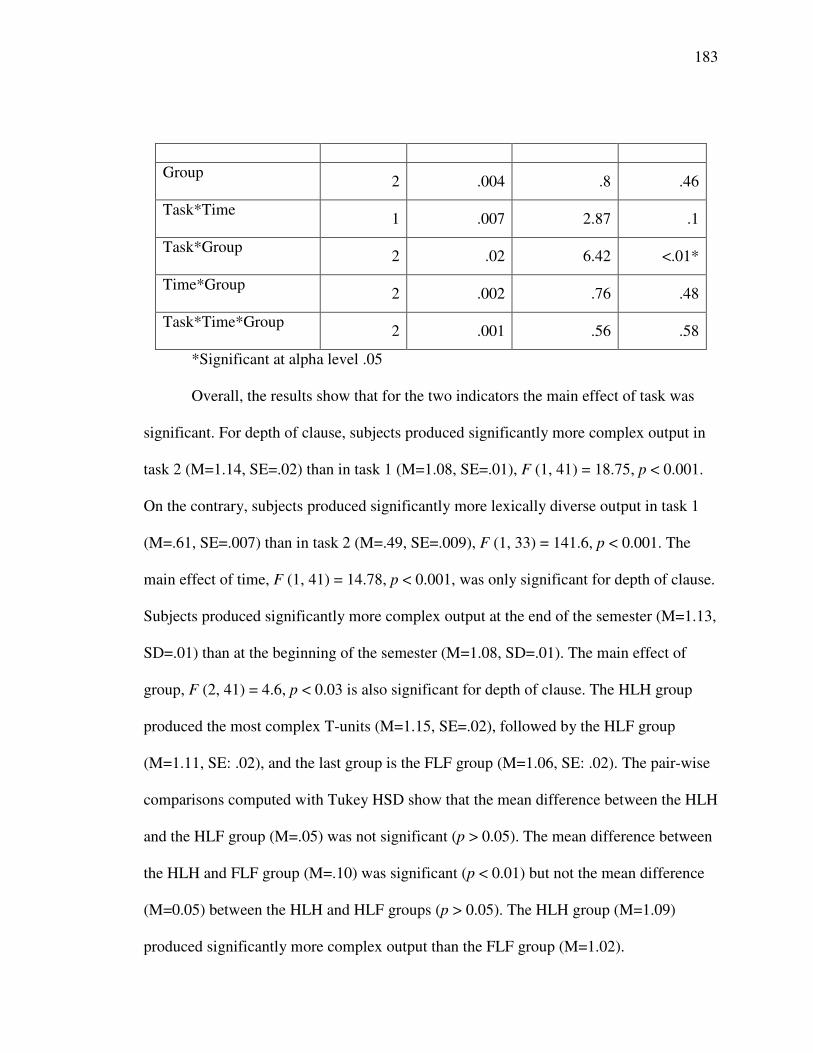
183
Group2 .004 .8 .46
Task*Time1 .007 2.87 .1
Task*Group2 .02 6.42 <.01*
Time*Group2 .002 .76 .48
Task*Time*Group2 .001 .56 .58
*Significant at alpha level .05
Overall, the results show that for the two indicators the main effect of task was
significant. For depth of clause, subjects produced significantly more complex output in
task 2 (M=1.14, SE=.02) than in task 1 (M=1.08, SE=.01), F (1, 41) = 18.75, p < 0.001.
On the contrary, subjects produced significantly more lexically diverse output in task 1
(M=.61, SE=.007) than in task 2 (M=.49, SE=.009), F (1, 33) = 141.6, p < 0.001. The
main effect of time, F (1, 41) = 14.78, p < 0.001, was only significant for depth of clause.
Subjects produced significantly more complex output at the end of the semester (M=1.13,
SD=.01) than at the beginning of the semester (M=1.08, SD=.01). The main effect of
group, F (2, 41) = 4.6, p < 0.03 is also significant for depth of clause. The HLH group
produced the most complex T-units (M=1.15, SE=.02), followed by the HLF group
(M=1.11, SE: .02), and the last group is the FLF group (M=1.06, SE: .02). The pair-wise
comparisons computed with Tukey HSD show that the mean difference between the HLH
and the HLF group (M=.05) was not significant (p > 0.05). The mean difference between
the HLH and FLF group (M=.10) was significant (p < 0.01) but not the mean difference
(M=0.05) between the HLH and HLF groups (p > 0.05). The HLH group (M=1.09)
produced significantly more complex output than the FLF group (M=1.02).
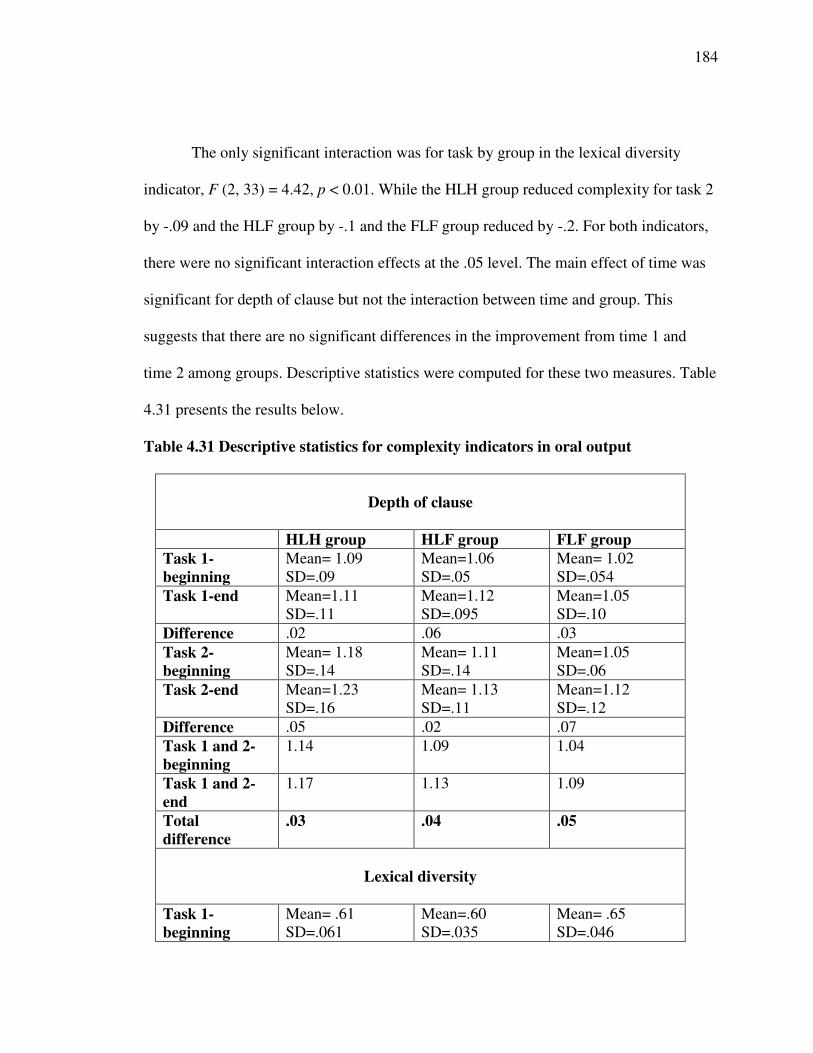
184
The only significant interaction was for task by group in the lexical diversity
indicator, F (2, 33) = 4.42, p < 0.01. While the HLH group reduced complexity for task 2
by -.09 and the HLF group by -.1 and the FLF group reduced by -.2. For both indicators,
there were no significant interaction effects at the .05 level. The main effect of time was
significant for depth of clause but not the interaction between time and group. This
suggests that there are no significant differences in the improvement from time 1 and
time 2 among groups. Descriptive statistics were computed for these two measures. Table
4.31 presents the results below.
Table 4.31 Descriptive statistics for complexity indicators in oral output
Depth of clause
HLH group HLF group FLF groupTask 1-beginning
Mean= 1.09SD=.09
Mean=1.06SD=.05
Mean= 1.02SD=.054
Task 1-end Mean=1.11SD=.11
Mean=1.12SD=.095
Mean=1.05SD=.10
Difference .02 .06 .03Task 2-beginning
Mean= 1.18SD=.14
Mean= 1.11SD=.14
Mean=1.05SD=.06
Task 2-end Mean=1.23SD=.16
Mean= 1.13SD=.11
Mean=1.12SD=.12
Difference .05 .02 .07Task 1 and 2-beginning
1.14 1.09 1.04
Task 1 and 2-end
1.17 1.13 1.09
Totaldifference
.03 .04 .05
Lexical diversity
Task 1-beginning
Mean= .61SD=.061
Mean=.60SD=.035
Mean= .65SD=.046
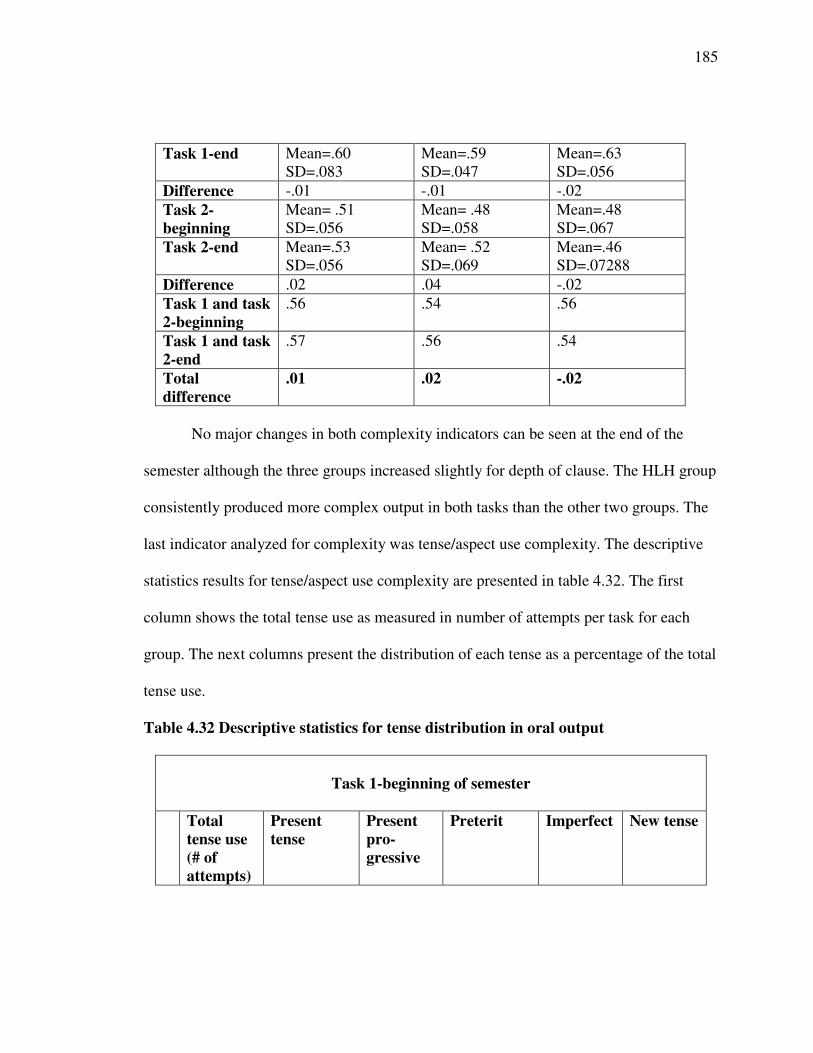
185
Task 1-end Mean=.60SD=.083
Mean=.59SD=.047
Mean=.63SD=.056
Difference -.01 -.01 -.02Task 2-beginning
Mean= .51SD=.056
Mean= .48SD=.058
Mean=.48SD=.067
Task 2-end Mean=.53SD=.056
Mean= .52SD=.069
Mean=.46SD=.07288
Difference .02 .04 -.02Task 1 and task2-beginning
.56 .54 .56
Task 1 and task2-end
.57 .56 .54
Totaldifference
.01 .02 -.02
No major changes in both complexity indicators can be seen at the end of the
semester although the three groups increased slightly for depth of clause. The HLH group
consistently produced more complex output in both tasks than the other two groups. The
last indicator analyzed for complexity was tense/aspect use complexity. The descriptive
statistics results for tense/aspect use complexity are presented in table 4.32. The first
column shows the total tense use as measured in number of attempts per task for each
group. The next columns present the distribution of each tense as a percentage of the total
tense use.
Table 4.32 Descriptive statistics for tense distribution in oral output
Task 1-beginning of semester
Totaltense use(# ofattempts)
Presenttense
Presentpro-gressive
Preterit Imperfect New tense
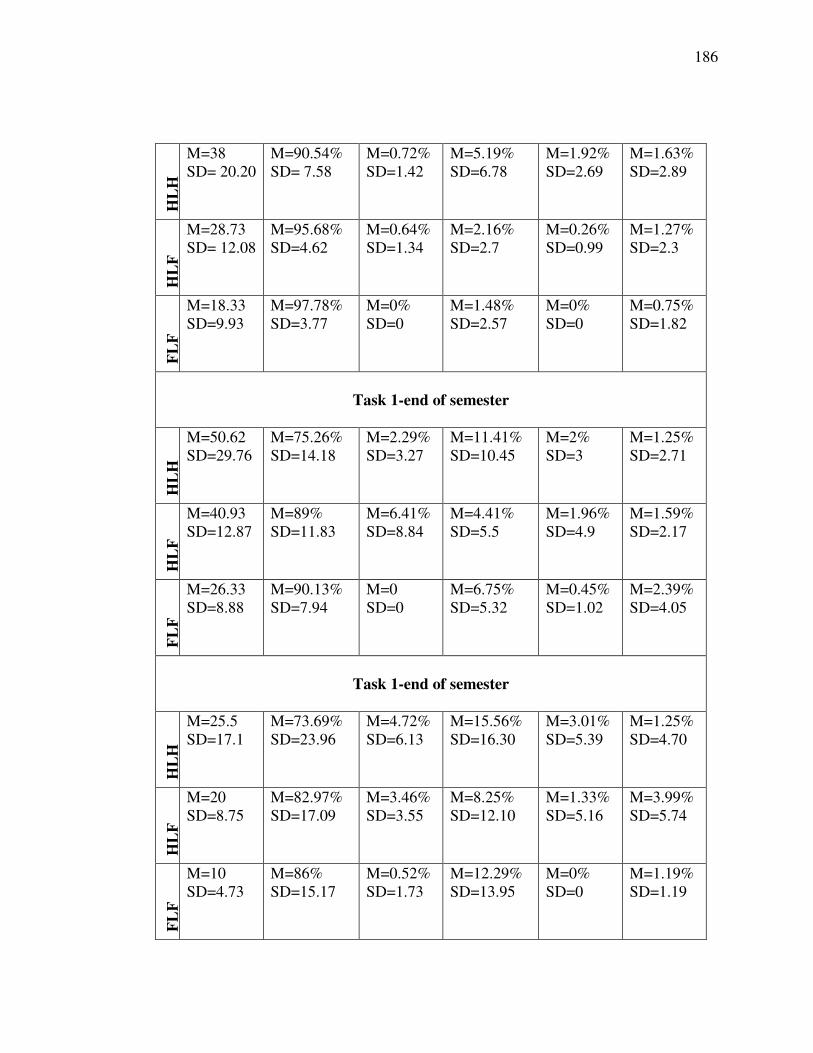
186
HL
HM=38SD= 20.20
M=90.54%SD= 7.58
M=0.72%SD=1.42
M=5.19%SD=6.78
M=1.92%SD=2.69
M=1.63%SD=2.89
HL
F
M=28.73SD= 12.08
M=95.68%SD=4.62
M=0.64%SD=1.34
M=2.16%SD=2.7
M=0.26%SD=0.99
M=1.27%SD=2.3
FL
F
M=18.33SD=9.93
M=97.78%SD=3.77
M=0%SD=0
M=1.48%SD=2.57
M=0%SD=0
M=0.75%SD=1.82
Task 1-end of semester
HL
H
M=50.62SD=29.76
M=75.26%SD=14.18
M=2.29%SD=3.27
M=11.41%SD=10.45
M=2%SD=3
M=1.25%SD=2.71
HL
F
M=40.93SD=12.87
M=89%SD=11.83
M=6.41%SD=8.84
M=4.41%SD=5.5
M=1.96%SD=4.9
M=1.59%SD=2.17
FL
F
M=26.33SD=8.88
M=90.13%SD=7.94
M=0SD=0
M=6.75%SD=5.32
M=0.45%SD=1.02
M=2.39%SD=4.05
Task 1-end of semester
HL
H
M=25.5SD=17.1
M=73.69%SD=23.96
M=4.72%SD=6.13
M=15.56%SD=16.30
M=3.01%SD=5.39
M=1.25%SD=4.70
HL
F
M=20SD=8.75
M=82.97%SD=17.09
M=3.46%SD=3.55
M=8.25%SD=12.10
M=1.33%SD=5.16
M=3.99%SD=5.74
FL
F
M=10SD=4.73
M=86%SD=15.17
M=0.52%SD=1.73
M=12.29%SD=13.95
M=0%SD=0
M=1.19%SD=1.19
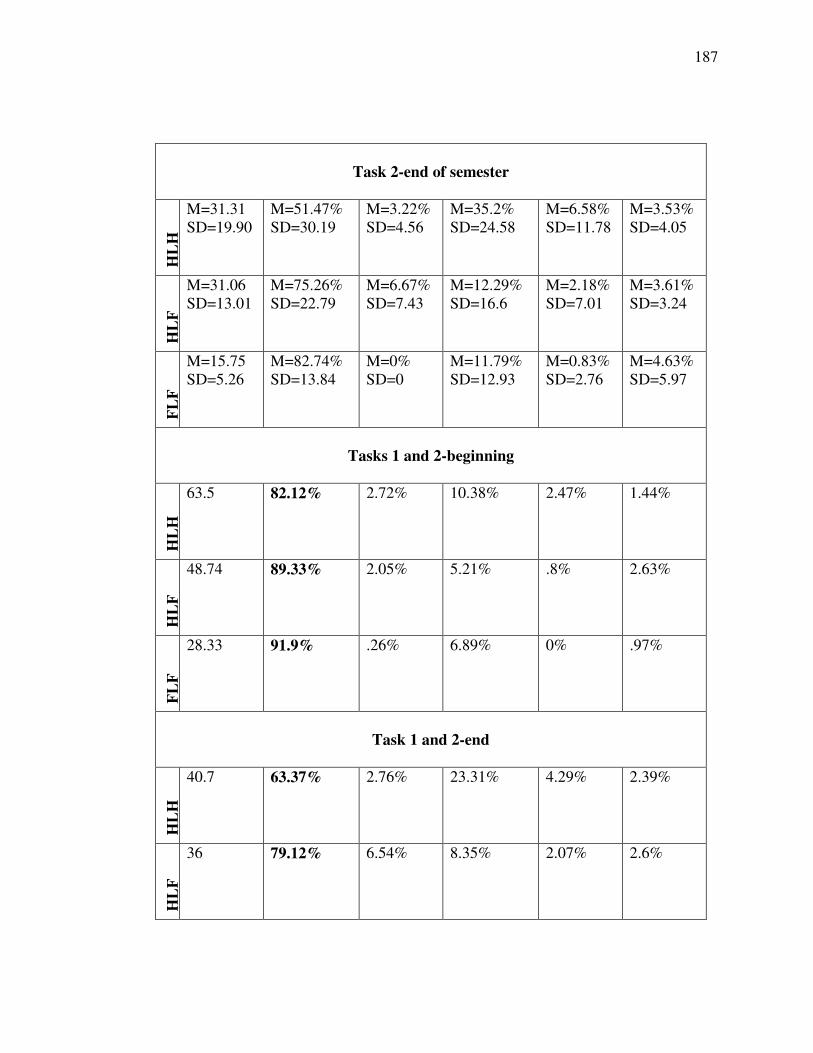
187
Task 2-end of semesterH
LH
M=31.31SD=19.90
M=51.47%SD=30.19
M=3.22%SD=4.56
M=35.2%SD=24.58
M=6.58%SD=11.78
M=3.53%SD=4.05
HL
F
M=31.06SD=13.01
M=75.26%SD=22.79
M=6.67%SD=7.43
M=12.29%SD=16.6
M=2.18%SD=7.01
M=3.61%SD=3.24
FL
F
M=15.75SD=5.26
M=82.74%SD=13.84
M=0%SD=0
M=11.79%SD=12.93
M=0.83%SD=2.76
M=4.63%SD=5.97
Tasks 1 and 2-beginning
HL
H
63.5 82.12% 2.72% 10.38% 2.47% 1.44%
HL
F
48.74 89.33% 2.05% 5.21% .8% 2.63%
FL
F
28.33 91.9% .26% 6.89% 0% .97%
Task 1 and 2-end
HL
H
40.7 63.37% 2.76% 23.31% 4.29% 2.39%
HL
F
36 79.12% 6.54% 8.35% 2.07% 2.6%
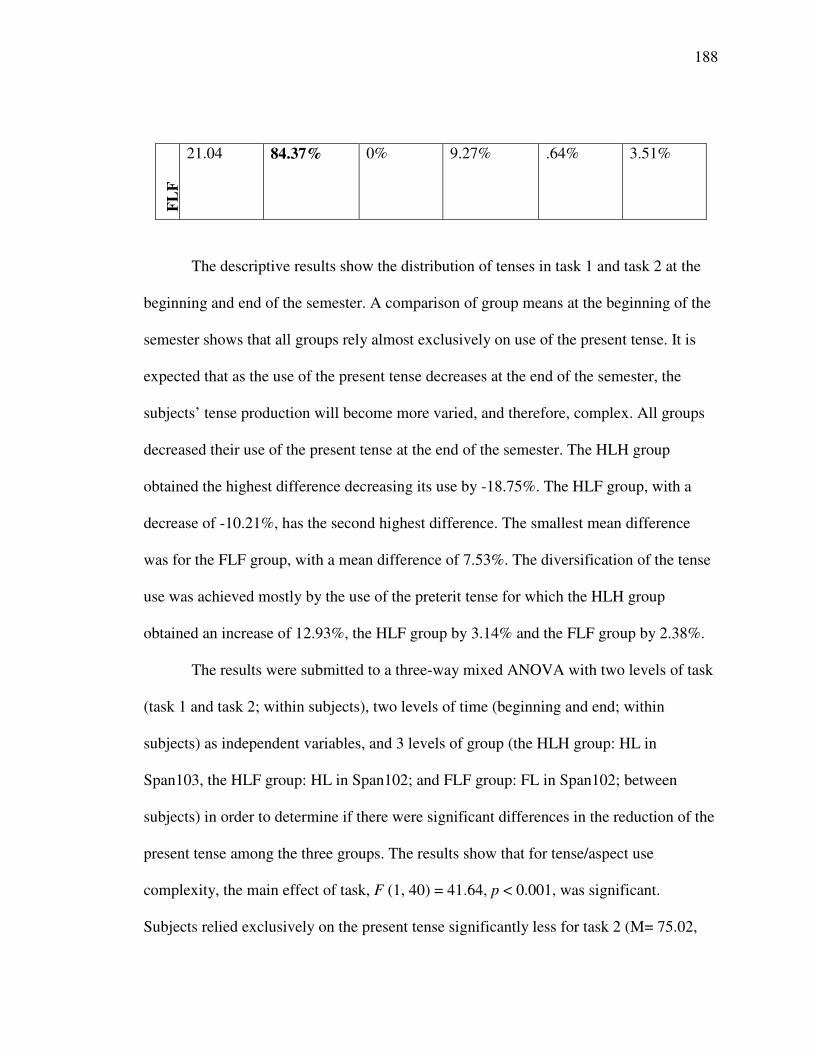
188
FL
F21.04 84.37% 0% 9.27% .64% 3.51%
The descriptive results show the distribution of tenses in task 1 and task 2 at the
beginning and end of the semester. A comparison of group means at the beginning of the
semester shows that all groups rely almost exclusively on use of the present tense. It is
expected that as the use of the present tense decreases at the end of the semester, the
subjects’ tense production will become more varied, and therefore, complex. All groups
decreased their use of the present tense at the end of the semester. The HLH group
obtained the highest difference decreasing its use by -18.75%. The HLF group, with a
decrease of -10.21%, has the second highest difference. The smallest mean difference
was for the FLF group, with a mean difference of 7.53%. The diversification of the tense
use was achieved mostly by the use of the preterit tense for which the HLH group
obtained an increase of 12.93%, the HLF group by 3.14% and the FLF group by 2.38%.
The results were submitted to a three-way mixed ANOVA with two levels of task
(task 1 and task 2; within subjects), two levels of time (beginning and end; within
subjects) as independent variables, and 3 levels of group (the HLH group: HL in
Span103, the HLF group: HL in Span102; and FLF group: FL in Span102; between
subjects) in order to determine if there were significant differences in the reduction of the
present tense among the three groups. The results show that for tense/aspect use
complexity, the main effect of task, F (1, 40) = 41.64, p < 0.001, was significant.
Subjects relied exclusively on the present tense significantly less for task 2 (M= 75.02,
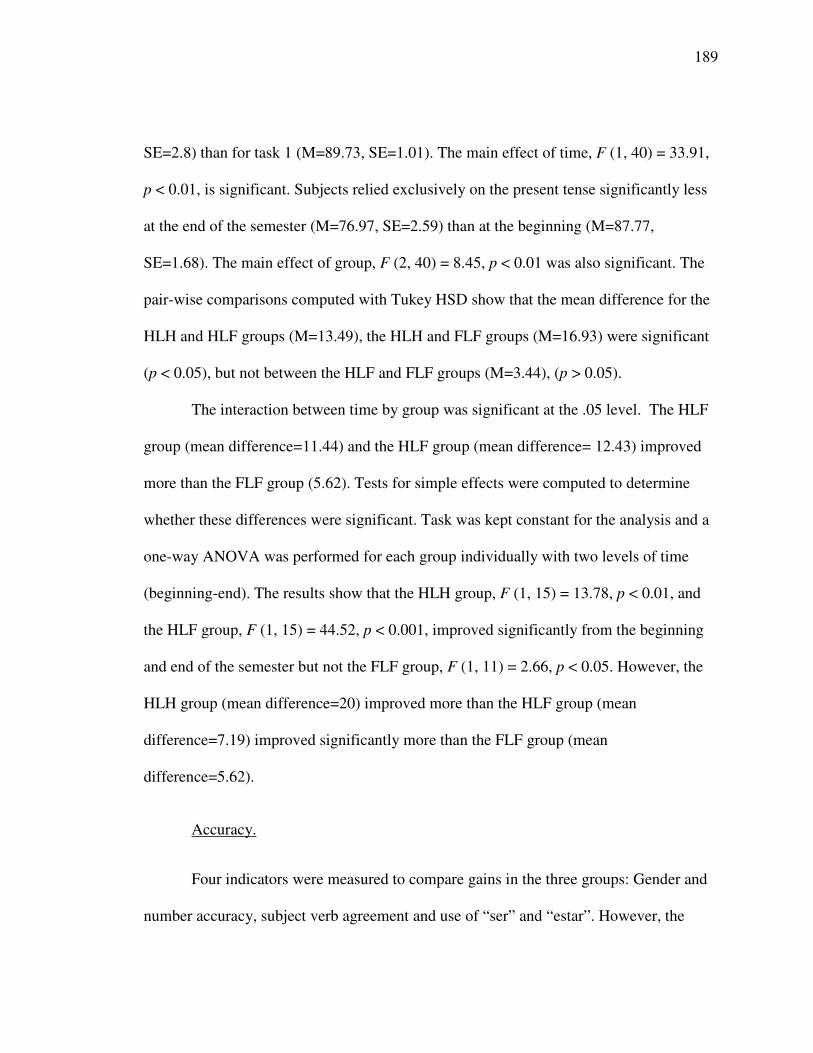
189
SE=2.8) than for task 1 (M=89.73, SE=1.01). The main effect of time, F (1, 40) = 33.91,
p < 0.01, is significant. Subjects relied exclusively on the present tense significantly less
at the end of the semester (M=76.97, SE=2.59) than at the beginning (M=87.77,
SE=1.68). The main effect of group, F (2, 40) = 8.45, p < 0.01 was also significant. The
pair-wise comparisons computed with Tukey HSD show that the mean difference for the
HLH and HLF groups (M=13.49), the HLH and FLF groups (M=16.93) were significant
(p < 0.05), but not between the HLF and FLF groups (M=3.44), (p > 0.05).
The interaction between time by group was significant at the .05 level. The HLF
group (mean difference=11.44) and the HLF group (mean difference= 12.43) improved
more than the FLF group (5.62). Tests for simple effects were computed to determine
whether these differences were significant. Task was kept constant for the analysis and a
one-way ANOVA was performed for each group individually with two levels of time
(beginning-end). The results show that the HLH group, F (1, 15) = 13.78, p < 0.01, and
the HLF group, F (1, 15) = 44.52, p < 0.001, improved significantly from the beginning
and end of the semester but not the FLF group, F (1, 11) = 2.66, p < 0.05. However, the
HLH group (mean difference=20) improved more than the HLF group (mean
difference=7.19) improved significantly more than the FLF group (mean
difference=5.62).
Accuracy.
Four indicators were measured to compare gains in the three groups: Gender and
number accuracy, subject verb agreement and use of “ser” and “estar”. However, the
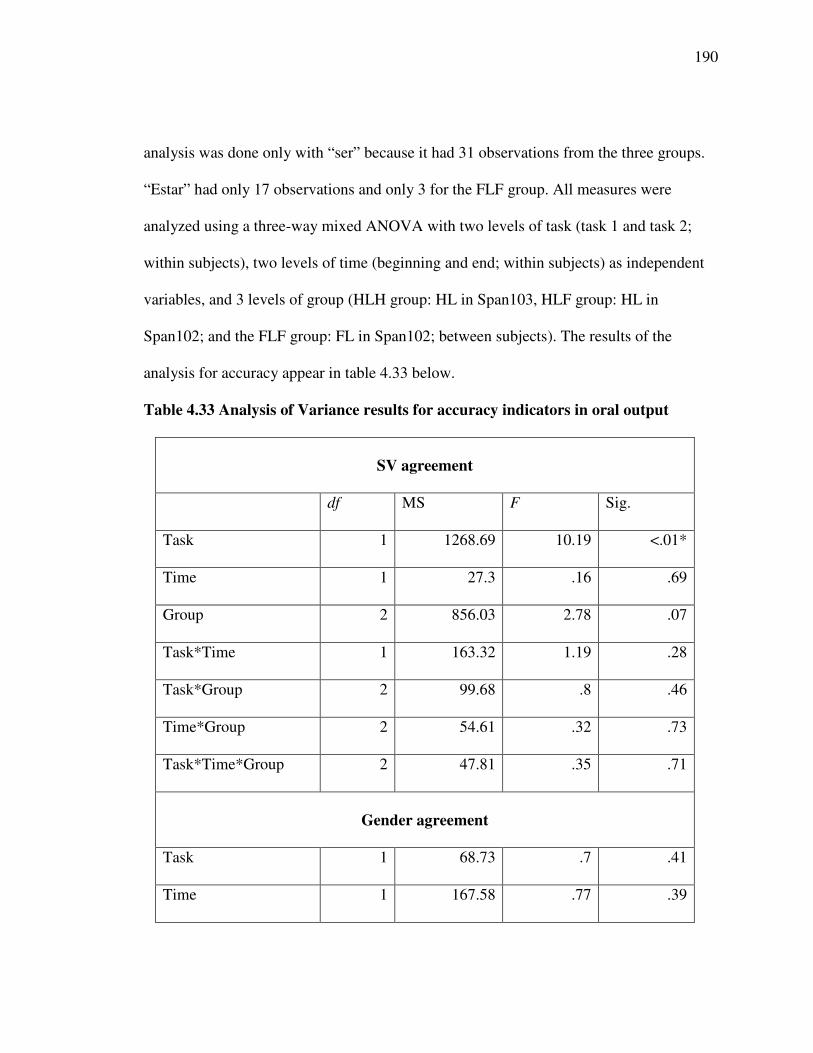
190
analysis was done only with “ser” because it had 31 observations from the three groups.
“Estar” had only 17 observations and only 3 for the FLF group. All measures were
analyzed using a three-way mixed ANOVA with two levels of task (task 1 and task 2;
within subjects), two levels of time (beginning and end; within subjects) as independent
variables, and 3 levels of group (HLH group: HL in Span103, HLF group: HL in
Span102; and the FLF group: FL in Span102; between subjects). The results of the
analysis for accuracy appear in table 4.33 below.
Table 4.33 Analysis of Variance results for accuracy indicators in oral output
SV agreement
df MS F Sig.
Task 1 1268.69 10.19 <.01*
Time 1 27.3 .16 .69
Group 2 856.03 2.78 .07
Task*Time 1 163.32 1.19 .28
Task*Group 2 99.68 .8 .46
Time*Group 2 54.61 .32 .73
Task*Time*Group 2 47.81 .35 .71
Gender agreement
Task 1 68.73 .7 .41
Time 1 167.58 .77 .39
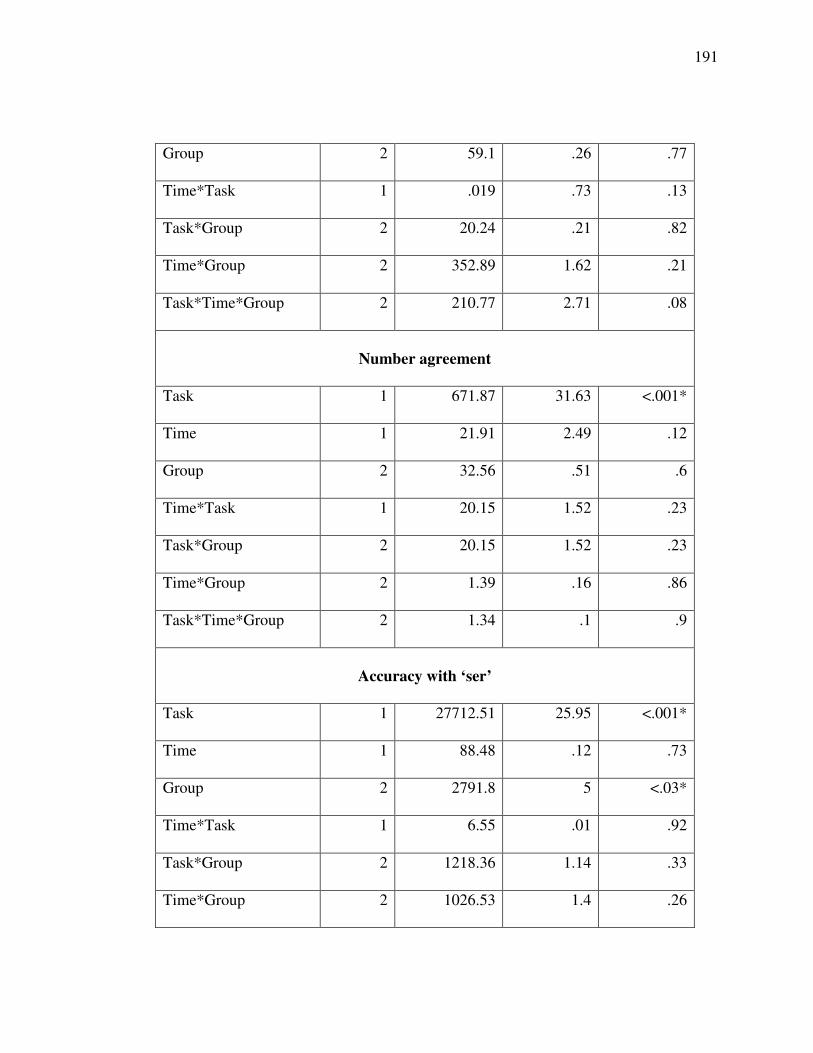
191
Group 2 59.1 .26 .77
Time*Task 1 .019 .73 .13
Task*Group 2 20.24 .21 .82
Time*Group 2 352.89 1.62 .21
Task*Time*Group 2 210.77 2.71 .08
Number agreement
Task 1 671.87 31.63 <.001*
Time 1 21.91 2.49 .12
Group 2 32.56 .51 .6
Time*Task 1 20.15 1.52 .23
Task*Group 2 20.15 1.52 .23
Time*Group 2 1.39 .16 .86
Task*Time*Group 2 1.34 .1 .9
Accuracy with ‘ser’
Task 1 27712.51 25.95 <.001*
Time 1 88.48 .12 .73
Group 2 2791.8 5 <.03*
Time*Task 1 6.55 .01 .92
Task*Group 2 1218.36 1.14 .33
Time*Group 2 1026.53 1.4 .26
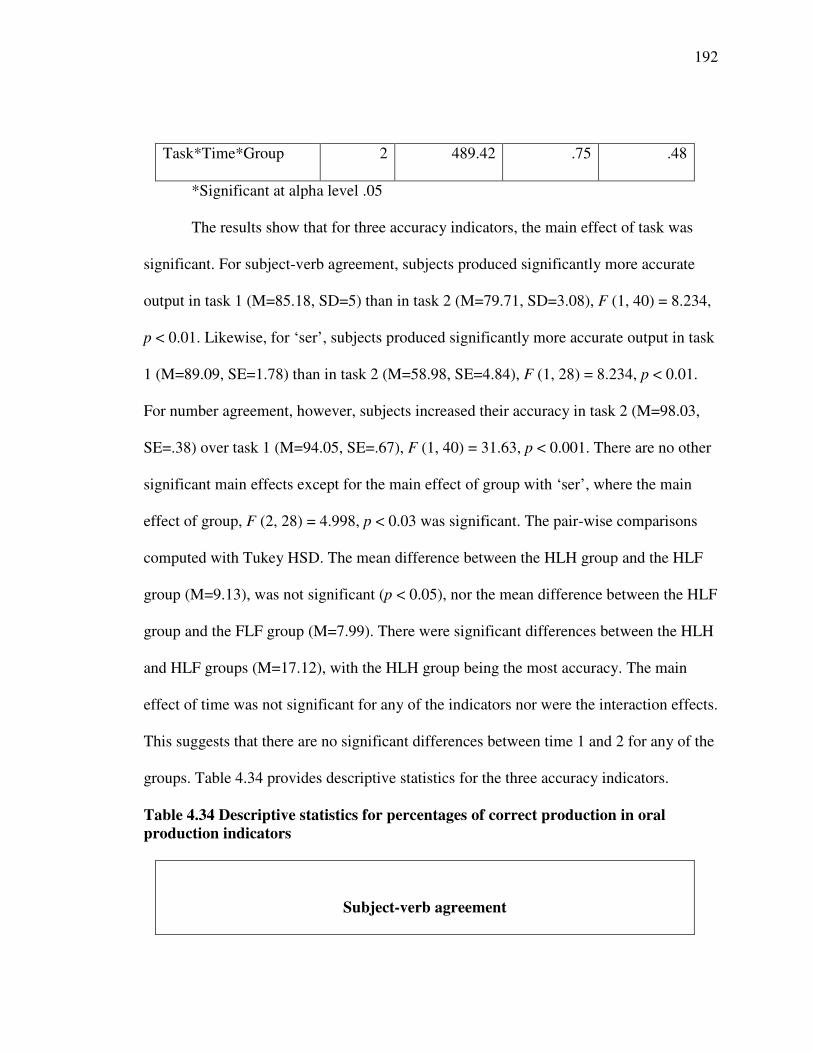
192
Task*Time*Group 2 489.42 .75 .48
*Significant at alpha level .05
The results show that for three accuracy indicators, the main effect of task was
significant. For subject-verb agreement, subjects produced significantly more accurate
output in task 1 (M=85.18, SD=5) than in task 2 (M=79.71, SD=3.08), F (1, 40) = 8.234,
p < 0.01. Likewise, for ‘ser’, subjects produced significantly more accurate output in task
1 (M=89.09, SE=1.78) than in task 2 (M=58.98, SE=4.84), F (1, 28) = 8.234, p < 0.01.
For number agreement, however, subjects increased their accuracy in task 2 (M=98.03,
SE=.38) over task 1 (M=94.05, SE=.67), F (1, 40) = 31.63, p < 0.001. There are no other
significant main effects except for the main effect of group with ‘ser’, where the main
effect of group, F (2, 28) = 4.998, p < 0.03 was significant. The pair-wise comparisons
computed with Tukey HSD. The mean difference between the HLH group and the HLF
group (M=9.13), was not significant (p < 0.05), nor the mean difference between the HLF
group and the FLF group (M=7.99). There were significant differences between the HLH
and HLF groups (M=17.12), with the HLH group being the most accuracy. The main
effect of time was not significant for any of the indicators nor were the interaction effects.
This suggests that there are no significant differences between time 1 and 2 for any of the
groups. Table 4.34 provides descriptive statistics for the three accuracy indicators.
Table 4.34 Descriptive statistics for percentages of correct production in oralproduction indicators
Subject-verb agreement
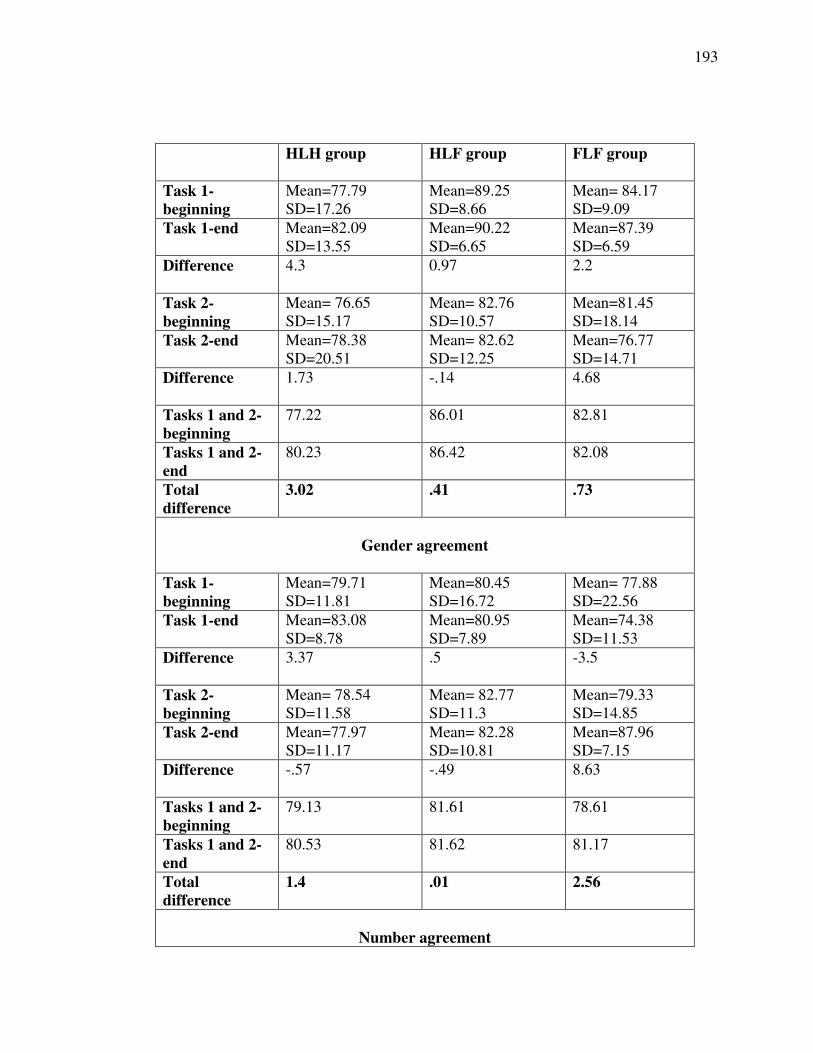
193
HLH group HLF group FLF group
Task 1-beginning
Mean=77.79SD=17.26
Mean=89.25SD=8.66
Mean= 84.17SD=9.09
Task 1-end Mean=82.09SD=13.55
Mean=90.22SD=6.65
Mean=87.39SD=6.59
Difference 4.3 0.97 2.2
Task 2-beginning
Mean= 76.65SD=15.17
Mean= 82.76SD=10.57
Mean=81.45SD=18.14
Task 2-end Mean=78.38SD=20.51
Mean= 82.62SD=12.25
Mean=76.77SD=14.71
Difference 1.73 -.14 4.68
Tasks 1 and 2-beginning
77.22 86.01 82.81
Tasks 1 and 2-end
80.23 86.42 82.08
Totaldifference
3.02 .41 .73
Gender agreement
Task 1-beginning
Mean=79.71SD=11.81
Mean=80.45SD=16.72
Mean= 77.88SD=22.56
Task 1-end Mean=83.08SD=8.78
Mean=80.95SD=7.89
Mean=74.38SD=11.53
Difference 3.37 .5 -3.5
Task 2-beginning
Mean= 78.54SD=11.58
Mean= 82.77SD=11.3
Mean=79.33SD=14.85
Task 2-end Mean=77.97SD=11.17
Mean= 82.28SD=10.81
Mean=87.96SD=7.15
Difference -.57 -.49 8.63
Tasks 1 and 2-beginning
79.13 81.61 78.61
Tasks 1 and 2-end
80.53 81.62 81.17
Totaldifference
1.4 .01 2.56
Number agreement
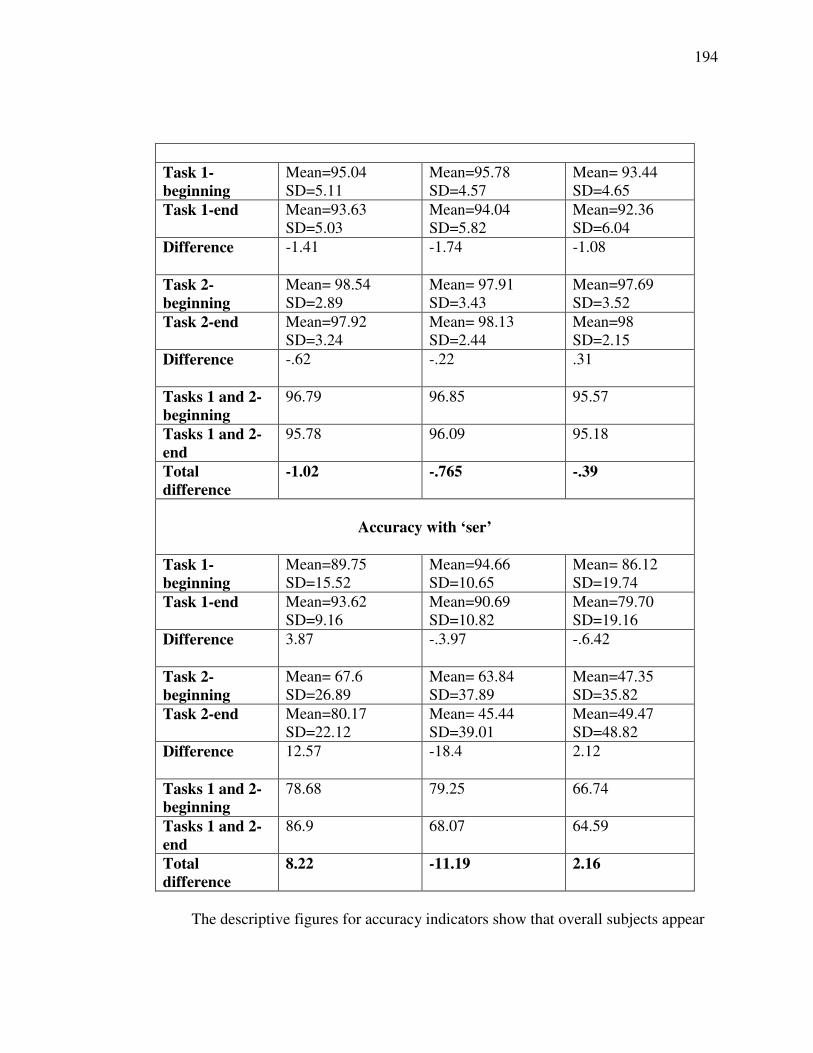
194
Task 1-beginning
Mean=95.04SD=5.11
Mean=95.78SD=4.57
Mean= 93.44SD=4.65
Task 1-end Mean=93.63SD=5.03
Mean=94.04SD=5.82
Mean=92.36SD=6.04
Difference -1.41 -1.74 -1.08
Task 2-beginning
Mean= 98.54SD=2.89
Mean= 97.91SD=3.43
Mean=97.69SD=3.52
Task 2-end Mean=97.92SD=3.24
Mean= 98.13SD=2.44
Mean=98SD=2.15
Difference -.62 -.22 .31
Tasks 1 and 2-beginning
96.79 96.85 95.57
Tasks 1 and 2-end
95.78 96.09 95.18
Totaldifference
-1.02 -.765 -.39
Accuracy with ‘ser’
Task 1-beginning
Mean=89.75SD=15.52
Mean=94.66SD=10.65
Mean= 86.12SD=19.74
Task 1-end Mean=93.62SD=9.16
Mean=90.69SD=10.82
Mean=79.70SD=19.16
Difference 3.87 -.3.97 -.6.42
Task 2-beginning
Mean= 67.6SD=26.89
Mean= 63.84SD=37.89
Mean=47.35SD=35.82
Task 2-end Mean=80.17SD=22.12
Mean= 45.44SD=39.01
Mean=49.47SD=48.82
Difference 12.57 -18.4 2.12
Tasks 1 and 2-beginning
78.68 79.25 66.74
Tasks 1 and 2-end
86.9 68.07 64.59
Totaldifference
8.22 -11.19 2.16
The descriptive figures for accuracy indicators show that overall subjects appear
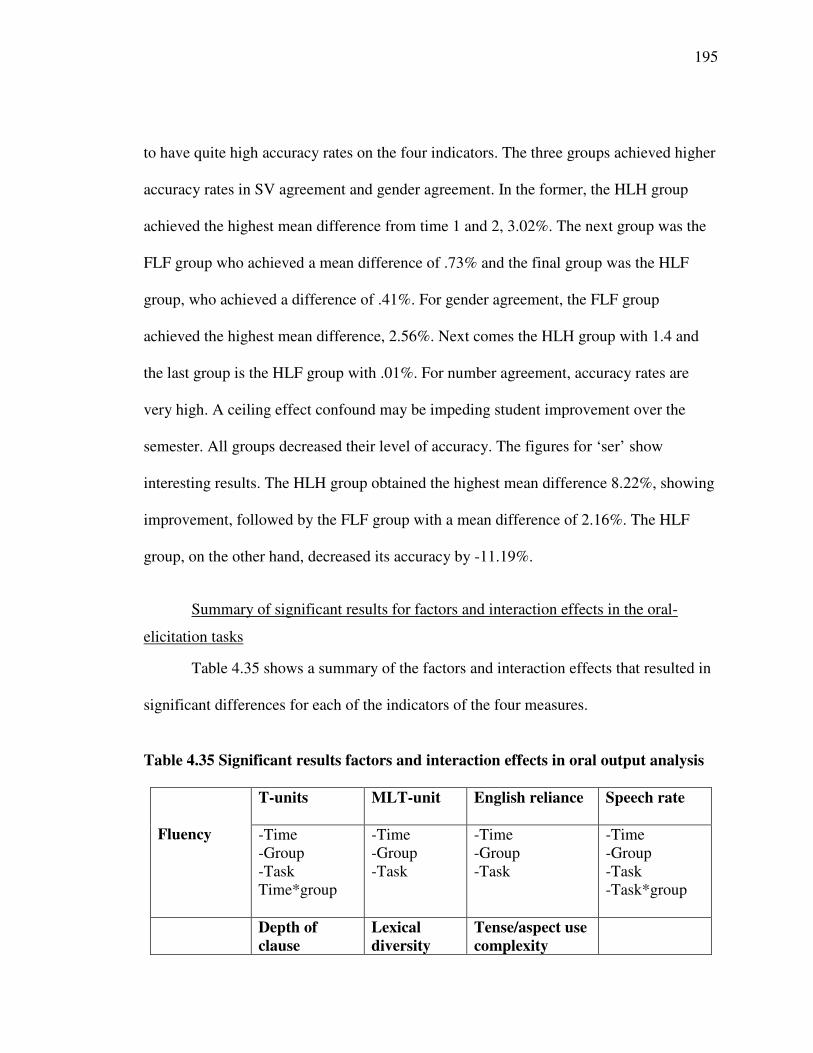
195
to have quite high accuracy rates on the four indicators. The three groups achieved higher
accuracy rates in SV agreement and gender agreement. In the former, the HLH group
achieved the highest mean difference from time 1 and 2, 3.02%. The next group was the
FLF group who achieved a mean difference of .73% and the final group was the HLF
group, who achieved a difference of .41%. For gender agreement, the FLF group
achieved the highest mean difference, 2.56%. Next comes the HLH group with 1.4 and
the last group is the HLF group with .01%. For number agreement, accuracy rates are
very high. A ceiling effect confound may be impeding student improvement over the
semester. All groups decreased their level of accuracy. The figures for ‘ser’ show
interesting results. The HLH group obtained the highest mean difference 8.22%, showing
improvement, followed by the FLF group with a mean difference of 2.16%. The HLF
group, on the other hand, decreased its accuracy by -11.19%.
Summary of significant results for factors and interaction effects in the oral-
elicitation tasks
Table 4.35 shows a summary of the factors and interaction effects that resulted in
significant differences for each of the indicators of the four measures.
Table 4.35 Significant results factors and interaction effects in oral output analysis
T-units MLT-unit English reliance Speech rate
Fluency -Time-Group-TaskTime*group
-Time-Group-Task
-Time-Group-Task
-Time-Group-Task-Task*group
Depth ofclause
Lexicaldiversity
Tense/aspect usecomplexity
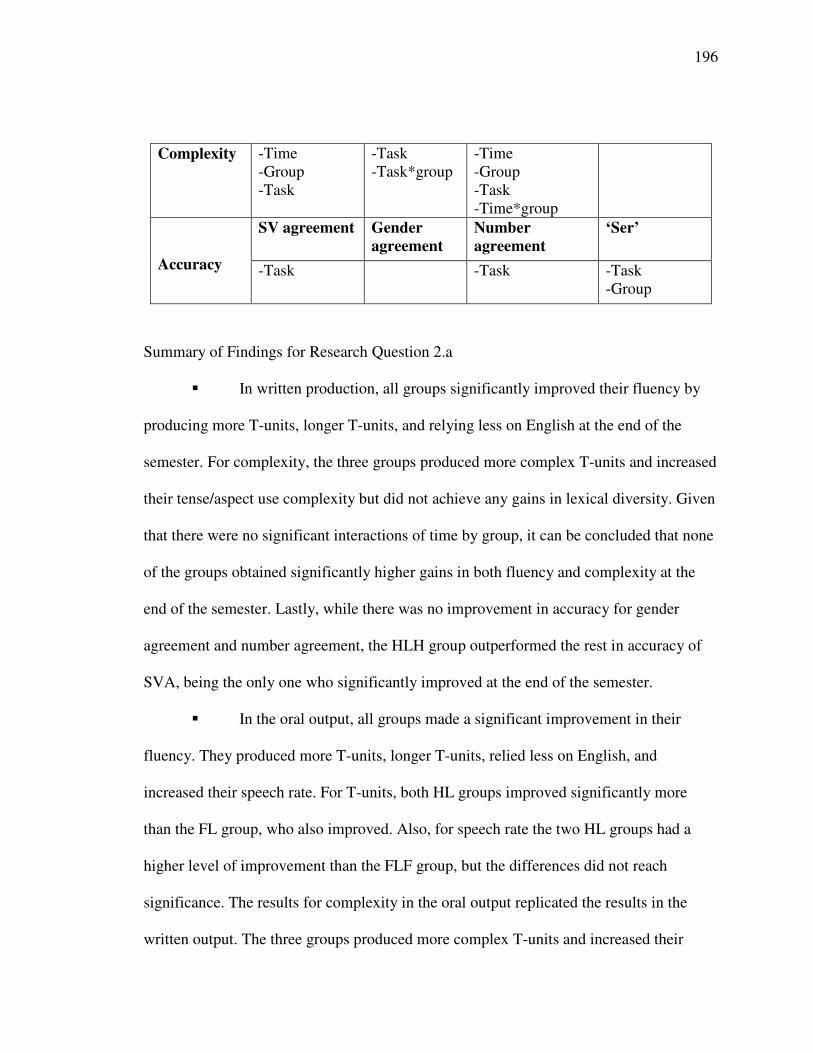
196
Complexity -Time-Group-Task
-Task-Task*group
-Time-Group-Task-Time*group
SV agreement Genderagreement
Numberagreement
‘Ser’
Accuracy -Task -Task -Task-Group
Summary of Findings for Research Question 2.a
� In written production, all groups significantly improved their fluency by
producing more T-units, longer T-units, and relying less on English at the end of the
semester. For complexity, the three groups produced more complex T-units and increased
their tense/aspect use complexity but did not achieve any gains in lexical diversity. Given
that there were no significant interactions of time by group, it can be concluded that none
of the groups obtained significantly higher gains in both fluency and complexity at the
end of the semester. Lastly, while there was no improvement in accuracy for gender
agreement and number agreement, the HLH group outperformed the rest in accuracy of
SVA, being the only one who significantly improved at the end of the semester.
� In the oral output, all groups made a significant improvement in their
fluency. They produced more T-units, longer T-units, relied less on English, and
increased their speech rate. For T-units, both HL groups improved significantly more
than the FL group, who also improved. Also, for speech rate the two HL groups had a
higher level of improvement than the FLF group, but the differences did not reach
significance. The results for complexity in the oral output replicated the results in the
written output. The three groups produced more complex T-units and increased their
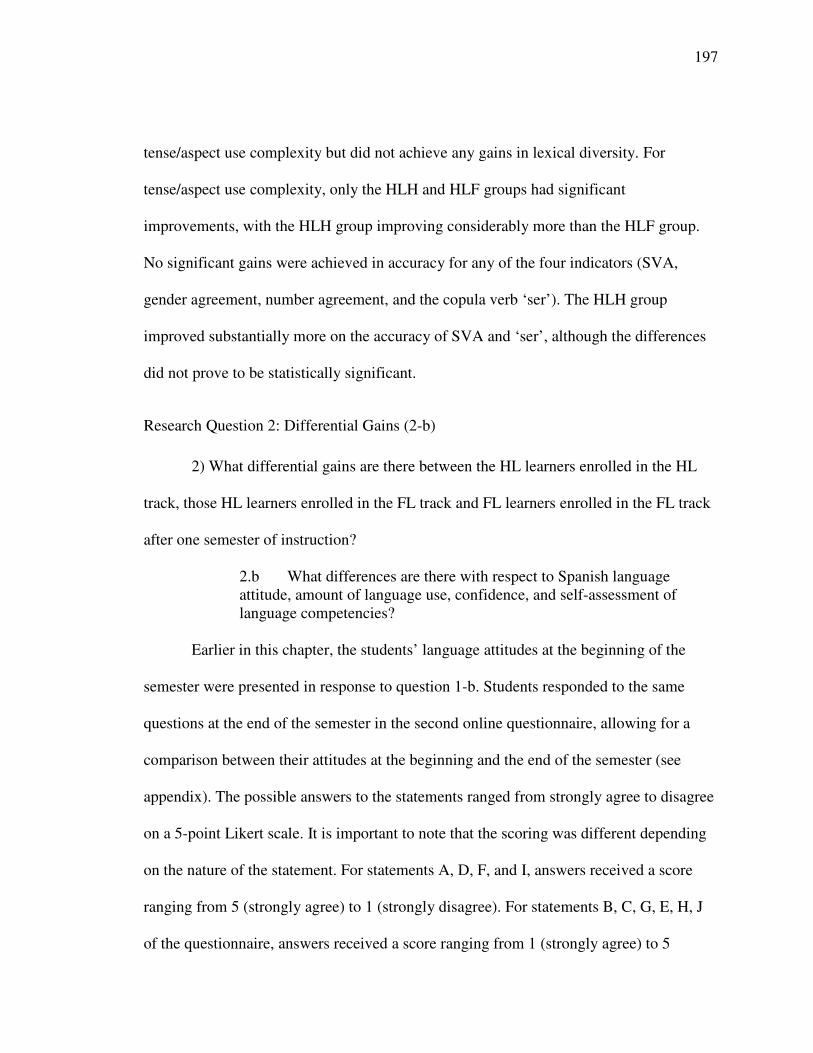
197
tense/aspect use complexity but did not achieve any gains in lexical diversity. For
tense/aspect use complexity, only the HLH and HLF groups had significant
improvements, with the HLH group improving considerably more than the HLF group.
No significant gains were achieved in accuracy for any of the four indicators (SVA,
gender agreement, number agreement, and the copula verb ‘ser’). The HLH group
improved substantially more on the accuracy of SVA and ‘ser’, although the differences
did not prove to be statistically significant.
Research Question 2: Differential Gains (2-b)
2) What differential gains are there between the HL learners enrolled in the HL
track, those HL learners enrolled in the FL track and FL learners enrolled in the FL track
after one semester of instruction?
2.b What differences are there with respect to Spanish languageattitude, amount of language use, confidence, and self-assessment oflanguage competencies?
Earlier in this chapter, the students’ language attitudes at the beginning of the
semester were presented in response to question 1-b. Students responded to the same
questions at the end of the semester in the second online questionnaire, allowing for a
comparison between their attitudes at the beginning and the end of the semester (see
appendix). The possible answers to the statements ranged from strongly agree to disagree
on a 5-point Likert scale. It is important to note that the scoring was different depending
on the nature of the statement. For statements A, D, F, and I, answers received a score
ranging from 5 (strongly agree) to 1 (strongly disagree). For statements B, C, G, E, H, J
of the questionnaire, answers received a score ranging from 1 (strongly agree) to 5
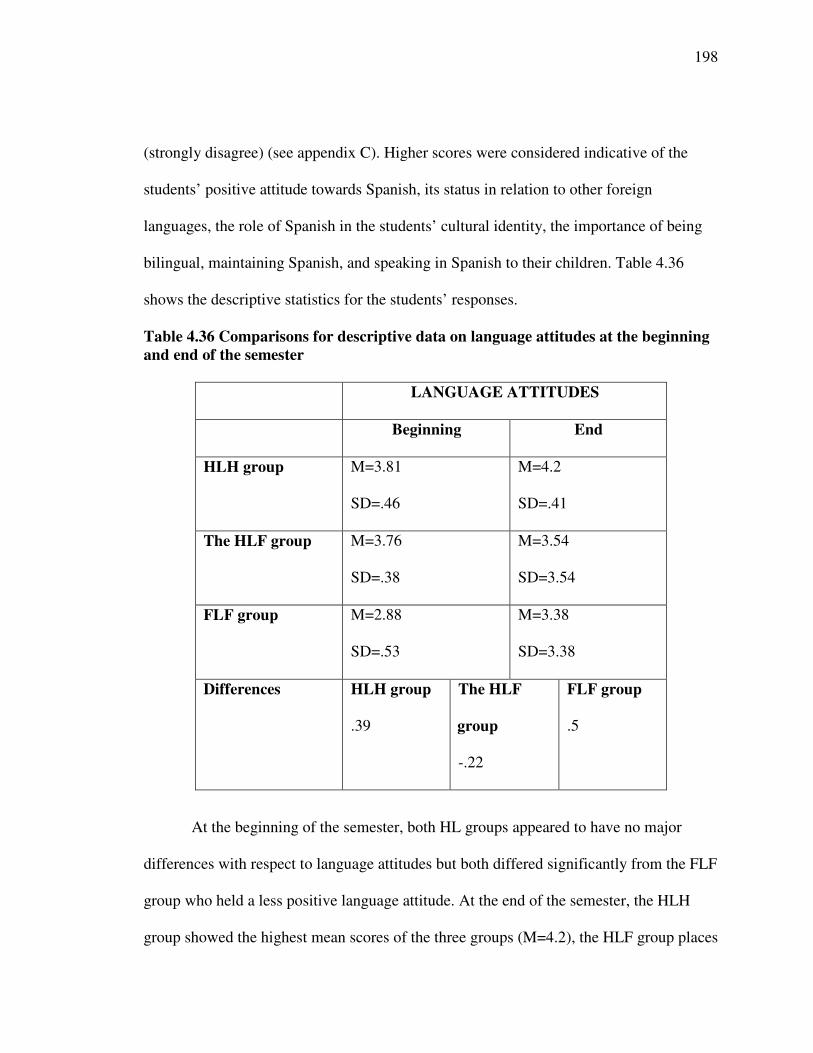
198
(strongly disagree) (see appendix C). Higher scores were considered indicative of the
students’ positive attitude towards Spanish, its status in relation to other foreign
languages, the role of Spanish in the students’ cultural identity, the importance of being
bilingual, maintaining Spanish, and speaking in Spanish to their children. Table 4.36
shows the descriptive statistics for the students’ responses.
Table 4.36 Comparisons for descriptive data on language attitudes at the beginningand end of the semester
LANGUAGE ATTITUDES
Beginning End
HLH group M=3.81
SD=.46
M=4.2
SD=.41
The HLF group M=3.76
SD=.38
M=3.54
SD=3.54
FLF group M=2.88
SD=.53
M=3.38
SD=3.38
Differences HLH group
.39
The HLF
group
-.22
FLF group
.5
At the beginning of the semester, both HL groups appeared to have no major
differences with respect to language attitudes but both differed significantly from the FLF
group who held a less positive language attitude. At the end of the semester, the HLH
group showed the highest mean scores of the three groups (M=4.2), the HLF group places
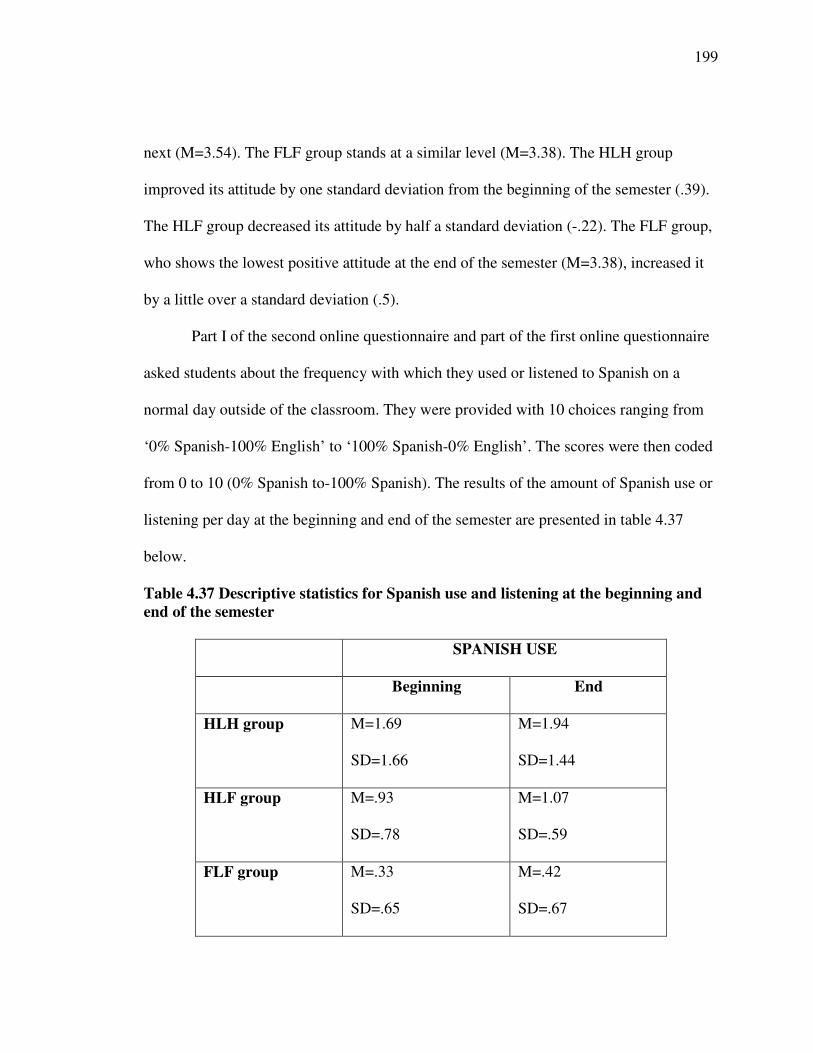
199
next (M=3.54). The FLF group stands at a similar level (M=3.38). The HLH group
improved its attitude by one standard deviation from the beginning of the semester (.39).
The HLF group decreased its attitude by half a standard deviation (-.22). The FLF group,
who shows the lowest positive attitude at the end of the semester (M=3.38), increased it
by a little over a standard deviation (.5).
Part I of the second online questionnaire and part of the first online questionnaire
asked students about the frequency with which they used or listened to Spanish on a
normal day outside of the classroom. They were provided with 10 choices ranging from
‘0% Spanish-100% English’ to ‘100% Spanish-0% English’. The scores were then coded
from 0 to 10 (0% Spanish to-100% Spanish). The results of the amount of Spanish use or
listening per day at the beginning and end of the semester are presented in table 4.37
below.
Table 4.37 Descriptive statistics for Spanish use and listening at the beginning andend of the semester
SPANISH USE
Beginning End
HLH group M=1.69
SD=1.66
M=1.94
SD=1.44
HLF group M=.93
SD=.78
M=1.07
SD=.59
FLF group M=.33
SD=.65
M=.42
SD=.67
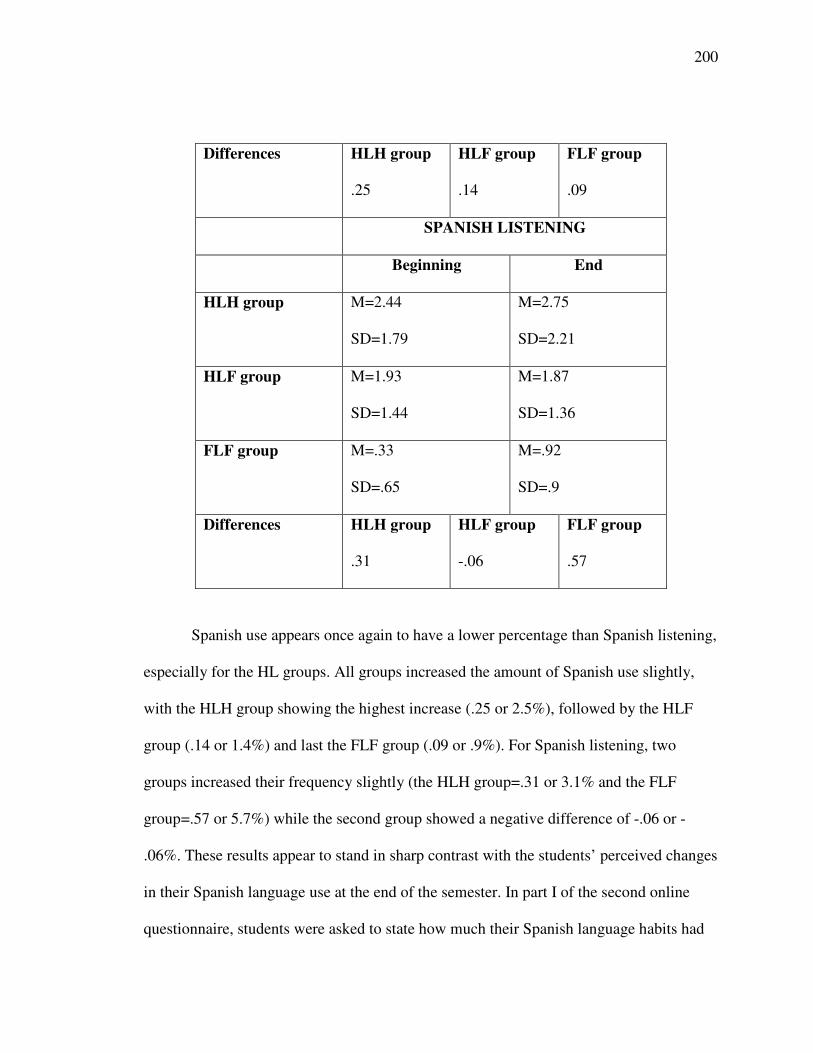
200
Differences HLH group
.25
HLF group
.14
FLF group
.09
SPANISH LISTENING
Beginning End
HLH group M=2.44
SD=1.79
M=2.75
SD=2.21
HLF group M=1.93
SD=1.44
M=1.87
SD=1.36
FLF group M=.33
SD=.65
M=.92
SD=.9
Differences HLH group
.31
HLF group
-.06
FLF group
.57
Spanish use appears once again to have a lower percentage than Spanish listening,
especially for the HL groups. All groups increased the amount of Spanish use slightly,
with the HLH group showing the highest increase (.25 or 2.5%), followed by the HLF
group (.14 or 1.4%) and last the FLF group (.09 or .9%). For Spanish listening, two
groups increased their frequency slightly (the HLH group=.31 or 3.1% and the FLF
group=.57 or 5.7%) while the second group showed a negative difference of -.06 or -
.06%. These results appear to stand in sharp contrast with the students’ perceived changes
in their Spanish language use at the end of the semester. In part I of the second online
questionnaire, students were asked to state how much their Spanish language habits had
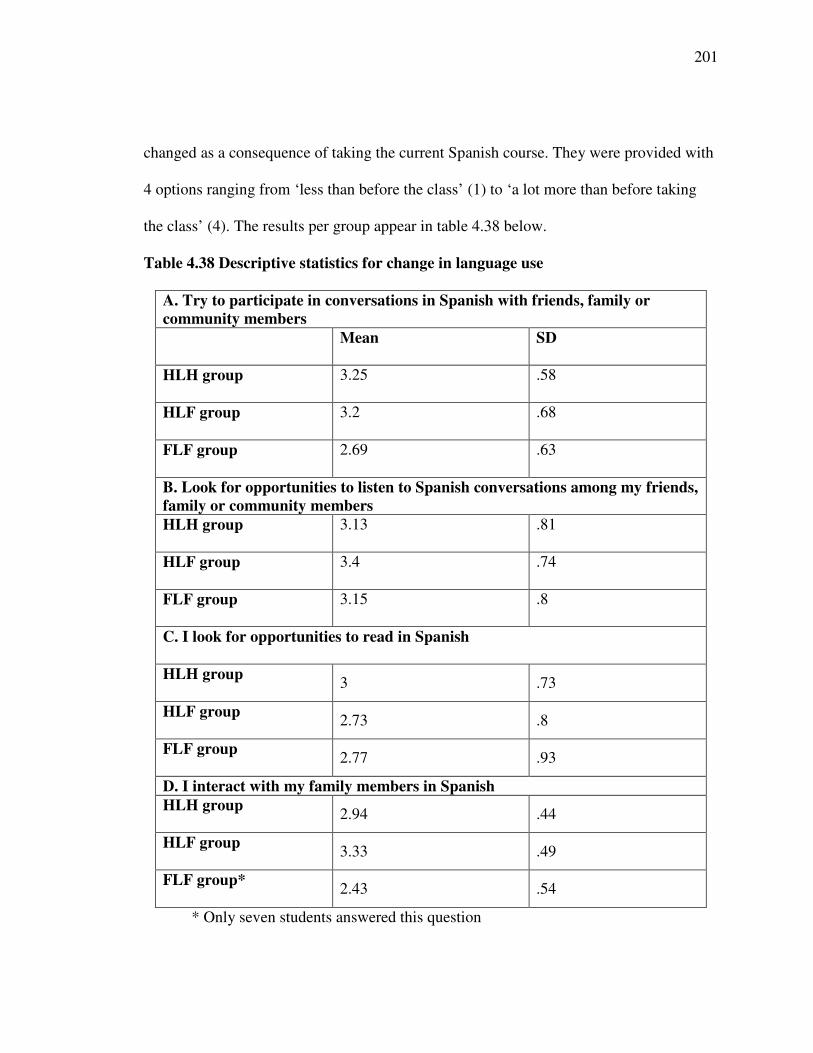
201
changed as a consequence of taking the current Spanish course. They were provided with
4 options ranging from ‘less than before the class’ (1) to ‘a lot more than before taking
the class’ (4). The results per group appear in table 4.38 below.
Table 4.38 Descriptive statistics for change in language use
A. Try to participate in conversations in Spanish with friends, family orcommunity members
Mean SD
HLH group 3.25 .58
HLF group 3.2 .68
FLF group 2.69 .63
B. Look for opportunities to listen to Spanish conversations among my friends,family or community membersHLH group 3.13 .81
HLF group 3.4 .74
FLF group 3.15 .8
C. I look for opportunities to read in Spanish
HLH group 3 .73
HLF group 2.73 .8
FLF group 2.77 .93
D. I interact with my family members in SpanishHLH group 2.94 .44
HLF group 3.33 .49
FLF group* 2.43 .54
* Only seven students answered this question
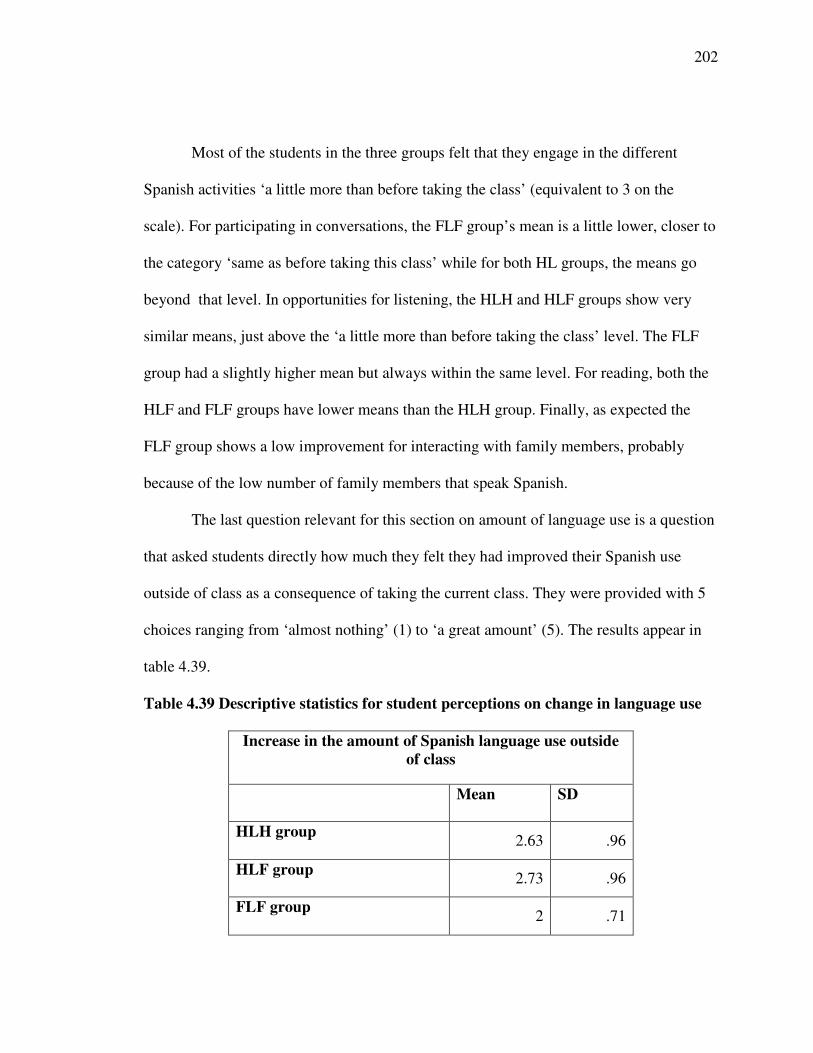
202
Most of the students in the three groups felt that they engage in the different
Spanish activities ‘a little more than before taking the class’ (equivalent to 3 on the
scale). For participating in conversations, the FLF group’s mean is a little lower, closer to
the category ‘same as before taking this class’ while for both HL groups, the means go
beyond that level. In opportunities for listening, the HLH and HLF groups show very
similar means, just above the ‘a little more than before taking the class’ level. The FLF
group had a slightly higher mean but always within the same level. For reading, both the
HLF and FLF groups have lower means than the HLH group. Finally, as expected the
FLF group shows a low improvement for interacting with family members, probably
because of the low number of family members that speak Spanish.
The last question relevant for this section on amount of language use is a question
that asked students directly how much they felt they had improved their Spanish use
outside of class as a consequence of taking the current class. They were provided with 5
choices ranging from ‘almost nothing’ (1) to ‘a great amount’ (5). The results appear in
table 4.39.
Table 4.39 Descriptive statistics for student perceptions on change in language use
Increase in the amount of Spanish language use outsideof class
Mean SD
HLH group2.63 .96
HLF group 2.73 .96
FLF group2 .71
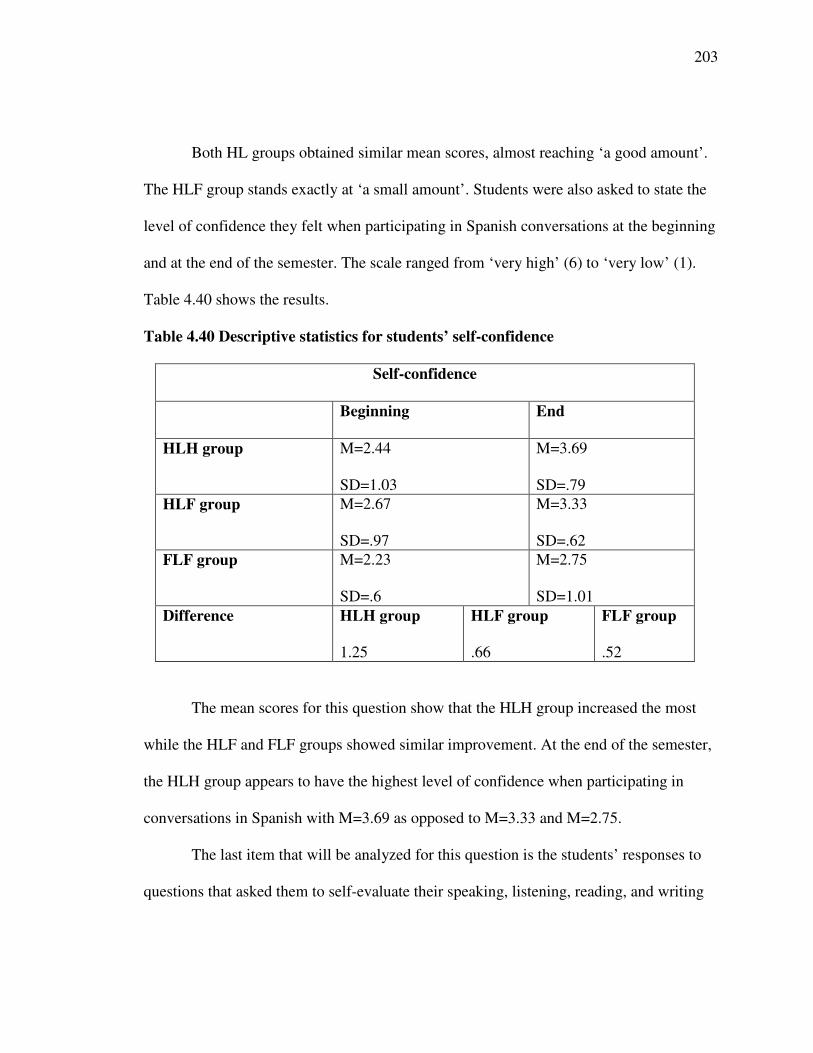
203
Both HL groups obtained similar mean scores, almost reaching ‘a good amount’.
The HLF group stands exactly at ‘a small amount’. Students were also asked to state the
level of confidence they felt when participating in Spanish conversations at the beginning
and at the end of the semester. The scale ranged from ‘very high’ (6) to ‘very low’ (1).
Table 4.40 shows the results.
Table 4.40 Descriptive statistics for students’ self-confidence
Self-confidence
Beginning End
HLH group M=2.44
SD=1.03
M=3.69
SD=.79HLF group M=2.67
SD=.97
M=3.33
SD=.62FLF group M=2.23
SD=.6
M=2.75
SD=1.01Difference HLH group
1.25
HLF group
.66
FLF group
.52
The mean scores for this question show that the HLH group increased the most
while the HLF and FLF groups showed similar improvement. At the end of the semester,
the HLH group appears to have the highest level of confidence when participating in
conversations in Spanish with M=3.69 as opposed to M=3.33 and M=2.75.
The last item that will be analyzed for this question is the students’ responses to
questions that asked them to self-evaluate their speaking, listening, reading, and writing
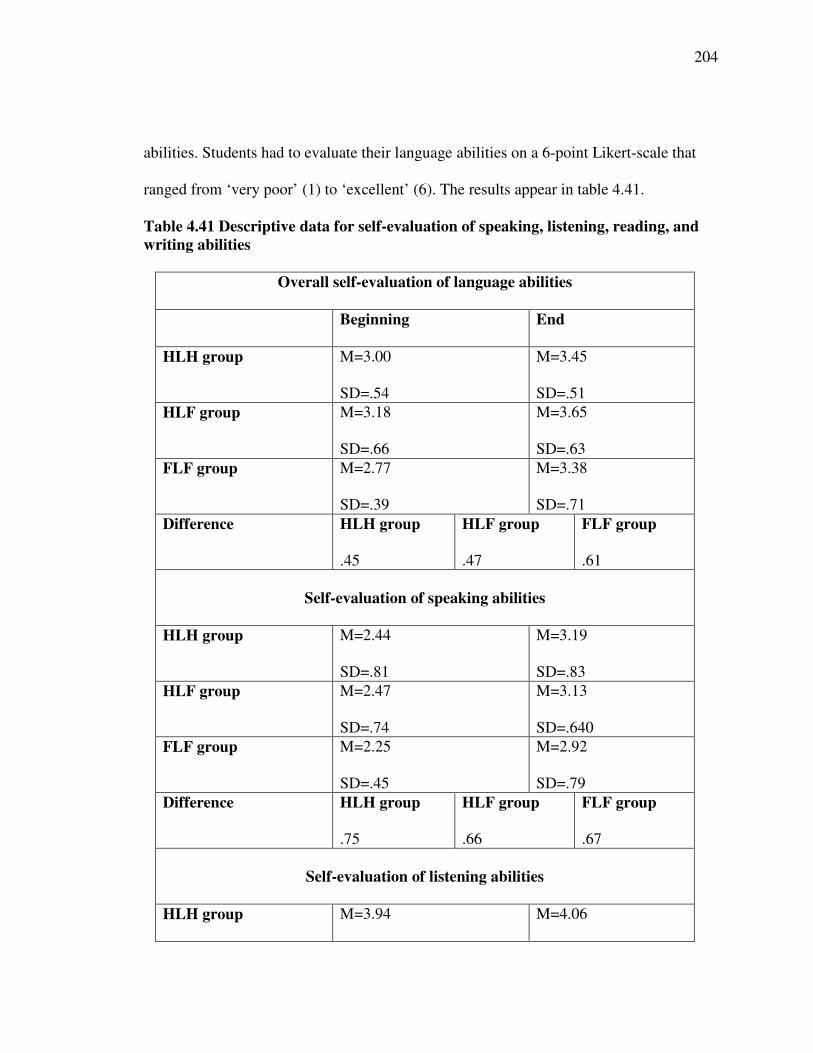
204
abilities. Students had to evaluate their language abilities on a 6-point Likert-scale that
ranged from ‘very poor’ (1) to ‘excellent’ (6). The results appear in table 4.41.
Table 4.41 Descriptive data for self-evaluation of speaking, listening, reading, andwriting abilities
Overall self-evaluation of language abilities
Beginning End
HLH group M=3.00
SD=.54
M=3.45
SD=.51HLF group M=3.18
SD=.66
M=3.65
SD=.63FLF group M=2.77
SD=.39
M=3.38
SD=.71Difference HLH group
.45
HLF group
.47
FLF group
.61
Self-evaluation of speaking abilities
HLH group M=2.44
SD=.81
M=3.19
SD=.83HLF group M=2.47
SD=.74
M=3.13
SD=.640FLF group M=2.25
SD=.45
M=2.92
SD=.79Difference HLH group
.75
HLF group
.66
FLF group
.67
Self-evaluation of listening abilities
HLH group M=3.94 M=4.06
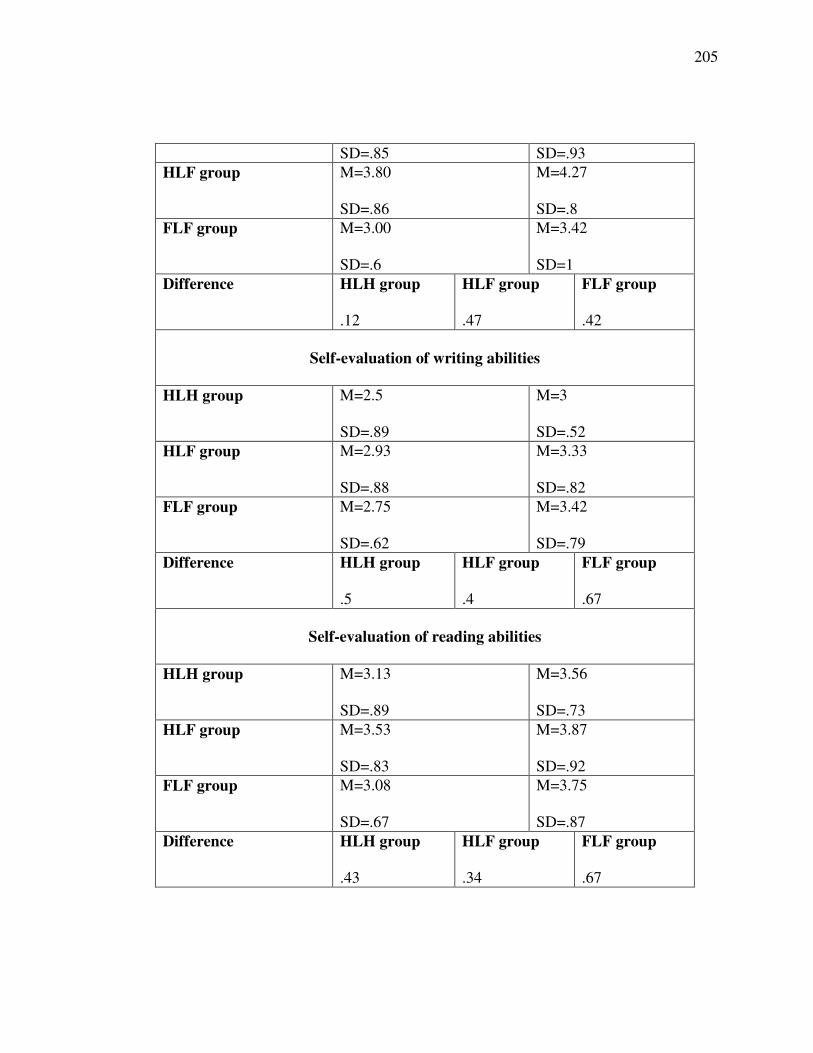
205
SD=.85 SD=.93HLF group M=3.80
SD=.86
M=4.27
SD=.8FLF group M=3.00
SD=.6
M=3.42
SD=1Difference HLH group
.12
HLF group
.47
FLF group
.42
Self-evaluation of writing abilities
HLH group M=2.5
SD=.89
M=3
SD=.52HLF group M=2.93
SD=.88
M=3.33
SD=.82FLF group M=2.75
SD=.62
M=3.42
SD=.79Difference HLH group
.5
HLF group
.4
FLF group
.67
Self-evaluation of reading abilities
HLH group M=3.13
SD=.89
M=3.56
SD=.73HLF group M=3.53
SD=.83
M=3.87
SD=.92FLF group M=3.08
SD=.67
M=3.75
SD=.87Difference HLH group
.43
HLF group
.34
FLF group
.67

206
The descriptive statistics for the overall self-evaluation of language abilities show
that at the beginning of the semester the HLF group had the highest self-evaluation score
and the FLF group the lowest. The HLH group obtained an average score of ‘fair’ while
the FLF nearly reached that level. At the end of the semester, the FLF group increased
their self-evaluation score the most and both HL groups had similar improvement. The
average increase was approximately one standard deviation (.53), resulting in an average
end self-evaluation of a score midway between ‘fair’ and ‘good’. Figure 4.5 summarizes
the findings for each group’s self-evaluation of language abilities.
Figure 4.5 Self-evaluation of Spanish language abilities
Self-evaluation of Spanish language abilities
0
1
2
3
4
5
6
Speak
ing1
Speak
ing2
Liste
ning
1
Liste
ning
2
Writi
ng1
Writi
ng2
Reading
1
Reading
2
Overal
l 1
Overal
l 2
Sca
le
Group 1
Group 2
Group 3
Group 1=HLF group; Group 2=HLF group; Group 3=FLF group
The next step in the analysis was to determine if there were significant differences
among the groups on the variables examined in this question. The results were submitted
to a two-way analysis of variance (ANOVA) with one within-subjects factor (time) with
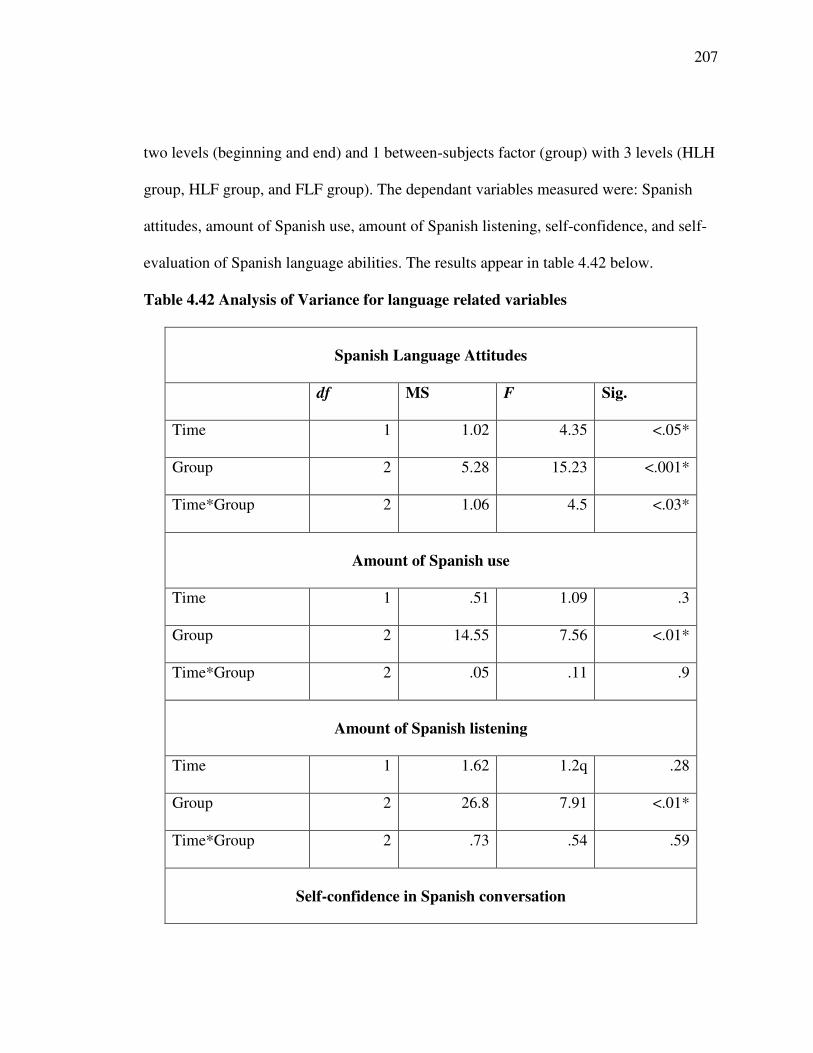
207
two levels (beginning and end) and 1 between-subjects factor (group) with 3 levels (HLH
group, HLF group, and FLF group). The dependant variables measured were: Spanish
attitudes, amount of Spanish use, amount of Spanish listening, self-confidence, and self-
evaluation of Spanish language abilities. The results appear in table 4.42 below.
Table 4.42 Analysis of Variance for language related variables
Spanish Language Attitudes
df MS F Sig.
Time 1 1.02 4.35 <.05*
Group 2 5.28 15.23 <.001*
Time*Group 2 1.06 4.5 <.03*
Amount of Spanish use
Time 1 .51 1.09 .3
Group 2 14.55 7.56 <.01*
Time*Group 2 .05 .11 .9
Amount of Spanish listening
Time 1 1.62 1.2q .28
Group 2 26.8 7.91 <.01*
Time*Group 2 .73 .54 .59
Self-confidence in Spanish conversation
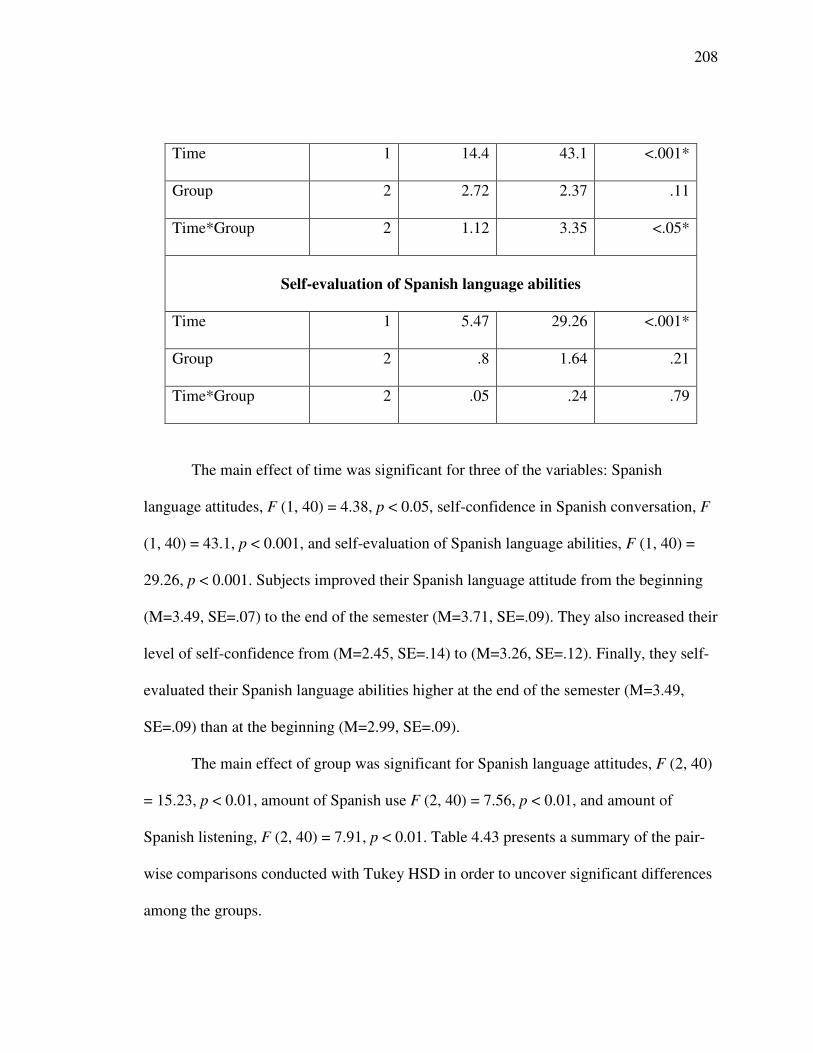
208
Time 1 14.4 43.1 <.001*
Group 2 2.72 2.37 .11
Time*Group 2 1.12 3.35 <.05*
Self-evaluation of Spanish language abilities
Time 1 5.47 29.26 <.001*
Group 2 .8 1.64 .21
Time*Group 2 .05 .24 .79
The main effect of time was significant for three of the variables: Spanish
language attitudes, F (1, 40) = 4.38, p < 0.05, self-confidence in Spanish conversation, F
(1, 40) = 43.1, p < 0.001, and self-evaluation of Spanish language abilities, F (1, 40) =
29.26, p < 0.001. Subjects improved their Spanish language attitude from the beginning
(M=3.49, SE=.07) to the end of the semester (M=3.71, SE=.09). They also increased their
level of self-confidence from (M=2.45, SE=.14) to (M=3.26, SE=.12). Finally, they self-
evaluated their Spanish language abilities higher at the end of the semester (M=3.49,
SE=.09) than at the beginning (M=2.99, SE=.09).
The main effect of group was significant for Spanish language attitudes, F (2, 40)
= 15.23, p < 0.01, amount of Spanish use F (2, 40) = 7.56, p < 0.01, and amount of
Spanish listening, F (2, 40) = 7.91, p < 0.01. Table 4.43 presents a summary of the pair-
wise comparisons conducted with Tukey HSD in order to uncover significant differences
among the groups.
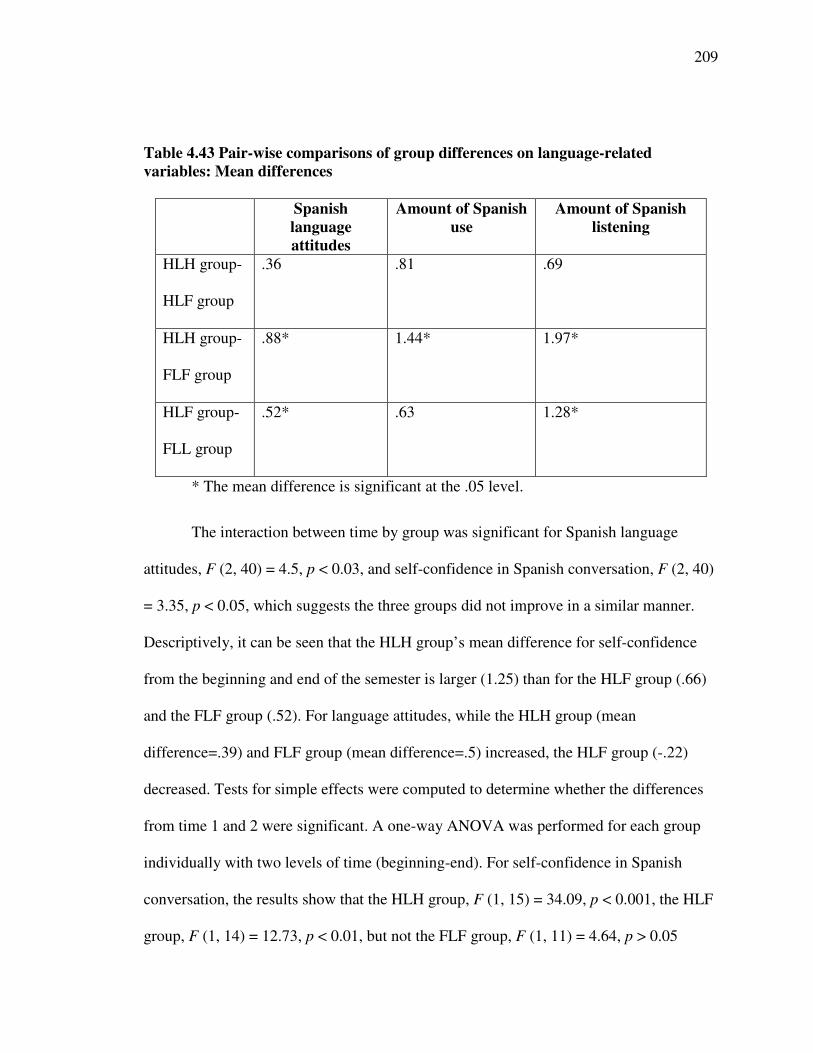
209
Table 4.43 Pair-wise comparisons of group differences on language-relatedvariables: Mean differences
Spanishlanguageattitudes
Amount of Spanishuse
Amount of Spanishlistening
HLH group-
HLF group
.36 .81 .69
HLH group-
FLF group
.88* 1.44* 1.97*
HLF group-
FLL group
.52* .63 1.28*
* The mean difference is significant at the .05 level.
The interaction between time by group was significant for Spanish language
attitudes, F (2, 40) = 4.5, p < 0.03, and self-confidence in Spanish conversation, F (2, 40)
= 3.35, p < 0.05, which suggests the three groups did not improve in a similar manner.
Descriptively, it can be seen that the HLH group’s mean difference for self-confidence
from the beginning and end of the semester is larger (1.25) than for the HLF group (.66)
and the FLF group (.52). For language attitudes, while the HLH group (mean
difference=.39) and FLF group (mean difference=.5) increased, the HLF group (-.22)
decreased. Tests for simple effects were computed to determine whether the differences
from time 1 and 2 were significant. A one-way ANOVA was performed for each group
individually with two levels of time (beginning-end). For self-confidence in Spanish
conversation, the results show that the HLH group, F (1, 15) = 34.09, p < 0.001, the HLF
group, F (1, 14) = 12.73, p < 0.01, but not the FLF group, F (1, 11) = 4.64, p > 0.05
210
improved significantly from the beginning to the end of the semester. However, the HLH
group (mean difference=1.25) improved more than the HLF group (mean
difference=.66). For Spanish language attitudes, the results show that the HLH group, F
(1, 15) = 11.79, p < 0.01 is the only one who improved significantly from the beginning
to end of the semester. The HLF group, F (1, 14) = 1.27, p > 0.05 and the FLF group, F
(1, 11) = 4.12, p > 0.05 did not change significantly.
Summary of Findings for Research Question 2.b
� Differences among the groups with regard to language-related variables,
such as Spanish language attitudes, amount of Spanish use, amount of Spanish listening,
self-confidence, and self-evaluation of language competencies, were also examined. All
groups improved their Spanish language attitudes, self-confidence, and self-evaluation by
the end of the semester. The HLH group is the only group that achieved significant gains
in their Spanish language attitudes and was also the group with the most positive attitude
towards Spanish. As to self-confidence, the HLH group made the highest improvement,
followed by the HLF group. The FLF group did not have any significant changes. All
groups had similar increases in their self-evaluation of Spanish competencies. There were
no major changes in the learners’ amount of Spanish language use and listening habits.
All students reported a modest positive change in their efforts to participate in or listen to
Spanish conversations, to read and interact with family members. The FLF group,
however, had the lowest improvement. Finally, the students’ perception at the end of the
211
semester for both HL groups is that they increased their Spanish use in a good amount
while the FL group changed its use slightly.
Research Question 3
What are some of the language differences between the groups of HL and FL
learners?
The major differences these two groups have shown in the measures obtained for
this study were in listening comprehension and oral production. Both groups of HL
learners scored significantly higher in the listening comprehension exam than FL learners
despite the fact that the exam is not especially designed for HL learners (see table 4.14).
In oral production, the HL group showed significant differences with the FL group in
three fluency indicators (T-units, MLT-unit, and speech rate). While the FL group
produced on average 12 T-units, the HL groups produced 19 T-units. For the MLT-unit,
the FL group produced T-units with an average length of 5.44, a significantly lower
number than the HL groups who produced T-units with a length of 7.06. Likewise, the
speech rate of FL learners was 26.32 while the FL groups produced 37.31 words per
minute.
For complexity, both HL groups produced more complex T-units, although only
one of the HL groups had significant differences with the FL group in both measures. The
depth of clause mean for the HL groups was 1.15 while the FL group had a mean of 1.09.
Accuracy is the indicator where the three groups had the least number of differences.
“Ser” is the only indicator that produced differences. While both HL groups produced
212
more accurate output (M=78.68 and M=79.25), only the HLF group (79.25) showed
significant differences with the FLF group (M=66.74) in the use of “ser”.
In written production, differences among groups are not major. For reliance on
English words the HLF group (M=7.73) produced significantly fewer words that the FL
group (13.03). For task 2, both groups of HL learners (M=10.73, M=5.52) relied
considerably less on English words than the FL group (M=19.33). For complexity, the
HL learners in the HLH group produced significantly more complex output than the FL
group while having no significant differences with the second HL group. The HLH group
also produced significantly more complex tense/aspect use than the FL group but had no
differences with the second HL group. For accuracy, the FLF group (M=92.81%) showed
significantly more accuracy in subject verb agreement than the HLH group (M=80.62%)
and there were no differences with the HLF group (M=86.38%).
An additional measure that was analyzed to answer this question is related to the
learners’ degree of non-native accent. It was hypothesized that the HL group would have
a higher degree of native-like pronunciation than the FL group because of their early
exposure to Spanish. To test this hypothesis, 40/45” segments were obtained from the
learners’ first oral task (personal narrative). Utterances that were complete, with no or
only one English word were selected for this segment. Utterances with major mistakes
were excluded to prevent non-target forms from influencing the raters’ judgments. Pauses
were also eliminated to leave only the students’ words. Six raters evaluated the samples
for the degree of accentedness using a 5-point Likert scale that ranged from 5 (no accent-
definitely native-like) to 1 (strong accent-definitely non-native-like). The raters invited to
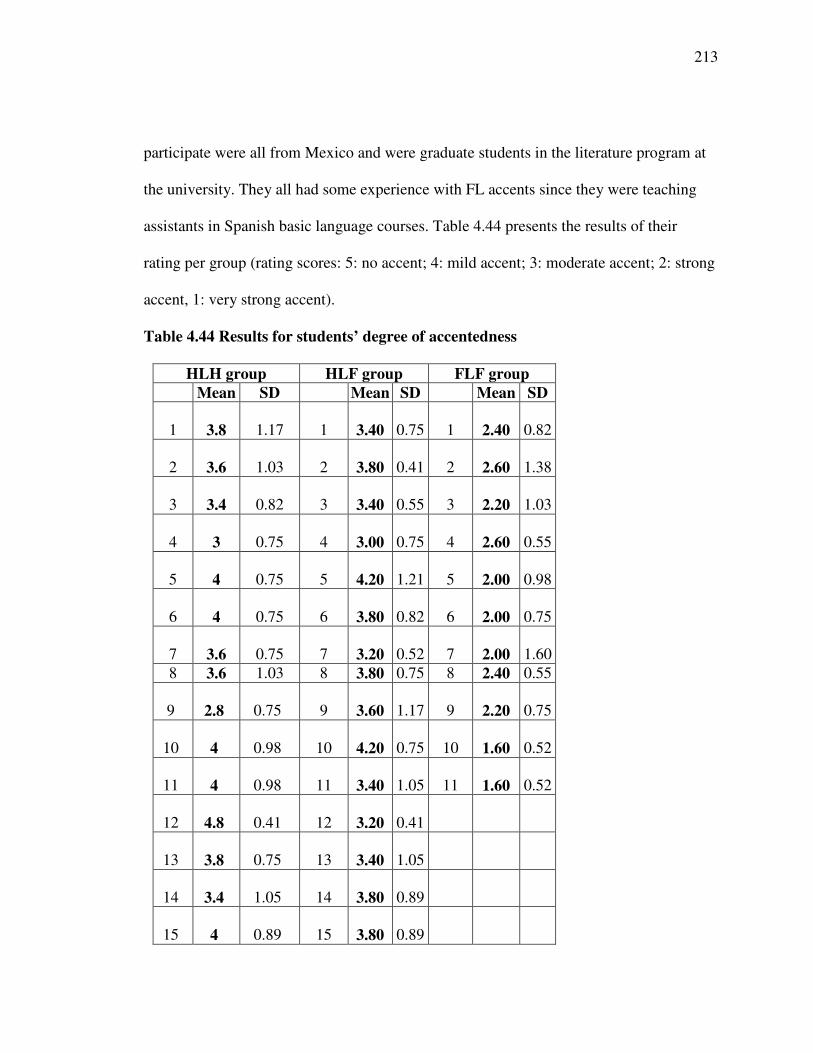
213
participate were all from Mexico and were graduate students in the literature program at
the university. They all had some experience with FL accents since they were teaching
assistants in Spanish basic language courses. Table 4.44 presents the results of their
rating per group (rating scores: 5: no accent; 4: mild accent; 3: moderate accent; 2: strong
accent, 1: very strong accent).
Table 4.44 Results for students’ degree of accentedness
HLH group HLF group FLF groupMean SD Mean SD Mean SD
1 3.8 1.17 1 3.40 0.75 1 2.40 0.82
2 3.6 1.03 2 3.80 0.41 2 2.60 1.38
3 3.4 0.82 3 3.40 0.55 3 2.20 1.03
4 3 0.75 4 3.00 0.75 4 2.60 0.55
5 4 0.75 5 4.20 1.21 5 2.00 0.98
6 4 0.75 6 3.80 0.82 6 2.00 0.75
7 3.6 0.75 7 3.20 0.52 7 2.00 1.608 3.6 1.03 8 3.80 0.75 8 2.40 0.55
9 2.8 0.75 9 3.60 1.17 9 2.20 0.75
10 4 0.98 10 4.20 0.75 10 1.60 0.52
11 4 0.98 11 3.40 1.05 11 1.60 0.52
12 4.8 0.41 12 3.20 0.41
13 3.8 0.75 13 3.40 1.05
14 3.4 1.05 14 3.80 0.89
15 4 0.89 15 3.80 0.89
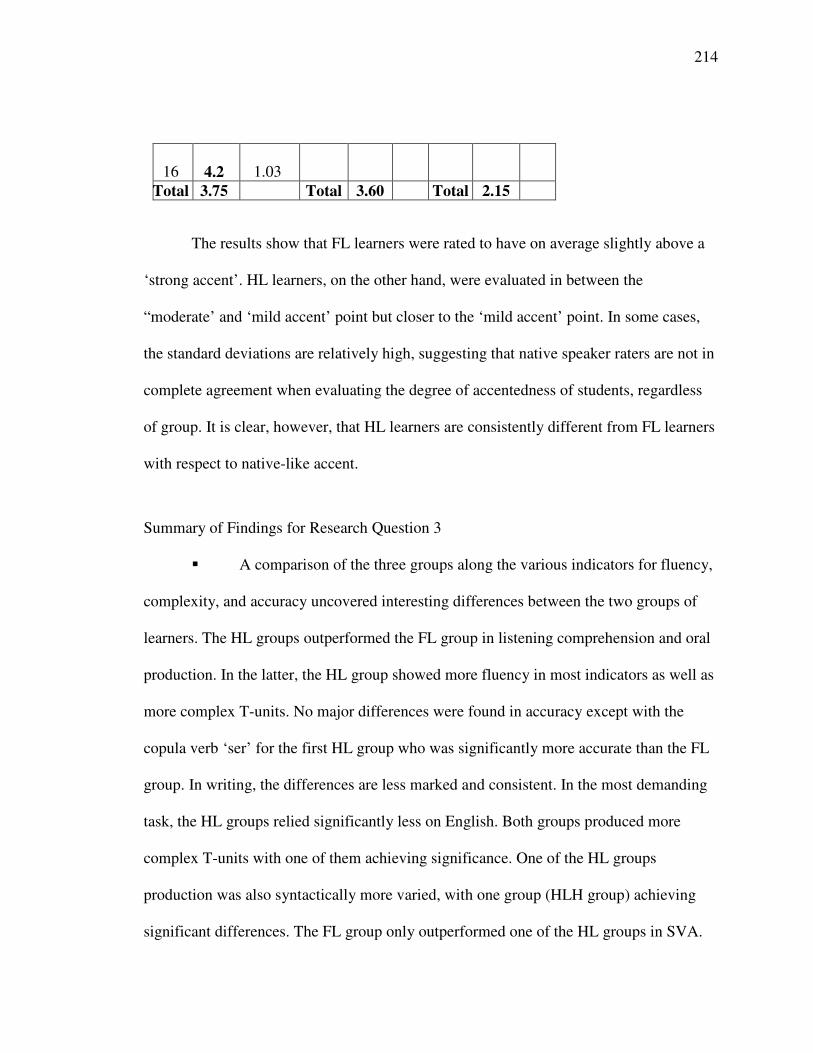
214
16 4.2 1.03Total 3.75 Total 3.60 Total 2.15
The results show that FL learners were rated to have on average slightly above a
‘strong accent’. HL learners, on the other hand, were evaluated in between the
“moderate’ and ‘mild accent’ point but closer to the ‘mild accent’ point. In some cases,
the standard deviations are relatively high, suggesting that native speaker raters are not in
complete agreement when evaluating the degree of accentedness of students, regardless
of group. It is clear, however, that HL learners are consistently different from FL learners
with respect to native-like accent.
Summary of Findings for Research Question 3
� A comparison of the three groups along the various indicators for fluency,
complexity, and accuracy uncovered interesting differences between the two groups of
learners. The HL groups outperformed the FL group in listening comprehension and oral
production. In the latter, the HL group showed more fluency in most indicators as well as
more complex T-units. No major differences were found in accuracy except with the
copula verb ‘ser’ for the first HL group who was significantly more accurate than the FL
group. In writing, the differences are less marked and consistent. In the most demanding
task, the HL groups relied significantly less on English. Both groups produced more
complex T-units with one of them achieving significance. One of the HL groups
production was also syntactically more varied, with one group (HLH group) achieving
significant differences. The FL group only outperformed one of the HL groups in SVA.
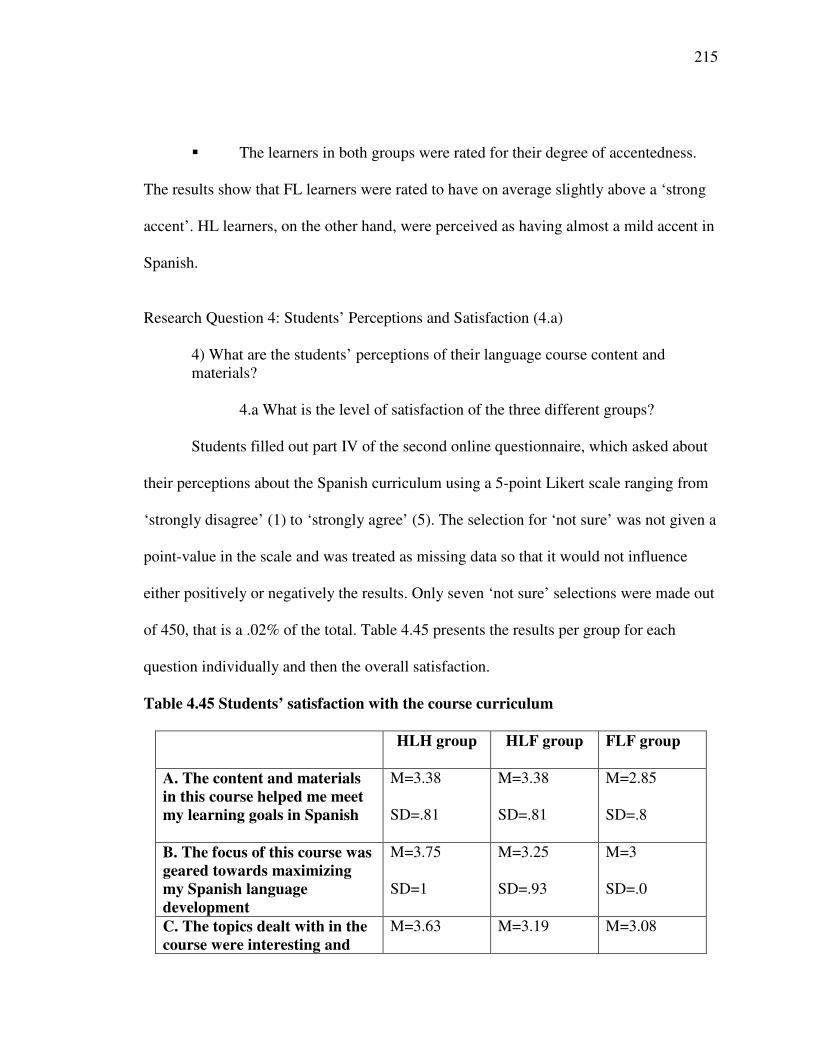
215
� The learners in both groups were rated for their degree of accentedness.
The results show that FL learners were rated to have on average slightly above a ‘strong
accent’. HL learners, on the other hand, were perceived as having almost a mild accent in
Spanish.
Research Question 4: Students’ Perceptions and Satisfaction (4.a)
4) What are the students’ perceptions of their language course content andmaterials?
4.a What is the level of satisfaction of the three different groups?
Students filled out part IV of the second online questionnaire, which asked about
their perceptions about the Spanish curriculum using a 5-point Likert scale ranging from
‘strongly disagree’ (1) to ‘strongly agree’ (5). The selection for ‘not sure’ was not given a
point-value in the scale and was treated as missing data so that it would not influence
either positively or negatively the results. Only seven ‘not sure’ selections were made out
of 450, that is a .02% of the total. Table 4.45 presents the results per group for each
question individually and then the overall satisfaction.
Table 4.45 Students’ satisfaction with the course curriculum
HLH group HLF group FLF group
A. The content and materialsin this course helped me meetmy learning goals in Spanish
M=3.38
SD=.81
M=3.38
SD=.81
M=2.85
SD=.8
B. The focus of this course wasgeared towards maximizingmy Spanish languagedevelopment
M=3.75
SD=1
M=3.25
SD=.93
M=3
SD=.0
C. The topics dealt with in thecourse were interesting and
M=3.63 M=3.19 M=3.08
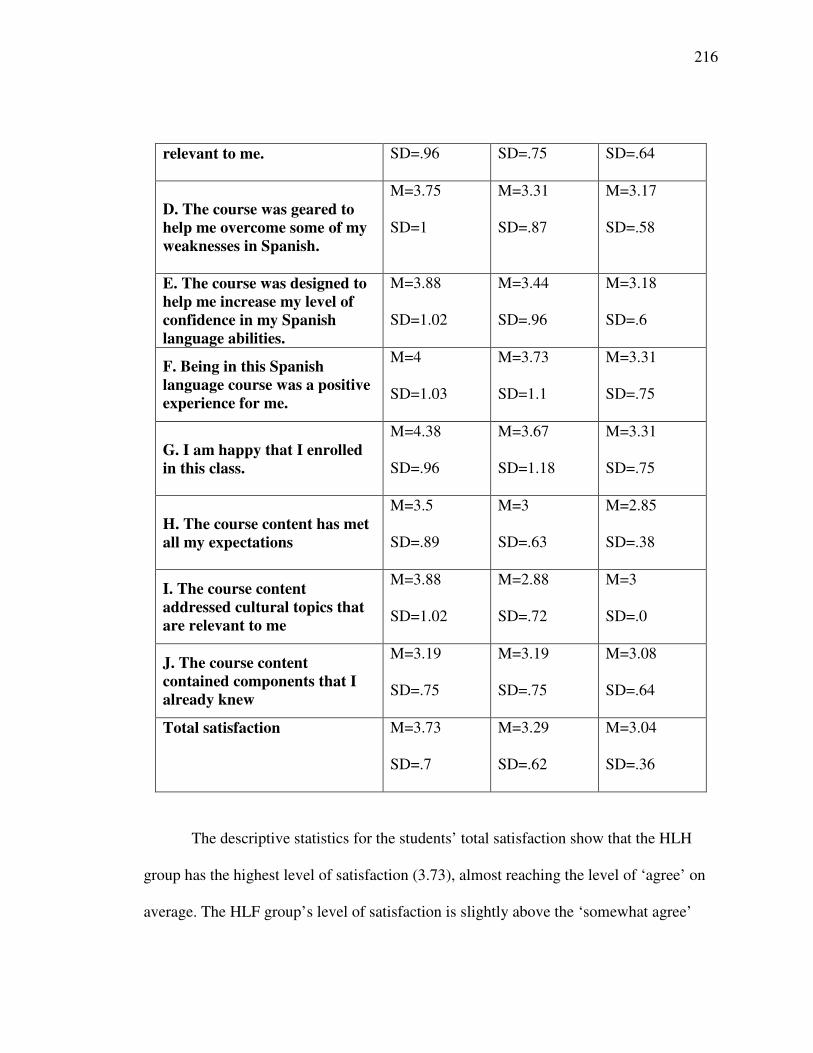
216
relevant to me. SD=.96 SD=.75 SD=.64
D. The course was geared tohelp me overcome some of myweaknesses in Spanish.
M=3.75
SD=1
M=3.31
SD=.87
M=3.17
SD=.58
E. The course was designed tohelp me increase my level ofconfidence in my Spanishlanguage abilities.
M=3.88
SD=1.02
M=3.44
SD=.96
M=3.18
SD=.6
F. Being in this Spanishlanguage course was a positiveexperience for me.
M=4
SD=1.03
M=3.73
SD=1.1
M=3.31
SD=.75
G. I am happy that I enrolledin this class.
M=4.38
SD=.96
M=3.67
SD=1.18
M=3.31
SD=.75
H. The course content has metall my expectations
M=3.5
SD=.89
M=3
SD=.63
M=2.85
SD=.38
I. The course contentaddressed cultural topics thatare relevant to me
M=3.88
SD=1.02
M=2.88
SD=.72
M=3
SD=.0
J. The course contentcontained components that Ialready knew
M=3.19
SD=.75
M=3.19
SD=.75
M=3.08
SD=.64
Total satisfaction M=3.73
SD=.7
M=3.29
SD=.62
M=3.04
SD=.36
The descriptive statistics for the students’ total satisfaction show that the HLH
group has the highest level of satisfaction (3.73), almost reaching the level of ‘agree’ on
average. The HLF group’s level of satisfaction is slightly above the ‘somewhat agree’
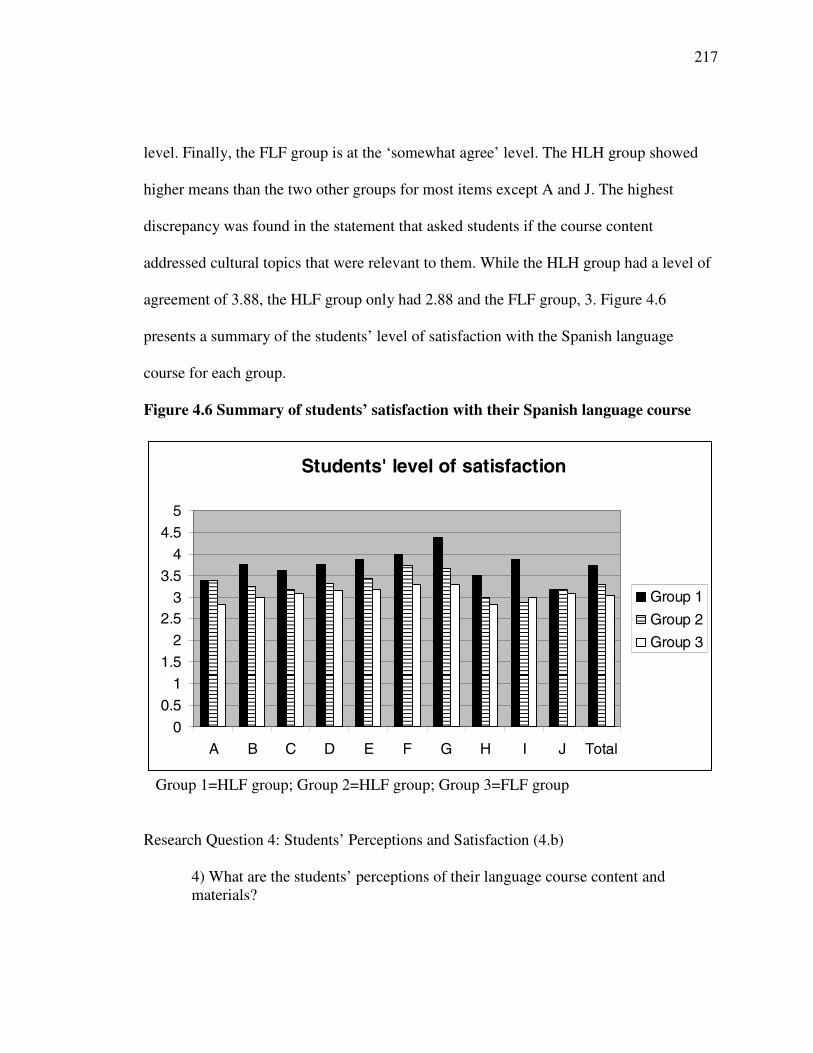
217
level. Finally, the FLF group is at the ‘somewhat agree’ level. The HLH group showed
higher means than the two other groups for most items except A and J. The highest
discrepancy was found in the statement that asked students if the course content
addressed cultural topics that were relevant to them. While the HLH group had a level of
agreement of 3.88, the HLF group only had 2.88 and the FLF group, 3. Figure 4.6
presents a summary of the students’ level of satisfaction with the Spanish language
course for each group.
Figure 4.6 Summary of students’ satisfaction with their Spanish language course
Students' level of satisfaction
0
0.51
1.52
2.53
3.54
4.55
A B C D E F G H I J Total
Group 1
Group 2
Group 3
Group 1=HLF group; Group 2=HLF group; Group 3=FLF group
Research Question 4: Students’ Perceptions and Satisfaction (4.b)
4) What are the students’ perceptions of their language course content andmaterials?
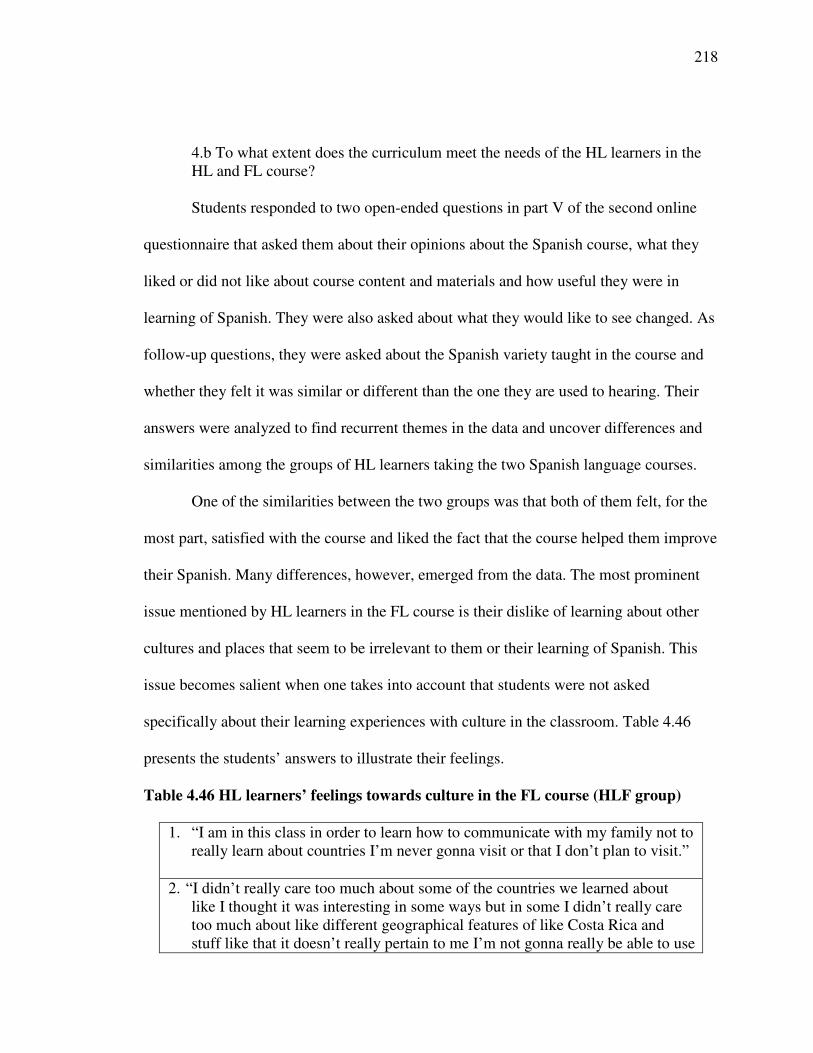
218
4.b To what extent does the curriculum meet the needs of the HL learners in theHL and FL course?
Students responded to two open-ended questions in part V of the second online
questionnaire that asked them about their opinions about the Spanish course, what they
liked or did not like about course content and materials and how useful they were in
learning of Spanish. They were also asked about what they would like to see changed. As
follow-up questions, they were asked about the Spanish variety taught in the course and
whether they felt it was similar or different than the one they are used to hearing. Their
answers were analyzed to find recurrent themes in the data and uncover differences and
similarities among the groups of HL learners taking the two Spanish language courses.
One of the similarities between the two groups was that both of them felt, for the
most part, satisfied with the course and liked the fact that the course helped them improve
their Spanish. Many differences, however, emerged from the data. The most prominent
issue mentioned by HL learners in the FL course is their dislike of learning about other
cultures and places that seem to be irrelevant to them or their learning of Spanish. This
issue becomes salient when one takes into account that students were not asked
specifically about their learning experiences with culture in the classroom. Table 4.46
presents the students’ answers to illustrate their feelings.
Table 4.46 HL learners’ feelings towards culture in the FL course (HLF group)
1. “I am in this class in order to learn how to communicate with my family not toreally learn about countries I’m never gonna visit or that I don’t plan to visit.”
2. “I didn’t really care too much about some of the countries we learned aboutlike I thought it was interesting in some ways but in some I didn’t really caretoo much about like different geographical features of like Costa Rica andstuff like that it doesn’t really pertain to me I’m not gonna really be able to use
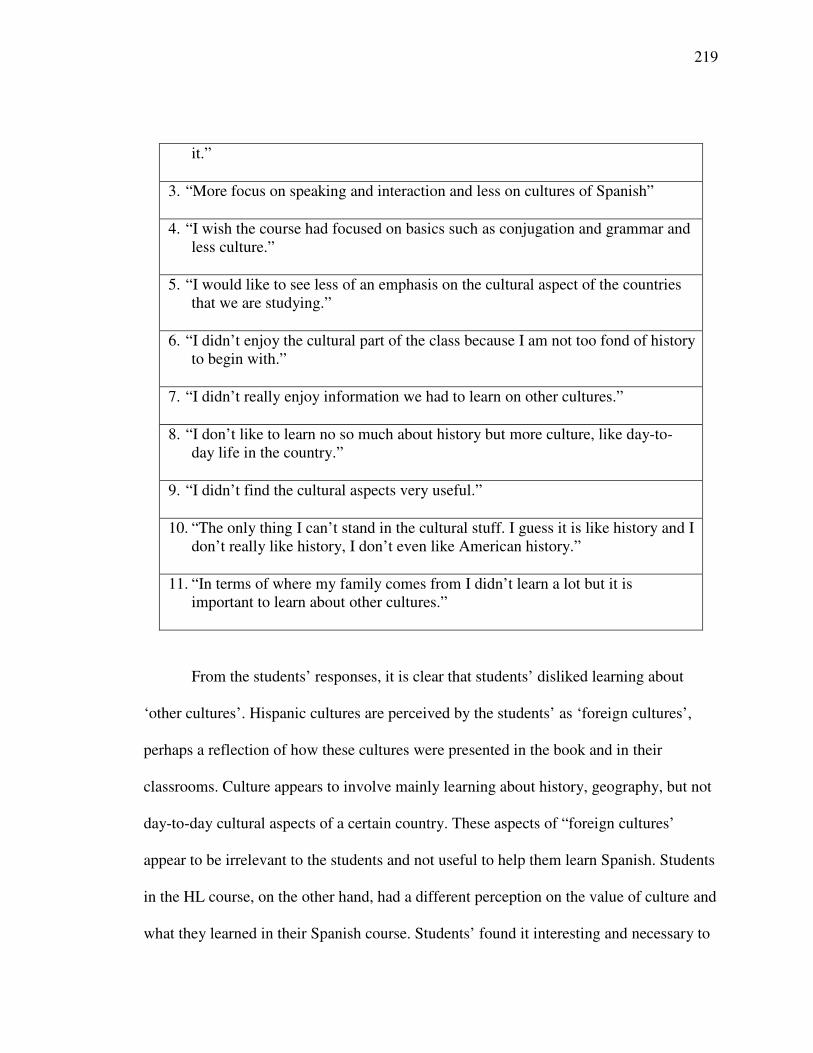
219
it.”
3. “More focus on speaking and interaction and less on cultures of Spanish”
4. “I wish the course had focused on basics such as conjugation and grammar andless culture.”
5. “I would like to see less of an emphasis on the cultural aspect of the countriesthat we are studying.”
6. “I didn’t enjoy the cultural part of the class because I am not too fond of historyto begin with.”
7. “I didn’t really enjoy information we had to learn on other cultures.”
8. “I don’t like to learn no so much about history but more culture, like day-to-day life in the country.”
9. “I didn’t find the cultural aspects very useful.”
10. “The only thing I can’t stand in the cultural stuff. I guess it is like history and Idon’t really like history, I don’t even like American history.”
11. “In terms of where my family comes from I didn’t learn a lot but it isimportant to learn about other cultures.”
From the students’ responses, it is clear that students’ disliked learning about
‘other cultures’. Hispanic cultures are perceived by the students’ as ‘foreign cultures’,
perhaps a reflection of how these cultures were presented in the book and in their
classrooms. Culture appears to involve mainly learning about history, geography, but not
day-to-day cultural aspects of a certain country. These aspects of “foreign cultures’
appear to be irrelevant to the students and not useful to help them learn Spanish. Students
in the HL course, on the other hand, had a different perception on the value of culture and
what they learned in their Spanish course. Students’ found it interesting and necessary to
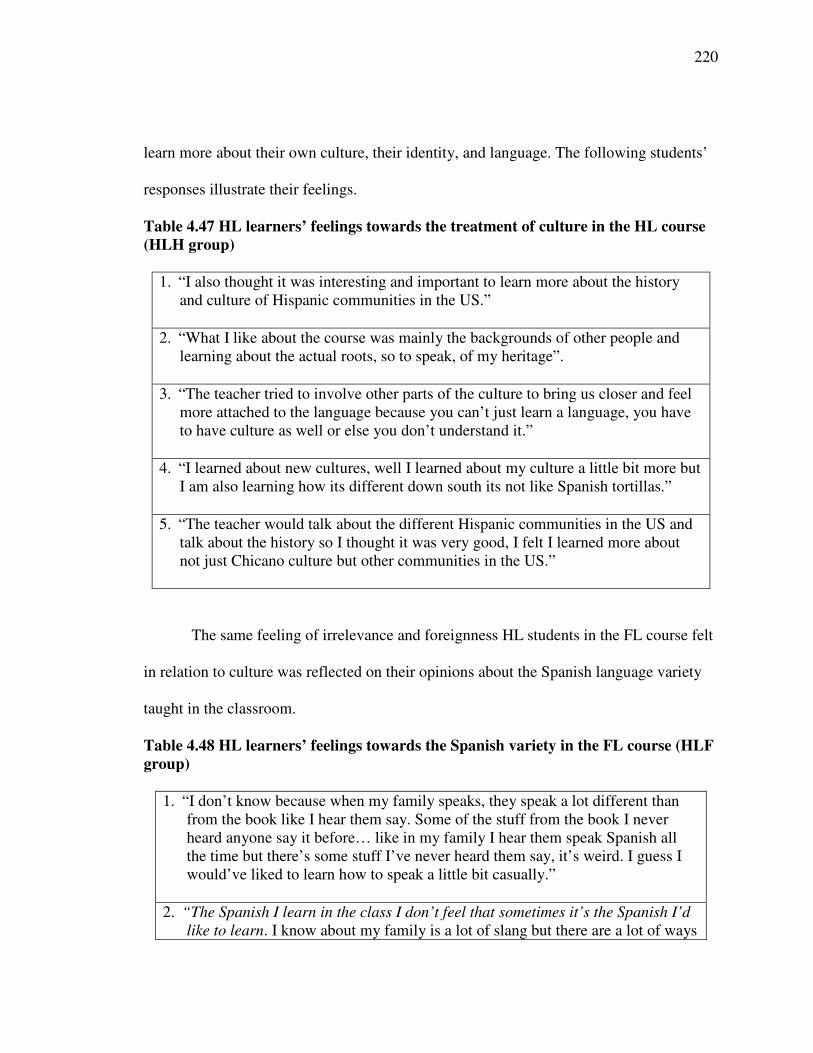
220
learn more about their own culture, their identity, and language. The following students’
responses illustrate their feelings.
Table 4.47 HL learners’ feelings towards the treatment of culture in the HL course(HLH group)
1. “I also thought it was interesting and important to learn more about the historyand culture of Hispanic communities in the US.”
2. “What I like about the course was mainly the backgrounds of other people andlearning about the actual roots, so to speak, of my heritage”.
3. “The teacher tried to involve other parts of the culture to bring us closer and feelmore attached to the language because you can’t just learn a language, you haveto have culture as well or else you don’t understand it.”
4. “I learned about new cultures, well I learned about my culture a little bit more butI am also learning how its different down south its not like Spanish tortillas.”
5. “The teacher would talk about the different Hispanic communities in the US andtalk about the history so I thought it was very good, I felt I learned more aboutnot just Chicano culture but other communities in the US.”
The same feeling of irrelevance and foreignness HL students in the FL course felt
in relation to culture was reflected on their opinions about the Spanish language variety
taught in the classroom.
Table 4.48 HL learners’ feelings towards the Spanish variety in the FL course (HLFgroup)
1. “I don’t know because when my family speaks, they speak a lot different thanfrom the book like I hear them say. Some of the stuff from the book I neverheard anyone say it before… like in my family I hear them speak Spanish allthe time but there’s some stuff I’ve never heard them say, it’s weird. I guess Iwould’ve liked to learn how to speak a little bit casually.”
2. “The Spanish I learn in the class I don’t feel that sometimes it’s the Spanish I’dlike to learn. I know about my family is a lot of slang but there are a lot of ways
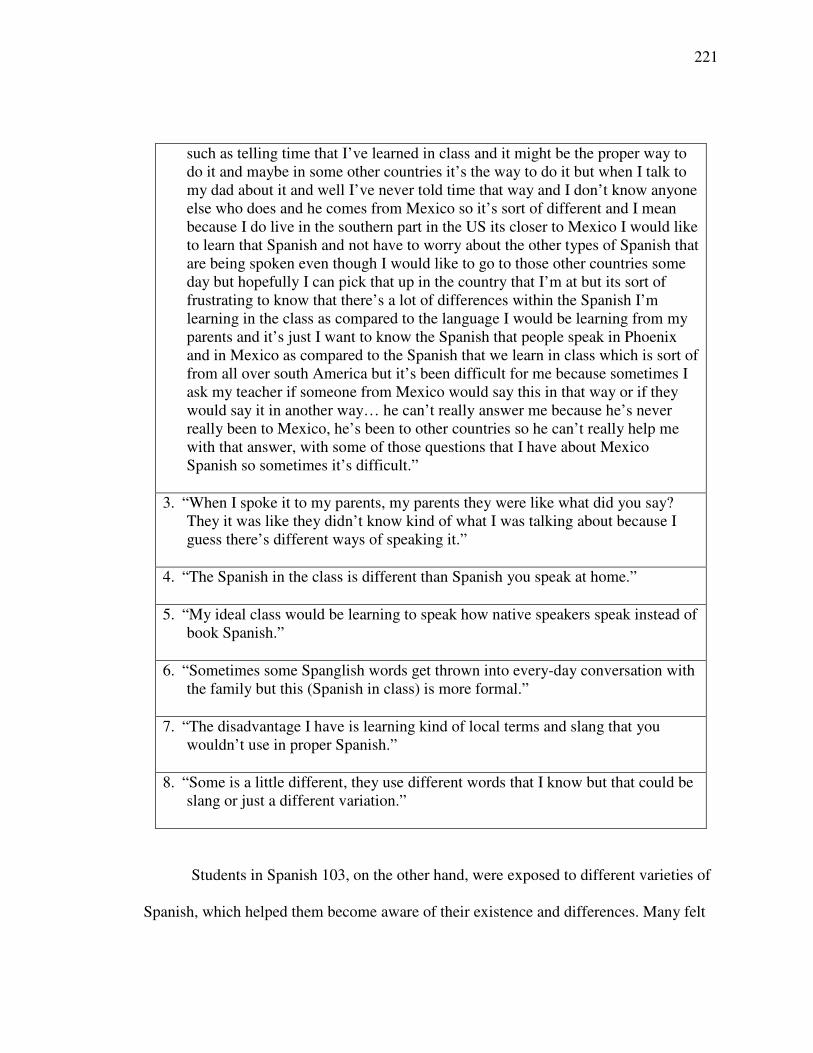
221
such as telling time that I’ve learned in class and it might be the proper way todo it and maybe in some other countries it’s the way to do it but when I talk tomy dad about it and well I’ve never told time that way and I don’t know anyoneelse who does and he comes from Mexico so it’s sort of different and I meanbecause I do live in the southern part in the US its closer to Mexico I would liketo learn that Spanish and not have to worry about the other types of Spanish thatare being spoken even though I would like to go to those other countries someday but hopefully I can pick that up in the country that I’m at but its sort offrustrating to know that there’s a lot of differences within the Spanish I’mlearning in the class as compared to the language I would be learning from myparents and it’s just I want to know the Spanish that people speak in Phoenixand in Mexico as compared to the Spanish that we learn in class which is sort offrom all over south America but it’s been difficult for me because sometimes Iask my teacher if someone from Mexico would say this in that way or if theywould say it in another way… he can’t really answer me because he’s neverreally been to Mexico, he’s been to other countries so he can’t really help mewith that answer, with some of those questions that I have about MexicoSpanish so sometimes it’s difficult.”
3. “When I spoke it to my parents, my parents they were like what did you say?They it was like they didn’t know kind of what I was talking about because Iguess there’s different ways of speaking it.”
4. “The Spanish in the class is different than Spanish you speak at home.”
5. “My ideal class would be learning to speak how native speakers speak instead ofbook Spanish.”
6. “Sometimes some Spanglish words get thrown into every-day conversation withthe family but this (Spanish in class) is more formal.”
7. “The disadvantage I have is learning kind of local terms and slang that youwouldn’t use in proper Spanish.”
8. “Some is a little different, they use different words that I know but that could beslang or just a different variation.”
Students in Spanish 103, on the other hand, were exposed to different varieties of
Spanish, which helped them become aware of their existence and differences. Many felt
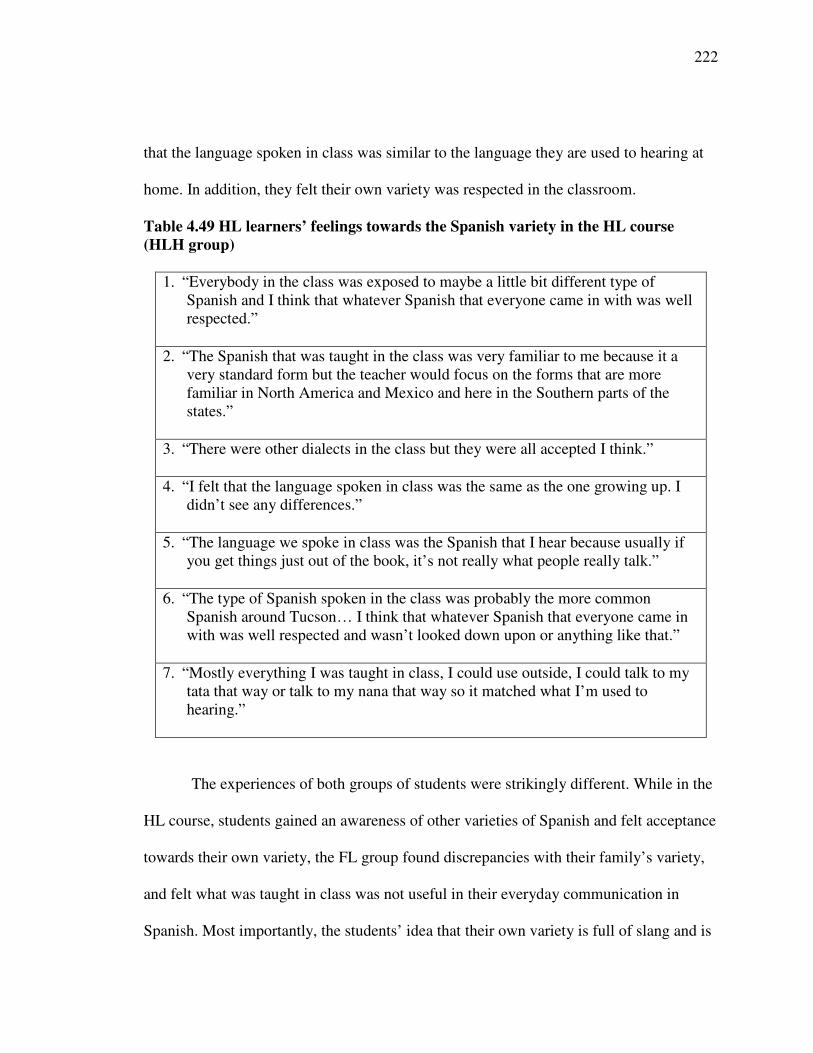
222
that the language spoken in class was similar to the language they are used to hearing at
home. In addition, they felt their own variety was respected in the classroom.
Table 4.49 HL learners’ feelings towards the Spanish variety in the HL course(HLH group)
1. “Everybody in the class was exposed to maybe a little bit different type ofSpanish and I think that whatever Spanish that everyone came in with was wellrespected.”
2. “The Spanish that was taught in the class was very familiar to me because it avery standard form but the teacher would focus on the forms that are morefamiliar in North America and Mexico and here in the Southern parts of thestates.”
3. “There were other dialects in the class but they were all accepted I think.”
4. “I felt that the language spoken in class was the same as the one growing up. Ididn’t see any differences.”
5. “The language we spoke in class was the Spanish that I hear because usually ifyou get things just out of the book, it’s not really what people really talk.”
6. “The type of Spanish spoken in the class was probably the more commonSpanish around Tucson… I think that whatever Spanish that everyone came inwith was well respected and wasn’t looked down upon or anything like that.”
7. “Mostly everything I was taught in class, I could use outside, I could talk to mytata that way or talk to my nana that way so it matched what I’m used tohearing.”
The experiences of both groups of students were strikingly different. While in the
HL course, students gained an awareness of other varieties of Spanish and felt acceptance
towards their own variety, the FL group found discrepancies with their family’s variety,
and felt what was taught in class was not useful in their everyday communication in
Spanish. Most importantly, the students’ idea that their own variety is full of slang and is
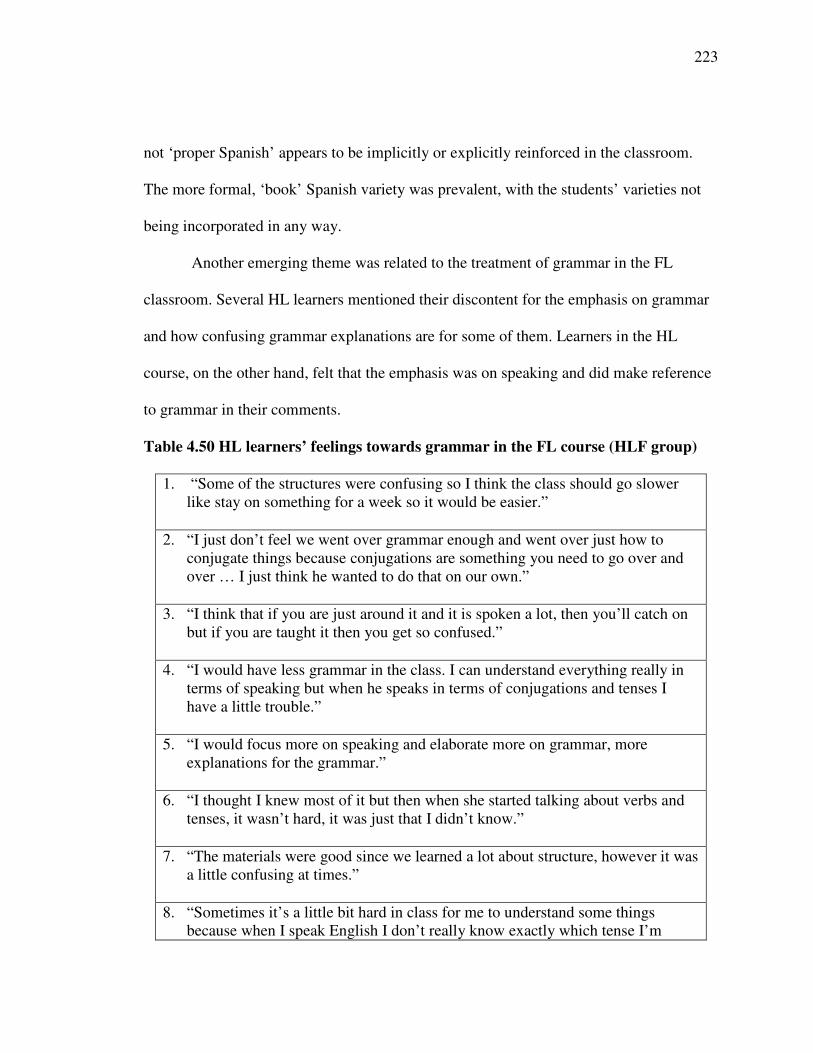
223
not ‘proper Spanish’ appears to be implicitly or explicitly reinforced in the classroom.
The more formal, ‘book’ Spanish variety was prevalent, with the students’ varieties not
being incorporated in any way.
Another emerging theme was related to the treatment of grammar in the FL
classroom. Several HL learners mentioned their discontent for the emphasis on grammar
and how confusing grammar explanations are for some of them. Learners in the HL
course, on the other hand, felt that the emphasis was on speaking and did make reference
to grammar in their comments.
Table 4.50 HL learners’ feelings towards grammar in the FL course (HLF group)
1. “Some of the structures were confusing so I think the class should go slowerlike stay on something for a week so it would be easier.”
2. “I just don’t feel we went over grammar enough and went over just how toconjugate things because conjugations are something you need to go over andover … I just think he wanted to do that on our own.”
3. “I think that if you are just around it and it is spoken a lot, then you’ll catch onbut if you are taught it then you get so confused.”
4. “I would have less grammar in the class. I can understand everything really interms of speaking but when he speaks in terms of conjugations and tenses Ihave a little trouble.”
5. “I would focus more on speaking and elaborate more on grammar, moreexplanations for the grammar.”
6. “I thought I knew most of it but then when she started talking about verbs andtenses, it wasn’t hard, it was just that I didn’t know.”
7. “The materials were good since we learned a lot about structure, however it wasa little confusing at times.”
8. “Sometimes it’s a little bit hard in class for me to understand some thingsbecause when I speak English I don’t really know exactly which tense I’m
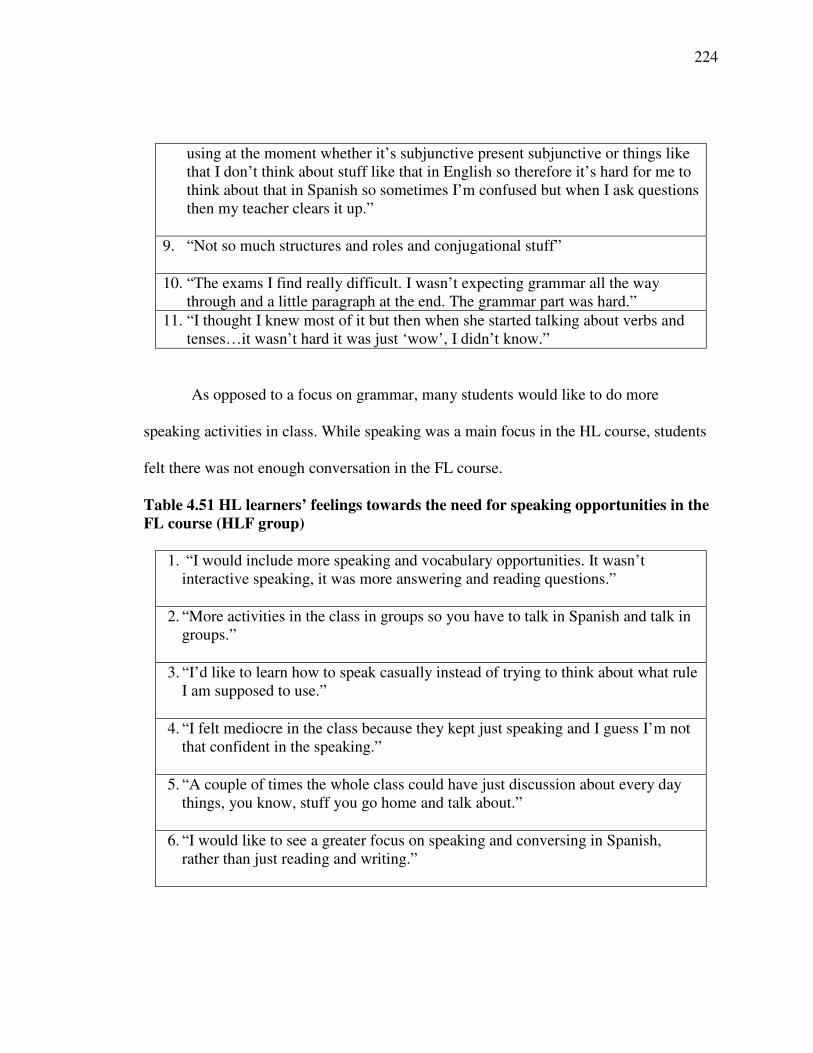
224
using at the moment whether it’s subjunctive present subjunctive or things likethat I don’t think about stuff like that in English so therefore it’s hard for me tothink about that in Spanish so sometimes I’m confused but when I ask questionsthen my teacher clears it up.”
9. “Not so much structures and roles and conjugational stuff”
10. “The exams I find really difficult. I wasn’t expecting grammar all the waythrough and a little paragraph at the end. The grammar part was hard.”
11. “I thought I knew most of it but then when she started talking about verbs andtenses…it wasn’t hard it was just ‘wow’, I didn’t know.”
As opposed to a focus on grammar, many students would like to do more
speaking activities in class. While speaking was a main focus in the HL course, students
felt there was not enough conversation in the FL course.
Table 4.51 HL learners’ feelings towards the need for speaking opportunities in theFL course (HLF group)
1. “I would include more speaking and vocabulary opportunities. It wasn’tinteractive speaking, it was more answering and reading questions.”
2. “More activities in the class in groups so you have to talk in Spanish and talk ingroups.”
3. “I’d like to learn how to speak casually instead of trying to think about what ruleI am supposed to use.”
4. “I felt mediocre in the class because they kept just speaking and I guess I’m notthat confident in the speaking.”
5. “A couple of times the whole class could have just discussion about every daythings, you know, stuff you go home and talk about.”
6. “I would like to see a greater focus on speaking and conversing in Spanish,rather than just reading and writing.”
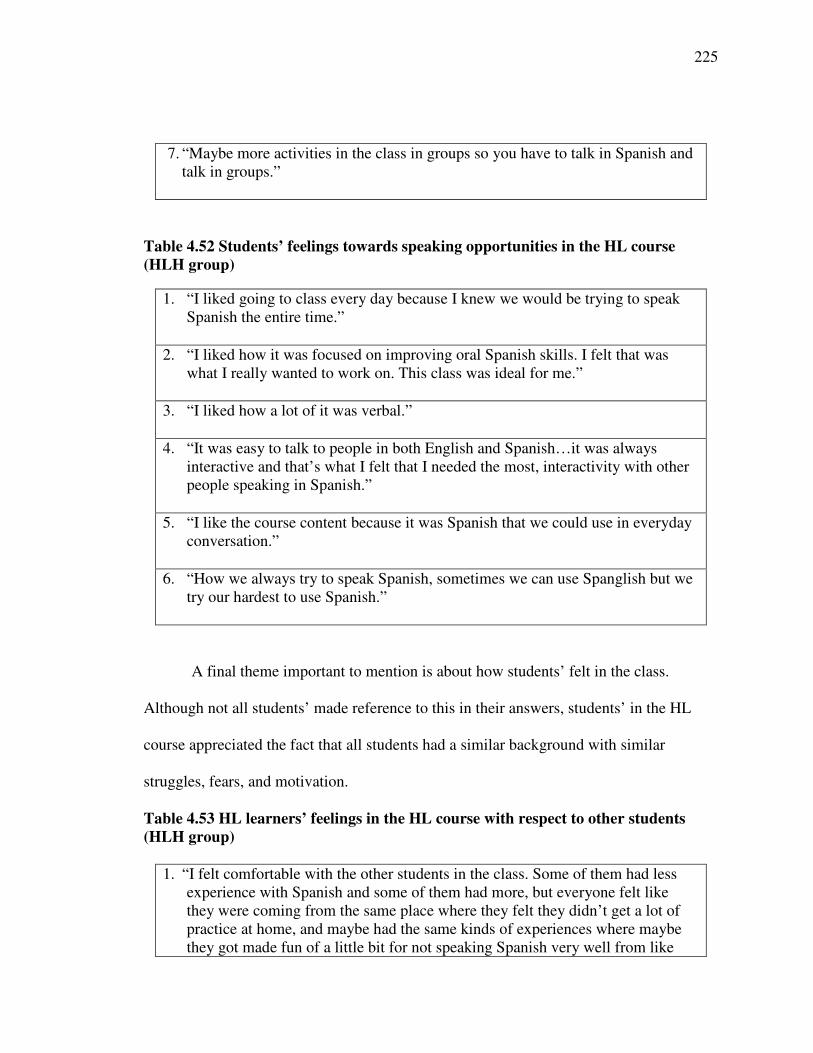
225
7. “Maybe more activities in the class in groups so you have to talk in Spanish andtalk in groups.”
Table 4.52 Students’ feelings towards speaking opportunities in the HL course(HLH group)
1. “I liked going to class every day because I knew we would be trying to speakSpanish the entire time.”
2. “I liked how it was focused on improving oral Spanish skills. I felt that waswhat I really wanted to work on. This class was ideal for me.”
3. “I liked how a lot of it was verbal.”
4. “It was easy to talk to people in both English and Spanish…it was alwaysinteractive and that’s what I felt that I needed the most, interactivity with otherpeople speaking in Spanish.”
5. “I like the course content because it was Spanish that we could use in everydayconversation.”
6. “How we always try to speak Spanish, sometimes we can use Spanglish but wetry our hardest to use Spanish.”
A final theme important to mention is about how students’ felt in the class.
Although not all students’ made reference to this in their answers, students’ in the HL
course appreciated the fact that all students had a similar background with similar
struggles, fears, and motivation.
Table 4.53 HL learners’ feelings in the HL course with respect to other students(HLH group)
1. “I felt comfortable with the other students in the class. Some of them had lessexperience with Spanish and some of them had more, but everyone felt likethey were coming from the same place where they felt they didn’t get a lot ofpractice at home, and maybe had the same kinds of experiences where maybethey got made fun of a little bit for not speaking Spanish very well from like
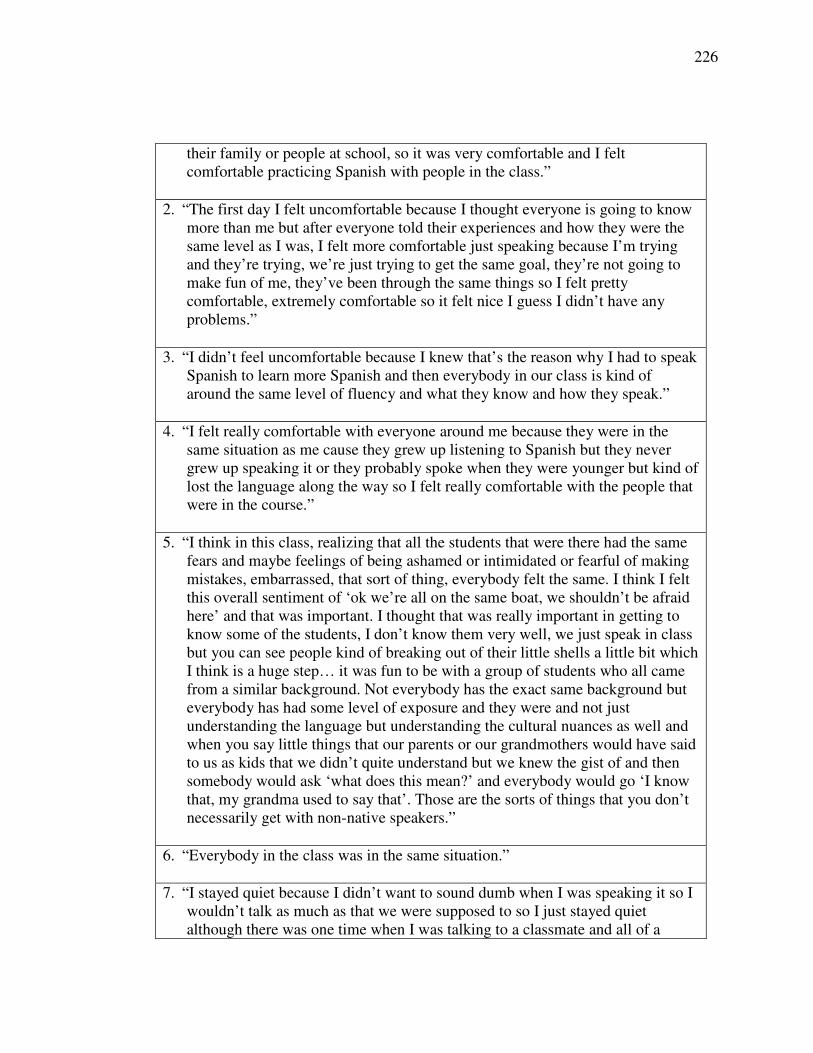
226
their family or people at school, so it was very comfortable and I feltcomfortable practicing Spanish with people in the class.”
2. “The first day I felt uncomfortable because I thought everyone is going to knowmore than me but after everyone told their experiences and how they were thesame level as I was, I felt more comfortable just speaking because I’m tryingand they’re trying, we’re just trying to get the same goal, they’re not going tomake fun of me, they’ve been through the same things so I felt prettycomfortable, extremely comfortable so it felt nice I guess I didn’t have anyproblems.”
3. “I didn’t feel uncomfortable because I knew that’s the reason why I had to speakSpanish to learn more Spanish and then everybody in our class is kind ofaround the same level of fluency and what they know and how they speak.”
4. “I felt really comfortable with everyone around me because they were in thesame situation as me cause they grew up listening to Spanish but they nevergrew up speaking it or they probably spoke when they were younger but kind oflost the language along the way so I felt really comfortable with the people thatwere in the course.”
5. “I think in this class, realizing that all the students that were there had the samefears and maybe feelings of being ashamed or intimidated or fearful of makingmistakes, embarrassed, that sort of thing, everybody felt the same. I think I feltthis overall sentiment of ‘ok we’re all on the same boat, we shouldn’t be afraidhere’ and that was important. I thought that was really important in getting toknow some of the students, I don’t know them very well, we just speak in classbut you can see people kind of breaking out of their little shells a little bit whichI think is a huge step… it was fun to be with a group of students who all camefrom a similar background. Not everybody has the exact same background buteverybody has had some level of exposure and they were and not justunderstanding the language but understanding the cultural nuances as well andwhen you say little things that our parents or our grandmothers would have saidto us as kids that we didn’t quite understand but we knew the gist of and thensomebody would ask ‘what does this mean?’ and everybody would go ‘I knowthat, my grandma used to say that’. Those are the sorts of things that you don’tnecessarily get with non-native speakers.”
6. “Everybody in the class was in the same situation.”
7. “I stayed quiet because I didn’t want to sound dumb when I was speaking it so Iwouldn’t talk as much as that we were supposed to so I just stayed quietalthough there was one time when I was talking to a classmate and all of a
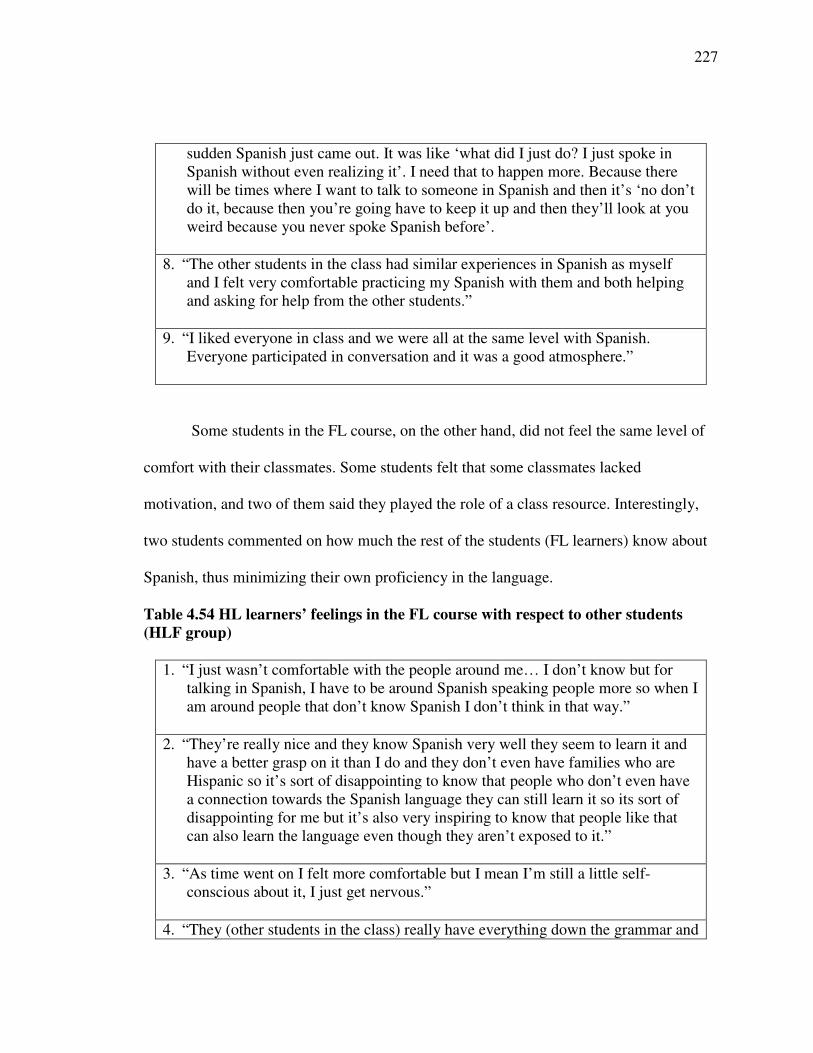
227
sudden Spanish just came out. It was like ‘what did I just do? I just spoke inSpanish without even realizing it’. I need that to happen more. Because therewill be times where I want to talk to someone in Spanish and then it’s ‘no don’tdo it, because then you’re going have to keep it up and then they’ll look at youweird because you never spoke Spanish before’.
8. “The other students in the class had similar experiences in Spanish as myselfand I felt very comfortable practicing my Spanish with them and both helpingand asking for help from the other students.”
9. “I liked everyone in class and we were all at the same level with Spanish.Everyone participated in conversation and it was a good atmosphere.”
Some students in the FL course, on the other hand, did not feel the same level of
comfort with their classmates. Some students felt that some classmates lacked
motivation, and two of them said they played the role of a class resource. Interestingly,
two students commented on how much the rest of the students (FL learners) know about
Spanish, thus minimizing their own proficiency in the language.
Table 4.54 HL learners’ feelings in the FL course with respect to other students(HLF group)
1. “I just wasn’t comfortable with the people around me… I don’t know but fortalking in Spanish, I have to be around Spanish speaking people more so when Iam around people that don’t know Spanish I don’t think in that way.”
2. “They’re really nice and they know Spanish very well they seem to learn it andhave a better grasp on it than I do and they don’t even have families who areHispanic so it’s sort of disappointing to know that people who don’t even havea connection towards the Spanish language they can still learn it so its sort ofdisappointing for me but it’s also very inspiring to know that people like thatcan also learn the language even though they aren’t exposed to it.”
3. “As time went on I felt more comfortable but I mean I’m still a little self-conscious about it, I just get nervous.”
4. “They (other students in the class) really have everything down the grammar and

228
everything so they did pretty well. There is also the disadvantage I have ofknow having a Spanish class previous and not knowing how words are speltand conjugations in Spanish.”
5. “I would have liked to have more students who were at a higher level, or hadmore confidence, or were more willing to participate on a higher level. I thinkthat a greater focus on student interaction in Spanish between each other andthe teacher, beyond reading answers, would provide a more effective learningenvironment.”
6. “Quite a few of the other students were immature and unmotivated, which wasdistracting and irritating.”
7. “My experience with the other students was fair. Many students chose not toparticipate which made it difficult. However, the atmosphere was usually agood one to learn.”
8. “I felt somewhat obligated to help some students in the class that didn'tunderstand as much as me. I liked being able to help, but sometimes it causedsome confusion. More oral conversations would have been helpful.”
9. “I didn’t really interact with the people in my class. Many times when I was ingroups I was made to do most of the work so I tried to do many of the projectsalone. I interacted more with the teacher and speaking with him in Spanish alsohelped me learn more.”
10. “Not that it mattered, but my Spanish class was predominantly consisted ofAnglos with the exception of a few Mexican Americans such as myself.Everyone was great though, I was even able to help out some of the people whowere having trouble with certain issues.”
The rest of the students in both groups mentioned that their class environment was
friendly and were able to make new friends in the class. An interesting comment from a
student who had a non-native speaker as her teacher, was: “at first I was very intimidated
because my teacher was not Mexican or of Hispanic descent as far as I could tell so it was
very intimidating when he spoke Spanish because his Spanish was very good and his
229
accent was very good as well…I felt very intimidated”. The same feeling of intimidation
was felt towards the other students in the class: Although these feelings were only
expressed by one student, the students’ feelings toward non-native Spanish speakers
should be explored further in future research.
Summary of Findings for Research Question 4
The students’ qualitative responses about the course, content, and material
showed very interesting results. HL learners in the FL course were dissatisfied with
learning about Spanish cultures in the classroom, which were seen as foreign cultures
irrelevant to their personal experiences and interests. Learners in the HL course, on the
contrary, were satisfied learning about Hispanic cultures in the US, their heritage, and
other cultures represented in the classroom. In the FL course, students felt there was too
much emphasis on grammar and felt confused by the grammar explanations. Also,
students saw discrepancies between the language they grew up hearing and the language
taught in the class. These two feelings were not experienced by HL learners in the HL
course, who felt that all varieties were respected and were taught the language they are
most familiar with. The FL course did not provide students with sufficient opportunities
to speak in Spanish while the HL course provided opportunities to speak in both English
and Spanish, while always encouraging the use of Spanish. Finally, learners in the HL
course felt comfortable and non-threatened by other students because they felt they all
had similar proficiency levels, similar experiences and similar struggles. Some students
in the FL course felt students in the course were not motivated, felt at a disadvantage due
230
to the extensive knowledge of the language by FL learners, or were used as classroom
resources to translate when other students did not understand what the teacher said.
Conclusion
This chapter has presented the analysis conducted for the data collected in
response to the four research questions posed for the study and the results. In the next
chapter, these results will be summarized and discussed in light of their implications for
the research questions. Conclusions and implications will also be addressed as well as
limitations of the study and directions for future research.
231
CHAPTER 5: DISCUSSION AND CONCLUSIONS
HL Learners’ Profile
The first research question examined the cultural and language profile of HL
learners who are receptive bilinguals by analyzing their family’s language and cultural
background, the students’ early contact with Spanish, and their current language contact
and preferences. It also sought to establish whether there were any profile differences
among the three groups of students participating in the study. Subjects completed an
online questionnaire containing both closed and open-ended questions.
The evidence presented in this study replicates the results obtained in previous
research with HL learners of higher proficiency levels and many of the trends delineated
by Carreira (2003) for young Hispanics in the U.S. This group of receptive bilinguals has
no foreign-born individuals, although a fourth of them are as recent as second-generation
immigrants. The rest of the students are third- and fourth-generation immigrants to the
U.S., with some possibly having their ancestry going back even further. These results
point to the presence of a rather diversified population of students with respect to parental
transmission patterns, which goes beyond the typical third-generation language loss
pattern. Concerning this issue, the study presents interesting findings. Parents appear to
have contributed only minimally towards the students’ language proficiency in Spanish,
providing mainly indirect exposure. These findings are consistent with Bills’ (2005)
claim that there is a lack of intergenerational transmission among Mexican-Americans. In
this case, the parents failed to transmit the language to their children. Even though during
232
their childhood years, students had plenty of opportunities to overhear their parents’
conversations in Spanish, they were not actively engaged as listeners or speakers with
them. The most prevalent factors for the lack of parental communication in Spanish
mentioned by the students were mixed language families in which one parent does not
speak the language, a parent trying to learn English so this language was used as the
medium of communication, the mothers’ fears of discrimination against their children,
early English exposure through child care, and unwillingness of the students themselves
to speak Spanish. The immediate family played a minor role in the students’ language
development during childhood and continues to play a minimal role into adulthood. The
grandparents, on the other hand, provided students with more opportunities for contact
and continue to do so. Based on anecdotal comments of the students, the grandparents’
lack of English proficiency is one of the main reasons for using Spanish to communicate
with their grandchildren. The current language use pattern outlined above does not bode
well for the future language maintenance and development of the students. The minimal
or no Spanish use with siblings or parents leaves the grandparents as a main family
contact resource, which may no longer be available in coming years. Beyond family
members, results suggest that the Spanish language media plays some role in the
students’ exposure to Spanish but clearly not a major one. While they all do watch TV,
listen to music, and read, the amount of contact time remains low. The positive impact of
the Spanish language media predicted by Carreira (2003) cannot be substantiated in this
study for the population under investigation.
233
An additional finding regarding the profile of the HL learners in this study relates
to their origin and cultural identity. The vast majority of these students have family
origins from Mexico (91%), a percentage slightly higher than the local city’s Mexican
population, which reached 83.5% in 2000. The students highly value their Hispanic
heritage and identify themselves as either ‘Mexican-American’ or ‘Hispanic’, a finding
consistent with prior research cited by Carreira (2003) that reported that three-fourths of
teenagers identified themselves as Hispanic or Latinos. As Carreira explains, this stood in
sharp contrast to adults over the age of 35 who overwhelmingly selected the term
‘American’. In this study, however, the students identified with the Hispanic culture at a
much higher rate, with 100% selecting a term that reflected their Hispanic heritage. It is
clear that in terms of Tse’s model of ethnolinguistic identity development (1998a), these
students belong to the last stage called ‘ethnic identity incorporation’. They do not appear
to present ethnic identity conflicts, they fully embrace their mixed cultural backgrounds,
and accept their belonging to this group. It can be argued, however, that a lack of mastery
of the Spanish language has hindered their ability to obtain a positive self-image and a
feeling of complete belonging to the Hispanic community. Students strongly agree that it
is very important for a member of the Hispanic community to speak Spanish. Based on
some students’ survey comments, they sometimes feel ‘less’ Hispanic or Mexican-
American for not being able to communicate in the language.
The combination of a strong Hispanic identity and their belief that speaking
Spanish is necessary to fully integrate into the Hispanic community may have contributed
to the students’ high motivation to learn Spanish. They enrolled in a Spanish course to
234
improve their Spanish and become bilingual, with the overarching goal of communicating
with their family. Learning Spanish has become a major personal goal that goes beyond a
school requirement or better prospects of finding a job. An additional contributing factor
to their high motivation is their positive attitude towards Spanish. Students do not
associate Spanish with stigma or low status and recognize the importance of bilingualism.
It may be surprising then that despite their highly positive attitudes towards Spanish and
their high motivation, students only minimally use Spanish on a daily basis. Other
researchers, such as Lynch (2003), claim that language attitudes may play only a minimal
role in language maintenance. This appears to be especially true for the group of students
in this study, who lack confidence in their language abilities and are afraid to make
mistakes in front of native speakers.
A final, but noteworthy issue that emerges from the study’s findings is that
students’ do not value Spanish monolingualism. They view Spanish as an essential part of
being Hispanic provided it comes together with bilingualism. Spanish adopts an
important but secondary role for these students after English. This echoes the mainstream
ideology of English hegemony prevalent in many spheres in the U.S. Students appear to
have internalized this ideology that promotes English as the rightful and necessary
language for any American (García, 2003).
235
Differential Gains in Language Development and other Language-Related Variables after
One Semester of Instruction
The second research question compared the differential gains obtained by the
three groups of subjects (HLH group: HL learners in the HL course; HLF group: HL
learners in the FL course; and FLF group: FL learners in the FL course) in the different
language courses. Subjects completed two written-elicitation tasks and two oral-
elicitation tasks. The samples were coded for 3 and 4 fluency indicators, 3 complexity
indicators, and 3 and 4 accuracy indicators.
The results indicated that all groups improved their writing fluency and
complexity, including their tense/aspect use complexity but obtained no differential gains
due to the type of language course. Lexical diversity was maintained but not improved,
independent of group. Language course made a difference for accuracy. The HLH group
made significantly greater gains in one of the three indexes, SVA. It should be noted that
this group had a lower rate of accuracy at the beginning of the semester, which may have
allowed for increased opportunities for improvement. In oral production, the three groups
improved in fluency but both HL groups made significantly greater gains than the FL
group in the number of T-units produced. Both HL groups made substantially more
improvements than the FL group in reliance on English words and speech rate, but the
differences were not statistically significant. There is partial evidence to suggest that both
HL groups gained more fluency than the FL group. The three groups made significant
gains in complexity but did not achieve any gains in lexical diversity. For tense/aspect
use complexity, the HLH group made significantly more gains in tense/aspect use
236
complexity than the HLF group, who also improved, and the FLF group, who did not
improve. No significant gains were achieved in accuracy for any of the groups. The HLH
group improved more in the accuracy of SVA and the copula verb ‘ser’, although the
results did not prove to be statistically significant. These accuracy results are somewhat
consistent with those found in writing accuracy.
Overall, the findings from the students’ writing and oral development present
interesting implications for this study. Both HL groups improved their oral and written
performance in fluency and complexity measures regardless of the course. While the
HLF group and the FLF group were expected to have greater gains in writing due to the
rather extensive writing practice in the FL course, the HLH group was not since they did
minimal writing practice in their Spanish course. While the HLH group was expected to
improve their oral performance due to the rather extensive oral practice in the HL course,
the HLF group was expected to increase at a lower rate since their oral practice was less
extensive in the FL course. There are at least two potential explanations to account for the
fact that both HL groups improved performance at the same rate, regardless of the course.
The first relates to the effects of output practice and the second one to the amount of
input.
First, there is some evidence in second language acquisition research that suggests
that these constructs may underlie both oral and written modalities, although it is not a
topic largely investigated (Weissberg, 1999). This claim about language development
may be relevant to the present study since improvement in fluency, complexity, and
accuracy appears to have underlain both oral and written modalities and may account for
237
the similarities regardless of modality. Another factor that may be at play here is the
transfer of benefits of practice in one modality to the other so that oral practice benefited
written performance and vice versa. The relationship between the simultaneous language
development of oral and written modalities is largely unexplored at this point (Weissberg,
1999) and little is known about how practice in one modality impacts the other. The
results of this study lend tentative support to the positive impact of practice in one
modality to the other. Further, the results clearly suggest that extensive oral practice for
one HL group did not produce increased benefits nor did extensive written practice in the
other group.
Second, another possible explanation for the lack of differential gains for any of
the HL groups may be related to the similar amount of input the students received in both
language courses. In second language acquisition, input has been found to promote
language development, especially comprehensible input (Krashen, 1982). Both groups
received input in the language, which may have had a positive impact on the oral and
written performance of both groups alike. Considering the passive knowledge the
students already possessed, it can be argued that the more intensive language contact may
have started language recovery/reactivation mechanisms for both groups alike.
One of the interesting findings in this study is that the HL group in the HL course
obtained increased benefits in accuracy measures, so accuracy appears to be susceptible
to the difference in language course. Both groups received either oral or written output
practice in the language. However, the HL group received increased opportunities for
small group interaction coupled with targeted grammar practice on a reduced number of
238
grammar structures. The HL group in the FL course, on the other hand, received explicit
grammar instruction on a much larger variety of grammar topics and had much fewer
opportunities for practicing them in meaningful contexts. As stated by the students’
themselves, grammar explanations were confusing and difficult to incorporate into their
Spanish production. Far from making any improvement, HL students in the FL course
considerably decreased their accuracy in some measures, such as number agreement and
the use of the copula verb ‘ser’.
These results have important implications for the role of interaction and explicit
grammar instruction in the HL classroom. First, explicit grammar instruction may have
had a negative impact on accuracy development in the HL classroom. This was seen in
the decrease of accuracy that the HL group in the FL course showed and the students’
repeated comments on the confusion that grammar explanations generated. In second
language acquisition, a substantial body of research suggests that explicit instruction
followed by examples of target forms facilitates language acquisition (Ellis, 1993;
Robinson, 1997; Alanen, 1995) and may be superior to implicit grammar instruction
(DeKeyser, 1995). Evidence against the benefits of explicit grammar instruction has also
been presented in existing research (VanPatten & Oikkenon, 1996). These studies,
however, do not offer longitudinal data on the benefits of explicit grammar instruction. In
the HL classroom, only further research can shed light on the role of explicit-grammar
instruction. This study offers tentative results suggesting that explicit-grammar
instruction may not be beneficial for this population of learners.
239
Interaction is another factor present in the HL classroom that may have facilitated
the learners’ accuracy development. A repeated comment of the instructor and students
was how they constantly learned from each other in pair-work or small group activities.
Prior research in second language acquisition has consistently shown the increased
benefits of interaction in the language classroom. Interaction affords learners with
opportunities for receiving comprehensible input, comprehensible output, and negative
feedback. Comprehensible input is enhanced when interaction is present (Long, 1982,
1985; Pica, Young & Doughty, 1987; Lochsky, 1994). Interaction also offers a context
where learners can produce output and be pushed to make it comprehensible (Swain,
1995; Nobuyoshi & Ellis (1993). Negative feedback has also been found to be an
important factor in language acquisition (Long, 1996). Research has shown that language
learners can provide one another with valuable error feedback during interaction (Pica et
al., 1996). The complexity of language development is evident in the results obtained in
this study. Using the history of research in second language acquisition, it would be
valuable for HLE to start its own line of research to determine the factors that influence
heritage language development.
Significant differences were found with respect to language-related variables such
as language attitudes, self-confidence, and self-evaluation. The HLH group was the only
group with significant improvement in their Spanish language attitudes and had the most
positive attitude. As to self-confidence, the HLH group had the highest improvement,
followed by the HLF group. The FLF group did not show significant changes. All groups
had similar increases in their self-evaluation of Spanish competencies. The language
240
curriculum appears to have had a differential impact on the learners’ language attitude
and self-confidence that has benefited HL learners in the HL course. The learners’
language use outside the classroom appears not to have changed at the end of the
semester as reported in objective measures taken at the beginning and end of the
semester, although HL groups perceived that a good amount of change has taken place
while the FL group perceived a small change.
The language curriculum appears to have had an impact on the students’ language
attitudes and self-confidence. This differential impact did not extend to Spanish use
outside the classroom. The self-esteem issues found at the beginning of the semester may
still remain after taking their first language course. However, all groups reported seeking
more opportunities for language contact with the language at the end of the course. The
effects of these efforts may only be felt later.
Linguistic Differences between Heritage and Foreign Language Learners
The third research question analyzed the differences between FL and HL learners
with respect to the language variables examined in the study and their degree of
accentedness. The results of the analysis are summarized below.
Differences in listening comprehension between the HL and FL groups were
expected, given the amount of exposure that HL learners had experienced with Spanish.
It should be noted that the listening test was designed for FL learners and utilized
standard Spanish for all its dialogues, which may have presented some difficulties for HL
learners. Despite this caveat, HL learners outperformed FL learners in their listening
comprehension. Also, their increased listening comprehension abilities could further be
241
confirmed by the student comments to the survey. They repeatedly reported
understanding the instructors’ talk in the classroom, sometimes even helping their peers
who had more difficulties comprehending it.
Differences among the two groups, however, not only apply to receptive
knowledge of the language but also to oral production and native-like pronunciation.
Regarding the former, the main differences were found in fluency and complexity but not
in accuracy. For percentage of English use, it should be mentioned that for the most
demanding task, both groups of HL learners relied relatively little on English whereas the
FL group relied about two and half times more. These results have important implications
for the role of passive knowledge in language development. While it appears to play a
more predominant role in the degree of fluency and elaboration that learners can achieve,
its role seems to be minimal in accuracy measures such as verbal and noun phrase
morphology. Noun phrase morphology appears to be the least influenced by passive
knowledge or instruction since a trend towards more rapid accuracy development was
observed in verb morphology but not in noun phrase morphology.
HL learners were consistently rated to have a mild non-native accent while the FL
obtained strong non-native accent rates. This has important implications for the learners’
potential ultimate attainment in Spanish in the area of pronunciation. Although this needs
to be tested by further research, it is possible that the success rate in achieving native-like
pronunciation of these students will be higher than that of FL learners. Given that the
increased contact with Spanish has been mostly oral, it is only natural that there are no
major differences in writing among both groups. The HL learners’ predominantly passive
242
exposure to the language has had an impact on the learners’ receptive knowledge, their
more rapid oral production, and native-like pronunciation.
Student’ Level of Satisfaction and their Perceptions on FL and HL curriculum
Students completed a questionnaire that inquired about their level of satisfaction
on 10 items related to the content and materials used in their Spanish course and the
course in general. Overall, the HLH group showed the highest level of satisfaction,
agreeing almost with all statements, followed by the HLF group, who had an average
slightly above the ‘somewhat agree’ level, and then the FLF group, who was at the
‘somewhat agree’ level.
Overall, the HL learners in the HL classroom have reported to be the group with
the highest level of satisfaction. They were satisfied with the content of the course, the
learning of US Hispanic cultures and other relevant cultures, the speaking emphasis of
the course, and the comfortable atmosphere with learners who had their same cultural and
linguistic needs, strengths, and weaknesses. The HL students in the FL course, on the
other hand, disliked the studying of culture in their classroom. Far from fulfilling their
cultural needs and bringing them closer to their family roots, they felt alienated and
forced to learn cultural facts that are irrelevant to their reality. Furthermore, the FL
classroom acted as an alienator of the students’ own variety of Spanish by reinforcing the
students’ preconceived notion that their Spanish variety is full of slang and non-standard
forms. In some cases, it did not help students to reconnect with their family because of
the discrepancies that students found between the two varieties. These results lend
support to Bernal-Enríquez and Hernández-Chávez’s (2003) proposal of exposing
243
students’ to their vernacular variety in order to strengthen their ethnolinguistic identity
and their sense of belonging to a community.
The overemphasis on grammar has also been poorly perceived by HL students in
the FL course. They reported being confused by grammar rules. Their language
development corroborates this feeling since they decreased rather than increased their
accuracy rates in some accuracy indicators and failed to achieve major improvement in
their syntactic complexity by incorporating a wider range of structures in their linguistic
repertoire. Further, students felt inadequate in the course, despite their higher proficiency,
since they did not know as much Spanish grammar as their FL classmates. Thus, this type
of teaching with explicit grammar instruction and a fast-paced curriculum where
grammar and language topics are renewed frequently does not appear to meet the
language needs of the students. This confirms Lipski’s (1993) claim that the FL
classroom is not the best place for the HL learner who dislikes the dominant focus on
grammatical structures and has problems understanding these concepts. Finally, the
learning environment in the HL course seems to have favored student interaction,
facilitated an increase in the learners’ self-confidence, and allowed students to start
producing the language in a non-threatening environment.
Overall, the results of this question lend support to the inclusion of separate
courses for HL learners. Students’ confidence, self-esteem, and cultural needs were best
met in the HL course.
244
Conclusions and Pedagogical Implications
The main motivation behind the present study was to determine the effects of a
FL versus a HL curriculum on the language development, language attitudes, language
use, self-confidence, self-evaluation, and satisfaction level of receptive bilinguals. This,
in turn, would help determine the type of curriculum in which their emotional, cultural,
and linguistic needs are best met. The overall purpose for this study was three-fold: 1) to
shed light on the cultural and linguistic profile of receptive bilinguals; 2) to compare the
oral and written production between learners enrolled in two different types of language
courses at the beginning and end of the semester and changes in language use, attitudes,
confidence, and self-evaluation, and 3) to explore their level of satisfaction and
perceptions on the language curriculum. In addition, this study set out to identify
linguistic differences between the HL and FL population.
Prior research has made considerable progress in the delineation of the HL learner
profile (Cano & Dolores, 2004; Campbell, 1996; Carreira, 2003; Draper & Hicks, 2000;
Valdés, 1997, 2000; Walki, 1997). This study has advanced that line of research by
exploring the cultural and linguistic profile of receptive bilinguals. The data showed
interesting results with respect to the students’ origin, their cultural and linguistic ties,
and their attitudes towards these ties. First, the students had a tight connection to the
Mexican-American and Mexican cultures along with exposure to language varieties
spoken at home or by family members. The need for a language curriculum for these
students that includes culturally relevant content to strengthen these connections cannot
be overemphasized. The teaching of culture from an outsider perspective in the FL
245
classroom has only created antagonism on the part of the students. The students’ ties to
the Mexican-American culture calls for the need to assign a predominant role to
Mexican-American varieties in the classroom. In the FL classroom, the teaching of
formal, foreign varieties of Spanish seems to have caused confusion and
miscommunication with the students’ families. Second, the pride the students showed for
their Hispanic roots did not carry over to their own variety of Spanish, for which they
showed a lower regard. The FL course, with its emphasis on formal varieties of Spanish,
helped reinforce the notion that their variety was inferior to the language presented in the
textbook. On the contrary, the HL classroom provided an environment of acceptance
where all varieties were welcome and encouraged an appreciation for other varieties.
Clearly, the students need to gain dialect awareness to understand the arbitrary, socio-
economic and politically based differences among varieties of a language. It follows that
exposure to formal or academic varieties foreign to the students should be postponed
until they have gained confidence and proficiency in their own. Additionally, it is
important for the teacher to be very familiar with varieties spoken by the students, in this
case, Mexican-American varieties.
Also, the analysis of the students’ linguistic profile concerning language use
patterns provides insight into possible causes of student receptive bilingualism. During
childhood, intergenerational language transmission was weak in the case of the parents
but stronger with grandparents. Language experiences with family members provided
students with rich opportunities to overhear, and sometimes listen to the language while
simultaneously resulting in limited speaking, reading, or writing opportunities. Current
246
language use presents no differences. The school and their grandparents emerged as the
two main sources of language contact while friends, community members, parents, and
siblings provided low contact. Regardless of the type, the contact has remained passive in
nature. The bilingual nature of their family environment, coupled with the students’ lack
of confidence and fear of ridicule from Spanish native speakers, prevents them from
actively using the language in daily conversation. In these encounters, the students are
often confronted with a contradictory situation. On the one hand, they have plenty of
opportunities to come into contact with native speakers. On the other, native-speaker
contact presents challenges and fears for these students who lack the necessary
confidence to actively participate. The language classroom, then, has the potential to
provide a nurturing environment where students can gain confidence speaking and can
continue their language development process. Students in the HL course have found this
classroom to be a non-threatening, safe, and motivational environment that has not been
available to the same extent in the FL classroom or the students’ homes. Although some
researchers have questioned the role of school in language maintenance (Baker, 2001;
Fishman, 2000), for receptive bilinguals school is a fundamental beginning point. Until
Bill’s proposal (2005) of an increased acceptance on the part of native speakers for non-
target-like language behavior is followed, home and community environments will
remain too threatening for these students to engage in active interactions.
Additionally, the students appear to be highly motivated to learn Spanish. Their
positive attitude towards Spanish and their cultural roots seem to have served as the main
catalyst for wanting to improve their Spanish and enroll in a Spanish course.
247
Interestingly, their high motivation and positive attitude do not appear to have influenced
their language use outside the classroom before starting the course or after finishing it.
The students’ language use and listening frequencies did not change significantly for any
group at the end of the semester. The tight correlation between attitudes and language
maintenance claimed by researchers such as Tse (1998) has not been corroborated in this
study. It should be noted though that their perceptions showed a somewhat different
picture since both HL groups felt that they sought more opportunities to use Spanish
outside the classroom at the end of the semester. An apparently contradictory finding that
dampens their positive attitude towards the value of Spanish is the students’
overwhelming preference for bilingualism to Spanish monolingualism. This has
important implications for the future maintenance of Spanish within their own families.
Early exposure to English or both English and Spanish, as suggested by Bernal-Enríquez
(2005), threatens Spanish language acquisition and compromises its maintenance.
As to the second purpose of this study, which sought to assess the effects of the
language curriculum on the students’ language development, the different types of
curricula appear to not have had a major differential impact on both groups of HL
learners with respect to fluency and complexity. Both groups of learners made similar
gains after one semester of instruction in both written and oral production despite the
difference in focus of the two curricula (one favored mainly oral practice and the other
focused on grammar, writing, reading, and speaking, in that order). For accuracy, this
study provides partial evidence to support the conclusion that the HL group in the HL
course obtained more gains in both written and oral output. Accuracy, then, appears to
248
have been more susceptible to the two different types of curricula. HL learners who
followed a curriculum with a grammar approach that focused on meaningful and
contextualized oral language practice seem to have received more benefits than a
curriculum with a focus on explicit grammar instruction from a larger list of grammar
topics. The lack of differences in fluency and complexity development may be indicative
of the increased role of passive knowledge in these two linguistic aspects. Students in the
FL course improved their oral production at the same rate as students in the HL course
despite the lack of speaking opportunities. At the same time, the HL learner in the HL
course improved their written production at the same rate as the HL learners in the FL
course, despite their lack of writing opportunities in their language course.
Furthermore, differences in accuracy development may be an indication that
passive knowledge may have a less dominant role in this realm and may require more
precise pedagogical intervention. This finding is in line with prior research on language
loss and points to commonalities between the two processes. As Montrul (2004) explains,
morphology, the verbal system, and the lexicon are the three linguistic domains that are
most affected in language loss. This study provides preliminary evidence that these
domains may be more resistant to language reactivation. The precise role that passive
knowledge has in relation to accuracy development, together with the type of pedagogical
intervention that proves to be more effective for HL learners, needs to be explored by
further research.
Regarding the third purpose of this study about the students’ level of satisfaction
and perceptions on their language courses, clear differences among the two HL groups
249
surfaced. While the HL learners in the FL course were dissatisfied with the irrelevance of
the content of the culture sections in their curriculum, the overemphasis on grammar, and
the discrepancies between their home variety of Spanish and the one taught in the
classroom, the learners in the HL group were satisfied with learning about their own
cultures and history, the emphasis on speaking, and the respect and the alignment
between their variety and the one taught in the classroom. In order to fully serve HL
learners, the FL classroom must incorporate pedagogies and curriculum changes that are
more aligned with the needs of these students.
Finally, the last purpose for this study was to explore linguistic differences
between HL and FL learners. The results suggest that differences between the two groups
clearly emerged, with both groups of HL learners showing differential gains after one
semester of instruction. They achieved a more rapid development with respect to the FL
group in measures of fluency, complexity, and accuracy in oral production. In addition,
HL learners in both groups outperformed FL in listening comprehension and native-like
pronunciation. This finding is consistent with research on loss of language skills. As
Yoshitomi (1992) points out, phonological skills are maintained better than lexical or
grammatical skills and receptive skills better than productive. Production skills, however,
developed at a faster rate for the HL learners than for the FL learners. This has two
important implications. First, it lends support to the notion that passive knowledge may
be responsible for a faster speed of learning, regardless of type of curriculum. Second, the
more rapid language development that both groups achieved has important implications
for program development. If the HL learners’ faster rate of development continues
250
throughout their FL courses, the linguistic differences among the two groups may
eventually become too large, resulting in major discrepancies in language proficiency
among the two groups of students.
The overarching purpose of this study was to determine the type of curriculum
that best met the needs of receptive bilinguals. Based on the findings discussed above, the
following are recommendations for the type of curriculum that would best meet the
students’ needs. This curriculum should contain the following components:
1. A focus on home and local varieties: If the language classroom is to play a
successful role in the students’ language maintenance and development, it should align
itself with the students’ linguistic needs and experiences, as suggested by Bernal-
Enríquez and Hernández-Chávez (2003). To this effect, a focus on varieties students are
familiar with is highly desirable for two main reasons. It will help students reconnect
with their family and community and enhance successful communication while at the
same time valuing their variety. It will also make full use of the knowledge students
already possess by encouraging its daily use in the classroom. At these early stages of
language development, the acquisition of formal varieties of Spanish should only play a
minimal role in the HL classroom. Class visitors such as family and community members
would be an ideal way to incorporate this variety. Students’ own recordings of family
conversations or interviews would also make an additional contribution. Finally, video
segments from local television programs can provide further input to the students.
2. A dialectal awareness approach: It will address the learners’ low regard
towards their own variety of Spanish and provide them with a dialectal awareness that
251
would allow them to understand differences in language varieties. It is not suggested here
that students acquire the standard varieties of Spanish at this level such as the Critical
Based Dialect Awareness approach to HL instruction would propose (Martínez, 2003).
They should be made aware, however, that the standard variety is, for economic or
political reasons, the “prestige” variety spoken for administrative and academic purposes
(Danesi, 1986) but its status has nothing to do with its intrinsic worth (Gutierrez, 1997).
As Martínez (2003) claims, “students must have access to a sophisticated social lens that
will allow them to rise above the essentialist ideologies that regard their language and,
indeed, their own selves as inferior” (p. 9). This approach can only be achieved by
introducing activities that raise student awareness of the arbitrary nature of linguistic
differences along with the full incorporation of the students’ variety of Spanish as the
main medium of communication in the classroom. If their variety is reserved for outside
classroom use, a hidden message may be transmitted to the student with respect to the
worth of their language variety.
3. A community and family-based focus: In addition to incorporating
community and family language varieties, instruction should rely on the community and
family cultural and linguistic resources. First, it would encourage students’ active
participation in community events. Second, it would encourage active use of the language
through the incorporation of family and community projects along with service learning
activities. However, these opportunities cannot be utilized until learners have achieved a
certain degree of confidence in their Spanish language abilities and are ready for contact
with Spanish native speakers.
252
4. Confidence-building activities: The curriculum should provide plenty of
confidence-building activities for students to become aware of their proficiency in the
language and take risks in participating in naturalistic conversations with native speakers.
This type of activity is naturally valuable for any language classroom. As Barbara
Garside states in the introduction to the book called ‘The confidence book’, “one of the
biggest blocks to learning is lack of self-esteem” (in Davis & Rinvolucri, 1990, p. 1). HL
learners and especially receptive bilinguals, however, often have low self-esteem issues
stemming from a low regard of their language proficiency and their own variety of
Spanish (Beaudrie & Ducar, 2005) that will be difficult to overcome without these types
of activities.
5. Authentic language instruction: The communicative language movement
of the last three decades has advocated for the value of contextualized and authentic
language instruction as a function of the need for communicative uses of language
(Omaggio Haddley, 2001). While all language learners would benefit from the
incorporation of authentic materials, for HL instruction it is almost a requirement. First,
HL students come to the classroom already used to participating in communicative events
in Spanish for authentic purposes; thus, activities that include drilling and isolated
grammar exercises are likely to be resented by students. Second, the varieties of Spanish
presented in textbooks may not always be in line with the students’. Authentic materials,
however, can present challenges in the same way they do for FL learners. As Omaggio
Haddley (2001) points out, some authentic activities can be frustrating for students,
especially for lower proficiency students (Ur, 1984; Dunkel, 1986, as cited in Omaggio
253
Haddley, 2001). Authentic materials such as newspaper and internet articles, TV program
and video segments, and multimedia software should be carefully selected, sequenced,
and adapted in the HL classroom.
6. Inclusion of individualized lesson plans: The classroom content and
materials should be modified to suit the level and interests of the individual students in
the HL classroom. The failure to introduce any modifications in the FL curriculum so as
to incorporate the diverse needs of the population is one of the factors that can account
for the lower level of satisfaction experienced by HL learners in the FL course. The
students’ attitudes, personal experiences, language proficiency, and linguistic and cultural
needs should be the starting point of pedagogical decisions in the language classroom, as
suggested by prior research (Romero, 2000).
7. The traditional explicit-grammar instruction seems to have created
confusion for HL learners in the FL course. More current approaches to teaching
grammar need to be explored in the HL classroom. Assuming that noticing (Schmidt,
1990, 1993, 1995) is also essential for HL language development to occur, noticing
strategies should be incorporated in the classroom. New techniques such as input
enhancement (Sharwood Smith, 1993) and focus on form (Long, 1991) are possible
choices that have been used successfully in the FL classroom. Above all, the teaching of
grammar should be contextualized, meaningful, and should utilize the learners’ own
experiences with the language as the base for pedagogical instruction. As suggested by
Lynch (2003), HL instruction should focus on grammatical and lexical development
through discourse-level activities rather than more isolated and controlled exercises.
254
8. Interaction: Interactive activities may be key for the HL learners’
development. If learners are to reactivate their passive knowledge, they need to be
provided with situations where they can set language retrieval or reactivation
mechanisms in motion and increase their opportunities for input, output, and feedback.
9. A focus on culture that emphasizes and promotes the learners’ insider
status and perspectives of their Hispanic culture. It should contain a heavy cultural
component where students learn about their own culture, its history and socio-political
reality in the U.S.
The results of this study also have some implications for Spanish language
program development. Regarding HL learner identification and placement, oral
production, language background surveys, listening comprehension, and degree of
accentedness can be potential indicators to discriminate foreign from heritage language
learners who are receptive bilinguals. Language background surveys by themselves may
not be sufficient to clearly identify the students’ level of the language. Despite the careful
selection of students based on the survey, there was still great diversity in student
performance. A combination of the fours indicators mentioned above may provide a
clearer picture the students’ proficiency and their right placement.
For HL learners in this study, the HL course brought about increased benefits in
the areas of language development, cultural development, affective factors such as
confidence and attitudes, and overall satisfaction. Other HL programs need to examine
the needs of their HL learners to see if comparable courses are a logical and feasible
choice to add to their language program structure. The pedagogical approaches, materials,
255
and curriculum used in the FL classroom together with the training of FL instructors
should be analyzed to determine if they are serving the needs of HL learners.
Limitations of the Study
The main limitation of this study is that its non-experimental design precludes any
generalization of its findings and implications beyond the scope of this study. The reader
may find some of results applicable to their own instructional context but broad
generalizations should be made with caution.
Another limitation of the study is the teacher variable as a possible confounding
factor. Despite the tight constraints imposed on the curriculum of each FL course, which
leaves little room for variation and digressions of individual instructors, the second group
of HL was enrolled in different FL courses taught by different instructors. This may have
introduced additional confounding variables to the study that are difficult to predict.
Individual student motivation and learning styles are other variables that are difficult to
control in this type of study and may have been the source of additional variance.
An additional limitation in this study is the limited scope of the language
development measures. This study examined a number of objective language
development measures such as fluency, complexity, and accuracy. Other measures of
language development, including components of communicative competence such as
strategic, sociolinguistic, and discourse competence, have not been included and,
therefore, a complete picture of the students’ language development over the course of a
semester has not been attained. In addition, the time frame is yet another constraint; a
256
longer period of two semesters would have provided a clearer picture of the students’
language development.
Future Research
The survey data in this study suggests that the students’ receptive knowledge of
the language has been influenced by two types of contact: one with overhearing
opportunities and one with listening opportunities. These two types of contact need to be
examined in further detail in order to establish how they have influenced the current
knowledge of the language and whether they are responsible for the individual variation
observed in this study. In addition, a more in-depth exploration of the students’ receptive
knowledge of the language, including an investigation of their comprehension of different
dialects, will greatly aid in the understanding of the students’ Spanish language
development and their proficiency in the language.
This study has made a contribution towards the understanding of the pedagogical
needs of receptive bilinguals. Research on different pedagogical practices and their effect
on the HL development of these students’ needs to be undertaken. Accuracy, for
example, has been found to be an area of weakness for HL learners of this level. Research
into this area should address best practices to help students attain more accurate
production.
The preliminary investigation conducted in this study on the HL learners’ degree
of accentedness has yielded interesting results that are worthy of future investigations.
These learners were rated as having a mild accent in Spanish. It will be interesting to
examine whether segmental characteristics or prosodic features contribute to their mild
257
accent as compared to advanced Mexican-American Spanish speakers. It also remains to
be examined if these students can acquire a more native-like pronunciation of these
phonemes that contributed to their mild accent at a more rapid pace than second language
learners. In this acquisition process, it should also be examined if these learners respond
better to overt phonological instruction or to increased amounts of native speaker input.
Final Thoughts
This study sought to address the specific language, cultural, and emotional needs
of a population of students that had not received sufficient attention from the HL field
and to determine the role of the language classroom in their language development of
Spanish. The results have shown that school currently plays a major role in the students’
contact with Spanish and has the potential to bridge the gap between the native speaker’s
world and the students. Overall, the receptive bilinguals’ language, cultural, and
emotional needs were best met in the HL course. In this course, they achieved equal gains
in writing, outperformed FL learners together with the HLF group in oral production, and
surpassed both FL and HL groups in the FL course in some measures of accuracy
development. Furthermore, their affective and cultural needs were best met in the HL
course where they gained more self-confidence, improved their language attitudes, and
learned about their cultural heritage and the reality of Hispanics in the US. In response to
Carreira (2004)’s call for the need to draw a dividing line where HL learners should be
included or excluded from HL programs, it is clear that receptive bilinguals in this study
benefited from being included in the HL program. This course has provided students with
a non-threatening environment where they could start taking risks at transforming their
258
passive knowledge into active knowledge and overcome their fears and embarrassment. I
would like to argue that without this type of course, active participation with native
speakers may prove to be too threatening for these learners. As they belong to bilingual
communities where they can communicate in English even when they are spoken to in
Spanish, the use of Spanish is almost never a requirement. One HL student’s words in the
HL course may have summarized the sentiment of many in this classroom:
“I think in this class, realizing that all the students that were there had the samefears and maybe feelings of being ashamed or intimidated or fearful of making mistakes,embarrassed, that sort of thing, everybody felt the same. I think I felt this overallsentiment of ‘ok we’re all on the same boat, we shouldn’t be afraid here’ and that wasimportant… you can see people breaking out of their little shells a little bit, which I thinkis a huge step… it was fun to be with a group of students who all came from a similarbackground. Not everybody has the exact same background but everybody has had somelevel of exposure and they were and not just understanding the language butunderstanding the cultural nuances as well and when you say little things that our parentsor our grandmothers would have said to us as kids that we didn’t quite understand but weknew the gist of and then somebody would ask ‘what does this mean?’ and everybodywould go ‘I know that, my grandma used to say that’. Those are the sorts of things thatyou don’t necessarily get with non-native speakers.” (Student in the HL course)
In summary, this study has taken the first steps towards understanding the
pedagogical needs of receptive bilinguals by examining their progress and satisfaction
level in courses following two different types of curricula. In addition, this study has
made a contribution towards understanding their profile, their differences with FL
learners, and their process of language development after extensive periods of primarily
passive use of the language. Other HL programs must examine the needs of their HL
learners to see if comparable courses would also better serve their students. It is hoped
that this study leads to further research that investigates more pedagogical aspects related
to HL learners in general, and receptive bilinguals specifically. Studies like this one are
259
essential in the search for sound pedagogical choices to meet the linguistic, cultural, and
affective needs of this growing population of HL students in the language classroom. It is
only after practitioners are able to mold instruction to students’ needs that we can begin
to accomplish individual and national goals of HL language maintenance in the language
classroom.
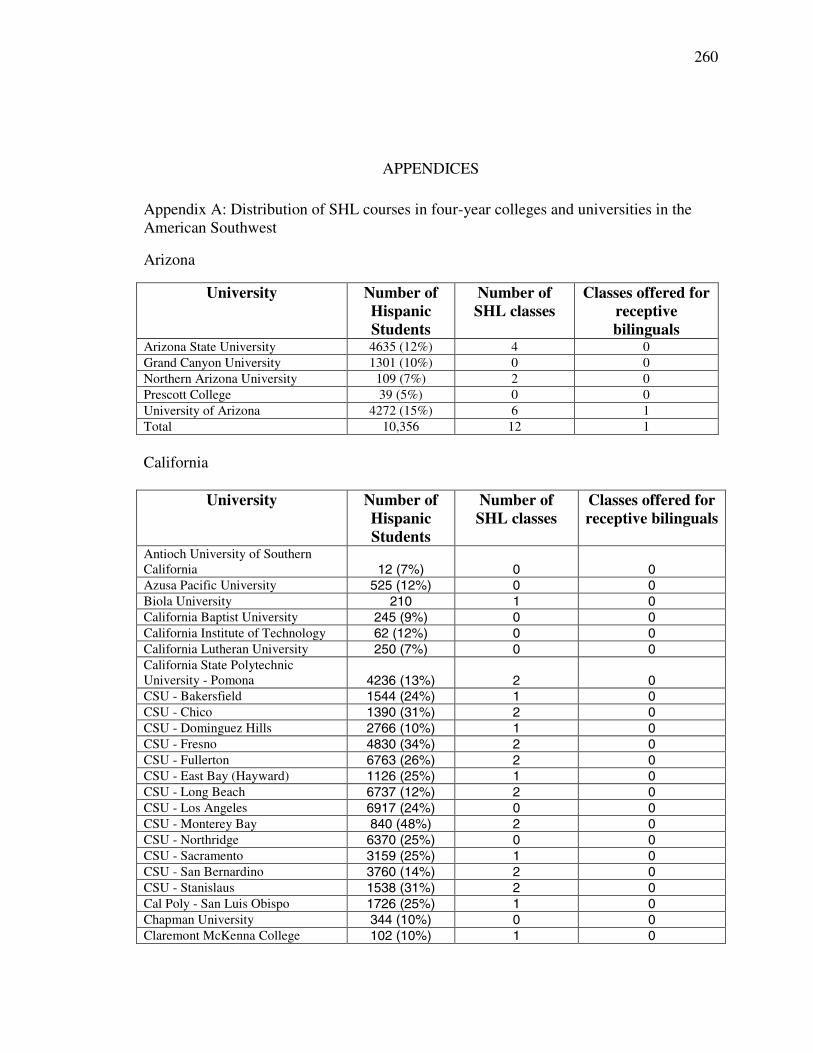
260
APPENDICES
Appendix A: Distribution of SHL courses in four-year colleges and universities in theAmerican Southwest
Arizona
University Number ofHispanicStudents
Number ofSHL classes
Classes offered forreceptivebilinguals
Arizona State University 4635 (12%) 4 0Grand Canyon University 1301 (10%) 0 0Northern Arizona University 109 (7%) 2 0Prescott College 39 (5%) 0 0University of Arizona 4272 (15%) 6 1Total 10,356 12 1
California
University Number ofHispanicStudents
Number ofSHL classes
Classes offered forreceptive bilinguals
Antioch University of SouthernCalifornia 12 (7%) 0 0Azusa Pacific University 525 (12%) 0 0Biola University 210 1 0California Baptist University 245 (9%) 0 0California Institute of Technology 62 (12%) 0 0California Lutheran University 250 (7%) 0 0California State PolytechnicUniversity - Pomona 4236 (13%) 2 0CSU - Bakersfield 1544 (24%) 1 0CSU - Chico 1390 (31%) 2 0CSU - Dominguez Hills 2766 (10%) 1 0CSU - Fresno 4830 (34%) 2 0CSU - Fullerton 6763 (26%) 2 0CSU - East Bay (Hayward) 1126 (25%) 1 0CSU - Long Beach 6737 (12%) 2 0CSU - Los Angeles 6917 (24%) 0 0CSU - Monterey Bay 840 (48%) 2 0CSU - Northridge 6370 (25%) 0 0CSU - Sacramento 3159 (25%) 1 0CSU - San Bernardino 3760 (14%) 2 0CSU - Stanislaus 1538 (31%) 2 0Cal Poly - San Luis Obispo 1726 (25%) 1 0Chapman University 344 (10%) 0 0Claremont McKenna College 102 (10%) 1 0
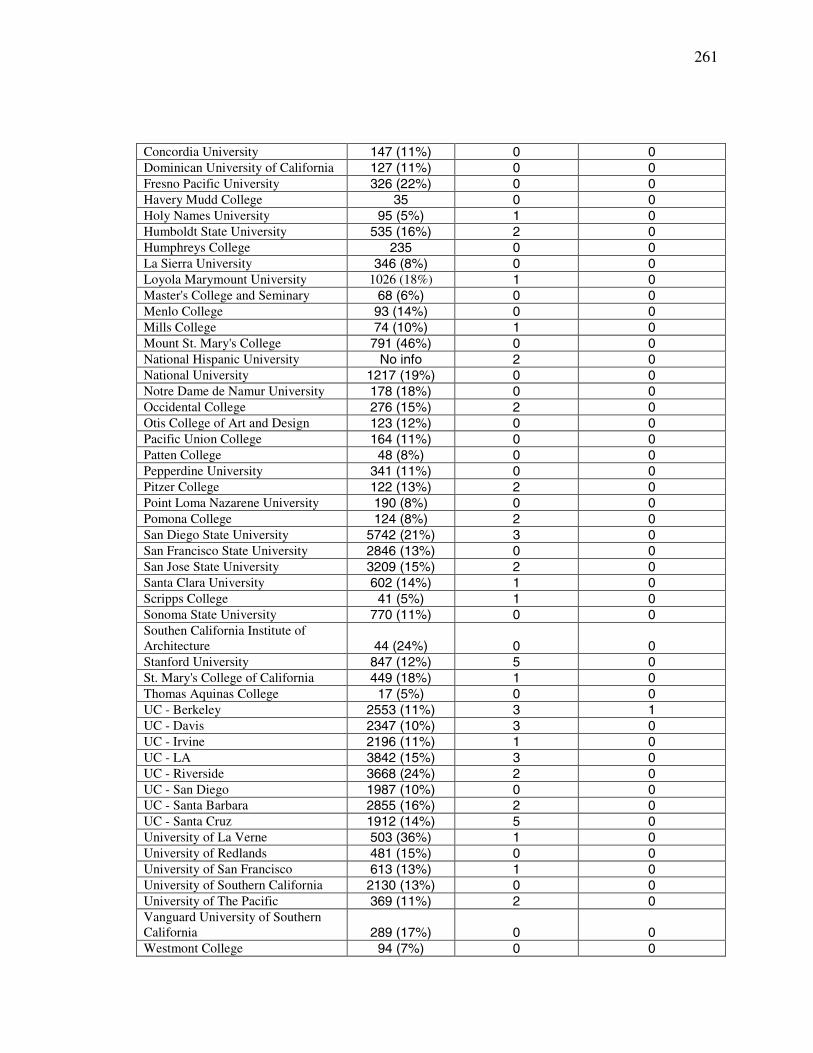
261
Concordia University 147 (11%) 0 0Dominican University of California 127 (11%) 0 0Fresno Pacific University 326 (22%) 0 0Havery Mudd College 35 0 0Holy Names University 95 (5%) 1 0Humboldt State University 535 (16%) 2 0Humphreys College 235 0 0La Sierra University 346 (8%) 0 0Loyola Marymount University 1026 (18%) 1 0Master's College and Seminary 68 (6%) 0 0Menlo College 93 (14%) 0 0Mills College 74 (10%) 1 0Mount St. Mary's College 791 (46%) 0 0National Hispanic University No info 2 0National University 1217 (19%) 0 0Notre Dame de Namur University 178 (18%) 0 0Occidental College 276 (15%) 2 0Otis College of Art and Design 123 (12%) 0 0Pacific Union College 164 (11%) 0 0Patten College 48 (8%) 0 0Pepperdine University 341 (11%) 0 0Pitzer College 122 (13%) 2 0Point Loma Nazarene University 190 (8%) 0 0Pomona College 124 (8%) 2 0San Diego State University 5742 (21%) 3 0San Francisco State University 2846 (13%) 0 0San Jose State University 3209 (15%) 2 0Santa Clara University 602 (14%) 1 0Scripps College 41 (5%) 1 0Sonoma State University 770 (11%) 0 0Southen California Institute ofArchitecture 44 (24%) 0 0Stanford University 847 (12%) 5 0St. Mary's College of California 449 (18%) 1 0Thomas Aquinas College 17 (5%) 0 0UC - Berkeley 2553 (11%) 3 1UC - Davis 2347 (10%) 3 0UC - Irvine 2196 (11%) 1 0UC - LA 3842 (15%) 3 0UC - Riverside 3668 (24%) 2 0UC - San Diego 1987 (10%) 0 0UC - Santa Barbara 2855 (16%) 2 0UC - Santa Cruz 1912 (14%) 5 0University of La Verne 503 (36%) 1 0University of Redlands 481 (15%) 0 0University of San Francisco 613 (13%) 1 0University of Southern California 2130 (13%) 0 0University of The Pacific 369 (11%) 2 0Vanguard University of SouthernCalifornia 289 (17%) 0 0Westmont College 94 (7%) 0 0
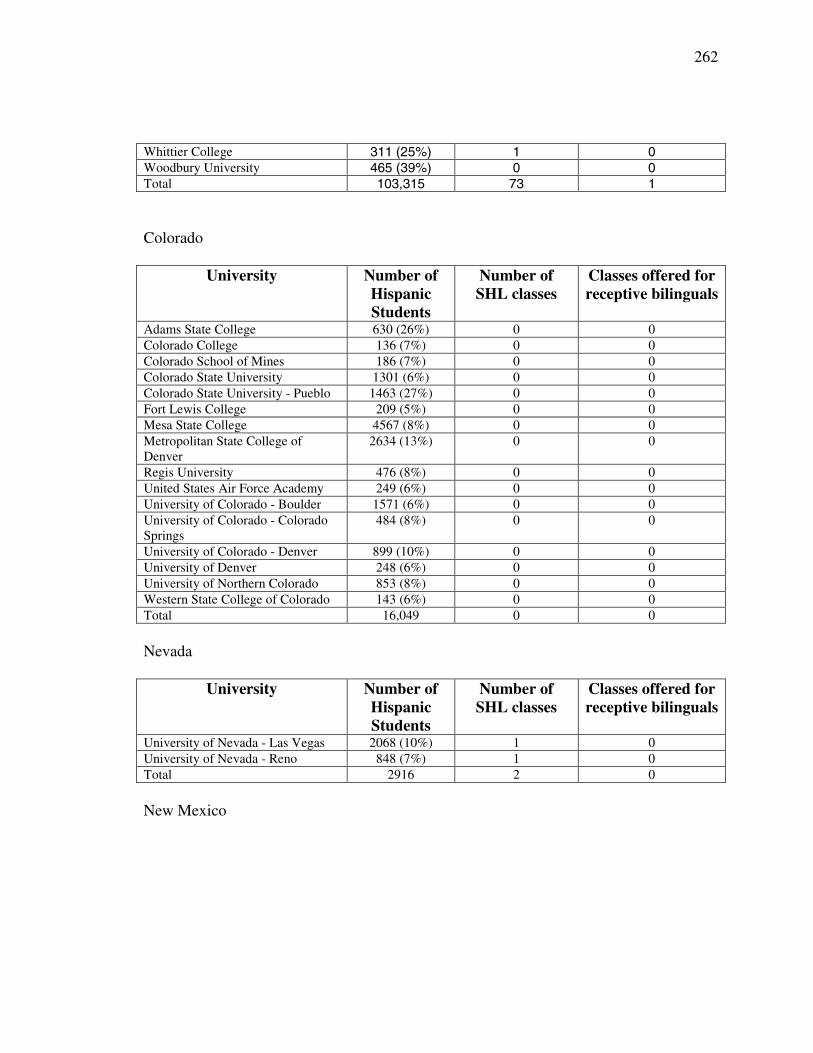
262
Whittier College 311 (25%) 1 0Woodbury University 465 (39%) 0 0Total 103,315 73 1
Colorado
University Number ofHispanicStudents
Number ofSHL classes
Classes offered forreceptive bilinguals
Adams State College 630 (26%) 0 0Colorado College 136 (7%) 0 0Colorado School of Mines 186 (7%) 0 0Colorado State University 1301 (6%) 0 0Colorado State University - Pueblo 1463 (27%) 0 0Fort Lewis College 209 (5%) 0 0Mesa State College 4567 (8%) 0 0Metropolitan State College ofDenver
2634 (13%) 0 0
Regis University 476 (8%) 0 0United States Air Force Academy 249 (6%) 0 0University of Colorado - Boulder 1571 (6%) 0 0University of Colorado - ColoradoSprings
484 (8%) 0 0
University of Colorado - Denver 899 (10%) 0 0University of Denver 248 (6%) 0 0University of Northern Colorado 853 (8%) 0 0Western State College of Colorado 143 (6%) 0 0Total 16,049 0 0
Nevada
University Number ofHispanicStudents
Number ofSHL classes
Classes offered forreceptive bilinguals
University of Nevada - Las Vegas 2068 (10%) 1 0University of Nevada - Reno 848 (7%) 1 0Total 2916 2 0
New Mexico
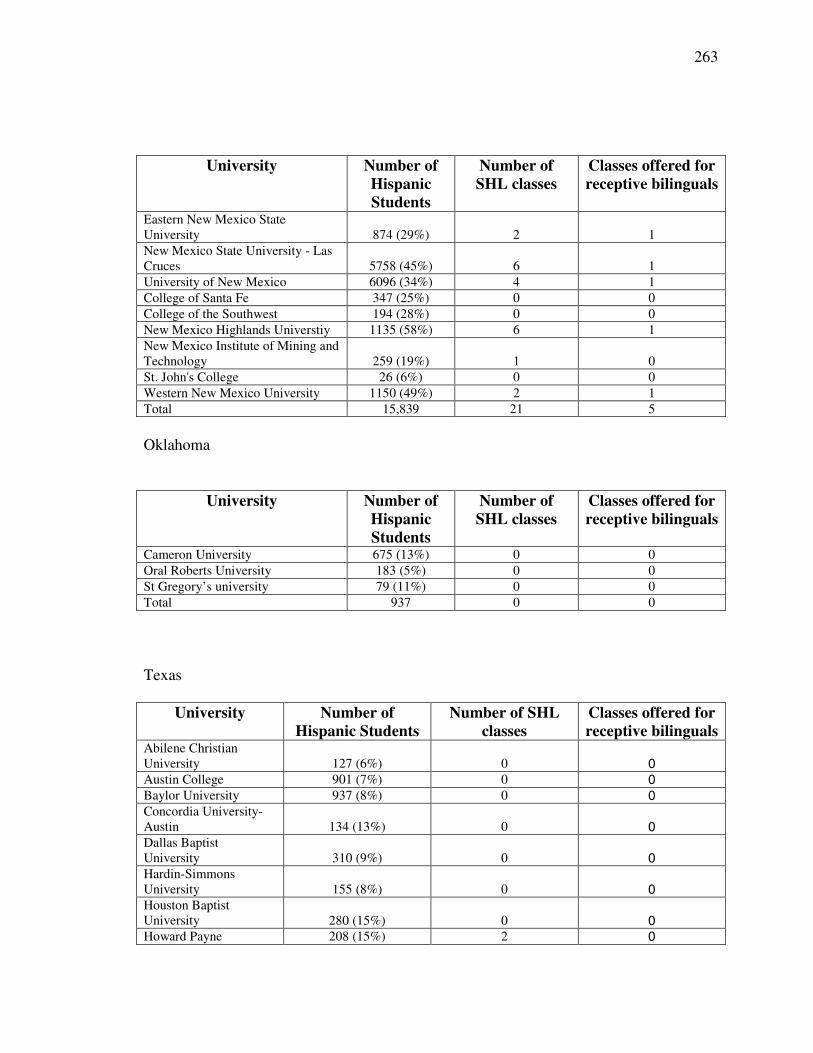
263
Oklahoma
Texas
University Number ofHispanic Students
Number of SHLclasses
Classes offered forreceptive bilinguals
Abilene ChristianUniversity 127 (6%) 0 0Austin College 901 (7%) 0 0Baylor University 937 (8%) 0 0Concordia University-Austin 134 (13%) 0 0Dallas BaptistUniversity 310 (9%) 0 0Hardin-SimmonsUniversity 155 (8%) 0 0Houston BaptistUniversity 280 (15%) 0 0Howard Payne 208 (15%) 2 0
University Number ofHispanicStudents
Number ofSHL classes
Classes offered forreceptive bilinguals
Eastern New Mexico StateUniversity 874 (29%) 2 1New Mexico State University - LasCruces 5758 (45%) 6 1University of New Mexico 6096 (34%) 4 1College of Santa Fe 347 (25%) 0 0College of the Southwest 194 (28%) 0 0New Mexico Highlands Universtiy 1135 (58%) 6 1New Mexico Institute of Mining andTechnology 259 (19%) 1 0St. John's College 26 (6%) 0 0Western New Mexico University 1150 (49%) 2 1Total 15,839 21 5
University Number ofHispanicStudents
Number ofSHL classes
Classes offered forreceptive bilinguals
Cameron University 675 (13%) 0 0Oral Roberts University 183 (5%) 0 0St Gregory’s university 79 (11%) 0 0Total 937 0 0
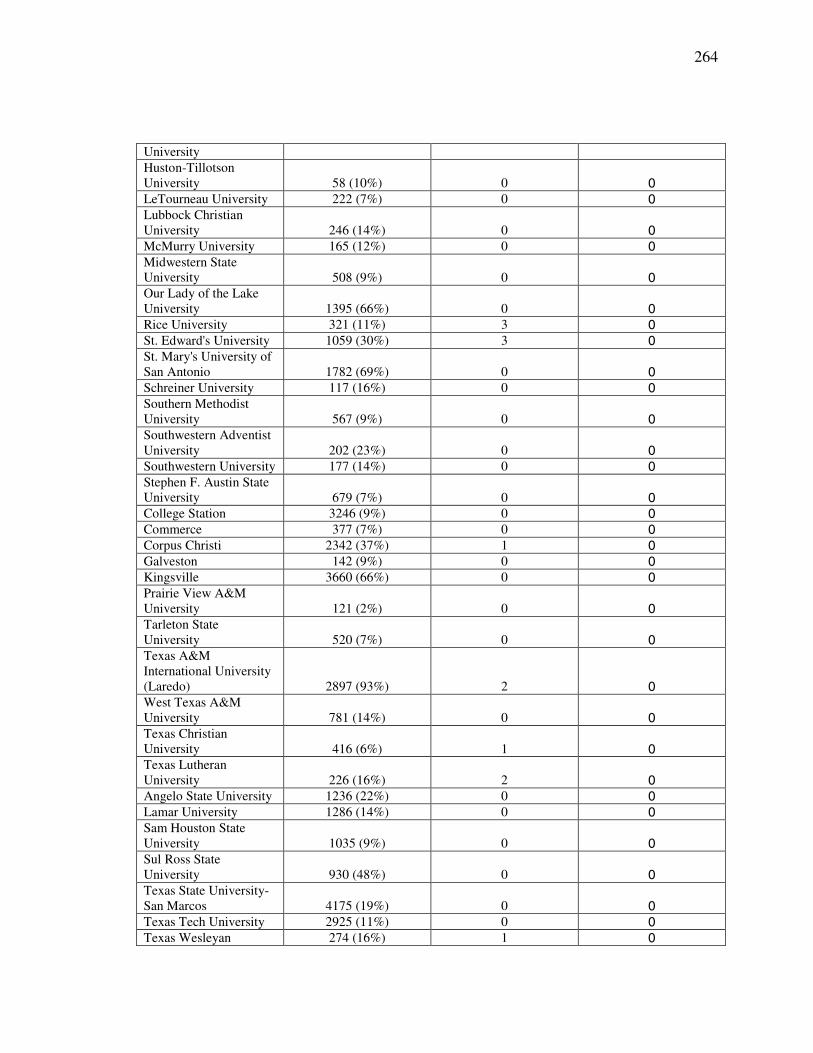
264
UniversityHuston-TillotsonUniversity 58 (10%) 0 0LeTourneau University 222 (7%) 0 0Lubbock ChristianUniversity 246 (14%) 0 0McMurry University 165 (12%) 0 0Midwestern StateUniversity 508 (9%) 0 0Our Lady of the LakeUniversity 1395 (66%) 0 0Rice University 321 (11%) 3 0St. Edward's University 1059 (30%) 3 0St. Mary's University ofSan Antonio 1782 (69%) 0 0Schreiner University 117 (16%) 0 0Southern MethodistUniversity 567 (9%) 0 0Southwestern AdventistUniversity 202 (23%) 0 0Southwestern University 177 (14%) 0 0Stephen F. Austin StateUniversity 679 (7%) 0 0College Station 3246 (9%) 0 0Commerce 377 (7%) 0 0Corpus Christi 2342 (37%) 1 0Galveston 142 (9%) 0 0Kingsville 3660 (66%) 0 0Prairie View A&MUniversity 121 (2%) 0 0Tarleton StateUniversity 520 (7%) 0 0Texas A&MInternational University(Laredo) 2897 (93%) 2 0West Texas A&MUniversity 781 (14%) 0 0Texas ChristianUniversity 416 (6%) 1 0Texas LutheranUniversity 226 (16%) 2 0Angelo State University 1236 (22%) 0 0Lamar University 1286 (14%) 0 0Sam Houston StateUniversity 1035 (9%) 0 0Sul Ross StateUniversity 930 (48%) 0 0Texas State University-San Marcos 4175 (19%) 0 0Texas Tech University 2925 (11%) 0 0Texas Wesleyan 274 (16%) 1 0
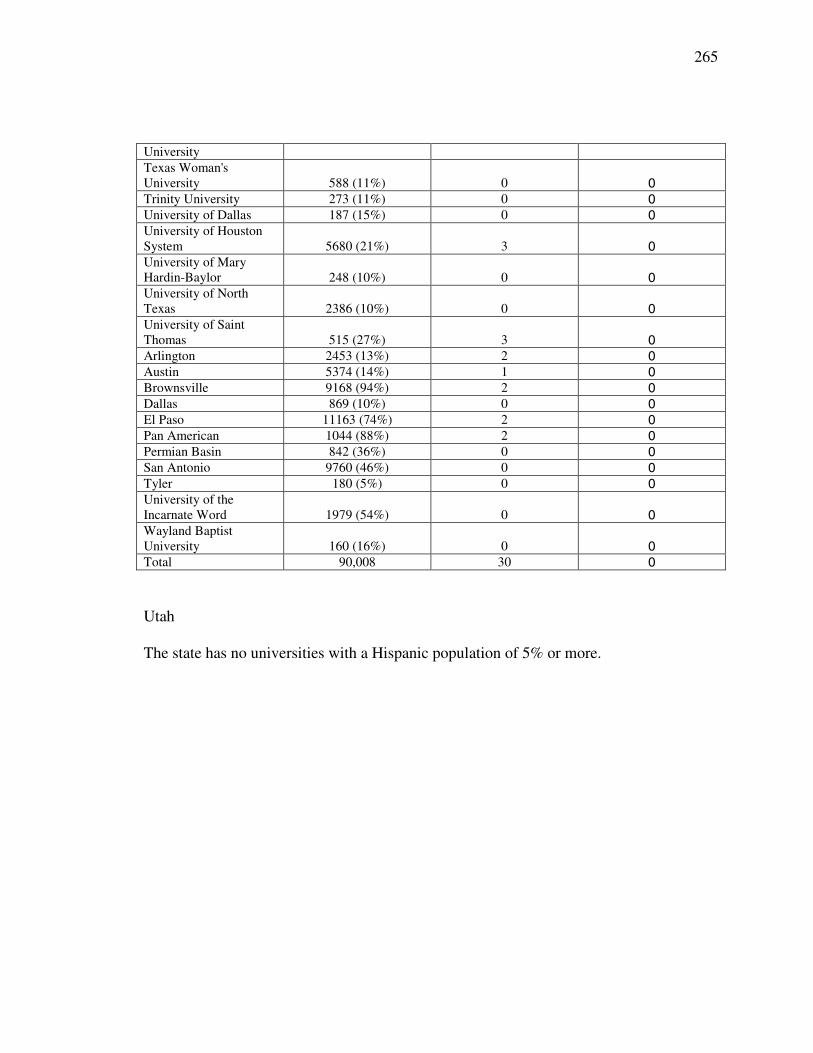
265
UniversityTexas Woman'sUniversity 588 (11%) 0 0Trinity University 273 (11%) 0 0University of Dallas 187 (15%) 0 0University of HoustonSystem 5680 (21%) 3 0University of MaryHardin-Baylor 248 (10%) 0 0University of NorthTexas 2386 (10%) 0 0University of SaintThomas 515 (27%) 3 0Arlington 2453 (13%) 2 0Austin 5374 (14%) 1 0Brownsville 9168 (94%) 2 0Dallas 869 (10%) 0 0El Paso 11163 (74%) 2 0Pan American 1044 (88%) 2 0Permian Basin 842 (36%) 0 0San Antonio 9760 (46%) 0 0Tyler 180 (5%) 0 0University of theIncarnate Word 1979 (54%) 0 0Wayland BaptistUniversity 160 (16%) 0 0Total 90,008 30 0
Utah
The state has no universities with a Hispanic population of 5% or more.
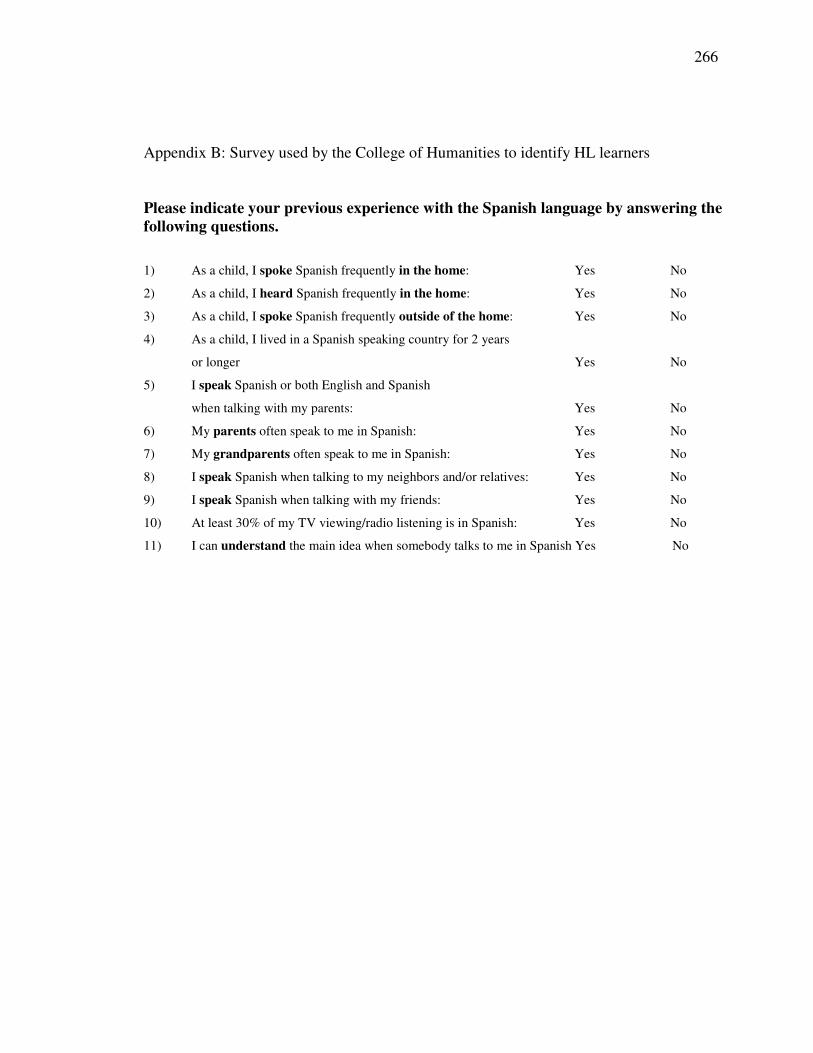
266
Appendix B: Survey used by the College of Humanities to identify HL learners
Please indicate your previous experience with the Spanish language by answering thefollowing questions.
1) As a child, I spoke Spanish frequently in the home: Yes No
2) As a child, I heard Spanish frequently in the home: Yes No
3) As a child, I spoke Spanish frequently outside of the home: Yes No
4) As a child, I lived in a Spanish speaking country for 2 years
or longer Yes No
5) I speak Spanish or both English and Spanish
when talking with my parents: Yes No
6) My parents often speak to me in Spanish: Yes No
7) My grandparents often speak to me in Spanish: Yes No
8) I speak Spanish when talking to my neighbors and/or relatives: Yes No
9) I speak Spanish when talking with my friends: Yes No
10) At least 30% of my TV viewing/radio listening is in Spanish: Yes No
11) I can understand the main idea when somebody talks to me in Spanish Yes No
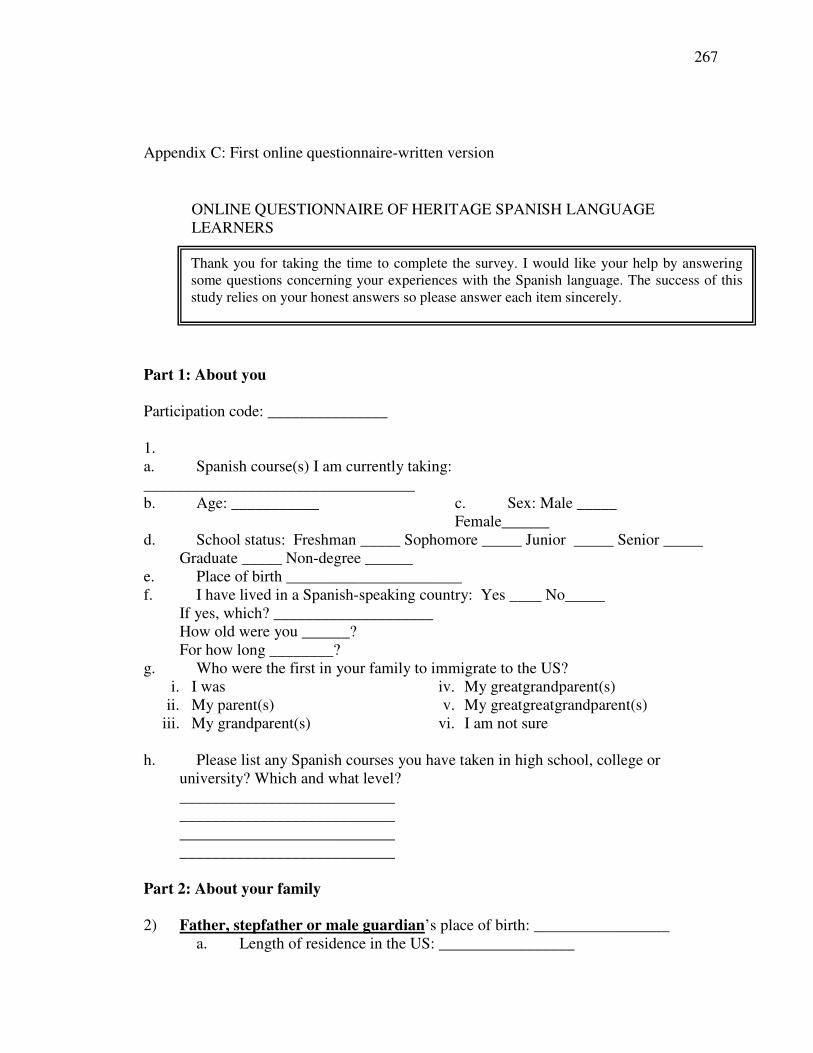
267
Appendix C: First online questionnaire-written version
ONLINE QUESTIONNAIRE OF HERITAGE SPANISH LANGUAGELEARNERS
Part 1: About you
Participation code: _______________
1.a. Spanish course(s) I am currently taking:__________________________________b. Age: ___________ c. Sex: Male _____
Female______d. School status: Freshman _____ Sophomore _____ Junior _____ Senior _____
Graduate _____ Non-degree ______e. Place of birth ______________________f. I have lived in a Spanish-speaking country: Yes ____ No_____
If yes, which? ____________________How old were you ______?For how long ________?
g. Who were the first in your family to immigrate to the US?i. I was
ii. My parent(s)iii. My grandparent(s)
iv. My greatgrandparent(s)v. My greatgreatgrandparent(s)
vi. I am not sure
h. Please list any Spanish courses you have taken in high school, college oruniversity? Which and what level?____________________________________________________________________________________________________________
Part 2: About your family
2) Father, stepfather or male guardian’s place of birth: _________________a. Length of residence in the US: _________________
Thank you for taking the time to complete the survey. I would like your help by answeringsome questions concerning your experiences with the Spanish language. The success of thisstudy relies on your honest answers so please answer each item sincerely.
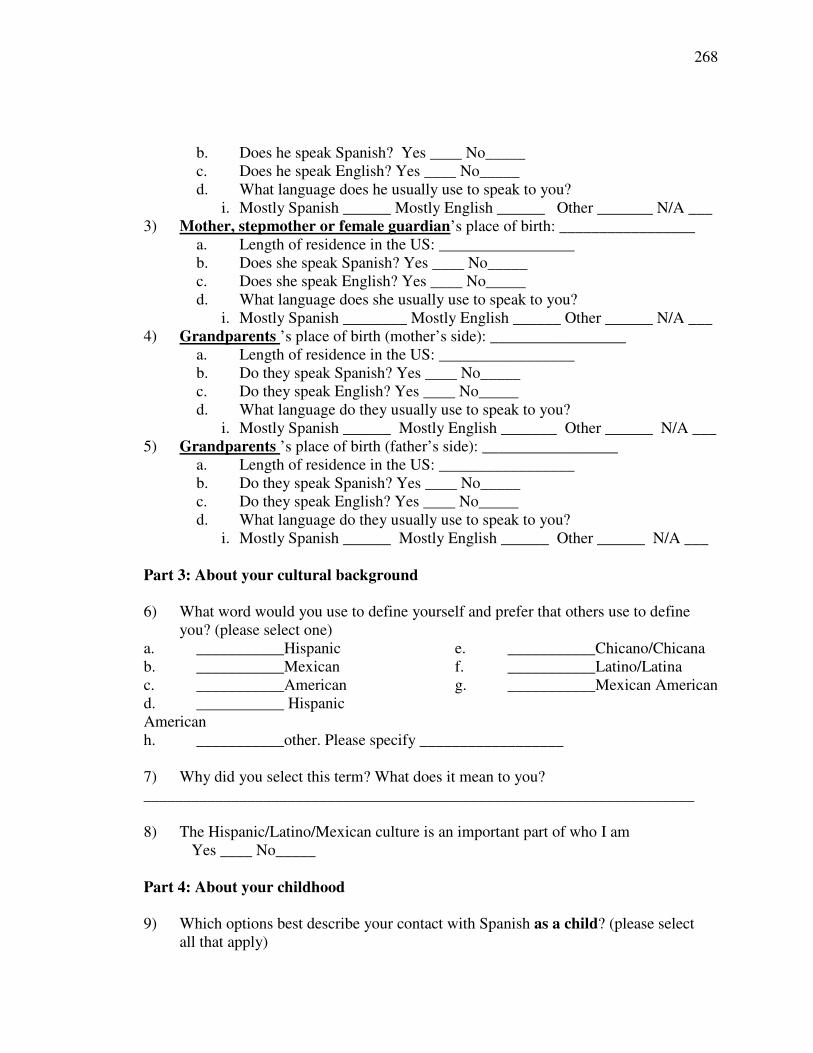
268
b. Does he speak Spanish? Yes ____ No_____c. Does he speak English? Yes ____ No_____d. What language does he usually use to speak to you?
i. Mostly Spanish ______ Mostly English ______ Other _______ N/A ___3) Mother, stepmother or female guardian’s place of birth: _________________
a. Length of residence in the US: _________________b. Does she speak Spanish? Yes ____ No_____c. Does she speak English? Yes ____ No_____d. What language does she usually use to speak to you?
i. Mostly Spanish ________ Mostly English ______ Other ______ N/A ___4) Grandparents ’s place of birth (mother’s side): _________________
a. Length of residence in the US: _________________b. Do they speak Spanish? Yes ____ No_____c. Do they speak English? Yes ____ No_____d. What language do they usually use to speak to you?
i. Mostly Spanish ______ Mostly English _______ Other ______ N/A ___5) Grandparents ’s place of birth (father’s side): _________________
a. Length of residence in the US: _________________b. Do they speak Spanish? Yes ____ No_____c. Do they speak English? Yes ____ No_____d. What language do they usually use to speak to you?
i. Mostly Spanish ______ Mostly English ______ Other ______ N/A ___
Part 3: About your cultural background
6) What word would you use to define yourself and prefer that others use to defineyou? (please select one)
a. ___________Hispanicb. ___________Mexicanc. ___________Americand. ___________ HispanicAmerican
e. ___________Chicano/Chicanaf. ___________Latino/Latinag. ___________Mexican American
h. ___________other. Please specify __________________
7) Why did you select this term? What does it mean to you?_____________________________________________________________________
8) The Hispanic/Latino/Mexican culture is an important part of who I amYes ____ No_____
Part 4: About your childhood
9) Which options best describe your contact with Spanish as a child? (please selectall that apply)
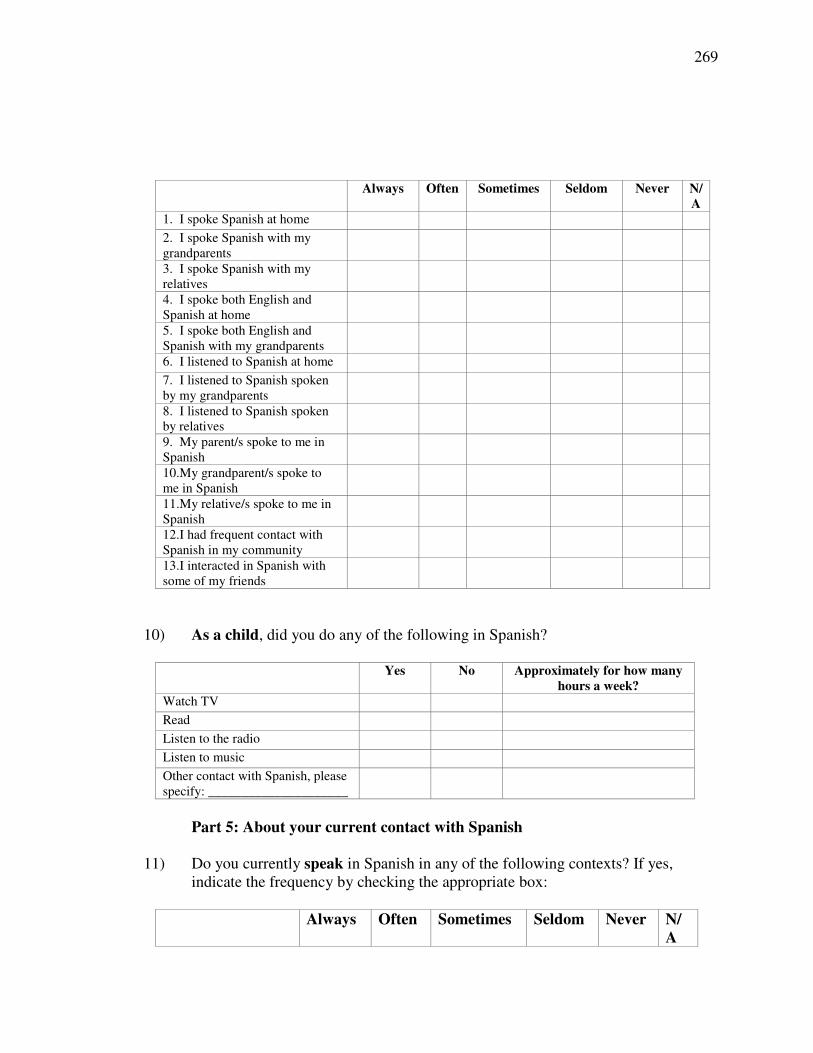
269
Always Often Sometimes Seldom Never N/A
1. I spoke Spanish at home
2. I spoke Spanish with mygrandparents3. I spoke Spanish with myrelatives4. I spoke both English andSpanish at home5. I spoke both English andSpanish with my grandparents6. I listened to Spanish at home
7. I listened to Spanish spokenby my grandparents8. I listened to Spanish spokenby relatives9. My parent/s spoke to me inSpanish10.My grandparent/s spoke tome in Spanish11.My relative/s spoke to me inSpanish12.I had frequent contact withSpanish in my community13.I interacted in Spanish withsome of my friends
10) As a child, did you do any of the following in Spanish?
Yes No Approximately for how manyhours a week?
Watch TV
Read
Listen to the radio
Listen to music
Other contact with Spanish, pleasespecify: _____________________
Part 5: About your current contact with Spanish
11) Do you currently speak in Spanish in any of the following contexts? If yes,indicate the frequency by checking the appropriate box:
Always Often Sometimes Seldom Never N/A
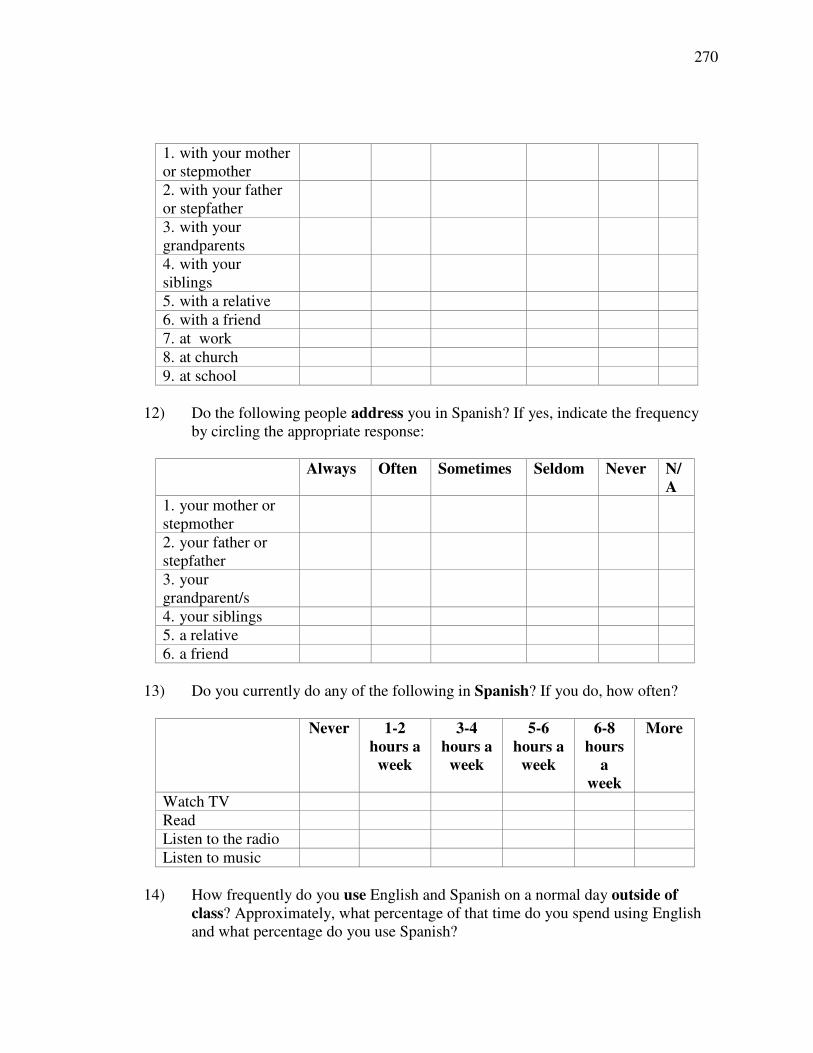
270
1. with your motheror stepmother2. with your fatheror stepfather3. with yourgrandparents4. with yoursiblings5. with a relative6. with a friend7. at work8. at church9. at school
12) Do the following people address you in Spanish? If yes, indicate the frequencyby circling the appropriate response:
Always Often Sometimes Seldom Never N/A
1. your mother orstepmother2. your father orstepfather3. yourgrandparent/s4. your siblings5. a relative6. a friend
13) Do you currently do any of the following in Spanish? If you do, how often?
Never 1-2hours a
week
3-4hours a
week
5-6hours a
week
6-8hours
aweek
More
Watch TVReadListen to the radioListen to music
14) How frequently do you use English and Spanish on a normal day outside ofclass? Approximately, what percentage of that time do you spend using Englishand what percentage do you use Spanish?
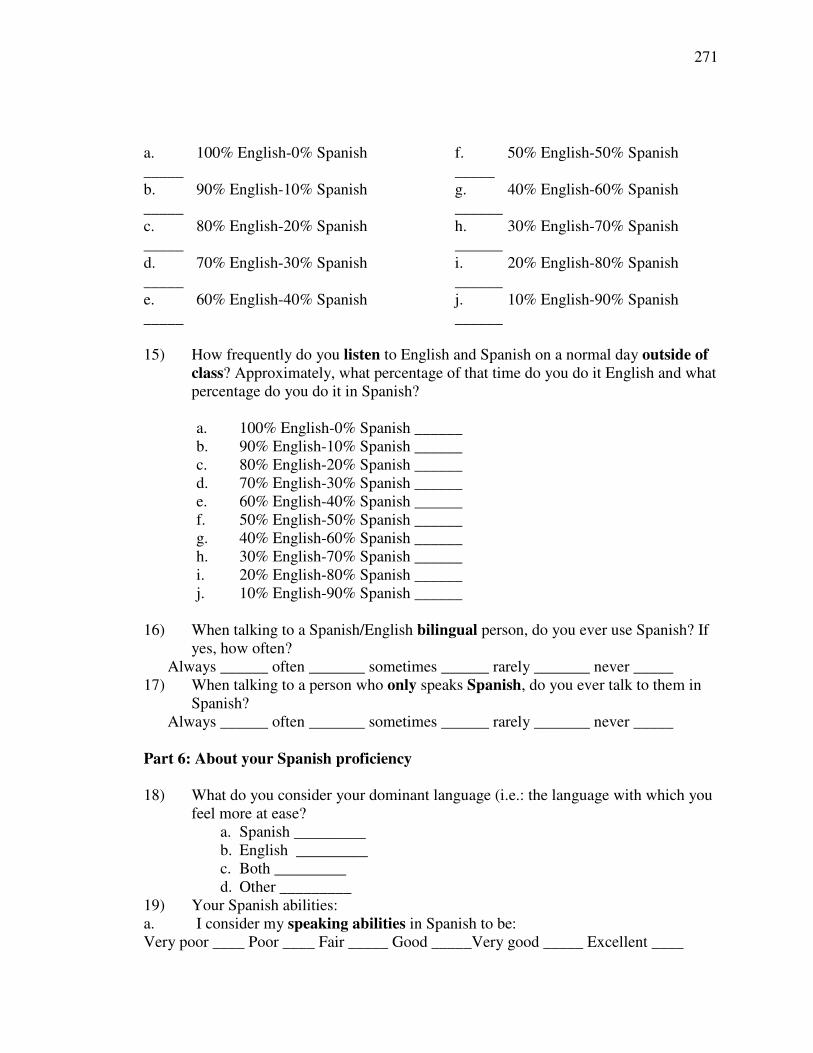
271
a. 100% English-0% Spanish_____b. 90% English-10% Spanish_____c. 80% English-20% Spanish_____d. 70% English-30% Spanish_____e. 60% English-40% Spanish_____
f. 50% English-50% Spanish_____g. 40% English-60% Spanish______h. 30% English-70% Spanish______i. 20% English-80% Spanish______j. 10% English-90% Spanish______
15) How frequently do you listen to English and Spanish on a normal day outside ofclass? Approximately, what percentage of that time do you do it English and whatpercentage do you do it in Spanish?
a. 100% English-0% Spanish ______b. 90% English-10% Spanish ______c. 80% English-20% Spanish ______d. 70% English-30% Spanish ______e. 60% English-40% Spanish ______f. 50% English-50% Spanish ______g. 40% English-60% Spanish ______h. 30% English-70% Spanish ______i. 20% English-80% Spanish ______j. 10% English-90% Spanish ______
16) When talking to a Spanish/English bilingual person, do you ever use Spanish? Ifyes, how often?
Always ______ often _______ sometimes ______ rarely _______ never _____17) When talking to a person who only speaks Spanish, do you ever talk to them in
Spanish?Always ______ often _______ sometimes ______ rarely _______ never _____
Part 6: About your Spanish proficiency
18) What do you consider your dominant language (i.e.: the language with which youfeel more at ease?
a. Spanish _________b. English _________c. Both _________d. Other _________
19) Your Spanish abilities:a. I consider my speaking abilities in Spanish to be:Very poor ____ Poor ____ Fair _____ Good _____Very good _____ Excellent ____
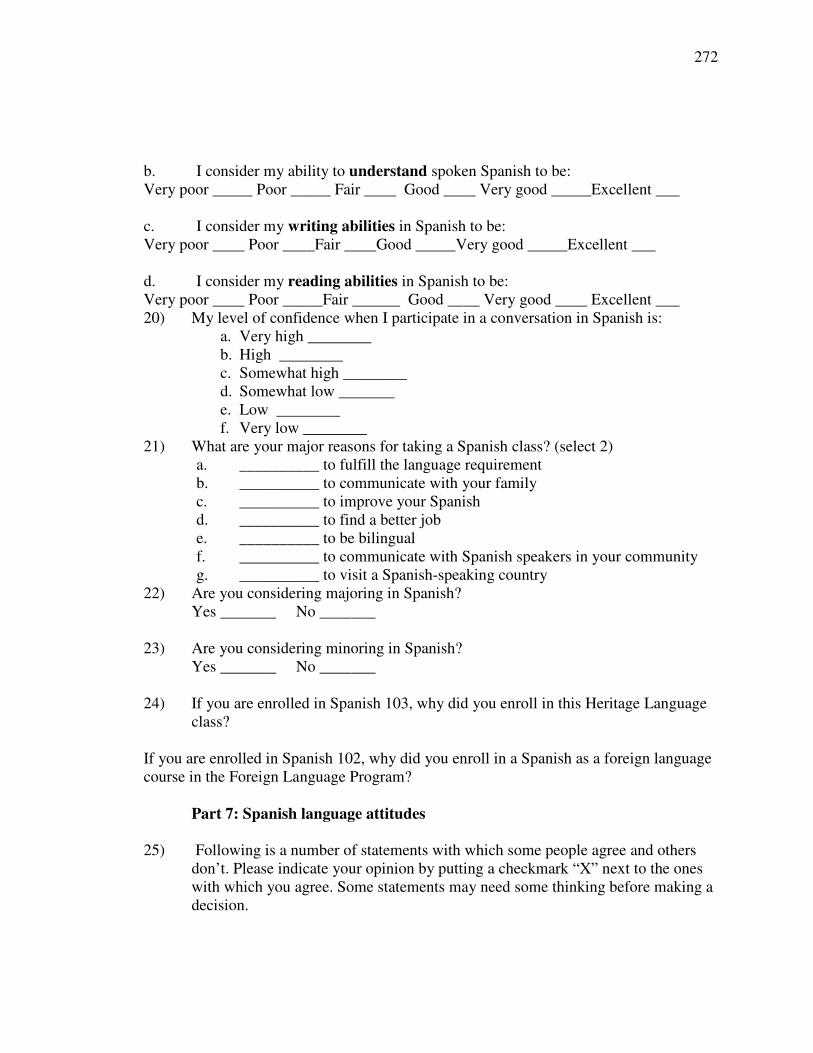
272
b. I consider my ability to understand spoken Spanish to be:Very poor _____ Poor _____ Fair ____ Good ____ Very good _____Excellent ___
c. I consider my writing abilities in Spanish to be:Very poor ____ Poor ____Fair ____Good _____Very good _____Excellent ___
d. I consider my reading abilities in Spanish to be:Very poor ____ Poor _____Fair ______ Good ____ Very good ____ Excellent ___20) My level of confidence when I participate in a conversation in Spanish is:
a. Very high ________b. High ________c. Somewhat high ________d. Somewhat low _______e. Low ________f. Very low ________
21) What are your major reasons for taking a Spanish class? (select 2)a. __________ to fulfill the language requirementb. __________ to communicate with your familyc. __________ to improve your Spanishd. __________ to find a better jobe. __________ to be bilingualf. __________ to communicate with Spanish speakers in your communityg. __________ to visit a Spanish-speaking country
22) Are you considering majoring in Spanish?Yes _______ No _______
23) Are you considering minoring in Spanish?Yes _______ No _______
24) If you are enrolled in Spanish 103, why did you enroll in this Heritage Languageclass?
If you are enrolled in Spanish 102, why did you enroll in a Spanish as a foreign languagecourse in the Foreign Language Program?
Part 7: Spanish language attitudes
25) Following is a number of statements with which some people agree and othersdon’t. Please indicate your opinion by putting a checkmark “X” next to the oneswith which you agree. Some statements may need some thinking before making adecision.
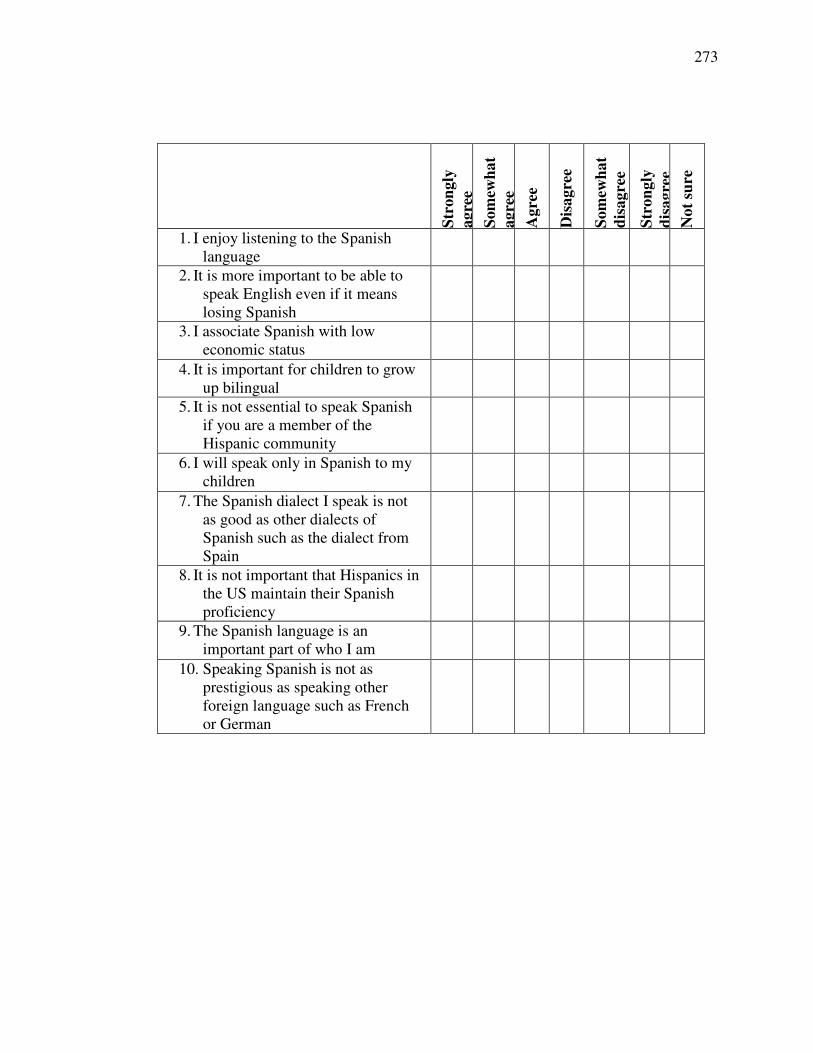
273
Stro
ngly
agre
eSo
mew
hat
agre
e
Agr
ee
Dis
agre
e
Som
ewha
tdi
sagr
ee
Stro
ngly
disa
gree
Not
sure
1. I enjoy listening to the Spanishlanguage
2. It is more important to be able tospeak English even if it meanslosing Spanish
3. I associate Spanish with loweconomic status
4. It is important for children to growup bilingual
5. It is not essential to speak Spanishif you are a member of theHispanic community
6. I will speak only in Spanish to mychildren
7. The Spanish dialect I speak is notas good as other dialects ofSpanish such as the dialect fromSpain
8. It is not important that Hispanics inthe US maintain their Spanishproficiency
9. The Spanish language is animportant part of who I am
10. Speaking Spanish is not asprestigious as speaking otherforeign language such as Frenchor German
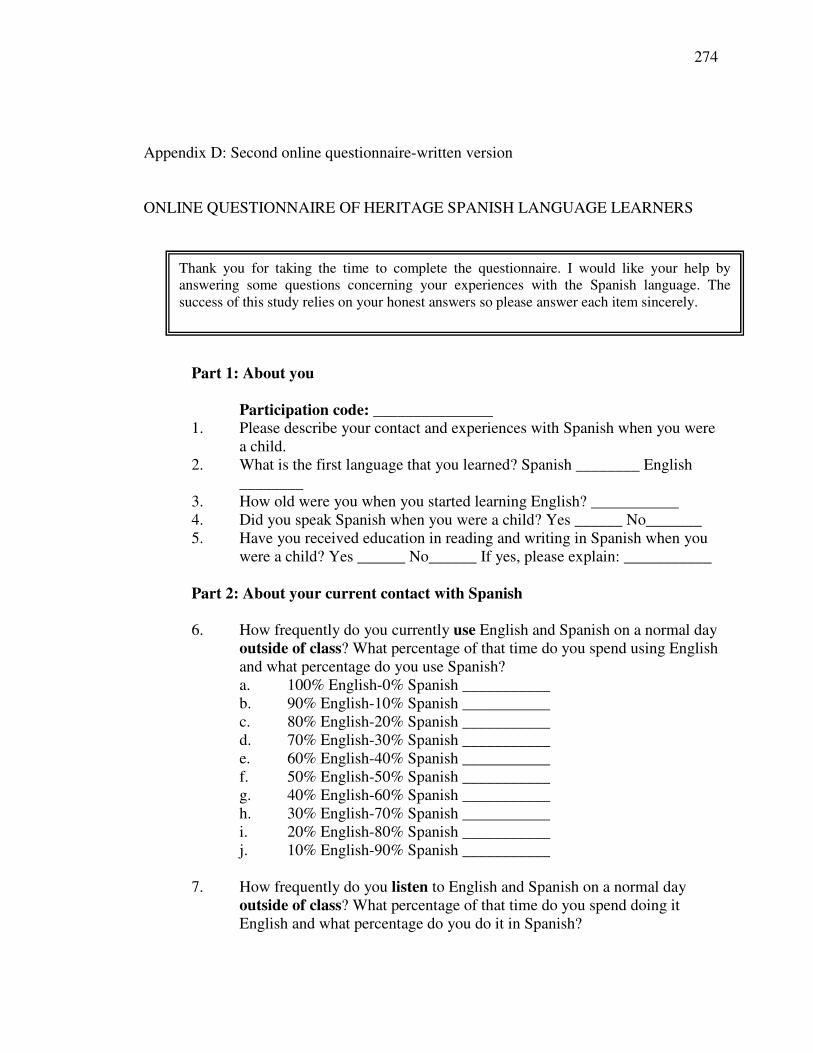
274
Appendix D: Second online questionnaire-written version
ONLINE QUESTIONNAIRE OF HERITAGE SPANISH LANGUAGE LEARNERS
Part 1: About you
Participation code: _______________1. Please describe your contact and experiences with Spanish when you were
a child.2. What is the first language that you learned? Spanish ________ English
________3. How old were you when you started learning English? ___________4. Did you speak Spanish when you were a child? Yes ______ No_______5. Have you received education in reading and writing in Spanish when you
were a child? Yes ______ No______ If yes, please explain: ___________
Part 2: About your current contact with Spanish
6. How frequently do you currently use English and Spanish on a normal dayoutside of class? What percentage of that time do you spend using Englishand what percentage do you use Spanish?a. 100% English-0% Spanish ___________b. 90% English-10% Spanish ___________c. 80% English-20% Spanish ___________d. 70% English-30% Spanish ___________e. 60% English-40% Spanish ___________f. 50% English-50% Spanish ___________g. 40% English-60% Spanish ___________h. 30% English-70% Spanish ___________i. 20% English-80% Spanish ___________j. 10% English-90% Spanish ___________
7. How frequently do you listen to English and Spanish on a normal dayoutside of class? What percentage of that time do you spend doing itEnglish and what percentage do you do it in Spanish?
Thank you for taking the time to complete the questionnaire. I would like your help byanswering some questions concerning your experiences with the Spanish language. Thesuccess of this study relies on your honest answers so please answer each item sincerely.
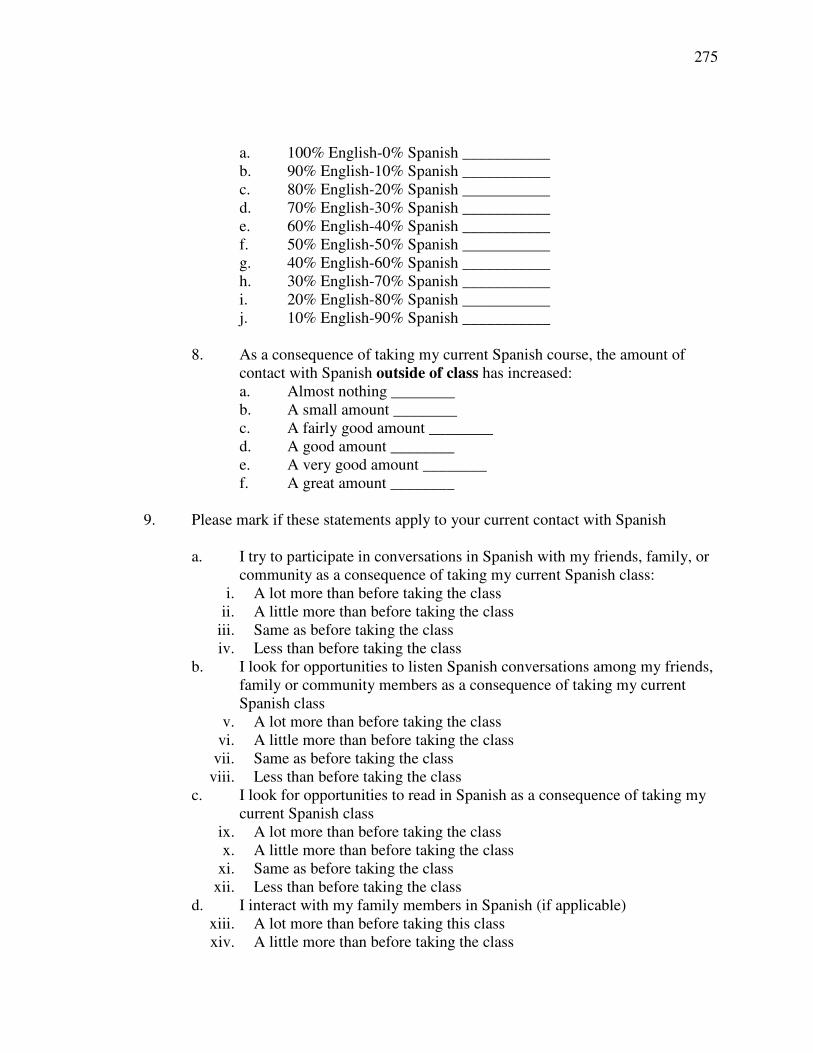
275
a. 100% English-0% Spanish ___________b. 90% English-10% Spanish ___________c. 80% English-20% Spanish ___________d. 70% English-30% Spanish ___________e. 60% English-40% Spanish ___________f. 50% English-50% Spanish ___________g. 40% English-60% Spanish ___________h. 30% English-70% Spanish ___________i. 20% English-80% Spanish ___________j. 10% English-90% Spanish ___________
8. As a consequence of taking my current Spanish course, the amount ofcontact with Spanish outside of class has increased:a. Almost nothing ________b. A small amount ________c. A fairly good amount ________d. A good amount ________e. A very good amount ________f. A great amount ________
9. Please mark if these statements apply to your current contact with Spanish
a. I try to participate in conversations in Spanish with my friends, family, orcommunity as a consequence of taking my current Spanish class:
i. A lot more than before taking the classii. A little more than before taking the class
iii. Same as before taking the classiv. Less than before taking the class
b. I look for opportunities to listen Spanish conversations among my friends,family or community members as a consequence of taking my currentSpanish class
v. A lot more than before taking the classvi. A little more than before taking the class
vii. Same as before taking the classviii. Less than before taking the class
c. I look for opportunities to read in Spanish as a consequence of taking mycurrent Spanish class
ix. A lot more than before taking the classx. A little more than before taking the class
xi. Same as before taking the classxii. Less than before taking the class
d. I interact with my family members in Spanish (if applicable)xiii. A lot more than before taking this classxiv. A little more than before taking the class
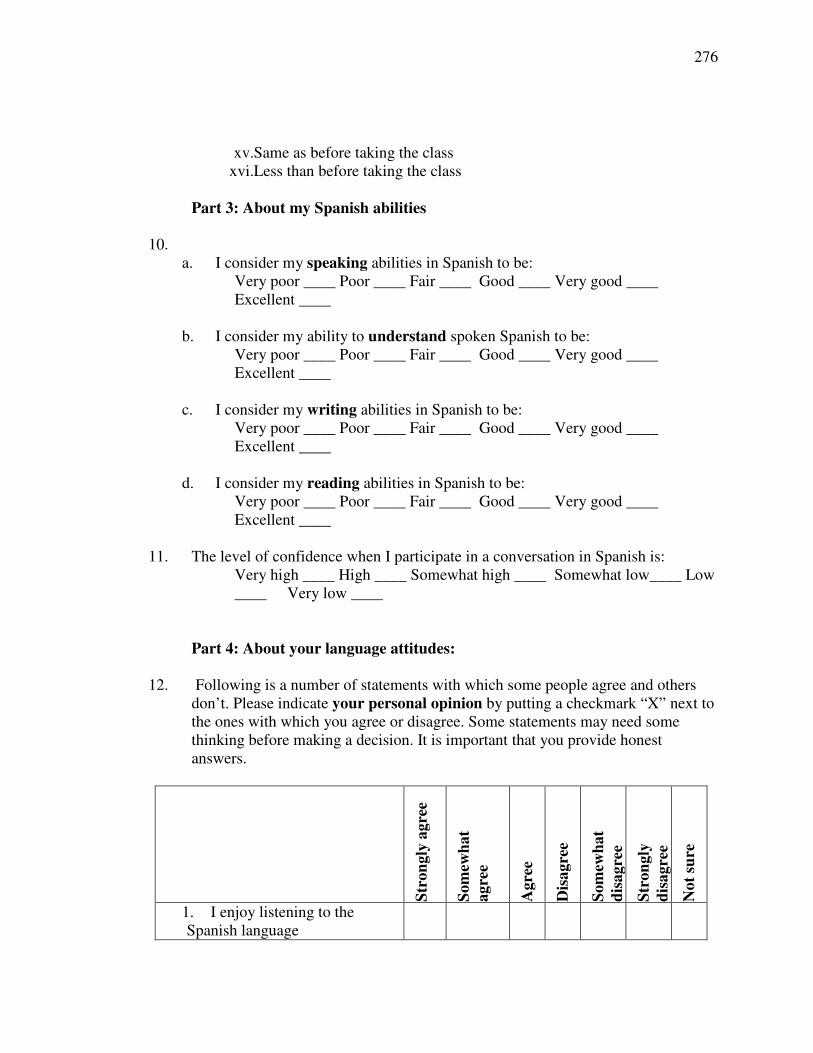
276
xv.Same as before taking the classxvi.Less than before taking the class
Part 3: About my Spanish abilities
10.a. I consider my speaking abilities in Spanish to be:
Very poor ____ Poor ____ Fair ____ Good ____ Very good ____Excellent ____
b. I consider my ability to understand spoken Spanish to be:Very poor ____ Poor ____ Fair ____ Good ____ Very good ____Excellent ____
c. I consider my writing abilities in Spanish to be:Very poor ____ Poor ____ Fair ____ Good ____ Very good ____Excellent ____
d. I consider my reading abilities in Spanish to be:Very poor ____ Poor ____ Fair ____ Good ____ Very good ____Excellent ____
11. The level of confidence when I participate in a conversation in Spanish is:Very high ____ High ____ Somewhat high ____ Somewhat low____ Low____ Very low ____
Part 4: About your language attitudes:
12. Following is a number of statements with which some people agree and othersdon’t. Please indicate your personal opinion by putting a checkmark “X” next tothe ones with which you agree or disagree. Some statements may need somethinking before making a decision. It is important that you provide honestanswers.
Stro
ngly
agre
e
Som
ewha
tag
ree
Agr
ee
Dis
agre
e
Som
ewha
tdi
sagr
ee
Stro
ngly
disa
gree
Not
sure
1. I enjoy listening to theSpanish language
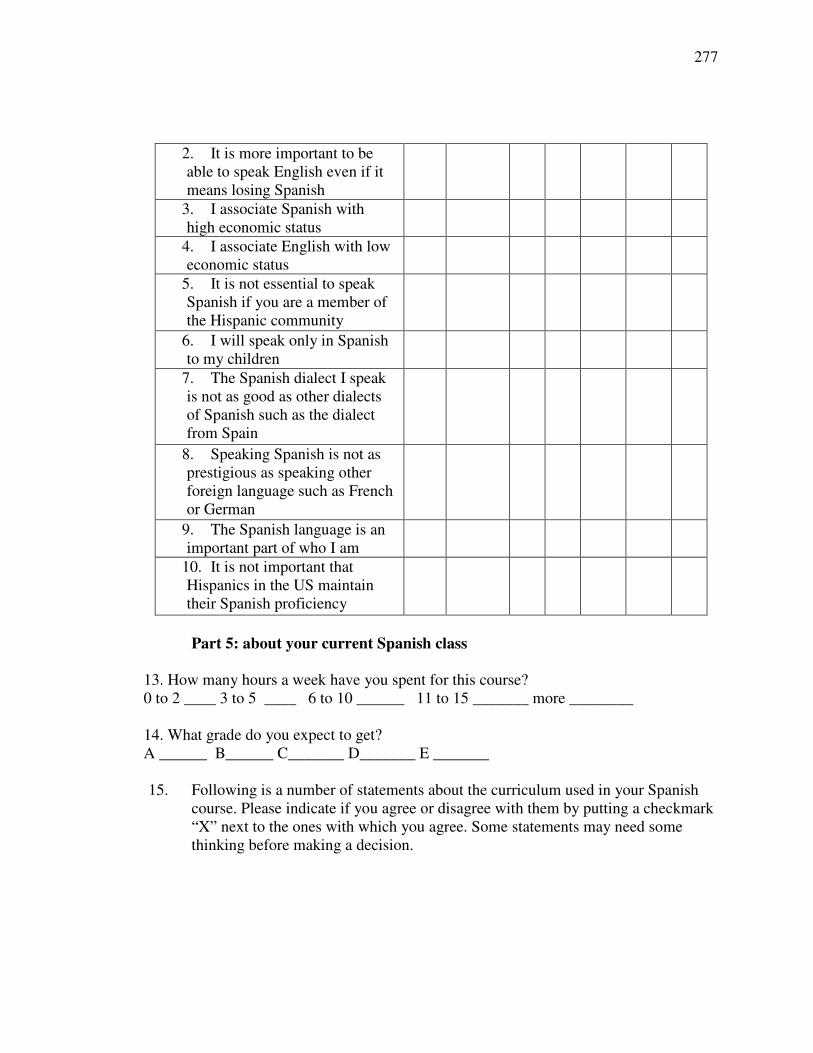
277
2. It is more important to beable to speak English even if itmeans losing Spanish
3. I associate Spanish withhigh economic status
4. I associate English with loweconomic status
5. It is not essential to speakSpanish if you are a member ofthe Hispanic community
6. I will speak only in Spanishto my children
7. The Spanish dialect I speakis not as good as other dialectsof Spanish such as the dialectfrom Spain
8. Speaking Spanish is not asprestigious as speaking otherforeign language such as Frenchor German
9. The Spanish language is animportant part of who I am
10. It is not important thatHispanics in the US maintaintheir Spanish proficiency
Part 5: about your current Spanish class
13. How many hours a week have you spent for this course?0 to 2 ____ 3 to 5 ____ 6 to 10 ______ 11 to 15 _______ more ________
14. What grade do you expect to get?A ______ B______ C_______ D_______ E _______
15. Following is a number of statements about the curriculum used in your Spanishcourse. Please indicate if you agree or disagree with them by putting a checkmark“X” next to the ones with which you agree. Some statements may need somethinking before making a decision.
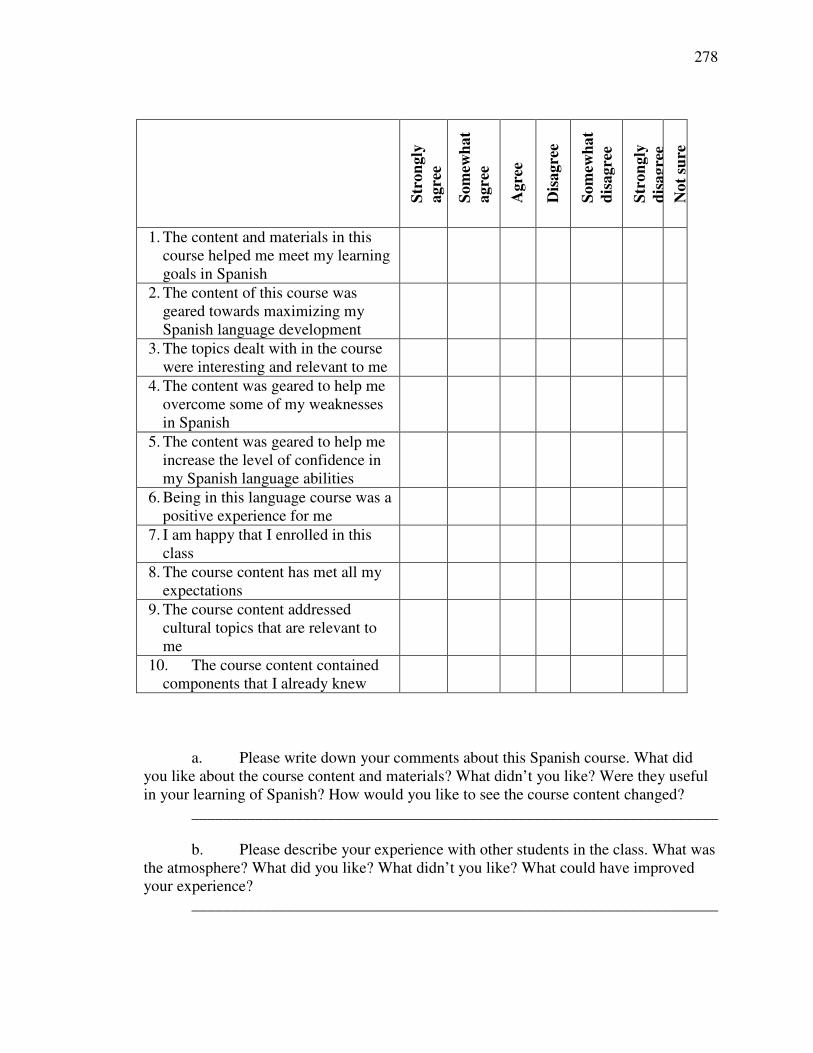
278
a. Please write down your comments about this Spanish course. What didyou like about the course content and materials? What didn’t you like? Were they usefulin your learning of Spanish? How would you like to see the course content changed?
__________________________________________________________________
b. Please describe your experience with other students in the class. What wasthe atmosphere? What did you like? What didn’t you like? What could have improvedyour experience?
__________________________________________________________________
Stro
ngly
agre
e
Som
ewha
tag
ree
Agr
ee
Dis
agre
e
Som
ewha
tdi
sagr
ee
Stro
ngly
disa
gree
Not
sure
1. The content and materials in thiscourse helped me meet my learninggoals in Spanish
2. The content of this course wasgeared towards maximizing mySpanish language development
3. The topics dealt with in the coursewere interesting and relevant to me
4. The content was geared to help meovercome some of my weaknessesin Spanish
5. The content was geared to help meincrease the level of confidence inmy Spanish language abilities
6. Being in this language course was apositive experience for me
7. I am happy that I enrolled in thisclass
8. The course content has met all myexpectations
9. The course content addressedcultural topics that are relevant tome
10. The course content containedcomponents that I already knew
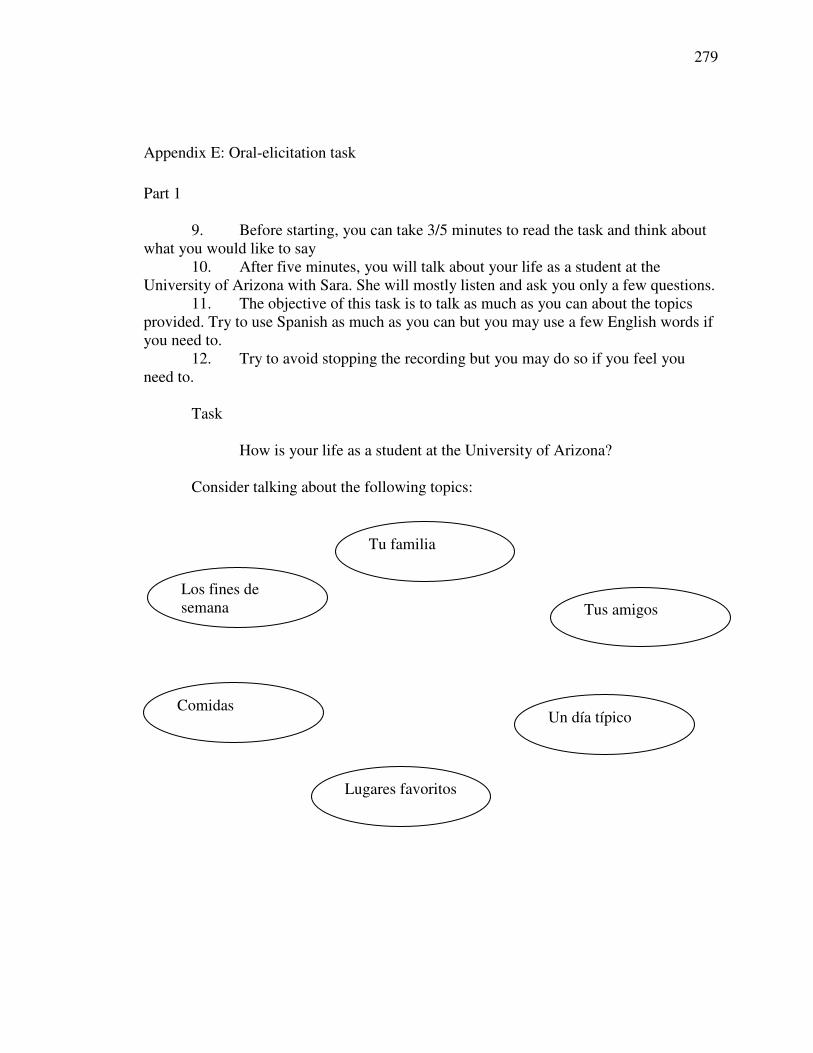
279
Appendix E: Oral-elicitation task
Part 1
9. Before starting, you can take 3/5 minutes to read the task and think aboutwhat you would like to say
10. After five minutes, you will talk about your life as a student at theUniversity of Arizona with Sara. She will mostly listen and ask you only a few questions.
11. The objective of this task is to talk as much as you can about the topicsprovided. Try to use Spanish as much as you can but you may use a few English words ifyou need to.
12. Try to avoid stopping the recording but you may do so if you feel youneed to.
Task
How is your life as a student at the University of Arizona?
Consider talking about the following topics:
Un día típico
Tu familia
Tus amigos
Comidas
Los fines desemana
Lugares favoritos
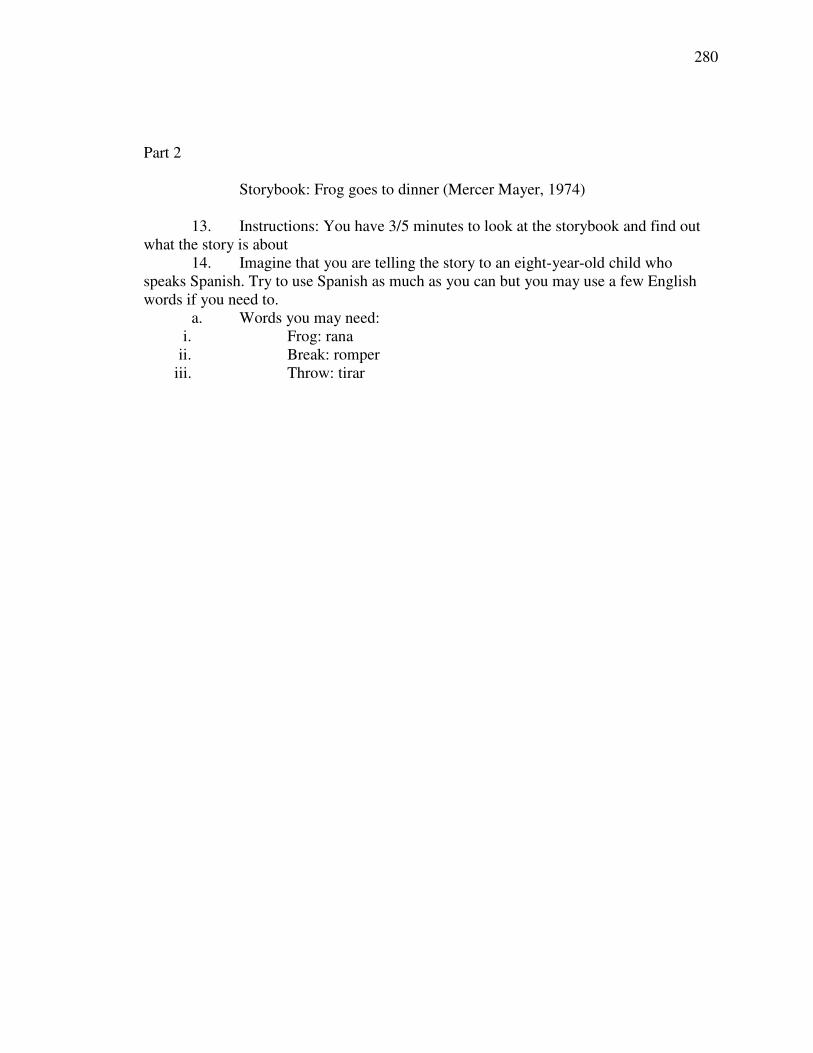
280
Part 2
Storybook: Frog goes to dinner (Mercer Mayer, 1974)
13. Instructions: You have 3/5 minutes to look at the storybook and find outwhat the story is about
14. Imagine that you are telling the story to an eight-year-old child whospeaks Spanish. Try to use Spanish as much as you can but you may use a few Englishwords if you need to.
a. Words you may need:i. Frog: rana
ii. Break: romperiii. Throw: tirar
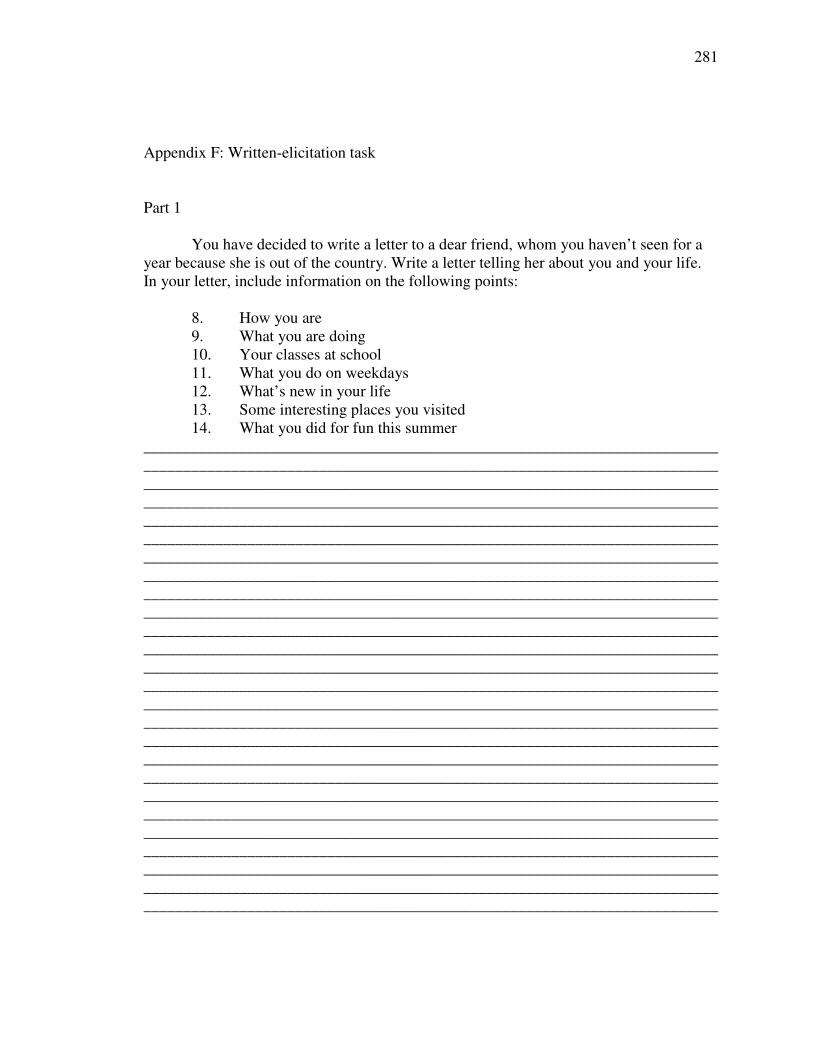
281
Appendix F: Written-elicitation task
Part 1
You have decided to write a letter to a dear friend, whom you haven’t seen for ayear because she is out of the country. Write a letter telling her about you and your life.In your letter, include information on the following points:
8. How you are9. What you are doing10. Your classes at school11. What you do on weekdays12. What’s new in your life13. Some interesting places you visited14. What you did for fun this summer
________________________________________________________________________________________________________________________________________________________________________________________________________________________________________________________________________________________________________________________________________________________________________________________________________________________________________________________________________________________________________________________________________________________________________________________________________________________________________________________________________________________________________________________________________________________________________________________________________________________________________________________________________________________________________________________________________________________________________________________________________________________________________________________________________________________________________________________________________________________________________________________________________________________________________________________________________________________________________________________________________________________________________________________________________________________________________________________________________________________________________________________________________________________________________________________________________________________________________________________________________________________________________________________________________________________________________________________________________________________________________________________________________________________________________________________________________________

282
Part 2
Storybook: One frog too many (Mercer Mayer, 1975)
15. Instructions: You have 3/5 minutes to look at the storybook and find outwhat the story is about
16. Imagine that you are writing the story to an eight-year-old child whospeaks Spanish. Try to use Spanish as much as you can but you may use a few Englishwords if you need to.
a. Words you may need:i. Frog: rana
ii. Present: regaloiii. Lose: perderiv. Bite: morder
________________________________________________________________________________________________________________________________________________________________________________________________________________________________________________________________________________________________________________________________________________________________________________________________________________________________________________________________________________________________________________________________________________________________________________________________________________________________________________________________________________________________________________________________________________________________________________________________________________________________________________________________________________________________________________________________________________________________________________________________________________________________________________________________________________________________________________________________________________________________________________________________________________________________________________________________________________________________________________________________________________________________________________________________________________________________________________________________________________________________________________________________________________________________________________________________________________________________________________________________________________________________________________________________________________________________________________________________________________________________________________________________________________________________________________________________________________
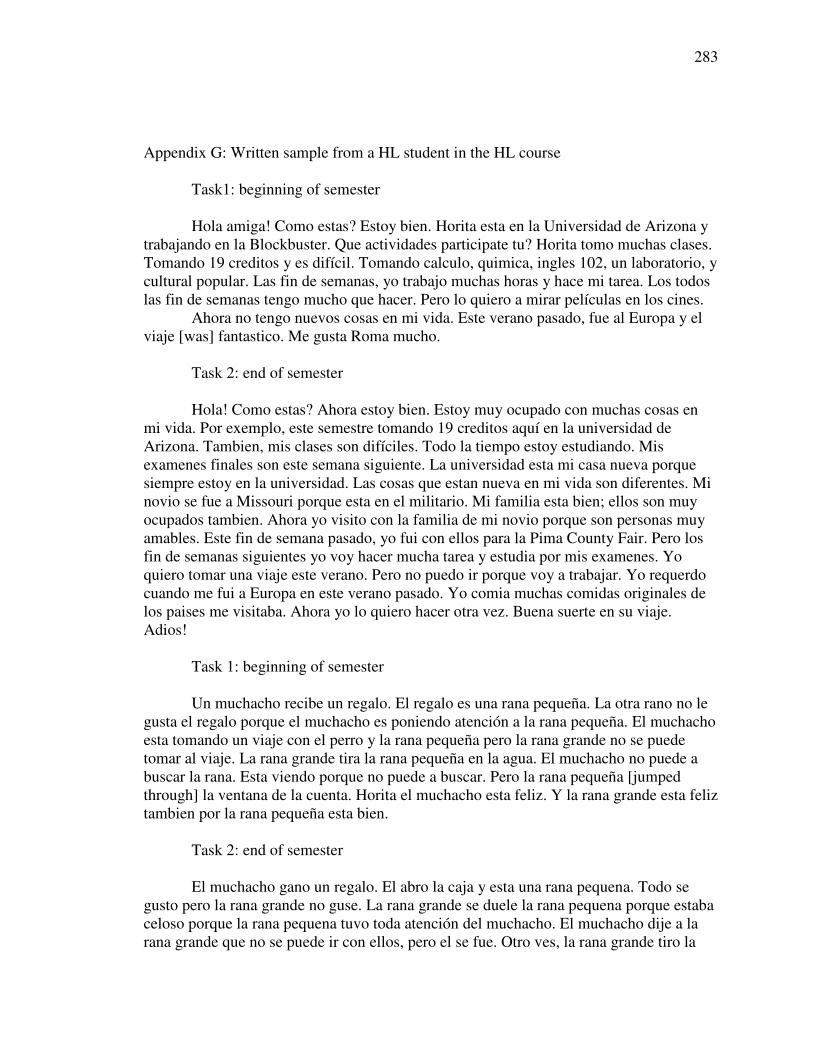
283
Appendix G: Written sample from a HL student in the HL course
Task1: beginning of semester
Hola amiga! Como estas? Estoy bien. Horita esta en la Universidad de Arizona ytrabajando en la Blockbuster. Que actividades participate tu? Horita tomo muchas clases.Tomando 19 creditos y es difícil. Tomando calculo, quimica, ingles 102, un laboratorio, ycultural popular. Las fin de semanas, yo trabajo muchas horas y hace mi tarea. Los todoslas fin de semanas tengo mucho que hacer. Pero lo quiero a mirar películas en los cines.
Ahora no tengo nuevos cosas en mi vida. Este verano pasado, fue al Europa y elviaje [was] fantastico. Me gusta Roma mucho.
Task 2: end of semester
Hola! Como estas? Ahora estoy bien. Estoy muy ocupado con muchas cosas enmi vida. Por exemplo, este semestre tomando 19 creditos aquí en la universidad deArizona. Tambien, mis clases son difíciles. Todo la tiempo estoy estudiando. Misexamenes finales son este semana siguiente. La universidad esta mi casa nueva porquesiempre estoy en la universidad. Las cosas que estan nueva en mi vida son diferentes. Minovio se fue a Missouri porque esta en el militario. Mi familia esta bien; ellos son muyocupados tambien. Ahora yo visito con la familia de mi novio porque son personas muyamables. Este fin de semana pasado, yo fui con ellos para la Pima County Fair. Pero losfin de semanas siguientes yo voy hacer mucha tarea y estudia por mis examenes. Yoquiero tomar una viaje este verano. Pero no puedo ir porque voy a trabajar. Yo requerdocuando me fui a Europa en este verano pasado. Yo comia muchas comidas originales delos paises me visitaba. Ahora yo lo quiero hacer otra vez. Buena suerte en su viaje.Adios!
Task 1: beginning of semester
Un muchacho recibe un regalo. El regalo es una rana pequeña. La otra rano no legusta el regalo porque el muchacho es poniendo atención a la rana pequeña. El muchachoesta tomando un viaje con el perro y la rana pequeña pero la rana grande no se puedetomar al viaje. La rana grande tira la rana pequeña en la agua. El muchacho no puede abuscar la rana. Esta viendo porque no puede a buscar. Pero la rana pequeña [jumpedthrough] la ventana de la cuenta. Horita el muchacho esta feliz. Y la rana grande esta feliztambien por la rana pequeña esta bien.
Task 2: end of semester
El muchacho gano un regalo. El abro la caja y esta una rana pequena. Todo segusto pero la rana grande no guse. La rana grande se duele la rana pequena porque estabaceloso porque la rana pequena tuvo toda atención del muchacho. El muchacho dije a larana grande que no se puede ir con ellos, pero el se fue. Otro ves, la rana grande tiro la
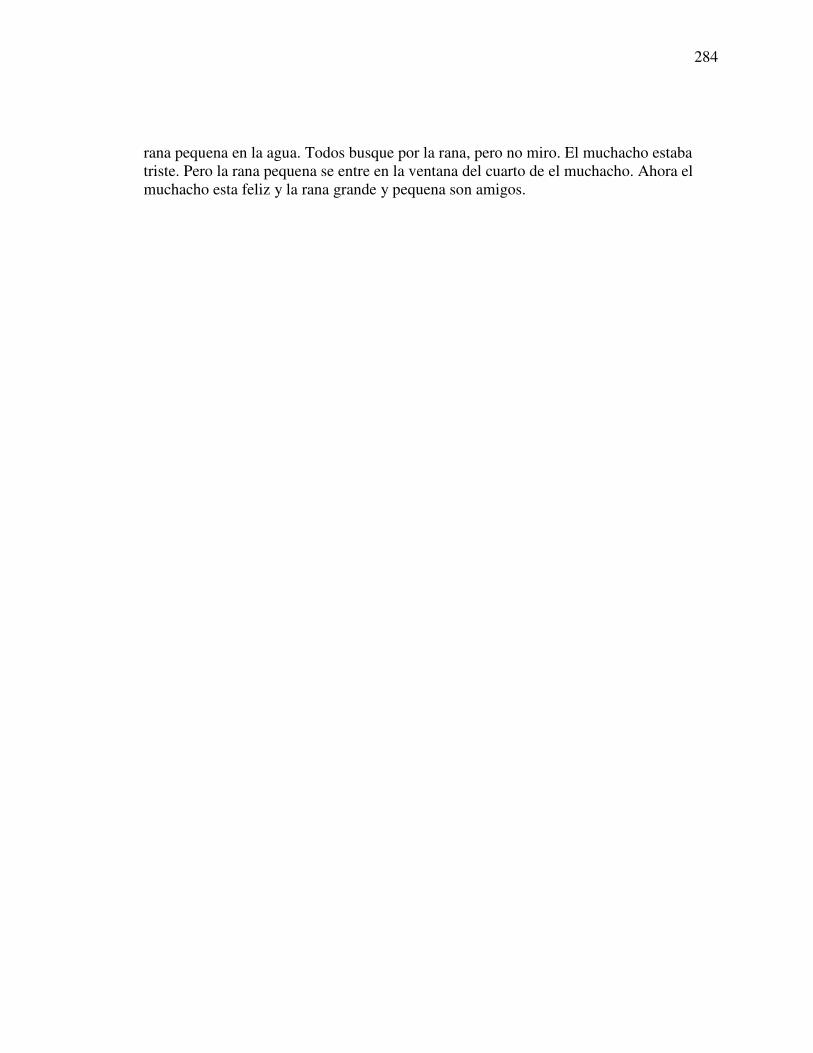
284
rana pequena en la agua. Todos busque por la rana, pero no miro. El muchacho estabatriste. Pero la rana pequena se entre en la ventana del cuarto de el muchacho. Ahora elmuchacho esta feliz y la rana grande y pequena son amigos.
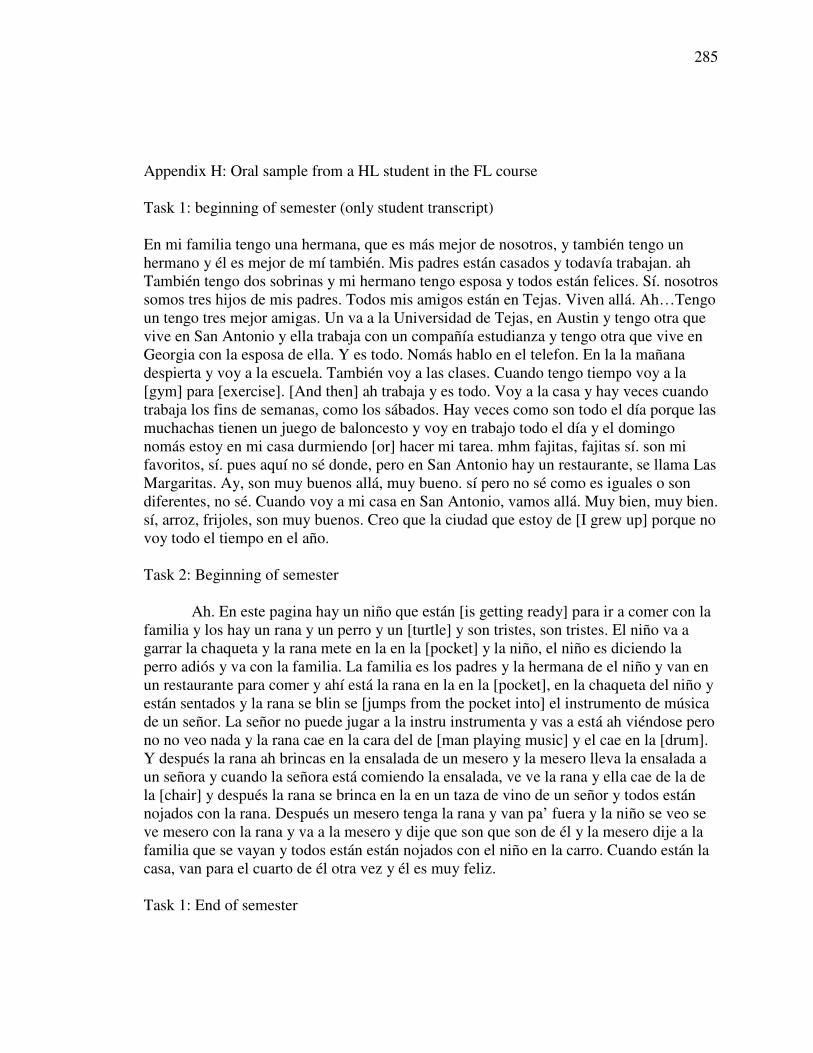
285
Appendix H: Oral sample from a HL student in the FL course
Task 1: beginning of semester (only student transcript)
En mi familia tengo una hermana, que es más mejor de nosotros, y también tengo unhermano y él es mejor de mí también. Mis padres están casados y todavía trabajan. ahTambién tengo dos sobrinas y mi hermano tengo esposa y todos están felices. Sí. nosotrossomos tres hijos de mis padres. Todos mis amigos están en Tejas. Viven allá. Ah…Tengoun tengo tres mejor amigas. Un va a la Universidad de Tejas, en Austin y tengo otra quevive en San Antonio y ella trabaja con un compañía estudianza y tengo otra que vive enGeorgia con la esposa de ella. Y es todo. Nomás hablo en el telefon. En la la mañanadespierta y voy a la escuela. También voy a las clases. Cuando tengo tiempo voy a la[gym] para [exercise]. [And then] ah trabaja y es todo. Voy a la casa y hay veces cuandotrabaja los fins de semanas, como los sábados. Hay veces como son todo el día porque lasmuchachas tienen un juego de baloncesto y voy en trabajo todo el día y el domingonomás estoy en mi casa durmiendo [or] hacer mi tarea. mhm fajitas, fajitas sí. son mifavoritos, sí. pues aquí no sé donde, pero en San Antonio hay un restaurante, se llama LasMargaritas. Ay, son muy buenos allá, muy bueno. sí pero no sé como es iguales o sondiferentes, no sé. Cuando voy a mi casa en San Antonio, vamos allá. Muy bien, muy bien.sí, arroz, frijoles, son muy buenos. Creo que la ciudad que estoy de [I grew up] porque novoy todo el tiempo en el año.
Task 2: Beginning of semester
Ah. En este pagina hay un niño que están [is getting ready] para ir a comer con lafamilia y los hay un rana y un perro y un [turtle] y son tristes, son tristes. El niño va agarrar la chaqueta y la rana mete en la en la [pocket] y la niño, el niño es diciendo laperro adiós y va con la familia. La familia es los padres y la hermana de el niño y van enun restaurante para comer y ahí está la rana en la en la [pocket], en la chaqueta del niño yestán sentados y la rana se blin se [jumps from the pocket into] el instrumento de músicade un señor. La señor no puede jugar a la instru instrumenta y vas a está ah viéndose perono no veo nada y la rana cae en la cara del de [man playing music] y el cae en la [drum].Y después la rana ah brincas en la ensalada de un mesero y la mesero lleva la ensalada aun señora y cuando la señora está comiendo la ensalada, ve ve la rana y ella cae de la dela [chair] y después la rana se brinca en la en un taza de vino de un señor y todos estánnojados con la rana. Después un mesero tenga la rana y van pa’ fuera y la niño se veo seve mesero con la rana y va a la mesero y dije que son que son de él y la mesero dije a lafamilia que se vayan y todos están están nojados con el niño en la carro. Cuando están lacasa, van para el cuarto de él otra vez y él es muy feliz.
Task 1: End of semester
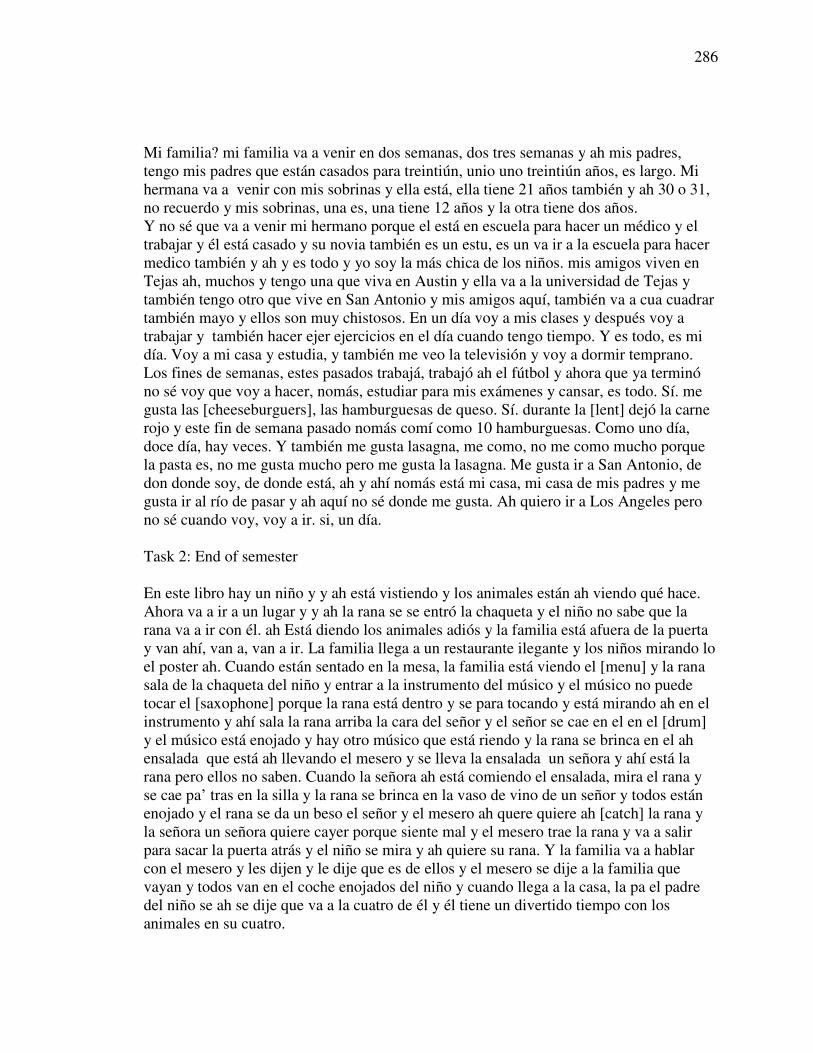
286
Mi familia? mi familia va a venir en dos semanas, dos tres semanas y ah mis padres,tengo mis padres que están casados para treintiún, unio uno treintiún años, es largo. Mihermana va a venir con mis sobrinas y ella está, ella tiene 21 años también y ah 30 o 31,no recuerdo y mis sobrinas, una es, una tiene 12 años y la otra tiene dos años.Y no sé que va a venir mi hermano porque el está en escuela para hacer un médico y eltrabajar y él está casado y su novia también es un estu, es un va ir a la escuela para hacermedico también y ah y es todo y yo soy la más chica de los niños. mis amigos viven enTejas ah, muchos y tengo una que viva en Austin y ella va a la universidad de Tejas ytambién tengo otro que vive en San Antonio y mis amigos aquí, también va a cua cuadrartambién mayo y ellos son muy chistosos. En un día voy a mis clases y después voy atrabajar y también hacer ejer ejercicios en el día cuando tengo tiempo. Y es todo, es midía. Voy a mi casa y estudia, y también me veo la televisión y voy a dormir temprano.Los fines de semanas, estes pasados trabajá, trabajó ah el fútbol y ahora que ya terminóno sé voy que voy a hacer, nomás, estudiar para mis exámenes y cansar, es todo. Sí. megusta las [cheeseburguers], las hamburguesas de queso. Sí. durante la [lent] dejó la carnerojo y este fin de semana pasado nomás comí como 10 hamburguesas. Como uno día,doce día, hay veces. Y también me gusta lasagna, me como, no me como mucho porquela pasta es, no me gusta mucho pero me gusta la lasagna. Me gusta ir a San Antonio, dedon donde soy, de donde está, ah y ahí nomás está mi casa, mi casa de mis padres y megusta ir al río de pasar y ah aquí no sé donde me gusta. Ah quiero ir a Los Angeles perono sé cuando voy, voy a ir. si, un día.
Task 2: End of semester
En este libro hay un niño y y ah está vistiendo y los animales están ah viendo qué hace.Ahora va a ir a un lugar y y ah la rana se se entró la chaqueta y el niño no sabe que larana va a ir con él. ah Está diendo los animales adiós y la familia está afuera de la puertay van ahí, van a, van a ir. La familia llega a un restaurante ilegante y los niños mirando loel poster ah. Cuando están sentado en la mesa, la familia está viendo el [menu] y la ranasala de la chaqueta del niño y entrar a la instrumento del músico y el músico no puedetocar el [saxophone] porque la rana está dentro y se para tocando y está mirando ah en elinstrumento y ahí sala la rana arriba la cara del señor y el señor se cae en el en el [drum]y el músico está enojado y hay otro músico que está riendo y la rana se brinca en el ahensalada que está ah llevando el mesero y se lleva la ensalada un señora y ahí está larana pero ellos no saben. Cuando la señora ah está comiendo el ensalada, mira el rana yse cae pa’ tras en la silla y la rana se brinca en la vaso de vino de un señor y todos estánenojado y el rana se da un beso el señor y el mesero ah quere quiere ah [catch] la rana yla señora un señora quiere cayer porque siente mal y el mesero trae la rana y va a salirpara sacar la puerta atrás y el niño se mira y ah quiere su rana. Y la familia va a hablarcon el mesero y les dijen y le dije que es de ellos y el mesero se dije a la familia quevayan y todos van en el coche enojados del niño y cuando llega a la casa, la pa el padredel niño se ah se dije que va a la cuatro de él y él tiene un divertido tiempo con losanimales en su cuatro.
287
REFERENCES
Acevedo, R. (2003). Navegando a través del registro formal. In A. Roca & M. C.Colombi (Eds.), Mi lengua: Spanish as a heritage language in the United States(pp. 257-268). Washington DC: Georgetown UP.
Achugar, M. (2003). Academic registers in Spanish in the U.S. In A. Roca & M. C.Colombi (Eds.), Mi lengua: Spanish as a heritage language in the United States(pp. 213-234). Washington DC: Georgetown UP.
Alanen, R. (1995). Input enhancement and rule presentation in second languageacquisition. In R. Schmidt (Ed.), Attention and awareness in foreign languagelearning (pp. 259-302). Honolulu: University of Hawaii Press.
Allard, R., & Landry, R. (1992). Ethnolinguistic vitality beliefs and languagemaintenance and loss. In W. Fase, K. Jaspaert & S. Kroon (Eds.), Maintenanceand loss of minority languages. Philadelphia: John Benjamins.
Allport, G. W. (1954). The historical background of modern social psychology. In G.Lindzey (Ed.), Handbook of social psychology (pp. 3-56). Cambridge: Addison-Wesley.
Alonso, E. (1997). Testing the oral proficiency of bilingual speakers of Spanishaccording to ACTFL guidelines. Hispania, 80(2), 328-341.
Amastae, J. (1982). Language shift and maintenance in the Lower Rio Grande Valley ofSouthern Texas. In F. Barkin, E. Brandt & J. Ornstein-Galicia (Eds.),Bilingualism and Language Contact: Spanish, English and Native AmericanLanguages (pp. 261-277). New York: Teachers College Press.
America’s Best Colleges. (2005). U.S. news and world report, p. 135-277.
Anderson, R. (2001). Lexical morphology and verb use in child first language loss: Apreliminary case study investigation. International Journal of Bilingualism, 5(4),377-401.
Aparicio, F. (1993). Diversification and pan-latinity: Projections for the teaching ofSpanish to bilinguals. In A. Roca & J. Lipski (Eds.), Spanish in the United States:Linguistic contact and diversity. Berlin: Mouton de Gruyter.
August, D., & Hakuta, K. (1997). Improving schooling for language-minority children: Aresearch agenda. National Research Council Institute of Medicine. Washington,DC: National Academy Press.
288
Baker, C. (2003). Education as a site of language contact. Annual Review of AppliedLinguistics, 23, 95-112.
Bardovi-Harlig, K., & Bofman, T. (1989). Attainment of syntactic and morphologicalaccuracy by advanced language learners. Studies in Second Language Acquisition,11, 17-34.
Beaudrie, S., & Ducar, C. (2005). Beginning Level University Heritage Programs:Creating a Space for All Heritage Language Learners. Heritage LanguageJournal, 3(1), 1-26, http://www.heritagelanguages.org/.
Beckstead, K., & Toribio, A. (2003). Minority perspectives on language: Mexican andMexican-American adolescents' attitudes toward Spanish and English. In A. Roca& C. Colombi (Eds.), Mi lengua: Spanish as a heritage language in the UnitedStates (pp. 154-170). Washington DC: Georgetown University Press.
Berman, R., & Slobin, D. (1994). Relating events in narrative: A crosslinguisticdevelopment study. Hillsdale, NJ: Lawrence Erlbaum Associates.
Bernal-Enríquez, Y. (2005). La sociohistoria de la pérdida del español en la NuevaMéxico. In L. Ortiz-López & M. Lacorte (Eds.), Contactos y contextoslingüísticos: El español en los Estados Unidos y en contacto con otras lenguas.Frankfurt/Madrid: Vervuert/Iberoamericana.
Bernal-Henríquez, Y., & Hernández-Chávez, E. (2003). La enseñanza del español enNuevo México: ¿Revitalización o erradicación de la variedad chicana? In A. Roca& C. Colombi (Eds.), Mi lengua: Spanish as a heritage language in the UnitedStates (pp. 78-95). Washington DC: Georgetown UP.
Bills, G. D. (2005). Las comunidades lingüísticas y el mantenimiento del español enEstados Unidos. In L. Ortiz-López & M. Lacorte (Eds.), Contactos y contextoslingüísticos: El español en los Estados Unidos y en contacto con otras lenguas(pp. 55-83). Frankfurt/Madrid: Vervuert/Iberoamericana.
Bybee, J. (1985). Morphology: A study of the relation between meaning and form.Amsterdam: John Benjamins.
Campbell, R. (1996). New learners and new challenges. In R. Lafayette (Ed.), Nationalstandards: A catalyst for reform. Lincolnwood, IL: National Textbook.
Cano, P., & Gonzales, D. (2004). Reconciling what students want with what we want togive them in an SHL class. Paper presented at the Conference on TeachingSpanish to Native Speakers, Las Cruces, NM.
289
Cantoni, G. (1997). Keeping minority languages alive: The schools' responsibility. In J.Reyhner (Ed.), Teaching indigenous languages (pp. 1-9). Flagstaff, AZ: NorthernArizona University.
Carreira, M. (2000). Validating and promoting Spanish in the U.S.: Lessons fromlinguistic science. Bilingual Research Journal, 24, 423-442.
Carreira, M. (2003). Profiles of SNS students in the twenty-first century: Pedagogicalimplications of the changing demographics and social status of U.S. Hispanics. InA. Roca & C. Colombi (Eds.), Mi Lengua: Spanish as a heritage language in theUnited States (pp. 51-77). Washington, DC: Georgetown University Press.
Carreira, M. (2004). Seeking explanatory adequacy: A dual approach to understandingthe term "Heritage Language Learner". Heritage Language Journal, 2, 1-25,http://www.heritagelanguages.org/.
Chevalier, J. (2004). Heritage language literacy: Theory and practice. Heritage LanguageJournal, 2, 1-19, http://www.heritagelanguages.org/.
Clark, E. (2003). First language acquisition. Cambridge: Cambridge University Press.
Clyne, M. (1992). Linguistic and sociolinguistic aspects of language contact,maintenance and loss: Towards a multifacet theory. In W. Fase, K. Jaspaert & S.Kroon (Eds.), Maintenance and loss of minority languages. Philadelphia: JohnBenjamins.
Cohen, A., & Dörnyei. (2002). Focus on the language learner: Motivation and styles. InN. Schmitt (Ed.), An introduction to applied linguistics. London: Arnold.
Colombi, C., & Alarcón, F. X. (Eds.). (1997). La enseñanza del español ahispanohablantes: Praxis y teoría. Boston: Houghton Mifflin.
Colombi, M. (2003). Un enfoque functional para la enseñanza del ensayo expositivo. InA. Roca & C. Colombi (Eds.), Mi Lengua: Spanish as a Heritage language in theUnited States. Washington DC: Georgetown UP.
Crawford, J. (1991). Bilingual education: history, politics, theory, and practices. LosAngeles: Bilingual Educational Services.
Cummins, J. (1976). The influence of bilingualism on cognitive growth: A synthesis ofresearch findings and explanatory hypothesis. Working Papers on Bilingualism, 9,2-43.
290
Cummins, J., & Nakajima, K. (1987). Age of arrival, length of residence, andinterdependence of literacy skills among Japanese immigrant students. In B.Harley, P. Allen, J. Cummins & M. Swain (Eds.), The development of bilingualproficiency. Final report, volume III: Social context and age. Toronto: ModernLanguage Center, The Ontario Institute for Studies in Education.
Danesi, M. (1986). Teaching a heritage language to dialect-speaking students. Toronto:OISE Press.
Davis, P., & Rinvolucri, M. (1990). The confidence book. Essex: Longman.
De Bot, K. (1999). The psycholinguistics of language loss. In G. Extra & L. Verhoeven(Eds.), Studies on second language acquisition 14: Bilingualism and migration(Vol. 1, pp. 579-585). Berlin: Walter de Gruyter.
De Bot, K. (2001). Language use as interface between sociolinguistic andpsycholinguistic processes in language attrition and language shift. In J. Klatter-Folmer & P. Van Avermaet (Eds.), Theories on maintenance and loss of minoritylanguages: Towards a more integrated explanatory framework (pp. 65-82).Münster: Waxmann.
De Bot, K., & Hulsen, M. (2002). Language attrition: Tests, self-assessment, andperceptions. In V. Cook (Ed.), Portraits of the L2 user (pp. 253-274). Clevedon:Multilingual Matters.
De Bot, K., & Stoessel, S. (2000). In search of yesterday's words: Reactivating aforgotten language. Applied Linguistics, 21(3), 364-384.
DeKeyser, R. (1995). Learning second language grammar rules: An experiment with aminiature linguistic system. Studies in Second Language Acquisition, 17, 379-410.
Draper, J., & Hicks, J. (2000). Where we've been; What we've learned. In J. Webb & B.Miller (Eds.), Teaching heritage language learners: Voices from the classroom(pp. 15-35). Yonkers, NY: American Council on the Teaching of ForeignLanguages.
Dunkel, P. (1986). Developing listening fluency in L2: Theoretical perspectives andpedagogical considerations. The Modern Language Journal, 70, 99-106.
Ecke, P. (2004). Language attrition and theories of forgetting: A cross-disciplinaryreview. International Journal of Bilingualism, 8(3), 321-354.
291
Ellis, N. (1993). Rules and instances in foreign language learning: Interactions of explicitand implicit knowledge. C. European Journal of Cognitive Psychology, 5(3), 289-318.
Ellis, R. (1994). The study of second language acquisition. Oxford: Oxford UniversityPress.
Ellis, R. (1999). Factors in the indidental acquisition of second language vocabulary fromoral input. In R. Ellis (Ed.), Learning a second language through interaction.Amsterdam: John Benjamins.
Ellis, R., & Yuan, F. (2003). The effects of pre-task planning and on-line planning onfluency, complexity and accuracy in L2 monologic oral production. AppliedLinguistics, 24(1), 1-27.
Fairclough, M. (2001). Hypothetical Discourse in a Contact Situation: The Acquisition ofthe Standard Variety by Heritage Learners of Spanish in the United States.Unpublished Unpublished Doctoral Dissertation, University of Houston, Houston,TX.
Faltis, C. (1990). Spanish for native speakers: Freirian and Vygotskian perspectives.Foreign Language Annals, 2, 117-126.
Felix, A. (2004). The Adult Heritage Spanish Speaker in the Foreign LanguageClassroom. Unpublished Doctoral Dissertation, Capella University.
Fernandez, R., & Nielsen, F. (1986). Bilingualism and Hispanic scholastic achievement:Some baseline results. Social Science Research, 15, 43-70.
Fishman, J. (1964). Language maintenance and language shift as a field of inquiry.Linguistics, 9, 32-70.
Fishman, J. (1991). Reversing language shift: Theoretical and empirical foundations ofassistance to threatened languages. Clevedon: Multilingual Matters LTD.
Fishman, J. (2001). 300-plus years of heritage language education in the United States. InJ. Peyton, D. Ranard & S. McGinnis (Eds.), Heritage language in America:Preserving a national resource (pp. 81-98). McHenry: Delta Systems.
Fishman, J. (2004). Language maintenance, language shift, and reversing language shift.In T. Bhatia & W. Ritchie (Eds.), The handbook of bilingualism (pp. 406-436).Malden, MA: Blackwell Publishing.
292
Fishman, J., Cooper, R., & Ma, R. (1971). Bilingualism in the barrio. Bloomington:Indiana University Press/The Hague: Mouton.
Foster, P., & Skehan, P. (1996). The influence of planning and task type on secondlanguage performance. Studies in Second Language Acquisition, 18, 229-323.
García, H. (1985). Family and offspring language maintenance and their effects ofChicano college students’ confidence and grades. In E. García & R. Padilla(Eds.), Advances in bilingual education research (pp. 226-243). Tucson:University of Arizona Press.
García, M. (2003). Recent research on language maintenance. Annual Review of AppliedLinguistics, 23, 22-43.
García, O., Morín, J., & Rivera, K. (2001). How threatened is the Spanish of New YorkPuerto Ricans? Language shift with vaivén. In J. Fishman (Ed.), Can threatenedlanguages be saved? (pp. 44-73). Clevedon: Multilingual Matters.
García, O., & Otheguy, R. (1988). The language situation of Cuban Americans. In M.McKay & C. Wong (Eds.), Language diversity: Problem or resource? A socialand educational perspective on language minorities in the United States (pp. 162-192). New York: Newbury House.
García, O., & Otheguy, R. (1997). No sólo de estándar vive el aula: Lo que nos enseñó laeducación bilingüe sobre el español de Nueva York. In C. Colombi & F. X.Alarcón (Eds.), La enseñanza del español a hispanohablantes: Praxis y teoría(pp. 156-174). Boston: Houghton Mifflin Company.
Gardner, R. (1982). Language attitudes and language learning. In E. Bouchard Ryan & H.Giles (Eds.), Attitudes towards language variation (pp. 132-147). Bungay:Edward Arnold.
Gay, L. R., & Airasian, P. (2003). Educational research: Competencies for analysis andapplications, Seventh Edition. Upper Saddle River, NJ: Pearson Education.
Giles, H., Bourhis, R. Y., & Taylor, D. M. (1977). Towards a theory of language inethnic group relations. In H. Giles (Ed.), Language, ethnicity and intergrouprelations. New York: Academic Press.
Goldin-Meadow, S., Seligman, M., & Gelman, R. (1976). Language in the two-year-old.Cognition, 4, 189-202.
Gutiérrez, J. (1997). Teaching Spanish as a heritage language: A case for languageawareness. ADFL Bulletin, 29(1), 33-36.
293
Hakuta, K. (1986). Mirror of language. New York: Basic Books.
Hakuta, K. (1990). Bilingualism and bilingual education: A research perspective. (Vol.1). Washington, DC: National Clearinghouse for Bilingual Education.
Hakuta, K., & D'Andrea, D. (1992). Some properties of bilingual maintenance and loss inMexican background high-school students. Applied Linguistics, 13, 72-99.
Hakuta, K., & Díaz, R. M. (1985). The relationship between degree of bilingualism andcognitive ability: A critical discussion and some new longitudinal data. In K. D.Neldon (Ed.), Children's language (Vol. 5, pp. 319-344). Hillsdale, NJ: LawrenceErlbaum.
Hansen, L. (Ed.). (1999). Second language attrition in Japanese contexts. Oxford:Oxford University Press.
Hernández Chávez, E. (1990). The role of suppresive language policies in language shiftand language loss. Estudios Fronterizos, 18, 123-135.
Hernández-Chávez, E. (1993). Native language loss and its implications for revitalizationof Spanish in Chicano communities. In B. Merino, H. Trueba & F. Samaniego(Eds.), Language and culture in learning: Teaching Spanish to native speakers ofSpanish (pp. 58-74). London: Falmer.
Hidalgo, M. (1987). On the question of ‘standard’ vs. ‘dialect’: Implications for teachingHispanic college students. Hispanic Journal of the Behavioral Sciences, 94, 375–395.
Hidalgo, M. (1990). On the question of 'standard' versus 'dialect': Implications forteaching Hispanic college students. In J. Bergen (Ed.), Spanish in the UnitedStates: Sociolinguistic Issues. Washington, DC: Georgetown UP.
Hidalgo, M. (1997). Criterios normativos e ideología lingüística: Aceptación y rechazodel español de los Estados Unidos. In C. Colombi & F. Alarcón (Eds.), Laenseñanza del español a hispanohablantes. Praxis y teoría. Boston: HoughtonMifflin Company.
Hinton, L. (2003). Language revitalization. Annual Review of Applied Linguistics, 23, 44-57.
Huang, G. (1995). Self-reported biliteracy and self-esteem: A study of Mexican-American 8th graders. Applied Psycholinguistics, 16, 271-291.
294
Hunt, K. W. (1965). Grammatical structures written at three grade levels. Champaign,IL: The National Council of Teachers of English.
Ingold, C. W., Rivers, C., & Tesser, E. (2002). Report on the NFLC/AATSP survey ofSpanish language programs for native speakers. Hispania, 85(2), 324-329.
Jakobson, R. (1941/68). Child language, aphasia, and phonological universals:Mouton.Eng. tr. of Kindersprache, aphasie und allgemeine lautgesetze. Uppsala.
Jordens, P. (1986). The cognitive function of case marking in German as a native and aforeign language. In E. Kellerman & M. Sharwood-Smith (Eds.), Cross-linguisticinfluence in second language acquisition (pp. 91-109). New York: Pergamonpress.
Kormos, J., & Dénes, M. (2004). Exploring measures and perceptions of fluency in thespeech of second language learners. System, 32(2), 145-164.
Krashen, S. (1982). Principles and practice in second language acquisition. Oxford:Pergamon.
Krashen, S. (1996). Under attack: The case against bilingual education. Culver City,CA: Language Education Associates.
Krashen, S. (1998a). Heritage language development: Some practical arguments. In S.Krashen, L. Tse & J. McQuillan (Eds.), Heritage language development (pp. 3-14). Culver City: Language Education Associates.
Krashen, S. (1998b). Language shyness and heritage language development. In S.Krashen, L. Tse & J. McQuillan (Eds.), Heritage language development (pp. 41-50). Culver City: Language Education Associates.
Krashen, S. (2000). Bilingual education, the acquisition of English, and the retention andloss of Spanish. In A. Roca (Ed.), Research on Spanish in the U.S. Somerville,MA: Cascadilla Press.
Krashen, S., Tse, L., & McQuillan, J. (1998). Heritage language development. CulverCity: Language Education Associates.
Lambert, W. E. (1975). Culture and language as factors in learning and education. InA.Wolfgang (Ed.), Education of immigrant children. Toronto: Ontario Institutefor Studies in Education.
295
LeBlanc, L. B., & Lally, C. G. (1997). Foreign language placement in postsecondaryinstitutions: Addressing the problem. In Dimensions 1997 (pp. 19-36). MyrtleBeach: Southern Conference on Language Teaching.
Leeman, J. (2005). Engaging critical pedagogy: Spanish for native speakers. ForeignLanguage Annals, 38(1), 35-45.
Lennon, P. (1990). Investigating fluency in EFL: A quantitative approach. LanguageLearning, 40, 387-417.
Lipski, J. (1986). El español vestigial de los Estados Unidos. Estudios Filológicos, 21, 7-22.
Lipski, J. (1993). Creoloid phenomena in the Spanish of transitional bilinguals. In J.Lipski & A. Roca (Eds.), Spanish in the United States: Linguistic contact anddiversity (pp. 155-182). New York: Mouton de Gruyter.
Lipski, J. (1996). Los dialectos vestigiales de los Estados Unidos: Estado de la cuestión.Signo y seña, 6, 459-489.
Lochsky, L. (1994). Comprehensible input and second language acquisition: What is therelationship? Studies in Second Language Acquisition, 16, 303-324.
Long, M. (1982). Native speaker/non-native speaker conversation and the negotiation ofcomprehensible input. Applied Linguistics, 4, 126-141.
Long, M. (1985). Input and second language acquisition theory. In Gass, S. &Madden, C. Input in second language acquistion. New York: Newbury HousePublishers.
Long, M. (1991). Focus on form: A design feature in language teaching methodology. InK. de Bot, R. Ginsberg & C. Kramsch (Eds.), Foreign language research incross-cultural perspective (pp. 39-52). Amsterdam: John Benjamins.
Long, M. (1996). The role of linguistic environment in second language acquisition. InW. Ritchie & T. Bhatia (Eds.), Handbook of second language acquisition (pp.413-468). New York: Academic Press.
Lynch, A. (2003). Toward a theory of heritage language acquisition. In A. Roca & C.Colombi (Eds.), Mi Lengua: Spanish as a heritage language in the United States(pp. 25-50). Washington, DC: Georgetown UP.
Lynch, B. (1996). Language program evaluation: Theory and practice. Cambridge:Cambridge University Press.
296
MacGregor-Mendoza. (2005). El desplazamiento intergeneracional del español en losEstados Unidos: Una aproximación. In L. Ortiz-López & M. Lacorte (Eds.),Contactos y contextos lingüísticos: El español en los Estados Unidos y encontacto con otras lenguas (pp. 287-300). Frankfurt/Madrid:Vervuert/Iberoamericana.
Martínez, G. (2003). Classroom based dialect awareness in Heritage LanguageInstruction: A critical applied linguistc approach. Heritage Language Journal, 1,http://www.heritagelanguages.org/.
Mayer, M. (1974). Frog goes to dinner. New York: The Dial Press.
Mayer, M., & Mayer, M. (1969). One frog too many. New York: Penguin Young ReadersGroup.
Mercado, C. (2003). Biliteracy development among Latino youth in New York Citycommunities: An unexploited potential. In N. Hornberger (Ed.), Continua ofBiliteracy (pp. 166-186). Clevedon: Multilingual Matters.
Milroy, L. (1980). Language and social network. Oxford: Blackwell.
Montrul, S. (2004). Subject and object expression in Spanish heritage speakers: A case ofmorpho-syntactic convergence. Bilingualism: Language and Cognition, 7(2),125–142.
Myers-Scotton. (2006). Multiple voices: An introduction to bilingualism. Malden, MA:Blackwell Publishing.
Nation, P. (2001). Learning vocabulary in another language. Cambridge: CambridgeUniversity Press.
Nielsen, F., & Lerner, S. (1986). Language skills and school achievement of bilingualHispanics. Social Science Research, 15, 209-240.
Nobuyoshi, J. & Ellis, R. (1993). Focused communication tasks and Second LanguageAcquisition. English Language Teaching, 47, 203-210.
Omaggio Hadley, A. (2001). Teaching language in context, 3rd edition.Boston, MA: Heinle & Heinle.
Ortega, L. (1999). Rethinking foreign language education: Political dimensions of theprofession. In K. A. Davis (Ed.), Foreign Language Teaching and Language
297
Minority education. Technical report #19, pp. 21-39. Honolulu: University ofHawaii: Second Language Teaching and Curriculum Center.
Ortega Alvarez-Ossorio, L. (2000). Understanding Syntactic Complexity: Themeasurement of change in the syntax of instructed L2 Spanish learners.Unpublished Doctoral Dissertation, University of Hawai'i, Hawai’i.
Pica T., Young, R. & Doughty, C. (1987). The impact of interaction on comprehension.TESOL Quarterly, 21, 737-758.
Peal, E., & Lambert, W. (1962). The relation of bilingualism to intelligence.Psychological Monographs, 76, 1-23.
Peale, C. G. (1991). Spanish for Spanish speakers (and other "native languages") inCalifornia's schools: A rationale statement. Hispania, 74(2), 446-451.
Peyton, J., Lewelling, V., & Winke, P. (2001). Spanish for Spanish Speakers: DevelopingDual Language Proficiency. Retrieved August 14, 2004, fromhttp://www.cal.org/resources/digest/spanish_native.html
Peyton, J., Ranard, D., & McGinnis, S. (2001). Heritage languages in America:Preserving a national resource. McHenry, IL: Delta Systems.
Pino, B., & Pino, F. (2000). Serving the heritage speaker across a five-year program.ADFL Bulletin, 32(1), 27-35.
Pomerantz, A. (2002). Language ideologies and the production of identities: Spanish as aresource for participation in a multilingual marketplace. Multilingua, 21, 275-302.
Poplack, S. (1980). Sometimes I'll start a sentence in English y termino en español.Linguistics, 18, 581-616.
Porras, J. E. (1997). Uso local y uso estándar: Un enfoque bidialectal a la enseñanza delespañol para nativos. In M. C. Colombi & F. X. Alarcón (Eds.), La enseñanza delespañol a hispanohablantes: Praxis y teoría (pp. 190-197). Boston: HoughtonMifflin.
Porter, R. P. (1990). Forked tongue: The politics of bilingual education. New York: BasicBooks.
Potowski, K. (2001). Educating foreign language teachers to work with Heritage Spanishspeakers. In B. Johnston & S. Irujo (Eds.), Research and practice: Voices fromthe field (pp. 99-113). Minneapolis, MN: Center for Advanced Research onLanguage Acquisition.
298
Potowski, K. (2002). Experiences of Spanish Heritage speakers in University Languagecourses and Implications for teaching training. ADFL Bulletin, 33(3), 35-42.
Potowski, K. (2003). Chicago's Heritage Language Teacher Corps: A model forimproving Spanish teacher development. Hispania, 86(2), 302-311.
Potowski, K. (2005). Fundamentos de la enseñanza del español a hispanohablantes enlos EE.UU. Madrid: Arco/Libros.
Potowski, K., & Carreira, M. (2004). Towards teacher development and nationalstandards for Spanish as a heritage language. Foreign Language Annals, 37, 427-435.
Pucci, S. (2003). Spanish print environments: Implications for heritage languagedevelopment. In A. Roca & M. C. Colombi (Eds.), Mi lengua: Spanish as aheritage language in the United States (pp. 269-290). Washington, DC:Georgetown UP.
Ramírez, A. (1992). El español de los Estados Unidos: El lenguaje de los hispanos.Madrid: MAPFRE.
Robinson, P. (1997). Generalizability and automaticity of second language learning underimplicit, incidental, enhanced, and instructed conditions. Studies in SecondLanguage Acquisition, 19, 223-247.
Roca, A., & Colombi, C. (2003). Mi Lengua: Spanish as a heritage language in theUnited States. Washington, DC: Georgetown UP.
Romero, M. (2000). Heritage language classrooms in action - three case studies: Anintroduction to the research. In J. Webb & B. Miller (Eds.), Teaching heritagelanguage learners: Voices from the classroom (pp. 128-156). Yonkers, NY:American Council on the Teaching of Foreign Languages.
Ruiz, R. (1988). Orientations in language planning. In S. McKay & S. C. Wong (Eds.),Language Diversity: Problem or Resource? Boston: Heinle & Heinle Publishers.
Samaniego, F., Blommers, T., Lagunas-Solar, M., Ritzi-Marouf, V., & Rodriguez, F.(2006). Dímelo Tú! Forth Worth: Harcourt Brace College Publishers.
Samaniego, F., Rojas, N., Ohara, M., & Alarcón, F. X. (2005). El mundo 21 hispano.Boston: Houghton Mifflin Company.
299
Schmid, M. (2002). First language attrition, use and maintenance: The case of GermanJews in Anglophone countries. Amsterdam: John Benjamins.
Schmidt, R. (1990). The role of consciousness in second language learning. AppliedLinguistics, 11, 129–158.
Schmidt, R. (1993). Awareness and second language acquisition. Annual Review ofApplied Linguistics, 13, 206–226.
Schmidt, R. (1995). Consciousness and foreign language learning: A tutorial on the roleof attention and awareness in learning. In R. Schmidt (ed.) Attention andawareness in foreign language learning (pp. 1–63). Honolulu, Hawai’i:University of Hawai’i, Second Language Teaching and Curriculum Center.
Schwartz, A. M. (2001). Preparing teachers to work with heritage language learners. In J.Peyton (Ed.), Heritage languages in America: Preserving a national resource(pp. 197-206). McHenry, IL: Delta Systems and Center for Applied Linguistics.
Schwartz, A. M. (2003). No me suena! Heritage spanish speakers' writing strategies. InA. C. Roca, C. (Ed.), Mi Lengua: Spanish as a heritage language in the UnitedStates (pp. 235-256). Washington, DC: Georgetown UP.
Seliger, H., & Vago, R. (1991). The study of first language attrition: An overview. In H.Seliger & R. Vago (Eds.), First language attrition (pp. 3-15). Cambridge:Cambridge University Press.
Seliger, H. W., & Vago, R. M. (1991). First Language Attrition. Cambridge: CambridgeUniversity Press.
Sharwood-Smith, M. (2003). Input enhancement in instructed SLA: Theoretical bases.Studies in Second Language Acquisition, 15, 165-179.
Silva-Corvalán, C. (2001). Sociolinguística y pragmática del español. Washington, DC:Georgetown University Press.
Skehan, P. (1998). A cognitive approach to language learning. Oxford: OxfordUniversity Press.
Slobin, D. (1996). Two ways to travel: Verbs of motion in English and Spanish. In M.Shibatani & S. Thompson (Eds.), Grammatical constructions: Their form andmeaning (pp. 195-219). Oxford, UK: Oxford University Press.
300
Swain, M. (1995). Three functions of output in second language learning. In G. Cook &B. Seidlhofer (Eds.), Principle and practice in applied linguistics: Studies inHonour of H. G. Widdowson (pp. 125-144). Oxford: Oxford University Press.
Swain, M., & Lapkin, S. (1981). Bilingual education in Ontario: A decade of research.Toronto: Minister of Education.
Thomason, S. G. (2001). Language contact: An introduction. Washington, DC:Georgetown University Press.
Torreblanca, M. (1997). El español hablado en el Suroeste de los Estados Unidos y lasnormas lingüísticas españolas. In M. C. Colombi & F. X. Alarcon (Eds.), Laenseñanza del español a hispanohablantes: Praxis y teoría (pp. 133-139). Boston:Houghton Mifflin.
Torres, L. (1988). Puerto Rican discourse: A sociolinguistic study of a New York suburb.Mahwah, NJ: Lawrence Earlbaum.
Tse, L. (1998a). Ethnic identity formation and its implications for heritage languagedevelopment. In S. Krashen, L. Tse & J. McQuillan (Eds.), Heritage languagedevelopment (pp. 15-29). Culver City: Language Education Associates.
Tse, L. (1998b). Affecting affect: The impact of heritage language programs on studentattitudes. In S. Krashen, L. Tse & J. McQuillan (Eds.), Heritage languagedevelopment (pp. 51-72). Culver City: Language Education Associates.
Tse, L. (forthcoming). An examination of the relationship between ethnic developmentand attitudes toward the ethnic language: Toward a developmental model.
University of California, L. A. (2001). Heritage language research priorities conferencereport. Los Angeles, CA: Author.
Ur, P. (1984). Teaching listening comprehension. Cambridge, Cambridge UniversityPress.
Uribe de Kellet, A. (2002). The recovery of a first language: A case study of anEnglish/Spanish bilingual child. International Journal of Bilingual Education,5(3), 162-181.
Valdés, G. (1988). The language situation of Mexican Americans. In S. McKay & L.Wong (Eds.), Language diversity: Problem or resource (pp. 111.139). New York:Newbury House Publishers.
301
Valdés, G. (1992). The role of the foreign language teaching profession in maintainingnon-English languages in the United States. In H. Byrnes (Ed.), Languages for amulticultural world in transition. Skokie, IL: National Textbook Company.
Valdés, G. (1995). The teaching of minority students as academic subjects: Pedagogicaland theoretical challenges. Modern Language Journal, 79(3), 299-328.
Valdés, G. (1997). The teaching of Spanish to bilingual Spanish-speaking students:Outstanding issues and unanswered questions. In M. Colombi & F. X. Alarcón(Eds.), La enseñanza del español a hispanohablantes: Praxis y teoría (pp. 8-44).Boston, MA: Houghton Mifflin.
Valdés, G. (2001). Heritage language students: Profiles and possibilities. In J. Peyton, D.Ranard & S. McGinnis (Eds.), Heritage languages in America: Preserving anational resource (pp. 37-80). McHenry: Delta Systems.
Valdés, G. (2005). Bilingualism, heritage language learners, and SLA research:Opportunities lost or seized? Modern Language Journal, 89(3), 410-426.
Van Deusen-Scholl, N. (1998). Heritage language instruction: Issues and challenges.AILA Newsletter, 1, 12-14.
Van Deusen-Scholl, N. (2001). Towards a definition of heritage language: Sociopoliticaland pedagogical considerations. Journal of Language, Identity, and Education,2(3), 211-230.
VanPatten, B. & Oikkenon, S. (1996). Explanation versus structured input in processinginstruction. Studies in Second Language Acquisition, 18, 495-510.
Villa, D. (1996). Choosing a 'standard' variety of Spanish for the instruction of nativeSpanish speakers in the U.S. Foreign Language Annals, 29, 191-200.
Wallen, N., & Fraenkel, J. (2001). Educational research: A guide to the process.Mahwah, N.J.: Lawrence Erlbaum Associates.
Walqui, A. (1997). Algunas consideraciones acerca de la enseñanza del español ahispanohablantes a nivel secundario. In M. Colombi & F. Alarcón (Eds.), Laenseñanza del español a hispanohablantes: Praxis y teoría (pp. 45-54). Boston:Houghton Mifflin.
Wass, M. (1993). Language Attrition among German Speakers in Australia: ASociolinguistic Inquiry. Unpublished Unpublished doctoral dissertation,Macquarie University, Sydney.
302
Webb, J., & Miller, B. (Eds.). (2000). Teaching heritage language learners: Voices fromthe classroom. Yonkers, NY: American Council on the Teaching of ForeignLanguages.
Weissberg, B. (2000). Developmental relationships in the acquisition of English syntax:Writing vs. speech. Learning and Instruction, 10, 37-53.
Wherritt, I., & Cleary, A. (1990). A national survey of Spanish language testing forplacement of outcome assessment at B.A.-granting institutions in the UnitedStates. Foreign Language Annals, 23, 157-165.
Wiley, T. (2001). On defining heritage learners and their speakers. In J. Peyton, D.Ranard & S. McGinnis (Eds.), Heritage languages in America: Preserving anational resource (pp. 29-36). McHenry: Delta Systems.
Wiley, T., & Valdés, G. (2000). Editors' introduction: Heritage language instruction inthe United States: A time for renewal. Bilingual Research Journal, 24(4).
Wingett, Y., & Meléndez, M. (2003, May 5). English-only Latinos on rise. ArizonaRepublic, pp. A1-A4.
Wolfe-Quintero, K., Inagaki, S., & Hae-Young, K. (1998). Second language developmentin writing: Measures of fluency, accuracy, and complexity. Honolulu: Universityof Hawaii, Second Language Teaching & Curriculum Center.
Wong Fillmore, L. (1991). When learning a second language means losing the first. EarlyChildhood Research Quarterly, 6, 323-346.
Yoshitomi, A. (1992). Towards a model of language attrition: Neurobiological andpsychological contributions. Issues in Applied Linguistics, 3, 293-318.
Zentella, C. (1997). Spanish in New York. In J. Fishman & O. García (Eds.), Themultilingual apple: Languages in New York City (pp. 167-220). Berlin: Moutonde Gruyter.


![Bayesian Causal Inference - uni-muenchen.de...from causal inference have been attracting much interest recently. [HHH18] propose that causal [HHH18] propose that causal inference stands](https://img.pdfslide.us/doc/110x75/5ec457b21b32702dbe2c9d4c/bayesian-causal-inference-uni-from-causal-inference-have-been-attracting.jpg)