Embed Size (px)
Citation preview

A Case Study to Examine Environmental Benefits of Lean Construction
Sustainability, Green and Lean 133
A CASE STUDY TO EXAMINE ENVIRONMENTAL BENEFITS OF LEAN
CONSTRUCTION Somik Ghosh1, Suchismita Bhattacharjee2, Pardis Pishdad-Bozorgi3 and Ram
Ganapathy4
ABSTRACT The process of construction significantly contributes to the total energy use, greenhouse gas emission, and waste generation. Utilizing lean helps in reducing construction wastes at source minimizing resource depletion and preventing pollution. The goal of this study was to investigate the contribution of lean construction to reduce waste at source and provide environmental benefits. A case study of a healthcare facility in Arizona was conducted that utilized BIM during the pre-construction and the construction phases. Pull planning, commitment tracking, and IPD were also utilized in the project. Procurement and installation of drywall was selected as the unit of analysis for the case study. The predictor variable of interest was the waste reduction due to utilization of lean tools, and the response variable was the environmental benefit through waste reduction at source. The environmental benefit of waste reduction was estimated by the resultant reduction in CO2 equivalent of greenhouse gas emission. For estimation of greenhouse gas emission, a “cradle-to-site” approach was considered that included the manufacturing of drywall and transportation to site. The findings show that significant amount of materials and labour hours were saved in the case study project that could be linked to the utilization of lean tools.
KEYWORDS Lean construction, BIM, pull planning, waste reduction, greenhouse gas emission.
INTRODUCTION Scientists have unanimously acknowledged the increase of temperature at the earth’s surface along with other climatic changes due to rising concentration of greenhouse gases (GHGs) caused by human actions (McMichael et al. 2006). The potential impact of these climatic changes on the global economy may be enormous: insurance companies estimate that it can be of the order of hundreds of billions of dollars per 1 Assistant Professor, College of Architecture, 830 Van Vleet Oval, 294 GH, University of
Oklahoma, Norman, OK 73019, USA. Phone +1 (405) 325-3670, [email protected] 2 Assistant Professor, College of Architecture, 830 Van Vleet Oval, 284 GH, University of
Oklahoma, Norman, OK 73019, USA. Phone +1 (405) 325-4528, [email protected] 3 Assistant Professor, College of Architecture, 280 Ferst Drive, Georgia Institute of Technology,
Atlanta, GA 30332, USA. Phone +1 (404) 894-7100, [email protected] 4 Senior BIM Engineer, DPR Construction, 224 N. 44th Street, Phoenix, AZ 85034, USA. Phone +1
(602) 808-0500, [email protected]
Somik Ghosh, Suchismita Bhattacharjee, Pardis Pishdad-Bozorgi and Ram Ganapathy
134 Proceedings IGLC-22, June 2014 | Oslo, Norway
year in the form of natural disasters and disruptions to agricultural cycles (Brown 2005). If actions are not taken to reduce the emission of GHGs, the overall costs and risks of climate change will be equivalent to losing at least 5% of global GDP per year, now and forever (Stern 2007).
With the recognition of global climate change, the construction industry is under increasing pressure to take environmental considerations into the daily decision-making processes. The rise of the global focus on climate change leads to the foundation of the United Nations Framework Convention on Climate Change (UNFCCC) in 1992 to deal with the environmental concerns that are brought about by global climate change. UNFCCC aims to introduce measures to control adverse climate changes caused by GHGs in both industrialized and developing countries (Yates 2007). Global environmental concerns about climate change also lead to the establishment of the Kyoto Protocol, an international agreement that had set binding targets for the reduction of GHG emissions by industrialized countries by the year 2012 (Yates 2007).
The construction industry is constantly being challenged to reduce its large amount of energy consumption, raw material usage, and water usage (Low et al. 2009). According to Klotz et al. (2007), buildings consume 36 percent of the total energy used, 30 percent of the raw materials used, and 12 percent of potable water consumed in the United States. The American Institute of Architects (2007) estimated that nearly 50% of all the GHG emissions are generated by buildings and their construction in terms of the energy used in the production of materials, transportation of materials from production sites to construction sites, as well as energy consumed during the operational stage. However, there is considerable potential to control and reduce carbon emissions in the construction industry with appropriate management intervention.
Till date reduction in carbon emissions have been attempted through process and technology innovation (Spence and Mulligan 1995), adopting low-carbon fuels (Hendriks et al. 1999), identifying alternative low-carbon raw materials and CO2 capture and sequestration (Herzog 2001). Empirical evidences support that reducing waste in construction processes using lean result in lowering the usage of raw materials thus minimizing waste at source (Nahmens and Mullens 2009, Salem and Zimmer 2005). Conceptually, minimizing waste at source should result in procuring less raw materials and reduce harmful environmental impact due to the manufacturing of the raw materials. The paper examines two phases of a healthcare project – one following traditional construction management methodologies, while other utilizing tools of lean construction, and emphasized how waste of material at source was significantly reduced using lean tools. The paper provides the description of application of lean tools explicitly targeting to reduce the waste and suggests that there is strong implicit evidence furthering the argument that lean construction has positive environmental benefits.
LITERATURE REVIEW More than a decade back, Womack (2003) wrote “People often tell me that lean thinking must be “green” because it reduces the amount of energy, manufacturing space, and wasted by-products required to produce a given product. Indeed, examples are often cited of reducing human effort, space, and scrap by 50 percent or more, per
A Case Study to Examine Environmental Benefits of Lean Construction
Sustainability, Green and Lean 135
product produced, through applying lean principles in a manufacturing facility. However, only a handful of researchers have investigated the association between lean and green initiatives. Starting from describing green as “the good public spill over of lean” (King and Lennox 2001) to claiming lean and green as parallel universes (Larson and Greenwood 2004) the research community has recognized “lean’s role to be green’s critical enabler” (Womack, 2003). Researchers have found that goals set to achieve leanness in manufacturing processes worked as catalyst for green initiatives (King and Lenox, 2001; Bergmiller and McCright 2009b, Larson and Greenwood 2004). Carvalhoadn Cruz-Machado (2009) identified more of a synergistic relationship between lean and green in pursuit of a combined environmental and operations management. Studying the Shingo prize winners and the finalists, Bergmiller and McCright (2009a) observed that lean companies that were involved in green initiatives achieved better results. This observation indicated that lean and green can realize their full potential when applied together.
Considering that construction waste comprises 40 percent of landfill materials (Allen and Iano, 2004), it is important that the industry turn their focus on minimizing waste at source. Nahmens (2009) commented that “combining lean and green building may be one approach to sustainable construction by focusing on waste reduction that not only results in reduced environmental impact.” Her case study demonstrated that utilizing lean techniques in a HUD code housing plant resulted in reduction of waste, which is a key requirement of green initiative. Riley et al. (2005) in a multiple case study project attempted to identify the areas of waste reduction and value added processes with a focus on mechanical systems design and construction that contributed to energy efficiency of building projects. In their study Riley et al. (2005) identified the lean techniques used in the case study projects that resulted in green outputs. Other studies conducted by Nahmens and Mullens (2009) and Salem and Zimmer (2005) found evidence that lean implementation results in waste reduction. However, no study till date was located that translated the waste reduction due to implementation of lean in terms of environmental benefits.
METHODOLOGY With the goal of examining the benefits of lean construction towards reducing harmful environmental impact of construction, a case study approach was adopted for the study. The methodology has been to compare two similar projects through the objectives of reducing waste at source using lean. Subsequently, the reduction in material wastage was translated to environmental benefits by quantifying the CO2 equivalent. Two phases of a healthcare project located in Gilbert, Arizona were chosen for the purpose. The selected project was a multi-disciplinary services facility that provided medical, radiation, surgical oncology, pathology, laboratory, diagnostic imaging, as well as other supportive clinical services. The healthcare facility is owned by Banner Health & MD Anderson and it was constructed by DPR Construction. Both the phases of the project were three stories high with comparable gross areas (Phase I was 131,851 SF and Phase II was 103,010 SF). Phase I of the project began in 2009 and was completed in 2011 (total of 17 months), and incurred an overall cost of 37.1 million USD with per square feet cost of 281.38 USD. While the cost per square feet of Phase II was comparable with the previous phase at 280.56 USD

Somik Ghosh, Suchismita Bhattacharjee, Pardis Pishdad-Bozorgi and Ram Ganapathy
136 Proceedings IGLC-22, June 2014 | Oslo, Norway
(overall cost of Phase II was estimated to be 28.9 million USD), the scheduled period of completion was only 13 months beginning in early 2013.
While traditional planning and control methods were utilized in Phase I of the project, several tools of lean construction were employed in Phase II such as BIM, pull planning, and commitment tracking. The implementation of the lean tools in Phase II was facilitated by the adoption of IPD as the preferred delivery method. The following sections illustrate the implementation of the different lean tools in in Phase II.
BIM BIM was formally adopted for Phase II starting from the preconstruction phase and an implementation plan delineating the roles and responsibilities for all project participants were added to the contract. BIM as defined by Eastman et al. (2011) is a modelling technology and associated set of processes to produce, communicate, and analyse parametric building models. The model prepared for Phase II represented the physical and functional characteristics of the facility that served as a repository of information for the facility. The owner, design team, and the construction team agreed upon a comprehensive list of objectives for the project that included zero construction change orders and zero design changes due to constructability issues among trades, maximizing prefabrication, zero tolerance on major milestones, model based layout and as-built updates with variance reporting, clear and direct communication and reorder rate reduction due to insufficient information, zero tolerance in compliance with pre-task planning, and 100% Percent Plan Complete (PPC) among others. BIM as a tool enhanced the collaborative approach of lean philosophy and reduced design errors by exposing the constraints ahead of actual construction. It is evident from the aforementioned objectives that the project participants focussed on reducing variability and thus increasing the work flow reliability for Phase II of the project. Reducing work flow variability results in less disruption and ensures successful completion of the project. Due to BIM implementation and detailing, the project team could pre-fabricate many components of the facility that helped in reducing wastage of material and also optimized the labour utilization.
PULL PLANNING & COMMITMENT TRACKING To assist in reducing the variability and unpredictability, pull planning was utilized by DPR during the weekly production planning meetings. Pull planning, as defined by Lean Construction Institute, requires “working from a target completion date backwards where tasks are defined and sequenced so that their completion releases work” (Lean Construction Institute 2013). Pulling is a make ready technique that decomposes the tasks and improves the definition of tasks (Ballard, 1999). Utilizing pull planning provided an opportunity to the project participants to communicate what they needed from others to complete their tasks, and to identify the probable constraints that might hinder the successful completion of tasks. Used in conjunction with an appropriately detailed critical path method master schedule, milestone-based short-interval planning helped the team increase efficiency, and deliver more predictable project results. DPR used short-interval planning to shift planning control from a single “planning guru” or small management group and relied on a more
A Case Study to Examine Environmental Benefits of Lean Construction
Sustainability, Green and Lean 137
interactive, interdependent scheduling process comprising multiple project participants. This approach helped the project team to adapt more quickly to the often fluid, fluctuating demands of the project. A commitment tracking tool was utilized to measure the PPC for each project participant as well as the entire project. Specific details such as duration, quantity of materials, labour hours, productivity rate, etc. were tracked for each of the tasks. PPC was used as the principle metric to measure the quality of planning and analysing the reasons for the schedule delays and incorporate a learning loop in the process. Bringing numerical significance to the planning sessions forced project teams to optimize their operational goals resulting efficiencies in a methodical manner. It was interesting to notice the use of the word ‘commitment’ as it signified an increased sense of responsibility and transparency from the project participants. In lean construction literatures, the term ‘commitment’ is used to express achievable and specific promises that are not unreliable and conditional. A reliable method of planning helped in identifying the constraints that could result in rework thus minimizing the material and labour wastage.
IPD Phase II of the case study project implemented IPD as a “philosophy”; the team decided not to adopt IPD as a “delivery method” involving single multi-party and shared risks and rewards contract. However, both designers and contractors were brought to the project early on. A three-day workshop was held before the commencement of Phase II among the owner, the design team (A/S/MEP), and DPR to frame an IPD charter to move forward. The goals outlined at the charter formed the major crust of the IPD implementation. The IPD traits utilized in this project is summarized in Error! Reference source not found..
Table 1: IPD Traits Implemented in Phase II of the case study project
IPD Traits Implemented in Phase II
• Relational contract • Colocation • Risk identified and accepted
early • Open Communication
• Protection from litigation • BIM use by multiple parties • Early Involvement of Key
Participants • Pre-existing relationships between parties
• Jointly Developed Project Target Criteria
• Intensified early planning/ Design intensive work
• Collaborative Decision Making • Transparent financials (open books) • Mutual Respect and Trust • Lean • Collaborative innovation • Champion/ Facilitator (Leadership by All)
Adoption of IPD facilitated the implementation of BIM and lean. IPD aligned all the project participants with the project objectives and establishes a sense of teamwork. Due to the use of IPD and development of integrated team, the design and

Somik Ghosh, Suchismita Bhattacharjee, Pardis Pishdad-Bozorgi and Ram Ganapathy
138 Proceedings IGLC-22, June 2014 | Oslo, Norway
construction teams could work on parallel modelling with quick turnaround of the model details.
IPD also facilitated implementation of Lean Project Delivery System (LPDS) as described by Ballard (2000). Phase II offered a good example of LPDS implementation. In this project, the participants were involved very early in the decision making – even before conceptual design phase. In addition, the owner’s facilities group was engaged in the system design and review process facilitated by the use of BIM. All the owner recommended templates were used in the design of the exterior skin. Also, object naming conventions within the BIM models were streamlined keeping in mind the end-users needs. The project followed the same schedule hierarchy propagated by the lean system – milestone, phase, look ahead, weekly work plan, and daily tasks. The actuals were tracked based on location and the baseline productivity was monitored and optimized every step of the way.
Sequential coordination and handoffs were implemented. The project was split up into work areas (location based work packaging) and all the systems within each work area was sequentially coordinated and signed off. As a true reflection of the location, cluster based spool sheets was adopted by all the trades for installation. This helped with fabrication orders and procurement to optimize the installation schedule. It also assisted greatly in the prefabrication of the Exterior skin (roughly $3500 sf) which was also sequenced based on the LPDS.
By utilizing BIM tools and model-based cost estimating system, the team was able to continuously plan and track the real time status of the project cost, and that played a key role in terms of budgeting and cost control.
ESTIMATION OF CO2 EQUIVALENT OF GHG EMISSION US Environmental Protection Agency (EPA 2011) has developed a framework to quantify the material inputs, energy inputs, and asses the environmental releases associated with the complete lifecycle (including manufacture, use, transportation, and disposal) of a given material. The most recent version of the aforementioned framework known as Waste Reduction Model (WARM version 11) is the result of several revisions of the original report titled “Greenhouse Gas Emissions from Management of Selected Materials in Municipal Solid Waste” published in 1998. WARM evaluates the GHG emissions associated with any material based on three factors: (1) GHG emissions throughout the lifecycle of the material; (2) extent to which manufacturing, recycling, and disposal of the material affect the carbon sink; and (3) extent to which use of the material can reduce consumption of electricity, thus reducing emission to produce electricity.
The authors utilised the WARM framework as the basis to assess the carbon emission related to procurement and installation activities in construction industry. However, in the context of the study the entire lifecycle of the product was not taken under consideration. While WARM includes the complete value chain from extraction of raw materials through different phases of manufacturing, transportation of raw materials and products to use, and final disposal in the lifecycle, this case study was bounded by assessment of emission associated with the extraction and processing of raw materials to transportation to the point of installation of the product in the construction site. The periods of use and disposal being so long (and somewhat uncertain) were not considered while calculating the emissions in this study.
A Case Study to Examine Environmental Benefits of Lean Construction
Sustainability, Green and Lean 139
The procurement and installation of drywall was selected as the unit of analysis for the case study. The GHG emissions associated with procurement and installation of drywall in Phase II were compared with that of Phase I of the case study project. The different steps from the extraction of raw materials to installing drywall have been shown below in Figure 1, which have been modelled based on lifecycle information related to drywall retrieved from USG Corporation (2000), National Renewable Energy Laboratory (2005), and EPA’s WARM.
LIFECYCLE OF DRYWALL Typical drywall used in construction consists of a core of gypsum mixed with additives backed on both sides by paper. As shown in Figure 1, gypsum, the primary ingredient for drywall is acquired through virgin gypsum mining as well as synthetic production that utilizes process energy. Gypsum is then combined with the other raw ingredients paper and starch to produce drywall. Drywall uses a combination of virgin, recycled, and synthetic gypsum. During the manufacturing of drywall, majority of energy requirement is for natural gas for the drying process. Post production, the drywall is transported to the retail stores to be stored until they are sold. The trade contractors installing drywall procure the material from these retail stores, which are in turn transported to the point of installation. At the point of installation, that is in the construction job site majority of the drywall end up being installed and a portion getting scrapped. The portion that is scrapped meets the end of life and transported either to the landfills or recycling facilities. According to EPA (2011) more than 60% of the drywall found in the waste stream come from scraps due to new construction. The installed drywalls meet the end of life when the particular facilities where they are installed reach the end of operational life and are demolished. Subsequently, they end up either in the landfills or recycling facilities. Most drywall at the end of the life is currently disposed of in landfills (opinion of Rik Master of USG Corporation as published in EPA (2011)). Approximately 19% of the drywall that end up in the recycling facilities is returned to the drywall manufacturing process (EPA 2011).

Somik Ghosh, Suchismita Bhattacharjee, Pardis Pishdad-Bozorgi and Ram Ganapathy
140 Proceedings IGLC-22, June 2014 | Oslo, Norway
Figure 1: Lifecycle of drywall The emissions related to the individual steps in Figure 1 have been listed below in Table 1. IPCC (1996) established CO2 as the reference gas for measurement of global warming (heat trapping) potential. Accordingly, one kilogram of CO2 is considered to have a global warming potential of one. In Table 2, the emission has been expressed as Metric Ton CO2 equivalent per short ton of drywall (MTCO2E/Ton). Considering the weight of a 5/8th inch thick drywall to be 2.2lb/SF (USG 2007), the emission has been eventually expressed as MTCO2E/Drywall Panel. IPCC has also provided the global warming potentials of other GHGs such as CH4, N2O, etc. EPA (2011).
Table 2: Quantification of GHG emission in CO2 equivalent at different stages of drywall lifecycle
Sources of emission MTCO2E/Ton MTCO2E/ Drywall Panel* Comments
Raw material acquisition and manufacturing
0.18** 0.0064
A Case Study to Examine Environmental Benefits of Lean Construction
Sustainability, Green and Lean 141
Transportation of raw gypsum, paper, starch, and additives to drywall manufacturing
0.04** 0.0014 Includes upstream emissions associated with the production of fuels and electricity (“pre-combustion” energy)
Transportation of drywall to retail facilities
0.03*** 0.001 388 miles on average per shipment
Transportation to the point of installation
0.002 0.00009 33.5 miles on average per shipment
* Each of the 5/8th inch thick drywall panel weighs 2.2lb/SF as per USG submittal Sheet 09250 ** Data on raw material extraction, and drywall and paper manufacturing were obtained by EPA from Venta (1997). While these data are several years old, they represent the most complete dataset available at the time these emissions factors were developed. *** The miles travelled fuel-specific information has been obtained from the 2007 U.S. Census Commodity Flow Survey (BTS 2007) and greenhouse gas emissions from the Management of Selected Materials (EPA 1998).
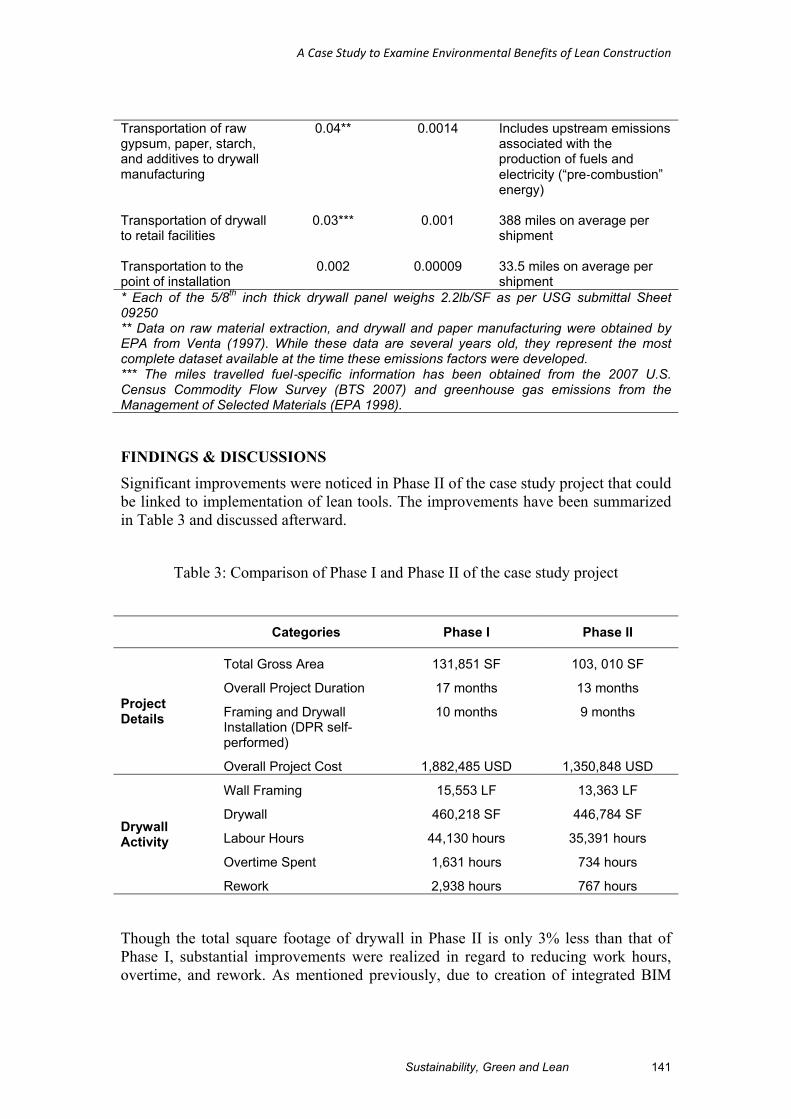
FINDINGS & DISCUSSIONS Significant improvements were noticed in Phase II of the case study project that could be linked to implementation of lean tools. The improvements have been summarized in Table 3 and discussed afterward.
Table 3: Comparison of Phase I and Phase II of the case study project
Categories Phase I Phase II
Project Details
Total Gross Area 131,851 SF 103, 010 SF
Overall Project Duration 17 months 13 months
Framing and Drywall Installation (DPR self-performed)
10 months 9 months
Overall Project Cost 1,882,485 USD 1,350,848 USD
Drywall Activity
Wall Framing 15,553 LF 13,363 LF
Drywall 460,218 SF 446,784 SF
Labour Hours 44,130 hours 35,391 hours
Overtime Spent 1,631 hours 734 hours
Rework 2,938 hours 767 hours
Though the total square footage of drywall in Phase II is only 3% less than that of Phase I, substantial improvements were realized in regard to reducing work hours, overtime, and rework. As mentioned previously, due to creation of integrated BIM

Somik Ghosh, Suchismita Bhattacharjee, Pardis Pishdad-Bozorgi and Ram Ganapathy
142 Proceedings IGLC-22, June 2014 | Oslo, Norway
model, the construction team could collaborate with the design team and carry out model based estimation and scheduling. They utilized the model beyond performing constructability reviews to increase efficiency of project controls. To avoid field coordination issues with electrical systems having ¾” modelling tolerance limit, the project team adopted ¼” tolerance limit much early in the process. These resulted in the reduction of rework in Phase II considerably in comparison to Phase I. Reduction in rework had an explicit relationship to minimization of material waste at source and labour hours. In addition, model based layout of the walls, soffits, and ceilings using total station increased the preciseness and reduced human errors. BIM was also utilized to integrate shop ready models to reduce time lag and efficiency generate shop drawing for pre-fabricated components. To increase the reliability of planning, the project team did not merely focus on milestones, but engaged in review and analysis of constraints. In case of unforeseen situations they sought to root-cause analysis to get to the root of the problem. Profound involvement of the trade contractors in the pull planning sessions and commitment tracking resulted in identification of dependencies and constraints during the planning sessions. While the drywall trade was interdependent on other trades such as mechanical, electrical, plumbing, spray on fire protection, etc. involvement of the trade contractors during pull planning helped in completing the drywall in Phase II with 20% less labour hours than that of Phase I. Minimizing labour hours has a direct impact on reducing environmental impact as there will be less number of trips to the jobsite reducing the usage of fuel to power the vehicles of the workers. The authors did not attempt to quantify the reduction of GHG emissions due to reduction of labour hours.
During the time of the case study project, the vendors supplying drywall to DPR were not equipped with inventory management systems that would enable them to track the actual quantity of drywall delivered at a particular project as they would supply to multiple projects. Instead, DPR measured the amount of drywall installed in the project. Based on analysis of archival documents, the Senior BIM Engineer of DPR for the case study project anticipated a 6% reduction in material waste at source in Phase II in comparison to Phase I. The savings in drywall when converted to GHG emission based on Table 1 will be equivalent to more than 7.5 MTCO2. It is to be noted that the reduction of GHG emission only takes into consideration the minimization of drywall at source, and not the metal studs, screws, and taping paper that are integral components of installation of drywall.
CONCLUSIONS The paper has presented results from a case study that was conducted to compare two phases of a healthcare project - Phase I of the case study project adopted traditional construction management methodologies, while Phase II utilized tools of lean construction such as BIM, pull planning, commitment tracking, and IPD. Procurement and installation of drywall was selected as the unit of analysis for the study. The effect of implementation of the aforementioned lean tools could be linked to improvements realized in Phase II of the project in terms of labour hours, overtime, and rework specifically to the scope of the drywall trade. In addition, approximately 6% reduction of material wastage at source was also realized in Phase II that could be linked to application of lean tools. Implementation of IPD enabled timely and

A Case Study to Examine Environmental Benefits of Lean Construction
Sustainability, Green and Lean 143
effective communication of design changes to all parties and allowed the opportunity for careful attention to details at the design and planning stages to avoid design and planning errors. Minimization of errors surely had its impact on reducing material waste. Further, application of the lean tools enabled the project participants to create a platform for collaboration and increase reliability of planning. By doing so the participants were involved in the process of constraint analysis in the planning phase and avoided ambiguity among different trades that resulted in reducing the rework to a great extent. Identifying constraints that might cause probable rework and using precise shop drawings generated from the model enabled the team to reduce material wastage. Off-site prefabrication facilitated by utilizing the model also helped the project team reduce material wastage to a considerable amount. The material savings when translated in terms of environmental impact showed substantial reduction in the emission of the GHGs. An approximate reduction of GHG emission by more than 7.5 MTCO2E only in the drywall trade is a considerable improvement.
A limitation of the present study is that the data on material saving is based on analysis of archival documents of DPR. Further studies will be undertaken based on more accurate data gathered from inventory management systems of the suppliers.
REFERENCES American Institute of Architects. (2007). Architects and Climate Change (available at
http://www.aia.org). Ballard, G. (1999). “Improving Work Flow Reliability.” Proceedings of 7th
International Group of Lean Construction Conference. Ballard, G. (2000). “Lean project delivery system.” White Paper-8 (Revision 1), Lean
Construction Institute, Ketchum, Id. Bergmiller, G.C. and McCright, P. R. (2009a). “Are Lean and Green Programs
Synergistic?” Proceedings of the 2009 Industrial Engineering Research Conference.
Bergmiller, G.C. and McCright, P. R. (2009b). “Parallel Models for Lean and Green Operations.” Proceedings of the 2009 Industrial Engineering Research Conference.
Brown, C. S. (Ed.). (2005). “The Sustainable Enterprise: Profiting from Best Practice.” Kogan Page Publishers.
BTS. (2007). US Census Commodity Flow Survey. Table 1: Shipment Characteristics by Mode of Transportation for the United States: 2007. Washington, DC: U.S. Bureau of Transportation Statistics (BTS), Research and Innovative Technology Administration.
Eastman, C., Teicholz, P., Sacks, R., and Liston, K. (2011). “BIM Handbook: A Guide to Building Information Modeling for Owners, Managers, Designers, Engineers and Contractors.” (2nd ed). John Wiley & Sons.
EPA. (1998). “Greenhouse Gas Emissions From the Management of Selected Materials.” US Environmental Protection Agency (EPA) publication no. EPA530-R-98-013. Washington, DC.
EPA. (2011). “Waste Reduction Model (WARM).” US Environmental Protection Agency (EPA). Washington, DC.
Hendriks, C. A., Worrell, E., De Jager, D., Blok, K., and Riemer, P. (1998). “Emission reduction of greenhouse gases from the cement industry.” Proceedings
Somik Ghosh, Suchismita Bhattacharjee, Pardis Pishdad-Bozorgi and Ram Ganapathy
144 Proceedings IGLC-22, June 2014 | Oslo, Norway
of the Fourth International Conference on Greenhouse Gas Control Technologies, 939-944.
Herzog, H. J. (2001). “What Future for Carbon Capture and Sequestration?” Environmental Science & Technology, 35(7), 148A-153A.
IPCC. (1996). “Revised 1996 IPCC Guidelines for National Greenhouse Gas Inventories.” Paris, France.
King, A.A. and Lenox, M.J. (2001). “Leen and Green? An Empirical Examination of the Relationship between Lean Production and Environmental Performance.” Journal of Productions and Operational Management, 10 (3), 244-256.
Klotz, L., Horman, M., and Bodenschatz, M. (2007). “A Lean Modeling Protocol for Evaluating Green Project Delivery.” Lean Construction Journal, 3(1), 1-18.
Larson, T. and Greenwood, R. (2004). “Perfect Compliments: Synergies Between Lean Production and Eco-Sustainability Initiatives.” Journal of Environmental Quality Management, 13 (4).
Lean Construction Institute (2013). “Introduction to Pull Planning.” (available at http://www.leanconstruction.org/media/docs/deliveryGuide/Appendix7.pdf)
Low, S. P., Liu, J. Y., and Wu, P. (2009). “Sustainable Facilities: Institutional Compliance and the Sino-Singapore Tianjin Eco-city Project.” Facilities, 27(9/10), 368-386.
McMichael, A. J., Woodruff, R. E., and Hales, S. (2006). “Climate Change and Human Health: Present and Future Risks.” The Lancet, 367(9513), 859-869.
Nahmens, I. (2009). “From Lean to Green Construction: A Natural Extension.” Construction Research Congress 2009, 1058-1067.
Nahmens, I and Mullens, M. (2009). “The Impact of Product Choice on Lean Homebuilding.” Construction Innovation Journal, 2(2).
National Renewable Energy Laboratory (2005). “U.S. Life-Cycle Inventory Database. Golden, CO.” (available at http://www.nrel.gov/lci/database).
Riley, D., Sanvido, V., Horman, M., McLaughlin, M., and Kerr, D. (2005). “Lean and Green: The Role of Design-Build Mechanical Competencies in the Design and Construction of Green Buildings.” Construction Research Congress 2005, 1-10.
Samen, O. and Zinner. E. (2005). “Application of Lean Manufacturing Principles to Construction.” Lean Construction Journal, 2 (2).
Spence, R., and Mulligan, H. (1995). “Sustainable Development and the Construction Industry.” Habitat International, 19(3), 279-292.
Stern, N. (Ed.). (2007). “The Economics of Climate Change: the Stern Review.” Cambridge University Press.
UNFCCC (1992). “United Nations Framework Convention on Climate Change: 1992.” (available at http://unfccc.int/resource/docs/convkp/conveng.pdf.)
USG (2007). Sheetrock Gypsum Panel: Submittal Sheet 09250.” United States Gypsum Company (USG), Chicago, IL.
USG Corporation. (2000). “The Gypsum Construction Handbook.” R.S. Means Company.
Venta, G. (1997). “Life Cycle Analysis of Gypsum Board and Associated Finishing Products.” Ottawa: Athena Sustainable Materials Institute, March.
Womack, J. (2003). “Is Lean Green?” (available at http://www.lean.org/womack/DisplayObject.cfm?o=714).
Yates, J. K. (2006). “Global Engineering and Construction.” John Wiley & Sons.


![Building Skills for a Lean Culture in Healthcare Part 1Developing a Lean Culture “I can't overstate the value [lean] is providing. It not only benefits our staff that has developed](https://img.pdfslide.us/doc/110x75/5ff0958ccd232f204b4044ed/building-skills-for-a-lean-culture-in-healthcare-part-1-developing-a-lean-culture.jpg)