Embed Size (px)
Citation preview
1
A CASE STUDY ON THE SELECTION OF DUAL TILL VERSUS SINGLE TILL CHARGESJoão Teixeira
AIRDEV 2012
Lisbon, April 19-20 2012
2012
2
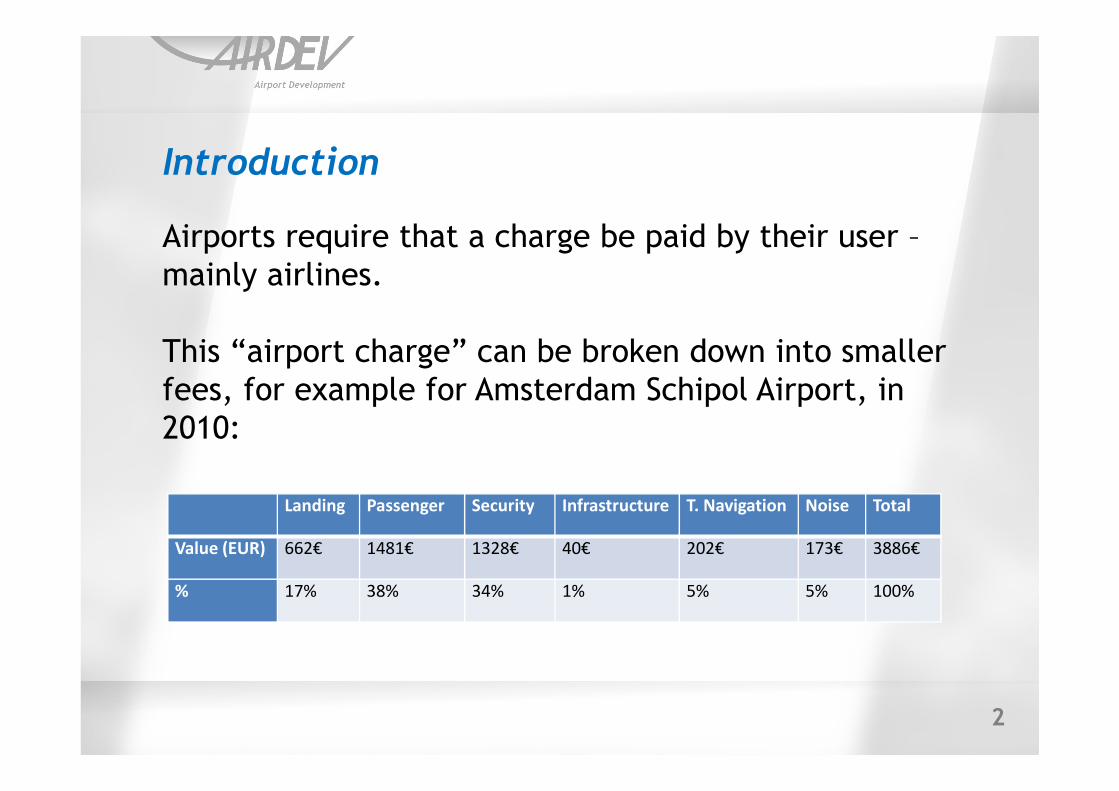
Introduction
Airports require that a charge be paid by their user –
mainly airlines.
This “airport charge” can be broken down into smaller
fees, for example for Amsterdam Schipol Airport, in
2010:
Landing Passenger Security Infrastructure T. Navigation Noise Total
Value (EUR) 662€ 1481€ 1328€ 40€ 202€ 173€ 3886€
% 17% 38% 34% 1% 5% 5% 100%
3
Introduction
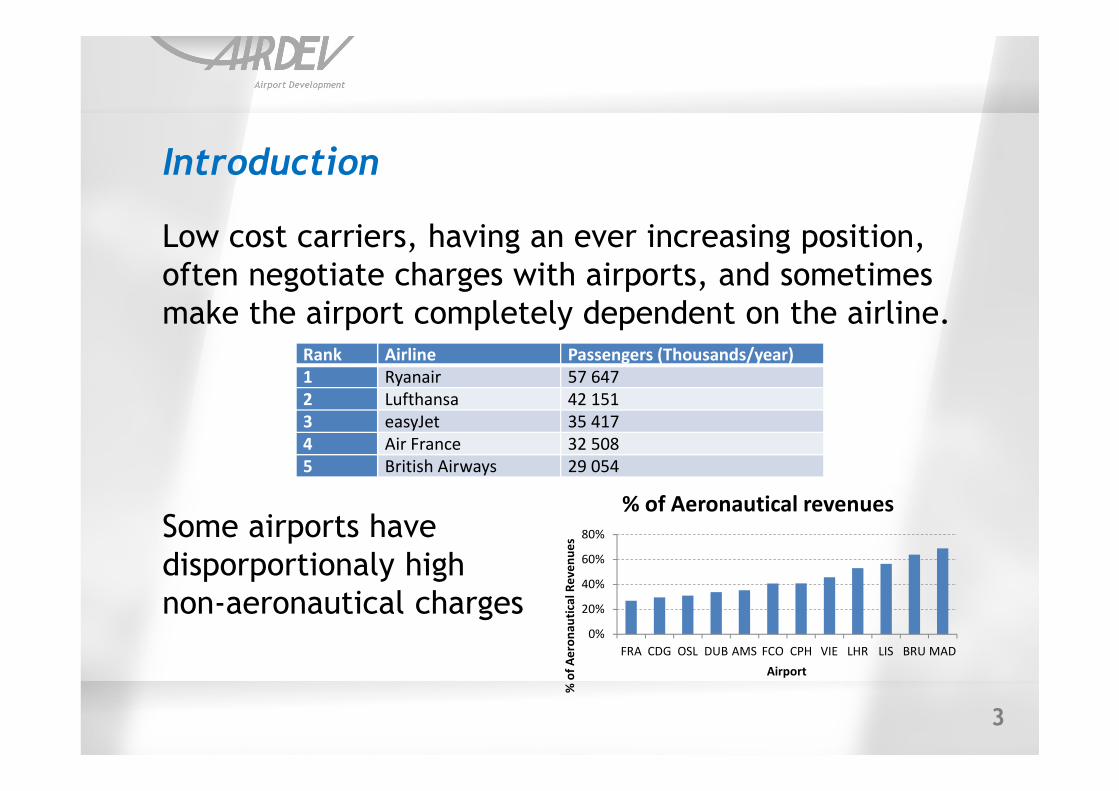
Low cost carriers, having an ever increasing position,
often negotiate charges with airports, and sometimes
make the airport completely dependent on the airline.Rank Airline Passengers (Thousands/year)
1 Ryanair 57 647
2 Lufthansa 42 151
3 easyJet 35 417
4 Air France 32 508
5 British Airways 29 054
Some airports have
disporportionaly high
non-aeronautical charges0%
20%
40%
60%
80%
FRA CDG OSL DUB AMS FCO CPH VIE LHR LIS BRU MAD
% o
f A
ero
na
uti
cal
Re
ve
nu
es
Airport
% of Aeronautical revenues
4
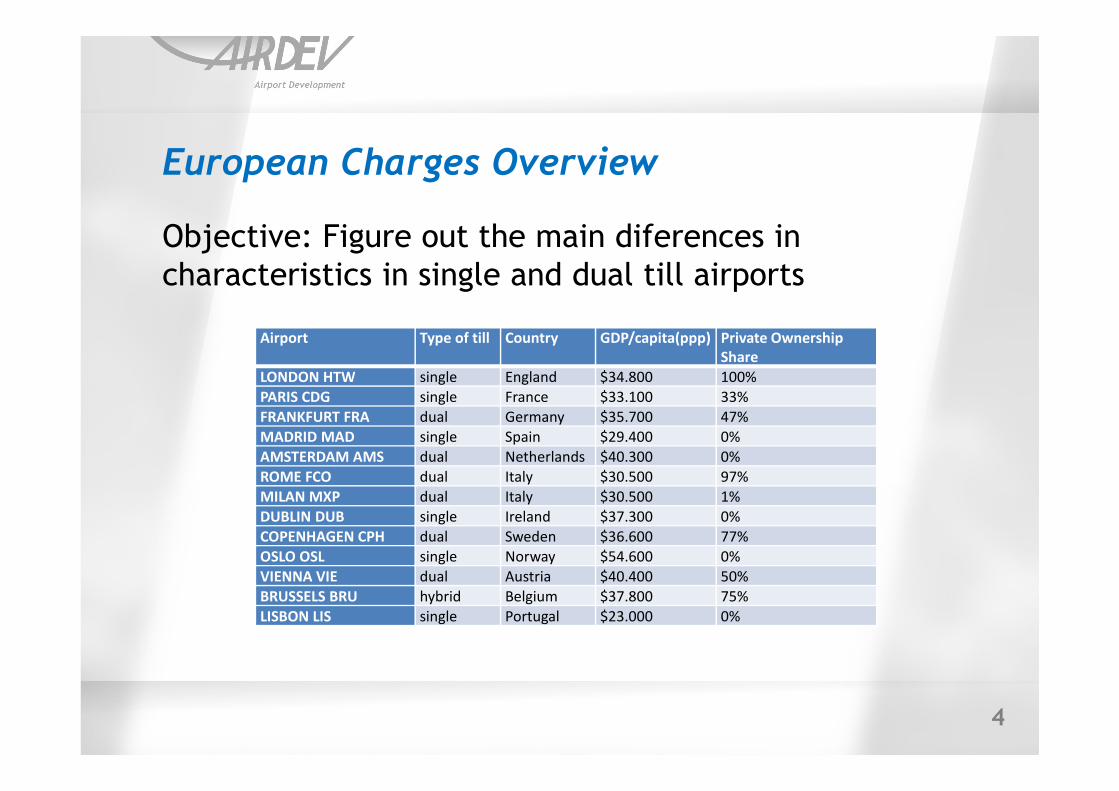
European Charges Overview
Objective: Figure out the main diferences in
characteristics in single and dual till airports
Airport Type of till Country GDP/capita(ppp) Private Ownership
Share
LONDON HTW single England $34.800 100%
PARIS CDG single France $33.100 33%
FRANKFURT FRA dual Germany $35.700 47%
MADRID MAD single Spain $29.400 0%
AMSTERDAM AMS dual Netherlands $40.300 0%
ROME FCO dual Italy $30.500 97%
MILAN MXP dual Italy $30.500 1%
DUBLIN DUB single Ireland $37.300 0%
COPENHAGEN CPH dual Sweden $36.600 77%
OSLO OSL single Norway $54.600 0%
VIENNA VIE dual Austria $40.400 50%
BRUSSELS BRU hybrid Belgium $37.800 75%
LISBON LIS single Portugal $23.000 0%
5
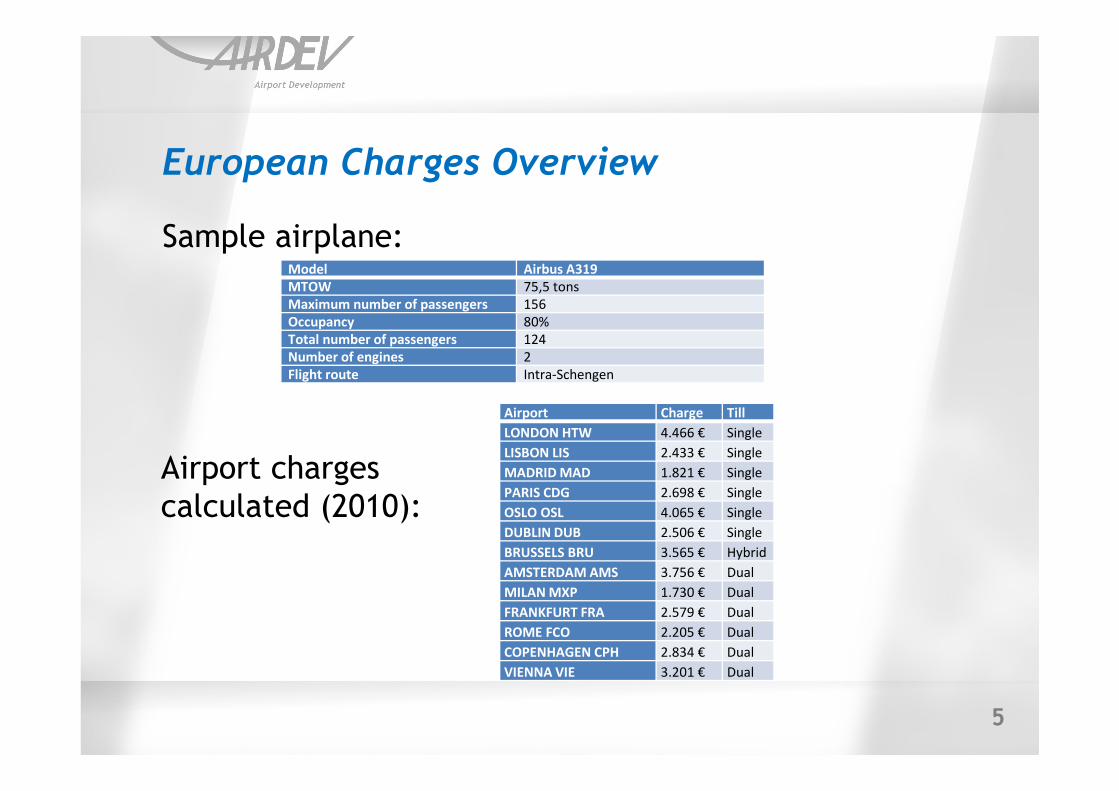
European Charges Overview
Sample airplane:Model Airbus A319
MTOW 75,5 tons
Maximum number of passengers 156
Occupancy 80%
Total number of passengers 124
Number of engines 2
Flight route Intra-Schengen
Airport Charge Till
LONDON HTW 4.466 € Single
LISBON LIS 2.433 € Single
MADRID MAD 1.821 € Single
PARIS CDG 2.698 € Single
OSLO OSL 4.065 € Single
DUBLIN DUB 2.506 € Single
BRUSSELS BRU 3.565 € Hybrid
AMSTERDAM AMS 3.756 € Dual
MILAN MXP 1.730 € Dual
FRANKFURT FRA 2.579 € Dual
ROME FCO 2.205 € Dual
COPENHAGEN CPH 2.834 € Dual
VIENNA VIE 3.201 € Dual
Airport charges
calculated (2010):
6
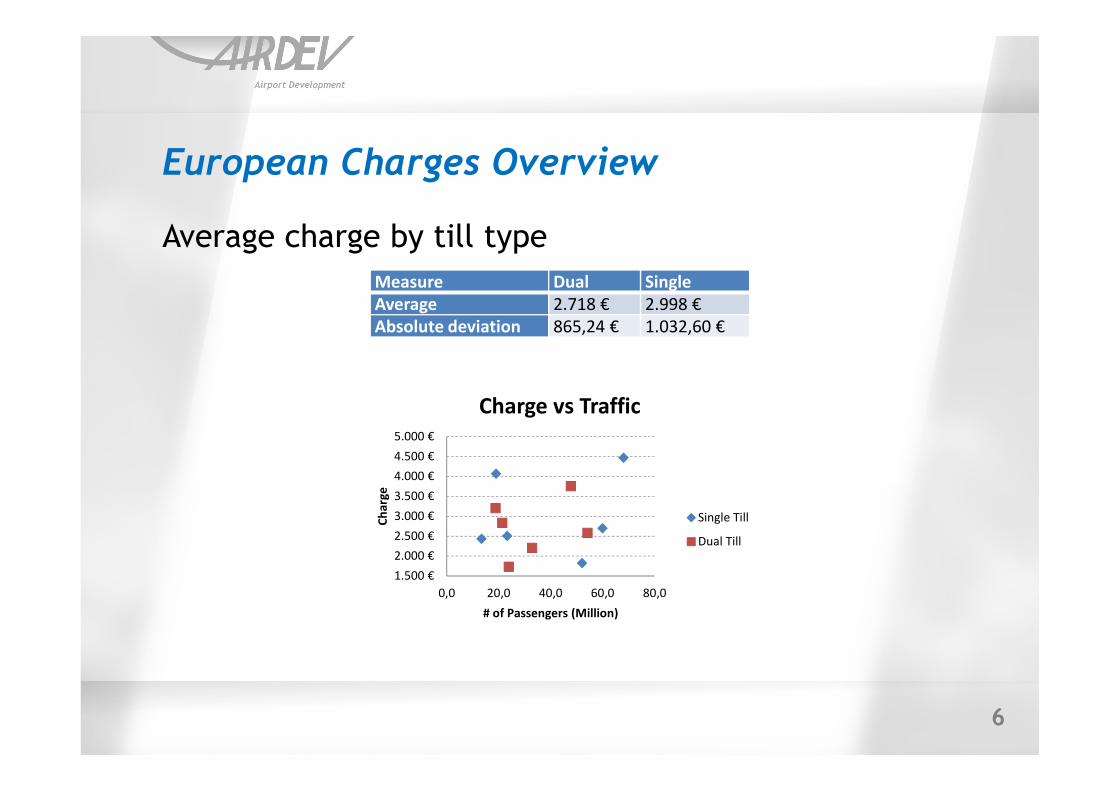
European Charges Overview
Average charge by till type
Measure Dual Single
Average 2.718 € 2.998 €
Absolute deviation 865,24 € 1.032,60 €
1.500 €
2.000 €
2.500 €
3.000 €
3.500 €
4.000 €
4.500 €
5.000 €
0,0 20,0 40,0 60,0 80,0
Ch
arg
e
# of Passengers (Million)
Charge vs Traffic
Single Till
Dual Till
7
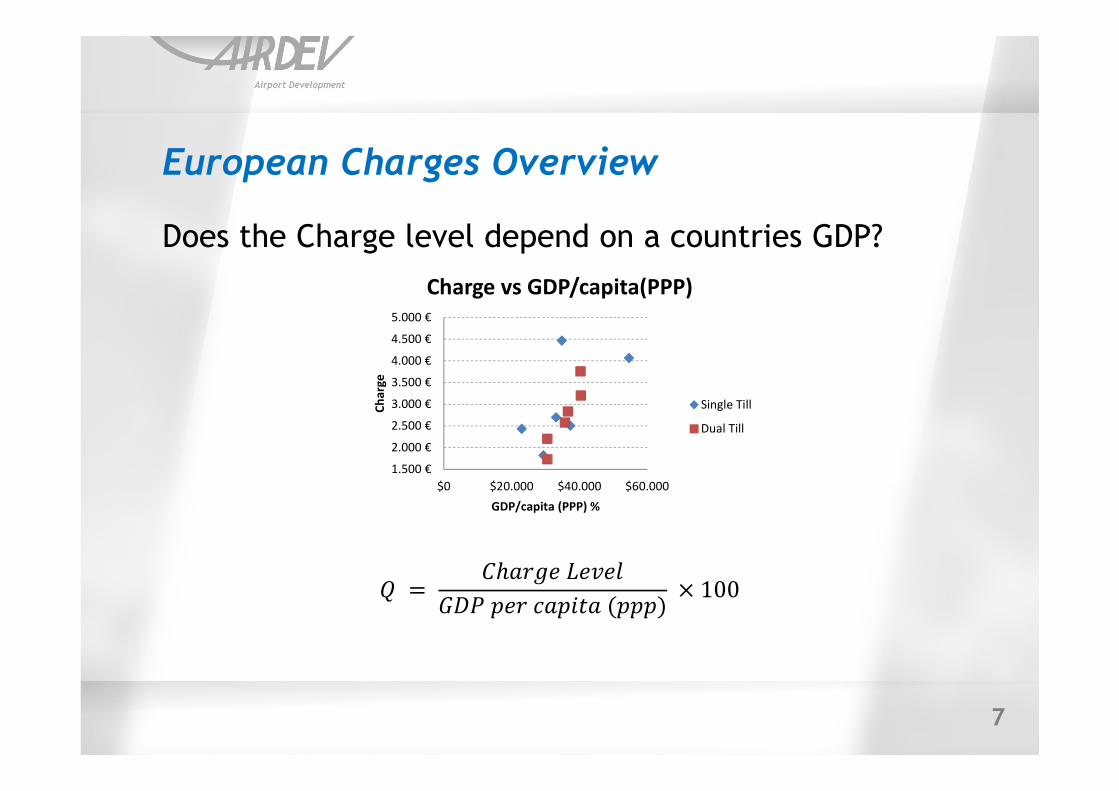
European Charges Overview
Does the Charge level depend on a countries GDP?
1.500 €
2.000 €
2.500 €
3.000 €
3.500 €
4.000 €
4.500 €
5.000 €
$0 $20.000 $40.000 $60.000
Ch
arg
e
GDP/capita (PPP) %
Charge vs GDP/capita(PPP)
Single Till
Dual Till
� � �������
���������������� 100
8
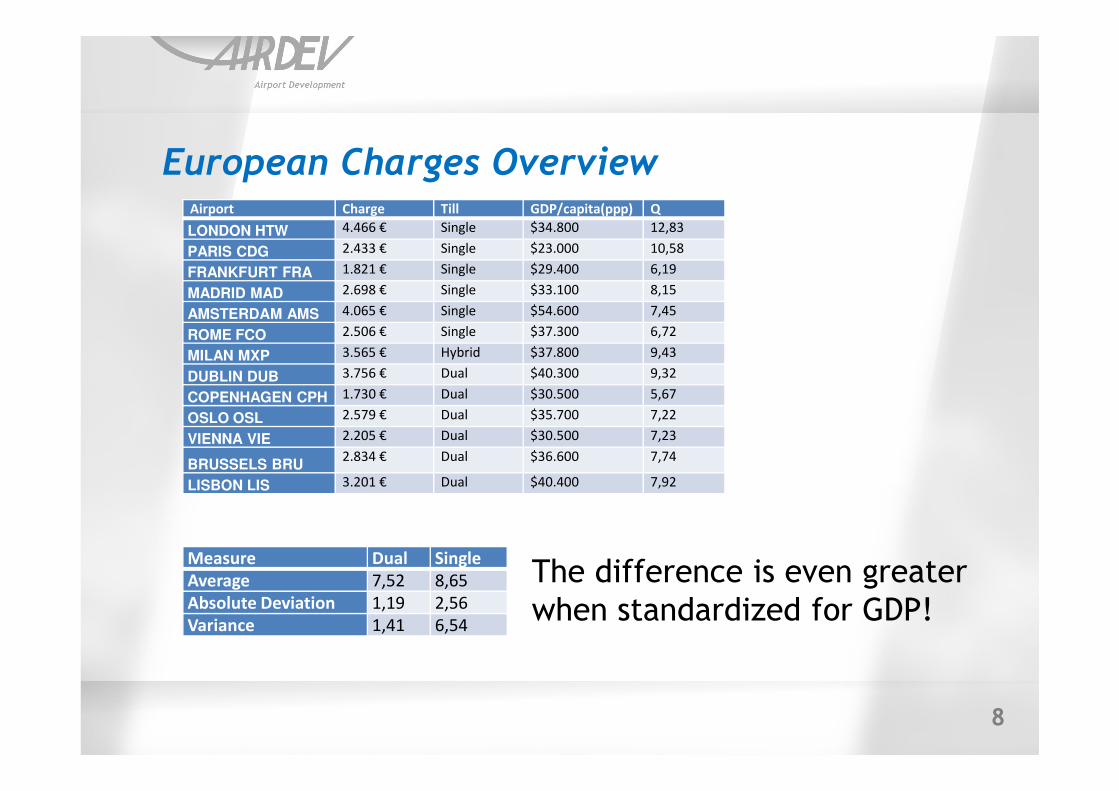
European Charges OverviewAirport Charge Till GDP/capita(ppp) Q
LONDON HTW 4.466 € Single $34.800 12,83
PARIS CDG 2.433 € Single $23.000 10,58
FRANKFURT FRA 1.821 € Single $29.400 6,19
MADRID MAD 2.698 € Single $33.100 8,15
AMSTERDAM AMS 4.065 € Single $54.600 7,45
ROME FCO 2.506 € Single $37.300 6,72
MILAN MXP 3.565 € Hybrid $37.800 9,43
DUBLIN DUB 3.756 € Dual $40.300 9,32
COPENHAGEN CPH 1.730 € Dual $30.500 5,67
OSLO OSL 2.579 € Dual $35.700 7,22
VIENNA VIE 2.205 € Dual $30.500 7,23
BRUSSELS BRU2.834 € Dual $36.600 7,74
LISBON LIS 3.201 € Dual $40.400 7,92
Measure Dual Single
Average 7,52 8,65
Absolute Deviation 1,19 2,56
Variance 1,41 6,54
The difference is even greater
when standardized for GDP!
9
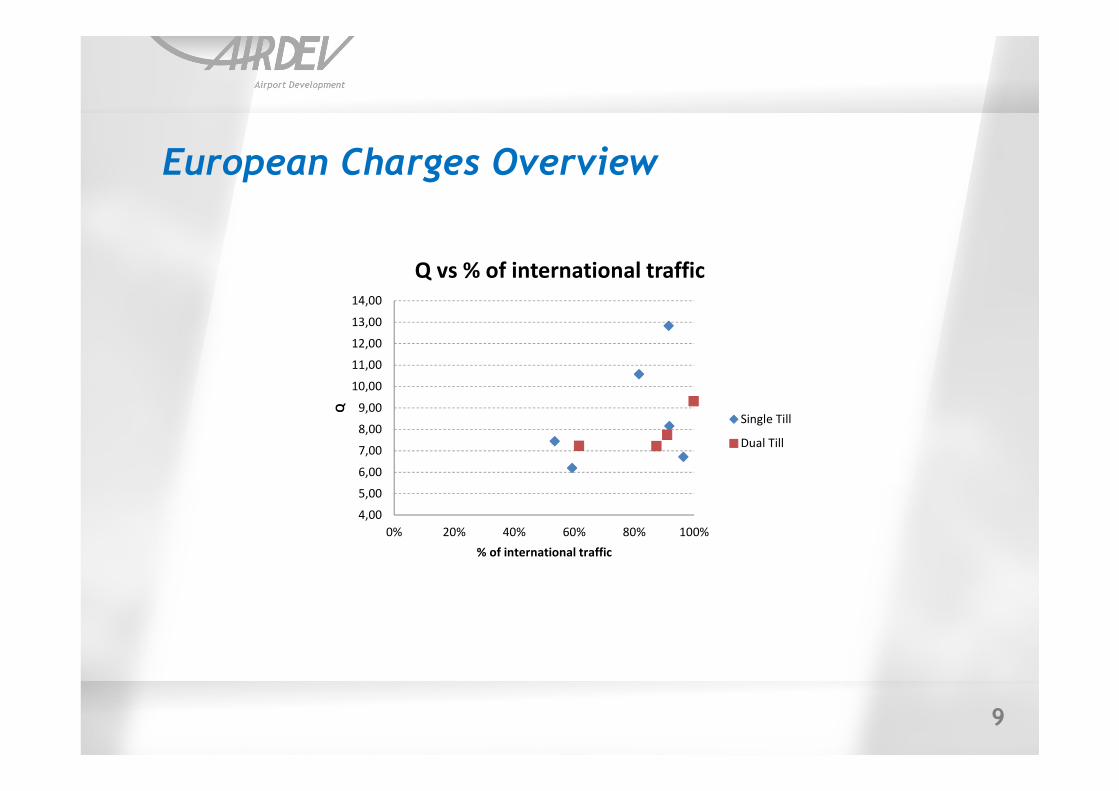
European Charges Overview
4,00
5,00
6,00
7,00
8,00
9,00
10,00
11,00
12,00
13,00
14,00
0% 20% 40% 60% 80% 100%
Q
% of international traffic
Q vs % of international traffic
Single Till
Dual Till
10
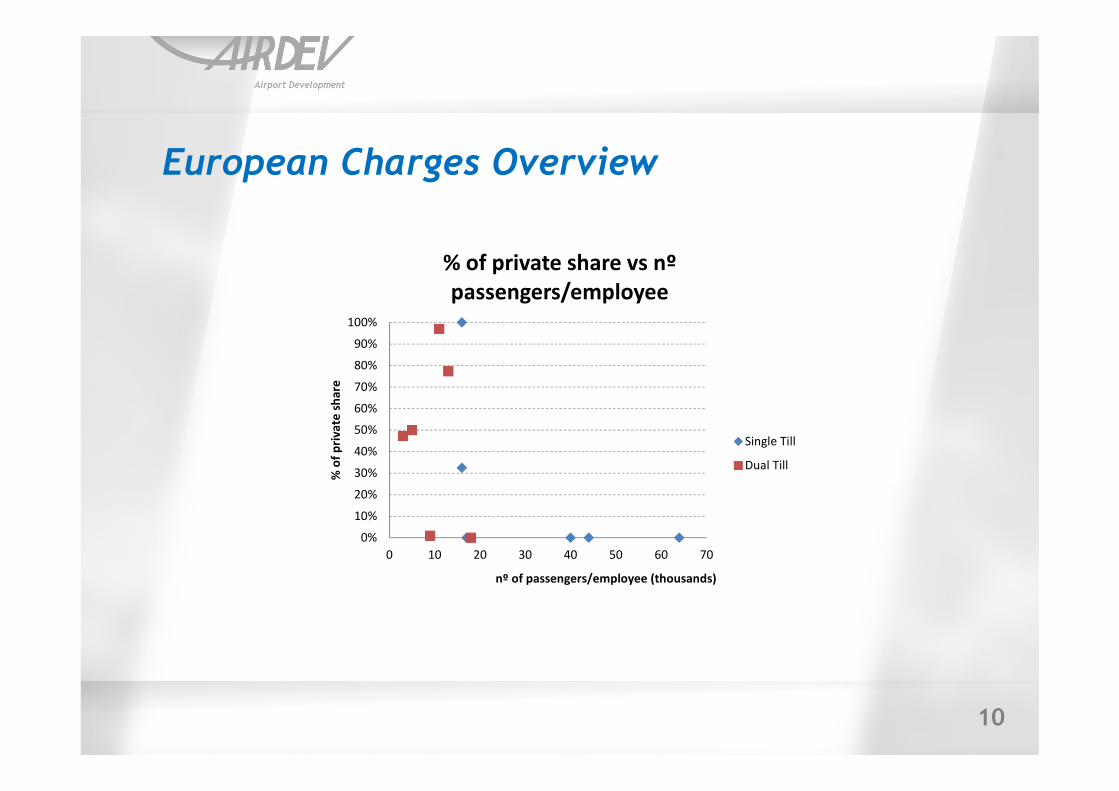
European Charges Overview
0%
10%
20%
30%
40%
50%
60%
70%
80%
90%
100%
0 10 20 30 40 50 60 70
% o
f p
riv
ate
sh
are
nº of passengers/employee (thousands)
% of private share vs nº
passengers/employee
Single Till
Dual Till
11
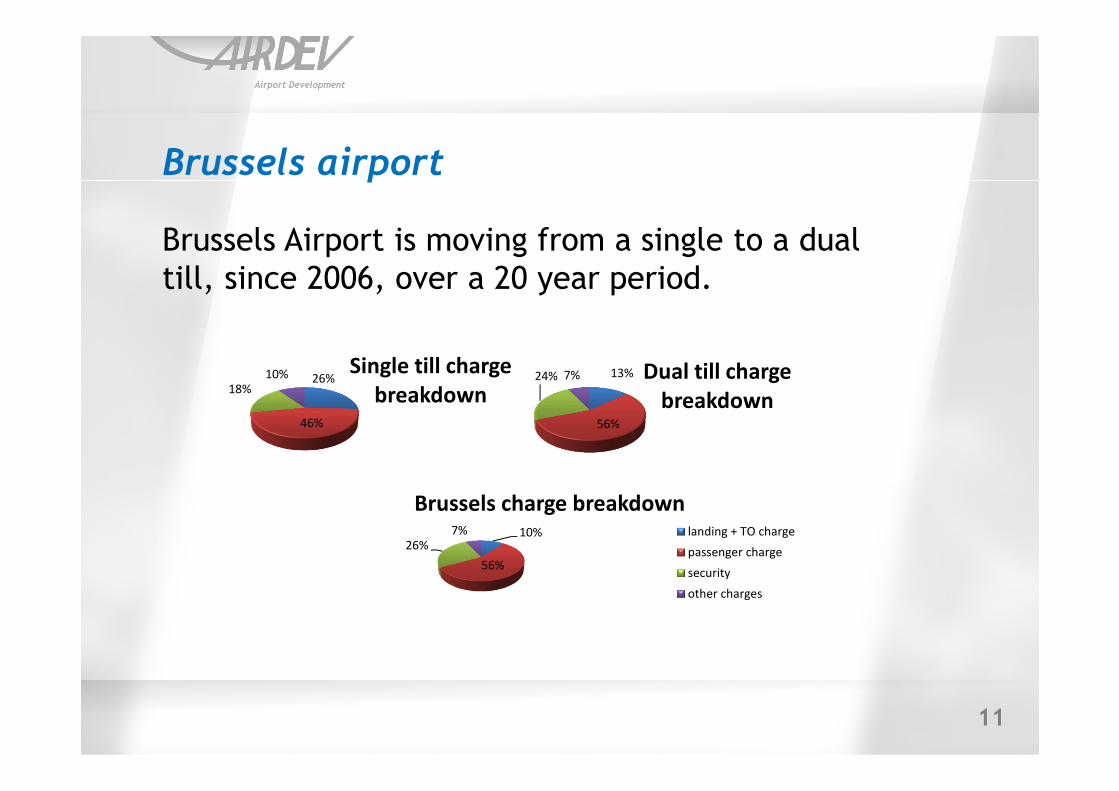
Brussels airport
26%
46%
18%10% Single till charge
breakdown13%
56%
24% 7% Dual till charge
breakdown
10%
56%
26%7%
Brussels charge breakdownlanding + TO charge
passenger charge
security
other charges
Brussels Airport is moving from a single to a dual
till, since 2006, over a 20 year period.
12
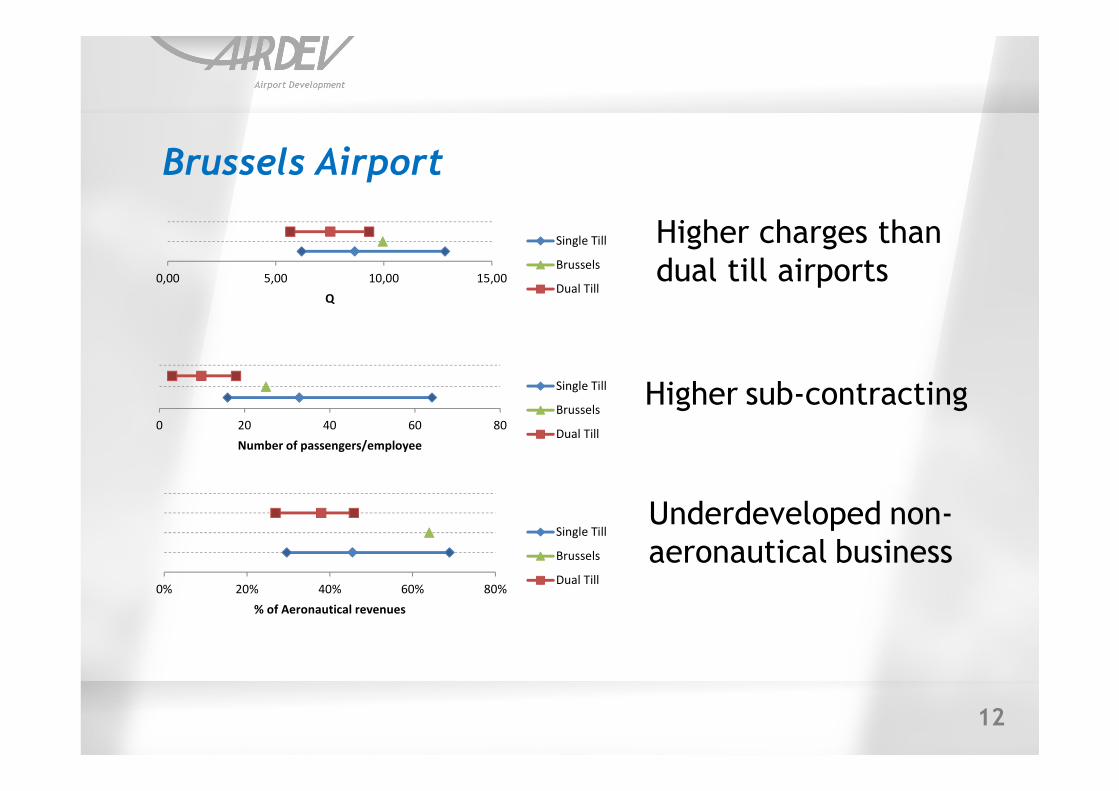
Brussels Airport
0,00 5,00 10,00 15,00
Q
Single Till
Brussels
Dual Till
0 20 40 60 80
Number of passengers/employee
Single Till
Brussels
Dual Till
0% 20% 40% 60% 80%
% of Aeronautical revenues
Single Till
Brussels
Dual Till
Higher charges than
dual till airports
Higher sub-contracting
Underdeveloped non-
aeronautical business
13
Conclusions
Single till airports show, on average, higher charges
than dual till ones
Sub-contracting levels is the parameter that better
supports this conclusion
Brussels airport is in the right track to reach a dual
till, but should try to lower charges, possibly by
reducing the ammount of sub-contracts
14
A CASE STUDY ON THE SELECTION OF DUAL TILL VERSUS SINGLE TILL CHARGES
João [email protected]
2012
15
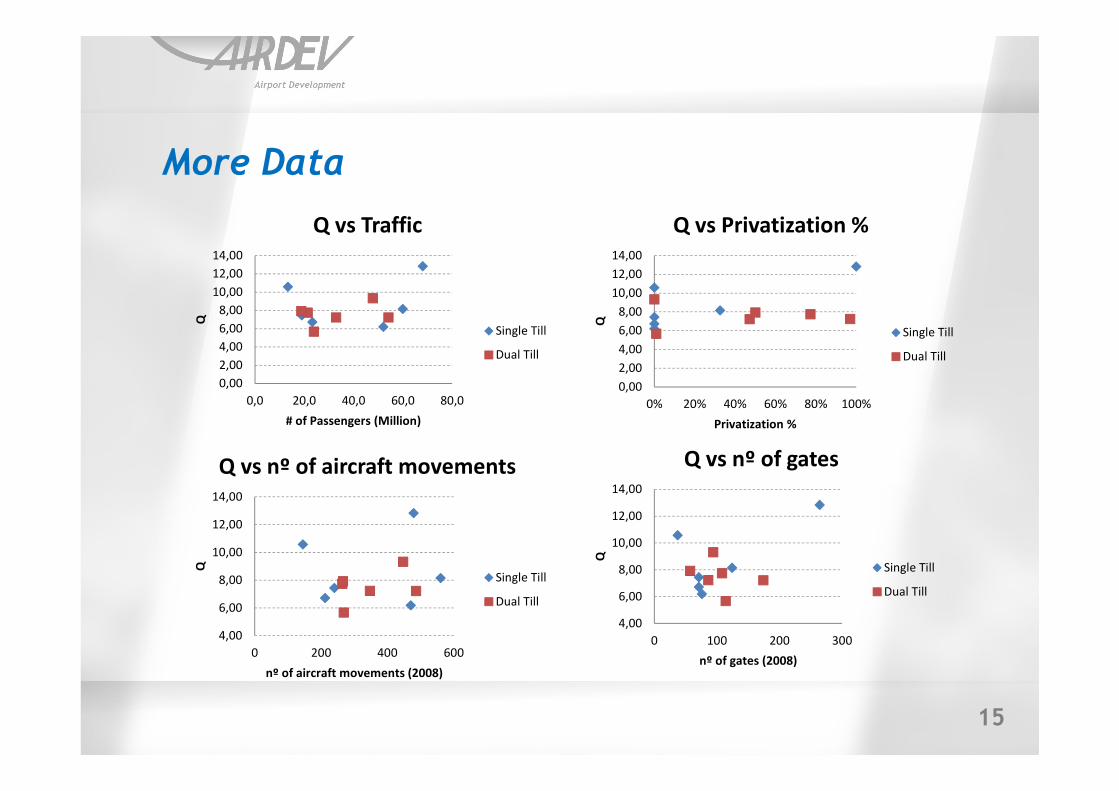
More Data
0,00
2,00
4,00
6,00
8,00
10,00
12,00
14,00
0,0 20,0 40,0 60,0 80,0
Q
# of Passengers (Million)
Q vs Traffic
Single Till
Dual Till
0,00
2,00
4,00
6,00
8,00
10,00
12,00
14,00
0% 20% 40% 60% 80% 100%
Q
Privatization %
Q vs Privatization %
Single Till
Dual Till
4,00
6,00
8,00
10,00
12,00
14,00
0 200 400 600
Q
nº of aircraft movements (2008)
Q vs nº of aircraft movements
Single Till
Dual Till
4,00
6,00
8,00
10,00
12,00
14,00
0 100 200 300
Q
nº of gates (2008)
Q vs nº of gates
Single Till
Dual Till
16
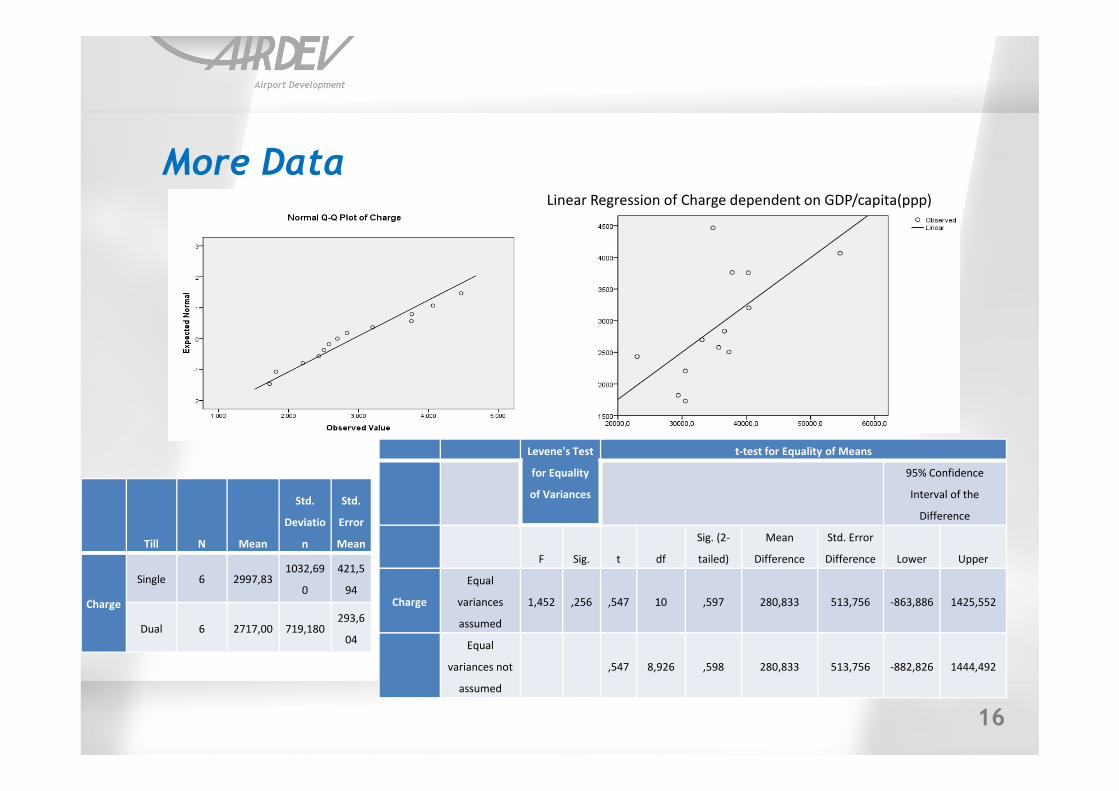
More DataLinear Regression of Charge dependent on GDP/capita(ppp)
Till N Mean
Std.
Deviatio
n
Std.
Error
Mean
Charge
Single 6 2997,831032,69
0
421,5
94
Dual 6 2717,00 719,180293,6
04
Levene's Test
for Equality
of Variances
t-test for Equality of Means
95% Confidence
Interval of the
Difference
F Sig. t df
Sig. (2-
tailed)
Mean
Difference
Std. Error
Difference Lower Upper
Charge
Equal
variances
assumed
1,452 ,256 ,547 10 ,597 280,833 513,756 -863,886 1425,552
Equal
variances not
assumed
,547 8,926 ,598 280,833 513,756 -882,826 1444,492
17
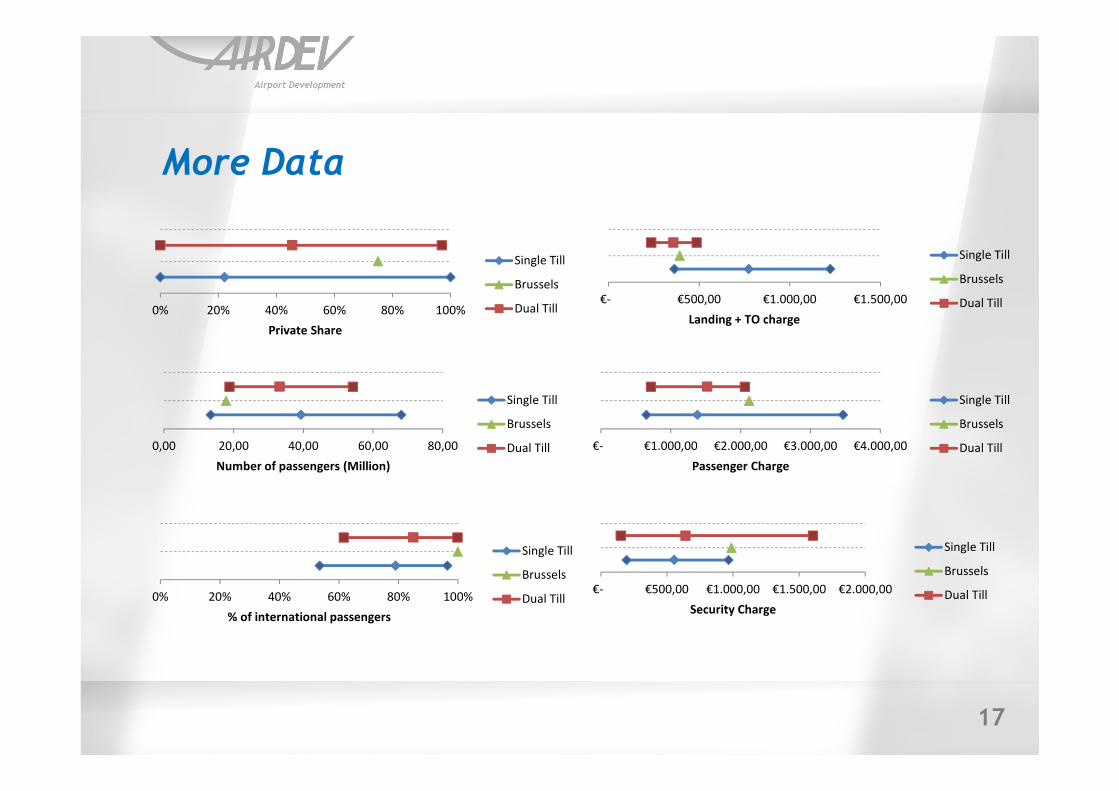
More Data
0% 20% 40% 60% 80% 100%
Private Share
Single Till
Brussels
Dual Till
0,00 20,00 40,00 60,00 80,00
Number of passengers (Million)
Single Till
Brussels
Dual Till
0% 20% 40% 60% 80% 100%
% of international passengers
Single Till
Brussels
Dual Till
€- €500,00 €1.000,00 €1.500,00
Landing + TO charge
Single Till
Brussels
Dual Till
€- €1.000,00 €2.000,00 €3.000,00 €4.000,00
Passenger Charge
Single Till
Brussels
Dual Till
€- €500,00 €1.000,00 €1.500,00 €2.000,00
Security Charge
Single Till
Brussels
Dual Till