Embed Size (px)
Citation preview

Graduate Theses and Dissertations Iowa State University Capstones, Theses andDissertations
2013
A case study on the food retail environment ofAccra, GhanaShelley Jayne OltmansIowa State University
Follow this and additional works at: https://lib.dr.iastate.edu/etd
Part of the African Languages and Societies Commons, and the Urban Studies and PlanningCommons
This Thesis is brought to you for free and open access by the Iowa State University Capstones, Theses and Dissertations at Iowa State University DigitalRepository. It has been accepted for inclusion in Graduate Theses and Dissertations by an authorized administrator of Iowa State University DigitalRepository. For more information, please contact [email protected].
Recommended CitationOltmans, Shelley Jayne, "A case study on the food retail environment of Accra, Ghana" (2013). Graduate Theses and Dissertations.13634.https://lib.dr.iastate.edu/etd/13634

A case study of the food retail system in Accra, Ghana
by
Shelley Jayne Oltmans
A thesis submitted to the graduate faculty
in partial fulfillment of the requirements for the degrees of
MASTER OF SCIENCE
MASTER OF COMMUNITY AND REGIONAL PLANNING
Co-majors: Sustainable Agriculture; Community and Regional Planning
Program of Study: Francis Owusu, Major Professor
Monica Haddad Robert Mazur
Iowa State University
Ames, Iowa
2013
Copyright © Shelley Jayne Oltmans 2013. All rights reserved.

ii
TABLE OF CONTENTS
LIST OF TABLES.......................................................................................................................... v
LIST OF FIGURES ....................................................................................................................... vi
LIST OF ABBREVIATIONS...................................................................................................... viii
ACKNOWLEDGEMENTS............................................................................................................ x
ABSTRACT................................................................................................................................... xi
CHAPTER 1. INTRODUCTION ................................................................................................... 1
1.1 The Food retail environment in developing countries .......................................................... 2
1.2 Study Area............................................................................................................................. 4
1.3 Research Problem and Questions.......................................................................................... 5
1.4 Thesis Outline ....................................................................................................................... 6
CHAPTER 2. THE CHANGING FOOD RETAIL ENVIRONMENT: A BRIEF LITERATURE REVIEW......................................................................................................................................... 7
2.1 Supermarketization................................................................................................................ 7
2.2 Impacts of Supermarketization............................................................................................ 10
2.3 Traditional Retail Environment and Distribution System in Ghana ................................... 15
2.4 Institutions and Policy......................................................................................................... 19
2.5 Changing food retail environment....................................................................................... 24
2.6 Consumer Behavior and access........................................................................................... 25
2.7 Summary ............................................................................................................................. 26
CHAPTER 3. RESEARCH METHODOLOGY .......................................................................... 27
3.1 Study Area........................................................................................................................... 27
3.2. Research Methodology and Data Collection...................................................................... 34
3.2.1 Direct Observations ...................................................................................................... 35
3.2.2 Retailer Interviews........................................................................................................ 37
3.2.3 Mapping........................................................................................................................ 38
3.2.4 Food Retail Assessment................................................................................................ 39
3.2.5 Household Surveys ....................................................................................................... 39
3.3 Data Analysis ...................................................................................................................... 42

iii
CHAPTER 4. THE FOOD RETAIL ENVIRONMENT .............................................................. 43
4.1 Traditional Markets ............................................................................................................. 43
4.2 Traditional Market Interviews............................................................................................. 46
4.2 Mini Markets ....................................................................................................................... 51
4.2.1 Food Assessment .......................................................................................................... 51
4.2.2 Mini market Interviews ................................................................................................ 54
4.3. Supermarkets...................................................................................................................... 57
4.4 Summary ............................................................................................................................. 61
CHAPTER 5. CONSUMER BEHAVIOR AND ACCESS.......................................................... 62
5.1 Where do consumers purchase food?.................................................................................. 63
5.1.1 Consumer frequency..................................................................................................... 68
5.1.2 Consumer transportation............................................................................................... 69
5.1.3 Consumer Preferences .................................................................................................. 72
5.1.4 Socioeconomic status and the choice of food retail outlets.......................................... 77
5.1.5 Statistical Tests ............................................................................................................. 79
5.1.6 Summary of findings .................................................................................................... 82
5.2 What types of foods do consumers purchase? .................................................................... 83
5.2.1 Background................................................................................................................... 83
5.2.2 Staples........................................................................................................................... 86
5.2.3 Fresh Fruits and Vegetables (FFV) .............................................................................. 88
5.2.4 Animal Source Foods (ASFs)....................................................................................... 90
5.2.5 Canned and highly processed foods ............................................................................. 91
5.2.6 Socioeconomic Analysis............................................................................................... 93
5.3 Where do consumers purchase different types of foods?.................................................... 93
5.3.1 Domestic and imported rice.......................................................................................... 94
5.3.2 Fresh Fruits and Vegetables (FFVs)............................................................................. 95
5.3.3 Processed foods ............................................................................................................ 96
5.3.4 Highly processed foods ................................................................................................ 97
5.4 Summary ............................................................................................................................. 98

iv
CHAPTER 6. SUMMARY AND CONCLUSIONS.................................................................... 99
6.1 Introduction ......................................................................................................................... 99
6.1.1 Traditional Markets remain strong ............................................................................. 100
6.1.2 Affordable transportation increases access to food .................................................... 100
6.1.3 High access to a variety of foods in the retail environment ....................................... 100
6.1.4 Neighborhood mini markets increase access to food ................................................. 101
6.2 Limitations and Constraints .............................................................................................. 102
6.3 Recommendations ............................................................................................................. 102
6.4 Future Research................................................................................................................. 103
6.5 Conclusion......................................................................................................................... 104
APPENDIX 1. SATELLITE IMAGES OF THE STUDY REGION......................................... 105
Ashongman Estates - Google Satellite Image 1/11/2010........................................................ 105
Zone 1 - Google Satellite Image 1/11/2010 ............................................................................ 106
Zone 2 - Google Satellite Image 1/11/2010 ............................................................................ 107
Zone 3 - Google Satellite Image 1/11/2010 ............................................................................ 108
APPENDIX 2. DISTRIBUTOR INTERVIEW .......................................................................... 109
APPENDIX 3. HOUSEHOLD SURVEY .................................................................................. 112
APPENDIX 4. FOODS LIST ..................................................................................................... 119
BIBLIOGRAPHY....................................................................................................................... 121

v
LIST OF TABLES
Table 1. Interviewed food traders ................................................................................................. 38 Table 2. Traditional market interviewees' characteristics............................................................. 47 Table 3. Traditional market interviewees' business characteristics .............................................. 49 Table 4. Items sold by interviewees.............................................................................................. 49 Table 5. Mini market food assessment by food types sold ........................................................... 53 Table 6. Mini market assessment by how many types of food items sold.................................... 54 Table 7. Chain supermarkets......................................................................................................... 57 Table 8. Household respondents' characteristics .......................................................................... 62 Table 9. Household family characteristics.................................................................................... 63 Table 10. Household socio-demographic characteristics.............................................................. 79 Table 11. Socioeconomic analysis and retail outlets .................................................................... 81 Table 12. Socioeconomic analysis and traditional markets .......................................................... 82
vi
LIST OF FIGURES
Figure 1. Supermarketization and traditional retailers.................................................................. 11 Figure 2. The fifteen ECOWAS member states............................................................................ 28 Figure 3. Greater Accra region by districts................................................................................... 31 Figure 4. Study area location in Greater Accra............................................................................. 32 Figure 5. Street in Ashongman Estates ......................................................................................... 33 Figure 6. Housing in Ashongman Estates..................................................................................... 33 Figure 7. Observed traditional markets and supermarkets............................................................ 36 Figure 8. Household survey zones ................................................................................................ 41 Figure 9. Middle man distributor at Haatso Yam Market............................................................. 46 Figure 10. Mini markets in Ashongman Estates........................................................................... 52 Figure 11. Container mini market interviewed ............................................................................. 55 Figure 12. Outbuilding mini market ............................................................................................. 55 Figure 13. Self-constructed mini market interviewed................................................................... 56 Figure 14. Supermarkets ............................................................................................................... 58 Figure 15. East Legon Maxmart ................................................................................................... 60 Figure 16. Retailers from which households bought food............................................................ 65 Figure 17. Traditional markets from which households bought food........................................... 66 Figure 18. Traditional markets...................................................................................................... 67 Figure 19. Comparison of shopping frequencies .......................................................................... 68 Figure 20. A tro-tro....................................................................................................................... 70 Figure 21. Modes of transportation used by households to reach preferred retail outlet.............. 71 Figure 22. Preferred retail outlets of households .......................................................................... 72 Figure 23. Consumer preferences in choosing preferred retail outlet........................................... 73 Figure 24. Comparison of preferences between traditional markets and supermarkets ............... 75 Figure 25. Preferences for Dome market...................................................................................... 76 Figure 26. Preferred retail outlets of households that shop in supermarkets ................................ 77 Figure 27. Fufu in a tomato sauce with canned mackerel (fish)................................................... 85 Figure 28. Corn and cassava dough in a traditional market.......................................................... 87 Figure 29. Staple consumption by households ............................................................................. 87 Figure 30. FFV consumption by households ................................................................................ 89 Figure 31. FFV consumption by households: domestic versus imported..................................... 90 Figure 32. ASF consumption by households ................................................................................ 91 Figure 33. Canned food consumption by households................................................................... 92 Figure 34. Highly processed food consumption by household..................................................... 93 Figure 35. Retail outlets where consumers purchase domestic versus imported rice................... 94 Figure 36. Retail outlets from where consumers purchase domestic versus imported FFVs ....... 96

vii
Figure 37. Retail outlets from where consumers purchase canned foods..................................... 97 Figure 38. Retail outlets from where consumers purchase highly processed foods ..................... 98

viii
LIST OF ABBREVIATIONS
AMA – Accra Metropolitan Area
AOV– One-factor analysis of variance
ASFs – Animal Source Foods
CBD – Central Business District
DR-NCDs – Diet related non-communicable diseases
ECOWAS – Economic Community of West African States
FAO – Food and Agriculture Organization
FDI – Foreign Direct Investment
FFVs – Fresh Fruits and Vegetables
GDP – Gross Domestic Product
GIS – Geographical Information Systems
GPRTU – Ghana Private Road Transport Union
GPS – Global Positioning System
GTUC – Ghanaian Trades Union Congress
IMF – International Monetary Fund
ISI – Import Substitution Industrialization
Kcals – Kilocalories
MMDA – Metropolitan, Municipal and District Assemblies
NCDs – Non-communicable diseases
ROSCA – Rotating Credit and Savings Associations
SAPs – Structural Adjustment Programs
SSA – Sub-Saharan Africa

ix
TFCs – Transnational Food Corporations
UN- United Nations

x
ACKNOWLEDGEMENTS
I have a great many people to thank for their guidance, assistance and support throughout
my research project experience. My advisor, Dr. Francis Owusu, who began this journey the first
day we met by making me believe that graduate school at Iowa State University would get me
closer to my dreams. Throughout the journey he always had a friendly smile and a sincere "how
are you doing?" when I had yet another question, dilemma or just needed to chat. Dr. Monica
Haddad remained confident in me, cheering me on till the end. I would also like to thank Dr.
Robert Mazur for his guidance. Thank you all for your support throughout this process
Ghana is a beautiful country and the people could not have been more friendly or
supportive. Dr. Richmond Aryeetey offered me valuable guidance throughout my field research
experience and an office desk from which I cultivated many a great relationships. My field
assistant, Akua Ageiwaa Bonnah, not only made it possible for me to communicate with the
Ghanaian people, but made our days of work enjoyable as well. I thank all the wonderful people
I met throughout my time in Ghana, who taught me about the culture and their way of living.
I feel so lucky to have had this opportunity. Without the financial support of the Butler
Travel Award and Murray B. Weir Scholarship, this research project most likely would not have
come to fruition. And finally to my family and friends who supported me throughout the ups and
downs of this arduous journey: Thank You All.

xi
ABSTRACT
The increased presence of modern/Western style food retail outlets is changing the food
retail environment in many developing countries. This phenomenon, known as
“supermarketization,” is just recently taking off in Sub-Saharan Africa. Through a case study
methodology, this research uses direct observation, retailer interviews, mapping, a food retail
assessment and household surveys, first to describe the food retail environment of consumers in
the neighborhood of Ashongman Estates, located in Accra, Ghana. Second, the study evaluates
consumer access to food and consumer behavior related to retail outlets and food types. Results
demonstrate that, although supermarkets have entered the food retail environment, traditional
retailers continue to be the main and preferred food retail outlets for consumers. The results also
show that there is a high level of access to a wide variety and good quality of foods throughout
the built environment. This research offers recommendations to maintain this good access to
food and improve the traditional food retail environment.

1
CHAPTER 1.
INTRODUCTION
Despite increasing poverty and rapid urbanization in the global south, urban food systems
have not received the attention they deserve. However, in the past twenty years there has been
increased attention paid to the entrance of modern/Western style food retail outlets like
supermarkets, hypermarkets and convenience stores in developing countries, especially in urban
areas. This has often been called the ‘supermarket revolution,’ otherwise known as
‘supermarketization’ (Regmi & Gehlhar, 2001; Goldman, Ramaswami, & Krider, 2002).
Supermarketization began in the early 1990s in urban areas in the developing world and has
spread from larger, richer countries to smaller and poorer countries and also from larger cities to
smaller towns (Makoka, 2005; Reardon & Hopkins, 2006). In many countries it has transformed
the production, processing, distribution, retailing and consumption of food (Weatherspoon &
Reardon, 2003). This study’s focus is on consumer food behavior and access in the food retail
environment in the Greater Accra metropolitan area in Ghana, an area that began to experience
supermarketization in the early 2000s. The primary focus is food retail sector consumption,
defined as ‘all activities and processes by which an individual, society and culture acquires (e.g.
purchases, strategizes, manages, ingests, digests) and utilizes (e.g. cooks, ritualizes, presents)
food material that has been produced and distributed’ (Unger & Wooten, 2006, p. 14). To better
understand the food retail environment and consumption, the study also briefly examines the
food distribution system, including the ‘transporting, storing and marketing of food products to
consumers’ (Unger & Wooten, 2006, p. 14).
2
This chapter begins with a brief overview of traditional food retail environments in
developing countries, followed by the drivers and impacts of supermarketization. The second
section introduces the study area of Greater Accra, Ghana and explains why it is an ideal area to
conduct such a study. The third section presents the research problem and four research
questions. The final section outlines the remaining chapters of the thesis.
1.1 THE FOOD RETAIL ENVIRONMENT IN DEVELOPING COUNTRIES
The food retailing environments in developing countries are traditionally different from
developed countries in many ways. The main food retail outlets in developing countries are wet
markets,1 that are open air public markets with many retailers specializing in selling a small
amount of one item or a few items (Weatherspoon & Reardon, 2003). In this study they are
referred to as traditional markets. The distribution system supplying these markets with food
products links millions of smallholder producers to thousands of small food retailers in urban
areas (Lyon, 2003). In addition to traditional markets, there are a variety of other small food
retailers spread throughout the urban environment. This happens because a lack of zoning and
enforcement of laws allow petty traders and hawkers to sell goods in public spaces, along
roadsides and in residentially zoned neighborhoods (Maxwell, 1998; Asiedu & Agyei-Mensah,
2008).
The main drivers of supermarketization in developing countries are urbanization and
liberalization of markets and finance (Kennedy, Nantel, & Shetty, 2004; Reardon, et al., 2003).
Urbanization is often accompanied by increased incomes and a growing middle class that has
more purchasing power and greater demands for quality and safety (Popkin, 2002). Lifestyles
1 The term wet indicates the continuous wetness of the floor as a result of the frequent spraying of food products and cleaning of stalls (Goldman, Krider, & Ramaswami, 1999).

3
also change with urbanization˗˗ women are more likely to work outside the home and more time
is spent in transit to and from work and errands. These changes increase the demand for
convenience foods (Kennedy, Nantel, & Shetty, 2004). The liberalization of agrifood markets
and trade in the 1980s opened the food systems of developing countries to global markets and
forces. This resulted in decreased food prices and increased trade in food, especially processed
foods. For instance, global food trade grew from US $224 billion in 1972 to US $438 billion in
1998 (Chopra, Galbraith, & Darnton-Hill, 2002). The liberalization of retail markets and finance
in the 1990s also increased foreign direct investment (FDI)2 by transnational corporations in food
production, processing, distribution and the retail environment in developing countries (Coe &
Wrigley, 2007; Lang, 2003; Chopra, Galbraith, & Darnton-Hill, 2002). In this study these
transnational corporations will be referred to as transnational food corporations (TFCs)3.
Several possible negative outcomes of supermarketization have been highlighted in the
literature. First, supermarkets quickly change the food retail environment and become the
dominant food retail outlet, displacing traditional retailers (Weatherspoon & Reardon, 2003;
Reardon & Hopkins, 2006; Neven & Reardon, 2004). Second, supermarkets increase access to
unhealthy foods in the food retail environment, altering consumption behaviors (Rayner, et al.,
2007; Popkin, 2006; Kennedy, Nantel, & Shetty, 2004; Rosen & Shapouri, 2008; Stamoulis,
Pingali, & Shetty, 2004). Third, supermarkets transform the food distribution system by creating
new supply chains that negatively impact small domestic producers, suppliers and distributors
(Neven & Reardon, 2004). The above findings are mostly based on research in Eastern Europe,
Asia and Latin America, as well as in Kenya and South Africa in Sub-Saharan Africa (SSA).
2 The purchase or construction of assets such as land, factories, machines, buildings and enterprises in one country by firms from another country (World Health Organization, 2013) 3 Firms that own or control food production, processing, distribution and/or retailing facilities in more than one country through FDI (Coe & Wrigley, 2007)

4
However, there is little research in the rest of SSA to support these findings. In fact, the most
recent research calls into question whether supermarketization negatively impacts traditional
producers, distributors and retailers or actually offers more economic opportunities (Farina,
Nunes, & Monteiro, 2005; Goldman, Ramaswami, & Krider, 2002; Maruyama, Masayoshi, &
Trung, 2007; Humphrey, 2007; Traill, 2006). Furthermore, research finds a widespread
availability of processed and unhealthy foods in both modern and traditional retailers in
developing countries due to the liberalization of trade and finance (Boselie, Henson, &
Weatherspoon, 2003).
1.2 STUDY AREA
This study examines the current food retail environment in Greater Accra, Ghana, during
an era of increasing numbers of supermarkets and other Western style retail outlets. The Greater
Accra metro area in Ghana is an ideal study area because of several factors. First, like many
countries experiencing supermarketization, Ghana is experiencing high rates of urbanization (at
3.1 percent/per year) in Greater Accra) and currently over 50 percent of the total population
resides in urban areas. Urbanization is linked to increases in income and a growing middle class
with more purchasing power (Ghana Statistical Service, 2012; Reardon et al., 2003). Second,
West Africa and Ghana have a long history of female dominated trade, distribution and retail in
food products. This food distribution and retail system is a major part of the rural agriculture and
urban informal sectors that dominate the Ghanaian economy4 (Britwum, 2011). It is a highly
complex system controlled and regulated by the government and non-governmental groups such
as trade associations (Clark, 1994; Britwum, 2013). Third, in 1983, Ghana was the first African
4 Ghana’s economy can be split into three sectors: the formal, rural agriculture and urban informal (Britwum and Martins, 2008). Rural agriculture and urban informal sectors are self-employed workers and waged and non-waged employees (Britwum, 2011).

5
nation to implement Structural Adjustment Programs (SAPs)5 that resulted in the liberalization of
trade and finance (Opoku, 2010). Fourth, in the last decade, Greater Accra has been experiencing
a boom in FDI for the development of Western style retail outlets. The largest and most
successful is the 58-shop Accra Mall which draws up to 1 million visitors every three months
(Bigg & Motsoeneng, 2013). The combination of these factors makes the Greater Accra metro
area in Ghana an interesting case study to examine the food retail environment in a developing
country.
1.3 RESEARCH PROBLEM AND QUESTIONS
The introduction and expansion of supermarkets in Greater Accra are visible signs of
change in the food retail environment. However, the implications of these changes are not well
understood, especially in terms of impacts on the traditional retail outlets and consumer behavior
and access pertaining to food. This study seeks to fill these gaps by identifying consumer food
consumption behavior and access in the current food retail environment. To achieve this goal the
study asks four questions:
1. How is the current food retail environment in the Greater Accra metro area in Ghana structured?
2. In the current food retail environment, where do consumers buy food for in home consumption and how do they interact in the built environment?
3. In the current food retail environment, what types of foods are consumers buying for
in-home consumption?
4. In the current food retail environment where do consumers purchase different types of foods for in-home consumption?
5 Neoliberal economic policies for developing countries that have been promoted by the World Bank and International Monetary Fund (IMF) since the early 1980s by the provision of loans conditional on the adoption of such policies (World Health Organization, 2013).

6
Answers to the first question will be helpful in identifying food outlets and describing the
food retail environment in which consumers in Ashongman Estates (a district in Greater Accra)
purchase their food. Answers to the second through fourth questions will be helpful in
identifying and describing how consumers in Ashongman Estates behave and access food in the
food retail environment. In this study, consumer behavior and access is operationalized by
relative food prices and transaction costs,6 including proximity, variety and quality, access to
transportation and operation hours.
1.4 THESIS OUTLINE
This thesis is organized into six chapters. Following this introduction, Chapter 2 –
reviews the literature on the food retail environment in Ghana, with a focus on the entrance of
supermarkets, it explores the likely impacts and outcomes on consumption behavior, food access
and traditional food retail environment. Chapter 3 is the methodology and introduces the study
area, as well as the methods of data collection and analysis. Chapter 4 – discusses the findings
about the food retail environment of consumers in the study area. Chapter 5 – discusses the
findings related to consumer behavior and access within the food retail environment. Chapter 6 is
the conclusion; it summarizes the key findings, the limitations and constraints of the study and
presents recommendations and possible future research.
6Costs other than the money price that are incurred in trading goods and services, including search and information costs, bargaining and decision costs, policing and enforcing costs (Johnson, 2005).

7
CHAPTER 2.
THE CHANGING FOOD RETAIL ENVIRONMENT: A BRIEF LITERATURE REVIEW
This study in the Greater Accra metro area explores food access and consumer behavior
in the present day food retail environment. The purpose is to better understand the phenomenon
of supermarketization in Sub-Saharan Africa (SSA), especially in West Africa. This chapter
covers the literature review. The first section traces the history of supermarketization in
developing countries, focusing on research in SSA, especially in Kenya and South Africa. The
second section discusses the history of the Ghanaian food distribution and retail environment to
give this study context.
2.1 SUPERMARKETIZATION
The first wave of supermarketization in the developing world took place in South
America, East Asia outside China, northern–central Europe, and South Africa. In the 1990
period, the average share of supermarkets in food retail in those first wave developing countries
was only 10-20 percent and increased to an average of 50-60 percent by the early 2000s
(Reardon, Timmer, & Berdegue, 2004). The second wave began in the mid-1990s and included
countries in Central America, Mexico, Southeast Asia, and Southern–Central Europe where the
share went from 5-10 percent in 1990 to 30-50 percent by the early 2000s. The third wave began
in the late 1990s and early 2000s and included part of Africa, a few countries in Central and
South America, and countries in Asia and Eastern Europe, including China, India and Russia.
The share of supermarkets in the Chinese market grew three times as rapidly in 2003 as in Brazil

8
and Argentina a decade earlier (Weatherspoon & Reardon, 2003; Reardon & Hopkins, 2006).
Currently, China’s supermarket sector is the largest and fastest growing in the world (Watson,
2013).
In Africa, supermarkets first started in the richest countries. South Africa is the only SSA
country in the first wave of supermarketization, while Kenya, Zambia, and Zimbabwe are in the
early phase of the third wave (Reardon & Timmer, 2007; D'Haese & Van Huylenbroeck, 2005).
In 2004, supermarkets in South Africa controlled an estimated 50 –60 percent of the food retail.
South Africa had the highest proliferation of supermarkets in SSA with 1700 supermarkets for 35
million people. In the 1990s, supermarkets expanded beyond urban areas into poorer regions and
small towns (Reardon, Timmer, & Berdegue, 2004). In the late 1990s, the supermarket sector in
Kenya was very small, but by 2004 it was estimated that 20 percent of urban food retail was
through supermarkets in many cities and larger towns. Of the supermarkets, 80 percent are part
of a chain of supermarkets. Kenya also had approximately 225 supermarkets/hypermarkets, with
accelerated growth of 18 percent annually. However, 17 percent of the food market was
controlled by other types of retail outlets like chain convenience stores and mini-supermarkets.
The remaining 63 percent of food sales came through informal traditional retailers (Neven &
Reardon, 2004). In the late 1990s to mid-2000s, supermarkets became established in other SSA
countries like Rwanda, Tanzania, Uganda and Malawi (Makoka, 2005).
The increase of modern food retail outlets has its origin in the liberalization of global
agrifood markets and finance, beginning in the early 1980s through the 1990s with the
implementation of SAPs. At the same time, the food retail markets in developed countries
became saturated, which drove TFCs to seek out emerging markets in developing countries
(Lang, 2003). The liberalization of markets and finance allowed TFCs to leverage their large
9
scale and cash flow and take advantage of low inflation and easily accessible equity financing to
increase FDI in emerging markets in developing countries (Coe and Wrigley, 2007). FDI in retail
is mainly carried out by the leading global retail multinationals, Ahold, Carrefour, and Wal-Mart,
and smaller global chains and regional multinationals such as Shoprite7, based in South Africa.
In Latin America global multinationals constitute roughly 70-80 percent of the top five retail
chains in most countries. In addition, the top five chains per country have 65 percent of the
supermarket sector (Weatherspoon & Reardon, 2003; Reardon & Timmer, 2007; Reardon &
Berdegue, 2002).
FDI has played a major role in increasing the number of supermarkets in developing
regions, but in Africa FDI has remained low and inconsistent geographically and over time
(Ndikumana & Verick, 2008). One exception is the supermarket chain Shoprite. It is the leading
African TFC that has provided regional FDI and has extensive experience in entering
smaller/poorer neighboring countries (Weatherspoon & Reardon, 2003). For instance, Shoprite
opened their first store outside of South Africa in 1995 in Lusaka Zambia (ShopRite, 2013).
Shoprite also introduced a new philosophy for grocery stores in Africa and it targeted
populations of all socioeconomic classes by providing the lowest prices for basic food and
household requirements, in contrast to other marketing strategies of targeting niche markets such
as the affluent and expatriates (Miller, 2008). Since TFC investments in Africa remain low,
domestic chains have filled this gap and are responsible for the growth in number and spread of
modern retail outlets in SSA countries (Neven & Reardon, 2004).
Generally, supermarketization takes place in areas undergoing rapid urbanization. First,
urbanization is often accompanied by increased incomes and a growing middle class that are the
7 Africa's largest food retailer operating in 17 countries across Africa and the Indian Ocean Islands (ShopRite, 2013).

10
first (after the affluent and expatriates) to begin frequenting supermarkets in developing
countries (Traill, 2006; Regmi & Gehlhar, 2005). Second, there are higher opportunity costs in
urban areas due to increased time spent in transit and women's employment outside the home
(Kennedy, Nantel, & Shetty, 2004). This makes convenience an important factor in shopping
decisions in urban areas. For instance, instead of traditional shopping habits where consumers
visit several retailers and are required to bargain to get the best prices, supermarkets offer the
ability to purchase all products in one location where prices are set (Frazão, Meade, & Regmi,
2008). Third, there is increased access to technologies like vehicular transportation and
refrigeration in urban areas. This makes it easier to purchase large amounts of food products
once a week in one location like a supermarket that offers free and easily accessible parking
(Popkin, 2006). Fourth, higher standards of living can also increase demand for higher quality
and food safety, which is part of the attractiveness of supermarkets (Weatherspoon & Reardon,
2003). The effects of urbanization, such as increased income and access to technologies and thus
demands for higher quality and convenience foods, may result in the adoption of modern
supermarkets as the main food retail outlet in developing countries.
2.2 IMPACTS OF SUPERMARKETIZATION
Supermarkets have played a significant role in increasing food safety standards across the
world and are increasingly the vehicle for providing a diverse diet to consumers in developing
countries, but there are possible negative impacts on the existing food retail environment and
distribution system (Popkin, Adair, & Wen Ng, 2011; Timmer, 2004). First, it is predicted that
supermarkets will quickly change the food retail environment and become the dominate food
retail outlet, displacing traditional retailers (Weatherspoon & Reardon, 2003; Reardon &
Hopkins, 2006; Neven & Reardon, 2004). Second, supermarkets will increase access to

11
unhealthy foods in the food retail environment, altering consumption behaviors (Rayner, et al.,
2007; Popkin, 2006; Kennedy, Nantel, & Shetty, 2004; Rosen & Shapouri, 2008; Stamoulis,
Pingali, & Shetty, 2004). Third, supermarkets will transform the food distribution system by
creating new supply chains that negativily impact small domestic producers, suppliers and
distributors, although this is not covered in this study (Neven & Reardon, 2004).
A great deal of research claims that supermarkets will quickly change the food retail
environment in developing countries and become the dominate food retail outlets, displacing
traditional retailers like "mom and pop stores," market traders in traditional markets, mini market
proprietors and hawkers (Figure 1) (Weatherspoon & Reardon, 2003; Reardon & Hopkins, 2006;
Neven & Reardon, 2004).
Figure 1. Supermarketization and traditional retailers

12
For instance, in Latin America, where in one decade food retailing made the change that
took the US grocery retail sector 50 years; there was a marked decline in small traditional stores
and plaza markets. Between 1984 and 1993, 64,198 small stores went out of business in
Argentina and between 1991 and 1995 5240 small shops closed in Chile (Reardon & Berdegue,
2002).
On the other hand, Goldman and colleagues (2002) believe that new Western style retail
outlets will not push out traditional markets and smaller food outlets8. They view the entrance of
supermarkets as a simple diversification of the food production, distribution and retail system
that does not appear to be harming traditional actors (Goldman, Ramaswami, & Krider, 2002;
Tschirley, 2010; Farina, Nunes, & Monteiro, 2005). For instance, in Hong Kong, which has a
large amount of widely dispersed supermarkets, consumers continue to frequent traditional
markets to purchase fresh fruits and vegetable (FFVs), as well as fish and meat products. They
assert that traditional markets in these sectors have a competitive advantage over supermarkets
due to not only traditional shopping habits, but also difficulties for supermarkets in creating and
entering domestic supply chains of FFVs and other non-processed foods (Goldman, Ramaswami,
& Krider 2002). Furthermore, research by Farina and colleagues (2005) note that in Brazil there
has been a growth in independent supermarkets and traditional retailers, creating a more diverse
food retail environment.
Research from several developing countries seems to suggest that consumption behaviors
in urban centers are changing with the entry of supermarkets in the food retail environment
(Rayner, et al., 2007; Minten, 2008). Supermarkets are said to offer more variety, quality,
8 Additional research in support of this argument is (Maruyama, Masayoshi, & Trung, 2007; Reardon & Timmer, 2007; Minten, 2008)

13
convenience and competitive prices in high-value added foods like processed goods. This shift in
consumption is known as the nutrition transition -- a shift from diets dominated by starchy roots
and coarse grains to a diet with an increased intake of refined grains, fat in vegetable oils, sugars
and sweeteners, and animal source foods (ASFs) (Popkin, 1994). For instance, between the
1960s and mid-2000s the average caloric availability in the developing world increased from
about 1950 to 2680 kcals/person/day (Schmidhuber & Shetty, 2005). This increase is attributed
especially to increased available calories in meat (119%), sugar (127%) and vegetable oils
(199%) (Kearney, 2010). However, the nutrition transition is associated with an increase in
overweight and obesity and an increase in diet related non-communicable diseases (DR-NCDs)
(Drewnowski & Popkin, 1997).
Consumption patterns consistent with the nutrition transition appear first in the affluent
and urban populations. A rise in incomes in developing countries allows consumers to increase
money spent on food, while the proportion of total income devoted to food purchases declines
(Frazão, Meade, & Regmi, 2008). This situation is similar to the circumstances many European
countries were under during their period of transformation and can be described by Engel’s
Law.9 The extra income is first spent to increase calories and then after a high enough increase in
income, consumers tend to purchase more expensive, higher quality, and value-added forms of
cereals rather than cheaper domestic staples (Frazão, Meade, & Regmi, 2008). Furthermore,
there is often a high social desirability and a wish to emulate Western culture (Regmi & Gehlhar,
2001). Supermarkets appear to be the natural place to buy such products because they carry a
greater variety of processed foods and in some countries prices are lower than smaller local
9 Named after the 19th century German Statistician Ernst Engel and states that low-income households must devote at least a minimum amount to meet basic food needs and as income increases, households may spend some of this additional income on food, but will allocate proportionally more on other, nonfood items (Frazão, Meade, & Regmi, 2008)

14
shops due to significant economies of scale, good retail logistics, centralized procurement,
consolidated distribution and better inventory management (Timmer, 2009; Pingali, 2006;
Weatherspoon & Reardon, 2003). On the other hand, research has found that these foods are also
marketed by traditional retailers (Neven, et al., 2006).
Although supermarkets in developing countries provide a diverse and a variety of food
product, they do not initially provide FFVs. Typically, supermarkets first tend to penetrate the
market for processed foods because those products are easier to procure, manage inventories, and
merchandise, compared to perishables (Neven, et al., 2006; Reardon & Hopkins, 2006). Even
where supermarkets have begun to sell FFVs, they continue to hold small shares of the market.
For example, supermarkets have 50 percent of the food retailing in Argentina and Mexico but
only control 30 percent of FFV retailing and in Chile supermarkets have 50 percent of food
retailing, but only 3-8 percent of FFV retailing (Reardon & Berdegue, 2002). In Kenya, 40
percent of marketed FFVs go directly through the supermarket procurement system, while only 7
percent is purchased through the traditional market and then goes to supermarkets. In South
Africa 53 percent of FFVs continue to be sold through traditional markets (Weatherspoon and
Reardon 2003). It was anticipated that the supermarket share of the FFV market would grow
quickly, however it has remained low and is growing slowly (Tschirley, 2010).
There are several reasons supermarkets have not broken into the FFV market. First,
competition from traditional markets tends to be more challenging as consumers often hold on to
daily shopping habits for fresh foods (Neven, et al., 2006). Second, often consumers have the
perception that produce should be purchased daily to guarantee freshness and quality and it is
believed that traditional markets have fresher produce. In addition, many small produce mini
markets fit well into dense urban areas compared to larger supermarkets and are able to provide

15
cheaper prices due to little or no overhead (Maruyama, Masayoshi, & Trung, 2007).
Furthermore, mini markets often provide credit to customers. Asian supermarkets buy through
the same wholesale markets as traditional market traders, implying a lack of buying advantage.
There are high costs for supermarkets because wholesale markets do not presort or pre-grade
produce, forcing the supermarket to invest money in this task in order to sell high quality fresh
goods in a self-service environment. Supermarkets also incur higher labor, rental, and overhead
costs and greater losses from waste and shrinkage (Gorton, Sauer, & Supatpongkul, 2011).
Nonetheless, supermarket managers realize the importance of the FFV market and continue to
develop marketing methods to attract consumers and generate profits.
In summary, supermarketization is spreading into developing countries but they have yet
to enter every sector of the food market. Increased rates of urbanization and foreign influences
have increased the amount and types of modern food retail outlets and demand but there are
doubts that supermarketization will take place in SSA countries like it has in other developing
countries (Tschirley, 2010). Thus the following section will describe and explain the traditional
food retail environment and distribution system in Ghana in order to give context to
supermarketization in the study area.
2.3 TRADITIONAL RETAIL ENVIRONMENT AND DISTRIBUTION SYSTEM IN GHANA
As stated previously, the food retail environment includes all activities and processes by
which an individual, society and culture acquires and utilizes food material and the food
distribution system is the transportation, storage and marketing of food products to consumers
(Unger & Wooten, 2006). There are several types of suppliers, distributors and retailers involved
in the supply chain and retail of food products in Ghana. Women are the majority of these actors

16
and include farmers, travelers, marketers, wholesalers, petty traders and hawkers. Farmers
produce food and, in some cases, individual farmers or groups of farmers also bring their harvest
to urban areas to sell. Travelers spend the majority of their time on the road and bring food from
farm gate or regional markets to traditional markets in urban areas. After the traveler or farmer
reaches the traditional market, typically a wholesaler sells the items based on commission or on a
profit basis. The wholesaler receives one truckload after another to sell to buyers. According to
Clark (1994), it is rare for petty traders who sell small quantities of foods suitable for household
consumption in traditional markets and throughout the urban environment to travel to producers
to buy their goods. Typically petty traders buy their goods from a trader in the wholesale market.
Marketers are the exception to the norm. They travel daily or occasionally to village markets or
to producers to buy goods and return to a traditional market in an urban area to sell the products
they acquire (Clark, 1994). Different food types like grains that are easier to store have fewer
intermediaries compared to fresh produce that needs to reach the market quickly to avoid
spoilage (Lyon, 2003).
The main food retail outlets in SSA and Ghana continue to be traditional markets
(Britwum A. O., 2013; Weatherspoon & Reardon, 2003). Traditional markets are designated
areas for the retail and/or wholesale of goods and foods by traders. The retail sector serves
consumers (such as households) and are organized in commodity-specialized areas where a large
number of petty traders are concentrated who sell relatively small quantities of similar foods
(i.e., the onion shed, the yam market) (Lyon, 2003; Clark, 1994). The wholesale sector serves
consumers who make large purchases, such as institutions and restaurants. The wholesale yard
has a different type of set-up, with a small number of traders and a large amount of goods,
located on the outer edge of the market in larger areas where trucks can enter and unload. These

17
spaces are set up to move large amounts of goods quickly. On the sidewalks and streets
surrounding traditional markets, compared to the interior of the formal markets that are set up by
commodity groups, it is common to see goods (i.e. food, electronics, and clothes) intermingled.
Petty traders located in the fringe areas are often there because they may not be able to afford or
to find a spot in the main market. In some cases their prices are lower since they have less
overhead because they do not pay monthly rents or maintenance fees. These areas are often
frequented by consumers in a hurry, who are interested in buying a few goods quickly, instead of
going into the crowded main market (Clark, 1994).
There are several other retailers in the urban environment from whom consumers can
purchase food for in-home preparation and consumption. The increase in the informal labor force
and urbanization resulted in new forms and places for production and services in which these
petty traders sell their goods (Owusu, 2007). For instance, it is common in peri-urban areas for
full service mini markets that sell a variety of products like food and provisions to operate in
open courtyards of compound houses, temporary workshops attached to houses and on tabletops
in residential areas. Minimarkets known as roadside stands also locate along major roads and in
road right-of-ways (Pellow, 2002). Some mini markets remain small and specialize in selling
only a few products, while others expand into full-service grocery stores that provide everything
from processed foods to fresh produce and frozen meat and fish. These mini markets often obtain
their products from the same wholesalers as traditional market petty traders. However, the prices
at mini markets are slightly higher than traditional markets due to costs of transportation, storage
and convenience. Cold stores are mini markets or traders in traditional markets that sell frozen
and refrigerated meats and fish (Maxwell D. , 1998). Hawkers offer goods for sale to the public
without having a permanent built-up structure from which to sell. They purchase their goods

18
from nearby traditional markets and retail shops on credit or through direct purchase. Hawking is
illegal but it is difficult to prohibit. (Asiedu & Agyei-Mensah, 2008). Petty trading is dominated
by women in West Africa, while hawking is traditionally a male occupation (D. Maxwell 1998).
Street food is an additional source of food in urban areas. It is a wide variety of often
cooked, ready-to-eat foods and beverages sold and sometimes prepared in public spaces. These
include snacks, porridge, prepared staple foods, and prepared meals consisting of a staple food, a
soup or sauce and a piece of fish, egg or meat (Maxwell, et al., 2000). The consumption of street
food is common in urban areas in developing countries that suffer from high rates of
unemployment, low income and limited social programs (Mensah, et al., 2002). Maxwell, et al.,
2000 found the consumption of street food to be dependent on income, women working outside
the home and proximity to markets. It is a cheap, convenient and quick meal for many urban
citizens, who spend long hours at work and in transit and have little time for in-home food
preparation (Kennedy, Nantel, & Shetty, 2004; Maxwell D. , 1998). School children can also rely
on street foods for a large share of their daily food requirements (Maxwell D. , 1998). Although
this study does not include in depth consumer behavior related to street food, it is important to
mention that an average of 32 percent of the food budget for all homes in Greater Accra is spent
on prepared foods, with the poor spending nearly 40 percent of their food budget on street foods.
A correspondingly high proportion of calories (roughly 30 percent) come from street foods
(Maxwell, et al., 2000).
Street food vending is known for its low entry capital and low income (Clark, 1994). In
addition, it is often unregulated and vendors can choose their own hours and avoid paying taxes
(Mensah, et al., 2002). Street food is a concern for government officials because of sanitation
reasons. However a study done by Mensah and colleagues (2002) in Accra found that the

19
majority of street food had an acceptable level of microbes. They also identified reasons for
unhygienic street food, including a lack of knowledge about sanitary practices, vehicle pollution,
absence of insect barriers and scarcity of water for preparation and cleaning up (Kennedy,
Nantel, & Shetty, 2004; Mensah, et al., 2002).
2.4 INSTITUTIONS AND POLICY
The food retail environment in the Greater Accra metro area may appear to be chaotic
and unorganized, but there are government policies and interventions that shape it. Most
traditional distributors and retailers are monitored by the local authorities known as the
Municipal, Metropolitan and District Assembly (MMDA).10 Furthermore, the majority of tax
revenues for MMDAs are collected from traders. It is difficult to determine which retailers pay
taxes or not, but it is safe to assume all types of traders are under some type of government
control through payment of fees, police control and exclusionary laws (Overa, 2007). For
instance, traders located in the formal traditional market pay fees and taxes. On the other hand,
hawkers normally do not pay daily tolls or taxes to the local authorities, while causing increased
congestion, according to a study done by Asiedu and Agyei-Mensah (2008). The lack of
consistency in tax collection and lack of transparency in fee and tax structures, as well as proper
allocation of funds for basic upkeep and regular waste collection, causes disputes between formal
traders, hawkers and local authorities (Tschirley, 2010).
10 The political administration of each region is decentralized and administered through the local government system. Under this administration system, each MMDA is administered by a Chief Executive, representing central government but deriving authority from an Assembly headed by a presiding member elected from among the members themselves.

20
Since petty trading and hawking in unauthorized areas is illegal in the Accra
Metropolitan Area (AMA), there is a special task force called the Aabaeei11 who attempt to
enforce the laws (Asiedu & Agyei-Mensah, 2008). These officials forcibly clear the streets and
sidewalks of petty traders and hawkers, confiscating their goods which are often their entire
working capital. However, many view this as unacceptable because this type of retailing is often
a livelihood of last resort for many low-income residents (particularly women) (Maxwell D. ,
1998). To combat these issues, the government constructed new markets in the center and outer
metro areas, in order to lessen the congestion in the central business district of Accra. However,
many traders fear the loss of their customers and meager profits, which results in them returning
to illegal trading in non-designated areas (Asiedu & Agyei-Mensah, 2008).
The Ghanaian government and public have a long history of resentment towards traders
and the trade associations they have formed to protect themselves. This was especially strong
through the 1970s and 1990s when there were many instances of open hostility by the
government and public toward traders, due to high food prices (Lyon, 2003). The accusations of
trader corruption included price fixing/manipulation, the hoarding of goods to create shortages in
order to benefit from ensuing price hikes, and the taking advantage of both producers and
consumers (Lyon, 2003; Britwum A. , 2011). This resulted in physical and verbal attacks on
many market women, culminating in the intentional burning of Makola market in 1979. For the
above reasons, trade associations have had a tenuous relationship with the government and the
public but their formation has allowed market traders to openly bargain with the
political/governmental powers and protect their businesses (Clark, 1994).
11 Special task for with the duty to arrest hawkers and petty traders at unauthorized places, however they often confiscate retailers’ goods and chase them away instead (Asiedu & Agyei-Mensah, 2008).

21
Trader associations and unions have a long history and are an integral part of the
Ghanaian and West African food system. In 1941, the Trade Union Ordinance paved the way for
the creation in 1945 of a British-modeled Ghanaian Trades Union Congress (GTUC) (Phelan,
2011). Unions include truckers, wholesalers, travelers, petty traders, hawkers and many other
people who participate in the food system. Typically, in order to become a member there is a
registration fee and before traders are allowed in they are required to trade for a bit to prove they
are not argumentative and don't cause disputes (Clark, 1994). Members choose to join for a
variety of reasons, including risk management and meeting others.
Associations perform economic and social roles and discuss and define the "rules of
conduct" for traders around these functions (Overa, 2007). The economic roles include
minimizing the transaction costs of individuals, making information available on reputations,
market prices and supplies of products, and credit, as well as providing means for price
negotiation and contract enforcement (Lyon, 2003). Important social functions include informal
insurance and social security mechanisms. For instance, members contribute to funeral costs and
birth expenses as well as donations for illnesses. In a study by Overa (2007), nearly one-third of
interviewees were members of occupational associations. In addition, associations are used to
strengthen the capacity and political voice of traders (Maxwell D. , 1998). However, associations
exert power and control in the market, which results in exclusionary practices and increase
transaction costs for those who are not members of the group (Lyon, 2003).
Associations are often led by an ohemma12 (market queen). The market queen tradition
started in the early 1900s and became institutionalized between the 1930s and 1950s (Clark,
1994). She is chosen by personal qualities, as well as age, emotional reliability, familiarity with
12 taken from the traditional title given to the leading woman of a chieftaincy

22
market affairs, skills in negotiation and dispute settlement, financial independence and wealth. A
market queen is advised and helped by a group of elders called a paninfo. In addition, a
secretary, usually a male, takes meticulous notes on the number of crates each trader brings and
sells, in order to avoid disputes. He also takes notes at national and municipal assembly meetings
(Lyon, 2003).
There are many barriers to trade association formation of informal workers like traders.
In the late 1990s and early 2000s, the GTUC increased their efforts to expand into the informal
economy and have had varying success. Associations for traders differ from formal employment
unions that deal with working conditions and collective bargaining. Associations for traders
focus on immediate concerns that deal with eviction, access to credit and market access. These
groups are also often more heterogeneous and represent informal workers that have many
different forms of labor relations and conflicts. While workers show an intense interest in being
members, these unions struggle to offer meaningful membership in means of services (e.g.,
education and business training) and increased rights (e.g., lawful allowance to trade). Three
unions that are completely made up of informal economy workers are Ghana Private Road
Transport Union (GPRTU), Madina Traders’ Union and Makola Traders’ Union. They focus on
stressing welfare support and regulation of trading practices among members (Britwum A. ,
2011).
The literature on traditional markets often notes a lack of standardization compared to
supermarkets (Weatherspoon & Reardon, 2003; Boselie, Henson, & Weatherspoon, 2003; Neven
& Reardon, 2004). However, contrary to common belief, prices are set daily based on standards
according to volume, number and price units depending on the product. For instance, the unit
might be wholesale quantities of one hundred yams, a standard wooden box of tomatoes, or a

23
burlap sack. Although there are no standards for quality or sorting, price is also dependent on
quality determined through visual inspection. Where a product is produced is also an important
piece of information, because of the specialization and reputations of districts. Retailers sell
smaller standard quantities at set starting prices (prices to bargain from) that they determine from
the wholesale prices at the beginning of the day (Clark, 1994).
While trade associations are quite powerful, it has been found that direct manipulation of
prices is a rarity (Clark, 1994). Prices are set based on the supply available for that day.
However, trade associations do impact competition, and therefore prices, by several methods
including control of the supply entering the market and limitations on the amount traders are
allowed to sell. Associations control the supply in the market by physically blocking the entrance
of foods, confiscation of goods, and even fines and bans in extreme cases. The most severe
punishment is for the market queen to sell the goods of the offending itinerant trader on their
behalf and take a large commission. However this power is only possible if the local authorities
and traditional government recognize the association (Lyon, 2003).
In addition to trade associations, there are formal and informal savings and credit
opportunities in Ghana. The formal sector includes all financial transactions taking place within
established financial institutions covered by banking law or other financial regulations of the
government. However, it is difficult for many low income citizens to access credit and savings
opportunities. The informal sector covers everything not included in the formal sectors, including
Rotating Credit and Savings Associations (ROSCA), money-lending and some credit unions.
ROSCA’s in Ghana are called susu13 clubs and are used for the pooling of scarce resources (e.g.,
money, labor, food) by a group of people for each member’s benefit (Bortei-Doku & Aryeetey,
13 The origin of the word is unknown, but likely of Akan, Igbo or Yoruba origin (Alabi, Alabi, & Ahiawodzi, 2007).

24
1995). In a study conducted by Overa (2007) one-third of the women and 17.6 percent of the
men used susu clubs to accumulate capital for either a purchase or business investment.
2.5 CHANGING FOOD RETAIL ENVIRONMENT
Traditional retail outlets have not remained static but have transformed with the
liberalization of markets and decrease in public sector employment beginning in the early 1980s
with the implementation of SAPs that continued through the 1990s. This resulted in a decline in
living standards for the urban population in Accra, Ghana and forced many residents to find
alternative livelihood strategies, which usually resulted in self-employment in the urban informal
economy14 (Owusu, 2001). Although Accra was already well known for its vibrant informal
sector prior to the implementation of SAPs, this sector grew at an estimated 5.5 percent
throughout the 1980s and 1990s. In 1980, the ratio of workers in the informal sector to formal
sector was 2:1 and by 1990, the ratio was 5:1 (Maxwell D. , 1998). Employment in the formal or
informal sector is not a good indicator of poverty because it is possible for those in the informal
economy to make more than those in the formal private and public sectors (Overa, 2007).
It was expected that African countries would follow the same development trajectory as
Western nations and become less dependent on the informal economy. However, according to
the last census conducted in 2010, 74.5 percent of Greater Accra’s active population (15 years
and older) continue to be employed in the informal sector. Of those, 35.3 percent are engaged as
service workers and petty traders, which include food traders (Ghana Statistical Service, 2012).
While the number of people employed as petty traders has increased and remains high, the
demand for these services has not grown, resulting in tighter competition and lower profits
14 The informal economy is made up of economic activity that is traditionally not monitored by a government, and is not included in the public or formal sector (Flodman Becker, 2004).

25
(Maxwell D. , 1998). In addition, traditional markets were more local and fragmented and they
now have become larger and more centralized in the sense that their service areas reach beyond
the local residents and to consumers who are required to use vehicular transportation to reach
them. So, mini markets have filled the role of smaller traditional markets. Furthermore, with the
liberalization of global food markets and improvements in food distribution logistics, traditional
retail distribution channels have evolved from solely domestic and regional dependent supply
chains to globally connected supply chains, allowing them to diversify their products from local
products to foreign processed and non-processed foods (Boselie, Henson, & Weatherspoon,
2003). The shift in food products happens first in dry goods and later in perishables like fresh
fruits and vegetables (FFVs), such as an increase in trade of apples and grapes produced in South
Africa in the case of SSA. The centralized traditional markets also serve as important distributors
for small retailers like mini markets and hawkers (Weatherspoon & Reardon, 2003).
2.6 CONSUMER BEHAVIOR AND ACCESS
Consumer behavior is often based on prices for food items, but there are additional costs
called transaction costs that can affect consumer behavior. For instance, proximity is an
important transaction cost, especially in urban areas in developing countries that suffer from poor
infrastructure and traffic congestion. Second, it is common for consumers to search out retailers
where they can buy all the items they need at low prices. This gives an advantage to retailers that
have a large variety of quality items. Third, the shelf-life of products (processed versus fresh)
and access to proper storage equipment like refrigeration, also determine how often consumers
must purchase such items. Finally, operation hours are another transaction cost (Reardon &
Hopkins, 2006). In addition to prices and the above mentioned transaction costs, hygenic
conditions and food safety affect consumer behavior. For this reason this study on consumer

26
behavior and food access in the current food retail environment will add to the current body of
research on supermarketization in developing countries, specifically in SSA.
2.7 SUMMARY
In summary, the literature illustrates that the food retail environment in developing
countries is diversifying with the introduction of supermarkets. While there has been a
significant amount of research in Latin America, Eastern Europe and Asia, there is little research
in SSA on the impacts of supermarketization other than in Kenya and South Africa. While it is
true that the traditional food retail environment in Accra, Ghana is a complex web and provides
access to a wide variety of food throughout the built food retail environment, the entrance of
supermarkets has increased competition. The research that has been completed suggests that
traditional markets appear to remain the main food distribution outlet for the majority of
consumers. However, the entrance of supermarkets is impacting consumer behavior toward and
access to food outlets and the food types available for purchase.

27
CHAPTER 3.
RESEARCH METHODOLOGY
This research is a case study of consumer behavior and access to food in a suburban
community of Ashongman Estates in the Greater Accra metropolitan area. Case study research
examines many features of one or a few cases over a period of time or as a snapshot in time
(Neuman, 2011). In this case, in order to determine how consumers behave and access food for
this community, a snapshot of the current food retail environment of the Greater Accra
metropolitan area was created. This chapter will focus on answering Research Question One:
how is the current food retail environment in the Greater Accra metro area in Ghana structured?
3.1 STUDY AREA
This study examines the current food retail environment and distribution system in the
Greater Accra metropolitan area in Ghana in an era of increasing supermarkets and other
Western style retail outlets in SSA. Accra, Ghana is an ideal study area because of several
factors. First, like many countries that are experiencing supermarketization, Ghana is
experiencing high population growth and urbanization (3.1%/year) which are linked to increases
in income and a growing middle class (Ghana Statistical Service, 2012; Reardon, et al., 2003).
As of the 2010 census, the population of Ghana is approximately 24.7 million. This is an
increase of 30.4 percent over the 2000 census population of 18.9 million. In addition, as of 2010,
slightly over 50 percent of the population lives in urban areas (Ghana Statistical Service, 2012).
Second, West Africa and Ghana have a long history of female-dominated trade, distribution and
retail in food products. This food distribution and retail environment is considered part of the

28
informal economy but it is highly complex due to being controlled and regulated by informal
groups such as trade associations (Clark, 1994). Third, Ghana was the first African nation to
implement SAPs that resulted in the liberalization of trade and finance. Fourth, in the last decade,
Accra, Ghana has been experiencing a boom in FDI for Western style retail outlets - the largest
and most successful being the 58-shop Accra Mall, which draws up to 1 million visitors every
three months (Bigg & Motsoeneng, 2013). The combination of the above factors makes Ghana
an interesting case study for examining a food distribution and retail system in a developing
country that is just beginning to experience supermarketization (Figure 2).
Figure 2. The fifteen ECOWAS member states
Ghana was the first West African nation to gain independence in 1957. Due to a wealth
of natural resources including timber and oil, high amounts of foreign reserves, and extensive
transportation infrastructure, there was much hope for quick development (Bureau of African
Affairs, 2011). However, Ghana suffered from political turmoil, military coups and inconsistent
economic policies from independence through the 1990s (Gocking, 2005). From independence to
the early 1980s, development policies were state-led policies, import substitution
29
industrialization (ISI)15, restrictive foreign exchange regimes, quantitative restrictions on
imports, and price controls, with the state playing a major role as a producer of agricultural and
manufactured goods (Aryeetey & Kanbur, 2008; Ayine, 2004).This resulted in food shortages
that were blamed on price hikes and hoarding by traders (mostly women) rather than failed
government development policies resulting in falling production, decaying infrastructure,
overvalued exchange rates, and declining investment and high inflation (Codjoe & Dzanku,
2009; Clark, 1994; Maxwell, et al., 2000). By the early 1980s, food shortages were exacerbated
by the global debt crisis and severe drought and bushfires that destroyed about a third of all
farms and affected both food and export crops (Nyanteng & Wayo Seini, 2000; Codjoe &
Dzanku, 2009).
Like many African countries, Ghana has implemented neo-liberal inspired SAP policies.
This involved a shift from state-led economic policies and protectionism to free trade ideology
(Jeong, 1998). Under the strong dictatorship of Jerry Rawlings, Ghana was the first African
country to fully adopt such policies in return for loans from the World Bank and International
Monetary Fund (IMF) (Aryeetey & Kanbur, 2008; Rapley, 2007). In order to receive loans,
countries were required to cut back the public sector and services; privatize publicly owned
companies, devalue the currency, and liberalize trade and finance (Rapley, 2007; Jeong, 1998).
The liberalization of trade involved the removal of quantitative restrictions, the lowering of
tariffs, cuts on subsidies for basic goods and services, elimination of price controls, and
liberalization of the foreign exchange regime (Ayine, 2004; Jeong, 1998). The impacts of SAPs
have been widely discussed. The successes include the depreciation in the exchange rate; the
removal of quotas on imports and the lowering of tariffs; a reduction of corporate and capital
15 An economic policy that promoted the replacement of imports with domestic products to lessen developing countries’ dependence on first world countries for imports (Rapley, 2007).
30
gains taxes; the removal of price controls and subsidies; the privatization and closure of many
inefficient state-owned enterprises; the dropping of restrictions on foreign investment; and the
award of special incentives to exporters and investors in infrastructure. The successes were
shown by the economy greatly improving, with increases in the level of exports, imports, and the
overall balance of payment throughout the 1980s. The GDP growth averaged 5.2 percent, but it
declined to 4.4 percent in the 1990s and many claim the social costs outweigh the benefits.
These social costs included the reduction of government expenditure in public services
and reduced availability and access to basic healthcare, education and other social services.
Second, there were an estimated 300,000 jobs lost in the public sector through the 1980s and
1990s, resulting in high rates of unemployment among the middle class. Also, since there was a
glut of unemployed persons, wages dropped drastically (Maxwell, 1998; Maxwell, et al., 2000).
Third, the liberalization of agricultural output markets due to the complete retraction of subsidies
and state control over food products resulted in higher food prices (Nyanteng & Wayo Seini,
2000). Fourth, the liberalization of markets for processed foods resulted in the dumping of cheap
processed foods on the Ghanaian market, forcing the closure of a tomato processing center that
was the main market for commercial tomato farmers. The importation of processed foods
increased over 638 percent from 1993 to 2003, and by 2004 Ghana had become the second
largest importer of tomato paste (Britwum, 2013).
Overall, Ghana has had some successes and setbacks due to SAPs. In the 1990s the
World Bank did recognize the need to not only focus on economic issues to improve developing
countries, but also the importance of good governance (Aryeetey & Kanbur, 2008). For instance,
Ghana took another step forward with a peaceful democratic transition and has continued to be
politically stable compared to regional neighbors (Gocking, 2005).

31
Ashongman Estates is located in the Greater Accra region, which contains the capital city
Accra, which is the economic and cultural center of Ghana (Figure 3). The Greater Accra region
is one of the largest and fastest growing urban areas in West Africa, at an annual growth rate of
4.3 percent (UN-Habitat, 2009).
Figure 3. Greater Accra region by districts
Greater Accra continues to experience rapid urbanization. This has resulted in unplanned
and unregulated physical growth and expansion of the city. An estimated 45 percent of the urban
population lives in slums and squatter settlements (UN-Habitat, 2009). This is a result and
symptom of urban fragmentation, which is the “separation and specialization” of functions and
uses in cities, where labor market polarization reflects major differences between wealthier and
poorer areas. The outcome of such fragmentation is a locally centered urban society, where
housing, work and recreation are not spatially distinct, in a situation that has a lack of zoning and
code enforcement. This allows residents to access the majority of their needs within their
community space (Watson V. , 2009). For instance, street food and food for in home preparation

32
and consumption are readily available throughout residential neighborhoods (Maxwell D. ,
1998).
The neighborhood of Ashongman Estates is a typical neighborhood of the city that
suffers from urban fragmentation (Figure 4).
Figure 4. Study area location in Greater Accra
Ashongman Estates is a suburb in the Greater Accra metro area, located approximately
13 miles north of central Accra. The neighborhood is well-planned with straight streets in a grid
pattern and is still undergoing development. The majority of roads are not paved and in poor
condition (Figure 5).

33
Figure 5. Street in Ashongman Estates
Figure 6. Housing in Ashongman Estates

34
The existing housing is a mixture of duplexes, single-family homes, single-level
multifamily structures, and houses under construction, but habitable. The housing under
construction is new developments (townhouses and duplexes) by developers and single family
homes by private owners. In the foreground of Figure 6 is a single family home under
construction while in the background the green buildings are a development of townhouses.
In summary, Ashongman Estates was chosen for this study for several reasons. First, it is
representative of a typical suburban neighborhood andit is mixed income, although the majority
of residents are upper to middle class. Poorer residents squat in incomplete structures and build
their own makeshift homes. Second, businesses are located in outbuildings outside of homes,
residential areas, along major roads, in road right of ways and in areas reserved for other
purposes within the built environment. The informal home-based economic sector provides
services such as food processing, food preparation and sale, sewing, and hair salons, allowing
residents to access the majority of their needs within the neighborhood, including food for in-
home consumption (Maxwell D. , 1998). Third, in order for residents to reach a traditional
market or supermarket they are required to use some sort of vehicular transportation, which is
true for most residents of Accra.
3.2. RESEARCH METHODOLOGY AND DATA COLLECTION
Field research was conducted between May and August of 2012. This section will present
detailed descriptions of the research methods and data collection process. The first section
explains the research methodologies and data collection processes used for answering the first
research question: How is the current food retail environment in the Greater Accra metro area in
Ghana structured? Four types of data collection methods were used: direct observations,
mapping, trader interviews and a food retail outlet assessment. The second section, in addition to

35
describing the four types of data collection methods, explains the fifth data collection method of
household surveys to answer questions two through four about where consumers buy food and
what types of foods are they buying.
3.2.1 Direct Observations
First, direct observations of the built food retail environment as well as of consumer and
retailer behaviors and opinions were taken throughout the time spent in the field. This was done
in order to first understand the geography of the food retail environment pertaining to traditional
markets throughout Greater Accra and to identify traditional markets that were frequented by
Ashongman Estates residents. Then, direct observations were taken on the culture, structure and
consumers of all food retail outlets, as well as on what types of foods were commonly sold and
the relative prices of food items.
The following five traditional markets were identified for the purposes of this study.
Dome, Madina and Haatso Yam Market, which are all located relatively close to Ashongman
Estates, and Makola and Abgobloshie, that are both centrally located, large, and have reputations
for quality, variety and large numbers of consumers. In addition, three supermarkets from two
chains were also identified: two Maxmart stores at 37 and East Legon and the Shoprite in the
Accra Mall (Figure 7).

36
Figure 7. Observed traditional markets and supermarkets

37
In addition, I spent three weeks in the neighborhood of Ashongman Estates observing and
taking notes on housing and mini markets. A printed Google Satellite Image (date 1/11/2010)
was used to take notes on the built environment, including streets, housing, and food retailers
(Appendix 1). New housing that was constructed since the taking of the satellite image was
added to the map. In addition, squatted houses under construction and informal squatter
structures were noted so that these households could be included in the study population. These
observations with the Google Satellite Image were used to identify random households for the
consumer survey.
3.2.2 Retailer Interviews
In order to better understand the food retail environment, traders were interviewed in the
five traditional markets identified in Figure 7. In addition, mini market proprietors in
Ashongman Estates were interviewed. The interviews were conducted with the assistance of a
Ghanaian field assistant who spoke English, Twi and Ga16. If permission was granted, interviews
were recorded. A semi-structured interview format was used, allowing for open and closed ended
questions and discussion. The questions focused on a respondent’s experience as a food trader,
about their business, where they obtained the goods they sold and demographic questions
(Appendix 2). Due to the large number of traders in traditional markets and mini market
proprietors in Ashongman Estates, a convenience sampling approach was employed to enable me
to choose a variety of interviewees who sold different food types, represented different size
operations and locations, and included both genders.
16 Ga is spoken by the Ga-Dangme ethnic group that historically resided in Greater Accra, Twi is widely spoken but originates in the Akan ethnic group and English is the national language (ghanadistricts.com, 2013).
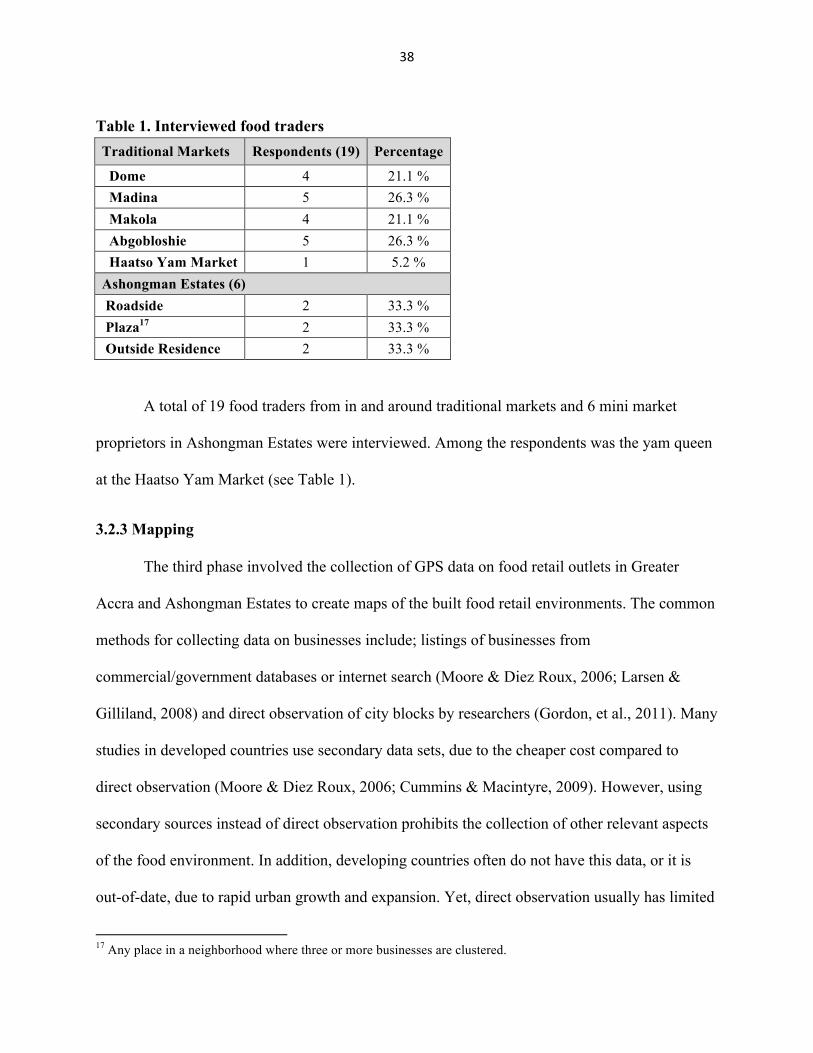
38
Table 1. Interviewed food traders Traditional Markets Respondents (19) Percentage
Dome 4 21.1 % Madina 5 26.3 % Makola 4 21.1 % Abgobloshie 5 26.3 % Haatso Yam Market 1 5.2 % Ashongman Estates (6) Roadside 2 33.3 % Plaza17 2 33.3 % Outside Residence 2 33.3 %
A total of 19 food traders from in and around traditional markets and 6 mini market
proprietors in Ashongman Estates were interviewed. Among the respondents was the yam queen
at the Haatso Yam Market (see Table 1).
3.2.3 Mapping
The third phase involved the collection of GPS data on food retail outlets in Greater
Accra and Ashongman Estates to create maps of the built food retail environments. The common
methods for collecting data on businesses include; listings of businesses from
commercial/government databases or internet search (Moore & Diez Roux, 2006; Larsen &
Gilliland, 2008) and direct observation of city blocks by researchers (Gordon, et al., 2011). Many
studies in developed countries use secondary data sets, due to the cheaper cost compared to
direct observation (Moore & Diez Roux, 2006; Cummins & Macintyre, 2009). However, using
secondary sources instead of direct observation prohibits the collection of other relevant aspects
of the food environment. In addition, developing countries often do not have this data, or it is
out-of-date, due to rapid urban growth and expansion. Yet, direct observation usually has limited
17 Any place in a neighborhood where three or more businesses are clustered.

39
geographic coverage due to time and money constraints (Bader, et al., 2010). In this study both
methods were used: an internet search to verify and identify the locations of traditional markets
frequented by household survey respondents and supermarkets in Greater Accra and a block-by-
block assessment of mini markets in the neighborhood of Ashongman Estates. The advantage of
the internet search was time saved in traveling to traditional markets and supermarkets. The GPS
data was collected with a GPS enabled camera. An additional advantage of the block-by-block
assessment was the ability to complete a food retail assessment.
3.2.4 Food Retail Assessment
Several types of measurements are used, often in combination, to create food retail
assessments including: location (Gordon, et al., 2011; Moore & Diez Roux, 2006; Larsen &
Gilliland, 2008) representative food baskets (Minten, 2008), food price surveys (Donkin, et al.,
1999; Temple, et al., 2011), shelf-space (Cheadle, et al., 1990), size (Clarke, Eyre, & Cliff,
2002), primary activity (Winkler, 2008), and type (Moore and Diez Roux 2006). The food store
assessment used in this study identified mini markets by location and types of foods sold. The
location was either outside a home, along a major road or in a market square. Although a mini-
market may be located outside a house, if it was also along a major road or part of a market
square it was identified as located as such. The food types sold were processed18, staples19, FFVs
and cold store items20. A mini market can carry one to all of these food types.
3.2.5 Household Surveys
Household surveys were conducted in Ashongman Estates to collect data on consumer
behavior about and access to the built food retail environment and types of foods purchased. A
18 Canned and packaged foods (i.e. canned tomatoes, pasta, powdered and canned milk, milo) 19 For instance, bread, eggs, rice and corn 20 Frozen and refrigerated meat and fish

40
total of 75 households took part in the survey, with the help of a Ghanaian field assistant who
spoke English, Twi and Ga. Surveys were conducted between June 2012 and August 2012,
Monday through Thursday (often between 3:30 pm and 8:00 pm), and on Saturdays (between
10:30 am and 7:00 pm), when most residents were likely to be home.
I used probability sampling to choose households for the survey, due to a lack of up-to-
date census data. A Google satellite image and observations of the housing in Ashongman
Estates identified habitable dwellings and based on that I created a study population dataset
(Weng, 2010). The study area was divided into three zones based on number of houses. Each
structure was identified and the number of households in each structure was estimated from field
notes. Many of the structures were duplexes but there were a few multifamily structures as well
as occupied incomplete structures and squatter structures. The neighborhood was divided into
Zones because each Zone had a different density and mixture of housing. Zone 1 had n=489
households, Zone 2 had n=411households, and Zone 321 had n=510 households (Figure 8). 25
households were interviewed from each zone. The Excel function RANDBETWEEN was used
to randomly select household in each zone. The preferred respondent for each household was the
person who normally did the food shopping.
All attempts were made to interview the selected households. Each was visited three
times. Where unsuccessful, the household next on the random number list were interviewed. The
survey instrument was pilot tested three times and revised each time for content and length
(Appendix 3).
21 Originally was two Zones, but were combined to have similar number of households as Zone 1 and 2.

41
Figure 8. Household survey zones

42
The household survey contains three sections. Section A inquires about home food
consumption patterns. Section B asks about consumer behavior related to the built food retail
environment, food retail outlet types and types of foods purchased. It included several questions
on whether respondents frequented specific food retail outlets, and if so how often. A food list of
58 items that represented different food types was used to solicit information on food
consumption behavior and what type of food retails outlet they preferred for purchasing these
food items. Section C requested demographic information. In addition, GPS data was collected at
each household where surveys were completed. The survey also included a food list of 58 items
that were broken down into five major food groups; carbohydrates, vegetables, fruits, protein,
and processed foods. These food items were identified as processed, non-processed, domestic,
and imported. A food item could represent more than one of these categories. In order to develop
this food list, an in-depth literature review of Ghanaian diets and agricultural production was
conducted prior to the field research. This original food list contained 82 items. After
observations during the first few weeks of field research and the pilot testing of the household
survey, the food list was narrowed to 58 food items.
3.3 DATA ANALYSIS
All data was entered and coded using EpiData version 3.1. Data analysis was performed
using Microsoft Excel. Interviews were transcribed using the iZotope RX 2 software. Maps were
created using Quantum GIS version 1.8, Google Earth and Arc GIS version 10.1.

43
CHAPTER 4.
THE FOOD RETAIL ENVIRONMENT
This chapter presents and discusses the findings on the food retail environment of
Ashongman Estates, answering the first research question: How is the current food retail
environment in the Greater Accra metro area in Ghana structured? The first section will present
and discuss the findings about the traditional retail environment. This includes findings on the
location, physical, social, and economic descriptions, in addition to the structures of the five
traditional markets most commonly frequented by households surveyed in Ashongman Estates
and the mini markets within this neighborhood. The second section will present and discuss the
supermarkets possibly frequented by residents of Ashongman Estates in Greater Accra. This will
include a brief history and description of the chains, the environment and items available in such
outlets, and maps of their locations in Greater Accra.
4.1 TRADITIONAL MARKETS
Five traditional markets were identified as visited most by Ashongman residents
including Dome, Madina and Haatso Yam Market that are located near Ashongman Estates, and
Makola and Abgobloshie, which are used by residents from across the Accra metro area. The
two markets are both centrally located, large, and have reputations for quality, variety and large
numbers of consumers. A brief description of each market is presented below.
Dome is the nearest market to Ashongman Estates at approximately 5.2 miles (8.3 km)
south via the street network. It is located on St. Johns-Dome Road along a narrow two lane
arterial road that is often congested. The market is medium sized and open daily. Major market

44
days are Wednesday and Saturday. On major market days there is a larger amount of products, as
well as variety and quality compared to the off-market days, according to consumers and traders.
It is primarily a retail market that serves the surrounding neighborhoods. However, there are a
few wholesalers who sell goods to retailers in the traditional market, as well as small traditional
retailers, like mini market proprietors, in the surrounding areas. The traditional market is covered
by a makeshift roof but the alleyways are dirty and muddy after rains. In the unloading and
loading area for products, women often set up makeshift stands with umbrellas. Adjacent to the
market there are concrete two-story buildings containing stores that carry food items of many
kinds. According to consumers, the retail prices are a bit more expensive than larger traditional
markets like Madina and Makola.
Madina is the third closest (second closest is Haatso Yam market) traditional market, at
approximately 8.75 miles (14 km) via the street network. It is located walking distance from the
‘Madina zongo,’22 an area that was undergoing construction for the expansion of the Legon East
Road, with a large amount of traffic that can sometimes be very dangerous. The improved road
will most likely provide new opportunities for the Madina market by improving the connection
to the city center as well as linking it to producers in rural areas. The market is larger than Dome
and therefore has more variety and higher quality food products. There is a formal concrete
market building with concrete alleys but the market spills out onto the streets and sidewalks,
where vendors set up makeshift tabletop stands or baskets of items. Surrounding the market there
are concrete buildings filled with small stores that offer a variety of items. According to
consumers, prices in Madina are lower than Dome and similar to Makola.
22 Zongo- originated as a Hausa (ethnic minority) term meaning the camping place of a caravan, or the lodging place of travelers, it was then adopted by the British to refer to the section of the town where Muslim traders lived (Schildkrout, 1978). Currently, it is widely used to name a place settled by a Muslim population, although it does have some derogatory connotations (Muratbayeva, 2010).

45
Makola is located approximately 12.5 miles (20 km) south of Ashongman Estates. It is
located in the central business district (CBD) of Accra. It is the largest traditional market in
Greater Accra and is world famous for its size and fact that it spills out into surrounding streets
and sidewalks for blocks. It has a large variety and high quality of food products. The formal
structure has been added on to several times and is mostly roofed and has concrete alleys.
According to consumers and traders, the prices of wholesale and retail food items are less than at
all other traditional markets in Greater Accra. Consumers can find anything they need at this
market every day, making it a one-stop-shop traditional market.
Abgobloshie is located approximately the same distance from Ashongman Estates as
Makola. It is a bit northwest of Makola market. It is not as large as Makola, but larger than Dome
and Madina. It is known as a wholesale market for Greater Accra. According to a wholesaler
who sells tomatoes to restaurants and large corporations, it is easier to reach Abgobloshie than
Makola, making it better for the trade of a large amount of goods. The formal retail sector is in a
mostly roofed structure with narrow alleyways. The alleyways are cleaner and less muddy than
Dome. Consumers are able to get everything they need every day of the week in this location.
The prices for retail and wholesale goods are comparable to Makola.
Haatso Yam market is located approximately 5.5 miles (9 km) from Ashongman Estates
on the way to Madina. In contrast to the other traditional markets, this is a small specialty market
devoted primarily to the wholesale of yams. Yams are distributed throughout Greater Accra from
this location (Figure 9). However, there are also small retail traders who sell quantities of yams
for household consumption. It has few traders who carry products other than yams. The yams are
priced the cheapest here but additional food items have higher prices than in other traditional
markets.

46
Figure 9. Middle man distributor at Haatso Yam Market
4.2 TRADITIONAL MARKET INTERVIEWS
Nineteen traders were interviewed from five traditional markets on their observations on
the atmosphere of traditional markets and traders. From these interviews and information
gathered from observations, the atmosphere of traditional markets and traders will be expanded
upon in the following section. During field research it was observed that traditional markets and
the surrounding streets and sidewalks were dominated by female traders. For this reason 16 of
the 19 respondents were female. In addition, 36.8 percent of them were single, 47.4 percent
married, and 15.8 percent divorced. Most of them had children, with an average of 2.5 children
(Table 2).

47
Table 2. Traditional market interviewees’ characteristics Respondents (19) Percentage Female 16 84.2 % Male 3 15.8 % Family Single 7 36.8 % Married 9 47.4 % Divorce 3 15.8 % With Children 15 78.9 % Average number of children 2.5
Since petty traders are the largest portion of traders in traditional markets they
represented 84.2 percent of total interviewees, while15.8 percent were wholesalers. The physical
set-up of the traditional markets observed had formal structures where petty traders paid rents for
a stand located under a roof, as well as designated wholesaler locations like parking lots. For
example, a female wholesaler who was interviewed was located in a parking lot surrounded by
crates of tomatoes in Abgobloshie market. The majority of interviewed traders (63.2 percent)
were located in the formal market structure and wholesale areas and paid rents. For instance, a
female petty trader who sold smoked fish in Dome market stated she paid ten cedis a month to
rent her corner stand in a high frequency area. The remaining petty traders (36.8 percent) were
located on the fringes of a traditional market on the sidewalk, street, or other non-designated area
like parking lots. Petty traders in these areas stated they desired a stand in the formal market but
were unable to obtain a place due to lack of funds. These petty traders, in spite of paying taxes to
local authorities, were still not guaranteed their spots and suffered from harassment by officials.
This was explained by a plantain trader in Dome who set up an umbrella and her goods illegally
in a wholesale area used for the loading and unloading of goods.
48
Typical retailers in traditional markets have been doing it for long periods of time. Their
average years of trading were 14.7 years, ranging from a few months trading to approximately
forty years. Furthermore, the majority of interviewed traders (73.7 percent) had only worked as
food traders throughout their lives. Asked about reasons for getting into this business, most
stated they had only traded food because they had no education and needed to support
themselves and/or families. Of the traders who had come into food trading after employment in
the formal or agriculture sector or even from a previous business in the informal sectors, they
had done so due to the loss of a job or belief that food trading was more lucrative. For instance, a
petty trader of processed foods in Dome had begun trading 10 years prior after losing her job in
the formal sector as a public servant in the Ministry of Information. A male petty trader who sold
onions at Abgobloshie had chosen to leave farming after seeing the money his friends were
making. A woman petty trader who sold dried fish in Dome market had tried selling used
clothing for a year but found it not to be profitable.
Food retailing is often a family business in Ghana. 36.8 percent of traders interviewed
were part of a family-owned/inherited and -operated business. All but one of these family
businesses was a mother-daughter pair. The other business was operated by a man who sold pig
and cow feet in Makola and had taken over the business from his sister. Two traders stated they
only traded because they took the business over from a family member. For instance, a mother
who sold dried foods and spices in the formal Makola market explained that she grew up trading
with her grandmother and when the grandmother became too old she took the business over and
expected her daughter, who was with her at the stand, to do the same (Table 3).

49
Table 3. Traditional market interviewees' business characteristics Characteristics Average years trading 14.7 years Location Respondents (19) Percentage Formal market 12 63.2 % Market fringe 7 36.8 % Type Retailer 16 84.2 % Wholesaler 3 15.8 % Other Characteristics Only worked as trader 14 73.7 % Family Business 7 36.8 %
For the type of foods sold, the majority of respondents (63.2 %) sold only one item, while
36.8 percent of interviewees sold multiple food types like FFVs, processed foods and dried fish.
Interviewees sold a variety of items; 26.3 percent of traders sold solely fish or meat products,
10.5 percent sold processed foods, 26.3 percent domestically processed foods and 36.8 percent
sold FFVs (Table 4).
Table 4. Items sold by interviewees Number of Items Respondents (19) Percentage One Item 12 63.2 % Multiple Items 7 36.8 % Type of Items Fish or Meat 5 26.3 % Processed 2 10.5 % Domestically processed 5 26.3 % FFVs 7 36.8 %
As noted in the literature review, formal and informal trade associations were active
within the observed traditional markets. For instance, two traders stated they belonged to a

50
formal association; a wholesaler of tomatoes at Abgobloshie belongs to the Ghana National
Tomato Traders association and a man who sold beef at Dome said he paid one cedi a week to be
part of an association of meat traders. In return for his dues he received advice on how to better
his business and profits. In addition to these formal associations, a woman who sold okra on the
sidewalk outside of the formal Abgobloshie market stated she was not part of a formal trade
association but she donated to other traders who needed money to pay for a funeral or illness in
the family. These findings confirm the presence and roles of formal and informal trade
associations in traditional markets.
As stated in the presentation of the study area, there has been an increase of traders in the
informal market in Greater Accra. This has affected the profitability of trading. For instance, a
woman who had petty traded for over forty years in the formal market in Madina explained that
trading used to be much more lucrative, but with the increase of traders her profits had shrunk,
making it harder to make a living. One strategy that was put forth by a woman who sold dried
fish was to set up her stand like that of displays in Shoprite to increase business, but she did not
know how to go about it.
This research did not specifically deal with the impacts of supermarketization on
suppliers and producers but by speaking to traders and mini market operators and through
observations, the researcher got a sense as to how the supply chain worked for traditional retail
outlets. Generally, wholesalers in traditional markets have supply chains that reach to the
producers of fresh goods, such as fruits and vegetables, and of staples, such as maize, plantain
and yams. The middlemen bring the goods to the market and smaller traders who do not have
these connections buy their goods from the wholesalers when they arrive at the market. Larger
and more experienced traders (also known as marketers), who have built relationships with

51
producers in rural areas often stated they went to the producers and bought directly from them,
transporting the goods back for themselves and maybe a few other traders. Traders also said that
customers were interested in where their goods came from, making it important that they knew
the origin. This type of supply chain is not efficient for supermarkets since they prefer vertically
integrated systems from producer to distributor, which allow them to guarantee quantity and
quality. In addition, the labor-intensive job of sorting and grading is pushed on to someone lower
on the supply chain. Without the development of more efficient supply chains, supermarkets will
continue to struggle to enter the domestic FFV retail environment.
4.2 MINI MARKETS
Mini markets are full service retail outlets that operate in residential areas. They range
from tabletop stands in public spaces to concrete outbuildings outside houses or along major
roads. In the neighborhood of Ashongman Estates (an area of a little over a square mile), 101
mini markets were identified (Figure 10).
4.2.1 Food Assessment
A food assessment was completed for 92 of the 101 mini markets identified and located
in the neighborhood of Ashongman Estates. The mini markets that were not assessed were closed
at the time they were recorded. Mini markets were assessed on where they were located and what
food products they carried. Mini markets were categorized based on their location into three
locations: plaza, along a major road, or outside a home. If they were located in a plaza or along
the roadside, that location was rated as more important than whether the mini market was located
outside of a residence. Food products sold by mini markets were categorized into four; staples,
processed foods, fresh produce and cold store items.

52
Figure 10. Mini markets in Ashongman Estates

53
Of the 92 mini markets involved in the food assessment, 78.3 percent carried processed
foods, which is most likely because of their long shelf lives, 51.1 percent carried staples like
bread, eggs and/or grains, and 35.9 percent carried FFVS. The lower number of traders carrying
FFVs is probably due to the high perishability of such products. In addition, only 9.8 percent of
mini markets were classified as a cold store that sold frozen and refrigerated meat and fish
products (Table 5). This is almost certainly due to the high investment involved in buying
freezers and refrigeration, as well as risks involved in carrying such goods that may spoil during
the often frequent blackouts. This was illustrated by a woman with a mini market outside of her
home who had to sell her freezer because of the costs and risks associated with running a cold
store.
Table 5. Mini market food assessment by food types sold Food Types
Total (92) Percentage
Road (20) Percentage
Plaza (14) Percentage
House (58) Percentage
Staple 47 51.1 % 9 45 % 7 50.0 % 31 53.4 % Processed 72 78.3 % 17 85 % 8 57.1 % 47 81 % FFV 33 35.9 % 5 25 % 8 57.1 % 19 32.8 % Cold store 9 9.8 % 2 10 % 1 7.1 % 6 10.3 %
Mini markets tend to limit their focus to a few of the categories identified above. For
instance, of the 92 mini markets in the food assessment only two sold all four food types. They
were larger than the average mini market. One of the two mini markets was Sweet Mama’s cold
store, located in a plaza. The owner started the business eight years prior when her husband
bought the container but had grown from selling only processed foods to her current business
that required her to shop daily for fresh produce at Dome and twice weekly at Makola for
processed foods and rice. She stated that the average mark-up was fairly small, depending on the

54
quantity and type of product. For instance, a can of tomato sauce was marked up five pesewas.23
This small price mark-up was confirmed by a woman respondent of the household survey who
lived near the market square and regularly shopped at Sweet Mama’s cold store. The remaining
mini markets mostly sold one or two food types (Table 6).
Table 6. Mini market assessment by how many types of food items sold
Total (92) Percentage
Road (20) Percentage
Plaza (14) Percentage
House (58) Percentage
Four 2 2.2 % 0 0 % 1 7.1 % 1 1.7 % Three 12 13 % 3 15 % 1 7.1 % 8 13.8 % Two 39 42.4 % 7 35 % 6 42.9 % 26 44.8 % One 39 42.4 % 10 50 % 6 42.9 % 23 39.7 %
4.2.2 Mini market Interviews
Of the 101 mini markets in Ashongman Estates, six mini market proprietors were
selected to complete a semi-structured interview about their business. All but one of the mini
market proprietors interviewed were female. Half of them had always worked as some sort of
trader and half had worked in the formal sector prior to starting the mini market. Their average
years of experience trading was 6.7 years and the average age of their mini markets was 4.8
years. All of the mini market proprietors interviewed were married with children. The average
family had 2.3 children.
Two proprietors from each of the locational categories were interviewed. Half of the mini
markets were located on land owned by the proprietor and half were located on squatted land.
The two located on squatted land were not asked whether they paid a fee for the land. Of the six
23 Equivalent to cents in American English

55
mini markets interviewed four were containers24 (Figure 11), one was an outbuilding (Figure 12),
and one was self-made (Figure 13).
Figure 11. Container mini market interviewed
Figure 12. Outbuilding mini market 24 Former shipping containers that are repurposed into mini markets.

56
Figure 13. Self-constructed mini market interviewed
All of the mini markets interviewees sold processed foods, half sold FFVs, five sold
staples (i.e., bread, eggs, rice) and only one sold cold store items (i.e., fish and meat). During the
interviews many respondents stated they started with processed foods because of the long shelf
life and high demand for such goods. Only one mini market sold all four food types, one mini
market sold everything other than cold store items, and the remaining four carried two of the four
food types.
Half of the mini market proprietors stated during the interview that they chose to start a
mini market because they wanted to care for their children. The cost and time of commuting and
daycare outweighed the benefits of having an income outside the home and in order to replace
this income they chose to open a mini market outside their home. In addition, a few respondents
stated that they are saving money in order to expand the mini market in the future. Instead of
saving with traditional sources like susu clubs, they chose to save with formal savings
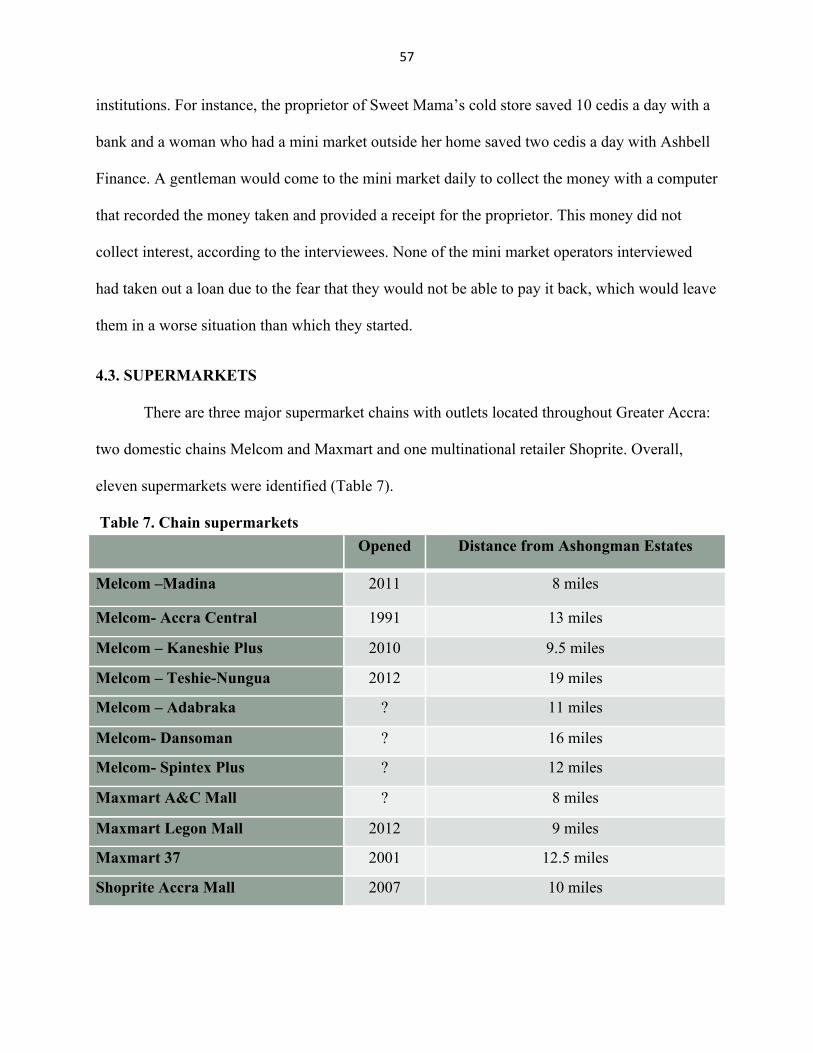
57
institutions. For instance, the proprietor of Sweet Mama’s cold store saved 10 cedis a day with a
bank and a woman who had a mini market outside her home saved two cedis a day with Ashbell
Finance. A gentleman would come to the mini market daily to collect the money with a computer
that recorded the money taken and provided a receipt for the proprietor. This money did not
collect interest, according to the interviewees. None of the mini market operators interviewed
had taken out a loan due to the fear that they would not be able to pay it back, which would leave
them in a worse situation than which they started.
4.3. SUPERMARKETS
There are three major supermarket chains with outlets located throughout Greater Accra:
two domestic chains Melcom and Maxmart and one multinational retailer Shoprite. Overall,
eleven supermarkets were identified (Table 7).
Table 7. Chain supermarkets Opened Distance from Ashongman Estates
Melcom –Madina 2011 8 miles
Melcom- Accra Central 1991 13 miles
Melcom – Kaneshie Plus 2010 9.5 miles
Melcom – Teshie-Nungua 2012 19 miles
Melcom – Adabraka ? 11 miles
Melcom- Dansoman ? 16 miles
Melcom- Spintex Plus ? 12 miles
Maxmart A&C Mall ? 8 miles
Maxmart Legon Mall 2012 9 miles
Maxmart 37 2001 12.5 miles
Shoprite Accra Mall 2007 10 miles

58
Figure 14. Supermarkets

59
Melcom is owned and operated by an Indian family and Maxmart is owned and operated
by a Lebanese family. Both families have resided in Ghana for generations (Maxmart, 2013;
Melcom Group of Companies, 2013). The arrival of Shoprite in 2005 as part of the Accra Mall is
the first TFC supermarket to enter the Greater Accra food retail environment. Shoprite is a South
African retailer that has stores throughout SSA. Since the entrance of Shoprite, Maxmart and
Melcom have expanded into new neighborhoods, with modern retail outlets (Figure 14).
Maxmart 37, Maxmart Legon Mall, and Shoprite in Accra Mall were visited to observe
and collect data on the layout of stores, the variety and quality of foods available, and types of
consumers and relative prices.
Maxmart 37 is located on the first floor of a three story building located next to a
convenience store and fast food restaurants. It is a smaller format store, has a small parking lot,
and is easily accessible with public transportation. There is a small produce section that carries a
small variety of products, the majority not traditionally grown in Ghana. It has a large bakery and
meat counter that resemble a bakery and a meat counter in a large grocery store in the United
States. It has a large amount and brand variety of processed goods that are crowded on shelves.
The prices for processed foods are relatively similar to traditional markets but there was a larger
variety and brand assortment. Consumers of all sorts were observed and there were a larger
number of expatriates shopping than in traditional markets.
Maxmart East Legon (Figure 15) was located on the first floor of a five story structure. It
was a larger store than 37 Maxmart however smaller than Shoprite. It had a large parking lot and
was easily accessible with public transportation, although it was located approximately two
blocks from the road. It has a larger produce section with more variety than the 37 Maxmart. It
also has a large bakery and meat counter like that of Maxmart 37. It has a refrigerated and frozen

60
goods section that carries juices, dairy products and meats. It has a large amount of processed
foods that were more organized than that of Maxmart 37. The prices for processed foods were
relatively similar to traditional markets but prices for fresh produce were higher than in
traditional markets. There were few consumers in this store, which was likely due to the newness
of the store.
Figure 15. East Legon Maxmart
Shoprite was a large store in the Accra Mall. It has a large parking lot that is highly
congested and is easily accessible with public transportation. The produce section resembles that
of larger supermarkets in the United States, although approximately one fourth of the size. It
carries a variety of imported fruits like oranges, apples and grapes. The fresh vegetable section
was much smaller. It also has a bakery and meat counter resembling that of the East Legon
Maxmart. It has an aisle of refrigerated and frozen goods including juices, dairy products and
meat. It has a larger amount of processed foods, but with less variety in brands than the Maxmart

61
stores. The prices for processed foods were similar to that of traditional markets. There were a
large number of shoppers that were both expatriates and Ghanaians.
In summary, supermarkets that were located in the Greater Accra region resemble
supermarkets in most Western nations and provide a similar shopping experience. However, they
fail to provide fresh produce sections that compete with traditional markets in domestic FFVs.
However, in the case of imported and non-domestic FFVs like apples and grapes, they do carry
these items that might not be as easy to find in traditional markets and cost more than domestic
FFVs. On the other hand, they provide competitive prices in processed and packaged foods and
provide more variety in these products compared to traditional markets. In addition, these retail
outlets provide an organized and hygienic environment in which consumers trust that the
products are of high quality.
4.4 SUMMARY
The food retail environment of the study area is diverse and spread out. Traditional
markets and mini markets continue to serve consumers on two levels. Traditional markets are
large central markets that serve a larger service area in the surrounding area and consumers are
able to purchase everything they need, while mini markets serve the neighborhood residents.
Supermarkets are similar to traditional markets in that they are spread throughout the built
environment but they serve consumers throughout the metro area. Supermarkets also provide a
different type of shopping experience in a hygienic and organized retail atmosphere under one
roof. Each of these retail outlets provides the same or similar products but serves different
service areas and populations as well as offer different shopping experiences.

62
CHAPTER 5.
CONSUMER BEHAVIOR AND ACCESS
This chapter presents and discusses the findings on the food retail environment of
Ashongman Estates by answering the final two research questions: where are consumers buying
and what types of foods are they buying. As already indicated, 75 households were randomly
selected to participate in the consumer survey. Whenever possible, the person responsible for
household grocery shopping was interviewed. Not surprisingly, the majority of respondents were
female (85.3 percent of total respondents), since shopping for household food items is
traditionally a woman’s task in Ghana. In terms of status in the household, 17.3 percent were the
head of the household, 58.7 percent Madame25 of the household, 21.3 percent a family member,
and 2.7 percent a roommate. For employment status, 65.3 percent of the respondents were
employed; of those, 49 respondents were employed in the informal sector and 34.7 percent in the
formal sector (Table 8).
Table 8. Household respondents' characteristics Sex Respondents (75) Percentage Male 11 14.7 % Female 64 85.3 % Household Role Household Head 13 17.3 % Household Madame 44 58.7 % Family member 16 21.3 % Roommate 2 2.7 % Employment Employed 49 65.3 % Formal Sector 17 22.7 % Informal Sector 32 42.7 %
25 Madame of the household is the head woman of the household, usually the wife.

63
For the purpose of this study, a household is defined by members who eat from the same
communal pot, including extended family and non-relative household members. Household
respondents were also asked: how many people do you buy food for? This included all
household members who consumed food received from the same communal pot and excluded
breastfeeding babies and children who attend boarding school for the majority of the year. The
average household size of the respondents is 5.45 people and the average number of people a
household bought food for is 5.29 people26. According to a study completed in 1996-1998, the
average household size was 5.1 persons (Maxwell, Levin, Armar-Klemesu, Ruel, Morris, &
Ahiadeke, 2000). The percentage of households that have at least one child between the ages of 6
months to 17 years is 74.7 percent. Of total survey households, 45.3 percent have at least one
child between 6 months and five years old and 57.3 percent have at least one child between 6 and
17 years old (Table 9).
Table 9. Household family characteristics Average Household size 5.45 Household feeds 5.29 Children Respondents (75) Percentage Children between 6 months and 17 years 56 74.7 % Children between 6 months and 5 years 34 45.3 % Children between 6 and 17 years 43 57.3 %
5.1 WHERE DO CONSUMERS PURCHASE FOOD?
One of the research questions of this study concerns how consumers behave and access
food for in home consumption in the food retail environment? In order to answer this question,
respondents were asked whether they purchased food for in-home consumption from
26 The difference between the average household size and people a household bought food for is due to the absence of children who attend boarding schools, and breastfeeding babies. In addition, some households stated they regularly fed non-household members.

64
supermarkets and several traditional retailers, including traditional markets, mini markets,27 cold
stores,28 roadside stands,29 hawkers,30 family/friends, and farmers. Respondents were also
allowed to name retailers that were not directly included in the survey that they bought food
from, such as neighborhood bakeries. Other than bakeries, the number of households that
frequented additional retailers was small so they were not included in the findings. Furthermore,
since a small percentage of households purchased food from family/friends and directly from
farmers, they were also excluded from the analysis. In addition to asking respondents where they
purchased food for in home consumption, the household survey sought to identify consumers’
food retail preferences as well as how they reached their preferred food retail outlets.
Generally residents patronize all the various retail outlets. The results show that
traditional markets are frequented by almost all households. Only one household indicated that
they do not frequent traditional markets and prefer neighborhood mini markets, due to the
congestion of traditional markets and hassle with haggling for prices. Mini markets are
frequented by 92 percent of households in the neighborhood of Ashongman Estates. Of those
households almost every respondent buys food from mini markets within walking distance from
their home. Cold stores are frequented by 76 percent of households. This is most likely due to
increased access to electricity and refrigeration equipment by retailers in residential
neighborhoods as well as in traditional markets. Supermarkets are frequented by 61.3 percent of
respondents. This is not surprising because supermarkets are fairly new and few (refer to Table
9) and according to the literature, supermarkets have yet to penetrate the food retail market
27 Full service retail outlets that operate in residential areas and range from table top stands in public spaces to concrete outbuildings outside houses. 28 Full service retail outlets that operate in traditional markets and as mini markets throughout the built environment that sell frozen and refrigerated meat and fish products. 29 Mini markets that operate along major roads. 30 People who offer goods for sale to the public without having a permanent built-up structure from which to sell

65
significantly in most SSA countries (Tschirley, 2010). Roadside stands are frequented by 52
percent of households and 49.3 percent of households buy food from hawkers. The lower
percentage of consumers purchasing food from roadside stands and hawkers is most likely due to
the availability of many of the items sold by these retailers in traditional markets and mini
markets in the neighborhood (Figure 16).
Figure 16. Retailers from which households bought food
Traditional markets are frequented by nearly all households making them the leading
food retail outlet. To better understand the food retail environment and geographic access to
traditional markets by consumers in Ashongman Estates, respondents were asked what
traditional markets they frequented. As already indicated, preliminary discussions with
Ashongman residents suggested the majority of respondents frequented Dome, Madina, Haatso
Yam Market, Makola and/or Abgobloshie. Due to this, respondents were specifically asked
whether they frequented these markets. Dome is the most frequented market with 92 percent of
households stating they buy groceries there, which is probably because of its proximity to
61.3%
98.7% 92%
52%
76%
49.3%
0%
10%
20%
30%
40%
50%
60%
70%
80%
90%
100%
Supermarket (46)
TradiHonal (74)
Mini market (69)
Roadside (39)
Coldstore (57)
Hawker (37)

66
Ashongman Estates. Madina is frequented by 52 percent of households, also due to its proximity
to Ashongman Estates as well as the larger size and greater variety of food items sold there.
Makola is frequented by 45.3 percent of households, which probably is due longer travel time
and the chaotic environment. The Haatso Yam market and Abgobloshie are frequented the least
by 38.7 percent and 30.7 percent of respondents respectively (Figure 17). The lower percentage
of respondents that frequent Haatso Yam market is likely because almost only yams are available
and it is mainly a wholesale market rather than a retail market for households. Abgobloshie is
also primarily a wholesale market but does provide a smaller retail market for residents in close
proximity.
Figure 17. Traditional markets from which households bought food
Respondents were also asked to name additional traditional markets in Greater Accra
they frequented; six additional markets were listed. None of these markets were frequented by
more respondents than the five traditional already discussed. Thus a total of 11 traditional
markets are frequented by households in Ashongman Estates (Figure 18).
92%
52%
38.7%
45.3%
30.7%
0%
10%
20%
30%
40%
50%
60%
70%
80%
90%
100%
Dome (69) Madina (39) Yam Market (29) Makola (34) Abgobloshie (23)

67
Figure 18. Traditional markets

68
5.1.1 Consumer frequency
Respondents were asked how often they frequented traditional markets and supermarkets.
Of the 74 respondents that frequent traditional markets, 65 respondents stated how often they
frequented traditional markets. The majority of these respondents (76.9 percent) buy food at a
traditional market at least once a week. Many respondents indicated they prefer shopping once a
week on Saturday, the busiest market day of the week, to take advantage of the largest variety
and quality offered on that day. Of the remaining respondents, 9.2 percent state they shop at
traditional markets monthly, 13.8 percent twice monthly, and 15.4 percent more than once a
week. Supermarkets are frequented by 61.3 percent of households. Of those 46 households, 39
stated how often they frequented a supermarket. The frequency of visits to supermarkets differs
from traditional markets in that 53.7 percent of those who shopped in supermarkets say they go
to supermarkets only once a month compared to 61.5 percent of survey households that visit
traditional markets weekly. Of the remaining respondents, 17.1 percent say they shop at a
supermarket twice a month, 19.5 percent weekly, and 4.9 percent shop in a supermarket once a
week or more (Figure 19).
Figure 19. Comparison of shopping frequencies
9.2% 13.8%
61.5%
15.4%
53.7%
17.1% 19.5%
4.9% 0%
10%
20%
30%
40%
50%
60%
70%
Monthly Twice a Month Weekly Once a week or more
Traditional Market Supermarket

69
The less frequent shopping in supermarkets could be due to the typical types of foods
available and purchased in supermarkets such as processed foods. It could also be because the
supermarket is not the main destination. For instance, Shoprite located in the Accra shopping
mall may be visited out of convenience while completing other shopping. Additionally, these
findings differ from the findings of Goldman and colleagues (2002) that found in Hong Kong
that households visited all types of food outlets on average 16 times weekly31. These differences
in shopping habits may be attributed to the different built environments between Accra and Hong
Kong. Hong Kong is much more densely populated and food outlets of all types are more
concentrated, making it unnecessary to travel with a vehicle to reach these locations, while Accra
is more spread out and less densely populated.
5.1.2 Consumer transportation
Transportation plays a critical role for residents of Ashongman Estates in reaching all
retail outlets other than mini markets. High levels of congestion and poor road maintenance
result in long commuting times and journey delays, however public transportation is affordable
(Armah, Yawson, & Pappoe, 2010). All traditional markets and supermarkets have major
transportation stops or are located along major transportation routes. There are several modes of
transportation that are used by households to reach traditional markets and supermarkets
including personal vehicle, tro-tro, public bus and taxi. The most popular mode of transportation
is minibus, locally referred to as tro-tro32 (Figure 20).
31 This is 5.8 trips to a wet market, 3.8 trips to a supermarket, 2.5 trips to a bakery, 1.2 trips to a fruit store and 1.0 trip to a Chinese grocery store. 32 This originated from Ga word "tro," which means three pence (pence being the penny coins used during Ghana's colonial days)

70
Figure 20. A tro-tro
Tro-tros have arisen with the deregulation of public transportation, which resulted in the
proliferation of these privately owned transport carriers, licensed by the state. Tro-tros are often
run down and appear to be dangerous, but are among the most efficient transport systems in the
country. Tro-tros stop at all bus stops and similar gatherings of people. One can also find tro-tros
at tro-tro parks, truck stations, traditional markets and commercial places like Accra Mall. There
are also public buses, but they run less frequently. Tro-tros and public buses are affordable and
charge around the same price. On both tro-tros and public buses it is common for riders to carry
large packages, especially foodstuff, from one market to another or home. Taxis are another
often utilized mode of transportation. They are found at taxi ranks or along any major road. A
taxi rank has taxis with set prices which are taken by customers who may not know each other
who are interested in traveling to the same location. Prices are normally based on a negotiation
between taxi driver and customer. Traffic is chaotic and thick in Accra, with traffic jams and

71
potholes being commonplace (Beautiful Ghana, 2013). Rates of car ownership are predicted to
increase the number of cars in Accra to over 1 million in 2023, which could result in more traffic
congestion (Armah, Yawson & Pappoe, 2010).
Respondents were asked to name what modes of transportation they used to reach their
preferred retail outlet and were allowed to name more than one (Figure 21).
Figure 21. Modes of transportation used by households to reach preferred retail outlet
Tro-tros are used by 58.3 percent of households to reach and/or return from their
preferred retail outlet. This may be due to the higher frequency of tro-tros than buses. Tro-tros
are also cheaper compared to taxis. The second most common mode of transportation is a
personal vehicle, which 62.7 percent of households owned but only 40.3 percent of households’
say they use to travel to get food products. Of total households, 16.7 percent state they use a taxi
as a mode of transportation to/from their preferred retail outlet. Many respondents state the use
of taxis is to return from retail outlets due to the large amount of purchases. The public bus is
used by only 6.9 percent of households, which is most likely due to the infrequency of buses.
58.3%
6.7%
38.7%
16%
0%
10%
20%
30%
40%
50%
60%
70%
Trotro (42) Bus (5) Personal car (29) Taxi (12)

72
5.1.3 Consumer Preferences
Respondents were asked to name the type of retail outlets where they preferred to do the
majority of their food purchasing. Households could name more than one type of retail outlet as
a preference. Of total households, 86.7 percent prefer traditional markets, 20 percent prefer
supermarkets and 10.7 percent prefer mini markets (Figure 22).
Figure 22. Preferred retail outlets of households
It is not surprising that a higher percentage of households prefer traditional markets
because of the availability of all types of items (food and provisions) and higher quality of
domestic FFVs. Many respondents that state they prefer both supermarkets and traditional retail
outlets because they purchase processed foods like canned goods and soda beverages in
supermarkets and FFVs and locally processed foods in traditional retail outlets.
86.7%
10.7%
20%
0% 10% 20% 30% 40% 50% 60% 70% 80% 90%
100%
Traditional Markets (65) Mini Markets (8) Supermarkets (15)

73
Respondents were asked choose up to three reasons from a set list as to why they chose
their preferred retail outlet. This included proximity (distance), low prices, quality, ability to
obtain specialty items, know trader, hygienic, convenience33 and other (Figure 23).
Figure 23. Consumer preferences in choosing preferred retail outlet
The most common reasons are low prices (73.3 %) and quality (60 %). The finding on
low prices is supported by studies about consumer behavior in developing country, where
purchasing power is usually lower and there are high rates of poverty (Minten, 2008).
Convenience (53.3 %) and proximity (46.7 %) are also common which is probably due to the
issues with traffic congestion in Greater Accra. Knowing the trader is cited by 10.7 percent of
households to explain why they prefer a particular retail outlet. This was anticipated to be higher
because it was believed that relationships between consumers and traders were highly valued.
The least common preference cited is hygienic conditions, at 9.3 percent, which is only stated
33 This was explained as ability to get everything one needed at place and/or since they were already going there they would also get food products (shopping at the mall for clothing and stopping at Shoprite to get some groceries).
73.3%
60% 53.3%
46.7% 41.3%
10.7% 9.3%
0%
10%
20%
30%
40%
50%
60%
70%
80%
Low prices (55)
Quality (45) Convenience (40)
Proximity (35)
Specialty Items (31)
Know Trader (8)
Hygenic (7)

74
about supermarkets, and which is consistent with studies on supermarketization (Goldman,
Ramaswami, & Krider, 2002).
Consumer preferences for traditional markets and supermarkets are compared below. The
top three reasons stated by consumers were low prices, quality and proximity. Of the 65
households that state they prefer traditional markets, 76.9 percent state low prices while of the 15
households that state they prefer supermarkets, only 26.7 percent state low prices. Prices were
observed in supermarkets and compared to prices in traditional markets. The prices for processed
goods like canned and packaged foods in supermarkets and traditional markets are similar, while
FFVs are much higher priced in supermarkets. Of the households that state they prefer traditional
markets, 52.3 percent gave quality as a reason and 40 percent of the households that prefer
supermarkets say quality is the reason. Respondents mentioned that traditional markets have
quality FFVs while supermarkets have quality processed and packaged foods. Of households,
41.5 percent favor traditional markets due to proximity while only 15 percent of households that
prefer supermarkets use that reason. In addition, 49.3 percent of respondents state they prefer
Dome market, the closest large retail outlet at 5.2 miles from Ashongman Estates. Proximity as a
reason why households prefer a retail outlet is believed to be important due to the large amount
of traffic and congestion in the Greater Accra metropolitan area. Furthermore, 33.3 percent state
convenience and hygienic conditions. It is likely that convenience causes a preference for
supermarkets because most are located near other commercial businesses, such as Shoprite in the
Accra Mall. There, respondents can complete additional tasks as well as buy groceries. It was
anticipated that hygienic conditions of supermarkets would be a reason consumers prefer them
due to their focus on providing hygienic conditions, compared to traditional markets (Figure 24).

75
Figure 24. Comparison of preferences between traditional markets and supermarkets
To expand on the three most common preferences, of the 37 households who prefer
Dome, 64.9 percent state they prefer Dome because of low prices, although it is often stated by
consumers and interviewees that the prices are higher at Dome than other traditional markets.
This could be because prices are low enough to make up for the savings in time and money spent
in transport. For instance, 62.2 percent state proximity and 40.5 percent of households state
convenience as why they prefer Dome. Both of these preferences are probably because it is the
nearest traditional market. In addition, 43.2 percent state they prefer Dome due to the high
quality of food items, which is typical of FFVs in traditional markets. Furthermore, 27 percent
state they prefer Dome because they can get specialty items (Figure 25).
38.5% 41.5%
76.9%
10.8%
52.3%
38.5%
6.2%
33.3%
0 %
26.7%
0 %
40 % 26.7% 33.3%
0% 10% 20% 30% 40% 50% 60% 70% 80% 90%
Convenience Proximity Low prices Know Trader Quality Specialty Items
Hygenic
Traditional Markets (65) Supermarket (15)

76
Figure 25. Preferences for Dome market
Another interesting finding is that of the 46 households that state they shop at
supermarkets, 67.4 percent state they prefer only traditional retailers and of those, 90 percent
state only traditional markets. This agrees with much of the literature on traditional markets that
says supermarkets are frequented by consumers but that traditional markets remain the main food
retail outlet for several reasons, including availability of affordable and high quality FFVs. On
the other hand only 5.3 percent state they prefer only supermarkets. Furthermore, 24 percent of
the households that frequent supermarkets state they prefer both traditional retailers and
supermarkets (Figure 26).
40.5%
62.2% 64.9%
43.2%
24.3%
0%
10%
20%
30%
40%
50%
60%
70%
Convenience (15) Proximity (23) Low Prices (22) Quality (16) Specialty (10)

77
Figure 26. Preferred retail outlets of households that shop in supermarkets
Of the households that state they prefer both traditional retailers and supermarkets it is oft
stated by respondents that they prefer buying processed foods at the supermarket and FFVs in the
traditional market. In addition, respondents state they prefer buying processed foods at the
supermarket because it provides a climate controlled atmosphere compared to traditional markets
where products often sat in the sun and heat.
5.1.4 Socioeconomic status and the choice of food retail outlets
There are five proxy indicators used to differentiate households according to
socioeconomic status (SES) in order to measure whether households of different statuses behave
differently in the food retail environment. Proxies are used for income because it is widely
acknowledged that self-reported measures of income are not reliable due to the understandable
reluctance of respondents, as well as inconsistencies in income week-to-week for the self-
employed in the informal sector (Morris, et al., 2000). Household tenure was split into three
67.3%
8.7%
24%
Traditional retailers (31) Supermarkets (4) Both (11)

78
categories: 1) own a house outright or with a mortgage, 2) rent, or 3) ‘looking after34’. Two
measurements of household employment were used as a proxy for SES. First, households were
identified by whether there was a member that was unemployed. This indicator was used because
if a member of the household was unemployed and looking for a job, the household was
deficient economically. The second measurement was what sectors employed members of the
household worked in: formal, informal or both. Car ownership was also used as a proxy for SES
because public/private transportation was affordable and car ownership did not guarantee easier
or cheaper access to points outside the neighborhood due to high levels of traffic and congestion.
A household either owned a vehicle or not. In addition, to SES measurement, households were
identified by whether the female head was employed or not. This indicator was used because the
literature often states that a household with a female head that works outside the house is more
likely to purchase convenience food like processed products.
Of the total survey households, 57.3 percent reported they own their home outright or
with a mortgage, 29.3 percent of households rent their home, and 13.3 percent of respondents
reported they are ‘looking after’ their current residence. According to the 2010 census, 32
percent of households own their home in the Greater Accra region, while 47 percent rent, and
20.6 percent are ‘looking after’ there current residence (Ghana Statistical Service, 2012). Of total
survey households, 36 percent have members that are only employed in the formal sector, 34.7
percent have members that are only employed in the informal sector, 22.7 percent have members
that are employed in both sectors, and 6.7 percent have no employed members. Of total
households, 28 percent have at least one member who is unemployed looking for a job. A vehicle
34 ‘Looking after’ refers to people who live rent-free and squatters who lived in incomplete structures with or without permission as well as self-constructed squatter structures.

79
is owned by 62.7 percent of survey households. The female household head is employed in 49.3
percent of households and unemployed in 50.7 percent (Table 10).
Table 10. Household socio-demographic characteristics Tenure Respondents (75) Percentage Own or mortgage 43 57.3 % Rented 22 29.3 % Looking After 10 13.3 % Household Employment Formal 27 36 % Informal 26 34.7 % Mixed 17 22.7 % No Employment 5 6.7 % Unemployed household member 21 28 % Female Household Head Employed 37 49.3 % Unemployed 38 50.7 % Vehicle Ownership 47 62.7 %
In summary, these household characteristics describe a residential neighborhood of
mostly upper to middle class working families with children that owned, mortgaged or rented
their homes. Thus, this sample is not representative of the Greater Accra region, implying that
these findings cannot be extrapolated.
5.1.5 Statistical Tests
A t-test for independence is used to determine the relationship between the above SES
and preferred choice of retail outlet. A t-test for independence is used when there are two groups
and a single measurement of a dependent variable. It measures whether the mean of one group is
different from the mean of the other (Marion, 2004). A P-value less than .05 is used to determine
whether the means between groups are statistically significant. In Excel, a 2-tail test is chosen
because there is prediction as to which group would be higher. There are three types of T tests
that can be used in Excel. Type 3 test is used in cases of unequal variances (Burton, 2002). For

80
the remaining two independent variables (employment and tenure), a one-factor analysis of
variance (AOV) otherwise known as an ANOVA is used. This test is used when there are three
or more groups and there is only one dependent variable measured. It measures whether one of
the group means is different from the other means, but not which groups (Marion, 2004).
The only significant finding presented in Table 11 is that in the households that own
vehicles, 80.4 percent shop in supermarkets while only 32.1 percent of households that do not
own a vehicle shop in supermarkets. This can be attributed to two reasons. First owning a vehicle
is an indicator of an upper to middle class family that may have more disposable income,
affording them the opportunity to shop in shopping centers like the Accra Mall and ANC Mall.
Second, culturally the ability to purchase items in shopping centers is a status symbol, so those
who own a vehicle may frequent these areas in order to show status. Although it is not
statistically significant, it is worth noting that households that own vehicles are more likely to
buy food from hawkers. This could be because hawkers often locate on the street at intersections
and areas that suffer from congestion, hawking their goods to drivers.
Although these findings are not statistically significant they warrant mentioning.
Households that look after their household are less likely to shop in supermarkets. This could be
because supermarkets are traditionally frequented by the upper and middle class and those who
squat their residence are more likely lower income. On the other hand, households that have
members that work in the formal sector are more likely to frequent supermarkets. This could be
because these family members work in areas that are more commercial and supermarkets are
conveniently close to their workplace. Households that rent and squat their residences and
households where all members work in the informal sector are more likely to purchase items

81
from a cold store. This could be because they themselves do not own a refrigerator or freezer, so
they purchase frozen meat products that they plan on consuming in the near future.
Table 11. Socioeconomic analysis and retail outlets
SES Indicators
Respondents
Super market
(46)
Mini Market
(69) Roadside
(39) Coldstore
(57) Hawker
(37) Vehicle Ownership 75 No Vehicle 28 32.1 %* 96.4 % 53.6 % 82.1 % 35.7 % Own Vehicle 47 80.4 %* 89.4 % 53.3 % 73.9 % 57.4 % Tenure 75 Own house 43 66.7 % 90.7 % 61.9 % 67.4 % 48.8 % Rent 22 63.6 % 95.5 % 47.6 % 90.5 % 59.1 % Looking After 10 40 % 90 % 30 % 90 % 30 % Employment 70 Formal 27 70.4 % 85.2 % 57.7 % 69.2 % 44.4 % Informal 26 46.2 % 96.2 % 44 % 92.3 % 53.8 % Mixed 17 64.7 % 94.1 % 52.9 % 64.7 % 47.1 % Unemployment 75 No unemployment 54 66 % 92.6 % 57.7 % 77.4 % 51.9 % Unemployment 21 52.4 % 90.5 % 42.9 % 76.2 % 42.9 % Working Female Household Head 75 Employed 37 59.5 % 94.6 % 51.4 % 78.4 % 51.4 % Unemployed 38 63.2 % 89.5 % 52.6 % 73.7 % 47.4 %
The only significant finding in Table 12 (that presents analysis on shopping in traditional
markets) is that working female household heads are more likely to shop at Makola and
Abgobloshie. This may be because they work outside the neighborhood and are more likely to be
in the center of the city due to the location of their workplace, making it convenient for them to
shop there.

82
Table 12. Socioeconomic analysis and traditional markets
SES Indicators Respondents
(75) Dome (69)
Madina (39)
Makola (34)
Abgobloshie (23)
Yam Market (29)
Vehicle Ownership No Vehicle 28 92.9 % 53.6 % 50 % 28.6 % 25 % Own Vehicle 47 91.5 % 51.1 % 42.6 % 34.1 % 50 % Tenure Own house 43 93 % 53.5 % 48.8 % 41.5 % 47.5 % Rent 22 90.9 % 50 % 50 % 23.8 % 40.9 % Squatter 10 90 % 50 % 20 % 10 % 10 % Employment Formal 27 88.9 % 40.7 % 40.7 % 24 % 42.3 % Informal 26 96.2 % 57.7 % 50 % 38.5 % 28 % Mixed 17 88.2 % 58.8 % 47.1 % 37.5 % 50 % No employment 5 100 % 60 % 40 % 20 % 60 % Household Unemployment No unemployment 54 90.7 % 48.1 % 44.4 % 23.1 % 43.4 % Unemployment 21 95.2 % 61.9 % 47.6 % 55 % 31.6 % Working Female Household Head Employed 37 91.9 % 59.5 % 56.8 %* 45.9 %* 32.4 % Unemployed 38 92.1 % 44.7 % 34.2 %* 15.8 %* 44.7 %
5.1.6 Summary of findings
The findings from the household survey show that traditional markets remain the main
and preferred food retail outlet, however multiple food retail outlets continue to be frequented by
households. Traditional markets remain the strongest retailer in the food retail environment in
Accra that is undergoing supermarketization. In addition, low prices and quality are the two most
stated reasons why respondents prefer a food retail outlet, and these are where traditional
markets hold an advantage. For instance, Ashongman residents prefer Dome, which is probably
because of proximity and cost related to opportunity costs of traveling in the Greater Accra
metropolitan area. Furthermore, although mini markets are not the main food retail outlet for
respondents, mini markets are frequented by a majority of households to buy items households

83
needed on short notice that do not warrant a trip to the traditional market and thuscreate
increased access to food.
5.2 WHAT TYPES OF FOODS DO CONSUMERS PURCHASE?
One of the research questions of this study concerns what foods consumers are
purchasing? In order to answer this question, a food list of 58 items split into five groups:
staples, fresh vegetables, fresh fruits, proteins, and highly processed was included in the
household survey. In addition, food items were described as imported or domestic and/or non-
processed, processed and locally processed (Appendix 4).
5.2.1 Background
During the 1970s to the 1980s there was a dramatic decline in agriculture production and
exports in Ghana due to poor development and economic policies. This resulted in increased
food imports that Ghana continues to be highly dependent on. The current shortfall of domestic
food production can be attributed to dependence on rain-fed agriculture and traditional practices
(Wolter, 2009). Furthermore, government subsidies were removed for inputs like fertilizer for
maize production, in addition to little public investment put into improving technologies and
production (Barbier, 2000; Wolter, 2009). Currently, domestic agriculture production only meets
half of cereal and meat needs and 60 percent of fish consumption. Ghana is only self-sufficient in
starchy staples such as cassava, yam and plantains, while rice and maize production falls below
demand (Wolter, 2009). Although domestic production fails to meet the country’s needs, since
1961 there has been an increase of available calories from 1986 kcal/person/day to 2934

84
kcal/person/day in 2009, an increase of almost 1000 kcal/person/day (data extracted from FAO
Food Balance Sheets)35.
The people of Accra are heavily reliant on the urban traditional markets for access to
food. More than 90 percent of all food consumed is purchased for cash (Maxwell, et al., 2000).
Urban populations and the affluent have more diversified diets that have high levels of
vegetables and fruits, ASFs, fats and oils, soda beverages and snack foods than the poor and rural
residents. This is because urban areas have more processed and packaged foods and imported
food items (Maxwell, 1998; Maxwell, et al., 2000). Poorer households also get more of their
calories from domestically produced starchy staples than the more affluent do (Maxwell, 1998).
However other factors also influence diets, including lifestyles, social relationships, marriage
patterns, family structures, and availability of packaged and processed foods, advertising and the
media. For instance, women working outside the home are increasingly looking for time-saving
foods (Maxwell, et al., 2000; Maxwell, 1998).
A basic meal in Ghana contains a starchy food eaten with a sauce or soup and fish, meat
or egg (Figure 27) (Food by Country, 2001; Maxwell, et al., 2000).
35 Available at Food and Agriculture Organization of the United Nations: http://faostat3.fao.org/home/index.html#DOWNLOAD

85
Figure 27. Fufu in a tomato sauce with canned mackerel (fish)
According to a study done by Plahar and colleagues (1999) on food availability and
consumption behaviors in southern Ghana, food intake is typically twice daily. However a study
by Nti (2008) found that most respondents eat three meals a day, while a few eat only twice
daily. In both studies, most households eat supper as the main meal prepared and consumed at
home, while breakfast and lunch are the most common meals purchased outside the home as
street food. Street food consumption is related to income, as well as whether women work
outside the home, proximity to traditional markets, and demographics (Maxwell D. , 1998).
Furthermore, Nti (2008) finds that about two-thirds of the respondents cook two meals a day at
home, with a small amount stating they only eat in-home prepared meals. The survey results
confirmed these findings. In the household survey, respondents were asked: in a typical week,
how many home-prepared meals the entire household eats at home? Breakfast is eaten in the

86
home on average 5.52 times a week, lunch 4.04 and supper 6.57 times. On average, households
eat 2.31 meals a day at home.
5.2.2 Staples
In most African communities people rely on a few staple crops (Oniang'o, Mutuku, &
Malaba, 2003). For people of Accra, grains, cereals, roots and tubers dominate the total food
consumption basket. Other than rice, the rest of the staples are prepared into dough. For instance
maize is made into banku and kenkey, millet or sorghum is made into tuo zaafi, and cassava,
yams and plantain are made into fufu, konkonto and gari36 (Maxwell, Levin, Armar-Klemesu,
Ruel, Morris, & Ahiadeke, 2000). Corn and cassava dough (Figure 28) are prepared locally and
widely available in traditional retail outlets. These doughs are further prepared in home to create
the starchy dishes named above.
As can be seen in Figure 29, 74.7 percent of households buy maize in grain form that
requires milling and 49.3 percent buy corn dough that is locally processed. Since mills are easily
accessible in the neighborhoods, maize is often bought in grain form. The lower percentage of
families that buy corn dough could be attributed to the relatively easy process of preparing that
food product. Non-processed cassava and gari are each bought by 82.7 percent of households.
This is probably because cassava is widely used in many of the staple dishes and the preparation
of gari is a specialized and time consuming process.
36 A starchy food made from grated and dry-roasted cassava that is processed locally and widely available (Oniang'o, Mutuku and Malaba 2003).
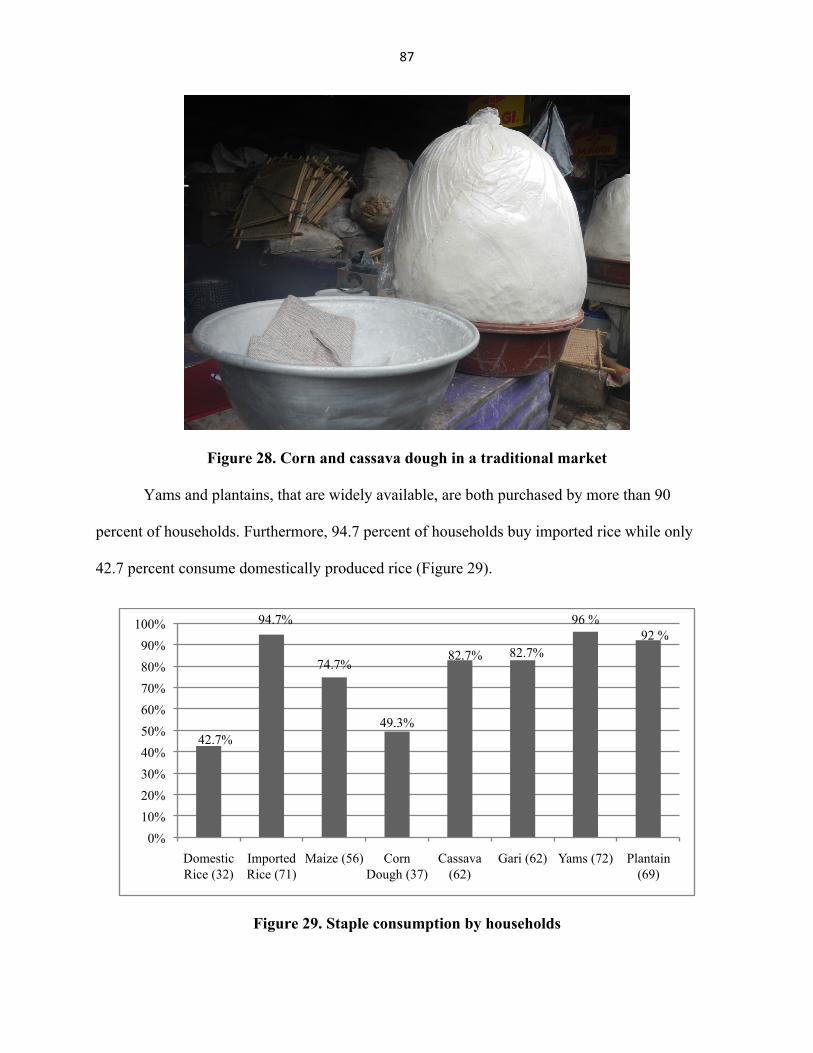
87
Figure 28. Corn and cassava dough in a traditional market
Yams and plantains, that are widely available, are both purchased by more than 90
percent of households. Furthermore, 94.7 percent of households buy imported rice while only
42.7 percent consume domestically produced rice (Figure 29).
Figure 29. Staple consumption by households
42.7%
94.7%
74.7%
49.3%
82.7% 82.7%
96 % 92 %
0% 10% 20% 30% 40% 50% 60% 70% 80% 90%
100%
Domestic Rice (32)
Imported Rice (71)
Maize (56) Corn Dough (37)
Cassava (62)
Gari (62) Yams (72) Plantain (69)

88
The results showed that imported rice is more widely purchased by households in
Ashongman Estates than domestic rice, which is supported by findings on rice consumption in
Ghana. First, Ghana only produces 30 percent of the domestic demand for rice (Mohapatra,
2013). Second, rice is produced in the north, making it expensive to transport to urban areas in
the south compared to imported rice that is subsidized. Third, consumers in urban areas prefer
the taste of imported rice varieties like jasmine rice (Wolter, 2009). Fourth, domestic rice is not
widely available in Accra and therefore is expensive. For instance, many rice traders in
traditional markets do not carry domestic rice because it is not profitable and there is little
consumer demand, because of the higher prices compared to imported varieties. The higher price
of domestic rice is due to the combination of higher cost of production, low yields and subsidies
on imported rice. Increased importation of rice in Ghana is linked with catastrophic impacts on
the rural economy and social structures in the north (Mohapatra, 2013).
5.2.3 Fresh Fruits and Vegetables (FFV)
Domestically grown and commonly eaten vegetables in Ghana include; tomatoes, onions,
eggplant, "kontomire" (leaves of cocoyam plant), spinach, carrots, okra, and pepper (Food by
Country, 2001). Over 90 percent of households buy tomatoes, onions and eggplant ("garden
eggs"). This is most likely because they are grown domestically and are central ingredients in
many sauces. Furthermore, kontomire, cabbage and cucumbers, which are purchased by around
85 percent of households, are also grown easily in Ghana. On the other hand, cauliflower, a fairly
new food crop in Ghana and relatively expensive, is purchased by only 57.3 percent of
households (Figure 30).
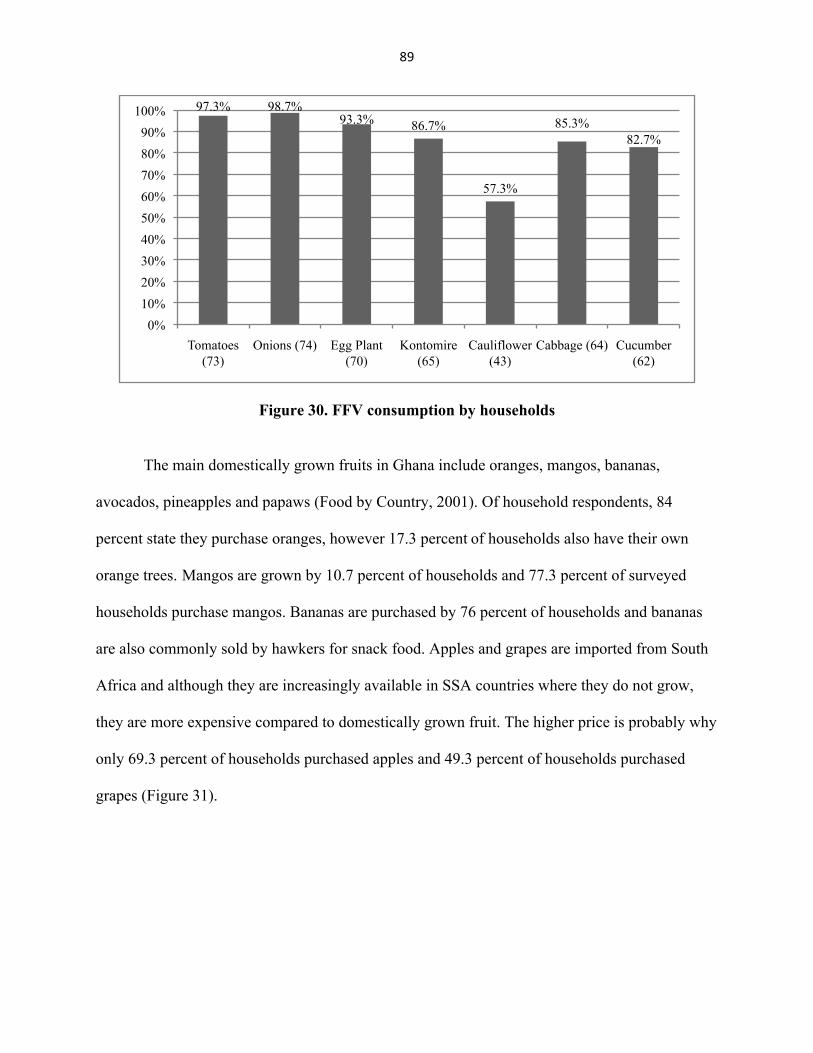
89
Figure 30. FFV consumption by households
The main domestically grown fruits in Ghana include oranges, mangos, bananas,
avocados, pineapples and papaws (Food by Country, 2001). Of household respondents, 84
percent state they purchase oranges, however 17.3 percent of households also have their own
orange trees. Mangos are grown by 10.7 percent of households and 77.3 percent of surveyed
households purchase mangos. Bananas are purchased by 76 percent of households and bananas
are also commonly sold by hawkers for snack food. Apples and grapes are imported from South
Africa and although they are increasingly available in SSA countries where they do not grow,
they are more expensive compared to domestically grown fruit. The higher price is probably why
only 69.3 percent of households purchased apples and 49.3 percent of households purchased
grapes (Figure 31).
97.3% 98.7% 93.3% 86.7%
57.3%
85.3% 82.7%
0% 10% 20% 30% 40% 50% 60% 70% 80% 90%
100%
Tomatoes (73)
Onions (74) Egg Plant (70)
Kontomire (65)
Cauliflower (43)
Cabbage (64) Cucumber (62)

90
Figure 31. FFV consumption by households: domestic versus imported
In summary, domestically produced FFVs are more commonly purchased by household
survey respondents, compared to imported and non-traditional FFVs like cauliflower. For
instance, imported fruits like apples and grapes are purchased by fewer households. Cauliflower,
which is now domestically produced, is also purchased by fewer households. Possible reasons
for the lower percentage of households that purchase these items are they have yet to become
part of the typical Ghanaian diet or the prices for these items are relatively expensive compared
to similar foods that are domestically produced.
5.2.4 Animal Source Foods (ASFs)
ASFs are consumed more by urban residents and the affluent compared to the poor and
rural residents (Maxwell, et al., 2000). The question asked whether households purchased a food
item and where. Every household purchases some sort of ASF and fish. This is not surprising
since Accra is a coastal community with a healthy fishing sector and meat consumption is
culturally acceptable. For instance, 66.7 percent of households consume corned beef and 70.6
84 % 77.3% 76 %
69.3%
49.3%
0%
10%
20%
30%
40%
50%
60%
70%
80%
90%
100%
Orange (63) Mango (58) Banana (57) Apple (52) Grapes (37)
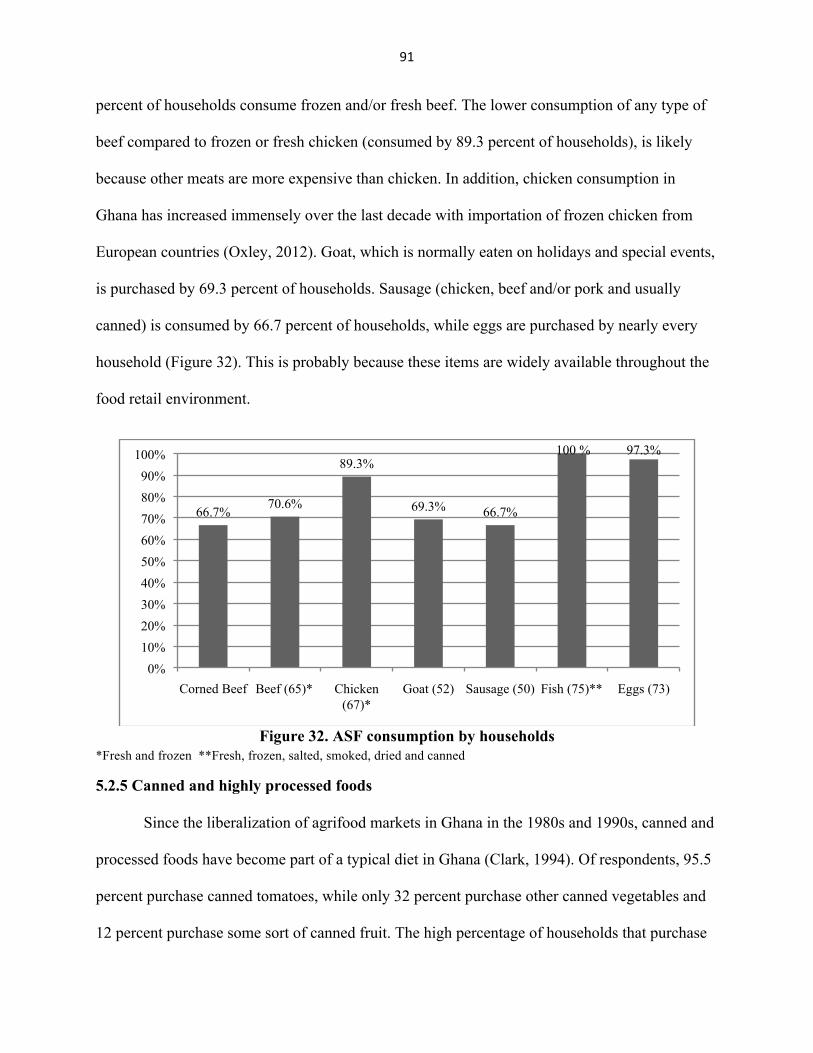
91
percent of households consume frozen and/or fresh beef. The lower consumption of any type of
beef compared to frozen or fresh chicken (consumed by 89.3 percent of households), is likely
because other meats are more expensive than chicken. In addition, chicken consumption in
Ghana has increased immensely over the last decade with importation of frozen chicken from
European countries (Oxley, 2012). Goat, which is normally eaten on holidays and special events,
is purchased by 69.3 percent of households. Sausage (chicken, beef and/or pork and usually
canned) is consumed by 66.7 percent of households, while eggs are purchased by nearly every
household (Figure 32). This is probably because these items are widely available throughout the
food retail environment.
Figure 32. ASF consumption by households
*Fresh and frozen **Fresh, frozen, salted, smoked, dried and canned
5.2.5 Canned and highly processed foods
Since the liberalization of agrifood markets in Ghana in the 1980s and 1990s, canned and
processed foods have become part of a typical diet in Ghana (Clark, 1994). Of respondents, 95.5
percent purchase canned tomatoes, while only 32 percent purchase other canned vegetables and
12 percent purchase some sort of canned fruit. The high percentage of households that purchase
66.7% 70.6%
89.3%
69.3% 66.7%
100 % 97.3%
0% 10% 20% 30% 40% 50% 60% 70% 80% 90%
100%
Corned Beef Beef (65)* Chicken (67)*
Goat (52) Sausage (50) Fish (75)** Eggs (73)

92
canned tomatoes is likely because tomatoes are used in many common sauces. The lower amount
of families that purchase other canned vegetables and fruits is probably because fresh fruits and
vegetables are widely available and affordable. Furthermore, 90.7 percent of households
purchase some sort of canned fish, which is likely because of the high consumption of fish in
southern Ghana overall and its coastal location (Figure 33).
Figure 33. Canned food consumption by households
Furthermore, packaged foods and sugary beverages are commonly purchased by
households (Figure 34). The high percentage of families that purchase these foods is because
they are available throughout the food retail environment, especially in mini markets.
95.5%
32.0%
12.0%
66.7%
90.7%
69.3%
0% 10% 20% 30% 40% 50% 60% 70% 80% 90%
100%
Tomato (63)* Vegetables (24) Fruits (9) Corned beef (50)
Fish (68) Baked beans (52)

93
Figure 34. Highly processed food consumption by household
In summary, canned, packaged and highly processed foods (other than canned vegetables
and fruits, excluding tomatoes) are purchased by a high percentage of households.
5.2.6 Socioeconomic Analysis
Statistical analysis was completed using the same indicators and statistical tests as in the
previous section for research question two. There are no significant statistical results to be
reported.
5.3 WHERE DO CONSUMERS PURCHASE DIFFERENT TYPES OF FOODS?
One of the research questions of this study asks what foods consumers are purchasing and
in what type of outlets? In order to answer this question, a food list of 58 items split into five
groups; staples, fresh vegetables, fresh fruits, proteins and highly processed was included in the
household survey. In addition, food items were described as imported or domestic and/or non-
76% 76% 64%
88% 80%
60%
0%
10%
20%
30%
40%
50%
60%
70%
80%
90%
100%
Fante (57) Cola (57) Margarine (48) Biscuits (66) Pasta (60) Cornflakes (45)

94
processed, processed and locally processed (Appendix 4). Consumers were then asked to answer
in what retail outlets they purchased these items.
5.3.1 Domestic and imported rice
As stated above, domestic rice is only purchased by 42.7 percent of households and
imported rice is purchased by 94.7 percent of households. Domestic rice is not as widely
available in supermarkets. This is backed up by consumers’ responses in the household survey.
Domestic rice is purchased in a supermarket by only one of the households, because domestic
rice is not commonly sold in supermarkets. On the other hand, 43.8 percent of households that
purchase domestic rice do it in traditional markets, 25 percent in mini markets and 12.5 percent
in roadside stands. Imported rice is purchased by 62 percent of households in traditional markets,
15.5 percent in supermarkets, 23.9 percent in mini markets and by none of the households at
roadside stands (Figure 35).
Figure 35. Retail outlets where consumers purchase domestic versus imported rice
3.1%
43.8%
25%
12.5% 15.5%
62%
23.9%
0% 0%
10%
20%
30%
40%
50%
60%
70%
Supermarket TradiHonal Mini Market Roadside
DomesHc (42.7%) Imported (94.7%)

95
These findings suggest that imported rice is widely available in traditional retail outlets
and supermarkets, while domestic rice has not entered supermarkets to a large degree and in
many cases is not even available at every rice trader in traditional markets. In addition, it is
common to see domestic rice as the only item sold in roadside stands.
5.3.2 Fresh Fruits and Vegetables (FFVs)
According to the literature, supermarkets in most developing countries have yet to break
into the FFVs market, which is the same finding in this study. Domestic FFVs are almost always
purchased by households in traditional markets. On the other hand, imported apples and grapes
from South Africa are purchased in supermarkets as well as traditional retail outlets. This may be
because supermarkets like Shoprite (a South African company) have an efficient supply chain
and logistics set up to import apples and grapes into all their stores across Africa. In addition,
apples are purchased from hawkers by 19.2 percent and grapes by 24.3 percent of households.
This was confirmed by observations and is likely because hawkers purchase apples and grapes
from the supermarket to sell (Figure 36).

96
Figure 36. Retail outlets from where consumers purchase domestic versus imported FFVs
In summary, domestic FFVs are purchased in all traditional retail outlets and rarely in
supermarkets , likely because in supermarkets domestic FFVs are not high quality or available.
On the other hand, imported FFVs like apples and grapes are purchased in both supermarkets and
traditional retail outlets. Thus, imported FFVs have now arrived in traditional retailers' shops and
consumers are able to easily access such items there and not only in supermarkets.
5.3.3 Processed foods
There are several canned foods that are widely available for purchase in supermarkets
and traditional retail outlets. Corned beef, fish, baked beans and tomatoes are commonly
purchased by households. Most households buy these goods in traditional markets, but around 20
percent of households purchase these items in supermarkets and around 30 percent state they
purchase these items in mini markets (Figure 37).
0%
10%
20%
30%
40%
50%
60%
70%
80%
90%
100%
Supermarkets TradiHonal Mini Hawker Roadside
Oranges (84%) Mango (77.3%) Apples (69.3%) Grapes (49.3%)
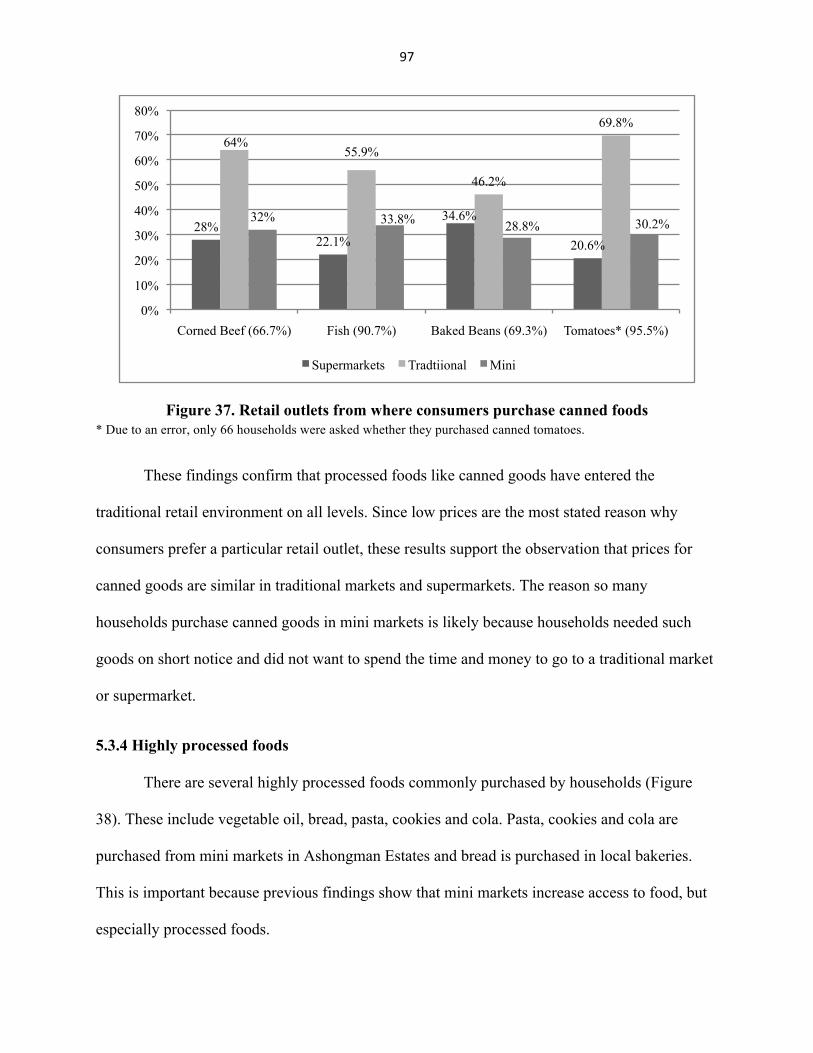
97
Figure 37. Retail outlets from where consumers purchase canned foods * Due to an error, only 66 households were asked whether they purchased canned tomatoes.
These findings confirm that processed foods like canned goods have entered the
traditional retail environment on all levels. Since low prices are the most stated reason why
consumers prefer a particular retail outlet, these results support the observation that prices for
canned goods are similar in traditional markets and supermarkets. The reason so many
households purchase canned goods in mini markets is likely because households needed such
goods on short notice and did not want to spend the time and money to go to a traditional market
or supermarket.
5.3.4 Highly processed foods
There are several highly processed foods commonly purchased by households (Figure
38). These include vegetable oil, bread, pasta, cookies and cola. Pasta, cookies and cola are
purchased from mini markets in Ashongman Estates and bread is purchased in local bakeries.
This is important because previous findings show that mini markets increase access to food, but
especially processed foods.
28% 22.1%
34.6%
20.6%
64% 55.9%
46.2%
69.8%
32% 33.8% 28.8% 30.2%
0%
10%
20%
30%
40%
50%
60%
70%
80%
Corned Beef (66.7%) Fish (90.7%) Baked Beans (69.3%) Tomatoes* (95.5%)
Supermarkets Tradtiional Mini

98
Figure 38. Retail outlets from where consumers purchase highly processed foods * Instead of a traditional market, this represents a local bakery.
5.4 SUMMARY
In summary, consumers frequent many different types of food retail outlets and purchase
a variety of food items from domestic to imported goods and locally processed foods to non-
traditional food items. Although supermarketization is taking place, it appears that traditional
retailers like traditional markets and mini markets continue to be favored by consumers and are
meeting needs in their area.
0%
10%
20%
30%
40%
50%
60%
70%
Vegetable Oil (100%)
Bread (98.7%)* Pasta (80%) Cookies (88%) Cola (76%
Processed Foods
Supermarket Traditional Mini Market

99
CHAPTER 6.
SUMMARY AND CONCLUSIONS
6.1 INTRODUCTION
The introduction and expansion of supermarkets in Greater Accra are showing visible
signs of change in the food retail environment. In order to better understand how consumers are
behaving and accessing food in the current food retail environment four questions were posited
in this study.
1. How is the current food retail environment in the Greater Accra metro area in Ghana structured?
2. In the current food retail environment where do consumers buy food for in home
consumption?
3. In the current food retail environment what types of foods are consumers buying for in home consumption?
4. In the current food retail environment where do consumers purchase different types of
foods for in home consumption?
By answering these questions, this study is able to map the food retail environment and
better understand consumer behavior and food access. The final section is divided into four
sections. The first section presents a summary of the five key findings of this case study. The
second section presents recommendations for improving the food retail system in Accra. The
third section is limitations and constraints of this study and the fourth section is possible future
research, followed by the conclusion.

100
6.1.1 Traditional Markets remain strong
Contrary to the claims in the literature that consumers will abandon traditional markets
and retailers in favor of supermarkets, the evidence from this study seems to suggest that the
majority of consumers continue to frequent traditional markets as their primary food retail outlet.
This is evident in the fact that the majority of consumers frequent and prefer traditional markets,
but also that supermarkets were visited normally monthly compared to weekly visits to
traditional markets. Consumers’ preferences for traditional markets are based on low prices and
the quality of the food, like domestic FFVs that were of lower quality or not even available in
supermarkets. Furthermore, consumers are more likely to frequent traditional markets near their
neighborhood because of convenience and proximity. This can be attributed to high traffic
congestion.
6.1.2 Affordable transportation increases access to food
Due to affordable and constant public/private transportation, consumers are more easily
able to access food retail outlets outside of their neighborhood. It is common to find in literature
on food access in developed countries that the development of food retail outlets in special
commercial zones outside of neighborhoods and high costs of transportation limit access to
healthy and affordable food. In the case of Greater Accra, high transportation costs do not appear
to limit access to traditional markets that carry all types of foods, although traffic congestion
does raise the opportunity costs related to shopping, which is most likely why weekly, instead of
daily, shopping trips are undertaken by the majority of consumers.
6.1.3 High access to a variety of foods in the retail environment
A variety of foods are easily and affordably accessible throughout the food retail
environment. All types of foods, including imported FFVs and staples like rice and canned

101
goods, have penetrated the traditional food retail environment. Thus consumers are able to
consume a more diverse and Western style diet in spite of accessing food in only traditional retail
outlets. Although consumers can purchase items like canned and packaged goods throughout the
traditional retail environment, some consumers are choosing to purchase such items in
supermarkets due to perceived higher quality because of better storage and climate control. In
addition, supermarkets offer more hygienic conditions protected from the outside elements and
focused on cleanliness. On the other hand, supermarkets have yet to penetrate the domestic FFV
market and locally processed foods markets like corn or cassava dough, resulting in traditional
markets having a higher quality and variety of foods. Until supermarkets enter the domestic FFV
market it appears that the hygienic conditions and climate control will not change the majority of
consumers from using traditional markets as their primary food retail outlet.
6.1.4 Neighborhood mini markets increase access to food
Due to a lack of planning and zoning enforcement, informal food retail outlets like mini
markets are able to operate businesses in residential neighborhoods that would normally be
banned through zoning and enforcement in developed countries. These neighborhood mini
markets increase access to a variety of foods, fresh and processed. Although mini markets are
rarely the main food retail outlet for consumers, the majority of consumers frequent them to buy
a variety of affordable foods throughout the day, especially in the evening hours when traditional
markets are closed or a trip to a retailer outside the neighborhood for one or a few items is costly.
While the increased access to food is good for neighborhood residents, it must also be recognized
that mini markets also increase access to unhealthy highly processed foods like sugary beverages
and cookies.

102
6.2 LIMITATIONS AND CONSTRAINTS
There are many limitations and constraints to this study. A larger and more representative
sample size of Greater Accra residents would allow for broader assertions about consumer
behavior and access to food. Due to limitations in time, it was decided to complete a case study
of a neighborhood rather than attempt to study the entire region. On the other hand, the strength
of this case study gaining a deeper insight into how consumers in a geographically distant suburb
access food and behaves, both within the built food retail environment in their neighborhood as
well as in Greater Accra. It also would have been preferred to survey more neighborhood
households, but traffic congestion in Accra made such efforts almost impossible, given time and
resource constraints. Furthermore, this study is only a snapshot in time thus no assertions about
changes over time can be made. the goal originally was to gather prices of foods in different
retail outlets to compare. However, during mini market and trader interviews it was found that
prices were not stable and highly fluctuating, thus broad observations and notes on overall prices
were taken instead. The data suffers from a number of shortcomings: some observations are
missing; questions pertaining to race/ethnicity were not included, thus the analysis did not
include any information on different ethnic groups; proxy questions of income did not appear to
be demonstrative of SES, thus SES analysis is weak. Furthermore, the sample size was not
representative of the Greater Accra population.
6.3 RECOMMENDATIONS
This study has identified several recommendations to sustain the current widespread
access to food in Accra, improve the traditional retail food environment and attempt to prevent
the negative health consequences of increased access to processed foods. First, this study has
shown that planning and enforcement of laws dealing with the traditional food retail environment

103
is minimal at this point. As planning improves it is critical that planners focus on transportation
infrastructure and traffic congestion on routes in and around traditional markets in order to cut
down on high opportunity costs for distributors and consumers in getting to and from traditional
markets. Planners must also realize the benefits of informal neighborhood enterprises like mini
markets in providing access to food and include them in plans and zoning. Additionally, this
study found that consumers think traditional markets are unhygienic and crowded. In order to
address this issue local authorities that collect taxes need to invest in infrastructure like roofing,
cleaning stations, concrete alleyways and hygienic restroom facilities. Fourth, this study shows
that there is widespread access to unhealthy processed foods throughout the urban environment,
which could result in a rise in diseases like obesity and diabetes across the population such as
developed countries are already experiencing. It is important that the government focus on
education about nutrition and health consequences of unhealthy eating habits. Public education
campaigns were common in Ghana on television and in advertisements. With these new types of
consumption, new campaigns will need to be created to educate the public about obesity and DR-
NCDs.
6.4 FUTURE RESEARCH
Future research on consumer behavior and access in the food retail environments of
developing countries needs to take into account several additional aspects. First, a food system
assessment of all components of the food system in Greater Accra would give planners and
policy makers an idea of what the issues are and what is working. Also, since this research is
only a snapshot in time, it would be interesting to return and complete a similar study in the
future in order to see if any changes have taken place. Second, to add more depth, health

104
measurements could be recorded in order to track whether consumption behavior and access to
certain food types are resulting in an increase in overweight and obesity.
6.5 CONCLUSION
In conclusion, the food retail environment for consumers in the neighborhood of
Ashongman Estates is diverse and all types of foods are accessible. New food retail outlets like
supermarkets are present in the current food retail environment of Greater Accra. For instance
there are several domestic supermarket Maxmart and Melcom stores and the first TFC
supermarket Shoprite. At this point in time it does not appear that supermarkets are negatively
impacting traditional retailers like traditional markets, mini markets, roadside stands, cold stores
and hawkers or increasing access to unhealthy foods that are already widely available. However,
it may be that in the future an increased number of modern retail outlets like convenience stores
and supermarkets will compete with traditional retailers.
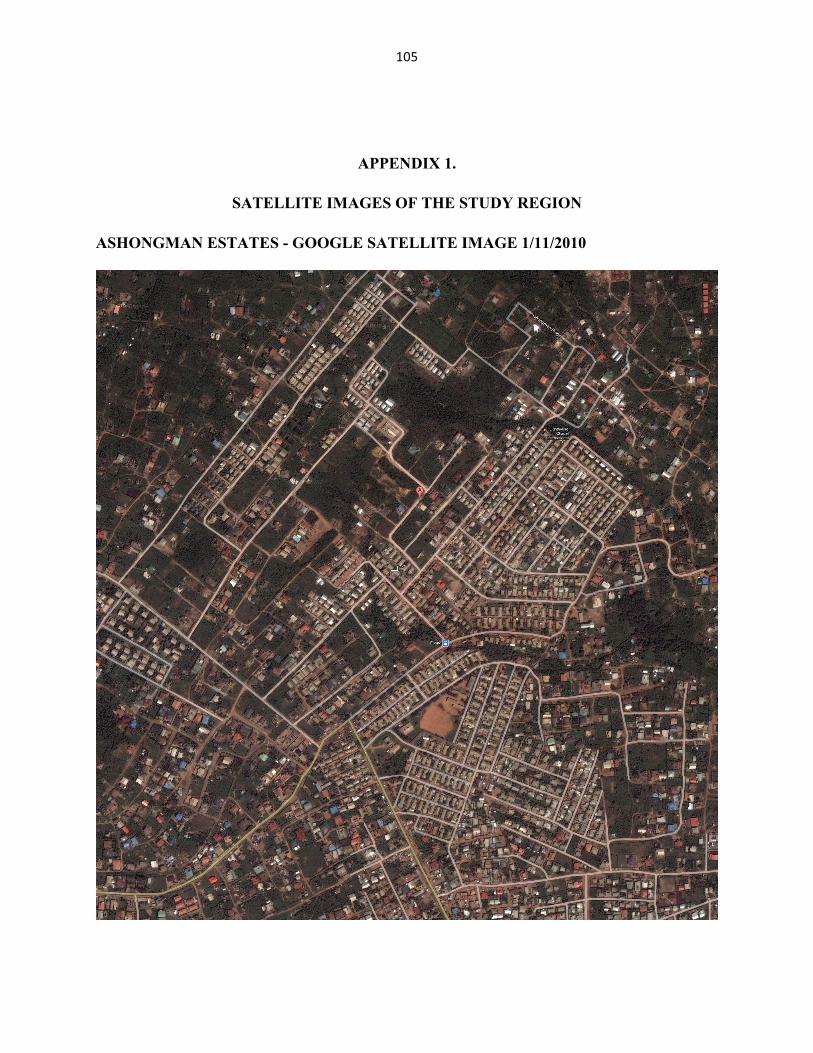
105
APPENDIX 1.
SATELLITE IMAGES OF THE STUDY REGION
ASHONGMAN ESTATES - GOOGLE SATELLITE IMAGE 1/11/2010

106
ZONE 1 - GOOGLE SATELLITE IMAGE 1/11/2010

107
ZONE 2 - GOOGLE SATELLITE IMAGE 1/11/2010

108
ZONE 3 - GOOGLE SATELLITE IMAGE 1/11/2010

109
APPENDIX 2.
DISTRIBUTOR INTERVIEW
FACESHEET
Interview number:____________ Food Distribution Location:___________________________
Food Distribution Type: _________________ Address or Location _______________________ GPS coordinates:_______________(Description):_________________________________________
Date & Time Surveyed: Date:______________ Day:______________ Time:______________
Hi. I am Shelley. I am currently collecting data on the food environment in (location). I
am interested in interviewing food traders about their business. You are being invited to
participate in this research as a representative. It would be greatly appreciated if you would
participate? I will try not to take more than 30 minutes of your time.
The goal of this interview is collect information about you and your business. This
information will be used to create a short story about your life and experiences selling food. This
will include why you have chosen to become a trader, what you do as a trader, what types of
food items you sell and a little bit about your life to give your story context. I don’t want to
interfere with your business so please continue selling your goods. When you have free moments
I can ask you a few questions. This interview will be recorded, to make it easier for the
researcher. You may skip any questions you do not wish to answer. Your participation is
completely voluntary. No personal identification information will be accessible or released to
anyone other than the researcher and research assistant.
1. Is it ok if we record this interview? Yes___ No____

110
2. Can you tell me a little about yourself as a food trader?
a. How long have you been trading?
Answer_________________________________________
b. How long have you been trading at _________________(location name)?
Answer____________________________________
3. Can you tell me about your business location choices?
a. What factors attracted you to locate your business at this location?
b. Do you have retail places in multiple locations around the city?
Yes___ No___ If yes, please explain?
c. Do you move this business to other locations throughout the week?
Yes____ No____
d. Would you prefer a different location?
Yes____ No_____ Please explain
e. Do you have plans for future relocation?
Yes____ No____
If yes, what factors would you looking for in your new location? Please explain.
f. Are there any constraints preventing you from moving from your current
location?
Yes____ No_____ If yes, please explain.
4. Why did you choose to become a trader? Please explain
5. From where and whom do you obtain the food that you sell?

111
6. Do you deliver food to customers upon request? If so, how do you do this? (mode of
transport, to their home, etc.)
7. Do the food items that you sell change with seasons?
Yes___ No___ If yes, please explain.
8. What are the top five food items that you sell most frequently?
9. How much time a week do you devote to trading?
10. If you don’t mind can I ask you a bit about your life and family to give context to your
story?
a. Are you single, married, widowed or divorced?
b. Do you have any children? Yes___ No____
i. If so are you supporting them financially through your activity as a trader?
Please explain
c. Do you have any other occupation or have you in the past?
11. Is there anything else you would like to add about your life, business or experiences to
make your story more complete?

112
APPENDIX 3.
HOUSEHOLD SURVEY
FACESHEET
Survey number ___________________________ Photo Number ______________
ID number _______________________________ Zone_______________________
Street ____________________________________ House Number ______________
GPS Lat___________________ Long___________________ Alt_________________
Date & Time Surveyed Date_____________ Day_________ Time______________
The purpose of this survey is to gather information from the person who is responsible
for making food purchase decisions for your household. This information will be used to create a
picture of the food environment, consumption trends and accessibility. You are being invited to
participate in this survey because you are the primary person responsible for making food
purchase decisions and your residence is located in the study area, Ashongman Estates. Your
participation in this survey will last approximately 15 - 20 minutes. You may skip any questions
you do not wish to answer. Your participation is completely voluntary. No personal/household
identification information will be accessible or released to anyone other than the researcher and
research assistant.
Section A Food consumption
1. How many people live in this household? ______
2. What is your position or role in this household?
Head of Household______ Madam of Household ______ Family member (nuclear)_____
Family member (extended)______ Maid/servant ______ Other (specify)______________

113
3. How many people do you buy food for? _____ persons (not incl. only breastfeeding
infants)
3a. Of those how many are children under 5 years of age who consume solid food? ___
3b. Of those how many are children ages 6-17 years? ______
4. In a typical week, how many home prepared meals does the entire household eat at
home?
Breakfast _____ Lunch _____ Supper_____ Total _____
5. In a typical week, do you prepare meals at home to be taken to eat outside the home (i.e.
lunch for work, lunch for school)? Yes____ No____
5a. If yes, how many home prepared meals are taken to eat outside the home?
Breakfast ______ Lunch _____ Supper _____ Total _____
5b. And, by whom? School children ______ Workers ______ Other_______________
6. If less than 7 times for each (see above), where else do the other household members
purchase or obtain their food?
Section B Food purchasing choices
7. Do you grow or raise your own food (i.e. garden, trees)? Yes_____ No_____
7a. If yes, what food products?
8. Do you purchase food from?
Dome market Yes____ No____
Madina market Yes____ No____
Makola market Yes____ No____

114
Abgobloshie mkt Yes____ No____
Yam market Yes____ No____
Other traditional mkt Yes____ No____
Name_____________________________________________
Super market Yes____ No____
Name:____________________________________________
Mini-supermarket Yes____ No ____
Within walking distance Yes____ No_____
Road-side seller Yes____ No____
Cold storage facility Yes____ No____
Hawkers Yes____ No____
Family/friends Yes____ No____
Farmer Yes____ No____
Other Name____________________________________
Other Name____________________________________
Other Name____________________________________
9. Do you purchase ____________ ?
10. Where do you purchase this item (Dome, Madina, Makola, Super Market, Mini-market)?
11. How often do you purchase this food item?
12. How much do you purchase at a time? One at a time, what you need, bulk
Staples Yes Where How often? Quantity
Rice (local)
Rice (Imp)

115
Maize
Maize (dough)
Cassava
Gari
Yams
Plantains
Tomatoes (fresh)
Tomatoes (tin)
Onions
Garden Eggs
Kontomire
Cauliflower
Cabbage
Cucumbers
Peppers
Oranges
Mango
Bananas
Apples
Grapes
Vegetables (tinned)
fruits (tinned)
beef (fresh)

116
beef (frozen)
Corned beef
pork (fresh)
pork (frozen)
chicken (fresh)
chicken (frozen)
Sausages
goat meat
fish (fresh)
fish salt, smoke, dried
fish (frozen)
fish (tinned)
Eggs
Beans
baked beans
Milk (liquid)
Milk (powder)
fruit (juice)
soy milk
chocolate drink
Fanta
Coca-cola

117
Margarine
Biscuits
Bread
Noodles or Pasta
Corn Flakes
Toffees
Chocolate
Maggi
Dawadawa
Palm Nut oil
Vegetable oil
13. Where do you prefer to buy the majority of your household food
________________________________________________________
14. Why do you prefer shopping at this location? (Three most important reasons)
Convenience______ Geographical Proximity______ Lower prices______
Know trader ______ Good Quality______ A variety of foods______
Specialty foods______ Other (specify)________________________________________
15. Are you able to buy the majority of your food from your preferred food market(s)?
Yes____ (Skip to question 10) No ____
16a. If No, Why

118
Distance ___ Cost ___ Time restraints ___ Transport ____ Other (specify)________
16. How do you normally get to your preferred food market?
Walking___ Tro-tro___ Bus___ Taxi___ Car___ Other (specify) _______
Section C Demographics
1. Is this your usual residence? Yes ____ No____
2. How would you describe your current residence?
11a. Single Family house ______ Multi-family house ____
11b. Rented residence ______ Owner residence______ Looking after _____
3. Are you currently employed? Yes_____ No_____
12a. If yes, what is your main occupation? ____________________________
12b. Formal or Informal sector? (circle one)
4. How many members of the household are employed? ____
4a. How many in the formal sector? ____
4b. How many in the informal sector? ____
5. Are there any members of the household who are currently unemployed looking for a
job? Yes_____ No_____ (skip to question 7)
6. If yes, how many? ___________
7. What is your highest level of education?
Primary____ Standard 8 ___ Secondary___ Post-secondary____
8. Does your household own a vehicle? Yes___ No___
9. Sex: female___ male___

119
APPENDIX 4.
FOODS LIST
Foods Domestic vs. Imported Processed vs. non-processed Staples Rice (local) Domestic N/A Rice (Imp) Imported N/A Maize Domestic Non-processed Maize (dough) Domestic Processed Cassava Domestic Non-processed Gari Domestic Processed Yams Domestic N/A Plantains Domestic N/A Fresh Vegetables Tomatoes Domestic Non-processed Onions Domestic Non-processed Garden Eggs Domestic Non-processed Kontomire Domestic Non-processed Cauliflower Imported Non-processed Cabbage Domestic Non-processed Cucumbers Domestic Non-processed Peppers Domestic Non-processed Fresh Fruits Oranges Domestic Non-processed Mangos Domestic Non-processed Bananas Domestic Non-processed Apples Imported Non-processed Grapes Imported Non-processed Protein Beef (fresh) Domestic Non-processed Beef (frozen) N/A Processed Corned beef N/A Processed pork (fresh) Domestic Non-processed pork (frozen) N/A Processed chicken (fresh) Domestic Non-processed chicken (frozen) N/A Processed Sausages N/A Processed goat meat Domestic Non-processed fish (fresh) Domestic Non-processed fish salt, smoke, dried Domestic Processed

120
fish (frozen) N/A Processed fish (tinned) N/A Processed Eggs Domestic Non-processed Beans N/A Non-processed baked beans N/A Processed Other Tomatoes (tinned) N/A Processed Vegetables (tinned) N/A Processed Fruits (tinned) N/A Processed Milk (liquid) N/A Processed Milk (powder) N/A Processed fruit juice N/A Processed soy milk N/A Processed chocolate drink N/A Processed Fanta N/A Processed Coca-Cola N/A Processed Margarine N/A Processed Biscuits N/A Processed Bread N/A Processed Noodles or Pasta N/A Processed Corn Flakes N/A Processed Toffees N/A Processed Chocolate N/A Processed Maggi N/A Processed Dawadawa N/A Processed Palm Nut oil Domestic Processed Vegetable oil Imported Processed
121
BIBLIOGRAPHY
Alabi, J., Alabi, G., & Ahiawodzi, A. (2007). Effects of "susu" - a traditional micro-finance mechanism on organized and unorganized micro and small enterprises (MSEs) in Ghana. African Journal of Business Management, 1(8), 201-208.
Armah, F. A., Yawson, D. O., & Pappoe, A. A. (2010). A systems dynamics approach to explore traffic congestion and air pollution link in the city of Accra, Ghana. Sustainability, 2, 252-265.
Aryeetey, E., & Kanbur, R. (2008). The Economy of Ghana Analytical Perspectives on Stability, Growth & Poverty. Chippenham, Great Britain: Woeli Publishing Services.
Asiedu, A. B., & Agyei-Mensah, S. (2008). Traders on the run: Activities of street vendors in the Accra Metropolitan Area, Ghana. Norwegian Journal of Geography, 62, 191-202.
Ayine, D. M. (2004). Managing trade liberalization: Legal system deficiencies and the political economy of contingency protection in Ghana. Journal of African Law, 48(2), 207-238.
Bader, M. D., Jennifer, A. A., Morenoff, J. D., & House, J. S. (2010). Measurement of the local food environment: A comparison of existing data sources. American Journal of Epidemiology, 171, 609-617.
Barbier, E. B. (2000). Links between economic liberalization and rural resource degradation in the developing regions. Agricultural Economics, 23, 299-310.
Beautiful Ghana. (2013). Beautiful Ghana. Retrieved January 23, 2013, from http://www.beautifulghana.com/content/view/5/62/lang,en/
Bigg, M., & Motsoeneng, T. (2013, August 30). Mall developers feel the pull of Africa's consumer boom. Reuters. Accra/Johannesburg. Retrieved September 1, 2013, from http://www.reuters.com/article/2013/08/30/us-africa-malls-idUSBRE97T08420130830
Bortei-Doku, E., & Aryeetey, E. (1995). Mobilizing cash for business: Women in rotating susu clubs in Ghana. In S. Ardener, & S. Burman (Eds.), Money-Go-Rounds: The Importance of ROSCAs for Women (pp. 77-94). Berg.
Boselie, D., Henson, S., & Weatherspoon, D. (2003). Supermarket procurement practices in developing countries: redefining the roles of public and private sectors. American Journal of Agriculture Economics, 85(5), 1155-1161.

122
Britwum, A. (2011). Trade unions and the informal economy in Ghana. In Trade Unions in West Africa: historical and contemporary perspectives (pp. 197-223). Bern: Peter Lang AG, International Academic Publishers.
Britwum, A. (2013). Market queens and the blame game in Ghanaian tomato marketing. In C. Scherrer, & D. Saha (Eds.), The Food Crisis Implications for Labor (pp. 53-72). Munchen, Mering: Rainer Hampp Verlag.
Bureau of African Affairs. (2011, November 4). Background Note: Ghana. Retrieved December 3, 2011, from U.S. Department of State: http://www.state.gov/r/pa/ei/bgn/2860.htm#geo
Burton, R. (2002). Using Excel to complete basic statistical tests. Retrieved from Alverno College: http://depts.alverno.edu/nsmt/stats.htm
Cheadle, A., Psaty, B., Wagner, E., et al. (1990). Evaluating community-based nutrition programs: assessing the reliability of a survey of grocery store product displays. American Journal of Public Health, 85, 1690-1692.
Chopra, M., Galbraith, S., & Darnton-Hill, I. (2002). A global response to a global problem: the epidemic of overnutrition. Bulletin of the World Health Organization, 80(12), 952-958.
Clark, G. (1994). Onions are my husband: survival and accumulation by West African market women. Chicago and London: The University of Chicago Press.
Clarke, G., Eyre, H., & Cliff, G. (2002). Deriving indicators of access to food retail provision in British cities: Studies of Cardiff, Leeds and Bradford. Urban Studies, 39(11), 2041-2060.
Codjoe, S., & Dzanku, F. M. (2009). Long-term determinants of Deforestation in Ghana: The role of Structural Adjustment Policies. African Development Review, 21(3), 558-588.
Coe, N. M., & Wrigley, N. (2007). Host economy impacts of transnational retail:the research agenda. Journal of Economic Geography, 7, 341-371.
Cummins, S., & Macintyre, S. (2009). Are secondary data sources on the neighborhood food environment accurate? Case study in Galsgow, UK. Preventitive Medicine, 49(6), 527-528.
D'Haese, M., & Van Huylenbroeck, G. (2005). The rise of supermarkets and changing expenditure patterns of poor rural households case study in the Transkei area, South Africa. Food Policy, 30, 97-113.
Donkin, A. J., Dowler, E. A., Stevenson, S. J., & Turner, S. A. (1999). Mapping access to food at a local level. British Food Journal, 101(7), 554-564.

123
Drewnowski, A., & Popkin, B. M. (1997). The nutrition transition: New trends in the global diet. Nutrition Reviews, 55(2), 31-43.
Farina, E., Nunes, R., & Monteiro, G. (2005). Supermarkets and their impacts on agrifood system in Brazil: The competition among retailers. Agribusiness, 21(2), 133-147.
Flodman Becker, K. (2004). The Informal Economy. Sida, Department for Infrastructure and Economic Co-operation. Retrieved September 19, 2013, from Sida: http://www.sida.se/English/About-us/Publication_database/Publications-by-year/2004/mars/The-Informal-Economy/
Food by Country. (2001). Retrieved February 23, 2013, from http://www.foodbycountry.com/Germany-to-Japan/Ghana.html
Frazão, E., Meade, B., & Regmi, A. (2008). Converging patterns in global food consumption and food delivery systems. USDA, Economic Research Service, 6(1), 22-29.
Ghana Statistical Service. (2012). 2010 population and housing census: summary report of final results. Retrieved June 27, 2013, from Government of Ghana: http://www.statsghana.gov.gh/pop_stats.html
ghanadistricts.com. (2013). Retrieved June 5, 2013, from http://www.ghanadistricts.com/home/
Gocking, R. S. (2005). The History of Ghana. Westport, CT, United States of America: Greenwood Press.
Goldman, A., Krider, R., & Ramaswami, S. (1999). The persistent competitive advantage of traditional food retailers in Asia: Wet markets' continued dominance in Hong Kong. Journal of Macromarketing, 19, 126-139.
Goldman, A., Ramaswami, S., & Krider, R. E. (2002). Barriers to the advancement of modern retail formats: theory and measurements. Journal of Retailing, 78, 281-295.
Gordon, C., Purciel-Hill, M., Ghai, N. R., Kaufman, L., Graham, R., & Van Wye, G. (2011). Measuring food deserts in New York City's low-income neighborhoods. Health and Place, 17, 696-700.
Gorton, M., Sauer, J., & Supatpongkul, P. (2011). Wet markets, supermarkets and the “Big Middle” for food retailing in developing countries: Evidence from Thailand. World Development, 39(9), 1624-1637.
Humphrey, J. (2007). The supermarket revolution in developing countries: Tidal wave or tough competitive struggle? Journal of Economic Geography, 7, 433-450.

124
Jeong, H.-w. (1998). Economic reform and democratic transition in Ghana. World Affairs, 160(4), 218-230.
Johnson, P. M. (2005). Transaction costs. Retrieved September 1, 2013, from A Glossary of Political Economy Terms: http://www.auburn.edu/~johnspm/gloss/transaction_costs
Kearney, J. (2010). Food consumption trends and drivers. Philosophical Transactions of the Royal Society Biological Sciences, 365, 2793-2807.
Kennedy, G., Nantel, G., & Shetty, P. (2004). Globalization of food systems in developing countries: A synthesis of country case studies. In FAO, Globalization of food systems in developing countries: Impact on food security and nutrition (pp. 1-25). Rome: FAO.
Lang, T. (2003). Food industrialisation and food power: Implications for food governance. Development Policy Review, 21(5-6), 555-568.
Larsen, K., & Gilliland, J. (2008). Mapping the evolution of 'food deserts' in a Canadian city: Supermarket accessibility in London, Ontario, 1961-2005. Interntional Journal of Health Geographics, 7(16).
Lyon, F. (2003). Trader Associations and Urban Food Systems in Ghana: Institutionalist Approaches to Understanding Urban Collective Action. International Journal of Urban and Regional Research, 27(1), 11-23.
Makoka, D. (2005). The emergence of supermarkets in Malawi: Implications for agrifood markets and the small farmer. In T. Tsukomu (Ed.), Agricultural and Rural Development in Malawi: Macro and Micro Perspectives (pp. 121-139).
Maruyama, Masayoshi, & Trung, L. (2007). Supermarkets in Vietnam: Opportuntities and obstacles. Asian Economic Journal, 21(1), 19-46.
Maxmart. (2013). Retrieved September 1, 2013, from http://www.maxmartghana.com/about_us.html
Maxwell, D. (1998). The political economy of urban food security in Sub-Saharan Africa. Discussion Paper, International Food Policy Research Institute, Food Consumption and Nutrition Division. Retrieved from International Food Policy Research Institute: http://www.ifpri.org/publication/political-economy-urban-food-security-sub-saharan-africa
Maxwell, D., Levin, C., Armar-Klemesu, M., Ruel, M., Morris, S., & Ahiadeke, C. (2000). Urban livelihoods and food and nutrition security in Greater Accra, Ghana. International Food Policy Research Institute. Retrieved June 26, 2013 from http://www.who.int/nutrition/publications/foodsecurity/livelihoods_foodsecurity_ghana.pdf

125
Melcom Group of Companies. (2013). Retrieved September 1, 2013, from http://www.melcomgroup.com/index_2.html
Mensah, P., Yeboah-Manu, D., Owusu-Darko, K., & Ablordey, A. (2002). Street foods in Accra, Ghana: how safe are they? Bulletin of the World Health Organization, 80(7), 546-554.
Miller, D. (2008, July). Food Frontiers in Zambia: Resistance and Partnership in Shoprite's Retail Empire. Africa Files. Retrieved July 23, 2008, from http://www.africafiles.org/printableversion.asp?id=18515
Minten, B. (2008). The food retail revolution in poor countries: Is it coming or is it over? Economic Development and Cultural Change, 767-789.
Mohapatra, S. (2013, April 12). Ghana Celebrates Rice. Retrieved August 10, 2013, from International Rice Research Institute: http://www.irri.org/index.php?option=com_k2&view=item&id=12530:ghana-celebrates-rice&Itemid=100094&lang=en
Moore, L. V., & Diez Roux, A. V. (2006). Associations of neighborhood characteristics with the location and type of food stores. American Journal of Public Health, 96(2), 325-331.
Morris, S. S., Carletto, C., Hoddinott, J., & Christiaensen, L. J. (2000). Validity of rapid estimates of household weath and income for health surveys in rural Africa. Journal of Epidemiology Community Health, 54, 381-387.
Muratbayeva, B. (2010). Zongo and the community of work and life in Accra, Ghana. Researcch Report, Bielefeld, Germany. Retreived from http://www.uni-bielefeld.de/tdrc/ag_sozanth/downloads/Zongo%20and%20the%20community%20of%20work%20and%20life%20in%20Accra,%20Ghana
Ndikumana, L., & Verick, S. (2008). The linkages between FDI and domestic investment: Unravelling the development impact of foreign investment in Sub-Saharan Africa. Bonn: Institute for the Study of Labor (IZA).
Neuman, W. L. (2011). Social Research Methods: Qualitative and Quantitative Approaches (7 ed.). Allyn & Bacon.
Neven, D., & Reardon, T. (2004). The rise of Kenyan supermarkets and the evolution of their horticulture product Procurement Systems. Development Policy Review, 22(6), 669-699.
Neven, D., Reardon, T., Chege, J., & Wang, H. (2006). Supermarkets and Consumers in Africa. Journal of International Food and Agribusiness Marketing, 18, 103-123.
Nti, C. A. (2008). Household dietary practices and family nutritional status in rural Ghana. Nutrition Research and Practice, 2(1), 35-40.

126
Nyanteng, V. K., & Wayo Seini, A. (2000). Agricultural policy & the impact on growth and productivity 1970-95. In E. Aryeetey, J. Harrigan, & M. Nissanke (Eds.), Economic Reforms in Ghana: The Miracle and Mirage (pp. 267-283). Oxford: Africa World Press Inc.
Oniang'o, R. K., Mutuku, J. M., & Malaba, S. J. (2003). Contemporary African food habits and their nutritional and health implications. Asia Pacific Journal of Clinical Nutrition, 12(3), 231-236.
Opoku, D. K. (2010). From a 'success' story to a highly indebted poor country: Ghana and neoliberal reforms. Journal of Contemporary African Studies, 28(2), 155-175.
Overa, R. (2007). When men do women's work: Structural adjustment, unemployment and changing gender relations in the informal economy of Accra, Ghana. The Journal of Modern African Studies, 45(4), 539-563.
Owusu, F. (2001). Urban impoverishment and multilple modes of livelihood in Ghana. The Canadian Geographer, 45(3), 387-403.
Owusu, F. (2007). Conceptualizing livelihood strategies in African cities: Planning and development implications of multiple livelihood strategies. Journal of Planning Education and Research, 26(4), 450-465.
Oxley, N. (2012, November 28). Ghana: take 70,900 metric tons of frzen chicken, add politics. The Crossing. Ghana. Retrieved from http://stepscentre-thecrossing.blogspot.com/2012/11/ghana-take-70900-frozen-chickens-add.html
Pellow, D. (2002). Landlords and Lodgers: Socio-Spatial Organization in an Accra Community. Westport, CT: Praeger.
Phelan, C. (2011). West African trade unionism past and present. In C. Phelan (Ed.), Trade Unions in West Africa: Historical and contemporary perspectives (Vol. 7, pp. 1-22). Bern: Peter Lang AG, International Academic Publishers.
Pingali, P. (2006). Westernization of Asian diets and the transformation of food systems: Implications for research and policy. Food Policy, 32, 281-298.
Plahar, W., Nti, C., Quaye, W., & Nyako, P. (1999). Household food availability and consumption behaviour in the coastal savanna zone of Ghana. Food Research Institute, C.S.I.R. .
Popkin, B. M. (1994). The nutrition transition in low-income countries: An emerging crisis. Nutrition Reviews, 52(9), 285-298.

127
Popkin, B. M. (2002). Part II. What is unique about the experience in lower- and middle-income less-industrialised countries compared with the very-high-income industrialised countries? Public Health Nutrition, 5(1A), 205-214.
Popkin, B. M. (2006). Technology, transport, globalization and the nutrition transition food policy. Food Policy, 31, 554-569.
Popkin, B. M., Adair, L. S., & Wen Ng, S. (2011). Global nutrition transition and the pandemic of obesity in developing countries. Nutrition Reviews, 70(1), 3-21.
Rapley, J. (2007). Understanding Development: Theory and Practice in the Third World (3 ed.). Boulder: Lynne Rienner Publishers.
Rayner, G., Hawkes, C., Lang, T., & Bello, W. (2007). Trade liberalization and the diet transition: a public health response. Health Promotion International, 21(S1), 67-74.
Reardon, T., & Berdegue, J. A. (2002). The rapid rise of supermarkets in Latin America: Challenges and opportunities for development. Development Policy Review, 20(4), 371-388.
Reardon, T., & Hopkins, R. (2006). The supermarket revolution in developing countries: Policies to address emerging tensions among supermarkets, suppliers and traditional retailers. The European Journal of Development Research, 18(4), 522-545.
Reardon, T., & Timmer, C. P. (2007). Transformation of markets for agricultural output in developing countries since 1950: How has thinking changed? Handbook of Agricultural Economics, 3, 2808-2855.
Reardon, T., Timmer, P. C., Barrett, C. B., & Berdegué, J. (2003). The rise of supermarkets in Africa, Asia and Latin America. American Journal of Agricultural Economics, 85(5), 1140-1146.
Reardon, T., Timmer, P., & Berdegue, J. (2004). The rapid rise of supermarkets in developing countries: Induced organizational, institutional, and technological change in agrifood systems. Journal of Agricultural and Development Economics, 1(2), 168-183.
Regmi, A., & Gehlhar, M. (2001). Consumer preferences and concerns shape global food trade. Food review, 24(3), 2-8.
Regmi, A., & Gehlhar, M. (2005). Processed food trade pressured by evolving global supply chains. USDA, Economic Research Service, 3(1), 12-19.
Rosen, S., & Shapouri, S. (2008, September). Obesity in the midst of unyielding food insecurity in developing countries. USDA, Economic Research Service, 6(4), 10-15.

128
Ruel, M. T., & Garrett, J. L. (2004). Features of urban food and nutrition security and considerations for successful urban programming. Globalization of food systems in developing countries: impact on food security and nutrition, 83, pp. 27-53.
Schildkrout, E. (1978). People of the zongo The Transformation of Ethnic Identities in Ghana. Cambridge University Press.
Schmidhuber, J., & Shetty, P. (2005). The nutrition transition to 2030: Why developing countries are likely to bear the major burden. Seminar of the European Association of Agricultural Economist. England: FAO.
ShopRite. (2013). Retrieved February 25, 2013, from http://www.shoprite.co.za
Stamoulis, K. G., Pingali, P., & Shetty, P. (2004). Emerging challenges for food and nutrition policy in developing countries. Journal of Agricultural and Development Economics, 1(2), 154-167.
Temple, N. J., Steyn, N. P., Fourie, J., Phil, M., & De Villiers, A. (2011). Price and availability of healthy food: A study in rural South Africa. Nutrition, 27, 55-58.
The Habari Network. (2013, January 20). Retrieved September 1, 2013, from The Habari Network: http://www.thehabarinetwork.com/ecowas-urges-members-to-hasten-troop-deployment-in-mali
Timmer, P. C. (2004). Food policy in the era of supermarkets: What's different? Journal of Agricultural and Development Economics, 1(2), 50-67.
Timmer, P. C. (2009). Do supermarkets change the food policy agenda? World Development, 37(11), 1812-1819.
Traill, B. W. (2006). The rapid rise of supermarkets? Development Policy Review, 24(2), 163-174.
Tschirley, D. (2010). Opportunities and constraints to increased fresh produce trade in East and Southern Africa. Paper prepared for 4th Video Conference under AAACP-funded series of high value. Retrieved from http://fsg.afre.msu.edu/zambia/VC4Position_Paper_FreshProduce_Trade_D_Tschirley.pdf
Unger, S., & Wooten, H. (2006). A food systems assessment for Oakland, CA: Toward a sustainable food plan. Oakland Mayor's Office of Sustainability. Retrieved from: http://clerkwebsvr1.oaklandnet.com/attachments/14033.pdf
UN-Habitat. (2009). Ghana Urban Profile. Nairobi: UN-Habitat. Retrieved from: http://www.google.com/url?sa=t&rct=j&q=&esrc=s&source=web&cd=1&ved=0CC4QFj

129
AA&url=http%3A%2F%2Fwww.unhabitat.org%2Fpmss%2FgetElectronicVersion.asp%3Fnr%3D2724%26alt%3D1&ei=_9qfUp_iNYGmyQHE34DQCw&usg=AFQjCNGyksiFmP0Ia7EiQiu1TXFiRTad5A&sig2=TFAMbibbYh7ttYHjbn-cNA&bvm=bv.57155469,d.aWc&cad=rja
Watson, J. (2013, February 21). Defining China's Challenges. Retrieved August 31, 2013, from IGD.com: http://www.igd.com/our-expertise/Economics-horizon-scanning/Global-economy/12690/Defining-Chinas-challenges/
Watson, V. (2009). 'The planned city sweeps the poor away...': Urban planning and 21st century urbanisation. Progress in Planning, 72, 151-193.
Weatherspoon, D. D., & Reardon, T. (2003). The rise of supermarkets in Africa: Implications for agrifood systems and the rural poor. Development Policy Review, 21(3), 333-355.
Weng, Q. (2010). Remote Sensing and GIS Integration. United States of America: McGraw Hill Companies.
Winkler, E. (2008). Food accessibility, affordability, cooking skills and socio-economic differences in fruit and vegetable purchasing in Brisbane, Australia. Brisbane: University of Queensland.
Wolter, D. (2009). Ghana: Agriculture is becoming a business. OECD Journal: General Papers, 2, 9-32.
World Health Organization. (2013a). Foreign Direct Investment (FDI). Retrieved 9 1, 2013, from World Health Organization: http://www.who.int/trade/glossary/story029/en/index.html
World Health Organization. (2013b). Structural Adjustment Programmes (SAPs). Retrieved September 1, 2013, from World Health Organization: http://www.who.int/trade/glossary/story084/en/