Embed Size (px)
Citation preview

A Case Study of Urban ParticleAcidity and Its Influence onSecondary Organic AerosolQ I Z H A N G , * , † J O S E L . J I M E N E Z , ‡
D O U G L A S R . W O R S N O P , § A N DM A N J U L A C A N A G A R A T N A §
Atmospheric Sciences Research Center (ASRC) and Departmentof Environmental Health Sciences, 251 Fuller Road, CESTML110, University at Albany, State University of New York,Albany, New York 12203, Cooperative Institute for Research inEnvironmental Sciences (CIRES) and Department of Chemistryand Biochemistry, 216 UCB, University of Colorado-Boulder,Boulder, Colorado 80309, and Aerodyne Research Inc.,Billerica, Massachusetts 01821
Size-resolved indicators of aerosol acidity, including H+
ion concentrations (H+Aer) and the ratio of stoichiometric
neutralization are evaluated in submicrometer aerosolsusing highly time-resolved aerosol mass spectrometer (AMS)data from Pittsburgh. The pH and ionic strength withinthe aqueous particle phase are also estimated using theAerosol Inorganics Model (AIM). Different mechanisms thatcontribute to the presence of acidic particles in Pittsburghare discussed. The largest H+
Aer loadings and lowestlevels of stoichiometric neutralization were detected whenPM1 loadings were high and dominated by SO4
2-. Theaverage size distribution of H+
Aer loading shows anaccumulation mode at Dva ≈ 600 nm and an enhancedsmaller mode that centers at Dva ≈ 200 nm and tails intosmaller sizes. The acidity in the accumulation mode particlessuggests that there is generally not enough gas-phaseNH3 available on a regional scale to completely neutralizesulfate in Pittsburgh. The lack of stoichiometric neutralizationin the 200 nm mode particles is likely caused by the relativelyslow mixing of gas-phase NH3 into SO2-rich plumescontaining younger particles. We examined the influenceof particle acidity on secondary organic aerosol (SOA)formation by comparing the mass concentrations and sizedistributions of oxygenated organic aerosol (OOAssurrogate for SOA in Pittsburgh) during periods whenparticles are, on average, acidic to those when particlesare bulk neutralized. The average mass concentration of OOAduring the acidic periods (3.1 ( 1.7 µg m-3) is higherthan that during the neutralized periods (2.5 ( 1.3 µg m-3).Possible reasons for this enhancement include increasedcondensation of SOA species, acid-catalyzed SOAformation, and/or differences in air mass transport andhistory. However, even if the entire enhancement (∼0.6 µgm-3) can be attributed to acid catalysis, the upper-bound increase of SOA mass in acidic particles is ∼25%,an enhancement that is much more moderate than themultifold increases in SOA mass observed during some lab
studies and inferred in SO2-rich industrial plumes. Inaddition, the mass spectra of OOA from these two periodsare almost identical with no discernible increase inrelative signal intensity at larger m/z’s (>200 amu), suggestingthat the chemical nature of SOA is similar during acidicand neutralized periods and that there is no significantenhancement of SOA oligomer formation during acidic particleperiods in Pittsburgh.
1. IntroductionAcidic aerosols are ubiquitous in the atmosphere withsignificant implications for human health (1) and ecologicalintegrity (2). Atmospheric acidic aerosols tend to be morehygroscopic than their neutralized form, as indicated by thepositive correlations between particle phase acidity andmeasured water content (3) and between deliquescence RHof ambient particles and their NH4
+/SO42- ratio (4). Larger
hygroscopicity enhances particles’ ability to scatter light andto nucleate cloud droplets, and thus their influence onvisibility and climate.
Particle phase acidity has also been linked to secondaryaerosol formation. Acid-catalyzed heterogeneous reactions,for instance, have been proposed as an important mechanismthat might significantly enhance secondary organic aerosol(SOA) production in the atmosphere (5-8). Up to several-fold increases in SOA mass have been observed in chamberstudies when acidic seed particles were used (e.g., refs 5, 6).Similar multifold enhancements in SOA production in theHouston area could be inferred based on the particle volumegrowth rates measured in industrial plumes rich in SO2 andvolatile organic compounds (VOCs) compared to thosecontaining only VOCs or SO2 (9). In addition, Chu (10)observed simultaneous increases of OC and SO4
2- massconcentrations accompanied with a charge deficit of NH4
+
during regional high PM2.5 episodes in the Eastern U.S. andthus suggested a link between acidic particles and sum-mertime SOA formation. However, while analyzing theaerosol mass spectrometer (AMS) data from Pittsburgh, weobserved no statistically significant enhancement in the totalorganic mass concentration in acidic particles compared tothe bulk neutralized particles (11). Similarly, Takahama etal. (12) evaluated the correlations between OC/EC ratio andparticle acidity using semi-continuous data from the Pitts-burgh Air Quality Study (PAQS) and concluded that acid-catalyzed SOA is not large enough to be observed consistentlyabove their analytical uncertainties and particle concentra-tion variations due to transport and mixing.
The chemistry and effects of acidic aerosols are intimatelylinked to a variation of acidity as a function of particle size.We thus investigate size-resolved indicators of ambientaerosol acidity using an AMS in Pittsburgh and exploit thehigh time resolution of these measurements (5-10 min) toresolve different mechanisms that contribute to the presenceof acidic particles. Particle acidity is evaluated based on theion balance between NH4
+ and the inorganic anions (SO42-,
NO3-, and Cl-), an approach that is commonly taken (e.g.,
refs 4, 13, 14-18) and is applicable for this study becausesubmicrometer particles in Pittsburgh generally contain verylow levels of metal ions (e.g., Na+, Ca2+, and K+) (19, 20). Wealso use the chemical speciation data from the AMS as inputsto the Aerosol Inorganic Model (21) to estimate the ionicstrength and pH of the particles.
Compared to previous work on ambient aerosol aciditythat utilized filter measurements (e.g., refs 4, 18), the high
* Corresponding author phone: (518) 437-8752; fax: (518) 437-8758; e-mail: [email protected].
† University at Albany, State University of New York.‡ University of Colorado-Boulder.§ Aerodyne Research Inc.
Environ. Sci. Technol. 2007, 41, 3213-3219
10.1021/es061812j CCC: $37.00 2007 American Chemical Society VOL. 41, NO. 9, 2007 / ENVIRONMENTAL SCIENCE & TECHNOLOGY 9 3213Published on Web 03/31/2007
time resolution of AMS data enables us to avoid the variousproblems associated with the low time resolution of filtersampling (13) and, additionally, to examine the sources andeffects of acidity on particle characteristics such as the sizedistribution, and the potential influence of aerosol acidityon the ambient SOA concentration. We also build on previouswork which has shown that AMS organic aerosol mass spectracan be deconvolved to determine oxygenated and hydro-carbon-like organic aerosol (OOA and HOA) components(22) and that in Pittsburgh (23) (as well as during some periodsin Mexico City (24)), OOA is mostly SOA, and HOA is mostlyprimary OA (POA) associated with fossil fuel combustion.The ability to directly correlate measures of particle aciditywith the mass of OOA (a surrogate for SOA) rather than totalorganic aerosol mass (POA + SOA) or OC/EC ratios, whichhas been done in the few ambient studies that have examinedthis issue in the past (10-12), is a new and unique componentof our analysis.
2. Experimental MethodsA Quadrupole-AMS was deployed at the Pittsburgh EPASupersite from September 7 to 22, 2002. The mass concen-trations and size distributions of nonrefractory (NR) chemicalspecies (e.g., SO4
2-, NO3-, NH4
+, Cl-, and organics) weredetermined in submicrometer particles (approximately PM1)and used for the analysis in this study. Overviews on thesampling site, local meteorology, AMS operation, and generaldata analysis are given in previous publications (11, 20).Details on the organic mass spectral analysis and discussionson HOA and OOA are presented in Zhang et al. (22, 23).Presented here is only information pertinent to this study.A particle collection efficiency (CE) correction was appliedto account for particle bounce in the AMS vaporizer (11).Although some studies have observed higher CE values inthe AMS for acidic sulfate-containing particles (25), this effectis only observed for particles much more acidic than thosein this study, and thus does not affect the quantification ofspecies during the acidic and neutralized periods presentedhere.
3. Indicators of Acidity3.1. H+
Aer. The mass and molar concentrations (in ng m-3
and nmol m-3, respectively) of H+ present in the particle-phase per unit volume of air, H+
Aer, are directly estimatedfrom AMS measurements as the difference between the NH4
+
mass concentrations measured in the particles and thestoichiometric NH4
+ concentrations required to fully neu-tralize the measured concentrations of SO4
2-, NO3-, and Cl-:
where, NH4+, SO4
2-, NO3-, and Cl- denote the mass con-
centrations (in ng m-3) of the species and the denominatorscorrespond to their molecular weights. Other ionic species,such as NaCl, are not included in eq 1 because they do nothave a large contribution to the observed PM2.5 mass, e.g.,the average mole-equivalent concentration of metal ions inPM2.5 is only ∼6-7% of that of NH4
+ in Pittsburgh (calculatedfrom ref 19). More importantly, most chemical forms of thesespecies do not vaporize at the AMS temperature of 600 °C,so their perturbation of the anion/cation balance calculatedhere will be even smaller.
3.2. NH4+
meas/NH4+
neu. The degree of stoichiometricneutralization for the ensemble of measured particles isobtained from the normalized ratio of the measured NH4
+
concentration (in nmol m-3) to the NH4+ concentration
needed for full neutralization of the anions,
In this manuscript, we use the NH4+
meas/NH4+
neu ratio toidentify “neutralized particle periods” (NH4
+meas/NH4
+neu )
1 ( σ) and “more acidic particle periods” (NH4+
meas/NH4+
neu
< 0.75 + 1σ), where σ is the corresponding analytical errorfor NH4
+meas/NH4
+neu calculated for every datapoint in time
based on error propagation of the measurement uncertaintyand noise for NH4
+, SO42-, Cl-, and NO3
-. On average, σ is4% of the corresponding NH4
+meas/NH4
+neu value. Since
concentrations of NO3- and Cl- in acidic particles are usually
very small, NH4+
meas/NH4+
neu ≈ 0.75 indicates roughly equalmole concentrations of (NH4)2SO4 and NH4HSO4. In total,the “more acidic” and “neutralized” periods account for ∼30and 25%, respectively, of the total sampling time of this study.The rest of the data points fall into a mildly acidic regimeand are not analyzed separately.
3.3. pH. The pH, which is related to the concentration ofH+ within the aqueous environment (H+
aq) of the ambientparticles, is the acidity measure that most likely influencesthe chemical behavior of aerosol particles. Since the AMSdoes not directly measure H+
aq, we use the H+Aer calculated
from AMS measurements to estimate the pH and ionicstrength within the aqueous particle phase using the on-line Aerosol Inorganics Model (AIM, Model II) (http://www.hpc1.uea.ac.uk/∼e770/aim.html). Inputs to the modelinclude the molar concentrations of sulfate, nitrate, am-monium and H+
Aer (nmol m-3), ambient temperature, andrelatively humidity (RH). Details on the model are given inClegg et al. (21). Note that this model neglects the influenceof organics on water uptake and on the partitioning of theinorganic species. While organics can lead to modestincreases of water uptake (26), this increase is expected havea minor effect on partitioning/dissociation of inorganicspecies in acidic particles. Based on model outputs, wecalculated the pH and the ionic strength (I) in aerosols:
fH+aq and xH+
aq are the activity coefficient on mole fractionbasis and the mole fractions of aqueous particle phase H+,respectively. fH+
aq × xH+aq represents the aqueous phase
activity of H+. mH+aq, mHSO4
-aq, mSO4
2-aq, mNO3
-aq, and
mNH4+
aq are the molalities (in mol/kg of water) of eachspecies.
Note that these calculations depend on the presence ofan aqueous phase in thermodynamic equilibrium. Metastableaerosols are not evaluated in this study. Thus, if the ambientRH is less than the deliquescence RH of the predominantsolid phase (i.e., ∼30% for NH4HSO4 and ∼80% for (NH4)2-SO4), the pH and ionic strength are not estimated. The outputof the model is not reported for periods with H+
Aer e 0(NH4
+meas/NH4
+neu g 1), since the dissociation reactions of
NH4+ and water are not currently included in the AIM model
and since the pH of near neutralized particles would bestrongly influenced by the presence of weaker acids and bases.However, mH+
aq < 0 can result if a fraction of the excessNH4
+ is due to the neutralization of organic acids by NH4+
(also see Section 4.1.).3.4. Size Resolved H+
Aer and NH4+
meas/NH4+
neu. The size-resolved H+
Aer concentration and NH4+
meas/NH4+
neu ratio areestimated from the AMS size distributions of NH4
+, SO42-,
and NO3- based on eqs 1 and 2. Cl- was not scanned for size
distributions during this study; but this omission is negligiblebecause Cl- typically accounts for <1% of the total equivalent
NH4+
meas/NH4+
neu ) NH4+/18/(2 × SO4
2-/96 +NO3
-/62 + Cl-/35.5) (2)
pH ) - log(fH+aq × xH+
aq) (3)
I ) 1/2 (mH+aq + mHSO4
-aq + mSO4
2-aq × 4 +
mNO3-
aq + mNH4+
aq) (4)
H+Aer ) 2 × SO4
2-/96 + NO3-/62 + Cl-/35.5 -
NH4+/18 (1)
3214 9 ENVIRONMENTAL SCIENCE & TECHNOLOGY / VOL. 41, NO. 9, 2007

concentrations of the anions in Pittsburgh (11). The sizedistributions of NH4
+ and SO42- were derived from the particle
time-of-flight measurements of their main ions from the AMSafter two corrections: (1) The size distributions of NH4
+ werecorrected for the penetration of gas-phase O+ signal (mainlyfrom O2) into the particle region, and were adjusted for fasterflight of the NH2
+ ion in the quadrupole mass spectrometercompared to the ions of sulfate and nitrate (11, 27); (2) Thesize distributions of SO4
2- were corrected for slightly elevatedbaselines at larger sizessa result of relatively slower evapo-ration of sulfate compounds compared to the other species.
4. Results and Discussion4.1. H+
Aer and NH4+
meas/NH4+
neu. Table 1 summarizes thestatistics of the H+
Aer concentration and the NH4+
meas/NH4+
neu
ratio. Submicrometer particles are, on average, acidic inPittsburgh during this study. Episodes of “more acidic”particles (NH4
+meas/NH4
+neu < 0.75 + 1σ, i.e., the molar ratio
of NH4HSO4 to (NH4)2SO4 > 1), occur ∼30% of the time. Themean ((1σ) mole equivalent concentration of H+
Aer is 28 (41 nmol m-3 (median ) 15 nmol m-3; Table 1), comparableto the average H+
Aer concentrations observed at various sites,including New York City (16), Toronto, Buffalo, and severalother U.S. sites (15, 18, and references therein). Higher fineparticle concentrations of H+
Aer (up to 5 times larger) areseen in Hong Kong (4, 18) and India (14), where ambient airis more strongly influenced by local and regional SO2
emissions.The H+
Aer concentrations correlate well to those of SO42-
(r2 ) 0.68; Figure 1). The linear fit slope indicates that thebulk submicrometer particles during this study are eitherpartially or fully neutralized by ammonium and that, onaverage, bisulfate appears to be the most acidic form of sulfatein these particles. This observation is consistent with an earlierstudy in Pittsburgh that aerosols are a mixture of (NH4)2SO4
and NH4HSO4 with very little H2SO4 during acidic episodes(28).
There is very little nitrate in acidic particles duringrelatively high SO4
2- periods (Figure 1). We estimate that theaverage concentration of organic acids in fine particles isapproximately 2-5 nmol m-3, based on the mass ratio of sixmajor organic acids measured by GC-MS to AMS m/z 44(ratio ) 0.85 ( 0.04) observed in PM1 during summer 2003in Tokyo, Japan (the average molecular weight of theseorganic acids is ∼100 g mol-1 (29)). These facts togetherindicate that the aerosol acidity in Pittsburgh is mainly relatedto SO4
2- with very little overall contribution from NO3-, Cl-,
and organic acids.4.2. Temporal variations of particle acidity measures.
Shown in Figure 2b-d are the time series of acidity indicators,H+
Aer concentration, NH4+
meas/NH4+
neu, and pH. Both H+Aer
and NH4+
meas/NH4+
neu are dependent on the mass concen-tration of SO4
2- (Figures 1 and 2e). Episodes with high SO42-
(>100 nmol m-3) are generally less neutralized than thosewith lower SO4
2- (<100 nmol m-3). Figure 2e indicates thatabnormally high NH4
+meas/NH4
+neu values are due to low
signal-to-noise for the detected ions.The trend in pH is consistent with that of NH4
+meas/
NH4+
neu, although the variations in pH are larger (seeSupporting Information Figure S1) because pH (and ionicstrength) is also strongly influenced by changes in ambienthumidity (15-96%; average ( 1σ ) 63% ( 22% during thisstudy). In addition, the measured RH values, which representthe instantaneous value in ambient air, do not reflect the RHhistory of the particles. We thus investigate the directcorrelation between NH4
+meas/NH4
+neu and pH modeled
under constant RH (80%, the deliquescence RH of (NH4)2-SO4)) and T (295 K) conditions. The tight correlation betweenthe pH and NH4
+meas/NH4
+neu (r ) 0.96; Figure S1c) confirms
that it is reasonable to use the NH4+
meas/NH4+
neu ratio as anacidity indicator for the separation of the neutralized andacidic particle periods (Figure 2d).
The diurnal patterns of the pH, the H+Aer concentration,
and the NH4+
meas/NH4+
neu ratio all indicate that particles aremost acidic in the afternoon (see Supporting InformationFigure S2). These trends are consistent with the reductionin particle water content (due to lower RH) in the afternoonand the hypothesis that more intense photochemistry andoxidation of SO2 in the afternoon (over regional scales) leadsto more acidic particles.
4.3. Average and Time-Resolved Size Distributions ofH+
Aer and NH4+
meas/NH4+
neu. The average size distribution ofH+
Aer peaks at the same diameter (Dva (30) ≈ 500 - 600 nm)as those of inorganic and total mass (Figure 3). This isconsistent with the facts that (1) H+
aer correlates with SO42-
mass concentration (Figures 1 and 2d-e) and 2) the relativeSO4
2- mass loading in 500-600 nm particles increase during“acidic” time periods compared to “neutralized” periods (seeFigure 6a and associated discussion below). Since this 500-600 nm accumulation mode is largely made up of agedregional aerosol particles rich in sulfate and oxidized organics(11, 27), the peak H+
Aer concentration in this mode indicatesthat there is generally not enough gas-phase NH3 tocompletely neutralize sulfate on a regional scale in thePittsburgh region. This conclusion is also consistent withthe observation that aerosols from high SO4
2- loading periodstend to be more acidic (Figure 2d-e).
TABLE 1. Statistics of H+Aer Concentrations (eq 1) and
Measured-to-Neutralized NH4+ Ratio (eq 2) during the Entire
Study Period (N ) 3599), Acidic Particle Periods (N )1033), and Neutralized Particle Periods (N ) 669)
NH4+
meas/NH4+
neu H+Aer (nmol m-3)
entirestudy acidic neutralized
entirestudy acidic neutralized
mean 0.89 0.69 0.99 28 79 0.81s 0.21 0.10 0.06 41 46 7.2median 0.88 0.71 0.99 15 77 0.790th 1.13 0.81 1.1 88 140 9.275th 0.99 0.76 1.0 44 109 4.625th 0.76 0.64 0.96 0.8 43 -2.810th 0.65 0.57 0.92 -8.2 18 -7.1
FIGURE 1. Scatter plot that compares the concentrations of H+Aer
to SO42- in submicrometer particles, colored by the equivalent ratio
of NO3- to total anions, during September 7-22, 2002 in Pittsburgh.
The error bars were calculated based on error propagation of themeasurement uncertainties and noise for NH4
+, SO42-, Cl-, and
NO3-. To reduce clutter, only every fifth of the data points in time
are shown.
VOL. 41, NO. 9, 2007 / ENVIRONMENTAL SCIENCE & TECHNOLOGY 9 3215

In addition to the 500-600 nm mode, the H+Aer distribution
also shows a mode at Dva ∼ 200 nm, which likely results fromcondensed freshly formed H2SO4 because (1) This modeevolves more noticeably in the afternoon (Figure 4); (2) Thesmall mode particles are more acidic than the larger particlesaccording to NH4
+meas/NH4
+neu (Figures 3b); and (3) Very
acidic ultrafine particles were detected during the frequentnew particle formation and growth events in Pittsburgh (27).A comparison of the average diurnal evolution of the H+
Aer
size distribution during days with new particle formationand growth events to that during days without (see SupportingInformation Figure S3) provide additional support to thesepoints.
There is strong evidence that the formation and growthof new particles in Pittsburgh are tightly linked to SO2
photooxidation and thus H2SO4 production (27, 31). Indeed,the best correlation of SO2 is found with the small modesulfate particles (see Supporting Information Figure S4), ascondensation of fresh H2SO4 to smaller particles is faster dueto the reduced diffusion limitation compared to largerparticles. Thus, the lack of stoichiometric neutralization inthe 200 nm mode is likely caused by the slow mixing of gas-phase NH3 into SO2 rich plumes.
4.4. Influence of Particle Acidity on Organic Aerosols.We recently developed a multivariate data analysis technique
(22) that yields the concentrations, size distributions, andmass spectra of oxygenated (OOA) and hydrocarbon-like(HOA) organic aerosols (23). OOA appears to be a goodsurrogate for SOA during this study and HOA is dominatedby POA from combustion emissions (23). On average, thePittsburgh organic aerosol consists of 65% OOA and 35%HOA. Given their very different time trends, mass spectra,and size distributions, the separation of the HOA and OOAsignals represents a crucial step in any detailed analysis ofthe relationship between particle acidity and SOA formationin Pittsburgh.
The mass loadings of OOA and sulfate are tightly correlated(r2 ) 0.74; Figure 5) and their size distributions are very similar,suggesting that SOA and SO4
2- are internally mixed and areboth formed over regional scales (12, 23), with a possiblecontribution of cloud processing to both. The average OOAto SO4
2- ratio is 0.49 and 0.33 µg m-3/µg m-3, respectively,in bulk neutralized and more acidic particles (see SupportingInformation Figure S5). This difference suggests that SO4
2-
is added faster than OOA to acidic aerosols, possibly due tofaster gas-phase or cloud production, and/or higher con-centration of SO2 than of OOA gas-phase precursors on thoseairmasses. Recent laboratory studies on sulfate aerosols ofmuch higher acidity than observed in this study report theformation of organosulfate species (32). Although we cannot
FIGURE 2. Time series of (a) ionic strength, (b) pH, (c) NH4+
meas/NH4+
neu ratio, (d) H+Aer concentration, and (e) SO4
2- concentration insubmicrometer particles in Pittsburgh. The NH4
+meas/NH4
+neu curve is colored by periods of more acidic aerosol (red), bulk neutralized
(green), and the rest that fall into a mildly acidic regime (gray) classified based on criteria described in section 3. Both the pH and theSO4
2- curves are colored by NH4+
meas/NH4+
neu ratios. Ionic strength and pH are calculated from the AIM model under ambient T and RHconditions. Reasons for missing data points in pH and ionic strength compared to the other three are explained in Section 3.3. Note thatthe unit of the ionic strength is mole of ions per kilogram of particle phase water.
3216 9 ENVIRONMENTAL SCIENCE & TECHNOLOGY / VOL. 41, NO. 9, 2007

rule out the presence of these species in the acidic particleswe do not observe any clear evidence of their presence.
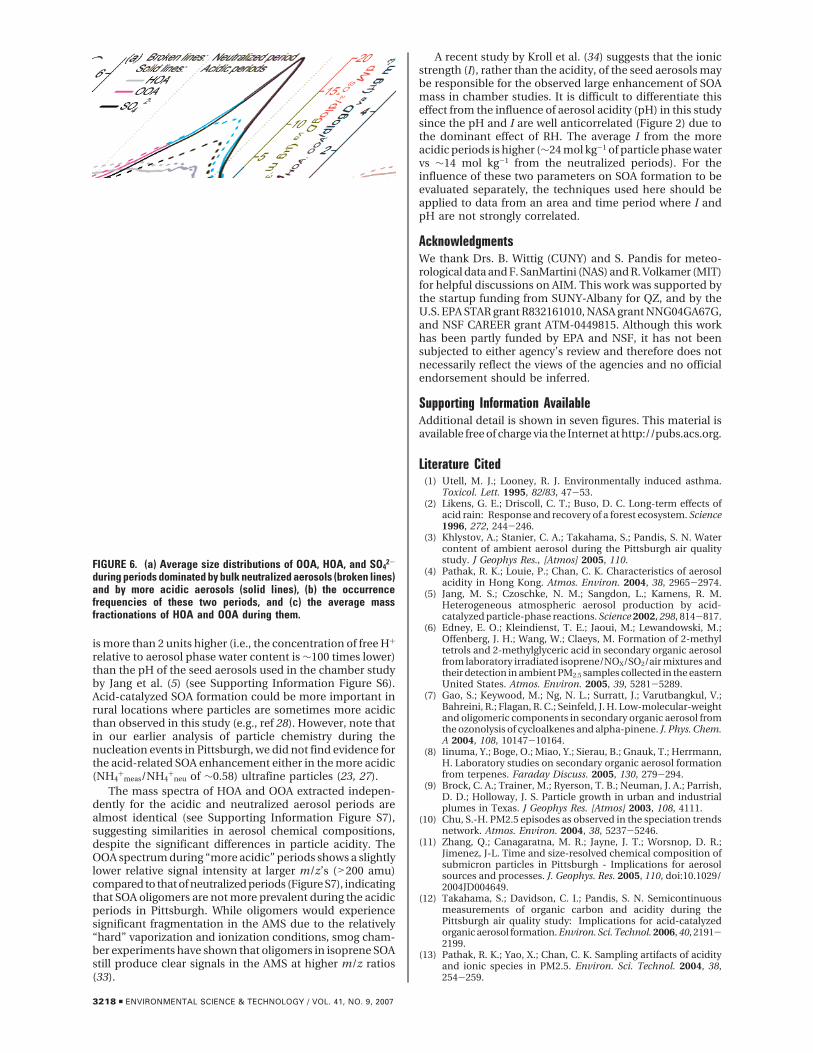
In comparison, the size distributions of both SO42- and
OOA in the 600 nm mode are enhanced during acidic timeperiods, while SO4
2- is also enhanced at the 200 nm mode(Figure 6a). The average concentrations of SO4
2- and OOAduring acidic periods are 100 and 25% higher, respectively,compared to neutralized periods. Since the acidic timeperiods are more prevalent in the afternoon (Figure 6b), itis possible that the higher average OOA concentration duringacidic periods is due to increased SOA photochemicalproduction (with or without the effects of acid-catalysis).Cloud processing may also affect the observed OOA con-centration in the 600 nm mode. Thus, the strongest evidencefor the lack of strong acidity dependent SOA formation isprovided by the 200 nm mode, where cloud processing shouldbe less important.
If we attribute the entire difference in OOA betweenneutralized and “more acidic” periods to acid-catalyzed SOAformation, the upper bound increase of SOA mass (normal-ized by the diurnal variation of OOA concentrations) thatcould be due to this mechanism is estimated at 25%. Whilethis analysis is limited by the uncertainty of comparingdifferent time periods during a relatively short study, animportant result is the lack of very large acidity-relatedenhancements of SOA (e.g., several fold) that was observedin some chamber studies (5, 6) and inferred in industrialplumes (9). Note that other recent laboratory studies reportmuch more moderate increases (10-40%) of SOA on acidicseed particles (7, 8, 17). One possible reason for the observeddifferences in acidity dependent SOA yield is that NH4
+meas/
NH4+
neu ratio of the seed particles used in the studies by Janget al. (5) was lower (∼0.41) than measured for the averageacidic particle in Pittsburgh (0.69; Table 1). According to AIM,the average pH in the acidic particles analyzed in this study
FIGURE 3. Average size distributions (dX/dlogDva) of (a) H+Aer, total
mass, and total inorganic concentrations and (b) NH4+
meas/NH4+
neu
ratio in submicrometer particles during September 7-22, 2002 inPittsburgh. A 3-point binning was applied to the size distributionof NH4
+meas/NH4
+neu to reduce high-frequency noise. The vertical
error bars in Figure 3b were calculated based on error propagationof the measurement uncertainties and noise for NH4
+, SO42-, and
NO3- size distributions. The horizontal error bars are uncertainties
in AMS size measurement estimated from the finite chopper openingand particle vaporization times (∼50 µs).
FIGURE 4. Average daily evolution of the size distribution of H+Aer concentration during September 7-22, 2002
FIGURE 5. Scatter plot of mass concentrations of oxygenated organic aerosol vs sulfate during September 7-22, 2002. The traces arecolored by NH4
+meas/NH4
+neu to show how this correlation varies as a function of ammonium deficit.
VOL. 41, NO. 9, 2007 / ENVIRONMENTAL SCIENCE & TECHNOLOGY 9 3217
is more than 2 units higher (i.e., the concentration of free H+
relative to aerosol phase water content is ∼100 times lower)than the pH of the seed aerosols used in the chamber studyby Jang et al. (5) (see Supporting Information Figure S6).Acid-catalyzed SOA formation could be more important inrural locations where particles are sometimes more acidicthan observed in this study (e.g., ref 28). However, note thatin our earlier analysis of particle chemistry during thenucleation events in Pittsburgh, we did not find evidence forthe acid-related SOA enhancement either in the more acidic(NH4
+meas/NH4
+neu of ∼0.58) ultrafine particles (23, 27).
The mass spectra of HOA and OOA extracted indepen-dently for the acidic and neutralized aerosol periods arealmost identical (see Supporting Information Figure S7),suggesting similarities in aerosol chemical compositions,despite the significant differences in particle acidity. TheOOA spectrum during “more acidic” periods shows a slightlylower relative signal intensity at larger m/z’s (>200 amu)compared to that of neutralized periods (Figure S7), indicatingthat SOA oligomers are not more prevalent during the acidicperiods in Pittsburgh. While oligomers would experiencesignificant fragmentation in the AMS due to the relatively“hard” vaporization and ionization conditions, smog cham-ber experiments have shown that oligomers in isoprene SOAstill produce clear signals in the AMS at higher m/z ratios(33).
A recent study by Kroll et al. (34) suggests that the ionicstrength (I), rather than the acidity, of the seed aerosols maybe responsible for the observed large enhancement of SOAmass in chamber studies. It is difficult to differentiate thiseffect from the influence of aerosol acidity (pH) in this studysince the pH and I are well anticorrelated (Figure 2) due tothe dominant effect of RH. The average I from the moreacidic periods is higher (∼24 mol kg-1 of particle phase watervs ∼14 mol kg-1 from the neutralized periods). For theinfluence of these two parameters on SOA formation to beevaluated separately, the techniques used here should beapplied to data from an area and time period where I andpH are not strongly correlated.
AcknowledgmentsWe thank Drs. B. Wittig (CUNY) and S. Pandis for meteo-rological data and F. SanMartini (NAS) and R. Volkamer (MIT)for helpful discussions on AIM. This work was supported bythe startup funding from SUNY-Albany for QZ, and by theU.S. EPA STAR grant R832161010, NASA grant NNG04GA67G,and NSF CAREER grant ATM-0449815. Although this workhas been partly funded by EPA and NSF, it has not beensubjected to either agency’s review and therefore does notnecessarily reflect the views of the agencies and no officialendorsement should be inferred.
Supporting Information AvailableAdditional detail is shown in seven figures. This material isavailable free of charge via the Internet at http://pubs.acs.org.
Literature Cited(1) Utell, M. J.; Looney, R. J. Environmentally induced asthma.
Toxicol. Lett. 1995, 82/83, 47-53.(2) Likens, G. E.; Driscoll, C. T.; Buso, D. C. Long-term effects of
acid rain: Response and recovery of a forest ecosystem. Science1996, 272, 244-246.
(3) Khlystov, A.; Stanier, C. A.; Takahama, S.; Pandis, S. N. Watercontent of ambient aerosol during the Pittsburgh air qualitystudy. J Geophys Res., [Atmos] 2005, 110.
(4) Pathak, R. K.; Louie, P.; Chan, C. K. Characteristics of aerosolacidity in Hong Kong. Atmos. Environ. 2004, 38, 2965-2974.
(5) Jang, M. S.; Czoschke, N. M.; Sangdon, L.; Kamens, R. M.Heterogeneous atmospheric aerosol production by acid-catalyzed particle-phase reactions. Science 2002, 298, 814-817.
(6) Edney, E. O.; Kleindienst, T. E.; Jaoui, M.; Lewandowski, M.;Offenberg, J. H.; Wang, W.; Claeys, M. Formation of 2-methyltetrols and 2-methylglyceric acid in secondary organic aerosolfrom laboratory irradiated isoprene/NOX/SO2/air mixtures andtheir detection in ambient PM2.5 samples collected in the easternUnited States. Atmos. Environ. 2005, 39, 5281-5289.
(7) Gao, S.; Keywood, M.; Ng, N. L.; Surratt, J.; Varutbangkul, V.;Bahreini, R.; Flagan, R. C.; Seinfeld, J. H. Low-molecular-weightand oligomeric components in secondary organic aerosol fromthe ozonolysis of cycloalkenes and alpha-pinene. J. Phys. Chem.A 2004, 108, 10147-10164.
(8) Iinuma, Y.; Boge, O.; Miao, Y.; Sierau, B.; Gnauk, T.; Herrmann,H. Laboratory studies on secondary organic aerosol formationfrom terpenes. Faraday Discuss. 2005, 130, 279-294.
(9) Brock, C. A.; Trainer, M.; Ryerson, T. B.; Neuman, J. A.; Parrish,D. D.; Holloway, J. S. Particle growth in urban and industrialplumes in Texas. J Geophys Res. [Atmos] 2003, 108, 4111.
(10) Chu, S.-H. PM2.5 episodes as observed in the speciation trendsnetwork. Atmos. Environ. 2004, 38, 5237-5246.
(11) Zhang, Q.; Canagaratna, M. R.; Jayne, J. T.; Worsnop, D. R.;Jimenez, J-L. Time and size-resolved chemical composition ofsubmicron particles in Pittsburgh - Implications for aerosolsources and processes. J. Geophys. Res. 2005, 110, doi:10.1029/2004JD004649.
(12) Takahama, S.; Davidson, C. I.; Pandis, S. N. Semicontinuousmeasurements of organic carbon and acidity during thePittsburgh air quality study: Implications for acid-catalyzedorganic aerosol formation. Environ. Sci. Technol. 2006, 40, 2191-2199.
(13) Pathak, R. K.; Yao, X.; Chan, C. K. Sampling artifacts of acidityand ionic species in PM2.5. Environ. Sci. Technol. 2004, 38,254-259.
FIGURE 6. (a) Average size distributions of OOA, HOA, and SO42-
during periods dominated by bulk neutralized aerosols (broken lines)and by more acidic aerosols (solid lines), (b) the occurrencefrequencies of these two periods, and (c) the average massfractionations of HOA and OOA during them.
3218 9 ENVIRONMENTAL SCIENCE & TECHNOLOGY / VOL. 41, NO. 9, 2007

(14) Mouli, P. C.; Mohan S. V.; Reddy, S. J. A study on major inorganicion composition of atmospheric aerosols at Tirupati. J. Hazard.Mater. 2003, 96, 217-228.
(15) Thurston, G. D.; Gorczynski, J. E. Jr.; Currie, J. H.; He. D.; Ito,K.; Hipfner, J.; Waldman, J.; Lioy, P. J.; Lippmann, M. The natureand origins of acid summer haze air pollution in metropolitanToronto, Ontario. Environ. Res. 1994, 65, 254-270.
(16) Hogrefe, O.; Schwab, J. J.; Drewnick, F.; Lala, G. G.; Peters, S.;Demerjian, K. L.; Rhoads, K.; Felton, H. D.; Rattigan, O. V.;Husain, L.; Dutkiewicz, V. A. Semicontinuous PM2.5 sulfate andnitrate measurements at an urban and a rural location in NewYork: PMTACS-NY summer 2001 and 2002 campaigns. J. AirWaste Manage. Assoc. 2004, 54, 1040-1060.
(17) Czoschke, N. M.; Jang, M. Acidity effects on the formation ofa-pinene ozone SOA in the presence of inorganic seed. Atmos.Environ. 2006, 40, 4370-4380.
(18) Pathak, R. K.; Lau, A. K. H.; Chan, C. K. Acidity and concentrationsof ionic species of PM2.5 in Hong Kong. Atmos. Environ. 2003,37, 1113-1124.
(19) Cabada, J. C.; Rees, S.; Takahama, S.; Khlystov, A.; Pandis, S. N.;Davidson, C. I.; Robinson, A. L. Mass size distributions andsize resolved chemical composition of fine particulate matterat the Pittsburgh Supersite. Atmos. Environ. 2004, 38, 3127-3141.
(20) Wittig, A. E.; Anderson, N.; Khlystov, A. Y.; Pandis, S. N.; Davidson,C.; Robinson, A. L. Pittsburgh Air Quality Study overviewand initial scientific findings. Atmos. Environ. 2004, 38, 3107-3125.
(21) Clegg, S. L.; Brimblecone, P.; Wexler, A. S. A thermodynamicmodel of the system H+-NH4
+-SO42--NO3
--H2O at tropospherictemperatures. J. Phys. Chem. A 1998, 102, 2137-2154.
(22) Zhang, Q.; Alfarra, M. R.; Worsnop, D. R.; Allan, J. D.; Coe, H.;Canagaratna, M. R.; Jimenez, J. L. Deconvolution and quan-tification of hydrocarbon-like and oxygenated organic aerosolsbased on aerosol mass spectrometry. Environ. Sci. Technol. 2005,39, 4938-4952, doi:4910.1021/es048568l.
(23) Zhang, Q.; Worsnop, D. R.; Canagaratna, M. R.; Jimenez, J. L.Hydrocarbon-like and oxygenated organic aerosols in Pitts-burgh: Insights into sources and processes of organic aerosols.Atmos. Chem. Phys. 2005, 5, 3289-3311.
(24) Volkamer, R.; Jimenez, J. L.; Martini, F. S.; Dzepina, K.; Zhang,Q.; Salcedo, D.; Molina, L. T.; Molina, M. J.; Worsnop, D. R.Secondary organic aerosol formation from anthropogenicVOCs: Rapid and higher than expected. Geophys. Res. Lett. 2006,33, doi:10.1029/2006GL026899.
(25) Kleinman, L. I.; Daum, P. H.; Lee, Y.-N.; Senum, G. I.; Springston,S. R.; Wang, J.; Berkowitz, C.; Hubbe, J.; Zaveri, R. A.; Brechtel,
F. J.; Jayne, J.; Onasch, T. B.; Worsnop, D. Aircraft observationsof aerosol composition in New England and mid-Atlantic statesduring the summer 2002 NEAQS field campaign. J. Geophys.Res. 2006, submitted.
(26) Ansari, A. S.; Pandis, S. N. Water absorption by secondary organicaerosol and its effect an inorganic aerosol behavior. Environ.Sci. Technol. 2000, 34, 71-77.
(27) Zhang, Q.; Stanier, C. O.; Canagaratna, M. R.; Jayne, J. T.;Worsnop, D. R.; Pandis, S. N.; Jimenez, J. L. Insights into thechemistry of new particle formation and growth events inPittsburgh based on Aerosol Mass Spectrometry. Environ. Sci.Technol. 2004, 38, 4797-4809.
(28) Liu, L.-J. S.; Burton, R.; Wilson, W. E.; Koutrakis, P. Comparisonof aerosol acidity in urban and semi-rural environments. Atmos.Environ. 1996, 30, 1237-1245.
(29) Takegawa, N.; Miyakawa, T.; Kawamura, K.; Kondo, Y. Contri-bution of selected dicarboxylic and ω-oxocarboxylic acids inambient aerosol to m/z 44 signal of an Aerodyne Aerosol MassSpectrometer. Aerosol Sci. Tech. 2007, in press.
(30) DeCarlo, P. F.; Slowik, J. G.; Worsnop, D. R.; Davidovits, P.;Jimenez, J. L. Particle morphology and density characterizationby combined mobility and aerodynamic diameter measure-ments. Part 1: Theory. Aerosol Sci. Technol. 2004, 38, 1185-1205.
(31) Stanier, C.; Khlystov, A.; Pandis, S. N. Nucleation events duringthe Pittsburgh Air Quality Study: Description and relation tokey meteorological, gas phase, and aerosol parameters. AerosolSci. Technol. 2004, 253-264.
(32) Liggio, J.; Li, S.-M. Organosulfate formation during the uptakeof pinonaldehyde on acidic sulfate aerosols. Geophys. Res. Lett.2006, 33, No. 13, doi:10.1029/2006GL026079.
(33) Kroll, J. H.; Ng, N. L.; Murphy, S. M.; Flagan, R. C.; Seinfeld, J.H. Secondary Organic Aerosol Formation from Isoprene Pho-tooxidation. Environ. Sci. Technol. 2006, 40, 1869-1877.
(34) Kroll, J. H.; Ng, N. L.; Murpht, S. M.; Varutbangkul, V.; Flagan,R. C.; Seinfeld, J. H. Chamber studies of secondary organicaerosol growth by reactive uptake of simple carbonyl com-pounds. J Geophys Res. [Atmos] 2005, 110.
Received for review July 31, 2006. Revised manuscript re-ceived November 18, 2006. Accepted January 4, 2007.
ES061812J
VOL. 41, NO. 9, 2007 / ENVIRONMENTAL SCIENCE & TECHNOLOGY 9 3219