Embed Size (px)
Citation preview
NO.5 WANG Donghai, DUAN Yihong, LIU Ying, et al. 601
A Case Study of the November 2012 Mixed Rain-Snow Stormover North China
WANG Donghai∗ (���), DUAN Yihong (���), LIU Ying (� �), LIANG Zhaoming (���),
LIU Chongjian (���), ZHAO Yanfeng (���), ZHANG Yuwei (���), YIN Jinfang (���),
and WANG Hong (� �)
State Key Laboratory of Severe Weather, Chinese Academy of Meteorological Sciences, Beijing 100081
(Received July 5, 2013)
ABSTRACT
A mixed rain-snow storm associated with a strong burst of cold air and development of an extratropicalcyclone occurred over North China from 3 to 5 November 2012. This early snowfall event was characterizedby a dramatic drop in temperature, strong winds, high precipitation intensity, broad spatial extent, andcoexistence of multi-phase precipitating hydrometeors. This study investigates the multi-scale interactionsbetween the large-scale circulation background and the synoptic-scale weather systems associated with thestorm. The results are as follows. (1) The Arctic Oscillation (AO) had been in its negative phase longbefore the event, leading to southward advection of cold air into North China in advance of the storm. (2)The large-scale atmospheric circulation experienced a decreased number of long waves upstream of NorthChina prior to the storm, resulting in reduced wave velocity and an almost stagnant low pressure system(extratropical cyclone) over North China. (3) An Ω-shaped blocking high over East Asia and the westernPacific obstructed the eastward movement of an upstream trough, allowing the corresponding surface cycloneto stabilize and persist over Beijing and its neighboring areas. This blocking high was a major factor inmaking this event a historically most severe precipitation event in autumn in Beijing for the past 60 years.(4) Baroclinic instability at lower levels gave rise to rapid development of the cyclone under the classical“second type” development mechanism for extratropical cyclones. (5) Moisture originated from the YellowSea entered the slowly-moving cyclone in a steady stream, creating fairly favorable water vapor supply for theheavy rainfall-snowfall, especially during the later stage of the cyclone development. (6) Moisture transportand frontal lifting triggered low-level instability and updrafts. Intensification of the front enhanced thevertical wind shear, causing conditional symmetric instability (CSI) to expand upward within the unstablelower troposphere, and to eventually gear into the CSI region of the upper troposphere, which facilitatedthe upward development of low-level updrafts.
Key words: rainfall and snowfall, extratropical cyclone, cause analysis, autumn
Citation: Wang Donghai, Duan Yihong, Liu Ying, et al., 2013: A case study of the November 2012 mixedrain-snow storm over North China. Acta Meteor. Sinica, 27(5), 601–625, doi: 10.1007/s13351-013-0512-1.
1. Introduction
A strong burst of cold air and the developmentof an extratropical cyclone led to the first mixed rain-snow storm in autumn over North China during 3–5November 2012. This event represented an abnormallyearly occurrence of snowfall, and was characterized
by broad spatial extent, severe rainfall intensity, co-existence of multi-phase precipitating hydrometeors,dramatic drop in temperature, and gale-force winds.From 0000 UTC 3 to 0000 UTC 5 November, a totalof 74 meteorological stations set new November dailyrainfall records, among which 20 stations in Beijingcity had daily precipitation of more than 59.2 mm.
Supported by the China Meteorological Administration Special Public Welfare Research Fund (GYHY200806007,GYHY201006006, and GYHY201006014), National Natural Science Foundation of China (40875022, 40633016, 41075048, and41175047), National (Key) Basic Research and Development (973) Program of China (2012CB417204), and Basic Research Projectof the State Key Laboratory of Severe Weather, Chinese Academy of Meteorological Sciences.
∗Corresponding author: [email protected].
Chinese version published in Vol. 71, No. 4, 606-627, 2013
©The Chinese Meteorological Society and Springer-Verlag Berlin Heidelberg 2013
602 ACTA METEOROLOGICA SINICA VOL.27
Statistics shows that this event is the fourth earli-est occurrence of snowfall since 1961. A large por-tion of North China experienced snow and/or rainfalland some areas even experienced thunderstorms. Thephase of the hydrometeors underwent multiple transi-tions from rain to sleet to snow during the event, andvice versa.
Rain and snow can enhance available water re-source, improve air quality, and benefit the cultiva-tion of winter crops; however, the severity and unsea-sonal nature of this event also adversely impacted bothtransportation and electricity supplies. It is thereforeadvisable to use this event to better understand andpredict similar weather events.
Previous studies have examined mixed rainfall-snowfall events in a range of contexts, including in-teractions among multi-scale systems (Bosart andSanders, 1986; Wu et al., 2012), occurrence of frontalcyclones (Tao et al., 2008; Hou et al., 2011), inte-grated thermal and dynamical impacts (Emanuel andKerry, 1979; Wang et al., 2009), frontogenesis and at-mospheric instability (Sanders, 1986; Moore and Blak-ley, 1988; Li et al., 2011), blocking highs (Du et al.,2012), and the effects of terrain (Sun et al., 2009).These studies have advanced scientific understandingof these events, particularly with respect to the effectsof extratropical cyclones.
Winter snowstorms in Europe and America, suchas the Presidents’ Day snowstorm of 18–19 February1979 in the mid-Atlantic United States (Bosart andLin, 1984; Uccellini et al., 1985), are often closelyassociated with extratropical cyclones. The relation-ships between snowstorms and extratropical cycloneshave been studied extensively. For example, Martin(1998a, b) investigated the frontal structure and occlu-sion process of a cyclone of moderate intensity that af-fected the central United States in January 1995. Thestudies revealed that the warm-occluded structure ofthe snowstorm developed first in the mid troposphereand later near the surface, in contrast to the classi-cal occlusion development process. Grim et al. (2007)also found that the structures of the upper-level warmtroughs in two continental wintertime cyclones withdifferent modes of genesis and upper-level conditionsdiffered from those predicted by the classical occlu-
sion model. The occurrence of extremely strong snow-storms in China has also been related to the forma-tion and development of extratropical cyclones. Forexample, the record-breaking snowfall that occurredover the eastern and southern parts of China during3–5 March 2007 was associated with the northwardadvance of a Jiang-Huai cyclone. Cai et al. (2009)and Liu et al. (2009) analyzed the development ofthis Jiang-Huai cyclone and the associated synopticbackground for this snowstorm. Their results indi-cated that strong atmospheric baroclinicity and theadvection of warm and cold air were responsible forthe explosive development of the cyclone.
Previous studies have also examined howmesoscale vortices, shear lines, cold air intrusions, va-por transport, the coupling between lower and upper-level jets, and other factors affect the development ofsnowstorms in North China (e.g., Zhao et al., 2007; Maet al., 2008; Zhou and Tan, 2008; Wu et al., 2011; Ye etal., 2011; Zhang et al., 2011; Zhang et al., 2012; Xia etal., 2013). These studies have typically focused on thedevelopment of systems at small spatial and temporalscales. Relatively little attention has been paid to theeffects of large-scale and planetary-scale circulationsystems. Wang et al. (2009) proposed that a very ac-tive Arctic Oscillation (AO) contributed to the strongsnowfall between 11 January and 2 February 2008 bytriggering semi-permanent planetary-scale waves, oneof the major factors that can lead to anomalous atmo-spheric circulations.
In the present study, surface observations, sound-ings, and the NCEP analysis data with a horizontalresolution of 1◦×1◦ are used to conduct a detailedanalysis of this mixed rain-snow storm, so as to clarifythe characteristics and mechanisms underlying its oc-currence and development. The synoptic and dynami-cal causes, the large-scale circulation background, andthe anomalous atmospheric circulation are examinedto improve the understanding of the nature of suchsnowstorms and provide a reference for prediction offuture severe weather events.
2. Overview of the rain-snow storm
A mixed rain-snow storm occurred in North
NO.5 WANG Donghai, DUAN Yihong, LIU Ying, et al. 603
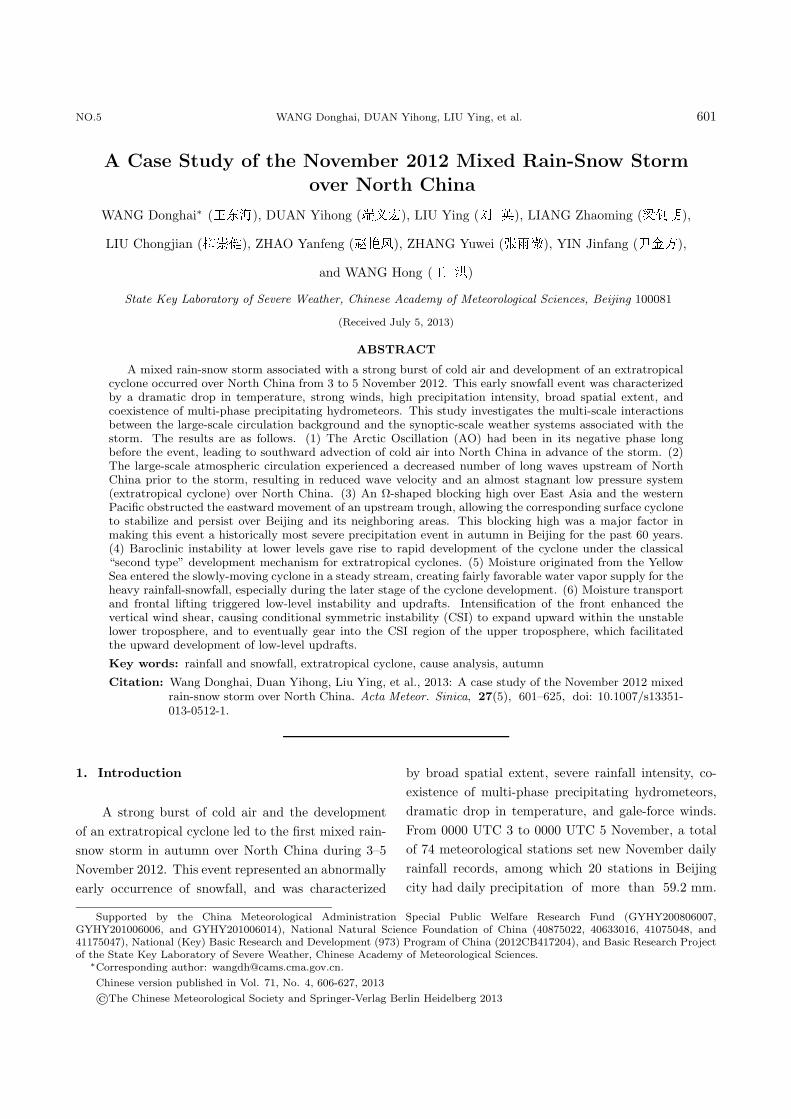
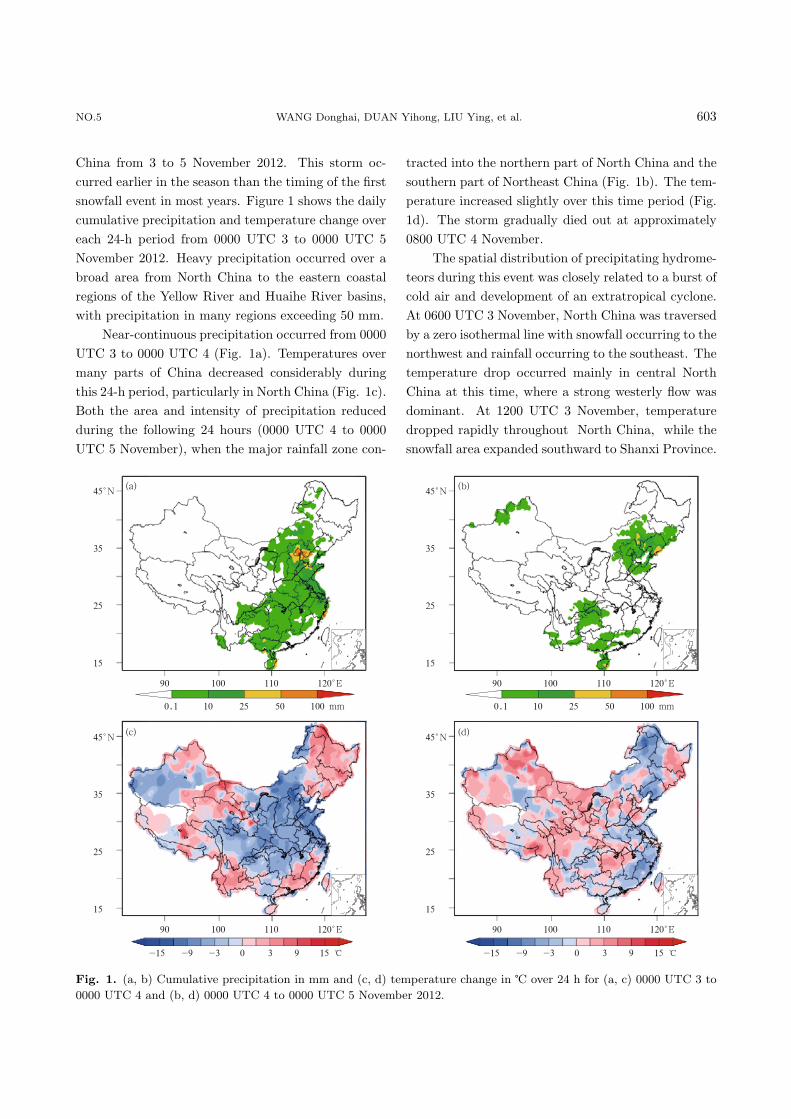
China from 3 to 5 November 2012. This storm oc-curred earlier in the season than the timing of the firstsnowfall event in most years. Figure 1 shows the dailycumulative precipitation and temperature change overeach 24-h period from 0000 UTC 3 to 0000 UTC 5November 2012. Heavy precipitation occurred over abroad area from North China to the eastern coastalregions of the Yellow River and Huaihe River basins,with precipitation in many regions exceeding 50 mm.
Near-continuous precipitation occurred from 0000UTC 3 to 0000 UTC 4 (Fig. 1a). Temperatures overmany parts of China decreased considerably duringthis 24-h period, particularly in North China (Fig. 1c).Both the area and intensity of precipitation reducedduring the following 24 hours (0000 UTC 4 to 0000UTC 5 November), when the major rainfall zone con-
tracted into the northern part of North China and thesouthern part of Northeast China (Fig. 1b). The tem-perature increased slightly over this time period (Fig.1d). The storm gradually died out at approximately0800 UTC 4 November.
The spatial distribution of precipitating hydrome-teors during this event was closely related to a burst ofcold air and development of an extratropical cyclone.At 0600 UTC 3 November, North China was traversedby a zero isothermal line with snowfall occurring to thenorthwest and rainfall occurring to the southeast. Thetemperature drop occurred mainly in central NorthChina at this time, where a strong westerly flow wasdominant. At 1200 UTC 3 November, temperaturedropped rapidly throughout North China, while thesnowfall area expanded southward to Shanxi Province.
Fig. 1. (a, b) Cumulative precipitation in mm and (c, d) temperature change in ℃ over 24 h for (a, c) 0000 UTC 3 to
0000 UTC 4 and (b, d) 0000 UTC 4 to 0000 UTC 5 November 2012.
604 ACTA METEOROLOGICA SINICA VOL.27
Precipitation intensified in Hebei Province and theBeijing–Tianjin–Tangshan region, where the horizon-tal temperature gradient was particularly deep due toa strong frontal system. A surface cyclone developedand intensified, with strong easterly winds contribut-ing water vapor from the Pacific Ocean and westerlygales bringing cold air into the cyclone. The center ofthe cyclone had moved slightly eastward by 0000 UTC4 November, but northwesterly winds were still strongto the west of the cyclone. The dramatic temperaturedrop led to mixed rainfall-snowfall in locations nearthe zero isotherms, including the western part of Bei-jing. The total amount of precipitation at Beijing sta-tion during this storm was 69.4 mm, greatly exceedingthe cumulative November precipitation during each ofthe previous 61 years (since 1951), and was approxi-mately 8 times of the annual mean value for the month(8.2 mm).
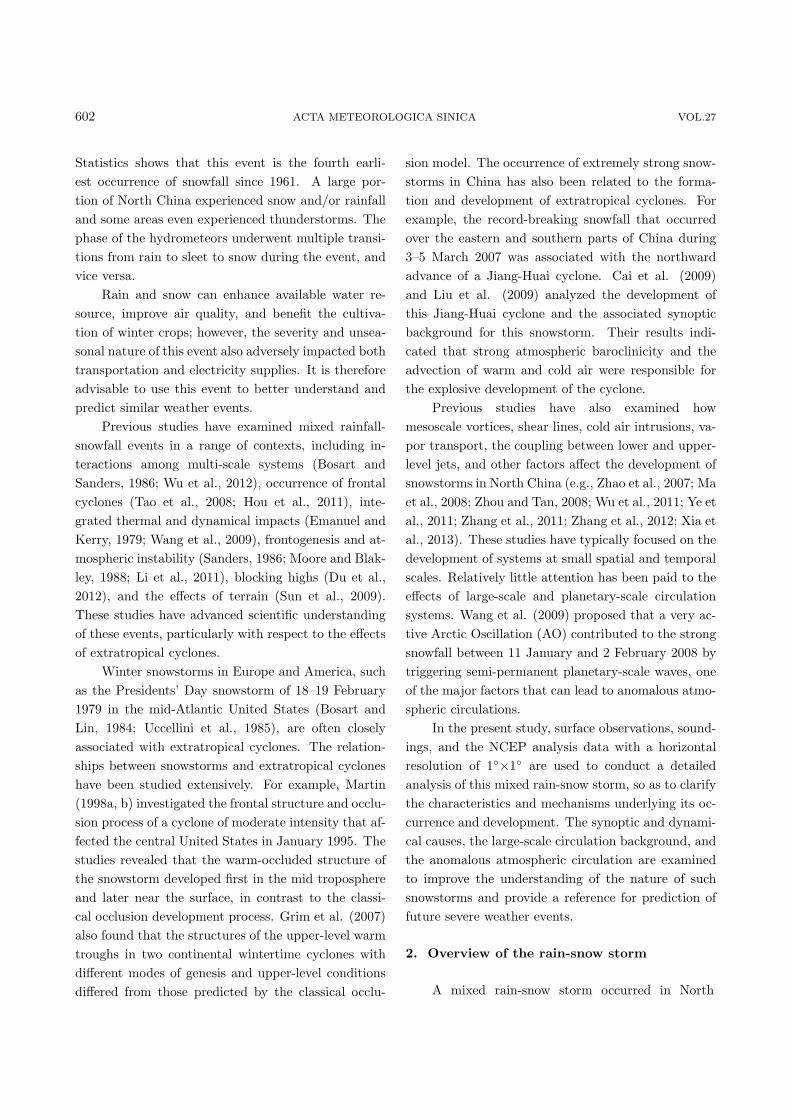
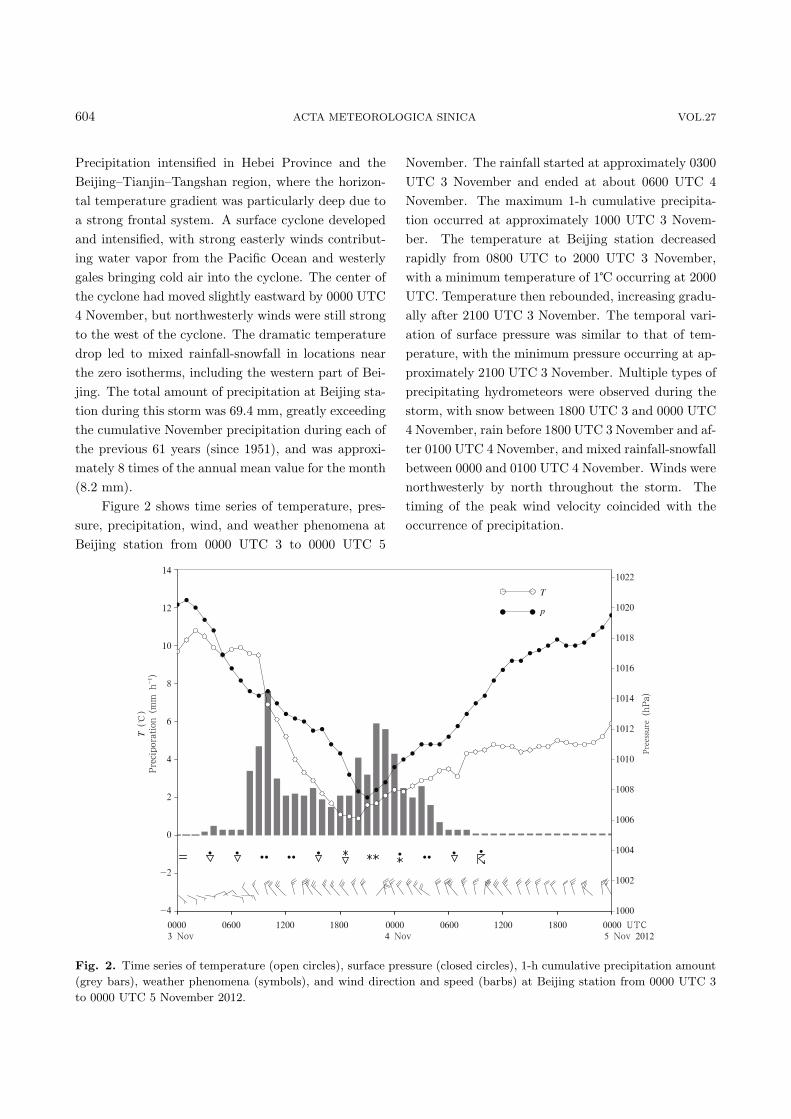
Figure 2 shows time series of temperature, pres-sure, precipitation, wind, and weather phenomena atBeijing station from 0000 UTC 3 to 0000 UTC 5
November. The rainfall started at approximately 0300UTC 3 November and ended at about 0600 UTC 4November. The maximum 1-h cumulative precipita-tion occurred at approximately 1000 UTC 3 Novem-ber. The temperature at Beijing station decreasedrapidly from 0800 UTC to 2000 UTC 3 November,with a minimum temperature of 1℃ occurring at 2000UTC. Temperature then rebounded, increasing gradu-ally after 2100 UTC 3 November. The temporal vari-ation of surface pressure was similar to that of tem-perature, with the minimum pressure occurring at ap-proximately 2100 UTC 3 November. Multiple types ofprecipitating hydrometeors were observed during thestorm, with snow between 1800 UTC 3 and 0000 UTC4 November, rain before 1800 UTC 3 November and af-ter 0100 UTC 4 November, and mixed rainfall-snowfallbetween 0000 and 0100 UTC 4 November. Winds werenorthwesterly by north throughout the storm. Thetiming of the peak wind velocity coincided with theoccurrence of precipitation.
Fig. 2. Time series of temperature (open circles), surface pressure (closed circles), 1-h cumulative precipitation amount
(grey bars), weather phenomena (symbols), and wind direction and speed (barbs) at Beijing station from 0000 UTC 3
to 0000 UTC 5 November 2012.
NO.5 WANG Donghai, DUAN Yihong, LIU Ying, et al. 605
3. Analysis of the large-scale atmospheric cir-
culation
The November 2012 mixed rain-snow storm de-scribed in Section 2 was characterized by large precip-itation amount and broad spatial coverage (daily pre-cipitation set new records at 74 national meteorolog-ical observation stations). The duration of this eventwas also relatively long, indicating that large-scale cir-culation systems may have played key roles in generat-ing and maintaining the storm. This section presentsan analysis of the atmospheric circulation backgroundduring the rain-snow storm.
3.1 The Arctic Oscillation
The Arctic Oscillation (AO) is a major mode ofwinter climatic variability in the Northern Hemisphere(Thompson and Wallace, 1998; Baldwin and Dunker-ton, 1999). This oscillation generally dominates thefirst empirical orthogonal function (EOF1) of monthlymean sea level pressure over the extratropical North-ern Hemisphere (20◦–90◦N) during winter. The AOindex is commonly defined as the projection of eitherthe corresponding time coefficient or the real-time sealevel pressure on EOF1.
The Arctic is generally dominated by low-pressuresystems while pressure in the midlatitudes is relativelyhigh. A positive AO index indicates an increase inthe pressure gradient between polar and midlatitudes.This imposes restrictions on the southward movementof cold Arctic air. A negative AO index indicates areduced pressure gradient between polar and midlat-itudes, a weakening of the zonal circulation and anenhancement of the meridional circulation (Deng andSun, 2006). In this case, incursions of frigid polar airare more common in midlatitudes (Gong and Wang,2003), leading to decreased surface air temperature.
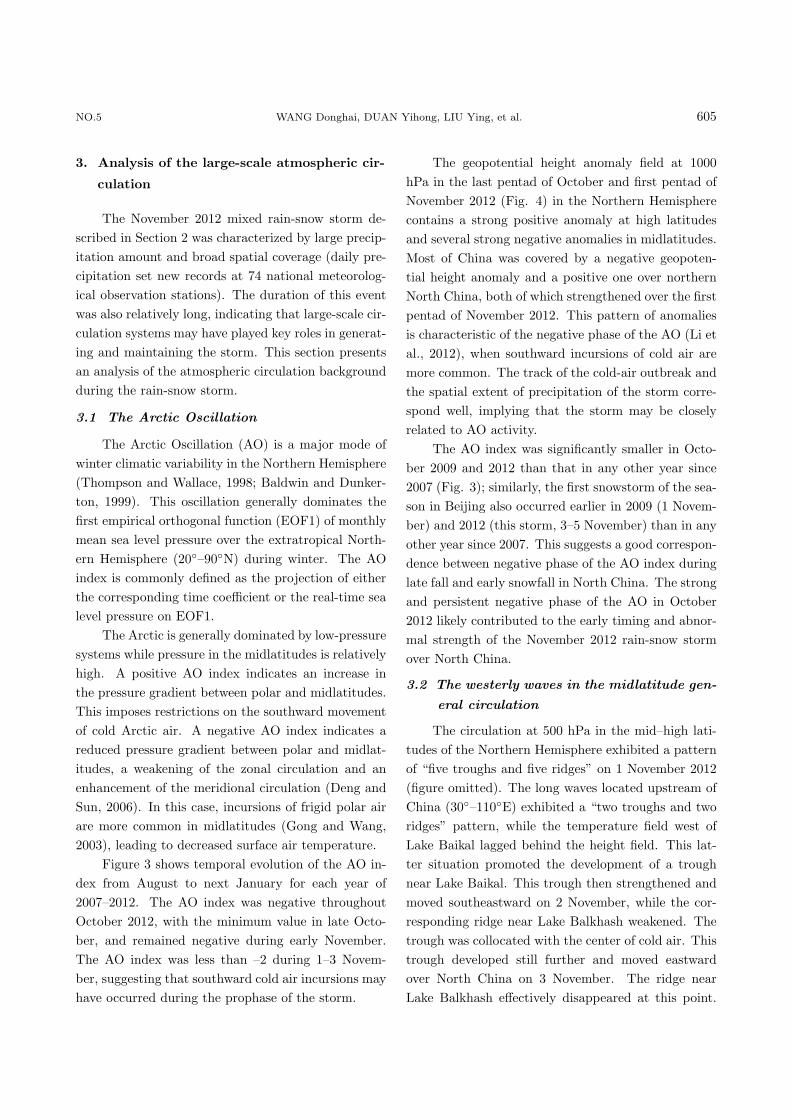
Figure 3 shows temporal evolution of the AO in-dex from August to next January for each year of2007–2012. The AO index was negative throughoutOctober 2012, with the minimum value in late Octo-ber, and remained negative during early November.The AO index was less than –2 during 1–3 Novem-ber, suggesting that southward cold air incursions mayhave occurred during the prophase of the storm.
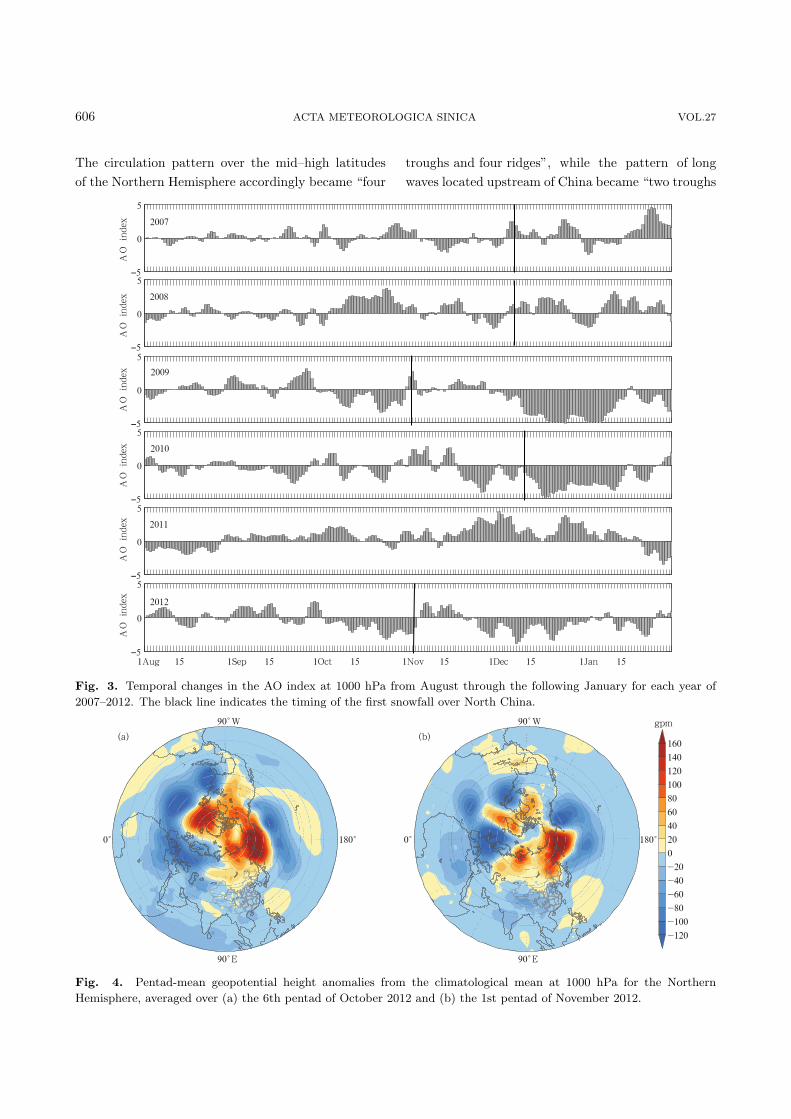
The geopotential height anomaly field at 1000hPa in the last pentad of October and first pentad ofNovember 2012 (Fig. 4) in the Northern Hemispherecontains a strong positive anomaly at high latitudesand several strong negative anomalies in midlatitudes.Most of China was covered by a negative geopoten-tial height anomaly and a positive one over northernNorth China, both of which strengthened over the firstpentad of November 2012. This pattern of anomaliesis characteristic of the negative phase of the AO (Li etal., 2012), when southward incursions of cold air aremore common. The track of the cold-air outbreak andthe spatial extent of precipitation of the storm corre-spond well, implying that the storm may be closelyrelated to AO activity.
The AO index was significantly smaller in Octo-ber 2009 and 2012 than that in any other year since2007 (Fig. 3); similarly, the first snowstorm of the sea-son in Beijing also occurred earlier in 2009 (1 Novem-ber) and 2012 (this storm, 3–5 November) than in anyother year since 2007. This suggests a good correspon-dence between negative phase of the AO index duringlate fall and early snowfall in North China. The strongand persistent negative phase of the AO in October2012 likely contributed to the early timing and abnor-mal strength of the November 2012 rain-snow stormover North China.
3.2 The westerly waves in the midlatitude gen-
eral circulation
The circulation at 500 hPa in the mid–high lati-tudes of the Northern Hemisphere exhibited a patternof “five troughs and five ridges” on 1 November 2012(figure omitted). The long waves located upstream ofChina (30◦–110◦E) exhibited a “two troughs and tworidges” pattern, while the temperature field west ofLake Baikal lagged behind the height field. This lat-ter situation promoted the development of a troughnear Lake Baikal. This trough then strengthened andmoved southeastward on 2 November, while the cor-responding ridge near Lake Balkhash weakened. Thetrough was collocated with the center of cold air. Thistrough developed still further and moved eastwardover North China on 3 November. The ridge nearLake Balkhash effectively disappeared at this point.
606 ACTA METEOROLOGICA SINICA VOL.27
The circulation pattern over the mid–high latitudesof the Northern Hemisphere accordingly became “four
troughs and four ridges”, while the pattern of longwaves located upstream of China became “two troughs
Fig. 3. Temporal changes in the AO index at 1000 hPa from August through the following January for each year of
2007–2012. The black line indicates the timing of the first snowfall over North China.
Fig. 4. Pentad-mean geopotential height anomalies from the climatological mean at 1000 hPa for the Northern
Hemisphere, averaged over (a) the 6th pentad of October 2012 and (b) the 1st pentad of November 2012.
NO.5 WANG Donghai, DUAN Yihong, LIU Ying, et al. 607
and one ridge”. These westerly long waves movedslowly over the North China low-pressure system on4 November, with the center of the latter coincidentwith the center of cold air. Thus, the wavenumber ofthe westerly waves upstream of North China decreasedin this process.
According to the Rossby wave equation, the re-duction in the wavenumber of the westerly waveswould lead to decreased upstream wave velocity. Thisin turn caused the North China low-pressure systemto become stable and move more slowly, thus prompt-ing the occurrence of severe weather over there.
This storm also coincided with the formation anddevelopment of a blocking high over East Asia andthe western Pacific. An Ω-shaped blocking high waspresent over this region during 1–2 November, witha steady ridge of wide meridional extent. The rapidformation of the low-pressure system to the south ofthe blocking high during 3–4 November resulted in aunique form of “solitary wave” with similarities to thecirculation pattern during the June–July Meiyu pe-riod, in which a stable blocking high is situated overXinjiang and Xizang (Tibet), upstream of the YangtzeRiver basin, and this “Meiyu period blocking” causescontinuous rainy weather downstream of the blockinghigh (Cheng et al., 2000; Zhang et al., 2004). The dif-ference in this case is that the flow pattern contains adownstream block rather than an upstream one. This
downstream block inhibited the eastward movementof the upstream westerly trough, ensuring that thecorresponding surface cyclone remained stable for arelatively long time over Beijing and its neighboringareas. This stability caused the persistent strong pre-cipitation during the November 2012 rain-snow storm.
3.3 Anomalous large-scale circulation in the
Northern Hemisphere
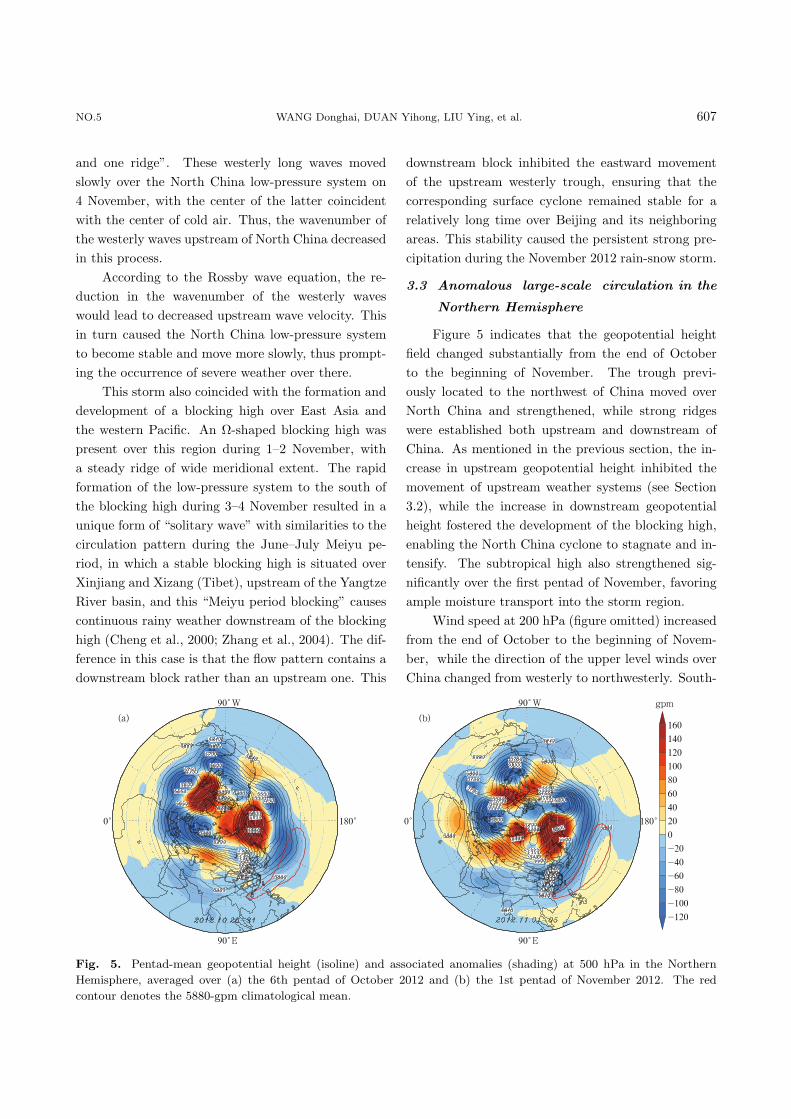
Figure 5 indicates that the geopotential heightfield changed substantially from the end of Octoberto the beginning of November. The trough previ-ously located to the northwest of China moved overNorth China and strengthened, while strong ridgeswere established both upstream and downstream ofChina. As mentioned in the previous section, the in-crease in upstream geopotential height inhibited themovement of upstream weather systems (see Section3.2), while the increase in downstream geopotentialheight fostered the development of the blocking high,enabling the North China cyclone to stagnate and in-tensify. The subtropical high also strengthened sig-nificantly over the first pentad of November, favoringample moisture transport into the storm region.
Wind speed at 200 hPa (figure omitted) increasedfrom the end of October to the beginning of Novem-ber, while the direction of the upper level winds overChina changed from westerly to northwesterly. South-
Fig. 5. Pentad-mean geopotential height (isoline) and associated anomalies (shading) at 500 hPa in the Northern
Hemisphere, averaged over (a) the 6th pentad of October 2012 and (b) the 1st pentad of November 2012. The red
contour denotes the 5880-gpm climatological mean.
608 ACTA METEOROLOGICA SINICA VOL.27
ward cross-equatorial flow at 850 hPa over East Asiaalso increased at this time (figure omitted), withnortheasterlies over the South China Sea and north-westerlies over the area south of the Yellow River.These changes in the wind fields imply that theNovember 2012 storm occurred nearly in concert withthe onset of the East Asian winter monsoon (Zhu etal., 2007). The coincidence between the timing of thestorm and the establishment of the winter monsoonmay have contributed to the occurrence of southwardcold air incursions.
4. Evolution of the North China cyclone and
its relationship with precipitation
4.1 Lifecycle of the cyclone
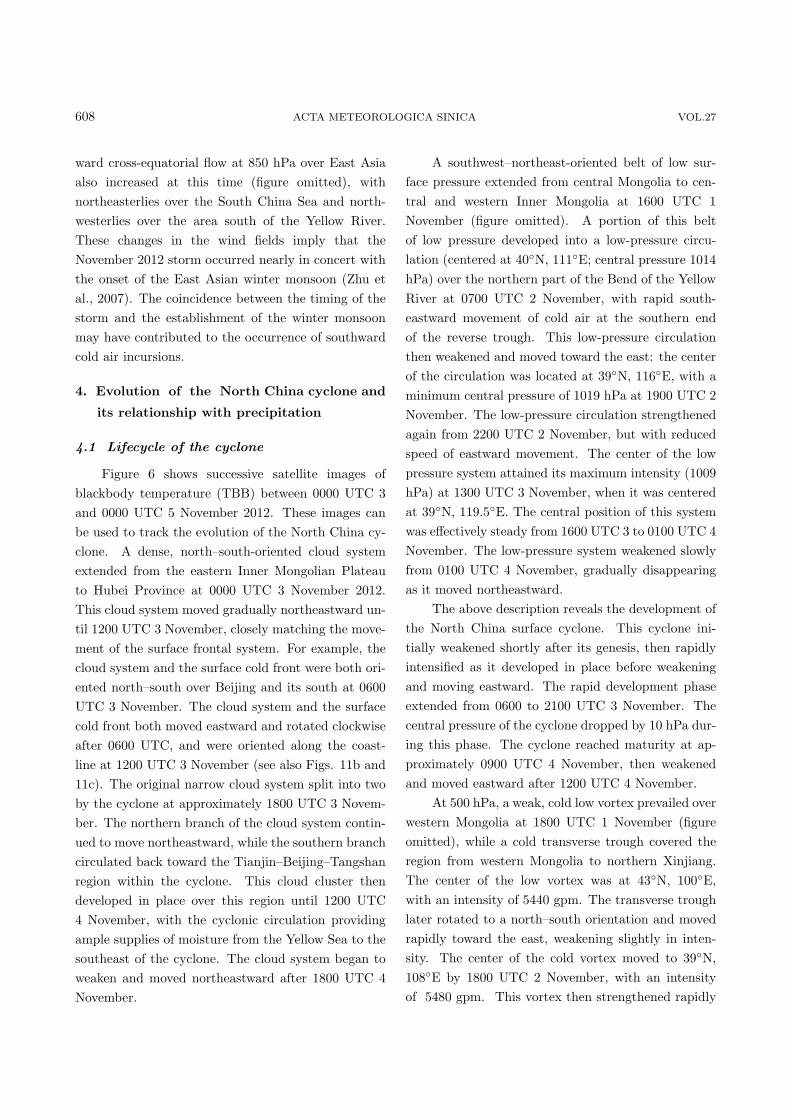
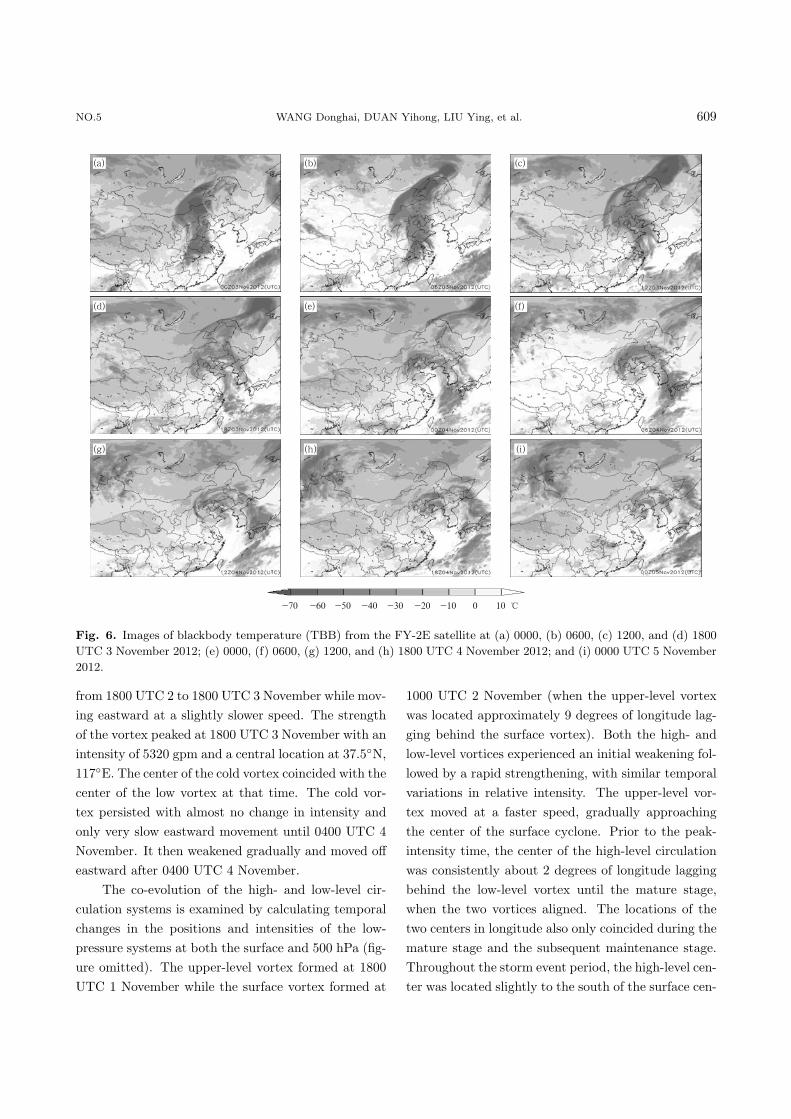
Figure 6 shows successive satellite images ofblackbody temperature (TBB) between 0000 UTC 3and 0000 UTC 5 November 2012. These images canbe used to track the evolution of the North China cy-clone. A dense, north–south-oriented cloud systemextended from the eastern Inner Mongolian Plateauto Hubei Province at 0000 UTC 3 November 2012.This cloud system moved gradually northeastward un-til 1200 UTC 3 November, closely matching the move-ment of the surface frontal system. For example, thecloud system and the surface cold front were both ori-ented north–south over Beijing and its south at 0600UTC 3 November. The cloud system and the surfacecold front both moved eastward and rotated clockwiseafter 0600 UTC, and were oriented along the coast-line at 1200 UTC 3 November (see also Figs. 11b and11c). The original narrow cloud system split into twoby the cyclone at approximately 1800 UTC 3 Novem-ber. The northern branch of the cloud system contin-ued to move northeastward, while the southern branchcirculated back toward the Tianjin–Beijing–Tangshanregion within the cyclone. This cloud cluster thendeveloped in place over this region until 1200 UTC4 November, with the cyclonic circulation providingample supplies of moisture from the Yellow Sea to thesoutheast of the cyclone. The cloud system began toweaken and moved northeastward after 1800 UTC 4November.
A southwest–northeast-oriented belt of low sur-face pressure extended from central Mongolia to cen-tral and western Inner Mongolia at 1600 UTC 1November (figure omitted). A portion of this beltof low pressure developed into a low-pressure circu-lation (centered at 40◦N, 111◦E; central pressure 1014hPa) over the northern part of the Bend of the YellowRiver at 0700 UTC 2 November, with rapid south-eastward movement of cold air at the southern endof the reverse trough. This low-pressure circulationthen weakened and moved toward the east: the centerof the circulation was located at 39◦N, 116◦E, with aminimum central pressure of 1019 hPa at 1900 UTC 2November. The low-pressure circulation strengthenedagain from 2200 UTC 2 November, but with reducedspeed of eastward movement. The center of the lowpressure system attained its maximum intensity (1009hPa) at 1300 UTC 3 November, when it was centeredat 39◦N, 119.5◦E. The central position of this systemwas effectively steady from 1600 UTC 3 to 0100 UTC 4November. The low-pressure system weakened slowlyfrom 0100 UTC 4 November, gradually disappearingas it moved northeastward.
The above description reveals the development ofthe North China surface cyclone. This cyclone ini-tially weakened shortly after its genesis, then rapidlyintensified as it developed in place before weakeningand moving eastward. The rapid development phaseextended from 0600 to 2100 UTC 3 November. Thecentral pressure of the cyclone dropped by 10 hPa dur-ing this phase. The cyclone reached maturity at ap-proximately 0900 UTC 4 November, then weakenedand moved eastward after 1200 UTC 4 November.
At 500 hPa, a weak, cold low vortex prevailed overwestern Mongolia at 1800 UTC 1 November (figureomitted), while a cold transverse trough covered theregion from western Mongolia to northern Xinjiang.The center of the low vortex was at 43◦N, 100◦E,with an intensity of 5440 gpm. The transverse troughlater rotated to a north–south orientation and movedrapidly toward the east, weakening slightly in inten-sity. The center of the cold vortex moved to 39◦N,108◦E by 1800 UTC 2 November, with an intensityof 5480 gpm. This vortex then strengthened rapidly
NO.5 WANG Donghai, DUAN Yihong, LIU Ying, et al. 609
Fig. 6. Images of blackbody temperature (TBB) from the FY-2E satellite at (a) 0000, (b) 0600, (c) 1200, and (d) 1800
UTC 3 November 2012; (e) 0000, (f) 0600, (g) 1200, and (h) 1800 UTC 4 November 2012; and (i) 0000 UTC 5 November
2012.
from 1800 UTC 2 to 1800 UTC 3 November while mov-ing eastward at a slightly slower speed. The strengthof the vortex peaked at 1800 UTC 3 November with anintensity of 5320 gpm and a central location at 37.5◦N,117◦E. The center of the cold vortex coincided with thecenter of the low vortex at that time. The cold vor-tex persisted with almost no change in intensity andonly very slow eastward movement until 0400 UTC 4November. It then weakened gradually and moved offeastward after 0400 UTC 4 November.
The co-evolution of the high- and low-level cir-culation systems is examined by calculating temporalchanges in the positions and intensities of the low-pressure systems at both the surface and 500 hPa (fig-ure omitted). The upper-level vortex formed at 1800UTC 1 November while the surface vortex formed at
1000 UTC 2 November (when the upper-level vortexwas located approximately 9 degrees of longitude lag-ging behind the surface vortex). Both the high- andlow-level vortices experienced an initial weakening fol-lowed by a rapid strengthening, with similar temporalvariations in relative intensity. The upper-level vor-tex moved at a faster speed, gradually approachingthe center of the surface cyclone. Prior to the peak-intensity time, the center of the high-level circulationwas consistently about 2 degrees of longitude laggingbehind the low-level vortex until the mature stage,when the two vortices aligned. The locations of thetwo centers in longitude also only coincided during themature stage and the subsequent maintenance stage.Throughout the storm event period, the high-level cen-ter was located slightly to the south of the surface cen-
610 ACTA METEOROLOGICA SINICA VOL.27
ter. This result suggests that the three-dimensionalcyclone system was inclined westward and southwest-ward from the surface to the mid-troposphere, with astrong baroclinity.
4.2 Relationship between the cyclone and pre-
cipitation
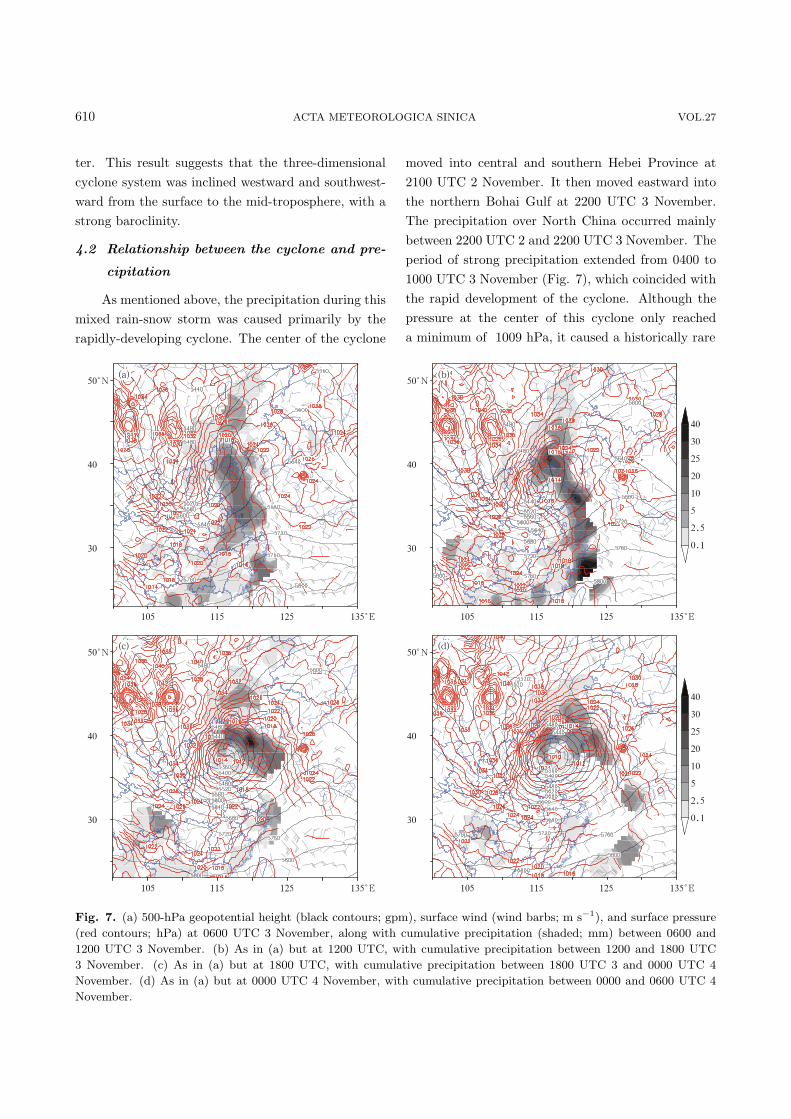
As mentioned above, the precipitation during thismixed rain-snow storm was caused primarily by therapidly-developing cyclone. The center of the cyclone
moved into central and southern Hebei Province at2100 UTC 2 November. It then moved eastward intothe northern Bohai Gulf at 2200 UTC 3 November.The precipitation over North China occurred mainlybetween 2200 UTC 2 and 2200 UTC 3 November. Theperiod of strong precipitation extended from 0400 to1000 UTC 3 November (Fig. 7), which coincided withthe rapid development of the cyclone. Although thepressure at the center of this cyclone only reacheda minimum of 1009 hPa, it caused a historically rare
Fig. 7. (a) 500-hPa geopotential height (black contours; gpm), surface wind (wind barbs; m s−1), and surface pressure
(red contours; hPa) at 0600 UTC 3 November, along with cumulative precipitation (shaded; mm) between 0600 and
1200 UTC 3 November. (b) As in (a) but at 1200 UTC, with cumulative precipitation between 1200 and 1800 UTC
3 November. (c) As in (a) but at 1800 UTC, with cumulative precipitation between 1800 UTC 3 and 0000 UTC 4
November. (d) As in (a) but at 0000 UTC 4 November, with cumulative precipitation between 0000 and 0600 UTC 4
November.
NO.5 WANG Donghai, DUAN Yihong, LIU Ying, et al. 611
blizzard in North China. The precipitation distribu-tion during the development of the cyclone was ori-ented along a north–south belt over central and east-ern North China with a width of 2◦–3◦ in latitude anda length of 20◦ in longitude.
Figure 7 shows the stage-by-stage developmentof the cyclone. The development of the north–southbelt of precipitation was almost identical to the deve-lopment of the surface front, which extended south-ward from the center of the cyclone within a nar-row zone of low surface pressure. The cyclone be-came stable with little horizontal movement duringits mature stage (Fig. 7c). By contrast, cold air tothe south of the cyclone continued to move towardthe southeast. This situation led to rapid changesin the position of the southern segment of the coldfront, with little movement on the northern end. Asthe cyclone rotated, the orientation of the correspond-ing rainfall belt shifted from north–south to west–east. Continued cyclonic rotation during the main-tenance stage (Fig. 7d) conveyed warm and wet airfrom the southeast of the cyclone to the western sideof the cyclone, so precipitation occurred in this re-gion as well. Throughout the mature stage, cold airentered the southern side of the cyclone before be-ing transported to the eastern side. The precipita-tion belt was therefore located largely on the north-ern side of the cyclone and oriented west–east. Theprevailing surface winds near the precipitation beltwere southeasterly-by-southerly. These winds com-bined with the northwesterly-by-westerly winds to thenorth of the precipitation belt created strong con-vergence, strengthening the southerly winds, enhanc-ing moisture convergence, and driving the subsequentnorthward movement of the storm.
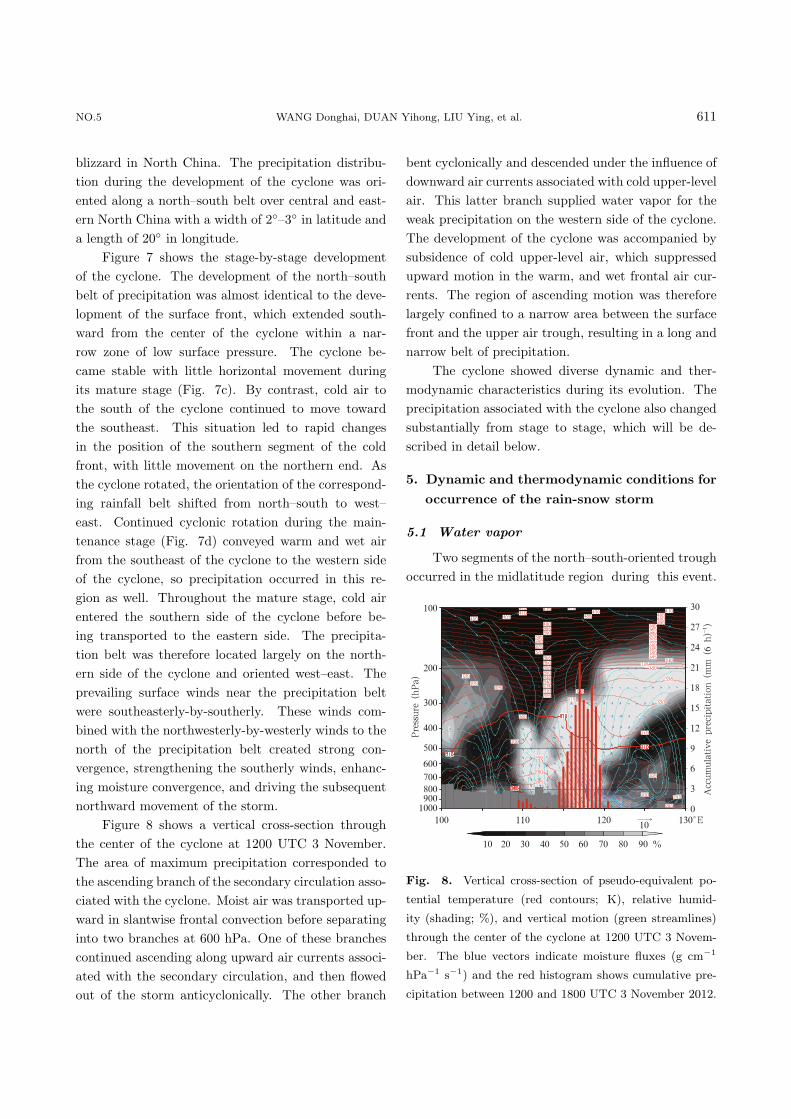
Figure 8 shows a vertical cross-section throughthe center of the cyclone at 1200 UTC 3 November.The area of maximum precipitation corresponded tothe ascending branch of the secondary circulation asso-ciated with the cyclone. Moist air was transported up-ward in slantwise frontal convection before separatinginto two branches at 600 hPa. One of these branchescontinued ascending along upward air currents associ-ated with the secondary circulation, and then flowedout of the storm anticyclonically. The other branch
bent cyclonically and descended under the influence ofdownward air currents associated with cold upper-levelair. This latter branch supplied water vapor for theweak precipitation on the western side of the cyclone.The development of the cyclone was accompanied bysubsidence of cold upper-level air, which suppressedupward motion in the warm, and wet frontal air cur-rents. The region of ascending motion was thereforelargely confined to a narrow area between the surfacefront and the upper air trough, resulting in a long andnarrow belt of precipitation.
The cyclone showed diverse dynamic and ther-modynamic characteristics during its evolution. Theprecipitation associated with the cyclone also changedsubstantially from stage to stage, which will be de-scribed in detail below.
5. Dynamic and thermodynamic conditions foroccurrence of the rain-snow storm
5.1 Water vapor
Two segments of the north–south-oriented troughoccurred in the midlatitude region during this event.
Fig. 8. Vertical cross-section of pseudo-equivalent po-
tential temperature (red contours; K), relative humid-
ity (shading; %), and vertical motion (green streamlines)
through the center of the cyclone at 1200 UTC 3 Novem-
ber. The blue vectors indicate moisture fluxes (g cm−1
hPa−1 s−1) and the red histogram shows cumulative pre-
cipitation between 1200 and 1800 UTC 3 November 2012.
612 ACTA METEOROLOGICA SINICA VOL.27
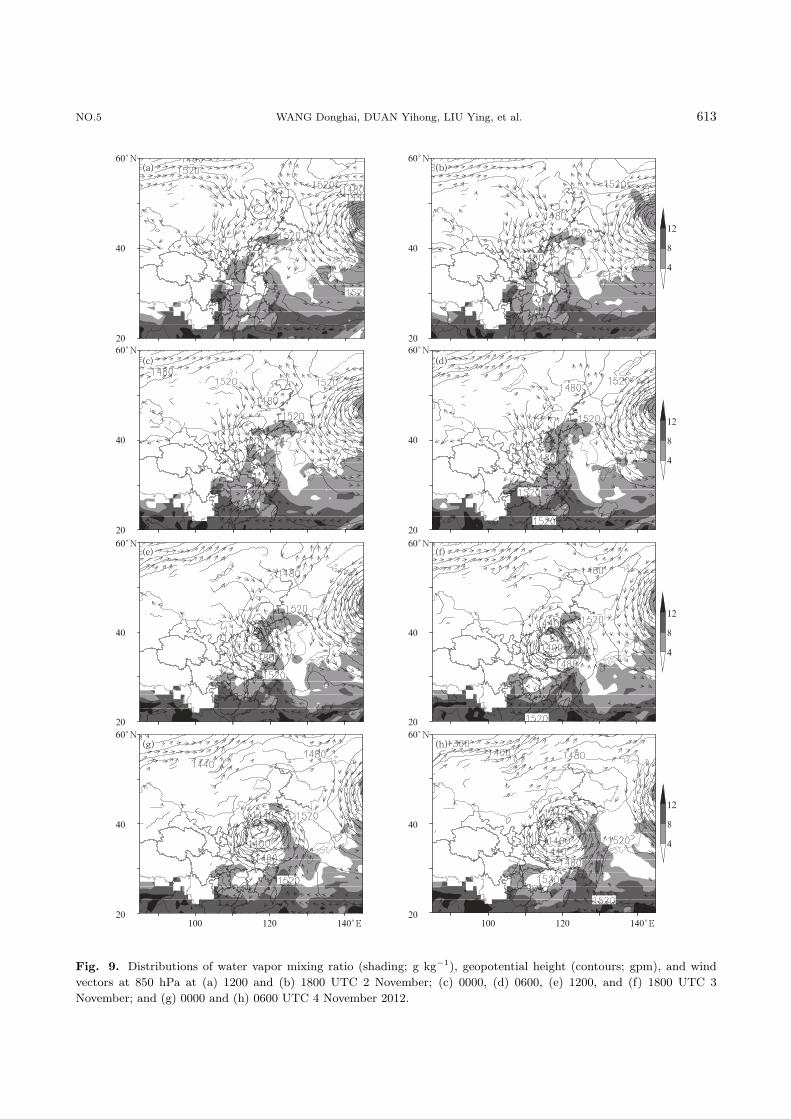
Figure 9 shows distributions of water vapor, geopo-tential height, and winds at 850 hPa from 1200 UTC2 to 0600 UTC 4 November 2012. At 1200 UTC 2November, the southern segment of the trough waslocated near the border between Shaanxi and Shanxiprovinces. Southwesterly winds to the east of this seg-ment supplied significant amounts of water vapor toNorth China. A cyclone formed in the southern seg-ment of the trough between 1800 UTC 2 and 0000UTC 3 November. This cyclone was accompaniedby enhanced water vapor transport into North Chinafrom the southwest. The cyclone moved over the west-ern part of North China at 0600 UTC 3 November.Convergence between southwesterly and southeasterlywinds along the eastern side of the cyclone furtherenhanced the supply of water vapor. The cyclone con-tinued to develop and move eastward slowly between1200 UTC 3 and 0600 UTC 4 November. Southeast-erly air flow in the eastern and northeastern portionsof the cyclone ensured a continued supply of abundantwater vapor to North China. The cyclone (and the as-sociated water vapor transport) then moved northeast-ward out of North China. Pre-existing conditions andthe continuous supply of cold air and abundant watervapor combined to strengthen the cyclone as it heldsteady over North China.
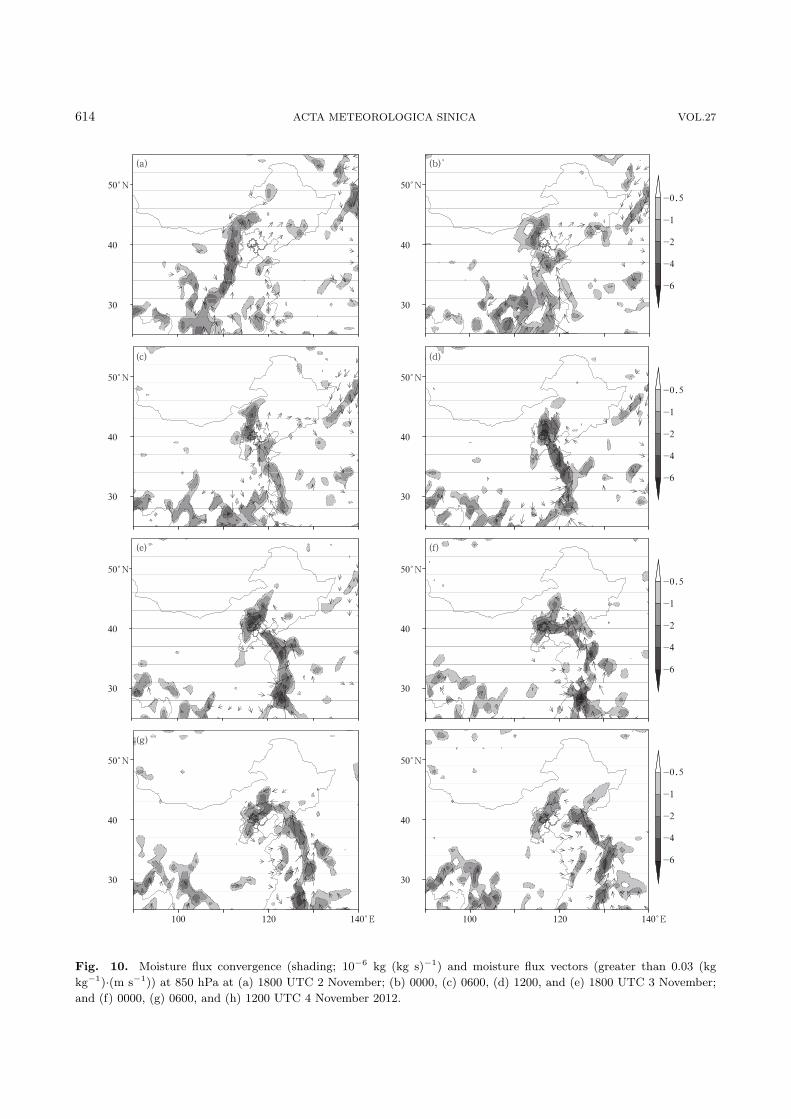
Figure 10 shows distributions of water vaporflux convergence (WVFC). The regions of maximumWVFC were located ahead of and oriented parallelto the cold front. A north–south-oriented belt of en-hanced WVFC arrived over Shanxi Province at 1800UTC 2 November. This belt of enhanced WVFC re-sulted from the convergence of southeasterly windsfrom the western Pacific Ocean and southwesterlywinds from southern Asia. The belt of enhancedWVFC belt had reached North China by 0000 UTC3 November, when it turned counterclockwise aroundan axis centered near Beijing. Northwesterly windsfrom the rear of the front blocked the southwesterlywinds from southern Asia at this stage, so south-easterly winds from the western Pacific Ocean be-came the main supply of water vapor to North China.The southeasterly winds shifted to southerly winds asthe front moved northward, and then became easterly
winds when the front moved into North China. Thearea near Beijing was a center of enhanced water vaporflux convergence throughout this period. These con-ditions favored the formation of snow and rain overNorth China (and near Beijing in particular).
The region of moisture convergence overlappedsubstantially with the region of upward motion, whichmay have caused the occurrence of strong precipita-tion ahead of the front. The belt of strong water va-por transport narrowed between 0000 UTC and 1200UTC 3 November due to an enhanced influx of coldair, which in turn sharpened the water vapor gradient.Upward motion ahead of the front also intensified, en-hancing the vertical transport of water vapor. Boththe belt of strong water vapor transport and the re-gion of upward motion rotated counterclockwise after1200 UTC 3 November due to the steering effect ofthe cyclone circulation, extending into North China.A weak warm front formed along the leading edge ofthe southerly winds located ahead of the cold front.The relative proximity of the cold and warm fronts ledto the coexistence of precipitation in multiple phases.
5.2 Cold front and cyclone
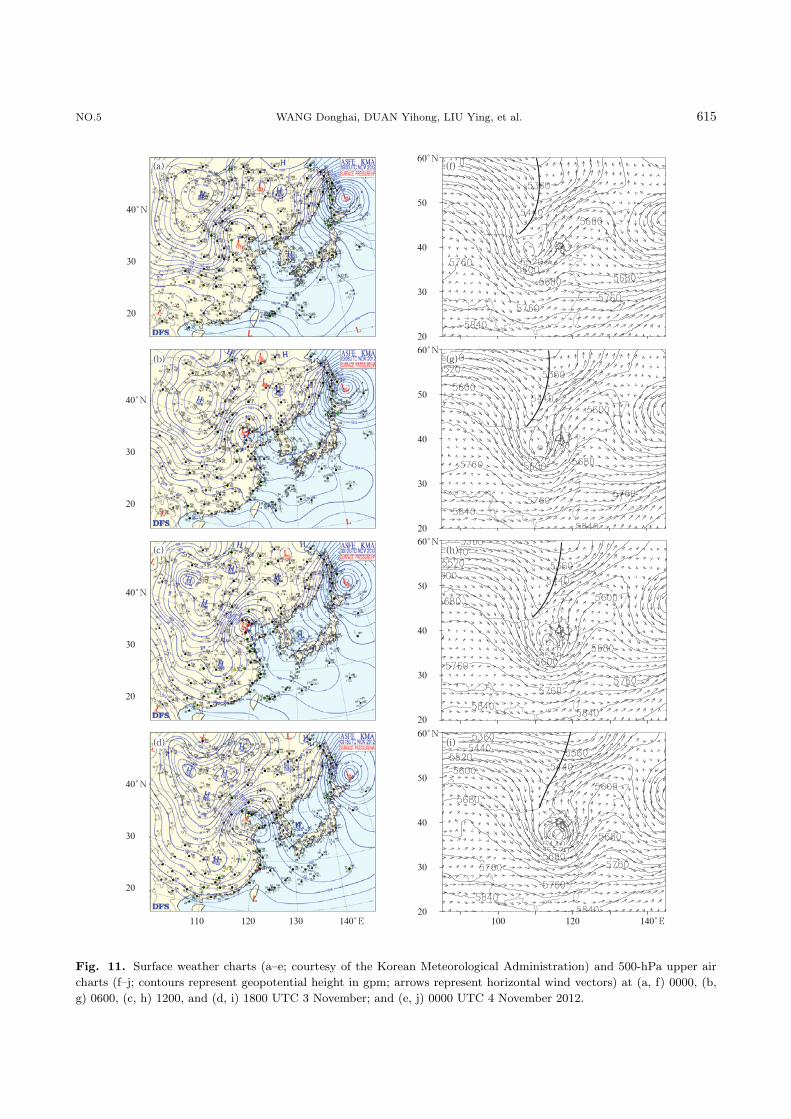
Figure 11 shows conditions at the surface and at500 hPa from 0000 UTC 3 to 0000 UTC 4 Novem-ber. An upper-level trough was entrenched over themidlatitude region of Inner Mongolia before the sig-nificant development of the cyclone (Figs. 11a and11f). Positive vorticity advection to the east of thetrough favored the development of the cyclone. A cen-ter of low pressure appeared at the surface and movedeastward at this time. At 0600 UTC 3 November, adistinct cold front extended outward from this centerof low pressure and moved eastward into East Chinaand southern North China (Figs. 11b and 11g). Theupper-level trough was located behind the surface lowat this point, but was propagating eastward at a fasterspeed. The cyclone developed rapidly after the upper-level trough caught up with the surface low at ap-proximately 1200 UTC 3 November (Figs. 11c and11h). This cyclone then moved into southern North-east China at 0000 UTC 4 November.
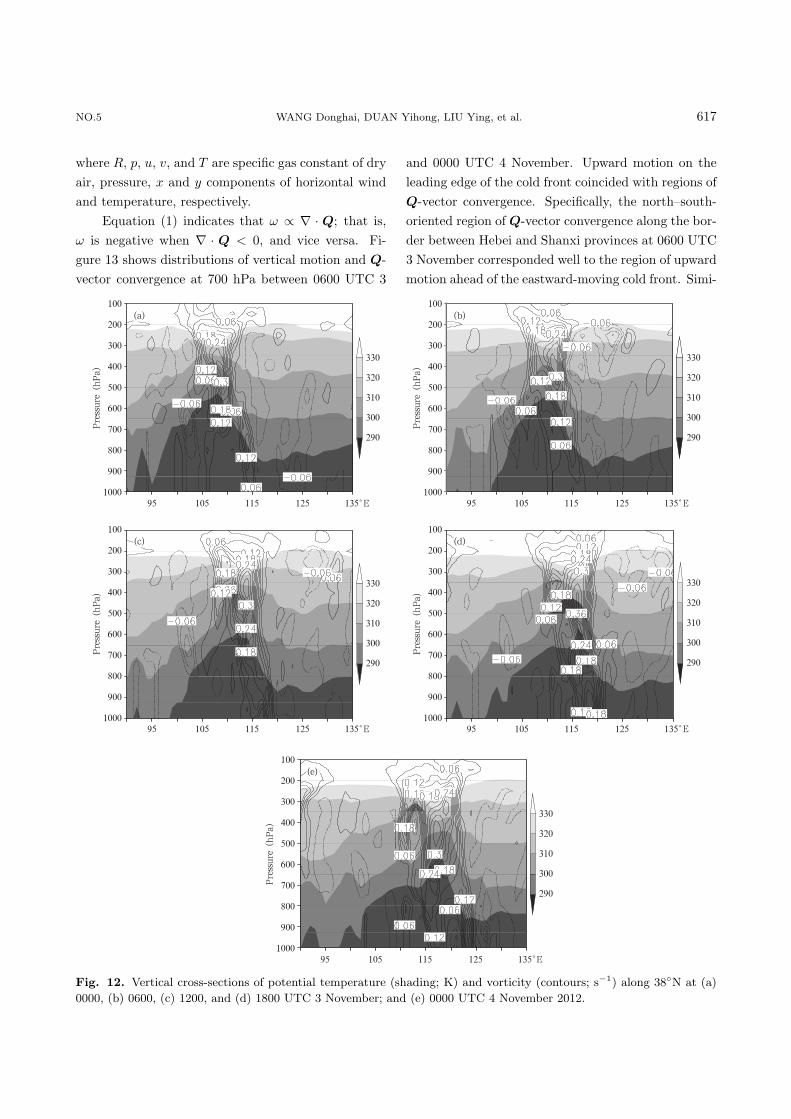
Figure 12 shows vertical cross-sections of poten-
NO.5 WANG Donghai, DUAN Yihong, LIU Ying, et al. 613
Fig. 9. Distributions of water vapor mixing ratio (shading; g kg−1), geopotential height (contours; gpm), and wind
vectors at 850 hPa at (a) 1200 and (b) 1800 UTC 2 November; (c) 0000, (d) 0600, (e) 1200, and (f) 1800 UTC 3
November; and (g) 0000 and (h) 0600 UTC 4 November 2012.
614 ACTA METEOROLOGICA SINICA VOL.27
Fig. 10. Moisture flux convergence (shading; 10−6 kg (kg s)−1) and moisture flux vectors (greater than 0.03 (kg
kg−1)·(m s−1)) at 850 hPa at (a) 1800 UTC 2 November; (b) 0000, (c) 0600, (d) 1200, and (e) 1800 UTC 3 November;
and (f) 0000, (g) 0600, and (h) 1200 UTC 4 November 2012.
NO.5 WANG Donghai, DUAN Yihong, LIU Ying, et al. 615
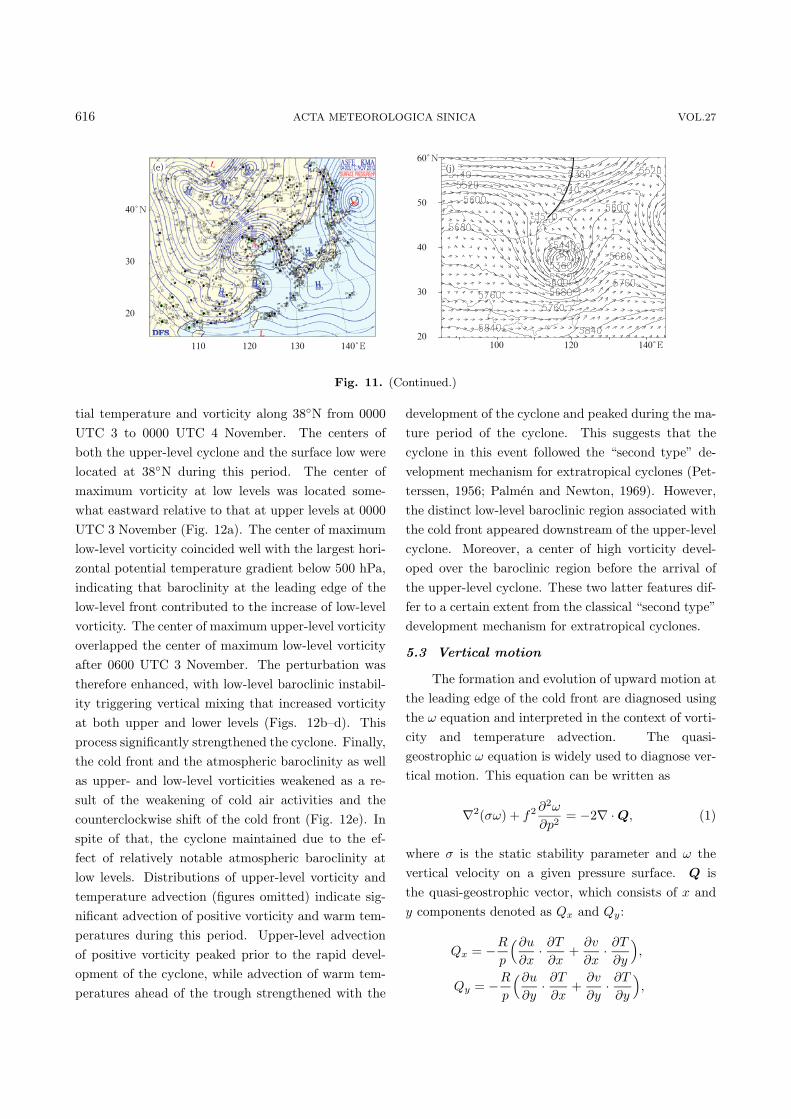
Fig. 11. Surface weather charts (a–e; courtesy of the Korean Meteorological Administration) and 500-hPa upper air
charts (f–j; contours represent geopotential height in gpm; arrows represent horizontal wind vectors) at (a, f) 0000, (b,
g) 0600, (c, h) 1200, and (d, i) 1800 UTC 3 November; and (e, j) 0000 UTC 4 November 2012.
616 ACTA METEOROLOGICA SINICA VOL.27
Fig. 11. (Continued.)
tial temperature and vorticity along 38◦N from 0000UTC 3 to 0000 UTC 4 November. The centers ofboth the upper-level cyclone and the surface low werelocated at 38◦N during this period. The center ofmaximum vorticity at low levels was located some-what eastward relative to that at upper levels at 0000UTC 3 November (Fig. 12a). The center of maximumlow-level vorticity coincided well with the largest hori-zontal potential temperature gradient below 500 hPa,indicating that baroclinity at the leading edge of thelow-level front contributed to the increase of low-levelvorticity. The center of maximum upper-level vorticityoverlapped the center of maximum low-level vorticityafter 0600 UTC 3 November. The perturbation wastherefore enhanced, with low-level baroclinic instabil-ity triggering vertical mixing that increased vorticityat both upper and lower levels (Figs. 12b–d). Thisprocess significantly strengthened the cyclone. Finally,the cold front and the atmospheric baroclinity as wellas upper- and low-level vorticities weakened as a re-sult of the weakening of cold air activities and thecounterclockwise shift of the cold front (Fig. 12e). Inspite of that, the cyclone maintained due to the ef-fect of relatively notable atmospheric baroclinity atlow levels. Distributions of upper-level vorticity andtemperature advection (figures omitted) indicate sig-nificant advection of positive vorticity and warm tem-peratures during this period. Upper-level advectionof positive vorticity peaked prior to the rapid devel-opment of the cyclone, while advection of warm tem-peratures ahead of the trough strengthened with the
development of the cyclone and peaked during the ma-ture period of the cyclone. This suggests that thecyclone in this event followed the “second type” de-velopment mechanism for extratropical cyclones (Pet-terssen, 1956; Palmen and Newton, 1969). However,the distinct low-level baroclinic region associated withthe cold front appeared downstream of the upper-levelcyclone. Moreover, a center of high vorticity devel-oped over the baroclinic region before the arrival ofthe upper-level cyclone. These two latter features dif-fer to a certain extent from the classical “second type”development mechanism for extratropical cyclones.
5.3 Vertical motion
The formation and evolution of upward motion atthe leading edge of the cold front are diagnosed usingthe ω equation and interpreted in the context of vorti-city and temperature advection. The quasi-geostrophic ω equation is widely used to diagnose ver-tical motion. This equation can be written as
∇2(σω) + f2 ∂2ω
∂p2= −2∇ · Q, (1)
where σ is the static stability parameter and ω thevertical velocity on a given pressure surface. Q isthe quasi-geostrophic vector, which consists of x andy components denoted as Qx and Qy:
Qx = −R
p
(∂u
∂x· ∂T
∂x+
∂v
∂x· ∂T
∂y
),
Qy = −R
p
(∂u
∂y· ∂T
∂x+
∂v
∂y· ∂T
∂y
),
NO.5 WANG Donghai, DUAN Yihong, LIU Ying, et al. 617
where R, p, u, v, and T are specific gas constant of dryair, pressure, x and y components of horizontal windand temperature, respectively.
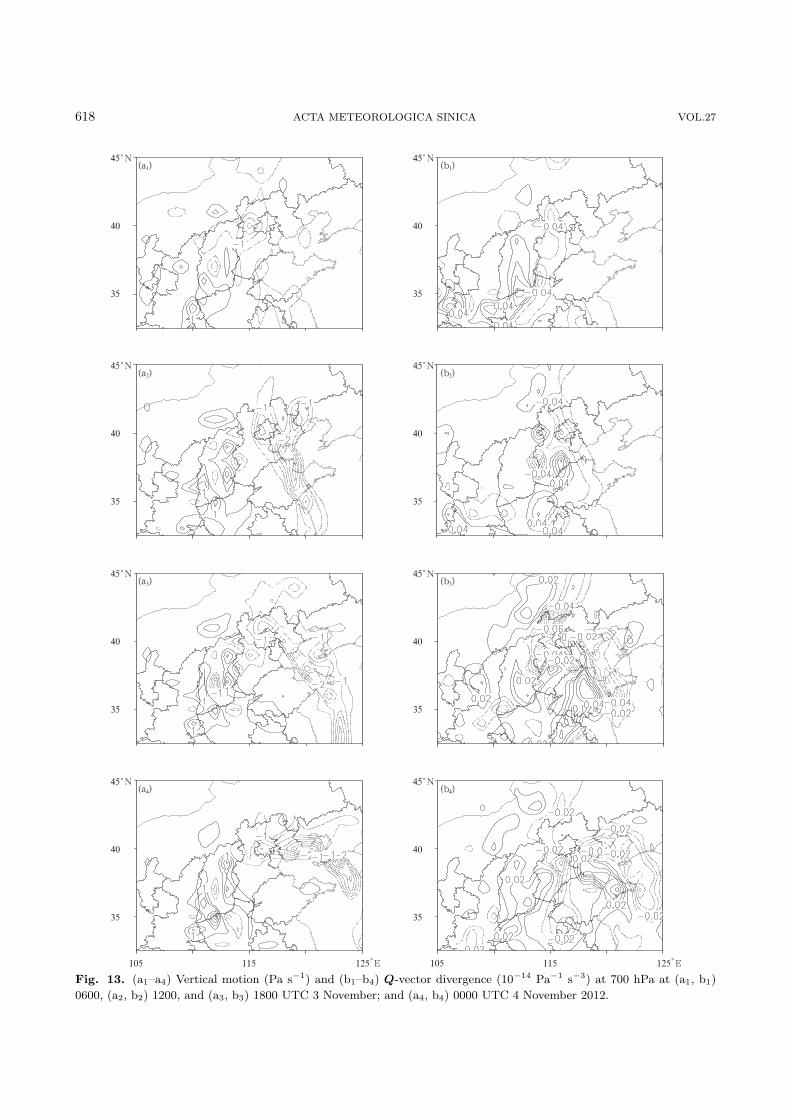
Equation (1) indicates that ω ∝ ∇ · Q; that is,ω is negative when ∇ · Q < 0, and vice versa. Fi-gure 13 shows distributions of vertical motion and Q-vector convergence at 700 hPa between 0600 UTC 3
and 0000 UTC 4 November. Upward motion on theleading edge of the cold front coincided with regions ofQ-vector convergence. Specifically, the north–south-oriented region of Q-vector convergence along the bor-der between Hebei and Shanxi provinces at 0600 UTC3 November corresponded well to the region of upwardmotion ahead of the eastward-moving cold front. Simi-
Fig. 12. Vertical cross-sections of potential temperature (shading; K) and vorticity (contours; s−1) along 38◦N at (a)
0000, (b) 0600, (c) 1200, and (d) 1800 UTC 3 November; and (e) 0000 UTC 4 November 2012.
618 ACTA METEOROLOGICA SINICA VOL.27
Fig. 13. (a1–a4) Vertical motion (Pa s−1) and (b1–b4) Q-vector divergence (10−14 Pa−1 s−3) at 700 hPa at (a1, b1)
0600, (a2, b2) 1200, and (a3, b3) 1800 UTC 3 November; and (a4, b4) 0000 UTC 4 November 2012.
NO.5 WANG Donghai, DUAN Yihong, LIU Ying, et al. 619
larly, the evolving position of the region of Q-vectorconvergence over North China between 1200 UTC 3and 0000 UTC 4 November corresponded well to theregion of upward motion ahead of the cyclonically ro-tating cold front. The other region of Q-vector con-vergence (over northwestern Hebei Province at 1800UTC 3 November) was also consistent with the lo-cation of upward motion associated with the othercold front. This implies that the formation of upwardmotion ahead of the cold front during this event wasclosely related to quasi-geostrophic motion.
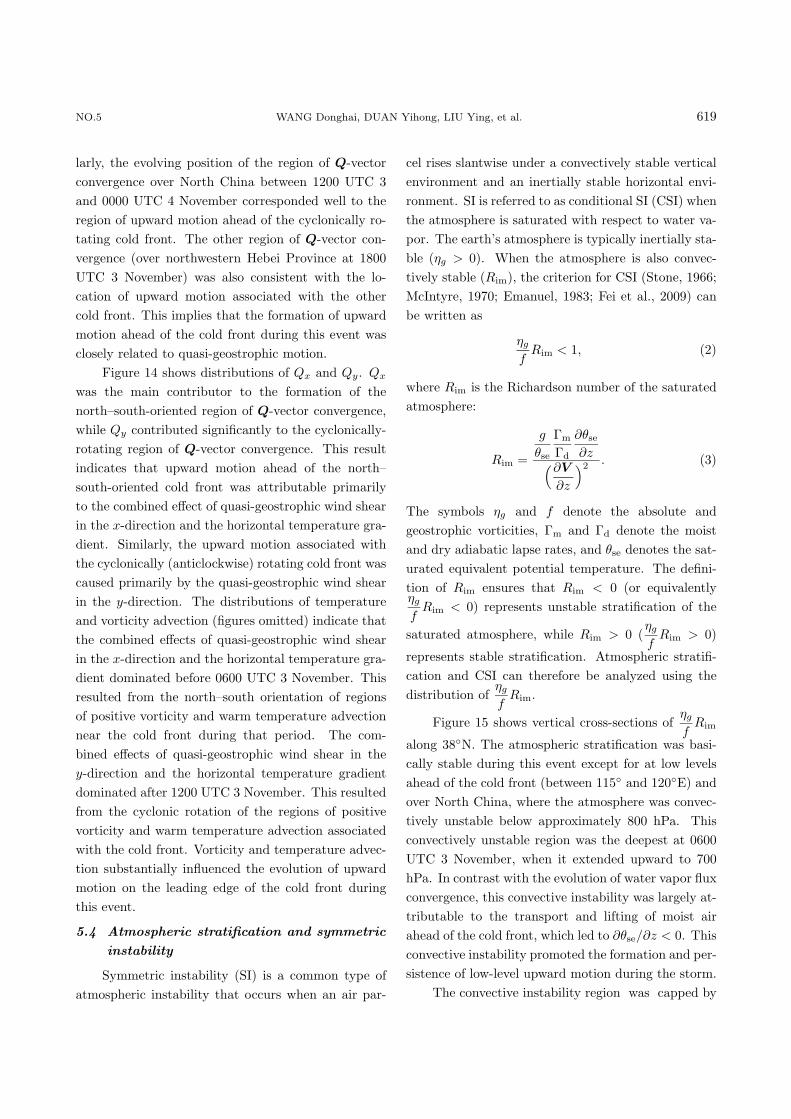
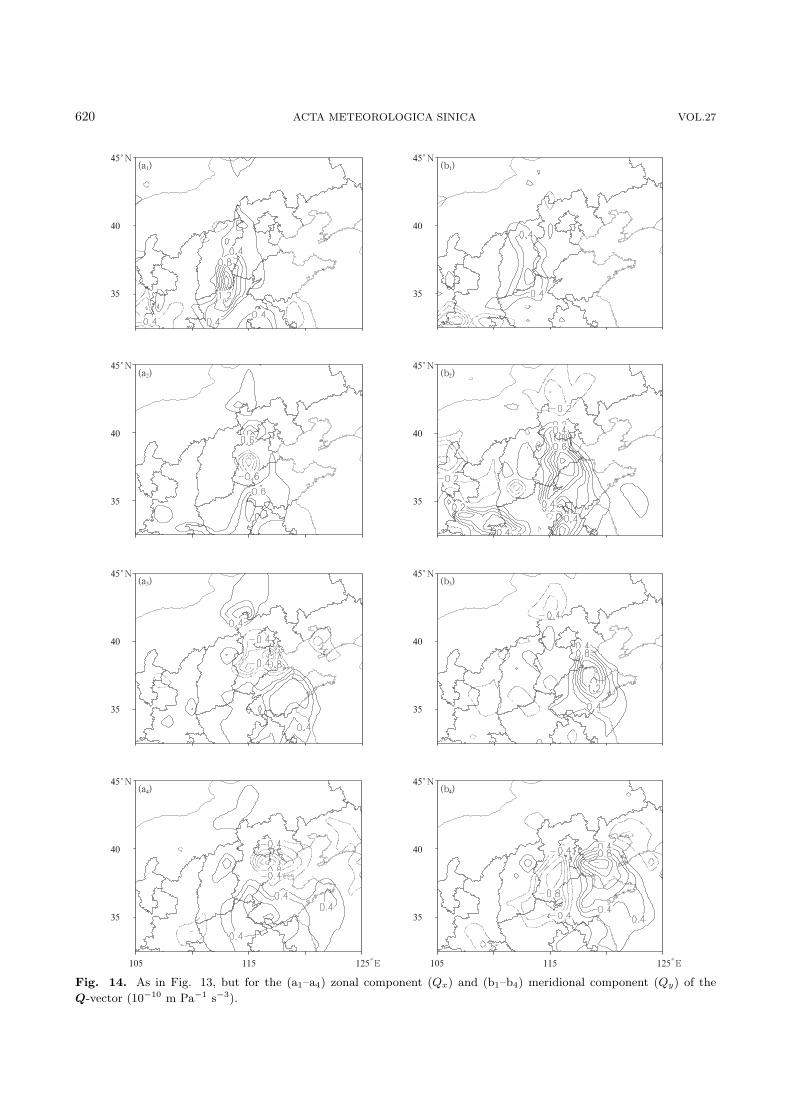
Figure 14 shows distributions of Qx and Qy. Qx
was the main contributor to the formation of thenorth–south-oriented region of Q-vector convergence,while Qy contributed significantly to the cyclonically-rotating region of Q-vector convergence. This resultindicates that upward motion ahead of the north–south-oriented cold front was attributable primarilyto the combined effect of quasi-geostrophic wind shearin the x-direction and the horizontal temperature gra-dient. Similarly, the upward motion associated withthe cyclonically (anticlockwise) rotating cold front wascaused primarily by the quasi-geostrophic wind shearin the y-direction. The distributions of temperatureand vorticity advection (figures omitted) indicate thatthe combined effects of quasi-geostrophic wind shearin the x-direction and the horizontal temperature gra-dient dominated before 0600 UTC 3 November. Thisresulted from the north–south orientation of regionsof positive vorticity and warm temperature advectionnear the cold front during that period. The com-bined effects of quasi-geostrophic wind shear in they-direction and the horizontal temperature gradientdominated after 1200 UTC 3 November. This resultedfrom the cyclonic rotation of the regions of positivevorticity and warm temperature advection associatedwith the cold front. Vorticity and temperature advec-tion substantially influenced the evolution of upwardmotion on the leading edge of the cold front duringthis event.
5.4 Atmospheric stratification and symmetric
instability
Symmetric instability (SI) is a common type ofatmospheric instability that occurs when an air par-
cel rises slantwise under a convectively stable verticalenvironment and an inertially stable horizontal envi-ronment. SI is referred to as conditional SI (CSI) whenthe atmosphere is saturated with respect to water va-por. The earth’s atmosphere is typically inertially sta-ble (ηg > 0). When the atmosphere is also convec-tively stable (Rim), the criterion for CSI (Stone, 1966;McIntyre, 1970; Emanuel, 1983; Fei et al., 2009) canbe written as
ηg
fRim < 1, (2)
where Rim is the Richardson number of the saturatedatmosphere:
Rim =
g
θse
Γm
Γd
∂θse
∂z(∂V
∂z
)2. (3)
The symbols ηg and f denote the absolute andgeostrophic vorticities, Γm and Γd denote the moistand dry adiabatic lapse rates, and θse denotes the sat-urated equivalent potential temperature. The defini-tion of Rim ensures that Rim < 0 (or equivalentlyηg
fRim < 0) represents unstable stratification of the
saturated atmosphere, while Rim > 0 (ηg
fRim > 0)
represents stable stratification. Atmospheric stratifi-cation and CSI can therefore be analyzed using thedistribution of
ηg
fRim.
Figure 15 shows vertical cross-sections ofηg
fRim
along 38◦N. The atmospheric stratification was basi-cally stable during this event except for at low levelsahead of the cold front (between 115◦ and 120◦E) andover North China, where the atmosphere was convec-tively unstable below approximately 800 hPa. Thisconvectively unstable region was the deepest at 0600UTC 3 November, when it extended upward to 700hPa. In contrast with the evolution of water vapor fluxconvergence, this convective instability was largely at-tributable to the transport and lifting of moist airahead of the cold front, which led to ∂θse/∂z < 0. Thisconvective instability promoted the formation and per-sistence of low-level upward motion during the storm.
The convective instability region was capped by
620 ACTA METEOROLOGICA SINICA VOL.27
Fig. 14. As in Fig. 13, but for the (a1–a4) zonal component (Qx) and (b1–b4) meridional component (Qy) of the
Q-vector (10−10 m Pa−1 s−3).
NO.5 WANG Donghai, DUAN Yihong, LIU Ying, et al. 621
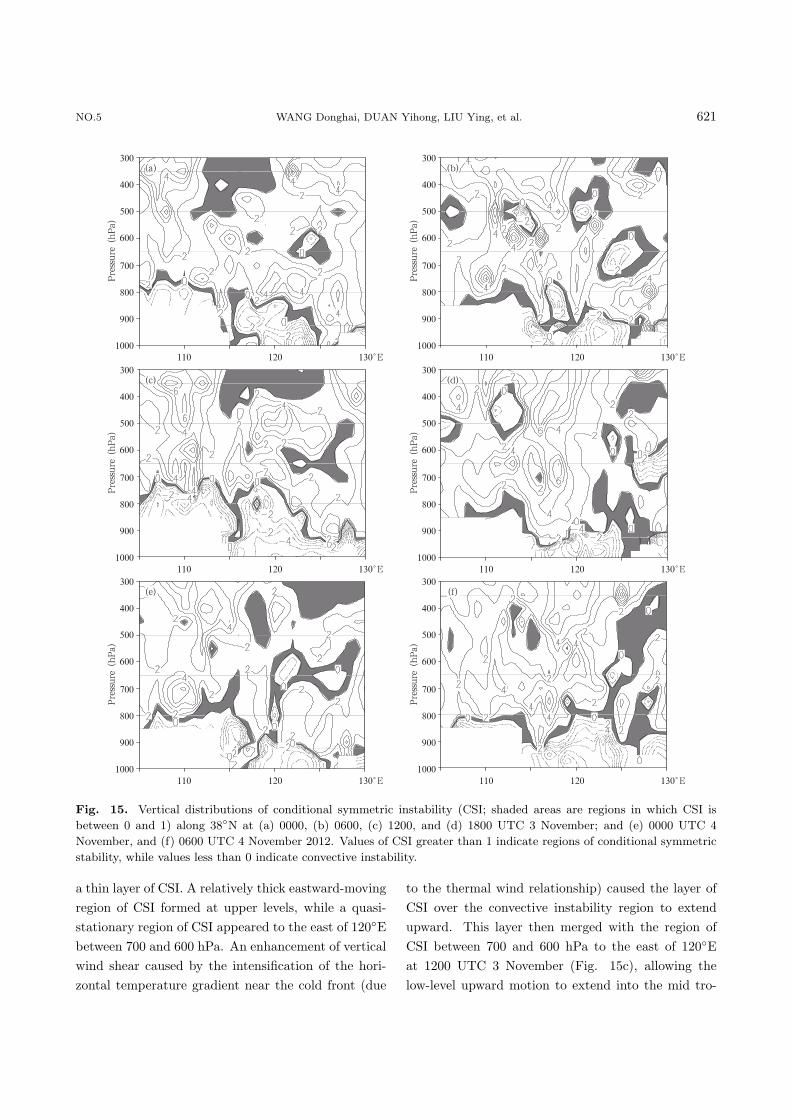
Fig. 15. Vertical distributions of conditional symmetric instability (CSI; shaded areas are regions in which CSI is
between 0 and 1) along 38◦N at (a) 0000, (b) 0600, (c) 1200, and (d) 1800 UTC 3 November; and (e) 0000 UTC 4
November, and (f) 0600 UTC 4 November 2012. Values of CSI greater than 1 indicate regions of conditional symmetric
stability, while values less than 0 indicate convective instability.
a thin layer of CSI. A relatively thick eastward-movingregion of CSI formed at upper levels, while a quasi-stationary region of CSI appeared to the east of 120◦Ebetween 700 and 600 hPa. An enhancement of verticalwind shear caused by the intensification of the hori-zontal temperature gradient near the cold front (due
to the thermal wind relationship) caused the layer ofCSI over the convective instability region to extendupward. This layer then merged with the region ofCSI between 700 and 600 hPa to the east of 120◦Eat 1200 UTC 3 November (Fig. 15c), allowing thelow-level upward motion to extend into the mid tro-
622 ACTA METEOROLOGICA SINICA VOL.27
posphere. The layer between 800 and 600 hPa overNorth China became conditionally symmetric stableat 1800 UTC 3 November (Fig. 15d); however, theCSI ahead of the cold front intensified and extendedupward 9 h later. This layer of CSI subsequently con-nected with regions of CSI between 700 and 600 hPa,and eventually even those above 500 hPa after 0600UTC 4 November. This process favored the formationof deep slantwise updrafts.
These results indicate that the atmosphere wasgenerally stably stratified during this event except forat low levels ahead of the cold front, where signifi-cant transport and lifting of moist air led to the for-mation of convective instability. The strengtheningof the horizontal temperature gradient near the coldfront enhanced the vertical wind shear, which causedthe region of CSI over the low-level convectively un-stable region to expand upward. The merger betweenthis expanding region of CSI and a region of CSI atupper levels created favorable conditions for the for-mation of deep slantwise updrafts.
6. Conclusions
The first mixed rain-snow storm in North Chinain 2012 was characterized by strong precipitation,broad spatial extent, earlier-than-normal occurrenceof snowfall, coexistence of precipitating hydrometeorsof multiple phases, dramatic temperature drop, andgale-force winds. The intensity of the precipitationassociated with this storm was particularly extreme.It is therefore necessary to understand the causes andmechanisms underlying the formation of this storm.The conclusions of our analysis are as follows.
(1) The Arctic Oscillation (AO) was in negativephase throughout October 2012, with an AO index ofless than –2 even during 1–3 November 2012. Thisprolonged negative phase was abnormal among recentyears, and suggested the occurrence of strong south-ward cold air incursions prior to the development ofthis storm. The shift to a negative AO index occurredrelatively early in 2012 with a strong intensity anda long duration. This situation corresponded to anabnormally early and abnormally intense first mixed
rain-snow storm over North China in 2012.(2) The cause of this storm was similar to that
of many historical persistent severe rainfall events inthis region. The intensity of local precipitation waslargely due to both the relative intensity of the associ-ated cyclonic system and the tendency of this systemto hold a stable position in this region for a relativelylong time. The primary cause of the stability and per-sistence of the cyclone that influenced this event wasthe decrease in the number of long waves located up-stream of North China. An analysis of the 500-hPaatmospheric circulation shows that two ridges (one lo-cated over the Barents Sea and the other located to itsnortheast) merged, causing the number of long wavesto decrease. The Rossby wave equation indicates thatthis merger caused a reduction in the wave velocity.This reduction of the speed of long wave movement atupper levels resulted in the cyclone stagnating and in-tensifying largely over North China during 3–4 Novem-ber 2012.
(3) An Ω-shaped blocking over the East Asia-western Pacific region obstructed the eastward move-ment of the upstream westerly trough. This block-ing and the rapidly-formed low pressure system toits south constituted a very stable high-low pres-sure dipole during 3–4 November. The correspond-ing surface cyclone system remained steady for a rela-tively long time over Beijing and its surrounding areas,thereby causing a historically rare severe precipitationevent in this region.
(4) An upper-level westerly trough existed priorto the development of the cyclone. Positive vorticityadvection at the leading edge of this trough promotedthe rapid development of the cyclone, with strongbaroclinility at lower levels associated with the coldfront formed by a strong southward incursion of coldair. These distributions of temperature and pressureand the gradual convergence of the upper-level andlower-level cyclonic circulations triggered the energyassociated with baroclinic instability at lower levels,resulting in the rapid development of the cyclone. Thedevelopment of this storm thus followed the classical“second type” development mechanism for extratrop-ical cyclones.
NO.5 WANG Donghai, DUAN Yihong, LIU Ying, et al. 623
(5) The supply of water vapor during this stormwas extremely advantageous to the occurrence of se-vere precipitation. First, there was significant mois-ture transport into North China before the arrival ofthe cold air, so the water vapor content of the airwas relatively high. Second, the intrusion of cold airinto North China strengthened the slow-moving cy-clone. The associated counterclockwise rotation of thecold front narrowed the band of water vapor flux con-vergence located along the leading edge of the front,especially during the late stage of cyclone develop-ment. Third, the cyclone imported a steady flow ofwater vapor from the nearby ocean, creating extremelyfavorable conditions for severe rainfall in this region.Finally, the ascending motion that preceded the coldfront provided a mechanism for lifting the moist air.
(6) A diagnostic analysis of vertical motion usingthe quasi-geostrophic ω equation shows that the as-cending motion associated with the front was largelygenerated by the quasi-geostrophic (i.e., large-scale)circulation. Further examination of the componentsof the quasi-geostrophic Q-vector indicates that ad-vection of positive vorticity and warm temperaturehad a key influence on the formation and subsequentdevelopment of the ascending motion ahead of thefront.
(7) Water vapor transport and lifting near thefront destabilized the lower-level atmospheric stratifi-cation, enhancing the ascending motion ahead of thefront. At the same time, strong temperature advec-tion caused by the strengthening of the front enhancedthe vertical wind shear at upper levels. This enhance-ment raised the upper boundary of the lower-levelregion of conditional symmetric instability (which wasin turn located above a region of low-level convectiveinstability). The merger of this lower-level region ofconditional symmetric instability with a pre-existingupper-level region of conditional symmetric instabil-ity established a favorable environment for ascendingmotion throughout the troposphere.
To summarize, the following major factors led toanomalously strong precipitation intensity over NorthChina during the rain-snow storm of 3–5 November2012: (1) the decrease in the traveling speed of the
westerly trough caused by changes in the upstreamcirculation; (2) the blocking effect of the downstreamwesterly trough; (3) a strong southward incursion ofcold air; (4) an abundant supply of water vapor; and(5) favorable atmospheric stratification. However, theinvestigation presented here remains relatively prelim-inary and in-depth research on several aspects of theevent is still required.
A further study of the formation and causal mech-anisms for this event, particularly a quantitative anal-ysis of the upstream effects that cause the cyclone toremain steady over North China is needed. This willinvolve additional analysis of the long wave propaga-tion speed based on the Rossby wave equation, as wellas examination of the steering effects exerted by theselong waves on the surface cyclone. We will presenta detailed discussion of the characteristics of cyclonegenesis and development in a follow-up paper.
Further exploration of the multi-scale interac-tions during this storm, particularly with respect tomedium- and long-term advance variables such as theAO index. The focus of this future research will beto ascertain the quantitative predictability of futurestorms of this type.
Development of a guidance forecast model isplanned for extratropical cyclone evolution, as hasbeen previously done for typhoon intensity and track.We will then couple this model with global and re-gional numerical forecast models with the aim ofimproving the accuracy of operational forecasts ofextratropical cyclone evolution over China.
Acknowledgments. The authors are gratefulto Prof. Ding Yihui and another reviewer for theirconstructive comments that have led to a significantlyimproved manuscript. The language editor for thismanuscript is Dr. Jonathon S. Wright.
REFERENCES
Baldwin, M. P., and T. J. Dunkerton, 1999: Propagation
of the Arctic Oscillation from the stratosphere to the
troposphere. J. Geophys. Res., 104(D24), 937–946.
Bosart, L. F., and F. Sanders, 1986: Mesoscale structure
in the megalopolitan snowstorm of 11–12 February
624 ACTA METEOROLOGICA SINICA VOL.27
1983. Part III: A large-amplitude gravity wave. J.
Atmos. Sci., 43, 924–939.
Bosart, R. J., and S. C. Lin, 1984: Diagnostic analysis
of the Presidents’ Day snowstorm of February 1979.
Mon. Wea. Rev., 112, 2148–2177.
Cai Li’na, Sui Yingjiu, Liu Daqing, et al., 2009: Analysis
on an unusual snowstorm event caused by explosive
cyclone. Acta Scientiarum Naturalium Universitatis
Pekinensis, 45(4), 693–700. (in Chinese)
Cheng Xinxi, Lu Hancheng, Zhou Zugang, et al., 2000:
A Lagrangian diagnosis on a block case during the
1991 Meiyu period in the Changjiang-Huaihe region.
Chinese J. Atmos. Sci., 24(5), 649–659. (in Chi-
nese)
Deng Weitao and Sun Zhaobo, 2006: Variational analy-
sis of Arctic Oscillation and polar vortex in winter.
Journal of Nanjing Institute of Meteorology, 29(5),
613–619. (in Chinese)
Du Xiaoling, Gao Shouting, Xu Ke, et al., 2012: Study
on the synoptic features of strong freezing rain with
blocking pattern in Guizhou and conceptual model.
Torrential Rain and Disasters, 31(1), 15–22. (in
Chinese)
Emanuel, K. A., 1979: Inertial instability and mesoscale
convective systems. Part I: Linear theory of inertial
instability in rotating viscous fluids. J. Atmos. Sci.,
36, 2425–2449.
—–, 1983: On assessing local conditional symmetric in-
stability from atmospheric soundings. Mon. Wea.
Rev., 111(10), 2016–2033.
Fei Jianfang, Wu Rongsheng, and Song Jinjie, 2009:
Advances in synoptic analysis and application of
symmetric instability theory. Journal of Nanjing
University (Natural Sciences), 45(3), 323–333. (in
Chinese)
Gong Daoyi and Wang Shaowu, 2003: Influence of Arc-
tic Oscillation on winter climate over China. Acta
Geographica Sinica, 58(4), 559–568. (in Chinese)
Grim, J. A., R. M. Rauber, M. K. Ramamurthy, et al.,
2007: High-resolution observations of the trowal-
warm-frontal region of two continental winter cy-
clones. Mon. Wea. Rev., 135, 1629–1646.
Hou Ruiqin, Zhang Yingxin, Fan Junhong, et al., 2011:
Diagnoses of heavy snowstorm in Hebei Province in
late autumn of 2009. Meteor. Mon., 37(11), 1352–
1359. (in Chinese)
Li, L., C. Y. Li, and J. Song, 2012: Arctic Oscilla-
tion anomaly in winter 2009/2010 and its impacts
on weather and climate. Sci. China (Earth Sci.),
55(4), 567–579.
Li Zhaohui, Wang Donghai, Wang Jianjian, et al., 2011:
Analysis on frontogenesis function and jet-front sec-
ondary circulation in a snowstorm process. Plateau
Meteor., 30(6), 1505–1515. (in Chinese)
Liu Ningwei, Qi Linlin, and Han Jiangwen, 2009: The
analyses of an unusual snowstorm caused by the
northbound vortex over Liaoning Province in China.
Chinese J. Atmos. Sci., 32(2), 274–284. (in Chi-
nese)
Ma Xiuling, Peng Jiuhui, Yang Leibin, et al., 2008: Anal-
ysis of a local snow storm in spring of 2007 in North
China. Arid Meteor., 26(1), 64–68. (in Chinese)
Martin, J. E., 1998a: The structure and evolution of a
continental winter cyclone. Part I: Frontal structure
and the occlusion process. Mon. Wea. Rev., 126,
303–328.
—–, 1998b: The structure and evolution of a continental
winter cyclone. Part II: Frontal forcing of an ex-
treme snow event. Mon. Wea. Rev., 126, 329–348.
McIntyre, M. E., 1970: Diffusive destabilization of the
baroclinic circular vortex. Geophys. Fluid Dyn.,
1(1-2), 19–57.
Moore, J. T., and P. D. Blakley, 1988: The role of
frontogenetical forcing and conditional symmetric
instability in the midwest snowstorm of 30–31 Jan-
uary 1982. Mon. Wea. Rev., 116, 2155–2171.
Palmen, E., and C. W. Newton, 1969: Atmospheric Cir-
culation Systems. Academic Press, 603 pp.
Petterssen, S., 1956: Weather Analysis and Forecasting,
2nd ed., Vol. 1. McGraw-Hill, New York, 428.
Sanders, F., 1986: Frontogenesis and symmetric stability
in a major new England snowstorm. Mon. Wea.
Rev., 114, 1847–1862.
Sun Jing, Lou Xiaofeng, and Xu Zhijin, 2009: Numerical
simulation of snowfall in winter of Qilian mountains.
Part I: Snowfall process and orographic influence.
Plateau Meteor., 28(3), 485–495. (in Chinese)
Stone, P. H., 1966: On non-geostrophic baroclinic stabil-
ity. J. Atmos. Sci., 23(4), 390–400.
Tao Zuyu, Zheng Yongguang, and Zhang Xiaoling, 2008:
Southern China quasi-stationary front during ice-
snow disaster of January 2008. Acta Meteor. Sinica,
66(5), 850–854. (in Chinese)
Thompson, D. W. J., and J. M. Wallace, 1998: The Arctic
Oscillation signature in the wintertime geopotential
height and temperature fields. Geophys. Res. Lett.,
25, 1297–1300.
NO.5 WANG Donghai, DUAN Yihong, LIU Ying, et al. 625
Uccellini, L. W., D. Keyser, K. F. Brill, et al., 1985:
The Presidents’ Day cycle of 18–19 February 1979:
Influence of upstream trough amplification and as-
sociated tropopause folding on rapid cyclogenesis.
Mon. Wea. Rev., 113, 962–988.
Wang Donghai, Liu Chongjian, Liu Ying, et al., 2009:
A preliminary analysis of features and causes of the
snow storm event over the southern areas of China
in January 2008. Acta Meteor. Sinica, 23(3), 374–
386.
Wu Guhui, Peng Fang, Cui Ting, et al., 2012: Analysis
of Guizhou’s rare freezing catastrophic weather in
winter 2011. Meteor. Mon., 38(3), 291–299. (in
Chinese)
Wu Wei, Deng Liantang, and Wang Shigong, 2011: A
numerical simulation of snowstorm in North China
during 9–11 November 2009 and its cloud micro-
physics. Meteor. Mon., 37(8), 991–998. (in Chi-
nese)
Xia Rudi, Wang Donghai, and Zhang Lisheng, 2013:
Characteristics of the wind field in the lower tro-
posphere and atmospheric stratification of the first
snowfall over North China in winter 2009. Climatic
Environ. Res., 18, 87–100. (in Chinese)
Ye Chen, Wang Jianjie, and Zhang Wenlong, 2011: For-
mation mechanism of the snowstorm over Beijing in
early winter of 2009. J. Appl. Meteor. Sci., 22(4),
398–410. (in Chinese)
Zhang Cunjie, Song Lianchun, and Li Yaohui, 2004: Ad-
vances on the research of East Asian blocking highs
in summer. Acta Meteor. Sinica, 62(1), 119–127.
(in Chinese)
Zhang Yingxin, Zhang Shoubao, Pei Yujie, et al., 2011:
Diagnostic analysis on snowstorm process in North
China in November 2009. Plateau Meteor., 30(5),
1204–1212. (in Chinese)
Zhang Yuanchun, Sun Jianhua, and Fu Shenming, 2012:
Analysis of vorticity during vortex producing snow-
storm in North China in winter. Plateau Meteor.,
31(2), 387–399. (in Chinese)
Zhao Guixiang, Cheng Linsheng, and Li Xinsheng, 2007:
The dynamical diagnosis of snowstorm over North
China in December 2004. Plateau Meteor., 26(3),
615–623. (in Chinese)
Zhou Xuesong and Tan Zhemin, 2008: Case study on
development mechanism of a snowstorm over North
China. Meteor. Mon., 34(1), 18–26. (in Chinese)
Zhu Qiangen, Lin Jinrui, Shou Shaowen, et al., 2007: The
Principles and Methodology of Synoptic Meteorology.
China Meteorological Press, 649 pp. (in Chinese)