Embed Size (px)
Citation preview
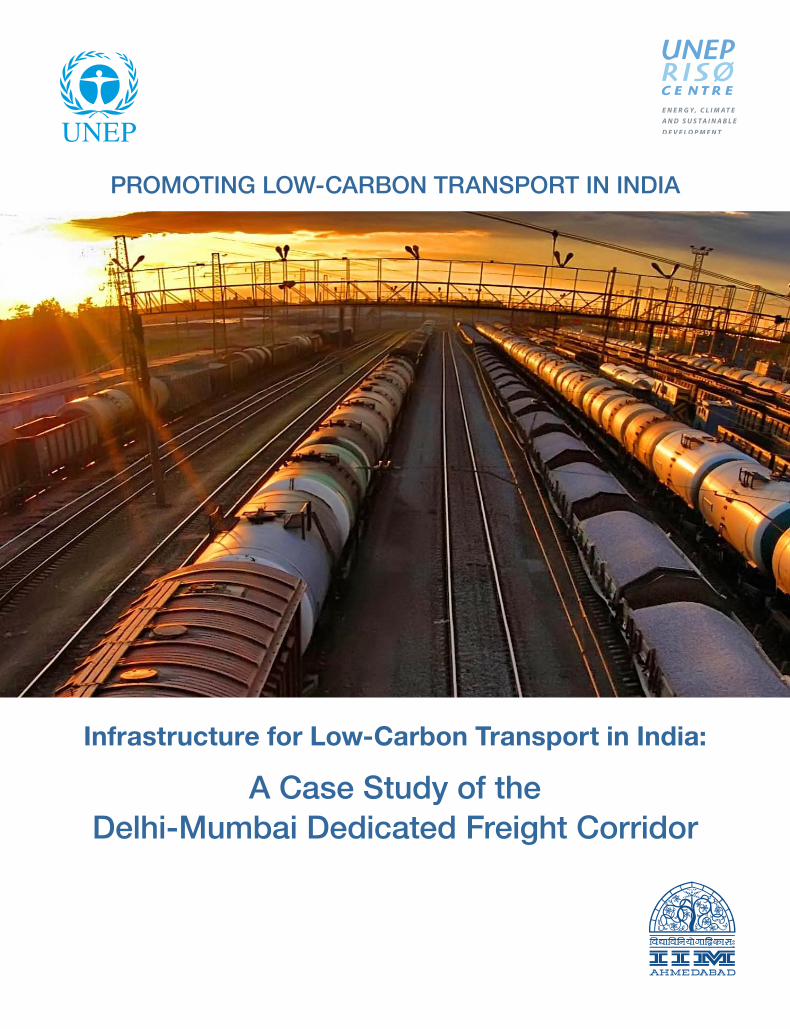
PROMOTING LOW-CARBON TRANSPORT IN INDIA
Infrastructure for Low-Carbon Transport in India:
A Case Study of theDelhi-Mumbai Dedicated Freight Corridor


PROMOTING LOW-CARBON TRANSPORT IN INDIA
Infrastructure for Low-Carbon Transport in India:
A Case Study of the Delhi-Mumbai Dedicated Freight Corridor
Authors
Prof Prem PangotraIndian Institute of Management, Ahmedabad
Prof P R ShuklaIndian Institute of Management, Ahmedabad
August 2012

UNEP Risø Centre on Energy, Climate and Sustainable DevelopmentTechnical University of Denmark
This publication is part of the ‘Promoting Low-carbon Transport in India’ project
ISBN: 978-87-92706-69-0
Design and production:
Magnum Custom PublishingNew Delhi, [email protected]
Photo acknowledgement:All images sourced from www.Colourbox.com
Disclaimer:
The findings, suggestions and conclusions presented in the case study are entirely those of the authors and should not be attributed in any manner to UNEP Risoe Centre or the United Nations Environment Program, nor to the institutions of individual authors.

iii
Acknowledgements
We wish to thank Dr. Subash Dhar and Dr. Jorge Rogat from the UNEP Risø Centre, and Ms. Kamala
Ernest from the UNEP, for their active involvement at various stages of the case study as well as during
the project workshops. We appreciate their valuable inputs in preparation of the final report.
We are especially grateful to Mr. P. N. Shukla, Director, Dedicated Freight Corridor Corporation Limited
(DFCCIL), and Mr. Rajesh Jain, General Manager, DFCCIL, for insightful discussions on the case study
and for providing us relevant information on the Dedicated Freight Corridor project. They shared important
project documents with us and their support was vital for completion of this case study. A special thanks
to Mr. Alexander Veitch, the International Union of Railways (UIC) for his valuable comments and inputs.
We would also like to thank our research associates Mr. Parth Vaidya, Ms. Trishita Roy and
Ms. Vidhee Avashia for excellent research support during the study. We are thankful to Ms. Josephine
Basch, Ms. Annemarie Kinyanjui and Ms. Surabhi Goswami for providing valuable editorial inputs during
preparation of the final report.
Prof Prem Pangotra Prof P. R. ShuklaIndian Institute of Management, Indian Institute of Management,Ahmedabad Ahmedabad
August 2012


v
Contents
Acknowledgements iii
List of Tables and Figures vii
Abbreviations ix
1. Background 1
1.1 Context 1
1.2 Case study 1
1.3 Focus on CO2 emissions 2
1.4 Focus on long-term assessment 3
2. Overview of Freight Transport in India 5
2.1 Past trends and future projections 5
2.2 Infrastructure gaps and future challenges 7
2.3 Proposed Dedicated Freight Corridors (DFCs) 7
2.4 Global experience of DFCs 9
3. The Delhi-Mumbai Dedicated Freight Corridor 11
3.1 Objectives and scope of the DFC project 11
3.2 Implementation strategies 12
3.3 Project plans and projected performance 13
3.4 Governance and management structure 16
3.5 The Delhi-Mumbai Industrial Corridor (DMIC) 17

vi
4. Assessment of CO2 Emissions 21
4.1 Approach 21
4.2 Methodology 21
4.3 Alternative scenarios 23
4.4 Future traffic projections 24
4.5 Estimation of fuel consumption 25
4.6 Future energy demand 26
4.7 Estimation of CO2 emission factors 28
4.8 Future CO2 emissions 29
5. Findings and Conclusions 33
5.1 Reduction of CO2 emissions from the western DFC 33
5.2 Potential reduction of CO2 emissions from six DFCs 33
5.3 Potential for climate financing 34
5.4 Impacts on regional development 35
5.5 Conclusions 35
References 37
Annexure 39
A: Freight traffic movement by rail and road (1950–2010) 39
B: Freight traffic by mode (2007–08) 39
C: Future projection of freight traffic 39
D: Design features 40
E: Organization structure 41
F: Proposed transport infrastructure for DMIC 42
G: Future energy requirement 42
H: Map showing western DFC, DMIC region and other DFCs 43
vii
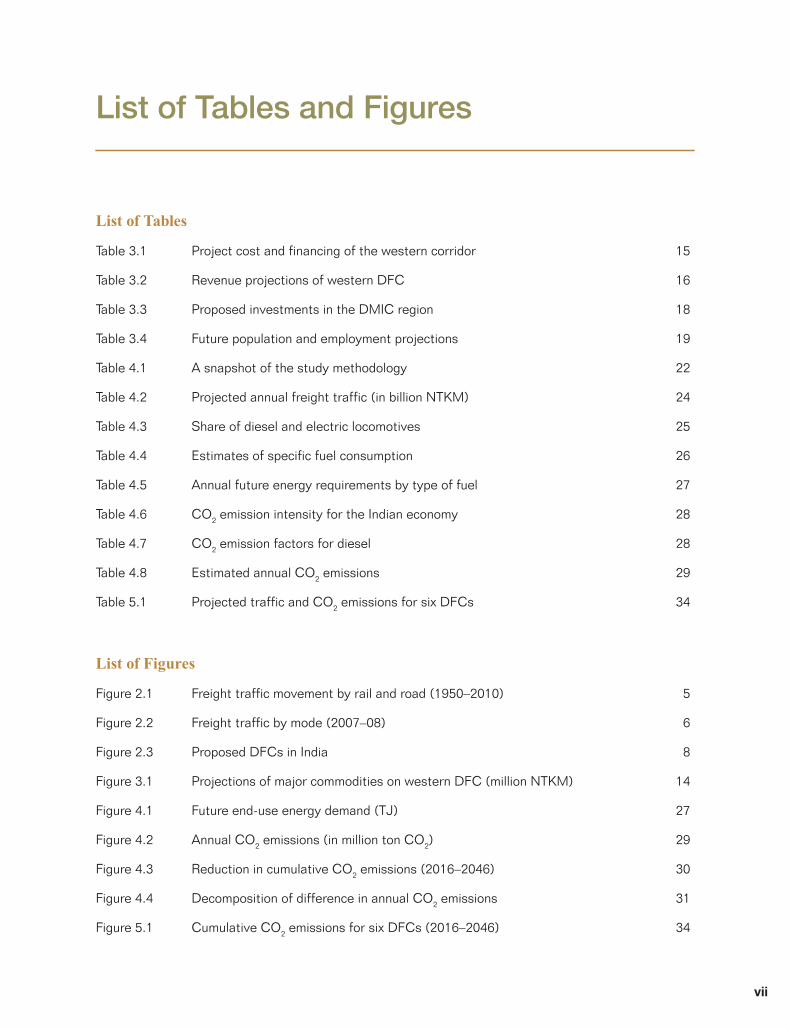
List of Tables
Table 3.1 Project cost and financing of the western corridor 15
Table 3.2 Revenue projections of western DFC 16
Table 3.3 Proposed investments in the DMIC region 18
Table 3.4 Future population and employment projections 19
Table 4.1 A snapshot of the study methodology 22
Table 4.2 Projected annual freight traffic (in billion NTKM) 24
Table 4.3 Share of diesel and electric locomotives 25
Table 4.4 Estimates of specific fuel consumption 26
Table 4.5 Annual future energy requirements by type of fuel 27
Table 4.6 CO2 emission intensity for the Indian economy 28
Table 4.7 CO2 emission factors for diesel 28
Table 4.8 Estimated annual CO2 emissions 29
Table 5.1 Projected traffic and CO2 emissions for six DFCs 34
List of Figures
Figure 2.1 Freight traffic movement by rail and road (1950–2010) 5
Figure 2.2 Freight traffic by mode (2007–08) 6
Figure 2.3 Proposed DFCs in India 8
Figure 3.1 Projections of major commodities on western DFC (million NTKM) 14
Figure 4.1 Future end-use energy demand (TJ) 27
Figure 4.2 Annual CO2 emissions (in million ton CO2) 29
Figure 4.3 Reduction in cumulative CO2 emissions (2016–2046) 30
Figure 4.4 Decomposition of difference in annual CO2 emissions 31
Figure 5.1 Cumulative CO2 emissions for six DFCs (2016–2046) 34
List of Tables and Figures


ix
Abbreviations
ADB Asian Development Bank
ARAI Automotive Research Association of India
BAU Business-as-Usual
CDM Clean Development Mechanism
CEA Central Electricity Authority
CEPT Center for Environmental Planning and Technology
CER Certified Emission Reduction
CGCF Copenhagen Green Climate Fund
CO2 Carbon Dioxide
CO2e Carbon Dioxide equivalent
DFC Dedicated Freight Corridor
DFCCIL Dedicated Freight Corridor Corporation of India Limited
DFID Department for International Development
DIPP Department of Industrial Policy and Promotion
DMIC Delhi-Mumbai Industrial Corridor
DMRC Delhi Metro Rail Corporation
E&Y Ernst & Young
FIDIC Federation Internationale Des Ingenieurs-Conseils
GDP Gross Domestic Product
GHG Green House Gases
GoI Government of India
GoJ Government of Japan
GQ Golden Quadrilateral
GTKM Gross Ton Kilometer
IA Industrial Area
IIM-A Indian Institute of Management, Ahmedabad
IIT-D Indian Institute of Technology, Delhi
IL&FS Infrastructure Leasing and Financial Services
INR Indian Rupee
IPCC Intergovernmental Panel for Climate Change

x
IR Investment Region
JICA Japanese International Cooperation Agency
JNPT Jawaharlal Nehru Port Trust
KWh Kilo Watt hour
LC Low Carbon
LCT Low Carbon Transport
LIBOR London Interbank Offered Rate
METI Ministry of Economy, Trade and Industry
MMLP Multi-Modal Logistics Park
MoCI Ministry of Commerce and Industry
MoEF Ministry of Environment and Forests
MoR Ministry of Railways
Mwh Megawatt hour
NAPCC National Action Plan for Climate Change
NTKM Net Ton Kilometer
PPMV Parts per million by volume
PPP Public Private Participation
Ro-Ro Roll-on-Roll-off
SPV Special Purpose Vehicle
T Tons
TAC Track Access Charge
UNEP United Nations Environment Programme
UNFCCC United Nations Framework Convention on Climate Change
URC UNEP Risø Centre
US $ US Dollar

1Promoting low carbon transPort in india
Infrastructure for Low-Carbon Transport in India: A Case Study of the Delhi-Mumbai Dedicated Freight Corridor
1.1 Context
This study is part of a larger research project on “Promoting Low-Carbon Transport in India”, a major initiative of the United Nations Environment Programme (UNEP), hereafter referred to as the Low Carbon Transport (LCT) project in this document. The overall context in which the LCT project has been undertaken is the critical role of the transport sector in reducing greenhouse gas (GHG) emissions. India is currently the fourth largest GHG emitter in the world, although its per capita emissions are less than half of the world’s average. Further, India’s transport sector accounts for 13% of the country’s energy related CO2 emissions (MoEF, 2010). It is evident that opportunities exist to make India’s transport growth more sustainable by aligning development and climate change agendas. India’s National Action Plan for Climate Change (NAPCC) recognizes that GHG emissions from transport can be reduced by adopting a sustainability approach through a combination of measures such as increased use of public transport, higher penetration of bio-fuels, and enhanced energy efficiency of transport vehicles.
The key objectives for the LCT project are as follows:
1. Delineating an enabling environment for coordinating policies at the national level to achieve a sustainable transport system
2. Enhancing capacity of cities to improve mobility with lower CO2 emissions
The LCT project has been endorsed by the Ministry of Environment and Forests (MoEF), Government of India. It is being jointly implemented by the UNEP Risø Centre, Denmark (URC); Indian Institute of Technology, Delhi (IIT-D); Indian Institute of Management, Ahmedabad (IIM-A); and CEPT University, Ahmedabad.
The case study of the Delhi-Mumbai Freight Corridor is one of the four case studies being carried out under the LCT project. These studies cover transportation projects under implementation in India for passenger and freight transport. The objective of these case studies is to explain the economic, social and environmental impacts of selected transportation projects. While the current case study deals with freight transport, the other three studies are all related to passenger transport and cover Metro projects, Bus Rapid Transit projects and Non-motorized transport projects. All of the above mentioned projects are perceived by policymakers as interventions that can contribute to sustainable development.
1.2 Case study
This study is based on the premise that large infrastructure projects, such as the proposed Dedicated Freight Corridor (DFC), are critical drivers of the national economy and have major implications for achieving low-carbon development goals. The focus of the study is not whether or not to undertake the DFC project, but rather whether the DFC project would simultaneously promote sustainable development and reduce carbon emissions. In that respect, it could be a model project for aligning climate change strategies and development policies in the long run. Similarly, other large infrastructure projects of this
1.Background
2Promoting low carbon transPort in indiaInfrastructure for Low-Carbon Transport in India: A Case Study of the Delhi-Mumbai Dedicated Freight Corridor
type could create a strategy framework for pursuing the goals of low-carbon transport and sustainable development, which in turn could form the basis of a low-carbon society. This is an exploratory study that may help to identify the important linkages of this framework.
Purpose
The broad purpose of this study is to examine the implications of the proposed DFC project for achieving the twin goals of sustainable development and low-carbon growth. The main goals of sustainable development are economic efficiency, sustainable growth (conserving resources, energy security, and energy efficiency) and inclusiveness. The major goal for low-carbon growth is to reduce GHG emissions in order to achieve global targets for minimizing threats of climate change. Energy efficiency gains associated with rail freight corridors are known to policymakers in India and were part of the motivation for the proposed DFC projects. However, the co-benefit of simultaneous reduction of GHG emissions is less understood. This study aims to provide a framework for long-term assessment of CO2 emission reduction from transport infrastructure projects like the proposed Delhi-Mumbai DFC.
Scope
This case study is broadly conceived to assess the potential of the Delhi-Mumbai DFC project for reducing GHG emissions. The decision by the Government of India to undertake this ambitious DFC project was primarily based on the rapidly rising demand for freight transport and the inability of the existing rail network to meet this demand. It was assumed that the DFCs would lead to higher economic efficiency, enhanced energy security and significant environmental benefits compared to the situation without the DFC project. However, no explicit analysis of these considerations is available and more elaborate studies would be required to understand each of these dimensions.
This study covers the following aspects of the proposed DFC project:
1. Overview of project plans and implementation strategy
2. Potential regional development benefits of the project
3. Assessment of CO2 emissions from the project in a Business-As-Usual (BAU) Scenario
4. Assessment of CO2 emissions from the project in a Low-Carbon (LC) Scenario
It is important to recognize that CO2 emissions would occur in both the construction and operations phase of the project. However, the emissions during the construction phase are short-term in nature; the current study focuses on long-term assessment. A time period of forty years has been considered in this study, from the fiscal year 2016-17 until 2046-47, which roughly coincides with the planned commissioning of the DFC project.
1.3 Focus on CO2 emissions
The assessment in this study is limited to CO2 emissions, while local air pollution is not considered; assessments of local air quality impacts would be inappropriate for a transportation project of this type. The proposed DFC would operate entirely on electric power. Therefore, to the extent that some of the electricity may be generated with fossil fuels, the resulting air pollutants would be emitted at the sites where the generation plants are located. Even in the scenario without the DFC, where some diesel

3Promoting low carbon transPort in india
Infrastructure for Low-Carbon Transport in India: A Case Study of the Delhi-Mumbai Dedicated Freight Corridor
locomotives would likely remain in use, the emissions are distributed along a long corridor and are not localized.
While local air pollution is an important dimension of sustainable development, neither the choice of energy sources nor the vulnerability of local population to air pollution can be directly linked to a project like the DFC. On the other hand, CO2 emissions contribute to the global problem of climate change, no matter where the source of emissions is. Therefore, it is reasonable to aggregate both GHG emissions and local air pollutants at the national level in order to understand policy choices and trade-offs. Those are not valid concerns at the project level for a project of this nature. This case study would form one of the inputs for the national level integrated assessment of transport sector emissions in India, which is a separate study being carried out under the project on “Promoting Low-Carbon Transport in India”.
1.4 Focus on long-term assessment
The focus of this case study is long-term assessment of CO2 emissions associated with the proposed dedicated freight corridor project. Assessments at the DFC project level have an inherent limitation because many macro transitions cannot be captured precisely at the project level. For example, changes in the national energy system such as the electricity grid-mix or new technologies dealing with emissions could be wrongly attributed to the particular project, especially when the assessment period is short. In long-term assessments some of these macro changes also enter the baseline scenarios so that net change in emissions is attributable to specific projects.
Since our methodology is linked to a separate Integrated Energy-Economy model for India, the macro transitions are exogenously specified for different scenarios. The importance of long-term perspective arises because of the long life of transport assets. Some of the projects with high CO2 reduction potential, like the dedicated freight corridors, would likely be implemented even under a business-as-usual scenario. However, a long assessment period provides the basis for deciding whether a project should be implemented sooner rather than later, within the context of global targets for reducing GHG emissions as agreed upon by the international community.
Finally, long-term assessments of specific projects provide a framework for aligning policies in various sectors, such as energy, infrastructure, transport and environment, in order to realize larger co-benefits and avoid adverse lock-ins.


5Promoting low carbon transPort in india
Infrastructure for Low-Carbon Transport in India: A Case Study of the Delhi-Mumbai Dedicated Freight Corridor
2.1 Past trends and future projections
When India became independent from the British Rule in 1947, it inherited a fairly large network of rail transport and a modest road network. The Indian Railways had a share of almost 90% in the inland movement of goods and there was significant investment in rail infrastructure initially. However, this was not sustained and, as a result, growth of freight movement by rail slowed down during the 1960s and 1970s. During the 1980s, the Indian Railways decided to discontinue small and wagonload traffic in order to concentrate on end-to-end transport of single commodity trainloads. While this resulted in significant growth of freight traffic by rail, the share of road transport in the total freight traffic started increasing at a faster rate (RITES, 2009).
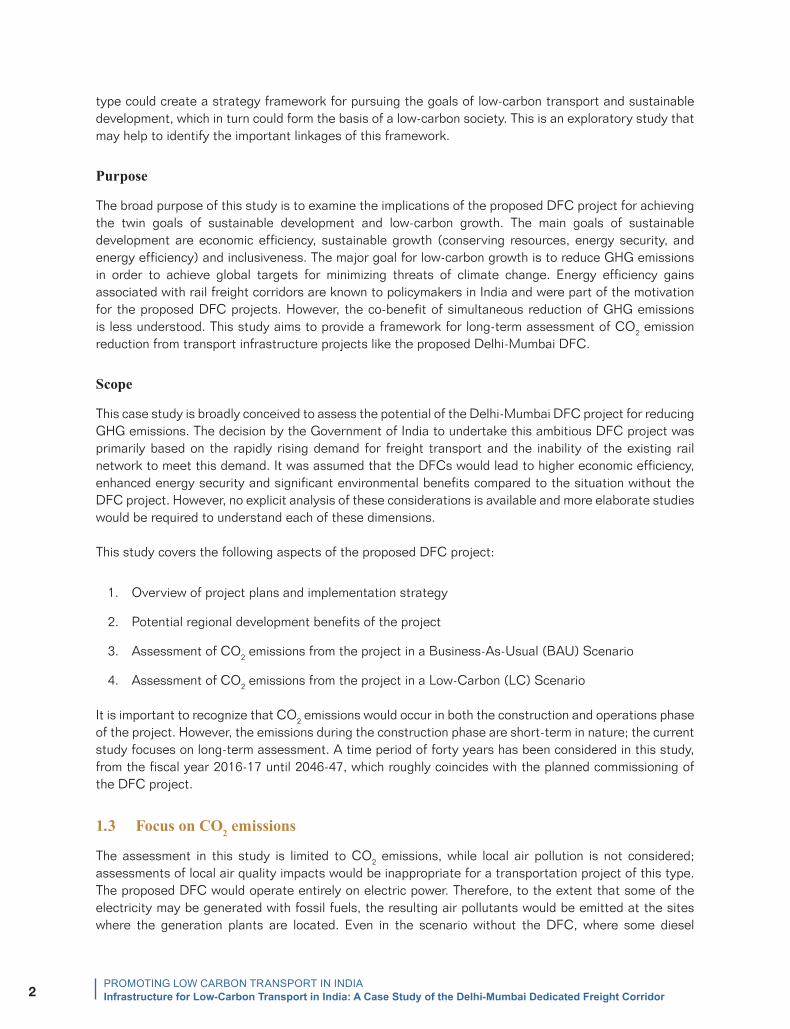
Figure 2.1 shows the relative share of rail and road in India’s freight transport sector for each decade since 1950. The relative share of rail in total freight traffic declined from 86.2% in 1960-61 to 63.5% in 1980-81 while the share of road increased from 13.8% to 36.5% over the same period. The 1980s saw significant growth in the freight traffic for both modes and their relative shares were quite stable. The maximum shift occurred in the 1990s when the share of rail declined from 62.6% at the beginning of the decade to 39.0% at the end, while that of road increased from 37.4% to 61.0%. This trend continued during the next decade and the gap between the two modes has continued to widen. In 2007-08, the relative share of rail and road in freight traffic movement was 33% and 67% respectively.
Figure 2.1 Freight traffic movement by rail and road (1950–2010)
Source: RITES (2009)
2.OverviewofFreightTransportinIndia
88 8673
64 63
39 33
12 1427
37 37
61 67
0%
10%
20%
30%
40%
50%
60%
70%
80%
90%
100%
1950-51 1960-61 1970-71 1980-81 1990-91 2000-01 2007-08
Rail Road

6Promoting low carbon transPort in indiaInfrastructure for Low-Carbon Transport in India: A Case Study of the Delhi-Mumbai Dedicated Freight Corridor
The share of Coastal Shipping, Inland Waterways and Airways in India’s freight transport sector has traditionally been quite small. However, there has been impressive growth in the quantum of freight carried by these modes during the last decade. Another significant recent development has been the use of pipelines for transport of petroleum products and natural gas. Large investments in pipeline infrastructure are being made in many regions of the country.
Figure 2.2 shows the total freight traffic carried by various modes in 2007-08. Road transport had the largest share in freight movement, accounting for 61% of total freight volume (measured in tons) and 50% of total freight traffic (measured in NTKM). In contrast to this, the share of railways was 30% of total freight volume and 36% of freight traffic. Coastal shipping and pipelines are also emerging as strong viable options in the sector, while the share of Inland waterways and Airways remain quite small.
Figure 2.2 Freight traffic by mode (2007–08)
Source: RITES (2009)
(a) Freight volume in Million Tons (2007-08)
(b) Freight traffic in Billion NTKM (2007-08) 36.1 %
50.1 %
6.1 %
0.0 % 0.2 %
7.5 %
0
100
200
300
400
500
600
700
800
Bill
ion
NTK
M
30.1 %
61.0 %
2.3 % 0.0 % 2.2 % 4.4 %
0
200
400
600
800
1000
1200
1400
1600
1800
Rail Road Coastal Shipping Airways Inland Waterway Pipelines
Rail Road Coastal Shipping Airways Inland Waterway Pipelines
Mill
ionT
ons

7Promoting low carbon transPort in india
Infrastructure for Low-Carbon Transport in India: A Case Study of the Delhi-Mumbai Dedicated Freight Corridor
A study conducted by RITES (2009) provides two sets of future projections for 52 major commodities in India’s freight traffic up to the year 2025-26. One set of projections is based on the assumption that the existing levels of rail and road shares in projected traffic would persist. The existing shares in terms of traffic volume are 33% for rail and 67% for road. The other set of projections are based on considering break-even distances for optimization of commodity flows for 11 major commodities. In this model, the share of rail in projected traffic volumes is expected to stabilize around 79% while that of road around 21% by 2025-26 (RITES, 2009). These projections are shown in Annexure C. The large difference in the relative shares of rail and road in the two sets of projections shows that the current pattern of commodity flows is clearly suboptimal. A possible explanation could be that road is perceived as a better option compared to rail in terms of level of service and service quality.
2.2 Infrastructure gaps and future challenges
India’s economy has seen unprecedented growth during the last decade, averaging 7-8% per annum. While this has created a great deal of opportunities, it has also resulted in many challenges especially for infrastructure required to sustain the rate of growth. Transport is viewed as one of the critical infrastructures for the economy. In national transport systems, freight transport acts as the critical link between ports, markets and manufacturing centres. According to an estimate by Indian Railways, elasticity of transport demand to GDP is 1.25. Therefore, GDP growth of 9% would translate into growth in transport demand of more than 11% (MoR, 2009).
On the other hand, it is also a fact that existing transport infrastructure has not kept pace with the growth in demand. The highway development projects have slowed down and the railway networks are highly congested. It is believed that line capacity utilization on existing trunk routes is far in excess of saturation capacity. The same network is concurrently used for passenger and freight transport, making it problematic for both. Lower average speed, unplanned halting of trains and outdated technologies reduce the operational efficiency of the system.
A report by McKinsey and company observes that “India’s logistic infrastructure is not adequately equipped to meet rapidly rising freight traffic, changing consumption patterns and increasing number of production centres” (McKinsey, 2010). The report states that DFCs are the most cost-effective way to add freight traffic capacity. According to a recent report from the Planning Commission, substantial addition to transport and logistics infrastructure would be required during the 12th Five-Year Plan period on account of planned new power capacity addition, increase in coal imports, and expected growth of manufacturing output (Planning Commission, 2012).
2.3 Proposed Dedicated Freight Corridors (DFCs)
There is increasing recognition among policymakers in India that transport infrastructure could become a serious bottleneck for future economic growth. This is particularly the case for freight transport as high growth in freight traffic is expected to continue in the medium and long-term. The idea of developing the dedicated rail corridors for freight movement was conceived in 2005 in a joint declaration by the Government of India and Japan. After studying its feasibility and obtaining necessary approvals, the Ministry of Railways established a Special Purpose Vehicle (SPV) – Dedicated Freight Corridor Corporation of India Limited (DFCCIL) – under the Companies Act in October, 2006.
The long-term strategic plan of the Ministry of Railways is to construct six high capacity, high-speed corridors along the Golden Quadrilateral and its diagonals. In the first phase, two corridors with a total

8Promoting low carbon transPort in indiaInfrastructure for Low-Carbon Transport in India: A Case Study of the Delhi-Mumbai Dedicated Freight Corridor
route length of about 3347 km have been approved. The Eastern DFC, with a route length of about 1800 km, would connect Dankuni in West Bengal to Ludhiana in Punjab. The Western DFC would connect Dadri in Uttar Pradesh to the Jawaharlal Nehru Port Trust (JNPT) near Mumbai, with a route length of about 1500 km. The Delhi–Mumbai Dedicated Freight Corridor, which is the subject of this study, will be hereafter referred to as the Western DFC. In the future, four more DFCs will be developed. Those are: East-West Corridor (2000 km), North-South Corridor (2173 km), East Coast Corridor (1100 km) and Southern Corridor (890 km). The proposed DFCs are shown in Figure 2.3.
Figure 2.3: Proposed DFCs in India
Source: DFCCIL (2011)

9Promoting low carbon transPort in india
Infrastructure for Low-Carbon Transport in India: A Case Study of the Delhi-Mumbai Dedicated Freight Corridor
2.4 Global experience of DFCs
Many countries around the world use rail infrastructure for “long haul operations”, which is another term for freight corridors, specifically built for transportation of bulk freight goods by railways. However, few countries have dedicated freight corridors. Among the ones that do, the most prominent are, Australia, South Africa, China, Netherlands and USA.
“Dedicated freight lines are rail lines whose planned use is restricted to freight trains only. A dedicated rail freight network would consist of an integral network of such lines, either newly constructed lines or existing lines converted to dedicated freight use, with adaptation where necessary” (Dirand, 2007). Conventional lines, conversely, operate with passenger and freight trains sharing the same infrastructure, which often results in conflicting priorities and reduced carrying capacity of the system.
In South Africa, the 861 km long Sishen-Saldanha railway line, known as the Ore Export Line, operates 4 km long trains carrying gross load of 41000 tons with 30T axle load (Kuys, 2011). Freight Railways in America, which are entirely privately owned, are among the cheapest in the world and one of the most efficient systems. Since its deregulation in the 1980s, the share of rail freight traffic in the USA has increased steadily. Although there are some dedicated corridors, much of the network is simultaneously used by Amtrak passenger services as required under current regulations. With future demand for freight traffic expected to grow at very high rates, the industry is worried about imminent conflict with intercity passenger rail services, which are also increasing rapidly (The Economist, 2010). Similarly, DFCs in Europe, such as the Betuweroute in the Netherlands, are focusing on serious issues of economic viability and integration with mixed traffic at linking nodes. The German DFC (NET 21) is an example of a well-planned project which is fully integrated with the passenger rail network (Das, 2005).
China has greatly expanded its rail network and new DFCs are being built to link hinterland areas with ports as well as to transport key resources between various production centres in the northern and southern regions. According to the “Medium and Long-Term Railway Network Plan”, passenger transport will be separated from freight transport on busy trunk lines by 2020. Although current expansion of the rail network in China is government financed, greater private sector participation is expected in coming years. Just like American Railways, China is also facing the difficult policy choices and uncertainties associated with deregulation of this sector for achieving market efficiency. While China is committed to rapidly expanding the rail freight network, their experience with DFCs has not been documented.
Overall, the global experience of DFCs shows that integration of DFCs with mixed traffic networks is problematic at the convergence points (nodes). These problems must be addressed with meticulous planning of networks and systems. The other major challenge is that of choosing between tight regulations and state control on one hand, and deregulation and free market competition on the other.


11Promoting low carbon transPort in india
Infrastructure for Low-Carbon Transport in India: A Case Study of the Delhi-Mumbai Dedicated Freight Corridor
3.1 Objectives and scope of the DFC project
The Western DFC is a part of the larger strategic plan of the Ministry of Railways to strengthen India’s rail transport infrastructure for freight movement. The DFC project was conceived against the backdrop of the expected growth of high future demand for freight transport in the region and the need to connect ports in Gujarat and Maharashtra to the manufacturing centres along the western corridor.
The Dedicated Freight Corporation of India Limited (DFCCIL), an SPV under the Ministry of Railways, was incorporated in 2006 and made responsible for planning, construction, maintenance and operation of the proposed DFCs. The Ministry of Railways holds 100% equity in the company. The company’s mission is to:
1. “Build a rail corridor with appropriate technology that enables Indian Railways to regain and enhance its market share of freight transport by creating additional capacity and guaranteeing efficient, reliable, safe and economical options for carriage of goods to its customers.” (IL&FS, 2011)
2. “Support the government’s initiatives towards ecological sustainability by encouraging users to adopt railways as the most environment friendly mode for their freight transport requirements.” (IL&FS, 2011)
The DFCCIL has identified the following as the key objectives of the Western DFC:
1. Reduce unit cost of transportation;
2. Create rail infrastructure to carry higher throughput per train;
3. Offer Indian Railway customers guaranteed faster transit at economic tariff;
4. Increase Indian Railway’s share in freight market;
5. Improve overall transport efficiency of national rail network
According to the company’s mandate, “DFC would be a complementary and not competitive corridor to Indian Railways as most of the traffic would continue to originate and terminate on Indian Railway’s network. Actual train operation including provision of motive power would continue to be vested in the Indian Railways and therefore DDFCCIL would not deal directly with freight customers or qualified operators. However, the DFCCIL would provide non-discriminatory access to freight trains belonging to Indian Railways and other qualified operators” (DFCCIL, 2011).
Subsequently, The DFCCIL has adopted a Corporate Social Responsibility Policy, a Corporate Environmental Policy and a Carbon Policy. These policies have implications in terms of expanding the scope of all future DFC projects. The key features of these policies are:
3.TheDelhi-MumbaiDedicatedFreightCorridor

12Promoting low carbon transPort in indiaInfrastructure for Low-Carbon Transport in India: A Case Study of the Delhi-Mumbai Dedicated Freight Corridor
1. Corporate Social Responsibility Policy (DFCCIL, 2011)
• To improve the quality of life of the workforce and their families as well as of the local community and society at large.
• Integrate social, environmental and ethical concerns into the company’s business processes.
2. Corporate Environmental Policy (DFCCIL, 2011)
• Integrated Environmental Management and Practices.
• Adopt efficient utilization of energy resources.
• Associate in direct activities towards environmental improvement through development of green belt and conservation of water resources.
• Make effort for preservation of ecological balance and heritage.
• Mitigation measures for noise, vibration and waste pollution.
3. Carbon Policy (DFCCIL, 2011)
• Shift of freight from road to the low-carbon intensive mode of rail transport.
• Inherent improvement in energy efficiency of freight rail through adoption of improved technologies.
• A low-carbon path adopting various technological options which can help DFCs operate in a more energy efficient fashion while exploring options to offset its own GHG emissions by investing low-carbon assets.
3.2 Implementation strategies
Construction of six dedicated freight corridors across the country is the most ambitious project ever conceived by Indian Railways. That also makes it the most challenging project to implement. In order to ensure the success of the DFC project on all critical parameters, the DFCCIL has formulated a well-planned implementation strategy based on the cumulative experience of the Indian Railways over many decades. The key elements of this strategy are summarized below (adopted from IL&FS, 2010):
1. Superior asset standards: The DFCs are being seen as an opportunity to adopt international best practices and innovation in technology, system and design, and business processes. The DFCCIL has adopted superior asset standards (higher axle load, higher capacity rolling stock, heavier rails, more efficient locomotives and traction systems, and centralized control) compared to Indian Railways. These would be more efficient and economical. (Annexure D)
2. Phase-wise execution: The Eastern and Western DFCs are scheduled to be fully commissioned by the year 2016-17. Since the traffic on the DFC would depend on its integration with the Indian Railways network, the phasing programme is being synchronized with the most saturated sections being taken up on priority.

13Promoting low carbon transPort in india
Infrastructure for Low-Carbon Transport in India: A Case Study of the Delhi-Mumbai Dedicated Freight Corridor
3. Landed acquisition: Not much land needs to be acquired since a major part of the DFC runs along the existing tracks of Indian Railways. For the remaining portion land will be acquired by the Ministry of Railways and given on license to DFCCIL. The process of acquisition is being managed by DFCCIL and it has its usual difficulties, though these obstacles are not as severe as those of the intra city rail systems.
4. Contracting strategy: In order to complete the construction work within the budgeted time and cost, the contracting strategy is of critical importance as it provides adequate/appropriate incentives and deterrents for contractors. DFCCIL is implementing its projects through design-build, lump sum, fixed time and cost contracts. Reputed firms with proven experience in similar works are preferred. DFCCIL hires consultants for all stages of project design, management and construction supervision up to the final stage of commissioning. Some projects are proposed to be implemented in public-private partnership mode.
There are a number of challenges and opportunities on the horizon for DFCCIL. For example, the Delhi-Mumbai Industrial Corridor (DMIC), which is being planned along the Western DFC, is a project with high potential for regional economic development. The DFCCIL would need to respond to many opportunities to become an active partner in sustainable development. Projects of the magnitude of the DFCs inevitably face environmental and social issues, which can be turned into opportunities with appropriate strategies. Conceptualizing all future DFC projects as low-carbon transport systems is one such challenge.
3.3 Project plans and projected performance
The Western DFC is a project under implementation and is the first dedicated freight corridor being built in India. This section looks at the projected performance of the Western DFC project’s key aspects as perceived by management and elaborated on in the company’s Business Plan, which is prepared by IL&FS consultants and officially adopted by DFCCIL.
Demand projections
As part of the Business Plan, detailed traffic projections have been made for the next thirty years. These are based on the assumption that the business strategy of the Indian Railways and DFCCIL would focus on consolidating dominance in commodities where rail has been the preferred mode. The most important commodities for freight transport by rail are coal, food grains, iron ore, iron & steel, cement and fertilizers.
The methodology for demand projections include commodity-wise growth projections, future regional plans for port capacity expansion, thermal power plants, anticipated coal requirement and supply linkages.
Figure 3.1 shows the projected traffic in NTKM for the Western DFC. The total traffic is projected to grow from 44 240 million NTKM in 2007-08 to 302 544 million NTKM in 2036-37. In fact, what is shown in the figure is the ‘targeted traffic’ and forms a part of the Business Plan of DFCCIL. It is based on commodity-wise projections and assumes proactive efforts by Indian Railways to attract traffic to the DFC (IL&FS, 2011).

14Promoting low carbon transPort in indiaInfrastructure for Low-Carbon Transport in India: A Case Study of the Delhi-Mumbai Dedicated Freight Corridor
Figure 3.1 Projections of major commodities on western DFC (million NTKM)
Source: Reproduced from the Business Plan of DFCCIL (IL&FS, 2011)
Note: DMIC refers to container traffic expected from the proposed Delhi-Mumbai Industrial Corridor
These demand projections have taken into consideration the following assumptions and strategies for attracting freight traffic to the DFC:
1. Large capacity expansions in cement and steel sectors along with potential for increasing the share of railways through aggressive marketing and efficient services;
2. Increase in rail share in port-based container traffic by 35-40% due to advantages of DFC;
3. Leveraging the benefits of DFC to induce modal shift in container traffic from road to rail;
4. Market share increase in container traffic through greater efforts by CONCOR, setting up of Multi-Modal Logistics Parks (MMLPs) and improving functional efficiency at ports and inland terminals;
5. Creation of new markets, especially growth in domestic container movement, automobile traffic and roll-on-roll-off (Ro-Ro) traffic.
Finally, to put these demand projections into a realistic perspective, it is important to recognize both the future possibilities and the accompanying uncertainties. The ability of the DFCCIL to actualize the strategies for increasing their market share is a critical assumption in these demand projections. No doubt, the future development of the Delhi-Mumbai Industrial Corridor can induce large volumes

15Promoting low carbon transPort in india
Infrastructure for Low-Carbon Transport in India: A Case Study of the Delhi-Mumbai Dedicated Freight Corridor
of additional freight traffic for the DFC. Conversely, expansion of pipeline infrastructure for carrying petroleum products would result in reduced traffic for DFC. Operation and cost efficiencies would be the most important determinants of demand in the long run.
Western DFC project costs
The total project completion cost of the Western DFC is estimated to be Rs. 384870 million in 2009-10 prices. This does not include the cost of land and rolling stock. Land for the Western DFC project will be acquired by Indian Railways and leased to DFCCIL. However, in the Business Plan of DFCCIL, cost of land has not been included in computation of project cost or the financial rate of return. Table 3.1 shows the cost structure of the Western DFC project and the proposed sources of financing.
Table 3.1 Project cost and financing of the western corridor
Project Cost and Financing Rupees3 (million)
a. Project Cost
• Construction costs 229560
• Cost escalation 63340
• Working capital 4990
• Insurance, taxes, contingencies, interest1 86980
Total 384870
b. Financing
• Loan from GoI2 264650
• Equity 68390
Total 333040
Note: 1 Contingencies at 5% of escalated construction cost, insurance & taxes at 7%2 Includes loan from JICA and World Bank3 Average Exchange Rate of US $ for the month of March, 2012 is 50.404 INR
It is assumed that the Western DFC project will be completed by 2017-18 and financed with loans from the World Bank and Japanese International Cooperation Agency (JICA), and equity contribution from Indian Railways. The loan from JICA will be in the form of a 7% loan in perpetuity with no principal repayment, while the loan from World Bank will carry an interest of LIBOR + 0.38% payable every six months. Indian Railways will provide equity to match the shortfall between the project cost (excluding cost of land) and loans from World Bank and JICA (IL&FS, 2011).
Revenue projections
DFCCIL’s role is primarily that of the infrastructure provider for the Indian Railways, to enable them to run trains on the DFC, which are constructed, maintained and operated by the DFCCIL. The only source of revenue for the DFCCIL would be the user charge, termed Track Access Charge (TAC), to be paid by the Indian Railways in return for services received. At present, no other operator is allowed to run train

16Promoting low carbon transPort in indiaInfrastructure for Low-Carbon Transport in India: A Case Study of the Delhi-Mumbai Dedicated Freight Corridor
services on the corridor although this may be permitted in the future. The relationship between the two parties will be governed by a concession agreement for a period of thirty years terminating in 2048.
DFCCIL’s Business Plan proposed a two-part tariff for computing TAC – a fixed component payable irrespective of the volume of traffic and a variable component based on gross ton kilometers (GTKM) moved. Therefore, capital cost (depreciation plus cost of debt) is treated as fixed cost, while traction cost is fully variable. Other O&M costs (staff, materials, overheads) are partly variable and party fixed. The revenue projections of the Western DFC are summarized in Table 3.2.
The revenue projections below show that when the project is commissioned, the fixed component of TAC will be 70% compared to 30% variable component. Over time the variable component would increase while the fixed component would decrease. Further, based on the traffic projections for the Western DFC, TAC per NTKM is estimated to be Rs. 0.19 in the year 2018, which increases to Rs. 0.53 in 2048. In 2009, the Indian Railways charged approximately Rs. 1.0 per NTKM for freight traffic (MoR, 2009). While the TAC is only one component of the total transport cost, it would be safe to conclude from these figures that the DFC would most likely reduce the operating costs for Indian Railways.
Table 3.2 Revenue projections of western DFC
Sources of revenue 2018 2023 2028 2033 2038 2043 2048
Track Access Charge-TAC (Million Rs.)
25240 62420 74530 81020 104230 147230 219490
Break-up of TAC
• Variable (%) 30 49 39 49 60 71 80
• Fixed (%) 70 51 61 51 40 29 20
Estimated* TAC per NTKM 0.19 0.33 0.32 0.30 0.33 0.40 0.53
Source: IL&FS (2011)*Estimates based on projected traffic
The Financial Rate of Return of the Western DFC project is estimated to be 4.83% if operations commence in 2017. It is proposed that TAC should be reviewed every three years, along with tariff policies of Indian Railways, to ensure that DFCC neither makes abnormal profits nor suffers a loss (IL&FS, 2011).
3.4 Governance and management structure
As noted earlier in this report, the DFCCIL is a fully owned SPV of the Indian Railways. Although the relationship between the two entities has been described as “an arm’s length relationship”, the Indian Railways is the sole owner and customer. Since it also controls the governing board, it is in a position to influence all policy decisions, including fixing user charges (TAC) payable to DFCCIL for services received. From a good corporate governance perspective, this is not a very desirable arrangement. At a minimum, there is need to set up an independent regulatory authority to govern the business relationship.
Further, under the present arrangement, the entire cost of capital expenditure is financed by debt from multilateral or bilateral agencies through the Government of India and equity provided by the Indian Railways from its internal resources. Although this is a suitable arrangement at the inception of the

17Promoting low carbon transPort in india
Infrastructure for Low-Carbon Transport in India: A Case Study of the Delhi-Mumbai Dedicated Freight Corridor
project, in the long run the organization would need greater financial autonomy to further its business interests and remain financially sustainable.
Regarding its management structure, the main challenge that DFCCIL faces is the inevitable requirement of separate staffing structures for the construction and operation phases. During the construction phase, almost the entire staff is comprised of persons with requisite engineering and related backgrounds, with expertise in planning, design, tendering, procurement and suppression of works. During the operations phase, more staff with commercial and logistics backgrounds will be needed. Additional field offices and maintenance depots would also need to be managed. In the long run, a more corporate type of management structure would be necessary.
The current organization structure of DFCCIL Corporate Office and proposed structure of the Corridor Headquarters is shown in Annexure E. It is a conventional structure based on functional classification, which is common in government organizations, that leads to less than efficient coordination across departments. A programme-based structure, on the other hand, leads to better coordination and better performance management. Therefore, coordination for greater programme effectiveness would be an important management challenge for DFCCIL.
3.5 The Delhi-Mumbai Industrial Corridor (DMIC)
When the plans for the Delhi-Mumbai DFC were being formulated, the Ministry of Commerce and Industries, Government of India, saw an opportunity for developing an industrial corridor along the Western DFC alignment that would attract investments in the surrounding region and induce regional economic development. The Delhi-Mumbai Industrial Corridor (DMIC) was conceived with the vision “to create strong economic base with globally competitive environment and state-of-the-art infrastructure to activate local commerce, enhance foreign investments attain sustainable development” (MoCI, 2007). This mega infrastructure project, costing US $90 billion, was to be implemented with financial and technical aid from the Government of Japan.
In 2008, the Delhi-Mumbai Industrial Corridor Development Corporation (DMICDC) was formed as the project development agency for implementing the DMIC project. The DMICDC is an SPV, based on public-private partnership model, with 49% equity held by the Government of India and the remaining 51% by financial institutions. This is an altogether separate entity from DFCCIL, which is implementing the DFC projects under the Ministry of Railways.
Development plan of DMIC
The DMIC region comprises parts of seven states (Uttar Pradesh, Delhi, Haryana, Rajasthan, Madhya Pradesh, Gujarat and Maharashtra) and two union territories (Dadra & Nagar Haveli and Daman & Diu). The state of Rajasthan has the maximum area in the DMIC region, followed by Gujarat. There are several major ports, a National Highway, two main railway routes and a number of high investment zones at various locations. The project influence region of DMIC is a band of 150 km on both sides of the Western DFC.
The DMIC strategy is to develop high impact development nodes for which 24 market-oriented centres have been identified. Substantial investments are planned to provide industrial and physical infrastructure at each node together with connectivity to the DFC, regional ports and hinterland markets. The identified nodes will be developed either as Investment Regions (IR), with a minimum area of 200 square km or as Investment Areas (IA) with a minimum area of 100 square km. Other criteria for an IR are proximity to

18Promoting low carbon transPort in indiaInfrastructure for Low-Carbon Transport in India: A Case Study of the Delhi-Mumbai Dedicated Freight Corridor
an urban agglomeration, potential for Greenfield port, availability of land and established industrial base. Criteria for IA include inherent strength of specific locations such as mineral resources, agricultural and industrial development and availability of skilled human resource base (MoCI, 2007).
Table 3.3 shows the key investments that have been planned for the DMIC region. The plan includes substantial investment in transport infrastructure along with industrial and urban infrastructure. There is also a proposal to develop seven eco-friendly cities in the DMIC region to serve as models for sustainable urban development. The plans for eco-cities would emphasize energy efficiency, resource conservation, waste efficiency, waste management and sustainable transport. Additional financial allocation would be required for the eco-cities.
Table 3.3 Proposed investments in the DMIC region
Project CategoryInvestment
(in Billion US $)Remarks
Manufacturing/ Industrial Process areas/ SEZs
33.8 Development of 55,000 Ha
Integrated Agro/ Food Processing Zone with backward and forward linkages
2.8 Development of 5,000 Ha
Port Development 3.0 3 Greenfield Ports and Augmentation of 2 Ports
Knowledge Cities/ Skill Development Centres
7.5 Development of 5,000 Ha
Developing Logistics Facilities (Logistic Park/ ICD/ Port Cont. Terminal/ CFS)
3.8 Development of 8,500 Ha
Augmentation of Airports 1.6
Integrated Townships/ Real Estate development
15.0 Development of 16,500 Ha
Augmentation of Power Supply System 10.0 Power Plant of 10,000 MV capacity
IT/ITES Hubs 8.8 Development of 2,000 Ha
Feeder Routes (Road) 2.0 Road length of 4,000 km
Feeder Routes (Rail) 1.9 Rail network length of 2,500 km
Total 90.0
* Adapted from (DMICDC, 2007)
Impetus for regional development
The DMIC region passes through industrial areas already developed as well as areas lagging in development. As the Concept Paper on DMIC, prepared by the Ministry of Commerce and Industry notes, “The ‘missing link’ is the infrastructure – logistics, industrial and social, which is incapable of handling the envisaged industrial output and exports” (MoCI, 2007).

19Promoting low carbon transPort in india
Infrastructure for Low-Carbon Transport in India: A Case Study of the Delhi-Mumbai Dedicated Freight Corridor
When the original plan for the DMIC was announced, its stated goal was to double the employment opportunities, triple the industrial output, and quadruple the exports from the region within five years. A perspective plan for the DMIC makes the following projections (Scott Wilson, 2009):
1. Value of regional output would increase by 163% in the year 2040 over a scenario without DMIC
2. With the DMIC, industrial output would triple in nine years, whereas regional employment and exports would double in seven years
3. Population in the region would grow from 231 million in 2009 to 518 million in 2039 under the DMIC scenario, compared to 425 million under the scenario without DMIC
Table 3.4 Future population and employment projections
Year
Population Employment
Business-As-Usual (Millions)
Business Induced (Millions)
Business-As-Usual (Millions)
Business Induced (Millions)
2009 231 231 91 91
2039 425 518 191 233
Source: Scott Wilson (2009)
The development strategy of DMIC is based on infrastructure development as a catalyst for regional economic growth. Key elements of this strategy are:
1. Setting up export oriented industrial parks/zones
2. Augmentation of industrial estates with infrastructure (transport terminals, warehouse waste treatment facilities, etc.)
3. Developing integrated agro/food processing zones including logistics and retail infrastructure
4. Knowledge cities to promote learning, innovation and skill development
5. Augmentation of airports and road/rail connectivity
6. Augmentation of ports and road/rail connectivity
7. Developing logistics infrastructure such as multi-modal logistics parks with container depots, terminals and warehouses
8. Integrated townships with good infrastructure, sustainable transport and good quality of life

20Promoting low carbon transPort in indiaInfrastructure for Low-Carbon Transport in India: A Case Study of the Delhi-Mumbai Dedicated Freight Corridor
Impacts on regional transport
It is evident that there would be substantial increase in travel demand induced by economic growth in the DMIC region. The Perspective Plan for the DMIC projects unprecedented growth in population, high inward migration, huge pressures on transport infrastructure and increase in road traffic volumes by a factor of 2.5 to 7, in different locations (Scott Wilson, 2009). Keeping in mind the industrial and logistics infrastructure proposed for the DMIC, a potential shift of freight traffic from road to rail is expected. However, at present, the two primary rail routes and 19 feeder routes are already congested. Therefore, timely completion of the Western DFC is a must in order to realize the full potential of the DMIC strategy.
The Perspective Plan of DMIC assumes timely completion and operation of the DFC as well as the ongoing development works of the Indian Railways. It forecasts two major bottlenecks in maximizing the potential of the DMIC strategy—handling capacity constraints at regional ports and carrying capacity constraints of the DFC. The analysis in the Perspective Plan shows that the ports on the west coast (in Gujarat and Maharashtra) would have the capacity to handle projected freight traffic only up to 2027-28. Similarly the Western DFC would have the capacity to handle containerized freight traffic until 2027-28 if the economic activity in the DMIC region grows at its full potential (Scott Wilson, 2009).
Therefore, it can be concluded that capacity of ports on the west coast would need to be substantially augmented and some new ports would have to be developed. Similarly, the DFCCIL would need to convert to double stack container trains as well as run coupled trains on the DFC by 2027-28. At present there are three major ports in the region—J.N.Port and Mumbai Port in Maharashtra and Kandla Port in Gujarat—equipped to handle containerized traffic. In addition there are five minor ports (Mundra, Pipavav, Hazira, Rewas and Dighi) with container handling capacity. For these ports, the capacity would need to be increased up to 3-4 times by 2039-40 in order to meet the requirements of the projected traffic. Further, new capacity would have to be created at other minor ports. Keeping these imperatives in mind, the DMIC has proposed an ambitious plan for transport infrastructure development in the region (Annexure F).
The DMIC region has an existing railway network of more than 30000 km and road network (freeways and expressways) of more than 6000 km. The Western DFC is expected to not only provide additional capacity for freight movement but also induce modal shift from road to rail. The planned transport infrastructure for the DMIC would provide crucial rail and road links to ports, airports and the DFC. The transport networks would also facilitate movement of goods from development nodes to hinterlands. In fact, the DMIC would lead to more efficient utilization of the DFC by providing freight traffic in both directions. Therefore, the challenge for national, state and local governments is to develop an integrated regional transport system that is environmentally friendly, low-carbon and sustainable.

21Promoting low carbon transPort in india
Infrastructure for Low-Carbon Transport in India: A Case Study of the Delhi-Mumbai Dedicated Freight Corridor
4.1 Approach
The Delhi-Mumbai Dedicated Freight Corridor, known as the Western Dedicated Freight Corridor, is one of the largest transport infrastructure projects being implemented in India. It is expected to revolutionize freight movement in the country and would thereby play a crucial role in sustaining national economic growth while inducing regional economic development. The DFC project also signifies a major transition in the freight transport sector through the increased sharing of rails, which are more energy efficient, environmentally friendly and less carbon-intensive mode of transport compared to other available modes.
For assessing the future CO2 emissions from the proposed DFC, a scenario-based approach has been developed. The assessment covers a thirty-year time period from 2016-17 to 2046-47, under three future scenarios. There are two business-as-usual scenarios based on continuation of current trends of freight movement, technologies and energy mix at the national level. The first scenario, BAU (With DFC), assumes that the Western DFC would become operational by 2016-17 as planned, while the second scenario, BAU (Without DFC), assumes continuation of freight movement on the existing mixed traffic network.
A third scenario, representing a low-carbon development path, labeled LC (with DFC), assumes a number of supply-side interventions that lead to further improvements in energy efficiency and energy intensity in the economy, as well as decarbonisation of electricity at the generation stage. As a result, the transport system becomes significantly more low-carbon compared to the two BAU scenarios.
4.2 Methodology
The analytical framework for this case study is based on the premise that the proposed Delhi-Mumbai rail corridor would be able to transport much larger volumes of freight traffic than the existing rail network, which is approaching saturation of capacity on most segments. The DFC would not only provide a more efficient system of freight transport, it would also result in significant improvements in energy efficiency and reduction in CO2 emissions. The time period for this assessment is thirty years and the estimates are presented in five-year intervals beginning in the year 2016 and going up to 2046.
4.AssessmentofCO2Emissions

22Promoting low carbon transPort in indiaInfrastructure for Low-Carbon Transport in India: A Case Study of the Delhi-Mumbai Dedicated Freight Corridor
Table 4.1 A snapshot of the study methodology
Steps Approach Data Sources
Alternative scenarios • With and Without DFC
• Business-as-Usual and Low-Carbon pathways
• Shukla et al. (2008)
• Shukla & Dhar (2010)
• DFCCIL
Future traffic projections
• Estimate targeted traffic
• Assign to rail and road
• DFCCIL Business Plan (IL&FS, 2011)
• E&Y (2011)
Projections of future energy demand
• Estimate specific fuel consumption for each mode/fuel
• Multiply with traffic volumes
• Ministry of Railways, GoI
• ARAI (2008)
• Other secondary sources
Estimation of CO2 emission factors
• Integrated Energy-Economy models for India provide future projections of CO2 emissions intensity for electricity
• Emission factor for diesel obtained from secondary sources
• IIMA researchers
• CEA (Govt. of India)
• MoEF (Govt. of India)
• IPCC (2006)
Future CO2 emissions
• For each scenario multiply estimated energy consumption and corresponding CO2 emission factors
The key steps in the methodology are:
1. Development of alternative scenarios
2. Projections of freight traffic
3. Estimation of future energy requirement
4. Estimation of CO2 emission factors
5. Future projections of CO2 emissions for each scenario
6. Decomposition of differences in emissions among different scenarios
Most of the DFC project information used in this study was obtained from DFCCIL. Particularly relevant and useful were two reports:
1. “Business Plan for Dedicated Freight Corporation of India Ltd.,” prepared by the consultants IL&FS

23Promoting low carbon transPort in india
Infrastructure for Low-Carbon Transport in India: A Case Study of the Delhi-Mumbai Dedicated Freight Corridor
2. A study “Green House Gas Emission Reduction for Dedicated Freight Corridor”, carried out by the consultants Ernst & Young (hereafter referred as the E&Y study)
The Business Plan prepared by IL&FS has been officially adopted by DFCCIL; the freight traffic projections from the report have been used in this study. The assessment methodology is broadly similar to that of the E&Y study. As some of the data and official project reports were not available, the E&Y study had to be relied on for estimates of some important parameters. There are also significant differences in our methodologies. As a result, the final estimates of CO2 emissions in the two studies are very different. However, both studies show that the DFC would result in larger reduction of CO2 emissions compared to the scenario without the DFC.
The approach for construction of alternative future scenarios is linked to the Integrated Assessment Models for India developed over the last few years by researchers at the Indian Institute of Management, Ahmedabad (Shukla, Dhar, & Mahapatra, 2008). The modeling framework combines a top-down model (AIM-CGE) with a bottom-up model (ANSWER-MARKAL). This integrated framework has been extensively used for modeling India’s energy sector and evaluating national strategies for achieving sustainable development and meeting normative global targets for reducing carbon emissions.
Broadly, the base-case scenarios under this approach assume continuation of resource-intensive conventional development paths driven by growth of GDP, population and urbanization. Improvements in energy intensity and changes in energy mix follow dynamics-as-usual path. A global climate stabilization target of 650 ppmv CO2e is assumed, which corresponds to 3.6°C rise in global average temperature by 2100 above the pre-industrial level. In contrast to this, the low-carbon scenarios under this approach assume a stringent carbon tax compared to a milder carbon regime assumed under the base-case scenarios. The low-carbon scenarios assume a climate stabilization target of about 450 ppmv CO2e, which corresponds to a stabilization target of 2°C global average temperature rise until the year 2100. These targets form the consensus benchmarks around which global climate agreements are currently centred (Shukla & Dhar, 2011).
The specific scenarios for this case-study are described later in this report (Section 4.3). It should be noted that there is only a soft link between national level macro models and project level assessment of CO2 emissions. The macro level changes in the national economy or energy system are not explicitly captured at the project level. In our case-study, the integrated national model for India is used to obtain estimates of the CO2 intensity of electricity until 2050 under the base-case and low-carbon scenarios, as described above. These emission factors are then used to estimate and forecast the DFC project level of CO2 emissions.
4.3 Alternative scenarios
For the purpose of this study, three alternative scenarios have been conceptualized:
1. Scenario 1: BAU (Without DFC)
In the absence of the DFC, freight traffic would be transported on the existing rail network shared with passenger traffic. At the macro level, current trends will continue as described below in scenario 2.

24Promoting low carbon transPort in indiaInfrastructure for Low-Carbon Transport in India: A Case Study of the Delhi-Mumbai Dedicated Freight Corridor
2. Scenario 2: BAU (With DFC)
It is assumed that the Western DFC would be commissioned by 2016-2017, as planned. Current trends in the demand for freight movement, modal split, electrification, and changes in the energy mix would continue. However, supply-side interventions such as higher average speeds, aerodynamic designs, regenerative braking and automatic control systems would be implemented.
3. Scenario 3: LC (With DFC)
This scenario is based on a conventional low-carbon path at the national level to achieve the global CO2 stabilization target corresponding to 2°C global average temperature rise until the year 2100. It assumes policy instruments such as a carbon tax to achieve the CO2 reduction target. It also assumes some additional supply-side interventions at the project level to improve energy efficiency and energy intensity.
4.4 Future traffic projections
Our freight traffic projections for the Western DFC are based on estimates of potential traffic provided in the Business Plan of DFCCIL prepared by IL&FS. The Business Plan provides projected traffic levels in Net Ton Kilometer (NTKM) from the year 2016-17 to 2036-37. These projections have extended until 2046-47 by assuming growth of traffic at 3% per annum from 2036 to 2041 and 2.75% per annum from 2041 to 2046.
Table 4.2 shows the projected levels of freight traffic under the three scenarios. Two of these scenarios are ‘With DFC’, that is BAU (With DFC) and LC (With DFC). Another BAU scenario, Scenario 1, is ‘Without DFC’. The BAU (With DFC) is the benchmark scenario that represents the case study boundary. This is the total targeted traffic that the proposed DFC is expected to carry in each year. The scenarios for future port capacity expansion, plans for new and existing thermal power plants, anticipated coal requirement and supply linkages, as well as the likely redistribution of commodity flows in the post DFC era have also been considered in order to arrive at these projections (IL&FS, 2011).
In the scenario ‘Without DFC’ the existing rail network of the Indian Railways would not have adequate capacity to carry the projected levels of traffic. In fact, several sections of the existing network are already saturated. It is assumed that the excess freight under the BAU (Without DFC) scenario would be diverted to road. The allocation of traffic between rail and road under this scenario is based on the proportions indicated by Ernst & Young (E&Y, 2011).
Table 4.2 Projected annual freight traffic (in billion NTKM)
Scenarios 2016 2021 2026 2031 2036 2041 2046
With DFC (BAU & LC)• Rail 115 170 215 255 300 345 395
Without DFC (BAU)*• Rail 72 85 92 97 102 97 95• Road 43 85 123 158 198 248 300
Note: In the scenario ‘With DFC’, the freight traffic shown is within the design capacity of the DFC. In the scenario ‘Without DFC’, freight is transported by road and rail due to inadequate capacity of the existing rail network.

25Promoting low carbon transPort in india
Infrastructure for Low-Carbon Transport in India: A Case Study of the Delhi-Mumbai Dedicated Freight Corridor
It is important to note here that our projections of freight traffic differ considerably from those given in the study by Ernst & Young. These differences are explained as follows:
1. The E&Y study has estimated the freight traffic in terms of Gross Ton Kilometers (GTKM) which includes the weight of trains apart from the net payload. They have also included the empty trips on each section of the corridor. We did not have access to detailed information of this nature and were unable to verify the calculations that went into the E&Y study.
2. Further, traffic projections for the scenario Without DFC in the E&Y study are based on analysis of saturation capacity in each section of the existing rail network between Delhi to Mumbai. We consider this to be an elegant way of assigning traffic between rail and road. However, the background report used for this exercise was not available to us. Consequently, we adopted the saturation capacity constraints and proportional allocation of excess traffic between rail and road, for the scenario Without DFC, from the study done by E&Y.
3. Since traffic volumes in our study are measured in terms of NTKM, subsequent estimates of energy consumption are also based on norms of fuel consumption per net ton kilometer.
4.5 Estimation of fuel consumption
It has been established that all freight movement on the Western DFC would be carried out by electric traction. As such, in the scenario “With DFC”, annual energy requirement can be estimated by multiplying traffic volume (NTKM) with specific fuel consumption for electric traction measured in terms of kilowatt hours per net ton kilometer.
The computation of energy requirement in the scenarios “Without DFC” is slightly more complicated. It involves the following steps:
1. For the portion of traffic movement by road, we have obtained specific fuel consumption estimates for diesel trucks (average 20T capacity), measured in terms of litres per net ton kilometer.
2. The road share of traffic volume is multiplied with the specific fuel consumption for diesel trucks.
3. The rail share of traffic volume is bifurcated into two parts pertaining to diesel and electric locomotives. The E&Y study referred to earlier provides future projections of the share of electric and diesel traction by extrapolating the current pattern and future plans of Indian Railways. We have assumed the same for our analysis.
Table 4.3 Share of diesel and electric locomotives
Type of traction 2016 2021 2026 2031 2036 2041 2046
• Electric 44% 47% 51% 55% 60% 66% 70%
• Diesel 56% 53% 49% 45% 40% 34% 30%
Source: E&Y (2011) for estimates up to 2041-42. The figures for 2046 are based on assumption.

26Promoting low carbon transPort in indiaInfrastructure for Low-Carbon Transport in India: A Case Study of the Delhi-Mumbai Dedicated Freight Corridor
4. Energy requirement of freight traffic by rail is estimated separately for electric and diesel traction by using the appropriate specific fuel consumption numbers. Table 4.4 shows the estimated values of specific fuel consumption by type of mode and fuel for both types of scenarios. The specific fuel consumption for electric traction in the scenarios “With DFC” is assumed to be 30% lower than the scenario “Without DFC”, reflecting the energy efficiency gains due to near elimination of congestion on dedicated freight corridors, regenerative braking systems in locomotives and other energy saving technologies.
Table 4.4 Estimates of specific fuel consumption
Scenario / Mode Specific Fuel Consumption
Remarks
(a) With DFC
• Rail (Electric) 0.008 KWh per NTKM Assuming 30% improvement in fuel efficient
(b) Without DFC
• Diesel Truck (20T) 0.0143 litres per NTKM Assuming average mileage of 3.5 km per litre
• Rail (Diesel) 0.0045 litres per NTKM Computed from Annual Statistical Statement (2009-10), Ministry of Railways
• Rail (Electric) 0.011 KWh per NTKM Computed from Annual Statistical Statement (2009-10), Ministry of Railways
4.6 Future energy demand
Estimated future energy demand under the three scenarios is shown in Table 4.5. In the BAU (Without DFC) scenario the demand for diesel would grow more than five times from 797 million litres in 2016 to 4448 million litres in 2046. The share of rail in the requirement from diesel declines steadily from 22.9 % in 2016 to 2.9 % in 2046 as share of diesel locomotive is reduced. Therefore, most of the increase in demand for diesel results from growing reliance on freight movement by road when traffic on the existing rail network exceeds saturation capacity. The demand for electricity under this scenario would roughly double over the same period, from 350 million KWh in 2016 to 730 million KWh in 2046, as the share of electric locomotives increases.

27Promoting low carbon transPort in india
Infrastructure for Low-Carbon Transport in India: A Case Study of the Delhi-Mumbai Dedicated Freight Corridor
Table 4.5 Annual future energy requirements by type of fuel
2016 2021 2026 2031 2036 2041 2046
BAU (With DFC)
• Diesel (M. Litres) – – – – – – –
• Electricity (M. KWh) 920.0 1360.0 1720.0 2040.0 2400.0 2760.0 3160.0
BAU (Without DFC)
• Diesel (M. Litres) 796.9 1421.5 1970.4 2468.1 3031.7 3714.3 4447.9
• Electricity (M. KWh) 349.9 441.3 517.2 587.8 673.8 705.8 730.0
LC (With DFC)
• Diesel (M. Litres) – – – – – – –
• Electricity (M. KWh) 920.0 1360.0 1720.0 2040.0 2400.0 2760.0 3160.0
In the two scenarios ‘With DFC’, there is no diesel consumption and the demand for electricity is projected to increase more than three times from 920 million KWh in 2016 to 3160 million KWh in 2046. When the future energy demand is converted under different scenarios to common energy unit of terajoules (TJ), it is observed that in the BAU (Without DFC) scenario annual energy demand would grow from 29 766 TJ in 2016 to 161 754 TJ in 2046. Conversely, annual energy demand under the two scenarios ‘Without DFC’ is projected to increase from 3 312 TJ in 2016 to 11 376 TJ in 2046 (Figure 4.1).
Figure 4.1 Future end-use energy demand (TJ)
The analysis represented in Figure 4.1 shows the enormous potential for energy savings associated with the proposed DFCs. The difference in energy demand is for end-use. However, the energy savings would be much lower at a national level as electricity for end-use involves transformation losses in converting primary energy as well as losses in transmission.
BAU (Without DFC) BAU (With DFC) LC (With DFC)
Tera
joules
(TJ)

28Promoting low carbon transPort in indiaInfrastructure for Low-Carbon Transport in India: A Case Study of the Delhi-Mumbai Dedicated Freight Corridor
4.7 Estimation of CO2 emission factors
The CO2 emissions factors are needed to estimate total CO2 emissions under each scenario. In India, both the Central Electricity Authority (CEA) and the Ministry of Environment and Forests (MoEF) publish the CO2 emission factor for the national power grid. According to these sources, the CO2 emission factor in 2009 at the generation point was 0.82 kg CO2 per KWh (CEA, 2009).
However, transmission and distribution losses in the Indian power grid are conservatively estimated to be around 20%. Therefore, the CO2 emission factor for electricity at the consumption stage is estimated to be 1.02 kg CO2 per KWh. With this as the starting number for the year 2010, the IIMA researchers have run the integrated energy-economy model for India. This model provides estimates of CO2 emissions intensity for India from 2010 to 2050. The model results for the business-as-usual and low-carbon conventional path scenarios are shown in Table 4.6.
Table 4.6 CO2 emission intensity for the Indian economy
(Tons CO2 per Mwh)
Scenario 2010 2015 2020 2025 2030 2035 2040 2045 2050
Business-As-Usual (BAU)
1.02 0.96 0.94 0.93 0.86 0.78 0.74 0.75 0.69
Low-Carbon Society: Conventional path
1.02 0.85 0.71 0.53 0.28 0.19 0.14 0.09 0.08
Source: Integrated Assessment for India, ANSWER-MARKAL Modeling System, IIMA, 2011
We have used the CO2 emissions factors shown above (with suitable interpolation) for this case study of the Western DFC. As discussed earlier in this chapter, the scenarios for this study are based on the same logic and assumptions as the macro model shown above.
The CO2 emission factors for diesel have been derived from the IPCC report “2006 IPCC Guidelines for National Greenhouse Gas Inventories” (IPCC, 2006). Combining this with the specific fuel consumption for diesel in the rail and road options, we have computed the CO2 emissions intensity of diesel in terms of grams of CO2 per ton kilometer for rail and road. This computation is shown in Table 4.7, below.
Table 4.7 CO2 emission factors for diesel
ModeSpecific Fuel
Consumption (litres/NTKM)
CO2 Emission Factor
(kg CO2 /litre)
CO2 Emissions Intensity (gCO2/
NTKM)
Rail (with diesel traction) 0.0045 2.65 11.9
Road (diesel trucks) 0.01439 2.65 38.1*
Note: The CO2 emission factors are derived from values given in IPCC (2006) by multiplying with specific density and net calorific value of diesel. The specific fuel consumption is based on estimates provided by a few local trucking companies. *This estimate matches the value of CO2 intensity reported by Automotive Research Association of India (ARAI, 2008).

29Promoting low carbon transPort in india
Infrastructure for Low-Carbon Transport in India: A Case Study of the Delhi-Mumbai Dedicated Freight Corridor
4.8 Future CO2 emissions
This section looks at the trends of future CO2 emissions under the three scenarios for the thirty-year period extending from 2016-17 to 2046-47. The analysis shows that under the BAU (Without DFC) scenario, the annual CO2 emissions would have increased from 2.45 million tons in 2016-17 to 12.32 million tons in 2046-47, at an annual growth rate of 5.5%. In contrast to this, annual CO2 emissions under the BAU (With DFC) scenario would be 0.88 million tons in 2016-17 and 2.33 million tons in 2046-47. This shows the enormous potential impact of the DFC project on reducing CO2 emissions. The reduction is even larger under the LC (With DFC) scenario, where the annual emissions in the year 2046-47 can be expected to drop to 0.28 million tons CO2 from 0.76 million tons in 2016-17 (Table 4.8).
Table 4.8 Estimated annual CO2 emissions
(Million tons of CO2)
Scenario 2016 2021 2026 2031 2036 2041 2046Cumulative (2016-2046)
BAU (With DFC) 0.88 1.28 1.58 1.72 1.85 2.05 2.33 51.9
BAU (Without DFC) 2.45 4.18 5.69 7.03 8.55 10.36 12.32 222.4
LC (With DFC) 0.76 0.92 0.83 0.53 0.43 0.36 0.28 18.4
Figure 4.2 shows the trends in future CO2 emissions under the three scenarios. The annual emissions under the BAU (With DFC) scenario in 2046 are less than one-fifth of those under the BAU (Without DFC) scenario. Similarly, annual emissions under the LC (With DFC) scenario are less than one-eighth of the BAU (With DFC) scenario and less than one-fortieth of BAU (Without DFC) scenario.
Figure 4.2 Annual CO2 emissions (in million ton CO2)
0.00
2.00
4.00
6.00
8.00
10.00
12.00
14.00
2016 2021 2026 2031 2036 2041 2046
BAU (Without DFC) BAU (With DFC) LC (With DFC)
Mill
ion
tons
of C
O2

30Promoting low carbon transPort in indiaInfrastructure for Low-Carbon Transport in India: A Case Study of the Delhi-Mumbai Dedicated Freight Corridor
Figure 4.3 shows the cumulative emissions under the three scenarios for the thirty-year period. Compared to the BAU (Without DFC) scenario, total emissions are expected to reduce by 77% under BAU (With DFC). The cumulative emissions under the LC (With DFC) scenario are 92% lower than BAU (Without DFC). This further reinforces the enormous gains, in terms of reduction in CO2 emissions, which are possible by implementing the DFC project.
Figure 4.3 Reduction in cumulative CO2 emissions (2016–2046)
Interpretation of results
1. In the BAU (Without DFC) scenario, the existing rail network acts as a capacity constraint; nearly 37% of the freight traffic in 2016 that could have easily moved on the DFC but is instead directed to road transport. In 2046-47, the existing rail network is expected to become highly saturated and would be able to carry only one-fourth of the total freight traffic.
2. Further, in the BAU (Without DFC) scenario, it is assumed that Indian Railways would continue to deploy diesel locomotives along with electric locomotives. Although the share of electric locomotives increases from 44% in 2016-17 to 70% in 2046-47, the large share of diesel traction results in additional CO2 emissions, compared to the BAU (With DFC) scenario where 100% electric traction is assumed.
3. Our methodology recognizes the fact that rail (with electric traction) on DFC would be significantly more energy-efficient compared to rail (with electric traction) operating on the existing rail network, which is shared by passenger and freight trains. This effect is captured in our analysis by using different values of specific fuel consumption for the two scenarios.
4. Finally, CO2 emissions drop significantly when the third scenario LC (With DFC) is introduced. Here, we see the effect of the CO2 emission intensity factors obtained from the ANSWER-MARKAL based integrated energy-economy model for India. The model assumes a global carbon
BAU (Without DFC)0
50
100
150 -77% -92%
200
250
BAU (With DFC) LC (With DFC)
Mill
ion
tons
of C
O2
222.4
51.9
18.4

31Promoting low carbon transPort in india
Infrastructure for Low-Carbon Transport in India: A Case Study of the Delhi-Mumbai Dedicated Freight Corridor
price regime aimed at limiting the average global temperature rise to within 2°C until the year 2100. A stringent carbon price induces preference for energy forms that have low carbon emissions, thereby, leading to greater decarbonisation in electricity generation. In our analysis the emissions intensity factors decrease rapidly in the LC (with DFC) scenario. As a result the total annual CO2 emissions increase slightly from 2016 to 2026 and then keep declining until 2046.
Decomposition analysis
Figure 4.4 shows the results of a step-wise decomposition analysis carried out to assess the relative contribution of key factors that explain the differences in CO2 emissions among the three scenarios. In the first step, the freight traffic assigned to road under the BAU (Without DFC) scenario is reassigned to rail, indicating expansion of existing rail network to overcome the capacity saturation constraint. This modal shift reduces the carbon emissions significantly.
In the next step, it is assumed that all freight movement by rail is converted to electric traction. This further reduces the total emissions. The residual difference in annual emission between the BAU (Without DFC) and BAU (With DFC) scenarios is attributed to the difference in energy efficiency of freight movement on a shared rail network as opposed to a dedicated freight corridor.
The analysis shows that in 2046-47, nearly 87% of the difference in annual emissions between the two BAU scenarios can be explained by modal shift from rail to road. An additional 4% of the difference is due to the use of diesel traction for freight movement by rail instead of electric traction. The remaining 9% of the difference is attributable to the higher energy efficiency of the DFC compared to the shared network. The further reduction in CO2 emissions under the LC (With DFC) scenario is attributed to additional decarbonisation of electricity in response to a global carbon tax.
Figure 4.4 Decomposition of difference in annual CO2 emissions
0.00
2.00
4.00
6.00
8.00
10.00
12.00
14.00
2016 2021 2026 2031 2036 2041 2046
Mill
ion
tons
of C
O2
Emission reduction due to modal shift from road to rail (Δ1)Emission reduction due to fuel switch in rail traction from diesel and electric mix to fully electric (Δ2)Emission reduction due to energy efficiency improvements over time (Δ3)
Δ1 ~ 87%
Δ2 ~ 4%
Δ3 ~ 9%
BAU (With DFC)
LC(With DFC)


33Promoting low carbon transPort in india
Infrastructure for Low-Carbon Transport in India: A Case Study of the Delhi-Mumbai Dedicated Freight Corridor
5.1 Reduction of CO2 emissions from the Western DFC
This study brings to light the large potential that the Delhi-Mumbai DFC project has for reducing CO2 emissions as compared to the expected emissions without the DFC project. This CO2 emissions reduction is even greater under a scenario of low-carbon development path, which assumes a stringent carbon tax at the national level.
Analysis shows that by 2046-47, the Western DFC project would reduce annual CO2 emissions by nearly 81% under the business-as-usual scenario and by 97% under the low-carbon scenario, compared to the level of emissions in the absence of the DFC.
Further, the cumulative emissions over the thirty-year study period (from 2016-17 to 2046-47) would reduce from 222 million tons CO2 under BAU (Without DFC) to 52 million tons CO2 under BAU (With DFC) and 18 million CO2 under LC (With DFC). Therefore, the DFC project has the potential to reduce cumulative emissions by nearly 170 million tons CO2 over thirty years.
The decomposition analysis explaining the difference in annual CO2 emissions between BAU (Without DFC) and BAU (With DFC) scenarios reveals that almost 87% of the difference in 2046-47 can be attributed to the modal shift from rail to road in the scenario without DFC, because of the saturated line capacity in the existing rail network. The remainder of the difference in emissions is attributable to partial use of diesel traction and lower energy efficiency in operations under the scenario Without DFC.
Finally, the difference in CO2 emissions between the BAU (With DFC) and LC (With DFC) scenarios is largely due to differences in the electricity grid-mix, which has a greater share of energy forms with lower CO2 emissions under the latter scenario.
5.2 Potential reduction of CO2 emissions from six DFCs
We have also estimated the combined potential of CO2 reduction from the six proposed DFCs which are planned along the Golden Quadrilateral (Delhi-Mumbai-Chennai-Kolkata) and its diagonals. Although this is a simple extrapolation from computations for the Western DFC, it provides useful aggregate estimate of the CO2 reductions that may be expected if the six corridors are built as planned.
In order to arrive at these estimates, we have used the total national freight traffic projections from RITES (2009). These were extrapolated to the year 2046-47 by assuming reducing growth rates for subsequent decades. Further, we have assigned 42% of the total freight traffic to the six corridors, with a modal split of 22% to road and 20% to rail. These assumptions are based on McKinsey (2010). Finally, 85% of the rail traffic is assigned to DFCs, assuming that the remaining 15% would continue to move on the shared rail network of Indian Railways. The results of this exercise are shown in Table 5.1.
5.FindingsandConclusions

34Promoting low carbon transPort in indiaInfrastructure for Low-Carbon Transport in India: A Case Study of the Delhi-Mumbai Dedicated Freight Corridor
Table 5.1 Projected traffic and CO2 emissions for six DFCs
2016 2021 2026 2031 2036 2041 2046
Projected Freight Traffic (Billion NTKM)
461 680 976 1369 1747 2229 2712
Projected CO2 emission (Million tons of CO2)
• BAU (With DFC) 3.52 5.10 7.15 9.24 10.79 13.23 16.01
• BAU (Without DFC) 9.80 16.72 25.84 37.75 49.79 66.96 84.61
• LC (With DFC) 3.03 3.67 3.75 2.87 2.52 2.32 1.91
It emerges that in the final year of assessment (2046-47), the annual CO2 emissions in the BAU (With DFC) scenario will be lower by almost 70 million tons compared to BAU (Without DFC). These would be further reduced by 15 million tons of CO2 under the LC (With DFC) scenario. The maximum cumulative reduction expected from the six DFCs over the thirty-year period is 1168 million tons of CO2 (Figure 5.1).
Figure 5.1 Cumulative CO2 emissions for six DFCs (2016–2046)
5.3 Potential for climate financing
Climate financing of infrastructure projects in developing countries is at present mostly centred on the Clean Development Mechanism (CDM) of earning carbon credits (CERs) which can be traded. More avenues are likely to open in the future as initiatives to create innovative climate funds get underway.
In the CDM framework there are two methodologies which are relevant for the Western DFC project: (1) Modal shift in Transportation of Cargo from Road Transportation to Water or Rail Transportation (AM 0090); (2) Emission Reductions by Electric and Hybrid Vehicles (AMS-IIIC).
1,258.7
285.0
90.30
200
400
600
800
1000
1200
1400
BAU (Without DFC) BAU (With DFC) LC (With DFC)
Mill
ion
tons
of C
O2

35Promoting low carbon transPort in india
Infrastructure for Low-Carbon Transport in India: A Case Study of the Delhi-Mumbai Dedicated Freight Corridor
The Delhi Metro Rail Corporation (DMRC) has successfully used the passenger transport versions of the above methodologies to earn CERs. DFCCIL could learn from the experience of DMRC. The true benefit of participating in the CDM process is in the recognition of being a climate conscious organization rather than the monetary value of carbon credits earned.
New climate financing avenues for transport projects are being initiated by various multilateral and bilateral agencies. Some of the emerging opportunities for climate financing that may be explored for projects like the Western DFC are:
1. German International Climate Initiative
2. Global Environment Facility (GEF)
3. National Appropriate Mitigation Actions (NAMAS)
4. Mitigation fund / CGCF under UNFCCC
5. Clean Technology Fund under ADB and World Bank
5.4 Impacts on regional development
The relationship between transportation investments and regional economic development is well established. Soon after the Western DFC project was sanctioned, the Government of India announced plans to develop the Delhi-Mumbai Industrial Corridor (DMIC) alongside the Western DFC.
The DMIC strategy includes development of market-oriented industrial areas, investment regions, industrial parks, ports and airports and seven new cities at different locations along the corridor. Several logistics hubs are planned and the DFCCIL also has plans to develop Multi-Modal Logistics Parks in the corridor.
It is evident that a subsequent intra-regional transport system would develop in the region in order to take advantage of the connectivity made available by the Western DFC. Conversely, the DFC can benefit from industrial development in the DMIC by attracting greater share of freight traffic. The challenge would be to ensure that the regional transport infrastructure is also environmentally friendly, low-carbon and sustainable.
5.5 Conclusions
The main conclusion of this study is that large transport infrastructure projects like the Western DFC have significant impact on CO2 emissions. This provides an additional dimension of sustainability to the efficiency gains for which these transportation projects are undertaken. In the case of the DFC, it was necessary to undertake this project for a number of economic and operational reasons; recognizing the substantial environmental and development benefits as well as the low-carbon characteristics made the case for DFC even more compelling.
This case study also demonstrates that low-carbon transport infrastructure is aligned with the global commitment to achieve milestone targets associated with climate stabilization. However, the focus of these assessments must be long-term as transport investments are long-life assets. Some of the short-term considerations become less relevant because those are assumed to have occurred in the

36Promoting low carbon transPort in indiaInfrastructure for Low-Carbon Transport in India: A Case Study of the Delhi-Mumbai Dedicated Freight Corridor
baseline scenarios. Instead, the focus of assessment can shift to long-term goals. Of course, long-term perspectives must be aligned with short-term actions, which are the responsibility of project planners and managers.
Another important conclusion emanates from our methodology of assessments based on long-term scenarios and national integrated energy-economy modeling frameworks. In these models, the global carbon price influences the relative prices of various energy forms, giving preference to those that have low-carbon emissions. When the CO2 emissions intensity from these models are used to assess specific transport modes, such as electric vehicles, or specific projects like the freight corridors, then more efficient modes and projects are preferred. If policymakers or decision makers use these assessments, more DFCs may be built sooner than would be otherwise. It is also valid that additional long-term runs of the integrated models, like the ANSWER-MARKAL model used in this case-study, are needed to get more refined assessments of future emission intensities. For that purpose, inputs from this and similar case studies will in turn help to calibrate inputs to the macro-model.
Finally, this case-study recognizes that transport and development have a symbiotic relationship. A robust development strategy needs strong transport infrastructure and conversely transport infrastructure is necessary for achieving full potential of regional economic development. The DFC is an important decision for transport investment planning but the development outcomes in this case would be largely determined by the success of the DMIC strategy. Low-carbon transport infrastructure decisions must be aligned with low-carbon sustainable actions on several fronts in order to maximize social welfare gains.

37Promoting low carbon transPort in india
Infrastructure for Low-Carbon Transport in India: A Case Study of the Delhi-Mumbai Dedicated Freight Corridor
ARAI.(2008). Draft Report on “Emission Factor development for Indian Vehicles” as a part of Ambient Air Quality Monitoring and Emission Source Apportionment Studies. The Automotive Research Association of India, Pune.
CEA.(2009). CO2 Baseline Database for the Indian Power Sector. Central Electricity Authority, New Delhi as available on http://www.cea.nic.in/reports/planning/cdm_co2/user_guide_ver5.pdf accessed on September 27, 2011.
Das, M. (2005). Tread cautiously on freight corridor project: McKinsey. The Hindu Business Line, August 15, 2005 as available on http://www.thehindubusinessline.in/bline/2005/08/15/stories/2005081500120600.htmaccessed on April 5, 2012
DFCCIL.(2011). Dedicated Freight Corridor Projects (Western Corridor) - Project brochure. DFCCIL New Delhi, India.
Dirand, J. (2007). Towards a “Primary European Rail Freight Network” (PERFN): Contribution of the Industry based on six Corridor Business Cases. Community of European Railway and Infrastructure Companies (CER), Brussels.
DMICDC Ltd. (2009). Corporate Overview as available on http://www.dmicdc.com/cpage.aspx?pgid=2accessed on September 26, 2011
E&Y. (2011). Green House Gas Emission Reduction for Dedicated Freight Corridor. Ernest & Young.
European Commission. (2011). Mobility and Transport as available on http://ec.europa.eu/transport/rail/infrastructures/rail_freight_oriented_network_en.htm, accessed on March 1, 2012
IL&FS. (2011). Business Plan for Dedicated Freight Corporation of India Ltd. DFCCIL.
IL&FS. (2008). DMIC-Status and Opportunities as available on http://www.ilfsindia.com/downloads/bus_rep/Status_DMICDC_180208_R0.pdf accessed on September 27, 2011.
India Infrastructure Research.(2009).Railways in India. India Infrastructure Publishing Pvt. Ltd., New Delhi
IPCC.(2006). “2006 IPCC Guidelines for National Greenhouse Gas Inventories”. Chapter 2: Energy.
Kumar, V., & Singh, A. K. (2006).Dedicated Freight Corridor Maintenance Practices. Indian Railways Institute of Civil Engineering, Pune, as available on http://wiki.iricen.gov.in/doku/lib/exe/fetch.php?media=625:1dfc.pdf accessed on August 22, 2011
Kuys, W. (2011).Presentation on heavy haul operations in South Africa. Calgary, Transnet Freight Rail Canada.
Masui, T., et al. (2011).An emission pathway for stabilization at 6 Wm-2 radiative forcing. Climate Change, 109 (1-2), 59-76.
References

38Promoting low carbon transPort in indiaInfrastructure for Low-Carbon Transport in India: A Case Study of the Delhi-Mumbai Dedicated Freight Corridor
McKinsey.(2010). Building India – Transforming the Nation’s Logistics Infrastructure. McKinsey & Company.
MoCI.(2007). Concept Paper- Development of Delhi – Mumbai Industrial Corridor (DMIC). Government of India, New Delhi.
MoR. (2009). Indian Railways - VISION 2020. Ministry of Railways, New Delhi
MoR.(2009). White Paper on Indian Railways. Ministry of Railways, New Delhi
MoR. (2010). Indian Railways Annual Statistical Statement 2009-10. Ministry of Railways, New Delhi
Planning Commission (2012). “The working group report on Road Transport for XIth Five Year Plan”. Planning Commission.
RITES.(2009). Total Transport System Study on Traffic Flows and Modal Costs. Planning Commission.
Scott Wilson India Pvt. Ltd. (2009). Perspective Plan for DMIC Region. DMICDC, New Delhi.
Shukla, P. R., & Dhar, S. (2011). Climate agreements and India: aligning options and opportunities on a new track. International Environmental Agreements: Politics, Law and Economics, 11 (3), 229–243.
Shukla, P. R., Dhar, S., & Mahapatra, D. (2008). Low-carbon society scenarios for India. Climate Policy, 8, S156-S176.
The Economist. (2010). American Railways: High-speed railroading. The Economist .
World Bank/DFID. (2012). Develop Dedicated Freight Corridors. Freight Transport for Development as available on http://www.ppiaf.org/freighttoolkit/toolkit/policy-framework/policy-measures/planning-investment/develop-dedicated-freight-corridorsaccessed on March 1, 2012

39Promoting low carbon transPort in india
Infrastructure for Low-Carbon Transport in India: A Case Study of the Delhi-Mumbai Dedicated Freight Corridor
A: Freight traffic movement by rail and road (1950-2010)
YearFreight Traffic (Billion NTKM) Share (%)
Rail Road Rail Road
1950-51 44.1 6.0 88.0 12.0
1960-61 87.7 14.0 86.2 13.8
1970-71 127.4 47.7 72.8 27.2
1980-81 158.5 90.9 63.5 36.5
1990-91 242.7 145.1 62.6 37.4
2000-01 315.5 494.0 39.0 61.0
2007-08 768.7 1558.9 33.0 67.0
Source: RITES (2009)
B: Freight traffic by mode (2007-08)
ModeFreight Volume Freight Traffic
Tons (Million) Share (%) NTKM (Billion) Share (%)
Rail 768.7 30.1 508.1 36.1
Road 1558.9 61.0 706.2 50.1
Coastal Shipping 59.1 2.3 85.7 6.1
Airways 0.3 0.0 0.3 0.0
Inland Waterway 54.9 2.2 3.4 0.2
Pipelines 113.5 4.4 105.5 7.5
Total 2555.4 100.0 1409.1 100.0
Source: RITES (2009)
C: Future projection of freight traffic
a) Estimated rail and road traffic with existing shares
Year Freight Volume (Million tons) Freight Traffic (Billion NTKM)
Rail Road Total Rail Road Total
2007-08 769 1559 2328 508 706 1214
2012-13 1058 2146 3204 805 1119 1924
2017-18 1474 2989 4464 1235 1717 2952
2022-23 2049 4155 6203 1806 2510 4316
2025-26 2507 5084 7592 2236 3109 5345
Source: RITES (2009)
Annexure

40Promoting low carbon transPort in indiaInfrastructure for Low-Carbon Transport in India: A Case Study of the Delhi-Mumbai Dedicated Freight Corridor
b) Estimated rail and road shares in optimized flow (11 commodities) (%)
Year Rail Road Total
2007-08 78.2 21.8 100
2012-13 77 23 100
2017-18 78.5 21.5 100
2022-23 78.9 21.1 100
2025-26 79.2 20.8 100
Source: RITES (2009)
D: Design features
Feature Existing On DFC
Moving dimensions
Height 4.265 m
7.1 m for WesternDFC 5.1 m for eastern DFC
Width
3,200 mm 3,660 mm
Container stack
Single stack Double stack
Train length
700 m 1500 m
Train load
4,000 ton 15,000 ton
Source: DFCCIL (2011)

41Promoting low carbon transPort in india
Infrastructure for Low-Carbon Transport in India: A Case Study of the Delhi-Mumbai Dedicated Freight Corridor
E: Organization structure
a) Corporate headquarters
b) Corridor headquarters
Source: Based on IL&FS (2011) and DFCCIL (2011)
Note: GGM-Group General Manager, GM-General Manager, CVO-Chief Vigilance Officer, PP-Project Planning, OP & BD-Operation and Business Development, IT-Information Technology, HR-Human Resources, S&T-Signal and Tele Communication, SEMU-Social and Environment Management Unit, WC-Western Corridor, EC-Eastern Corridor, Infra-Infrastructure, Admin.-Administration, RS- Rolling Stock, RM-Risk Management, TS-Technical Services
Director (PP)
GGM Engg-I
GGM Eng-II
GM/CO (EC)
GM/LA & SEMU (EC)
GGM/P(EC)
GM/S&T/EC
GGM/TechServices
GM/Survey& HQ
GM/Electrical(EC)
Director (Infra)
GGM/Electrical
GGM/Proc(WC)
GGM/S&T
GM/CO (WC)
GM/Electrical(PS)
GM/S&T (WC)
GM/Signaling
GM/SEMU/WC
Director (Finance)
GGM/Fin.
GGM/Fin. & IT
GGM/RM
Director (OP & BD)
GGM/Operation& Safety
GGM/BD
GGM/HRGGM/Admn.
GM/Traffic &
Coordination
CVO
Managing Director
Executive Director Corridor
Depot Staff Depot Staff Station, HR & Finance IT Staff Safety & Training Staff Control Staff Staff
GM Infra GM Systems GM Transportation GM Finance
OH
E
Pow
er S
uppl
y
Sig
nal
Tele
com
Ope
ratio
ns
Loco
& R
ollin
g S
tock
PR
& B
D
Saf
ety
& S
ecur
ity
Fina
nce
Bud
get
Trac
k A
cces
s
Trac
ks
Brid
ges
& S
truct
ures
Trac
k M
achi
ne

42Promoting low carbon transPort in indiaInfrastructure for Low-Carbon Transport in India: A Case Study of the Delhi-Mumbai Dedicated Freight Corridor
F: Proposed transport infrastructure for DMIC
Transport Infrastructure Projects Planned Remarks
Rail Infrastructure
New/upgraded rail links 20 links covering 1951 km
Metro/suburban railway systems for intercity connectivity
5 systems covering 330 km inside the city
Mumbai and Ahmedabad identified for high speed rail linkage
Length estimated to be 492 km
Road InfrastructureRoad links to be built by state governments 27 links covering 1840 km
Road links to be constructed by the National Highways Authority of India
11 links covering 1659 km
Port Development
Port Connectivity 19 (Rail links), 26 (Road links)
New Sea ports 7
Upgradation of Ports 6
Greenfield Ports 3
Airport Development
Non metro Airports 7
International Airports 4
Airport Connectivity 8 (Rail links), 8 (Road link)
Airport Upgradation 2
Greenfield Air strips 2
Logistic Parks
Multi-Modal Logistic Parks 8 parks with an area between 200-400 Ha
Logistic sub-parks 7 dub-parks with an area between 100-200 Ha
G: Future energy requirement
Scenario 2016 2021 2026 2031 2036 2041 2046
(a) Energy requirement (by type of fuel)
BAU (With DFC)
Diesel (M.Litres) – – – – – – –
Electricity (M.KWh) 920 1360 1720 2040 2400 2760 3160
BAU (Without DFC)
Diesel (M.Litres) 797 1422 1970 2468 3032 3714 4448
Electricity (M.KWh) 350 441 517 588 674 706 730
LC (With DFC)
Diesel (M.Litres) – – – – – – –
Electricity (M.KWh) 920 1360 1720 2040 2400 2760 3160
(b) Energy Demand (TJ)
BAU (With DFC) 3312 4896 6192 7344 8640 9936 11376
BAU (Without DFC) 29766 52444 72356 90413 110885 135425 161754
LC (With DFC) 3312 4896 6192 7344 8640 9936 11376

43Promoting low carbon transPort in india
Infrastructure for Low-Carbon Transport in India: A Case Study of the Delhi-Mumbai Dedicated Freight Corridor
H: Map showing western DFC, DMIC Region and other DFCs


Information about the project:
UNEP Transport Unit in Kenya, UNEP Risø Centre in Denmark and partners in India have embarked on a new initiative to support a low carbon transport pathway in India. The three-year 2.49 million Euro project is funded under the International Climate Initiative of the German Government, and is designed in line with India’s National Action Plan on Climate Change (NAPCC). This project aims to address transportation growth, development agenda and climate change issues in an integrated manner by catalyzing the development of a Transport Action Plan at national level and Low Carbon Mobility plans at cities level.
Key local partners include the Indian Institute of Management, Ahmedabad, the Indian Institute of Technology, Delhi and CEPT University, Ahmedabad. The cooperation between the Government of India, Indian institutions, UNEP, and the Government of Germany will assist in the development of a low carbon transport system and showcase best practices within India, and for other developing countries.
Homepage : www.unep.org/transport/lowcarbon

United Nations Environment Programme (UNEP)Division of Technology, Industry and Economics (DTIE)Transport Unit P.O Box 30552Nairobi, Kenya Tel : +254 20 762 4184Email : [email protected]/transport/lowcarbon
FOR MORE INFORMATION, CONTACT: