Embed Size (px)
Citation preview
INTERNATIONAL JOURNAL OF ENVIRONMENTAL SCIENCES Volume 6, No 6, 2016
© Copyright by the authors - Licensee IPA- Under Creative Commons license 3.0
Research article ISSN 0976 – 4402
Received on January 2016 Published on May 2016 954
A case study of temperature and rainfall trends using Mann-Kendall test in
Saurashtra Region (Junagadh) of Gujaart, India Chinchorkar S.S1, Bhavin Ram D.M2, Paradava3 and Trivedi M.M4
1- Assistant Professor, Anand Agricultural University, Dahod,
2- Assistant Professor, Anand Agricultural University, Anand.
3- Research Associate, Anand Agricultural University,Dahod.
4- Associate Professor, Anand Agricultural University, Dahod.
doi: 10.6088/ijes.6090
ABSTRACT
The long–term change in temperature and rainfall has been assessed by linear trend analysis.
It is evident from above Figures that monthly mean of maximum (MMAX) temperatures
have increased significantly for all the months except the month of October for which a very
weak decrease in MMAX temperature is observed. This implies that in Junagadh, the highest
increase in MMAX temperature occurs in November by (0.021C) during last 32 years. The
annual mean of monthly mean of maximum temperatures observed a decreasing trend having
an annual increase of 0.041C per year. The monthly mean of TMRF have increased
significantly for the months February, March, April May, July, August, September, whereas
it shows decreasing trend in January, June, October, November, and December. The highest
increase in TMRF occurs in August by 1.463 mm during the last 32 years. The highest
decrease in TMRF occurs in November and decreased by 0.1.60 mm. the annual mean of
monthly mean of total mean rainfall observed an increasing trend having an increase of 0.482
mm per year. In winter total mean rainfall observed a deceasing trend of 1.291 mm per day
where as in summer increasing trend by 0.64 mm and in monsoon slightly increase trend by
1.12 mm per year in Junagadh station. Annual MMAX temperature shows increasing trend
which is statistically significant at 5% level of significance whereas annual TMRF shows
increasing trend which is statistically insignificant at 5% level of significance.
Keywords: Rainfall, maximum temperature, trend analysis, Mann-Kendall test, rainfall
pattern, global warming
1. Introduction
Climate change has brought in unexpected changes not only in India but all over the regions
across the world. Emergence of global warming due to climate change is the new and most
talked subject of today’s world as it being the most threatening issue for very existence of life
on the earth. One of the consequences of climate change is the alteration of rainfall patterns
and increase in temperature. According to Intergovernmental Panel on Climate Change
(IPCC,2007) reports, the surface temperature of the earth has risen by 0.6+ 0.20C over the
20th century. Also in the last 50 years, the rise in temperature has been 0.13 + 0.070C per
decade. As the warming depends on emissions of GHGs in the atmosphere, the IPCC has
projected a warming of about 0.20C per decade.
Further, surface air temperature could rise by between 1.10C to 6.40C over 21st century. In
case of India, the climate change expected to adversely affect its natural resources, forestry,
A case study of temperature and rainfall trends using Mann-Kendall test in Saurashtra Region (Junagadh) of
Gujaart, India
Chinchorkar S. S et al., International Journal of Environmental Sciences Volume 6 No.6 2016
955
agriculture, and change in precipitation, temperature, monsoon timing and extreme events (M.
H. Fulekar, R.K. Kale, 2010). Due to global warming, precipitation amount, type and timing
are changing or are expected to change because of increased evaporation, especially in the
tropics (Ritter, 2006). The pattern and amount of rainfall are among the most important
factors that affects agricultural production. Agriculture is vital to India’s economy and the
livelihood of its people. Agriculture is contributing 21% to the country’s GDP, accounting for
115 of total export, employing 56.4% of the total workforce, and supporting 600 million
people directly and indirectly (Beena Shah, 2010). The analysis of rainfall records for long
periods provides information about rainfall patterns and variability (Lazaro et. al., 2001). The
main objective of this paper is to analyze the 1980 to 2011 rainfall and temperature records
obtained from Junagadh Agricultural University Junagadh, Gujarat as a basis on
sustainability of crop production.
2. Climate Change
Several studies relating to changing pattern of rainfall over India observed that there is no
clear trend of increase or decrease in average rainfall over the country (Mooley and
Parthasarathy, 1984; Thapliyal and Kulshrestha, 1991; Lal, 2001; Kumar et al., 2010).
Although long-term trends in monsoon rainfall have not been observed on an all-India scale,
several studies have found significant trends in rainfall on a regional scale (Koteswaram and
Alvi, 1969; Jagannathan and Parthasarathy, 1973; Raghavendra, 1974; Chaudhary and
Abhyankar, 1979; Kumar et al., 2005; Dash et al., 2007; Kumar and Jain, 2010). In India, the
climate change is expected to adversely cause changes in precipitation, temperature, monsoon
timing and extreme events (Fulekar and Kale 2010). Due to global warming, precipitation
amount, type and timing are changing or are expected to change because of increased
evaporation, especially in the tropics (Ritter, 2006). The pattern and amount of the rainfall are
among the most important factors that affect agriculture production. Agriculture is vital to
India’s economy and livelihood of its people.
Agriculture is contributing 21% to the country’s GDP, employing 56.4% of the total
workforce and supporting 600 million people directly and indirectly (Beena Shah 2010). In
India despite recent progress in industrlization, the soundness of economy is significantly
dependent upon the gross production of agricultural commodities and agriculture is the
mainstay of millions of teeming population with crops pre-dominantly dependent upon
natural rainfall. Excepting the south-eastern part of the peninsula and Jammu and Kashmir,
the south west monsoon (June – Sept.) is the principle source of rain in the entire country.
During monsoonal period more than 75% of annual rainfall is received over a major portion
of the country. India’s economy has traditionally been agricultural in nature and excess
climate anomalies, deficient and flooded rainfall years have a dramatic impact on the
economy as well as on the living conditions of the inhabitants of the affected regions
(Parthasarthy et al. 1988). The green revolution on technology has increased the rice and
other food grain production and productivity substantially.
3. Study Area
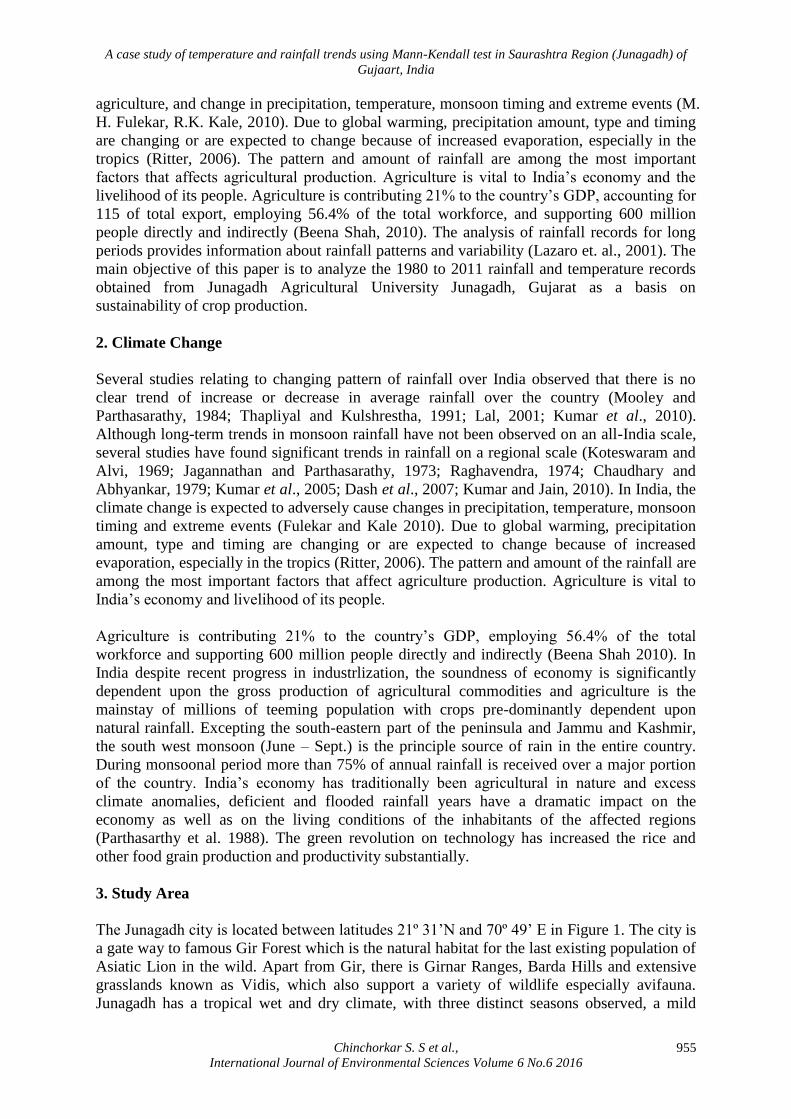
The Junagadh city is located between latitudes 21º 31’N and 70º 49’ E in Figure 1. The city is
a gate way to famous Gir Forest which is the natural habitat for the last existing population of
Asiatic Lion in the wild. Apart from Gir, there is Girnar Ranges, Barda Hills and extensive
grasslands known as Vidis, which also support a variety of wildlife especially avifauna.
Junagadh has a tropical wet and dry climate, with three distinct seasons observed, a mild
A case study of temperature and rainfall trends using Mann-Kendall test in Saurashtra Region (Junagadh) of
Gujaart, India
Chinchorkar S. S et al., International Journal of Environmental Sciences Volume 6 No.6 2016
956
winter from November to February, a hot summer from March to June, and a monsoon from
July to October. Junagadh faces adverse climatic conditions in the summer months with the
temperature ranging from 28° Celsius to 38° Celsius. In the winter months, the temperature
ranges from 10° Celsius to 25° Celsius. Various factors such as its close proximity to the sea
influence the weather of Junagadh. The latent winds from the sea affect the climatic
conditions in the region.
Figure 1: Location map of study area
4. Data and Methodology
The data used in this paper are the monthly averages of total mean rainfall, minimum and
maximum atmospheric temperatures during 1980-2011 (32 years). The time series is made up
of four components known as seasonal, trend, cyclical and irregular (Patterson, [11]). Trend
is defined as the general movement of a series over an extended period of time or it is the
long term change in the dependent variable over a long period of time (Webber and Hawkins,
[18]). Trend is determined by the relationship between the two variables as temperature and
time, rainfall and time. The statistical methods such as regression analysis and coefficient of
determination R2 (Murray R. Spiegel, Larry J. Stephens, [10]) are used. The magnitudes of
the trends of increasing or decreasing maximum temperatures and total mean rainfall were
derived and tested by the Mann-Kendall (M-K),[9] trend test and slope of the regression line
using the least squares method.
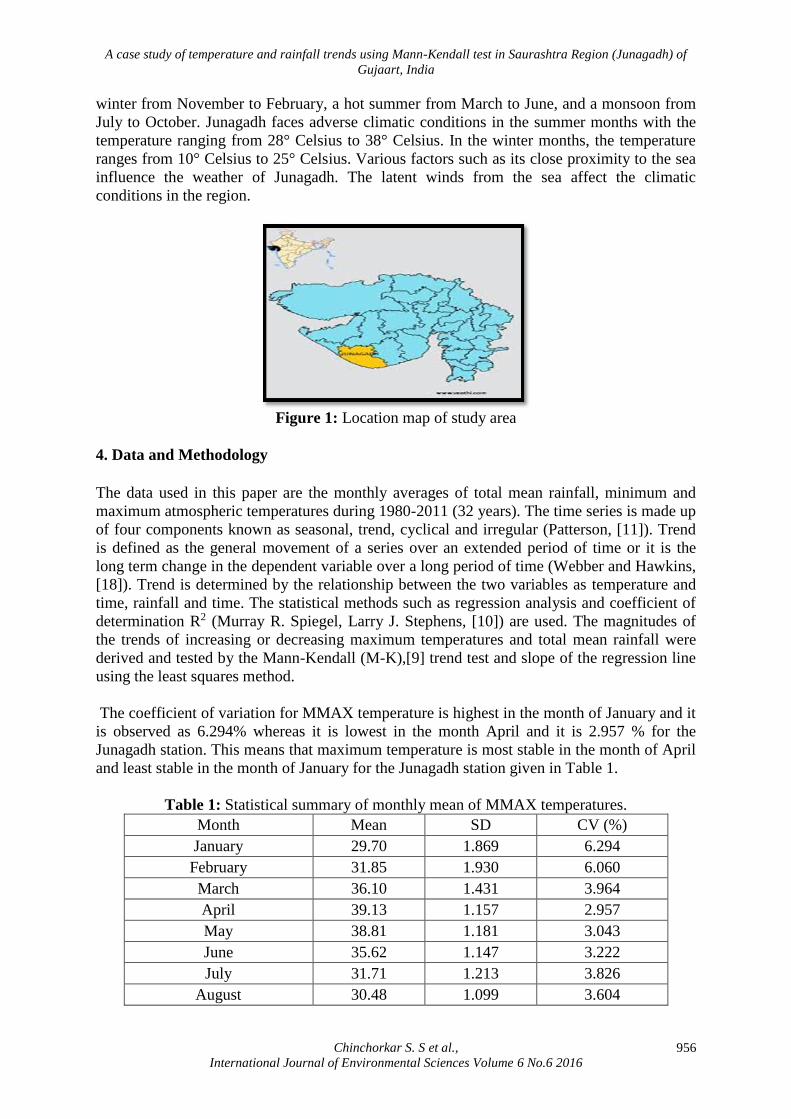
The coefficient of variation for MMAX temperature is highest in the month of January and it
is observed as 6.294% whereas it is lowest in the month April and it is 2.957 % for the
Junagadh station. This means that maximum temperature is most stable in the month of April
and least stable in the month of January for the Junagadh station given in Table 1.
Table 1: Statistical summary of monthly mean of MMAX temperatures.
Month Mean SD CV (%)
January 29.70 1.869 6.294
February 31.85 1.930 6.060
March 36.10 1.431 3.964
April 39.13 1.157 2.957
May 38.81 1.181 3.043
June 35.62 1.147 3.222
July 31.71 1.213 3.826
August 30.48 1.099 3.604
A case study of temperature and rainfall trends using Mann-Kendall test in Saurashtra Region (Junagadh) of
Gujaart, India
Chinchorkar S. S et al., International Journal of Environmental Sciences Volume 6 No.6 2016
957
September 32.72 1.249 3.819
October 35.77 1.415 3.955
November 34.10 1.144 3.355
December 31.15 1.214 3.897
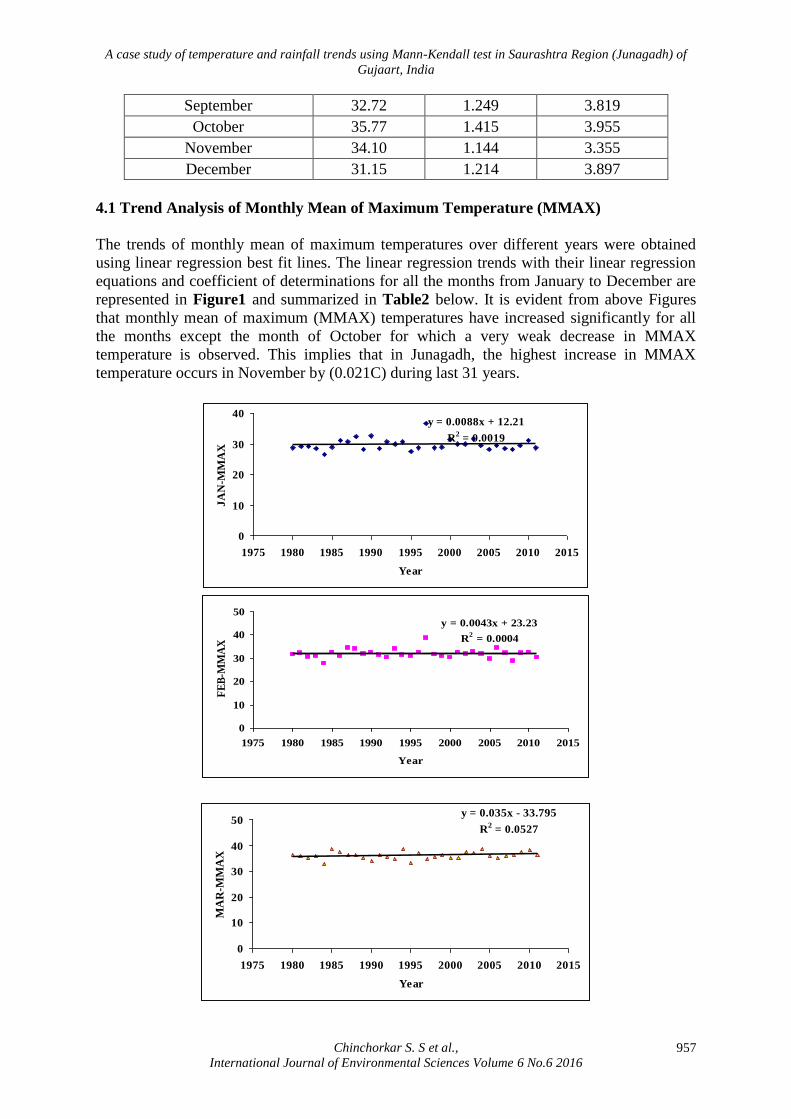
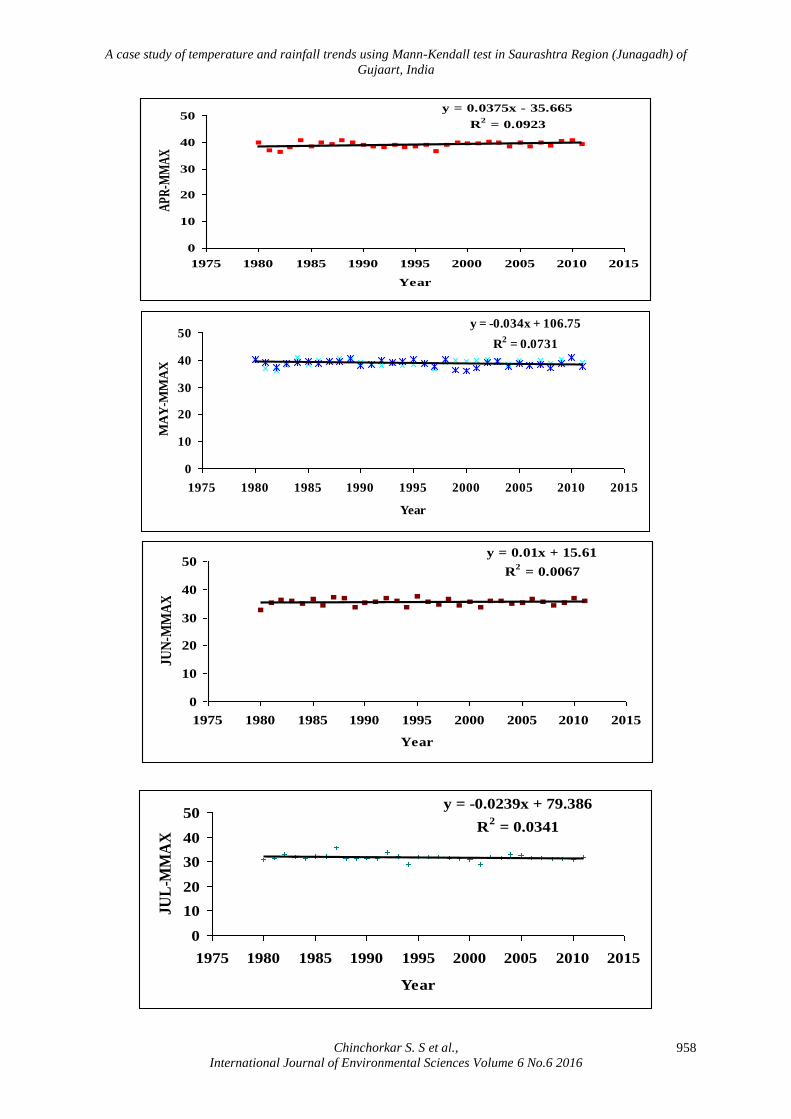
4.1 Trend Analysis of Monthly Mean of Maximum Temperature (MMAX)
The trends of monthly mean of maximum temperatures over different years were obtained
using linear regression best fit lines. The linear regression trends with their linear regression
equations and coefficient of determinations for all the months from January to December are
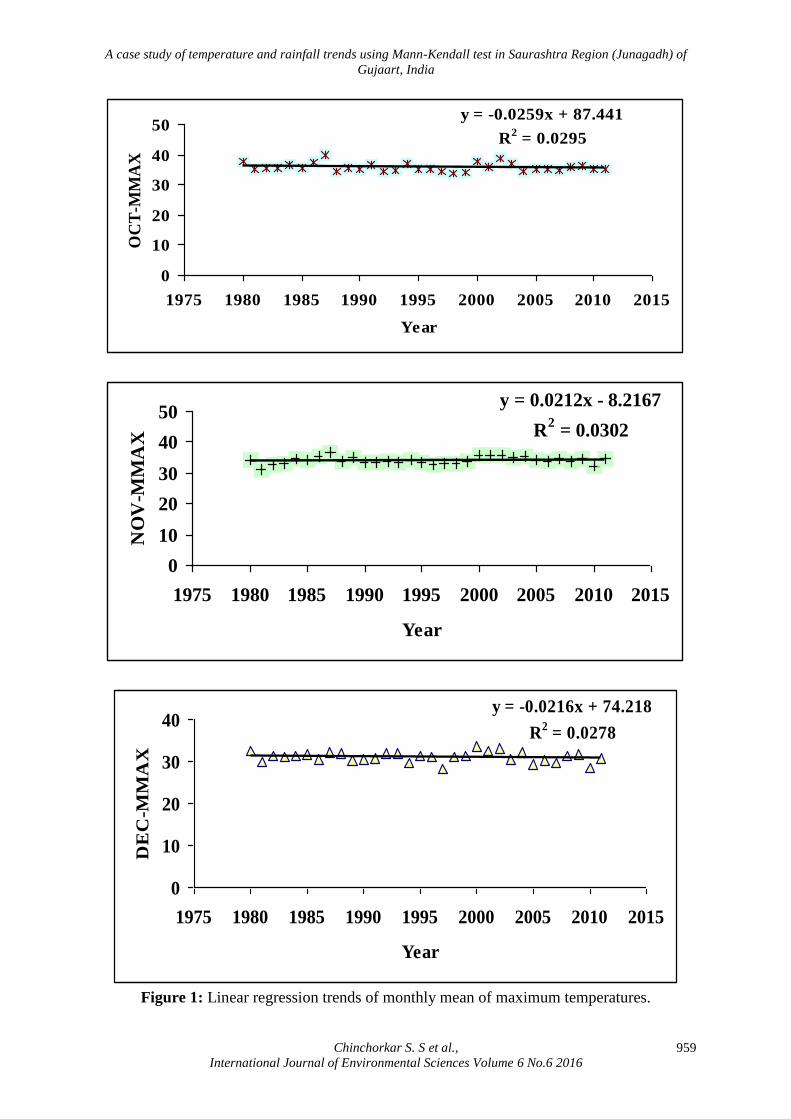
represented in Figure1 and summarized in Table2 below. It is evident from above Figures
that monthly mean of maximum (MMAX) temperatures have increased significantly for all
the months except the month of October for which a very weak decrease in MMAX
temperature is observed. This implies that in Junagadh, the highest increase in MMAX
temperature occurs in November by (0.021C) during last 31 years.
y = 0.0088x + 12.21
R2 = 0.0019
0
10
20
30
40
1975 1980 1985 1990 1995 2000 2005 2010 2015
Year
JA
N-M
MA
X
y = 0.0043x + 23.23
R2 = 0.0004
0
10
20
30
40
50
1975 1980 1985 1990 1995 2000 2005 2010 2015
Year
FE
B-M
MA
X
y = 0.035x - 33.795
R2 = 0.0527
0
10
20
30
40
50
1975 1980 1985 1990 1995 2000 2005 2010 2015
Year
MA
R-M
MA
X
A case study of temperature and rainfall trends using Mann-Kendall test in Saurashtra Region (Junagadh) of
Gujaart, India
Chinchorkar S. S et al., International Journal of Environmental Sciences Volume 6 No.6 2016
958
y = 0.0375x - 35.665
R2 = 0.0923
0
10
20
30
40
50
1975 1980 1985 1990 1995 2000 2005 2010 2015
Year
AP
R-M
MA
X
y = -0.034x + 106.75
R2 = 0.0731
0
10
20
30
40
50
1975 1980 1985 1990 1995 2000 2005 2010 2015
Year
MA
Y-M
MA
X
y = 0.01x + 15.61
R2 = 0.0067
0
10
20
30
40
50
1975 1980 1985 1990 1995 2000 2005 2010 2015
Year
JUN
-MM
AX
y = -0.0239x + 79.386
R2 = 0.0341
0
10
20
30
40
50
1975 1980 1985 1990 1995 2000 2005 2010 2015
Year
JUL
-MM
AX
A case study of temperature and rainfall trends using Mann-Kendall test in Saurashtra Region (Junagadh) of
Gujaart, India
Chinchorkar S. S et al., International Journal of Environmental Sciences Volume 6 No.6 2016
959
y = -0.0259x + 87.441
R2 = 0.0295
0
10
20
30
40
50
1975 1980 1985 1990 1995 2000 2005 2010 2015
Year
OC
T-M
MA
X
y = 0.0212x - 8.2167
R2 = 0.0302
0
10
20
30
40
50
1975 1980 1985 1990 1995 2000 2005 2010 2015
Year
NO
V-M
MA
X
y = -0.0216x + 74.218
R2 = 0.0278
0
10
20
30
40
1975 1980 1985 1990 1995 2000 2005 2010 2015
Year
DE
C-M
MA
X
Figure 1: Linear regression trends of monthly mean of maximum temperatures.
A case study of temperature and rainfall trends using Mann-Kendall test in Saurashtra Region (Junagadh) of
Gujaart, India
Chinchorkar S. S et al., International Journal of Environmental Sciences Volume 6 No.6 2016
960
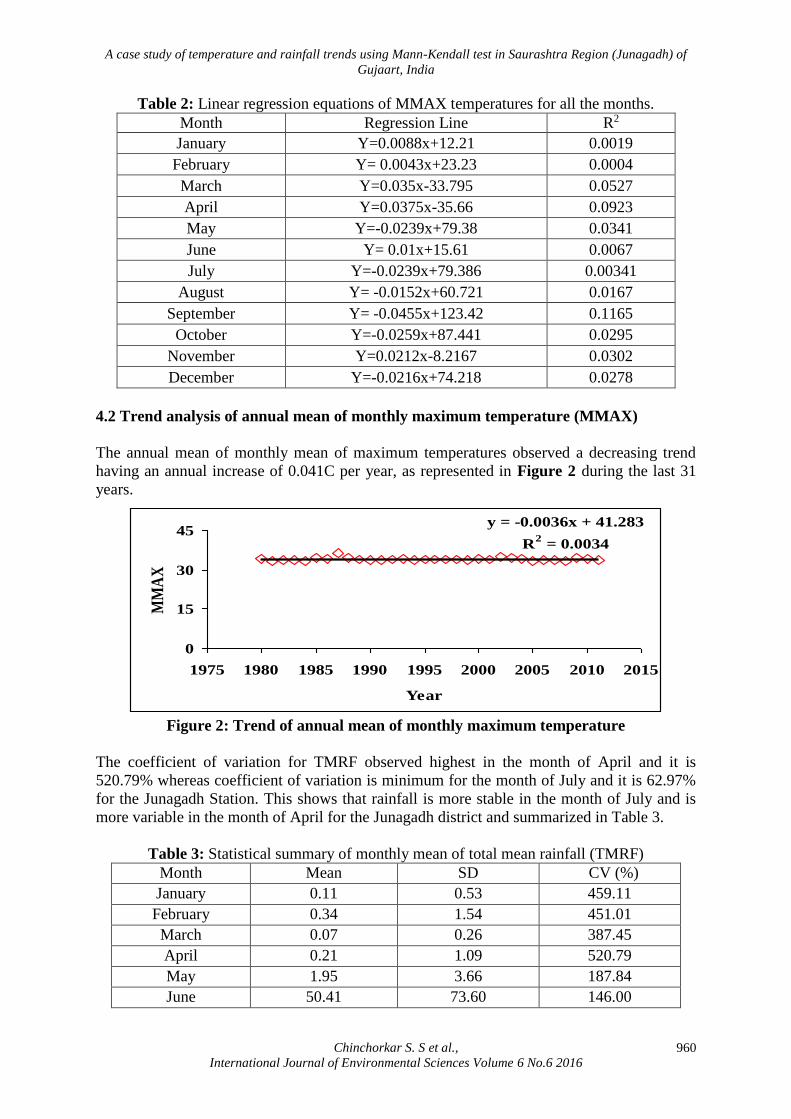
Table 2: Linear regression equations of MMAX temperatures for all the months.
Month Regression Line R2
January Y=0.0088x+12.21 0.0019
February Y= 0.0043x+23.23 0.0004
March Y=0.035x-33.795 0.0527
April Y=0.0375x-35.66 0.0923
May Y=-0.0239x+79.38 0.0341
June Y= 0.01x+15.61 0.0067
July Y=-0.0239x+79.386 0.00341
August Y= -0.0152x+60.721 0.0167
September Y= -0.0455x+123.42 0.1165
October Y=-0.0259x+87.441 0.0295
November Y=0.0212x-8.2167 0.0302
December Y=-0.0216x+74.218 0.0278
4.2 Trend analysis of annual mean of monthly maximum temperature (MMAX)
The annual mean of monthly mean of maximum temperatures observed a decreasing trend
having an annual increase of 0.041C per year, as represented in Figure 2 during the last 31
years.
y = -0.0036x + 41.283
R2 = 0.0034
0
15
30
45
1975 1980 1985 1990 1995 2000 2005 2010 2015
Year
MM
AX
Figure 2: Trend of annual mean of monthly maximum temperature
The coefficient of variation for TMRF observed highest in the month of April and it is
520.79% whereas coefficient of variation is minimum for the month of July and it is 62.97%
for the Junagadh Station. This shows that rainfall is more stable in the month of July and is
more variable in the month of April for the Junagadh district and summarized in Table 3.
Table 3: Statistical summary of monthly mean of total mean rainfall (TMRF)
Month Mean SD CV (%)
January 0.11 0.53 459.11
February 0.34 1.54 451.01
March 0.07 0.26 387.45
April 0.21 1.09 520.79
May 1.95 3.66 187.84
June 50.41 73.60 146.00
A case study of temperature and rainfall trends using Mann-Kendall test in Saurashtra Region (Junagadh) of
Gujaart, India
Chinchorkar S. S et al., International Journal of Environmental Sciences Volume 6 No.6 2016
961
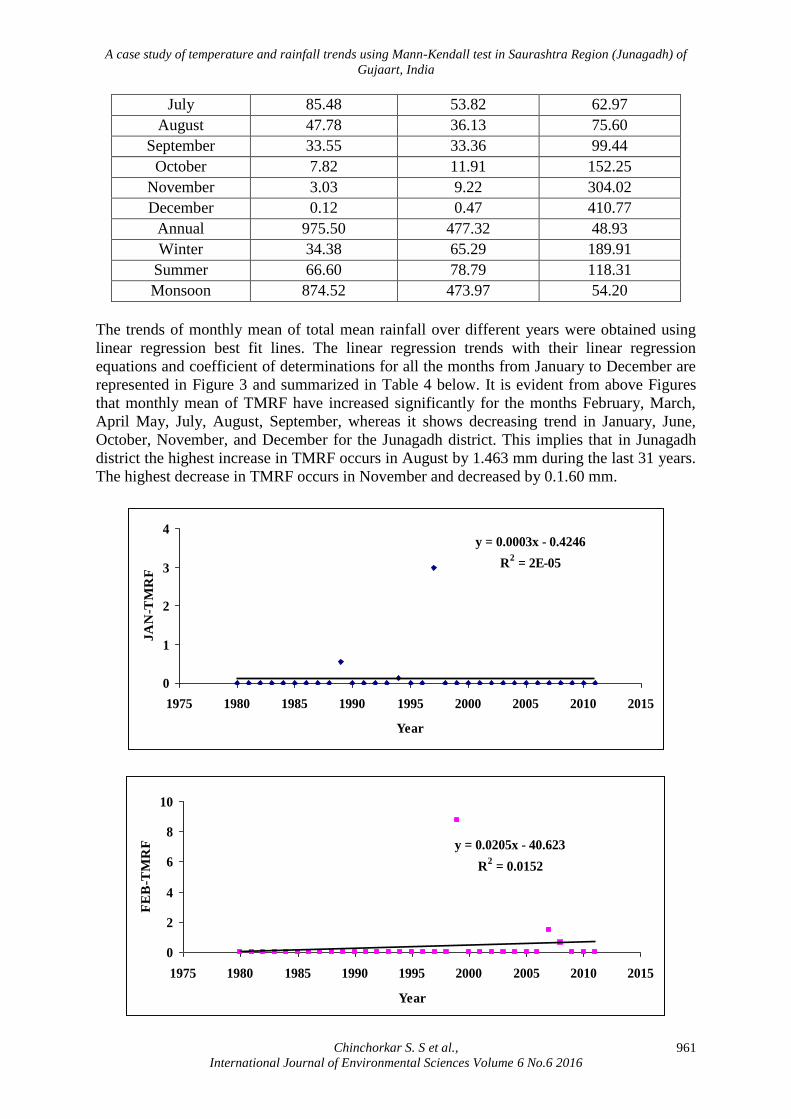
July 85.48 53.82 62.97
August 47.78 36.13 75.60
September 33.55 33.36 99.44
October 7.82 11.91 152.25
November 3.03 9.22 304.02
December 0.12 0.47 410.77
Annual 975.50 477.32 48.93
Winter 34.38 65.29 189.91
Summer 66.60 78.79 118.31
Monsoon 874.52 473.97 54.20
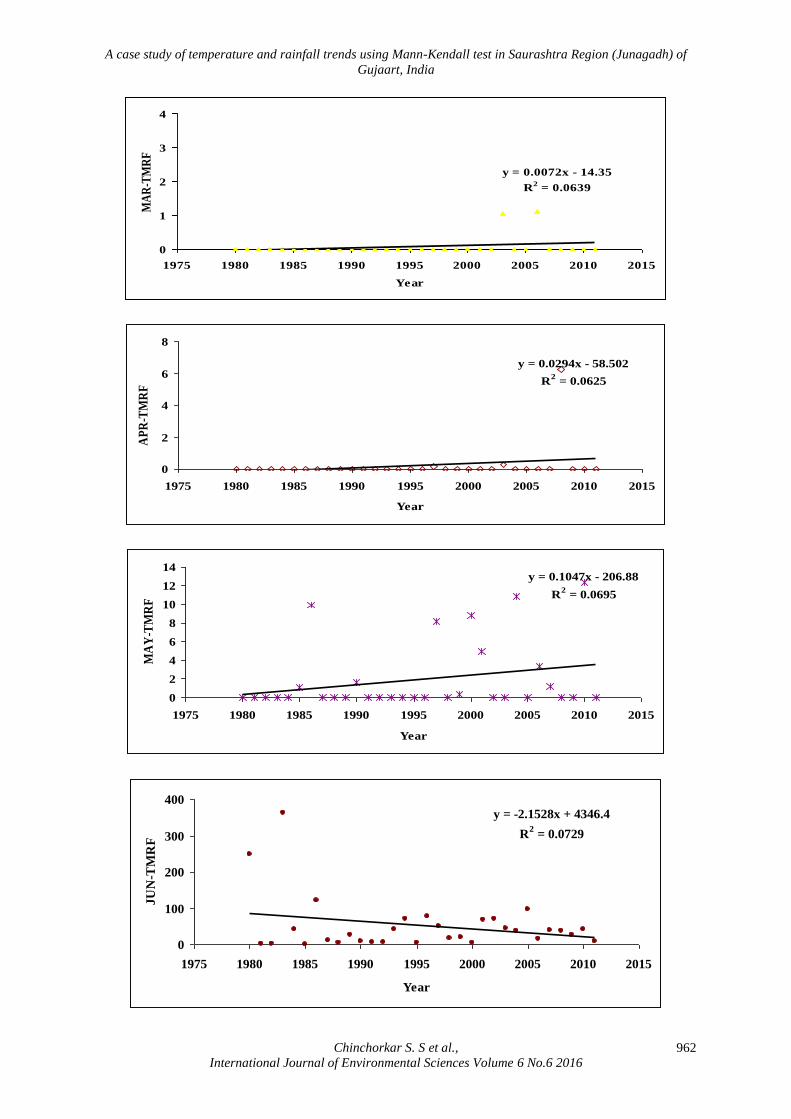
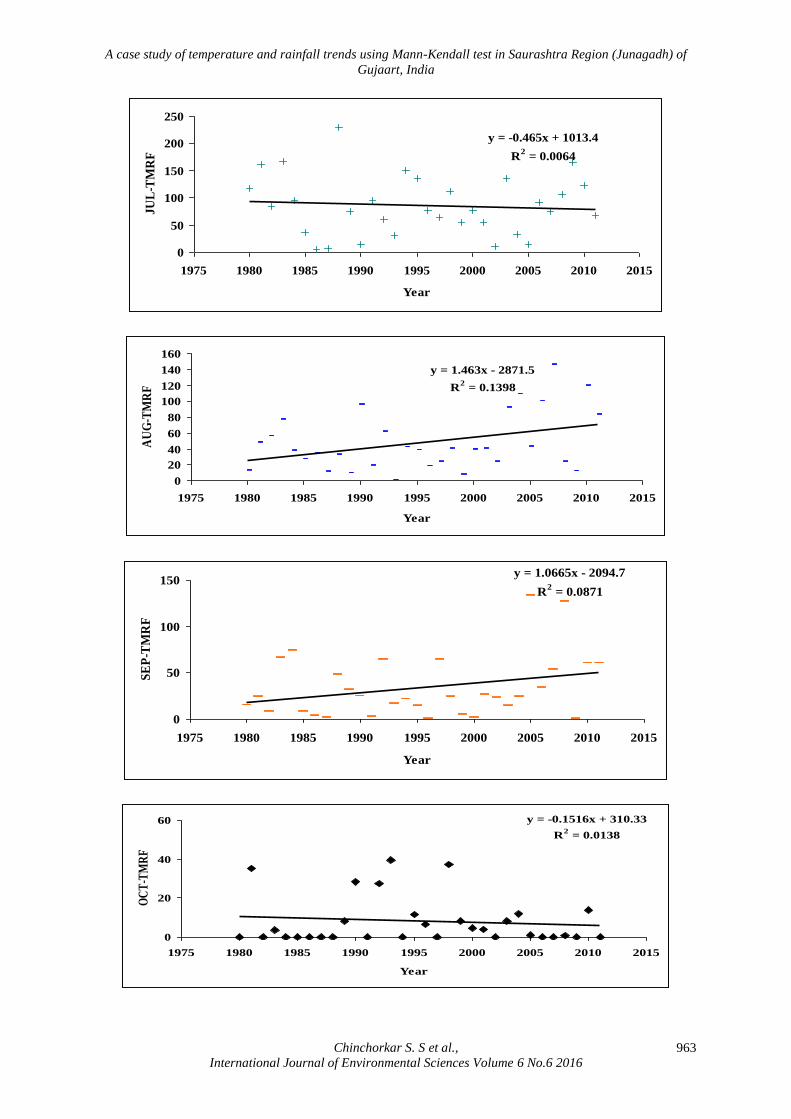
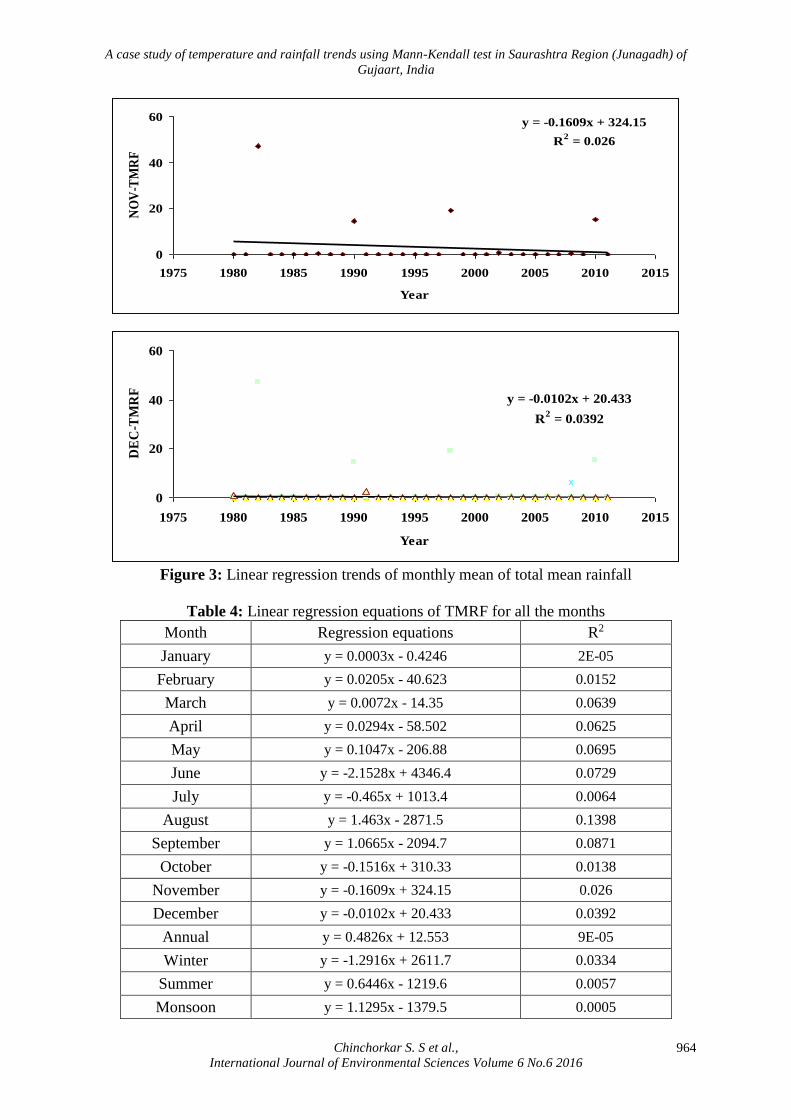
The trends of monthly mean of total mean rainfall over different years were obtained using
linear regression best fit lines. The linear regression trends with their linear regression
equations and coefficient of determinations for all the months from January to December are
represented in Figure 3 and summarized in Table 4 below. It is evident from above Figures
that monthly mean of TMRF have increased significantly for the months February, March,
April May, July, August, September, whereas it shows decreasing trend in January, June,
October, November, and December for the Junagadh district. This implies that in Junagadh
district the highest increase in TMRF occurs in August by 1.463 mm during the last 31 years.
The highest decrease in TMRF occurs in November and decreased by 0.1.60 mm.
y = 0.0003x - 0.4246
R2 = 2E-05
0
1
2
3
4
1975 1980 1985 1990 1995 2000 2005 2010 2015
Year
JA
N-T
MR
F
y = 0.0205x - 40.623
R2 = 0.0152
0
2
4
6
8
10
1975 1980 1985 1990 1995 2000 2005 2010 2015
Year
FE
B-T
MR
F
A case study of temperature and rainfall trends using Mann-Kendall test in Saurashtra Region (Junagadh) of
Gujaart, India
Chinchorkar S. S et al., International Journal of Environmental Sciences Volume 6 No.6 2016
962
y = 0.0072x - 14.35
R2 = 0.0639
0
1
2
3
4
1975 1980 1985 1990 1995 2000 2005 2010 2015
Year
MA
R-T
MR
F
y = 0.0294x - 58.502
R2 = 0.0625
0
2
4
6
8
1975 1980 1985 1990 1995 2000 2005 2010 2015
Year
AP
R-T
MR
F
y = 0.1047x - 206.88
R2 = 0.0695
0
2
4
6
8
10
12
14
1975 1980 1985 1990 1995 2000 2005 2010 2015
Year
MA
Y-T
MR
F
y = -2.1528x + 4346.4
R2 = 0.0729
0
100
200
300
400
1975 1980 1985 1990 1995 2000 2005 2010 2015
Year
JU
N-T
MR
F
A case study of temperature and rainfall trends using Mann-Kendall test in Saurashtra Region (Junagadh) of
Gujaart, India
Chinchorkar S. S et al., International Journal of Environmental Sciences Volume 6 No.6 2016
963
y = -0.465x + 1013.4
R2 = 0.0064
0
50
100
150
200
250
1975 1980 1985 1990 1995 2000 2005 2010 2015
Year
JU
L-T
MR
F
y = 1.463x - 2871.5
R2 = 0.1398
0
20
40
60
80
100
120
140
160
1975 1980 1985 1990 1995 2000 2005 2010 2015
Year
AU
G-T
MR
F
y = 1.0665x - 2094.7
R2 = 0.0871
0
50
100
150
1975 1980 1985 1990 1995 2000 2005 2010 2015
Year
SE
P-T
MR
F
y = -0.1516x + 310.33
R2 = 0.0138
0
20
40
60
1975 1980 1985 1990 1995 2000 2005 2010 2015
Year
OC
T-T
MR
F
A case study of temperature and rainfall trends using Mann-Kendall test in Saurashtra Region (Junagadh) of
Gujaart, India
Chinchorkar S. S et al., International Journal of Environmental Sciences Volume 6 No.6 2016
964
y = -0.1609x + 324.15
R2 = 0.026
0
20
40
60
1975 1980 1985 1990 1995 2000 2005 2010 2015
Year
NO
V-T
MR
F
y = -0.0102x + 20.433
R2 = 0.0392
0
20
40
60
1975 1980 1985 1990 1995 2000 2005 2010 2015
Year
DE
C-T
MR
F
Figure 3: Linear regression trends of monthly mean of total mean rainfall
Table 4: Linear regression equations of TMRF for all the months
Month Regression equations R2
January y = 0.0003x - 0.4246 2E-05
February y = 0.0205x - 40.623 0.0152
March y = 0.0072x - 14.35 0.0639
April y = 0.0294x - 58.502 0.0625
May y = 0.1047x - 206.88 0.0695
June y = -2.1528x + 4346.4 0.0729
July y = -0.465x + 1013.4 0.0064
August y = 1.463x - 2871.5 0.1398
September y = 1.0665x - 2094.7 0.0871
October y = -0.1516x + 310.33 0.0138
November y = -0.1609x + 324.15 0.026
December y = -0.0102x + 20.433 0.0392
Annual y = 0.4826x + 12.553 9E-05
Winter y = -1.2916x + 2611.7 0.0334
Summer y = 0.6446x - 1219.6 0.0057
Monsoon y = 1.1295x - 1379.5 0.0005
A case study of temperature and rainfall trends using Mann-Kendall test in Saurashtra Region (Junagadh) of
Gujaart, India
Chinchorkar S. S et al., International Journal of Environmental Sciences Volume 6 No.6 2016
965
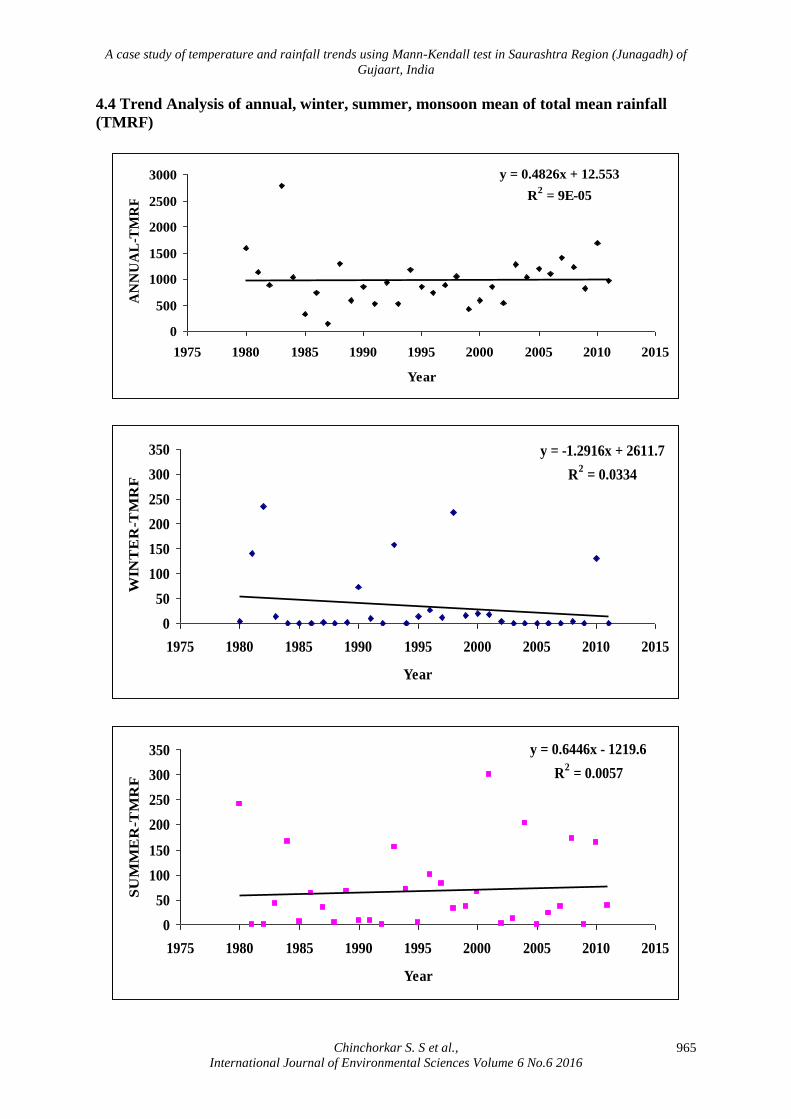
4.4 Trend Analysis of annual, winter, summer, monsoon mean of total mean rainfall
(TMRF)
y = 0.4826x + 12.553
R2 = 9E-05
0
500
1000
1500
2000
2500
3000
1975 1980 1985 1990 1995 2000 2005 2010 2015
Year
AN
NU
AL
-TM
RF
y = -1.2916x + 2611.7
R2 = 0.0334
0
50
100
150
200
250
300
350
1975 1980 1985 1990 1995 2000 2005 2010 2015
Year
WIN
TE
R-T
MR
F
y = 0.6446x - 1219.6
R2 = 0.0057
0
50
100
150
200
250
300
350
1975 1980 1985 1990 1995 2000 2005 2010 2015
Year
SU
MM
ER
-TM
RF
A case study of temperature and rainfall trends using Mann-Kendall test in Saurashtra Region (Junagadh) of
Gujaart, India
Chinchorkar S. S et al., International Journal of Environmental Sciences Volume 6 No.6 2016
966
y = 1.1295x - 1379.5
R2 = 0.0005
0
500
1000
1500
2000
2500
3000
1975 1980 1985 1990 1995 2000 2005 2010 2015
Year
MO
NS
OO
N-T
MR
F
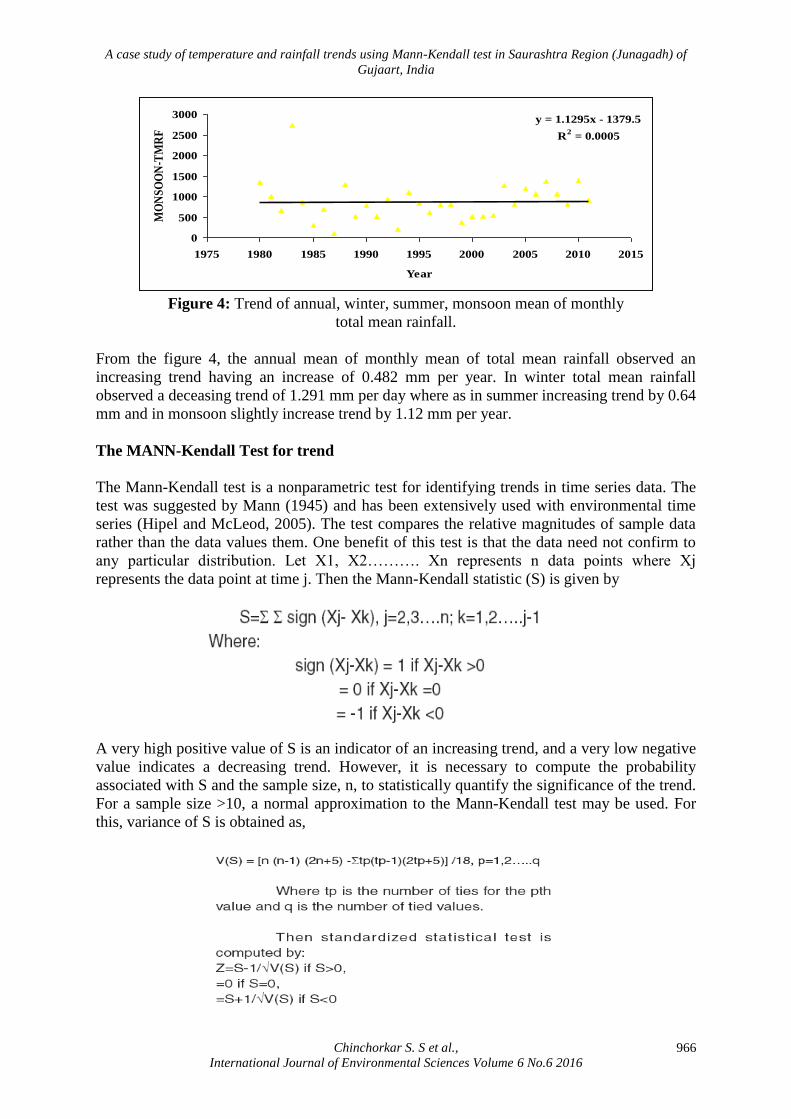
Figure 4: Trend of annual, winter, summer, monsoon mean of monthly
total mean rainfall.
From the figure 4, the annual mean of monthly mean of total mean rainfall observed an
increasing trend having an increase of 0.482 mm per year. In winter total mean rainfall
observed a deceasing trend of 1.291 mm per day where as in summer increasing trend by 0.64
mm and in monsoon slightly increase trend by 1.12 mm per year.
The MANN-Kendall Test for trend
The Mann-Kendall test is a nonparametric test for identifying trends in time series data. The
test was suggested by Mann (1945) and has been extensively used with environmental time
series (Hipel and McLeod, 2005). The test compares the relative magnitudes of sample data
rather than the data values them. One benefit of this test is that the data need not confirm to
any particular distribution. Let X1, X2………. Xn represents n data points where Xj
represents the data point at time j. Then the Mann-Kendall statistic (S) is given by
A very high positive value of S is an indicator of an increasing trend, and a very low negative
value indicates a decreasing trend. However, it is necessary to compute the probability
associated with S and the sample size, n, to statistically quantify the significance of the trend.
For a sample size >10, a normal approximation to the Mann-Kendall test may be used. For
this, variance of S is obtained as,
A case study of temperature and rainfall trends using Mann-Kendall test in Saurashtra Region (Junagadh) of
Gujaart, India
Chinchorkar S. S et al., International Journal of Environmental Sciences Volume 6 No.6 2016
967
The presence of a statistically significant trend is evaluated using Z value.
5. Conclusions
It is observed that the long–term change in temperature and rainfall has been assessed by
linear trend analysis. It is evident from above figures that monthly mean of maximum
(MMAX) temperatures have increased significantly for all the months except the month of
October for which a very weak decrease in MMAX temperature is observed. This implies
that in Junagadh, the highest increase in MMAX temperature occurs in November by
(0.021C) during last 32 years. The annual mean of monthly mean of maximum temperatures
observed an decreasing trend having an annual increase of 0.041C per year. The monthly
mean of TMRF have increased significantly for the months February, March, April May, July,
August, September, whereas it shows decreasing trend in January, June, October, November,
and December.The highest increase in TMRF occurs in August by 1.463 mm during the last
32 years. The highest decrease in TMRF occurs in November and decreased by 0.1.60 mm.
the annual mean of monthly mean of total mean rainfall observed an increasing trend having
an increase of 0.482 mm per year. In winter total mean rainfall observed an deceasing trend
of 1.291 mm per day where as in summer increasing trend by 0.64 mm and in monsoon
slightly increase trend by 1.12 mm per year in Junagadh station. Annual MMAX temperature
shows increasing trend which is statistically significant at 5% level of significance whereas
annual TMRF shows increasing trend which is statistically insignificant at 5% level of
significance.
6. References
1. Beena Shah, (2010), Global and National Concerns on Climate Change,‖ University
News, 48(24), pp 15-23.
2. Chaudhary A, Abhyankar VP., (1979), Does precipitation pattern foretell Gujarat
climate becoming arid. Mausam 30, pp 85–90.
3. Dash SK, Jenamani RK, Kalsi SR, Panda SK., (2007), Some evidence of climate
change in twentieth-century India, Climatic Change 85, pp 299–321.
4. Deshmukh, D. T., Lunge, H. S., (2013), A Study of Temperature and Rainfall Trends
In. Buldana District of Vidarbha, India. International Journal of Scientific &
Technology Research, 2(2).
5. Fulekar, M.H., Kale, R.K., (2010), Impact of Climate Change: Indian Scenario,
University News, 48(24), pp 15-23.
6. IPCC, Climate Change-A Synthesis Report of the IPCC, Technical Report, Inter
governmental Panel on Climate Change (2007).
7. Jagannathan P, Parthasarathy B, (1973), Trends and periodicities of rainfall over India,
Monthly Weather Review, 101, pp 371–375.
A case study of temperature and rainfall trends using Mann-Kendall test in Saurashtra Region (Junagadh) of
Gujaart, India
Chinchorkar S. S et al., International Journal of Environmental Sciences Volume 6 No.6 2016
968
8. Jestinos Mzezewa, Titus Misi and Leon D van Rensburg, (2009), Characterization of
rainfall at a semi-arid ecotope in the Limpopo Province (South Africa) and its
implications for sustainable crop production.
9. Julious M. Huho, Josephine K.W. Ngaira, Harun O.Ogindo and Nelly Masayi, (2012),
The changing rainfall pattern and the associated impacts on subsistence agriculture in
Laikipia East District, Kenya,‖ Journal of Geography and Regional Planning, 5(7), pp
198-206.
10. Koteswaram P, Alvi SMA, (1969), Secular trends and periodicities in rainfall at west
coast stations in India, Current Science 38, pp 229–231.
11. Kumar V, Singh P, Jain SK, (2005), Rainfall trends over Himachal Pradesh, Western
Himalaya, India. In: Development of Hydro Power Projects – A Prospective
Challenge. Conference, Shimla, pp 20–22.
12. Kumar V, Jain SK, Singh Y, (2010), Analysis of long-term rainfall trends in India,
Hydrological Sciences Journal 55(4), pp 484–496
13. Lal M, (2001), Climatic change – implications for India’s water resources. Journal of
Indian Water Resource Society 21, pp 101–119.
14. Lazaro R, Rodrigo FS, Gutierrez L, (2001), Domingo Fand Puigdefafregas J
―Analysis of a 30-year rainfall record (1967-1997) in semi-arid SE Spain for
implications on vegetation, J. Arid Environ. 48, pp 373-395.
15. Mooley DA, Parthasarthy B, (1984), Fluctuations of all India summer monsoon
rainfall during 1871–1978. Climatic Change 6, pp 287–301.
16. Murray R. Spigel, Larry J. Stephens, Schaum’s outlines Statistics, third edition,
TATA Mcgraw-Hill Edition, (2000).
17. Mann, H.B., (1945), Nonparametric tests against trend, Econometrica, 13, pp 245-259.
18. Parthasarthy, B. A.A. Munot and D.R. Kothawale, (1988), Regression model for
estimation of India’s food grain production from summer monsoon rainfall.
Agricultural and Forest Meteorology 42, pp 167-182.
19. Patterson, P.E. ―Statistical Methods‖, Richard D. Irwin INC, Homewood, IL, (1987).
20. Raghavendra VK, (1974), Trends and periodicities of rainfall in subdivisions of
Maharashtra state. Indian Journal of Meteorology and Geophysics 25, pp 197–210.
21. Ritter ME ―The physical environment: an introduction to physical Geography.
22. Del Rio S, R.Fraile, L. Herrero and A.Penas, ―Analysis of Recent Trends in Mean
Maximum and Minimum Temperatures in a Region of the NW of Spain (Castillay
Leon), Theorotical and Applied Climatology, 90(1-2), pp 1-12.

A case study of temperature and rainfall trends using Mann-Kendall test in Saurashtra Region (Junagadh) of
Gujaart, India
Chinchorkar S. S et al., International Journal of Environmental Sciences Volume 6 No.6 2016
969
23. Thapliyal V, Kulshrestha SM, (1991), Decadal changes and trends over India,
Mausam, 42, pp 333–338.
24. Webber, J. and Hawkins, C. Statistical Analysis Application to Business and
Economics, Harper and Row, New York,(1980).