Embed Size (px)
Citation preview

1
Article 2
A Case Study of Smart Grid Station in Guri Branch 3
Office of KEPCO 4
Jaehong Whang 1, Woohyun Hwang 2, Yeuntae Yoo 3 and Gilsoo Jang 3,* 5 1 Graduate School of Energy and Environment, Korea University, Seoul 02841, Korea; [email protected] 6 2 Jeju Headquarters, Korea Electric Power Corporation, Jeju-do 63121, Korea; [email protected] 7 3 School of electrical Engineering, Korea University, Seoul 02841, Korea; [email protected] 8 * Correspondence: [email protected] Tel.: +82-2-3290-3246 9
10
Abstract: Climate change and global warming are becoming important problems around the globe. 11 To prevent these environmental problems, many countries try to reduce the emissions of 12 greenhouse gases (GHG) and manage the consumption of energy. In Korea, Korea Electric Power 13 Corporation (KEPCO) has introduced Smart Grid (SG) technologies to its branch office in 2014. This 14 was the first demonstration of smart grid on a building called Smart Grid Station. This paper treats 15 the achievements of the Smart Grid Station (SGS) by its early target in three aspects. The things are 16 peak reduction, power consumption reduction and electricity fee saving. The authors analyzed the 17 achievements by comparing the data of 2015 with the data of 2014. Through the evaluation, the 18 authors studied the case, proved the advantages of SGS, and suggested the requirements to improve 19 and the direction to go of the system. 20
Keywords: Smart grid, Smart Grid Station, renewable energy sources, energy management system 21 22
1. Introduction 23 FOR many years, concerns about global warming and climate change have been growing. In 24
response to these environmental problems, most developed and developing countries have had 25 meetings and looked for countermeasures. One of these efforts resulted in the Kyoto Protocol, an 26 international treaty was adopted in 1997 and took effect in 2005. However, due to the expiration of 27 the Kyoto Protocol in 2020 (Post2020), the Paris Agreement, a statement of intent to address climate 28 change problems, was signed by 195 countries at the twenty-first Conference of the Parties (COP21) 29 of the United Nations Framework Convention on Climate Change (UNFCCC), held in Paris, France, 30 in 2015. The objective of the Paris Agreement was to hold the increase in the global average 31 temperature to below a 2℃ above pre-industrial levels [1]. Unlike in the case of the Kyoto Protocol, 32 it is significant that many countries attended the COP21 autonomously, and each country set its own 33 target with regard to greenhouse gas (GHG) emissions. Table 1 shows the goals for GHG reduction 34 of some selected countries. Although the United States declared a withdrawal from the agreement, 35 other countries keep trying to contribute to the health of the environment. 36
Countries that signed the Paris Agreement summited their goals, called Intended Naturally 37 Determined Contribution (INDC), for the reduction of GHG emissions in the Paris Agreement. 38 Through the INDC, the Korean government set a goal to reduce GHG emissions by 37% compared 39 to business as usual (BAU) by 2030 [5]. As an effort, the Korean government has tried to expand 40 renewable energy generation and develop new technologies. One of the technologies is the Smart 41 Grid (SG), which is a new concept of an electrical grid integrated with information and 42 communication technologies (ICT). The SG is generally composed of distributed energy resources 43 (DERs), such as photovoltaics (PVs) and wind turbines (WTs), Operation System, energy storage 44
Preprints (www.preprints.org) | NOT PEER-REVIEWED | Posted: 10 May 2018 doi:10.20944/preprints201805.0161.v1
© 2018 by the author(s). Distributed under a Creative Commons CC BY license.

system (ESS), advanced metering infrastructure (AMI), and other smart devices [6]. The Operation 45 System can balance supply and demand in real time by monitoring and controlling the whole system 46 of a building. 47
Table 1. Goals of GHG Emissions Reduction for Selected Countries [2-5] 48
Countries Goals
China To lower carbon dioxide emissions per unit of GDP by 60% to 65% from the 2005 level
EU At least 40% domestic reduction in GHG emissions by 2030 compared to 1990
Japan At the level of GHG emission reductions of 26% by 2030 compared to 2013
South Korea GHG emission reduction by 37% from the BAU level by 2030
49 Since 2009, Korea Electric Power Corporation (KEPCO) which is a public company has installed 50
and demonstrated SG technologies. The Jeju Smart Grid Demonstration Project was the first test-bed 51 built on Jeju Island in 2009. As a comprehensive project, this had five themes: Smart Place, Smart 52 Transportation, Smart Renewable, Smart Power Grid, and Smart Service. It included renewable 53 energy resources, metering, use of electric vehicle, battery system, demand response, transmission, 54 communication, etc. Using the experience gained in the project, Smart Grid Station (SGS) was built 55 in the Guri branch office building of KEPCO in 2014 as the first demonstration on building. Smart 56 Grid Station is a term that combines smart grid with Station. Station means a place or a building that 57 can provide various services. Therefore, Smart Grid Station is a place that provides intelligent 58 electricity services to customers. KEPCO expects that the office can shave power peak and reduce 59 power consumption. Since the demonstration, the KEPCO has expanded SGS to 121 of its branch 60 offices. However, the expansion is limited in KEPCO’s internal branch offices. In other words, 61 although it has been a few years since the first SGS was built, the smart grid industry is stagnant in 62 Korea. The authors recognized an analysis was required to verify the performance of SGS and to 63 propose a direction based on an analysis comparing current real operation data with early 64 expectations. 65
2. SGS Concept and Features 66 The objectives of SGS are to optimize the usage of electricity and to reduce the electricity fee and 67
consumption in a building, with various integrated technologies. 68 When renewable energy resources connected to both grid and ESS generated power, the power 69
from renewable energy can be supplied to load directly or charged ESS. Also, the battery is charged 70 from grid when the price is low and discharged when the price of electricity on the grid is high. This 71 allows a building to save money and reduce power consumption. In this system, less energy 72 production is required by fossil fuel generators during times of peak consumption. In consequence, 73 SGS benefits the environment by reducing emissions of CO2. These effects are shown in Table 2. 74
Table 2. Details of SGS 75
Objective Reducing consumption and saving electricity fee by optimizing usage in a building
Expected Effects
• Reduce 5.0% of electricity peak in a year • Reduce 9.6% of power consumption for a year • Save electricity fee • Reduce 5.0% of CO2 for a year
Features • Remote control of demand in a building • Energy management system construction based on SG • ICT convergence on intelligent energy management
Preprints (www.preprints.org) | NOT PEER-REVIEWED | Posted: 10 May 2018 doi:10.20944/preprints201805.0161.v1

The Guri SGS project consisted of two steps. The duration of the first step was from October, 76 2013 to February, 2014, and this step was for the installation of PV, ESS, a slow-charging type of EV 77 charger, AMI, a smart distribution board, and building automation system (BAS) components. The 78 goal of the first step was to optimize the building’s energy consumption based on SG. The second 79 step was for the addition of WT, control system of the heat, ventilation, and air conditioner (HVAC), 80 and improving the Operation System. The duration of the second step was from December, 2014 to 81 June, 2015. 82
Figure 1 is a diagram of SGS components. It shows the Operating System (OS), which is a 83 software program that plays a key role in integrating other technologies. It can monitor and control 84 each element remotely and maintain the power balance by communication between various 85 components. In order to help small and mid-sized businesses, KEPCO adopted their products and 86 integrated various systems as an ICT convergence. Each component will be specified in the Section 87 3. 88
89
3. Components Description 90
3.1. Photovoltaic 91 The PV system was mounted at 30° on the rooftop. The maximum power of each module is 92
250W, and the total capacity of the system is 20kWp. The system is composed of 84 modules 93 consisting of monocrystalline silicon cells, but 4 of them are dummies. The capacity was adopted at 94 5% of the contracted power (400kW) of the Guri office. The PV system supplies the power the 95 building on weekdays, and charges a battery on weekends. Table 3 is the specification of the PV 96 system. 97
Table 3. Specification of PV System 98
Device Monocrystalline Silicon Max Power 250Wp (60 Cells)
Max Voltage 497.6V (31.1V × 16) Efficiency 15.7% Capacity 20kWp (6 by 14, 84 modules, Dummy 4)
Connection 16 series by 5 parallel 99
Figure 1. The main components of SGS
KEPCOGrid
TRRoom
DistributionBoards
AMI EV/C
PV WT
BAT
PCS
Lights
Outlets
HVAC
ESS BAS
Power LineCommunication Line
OperationSystem
Preprints (www.preprints.org) | NOT PEER-REVIEWED | Posted: 10 May 2018 doi:10.20944/preprints201805.0161.v1

The power from PV in summer season, from June to August, doesn’t charge the battery but 100 supply to building loads directly to reduce the peak and power consumption. 101
3.2. Wind Turbine 102 WT system was mounted on the rooftop from March, 2015. The PV system and the WT installed 103
as Figure 2. This WT is not influenced by the direction of the wind since it is a vertical axis type wind 104 turbines (VAWT) [7]. Also it doesn’t make noise when the turbine rotates, and cut-in wind speed is 105 light wind as 3m/s. These features make the WT system easy to install on buildings, but the rated 106 power is 1.2kW at 15m/s. Although this WT generates 53kWh for a year by Weibull performance 107 calculations, the system is hard to contribute to reduce energy because the wind doesn’t blow fast 108 enough in urban area. 109
110 111
Because this vertical type of WT has unstable output at certain wind speeds and low efficiency 112 [7,8], it has its own interconnected inverter to stabilize the output. Table 4 shows the features of WT, 113 and Table 5 shows the details of this inverter. 114
Table 4. Performance Characteristics of WT 115
Type Vertical Axis type Size 1400×1800mm Rated Power 1.2kW at 15m/s Cut-in wind speed 3m/s Extreme wind speed 52.5m/s
Table 5. Specification of WT Inverter 116
Input Rated Voltage 430Vdc Voltage Range 60~600Vdc
Output
Max Capacity 3kW (Single Phase) Rated Voltage 220Vac (±10%) Rated Frequency 60Hz (±0.5Hz) Efficiency 98% Power Factor 99%
3.3. Energy Storage System 117 ESS is composed of a battery and power conversion system (PCS). Figure 3 shows the battery 118
and PCS installed on the rooftop. The ESS can be used for either on-grid status or off-grid status. The 119 ESS has various effects: peak shaving, load leveling, providing constant voltage and constant 120 frequency (CVCF), cost reduction, load compensation and so on [9]. In this paper, the authors focused 121
Figure 2. PV and WT system at Guri Office
Preprints (www.preprints.org) | NOT PEER-REVIEWED | Posted: 10 May 2018 doi:10.20944/preprints201805.0161.v1

on peak shaving, and load shifting. Regarding of the first function, the ESS charges power from 122 renewable energy (RE) resources at the off-peak load time and discharges the power at the peak time. 123 Regarding the second function, the ESS charges a battery with the power from the grid in the evening 124 and discharges the battery in the afternoon. By cutting peak and shifting load, the electricity fee can 125 be saved. 126
The PCS converts DC-to-AC and AC-to-DC. This means that it can function both a converter and 127 an inverter. Usually, a PV system has its own inverter, but the PCS used in the SGS is a hybrid type. 128 Figure 4 is the inner connection diagram of PCS. It makes it possible to charge or discharge the power 129 of the PV, the WT, and the battery. The capacity of the PCS was determined to be 30kW, considered 130 the capacity of the PV and the battery, in that the PV system has 20kW, and the battery was estimated 131 to discharge at 10kW. 132
133
134 135
A lithium iron phosphate (LiFePO4) battery was selected, and the size is 50kWh. LiFePO4 has 136 better thermal and chemical safety than other types of batteries [10]. The capacity was designed to 137 discharge for five hours at 10kW. The life cycle is 4,000 cycles at 80% of depth of discharge. This 138 means that the battery can be used 4,000 times if it charges-and-discharges power in the range of 20% 139 to a full charge state. This range is established to prevent the battery from reaching a full discharge 140 state. The specification of the ESS is in Table 6. 141
There are three discharge schedules that the operator adjusts, and those are as follows: 142 1. Uniform discharge: Discharges uniform amount of power from battery during peak and mid-143
load times continuously 144
Figure 3. Battery (left) and PCS (right) on rooftop
Figure 4. Battery (left) and PCS (right) on rooftop
PV20kWp
WT1.2kWp
DC/DCBoost
InverterDC/AC
Battery50kWh
DC/DCBoost
InverterController
TR30kVA
Power LineCommunication Line
Preprints (www.preprints.org) | NOT PEER-REVIEWED | Posted: 10 May 2018 doi:10.20944/preprints201805.0161.v1

2. Continuous differential discharge: Continuously discharges during peak and mid-load times, 145 but the amount is different during peak load time 146
3. Non-continuous differential discharge: Discharges non-continuously during peak and mid-load 147 times, and the amount is different during peak-load time 148 In summary, the ESS charges the batteries at the off-peak load time and discharges them during 149
the peak and mid load times on weekdays. It is expected that a customer can reduce power peak by 150 5% with these schedules. 151
Table 6. Specification of ESS 152
PCS
Capacity 30kW/30kVA, 60Hz Control System PWM converter Max Efficiency 90% Power Factor Over 95%
Max Input Voltage 800Vdc from Battery 450~850Vdc from PV
Output 45A
BAT
Capacity 50kWh (25kWh × 2) Charge-Discharge Efficiency 95%
Cell Voltage 3.2V, 20Ah Rack Voltage 422.4V(11modules, 396 cells)
Nominal Voltage 422.4V (369.6V~468.6V)
3.4. Advanced Metering Infrastructure 153 An AMI installed in a transformer room of the SGS measures the amount of power supplied 154
from the grid and checks the qualities of voltage, current, and frequency. A general electricity meter 155 monitors power quality every 15 minutes, but the AMI exports the data in real-time. The exported 156 data are used to calculate the real-time electricity fee and analyze the operation status. This AMI is 157 connected in series a connection to current, and in a parallel connection to voltage. Figure 5 shows 158 the picture and the connection of the AMI, and Table 7 is the detail specification of the AMI. 159
Table 7. Specification of AMI 160
Potential Transformer AC 10~452V/110V Current Transformer 0.05~6A(rated 5A)
Measurement Voltage, Current, Freq., etc.
161
3.5. Electric Vehicle Chargers 162 Outside of the building, there are 6 EV chargers. Four of them are a slow-charging type, and the 163
others are a fast-charging type. The slow-charging type has an AC type of connector and charges the 164 EV at 7~8kW through a single phase of 220 Vac, and it takes about 5 to 6 hours to reach a full charge. 165
Figure 5. Pictures of AMI and connection line
Connection
Preprints (www.preprints.org) | NOT PEER-REVIEWED | Posted: 10 May 2018 doi:10.20944/preprints201805.0161.v1

The fast-charging type has 3 kinds of sockets: CHAdeMO, Combo, and 3-phase AC type. CHAdeMO 166 and Combo supply power in DC. The fast-charging type chargers supply power at 50kW by 167 380~450Vdc or 380Vac. However, because of the inconvenience caused by different types of 168 connectors, there is a trial to standardize the shapes of connectors currently. In fact, the EV chargers 169 are considered as loads, but potentially, they can be bridges to implement the vehicle to grid (V2G) 170 [11]. 171
3.6. Building Automation System 172 For an automation system in a building, CTs are installed in each distribution board to measure 173
the power quality and the consumed energy by the hour and by the device. Also, smart outlets and 174 light switches were newly installed, and these can be controlled remotely by the Operation System. 175
The outlets can cut off standby power. Their rated allowable current is 16A, and their overload 176 current is 20A. For the smart lighting, gateways were installed to transmit control signals to the 177 lighting from the OS. 178
The other controllable system of the BAS is heating, ventilation, and air conditioning (HVAC). 179 The OS adjusts the air quality by controlling the frequency of the variable frequency drives (VFDs) 180 to reduce energy consumption. 181
To measure power consumption of each device, current transformers (CT) are installed in 182 distribution panels. These CTs are solid-ring and split-core types, and they communicate with a 183 multi-channel power meter by Modbus. 184
3.7. SGS Operation Sytstem 185 In the SGS, the Operation System plays a role as energy management system (EMS). This is a 186
software program that can integrate the other components. These are connected in communication 187 lines, and the data of the devices are gathered into the operation system. This means that the system 188 can monitor the power consumption of all components in the building in real-time. Moreover, it has 189 a human machine interface (HMI) that shows the details of the components. Figure 6 (a) shows that 190 the OS has three categories: system configuration, management, and statistics. This is the main page 191 of the OS, and from this page, an operator can select any other page. 192
The first page, system configuration, shows the real-time power flow. In this section, users can 193 check the status of components and monitor the general data, including electricity fee information, 194 supplied power from each source, and power consumption of the building. This helps users to 195 understand the power flow, and Figure 6 (b) shows it. On this page, the operator reviews the overall 196 function of the system. Figure 6 (c) includes the information on the communication status of each 197 device. 198
The OS gathers various data from the devices in the communication by Modbus and Zigbee. 199 Based on these data, the OS is able to turn each light switch and outlet on and off and to manage the 200 PCS and BAS in the management section. Figure 6 (d) shows monitoring of the power consumption 201 on each floor. Figure 6 (e) and (f) are control pages for lights and outlets. Figure 6 (g) and (h) show 202 VFDs and HVAC. 203
Specifically, the operator can set schedules for these devices. Regarding the PCS, the OS controls 204 the charge-discharge operation mode as shown in Table 8. The output of the WT is too small to 205 contribute to the modes. 206
The statistics section comprises an overall analysis, DER analysis, and load forecasting. Overall 207 analysis is for supplied power and peak per day, month, and year. Figure 6 (i) is the page of the 208 monthly analysis of supply/demand. The DER analysis shows the PV generation and the amount of 209 battery discharge. One of the main functions of the OS is to forecast the demand of electricity by its 210 own algorithm. Through this analysis, the OS controls the devices and power flow, and decides to 211 charge or discharge the battery. 212
213
Preprints (www.preprints.org) | NOT PEER-REVIEWED | Posted: 10 May 2018 doi:10.20944/preprints201805.0161.v1

Table 8. Operation Modes of PCS 214
Status Mode Description
Charge Full charge Full Charge by PV + Grid
Only PV Charge Charge by only PV
Discharge
Full discharge Supply power to loads by PV + BAT
Fix PCS output •Fix PCS output •BAT output varies with PV output
Fix BAT output •Fix BAT output •PCS output varies with PV output
Only PV discharge Supply power to loads by only PV
Concurrent Fix BAT charge •Some of PV output charges BAT
•Other supplies to loads
Fix PCS output •Some of PV output supplies to loads •Other charges BAT
215
4. Performance Evaluation 216 To evaluate the performance of Smart Grid Station, the authors analyzed the reduction of peak 217
and consumption, as well as, economy by comparison with the early targets. 218 The performance analysis is based on Smart Grid Station operation algorithm shown in Figure 219
7. Following the algorithm, power from KEPCO grid charges the battery at off-peak load times, such 220 as night time or on weekends. Also, if the generation of the PV and WT is over the power demand, 221 the extra power goes to charge the battery. On the other hand, the grid power, renewable energy 222 sources, and battery supply to loads, including the EV/C, outlets, lights, and HVAC, at the peak-load 223 time and mid-load time. The Operation System gathers and monitors these generating, supplying, 224 and demanding data. 225
(a) (b) (c)
(d) (e) (f)
(g) (h) (i)
Figure 6. Operation System displays
Preprints (www.preprints.org) | NOT PEER-REVIEWED | Posted: 10 May 2018 doi:10.20944/preprints201805.0161.v1

226 227
In the SGS, the peak power and consumption are reduced due to the DER. This makes it difficult 228 to directly compare the decreased value with the unreduced value that could have been measured if 229 not for the reduction. For this reason, the authors tried to compare the reduced peak and consumption 230 with the values from 2014; however, new equipment and appliances were installed in the supervisory 231 control and data acquisition (SCADA) room and the temporary office of the city of Namyangju in the 232 Guri branch office, and we considered these changes in increment. Table 9 shows the details of 233 increment in the building, and the authors assume usage time of the devices as in Table 10. 234
As the equipment for the SCADA room is ICT equipment, it is always used, even on weekends. 235 Because the air conditioning system is an ice storage system, it does not contribute to a rise in the 236 peak. Printers and cooling fans were considered to be unused during peak time to save energy. 237
Table 9. Newly Installed Equipment and Appliances 238
Installation
Date Items
Capacity (kW)
Using hours Consumption Per a
weekday Per a
weekend Aug
(kWh) Sept
(kWh) Total
(kWh)
SCADA 2014 10.30
Media Rack 0.72
24 24 10,460.6 10,123.2 20,583.8 Audio Rack 0.5 6 DLP Cube 1.32 4 LED TVs 0.52 Humidifier 11
Temp. office
2015 03.24
Lights 1.8 10 - 378 360 738 13 Computers
(400W) 5.2
10 - 1,092 1,040 2,132
13 Computers (300W)
3.9 10 - 819 780 1,599
21 Monitors (170W)
3.7 10 - 777 740 1,517
Hot&Cold dispenser
0.85 24 24 632.4 612 1,244.4
Air Handling Unit
12.5 10 - 2,625 2,500 5,125
10 Cooling Fans 0.3 6 - 37.8 36 73.8 4 Printers
(700W) 2.8
1 - 58.8 56 114.8
Ice Storage AC Sys.
15 10 - 3,150 3,000 6150
Total Consumption(kWh) 20,030.6 19,247.2 39,277.8 The number of weekdays in each month 21 days 20 days The number of weekends in each month 10 days 10 days
Figure 7. Smart grid Station Operation Algorithm
TOU=Peak/Mid
load
KEPCOGrid
PVWT
ESS
Loads
TOU=Off-peak load
Yes
No
Yes
No
Always
Preprints (www.preprints.org) | NOT PEER-REVIEWED | Posted: 10 May 2018 doi:10.20944/preprints201805.0161.v1

Table 10. Details of Usage Time 239
Usage hours Note
Off-peak load Mid load Peak load SCADA 6 8 10 All days
Office Facilities1 6 3.5 0.5 08:30~18:30
on Weekdays Hot&Cold Dispenser 6 8 10 All days
Ice Storage AC System - - 10 Weekdays
Printers 1 - - Weekdays Cooling fans 5 1 - Weekdays
1 Lights, computers, monitors, and air handling unit
4.1. Peak Shaving 240 For a commercial building, once a peak power is measured, the peak is adopted for the electricity 241
fee in the year. The maximum peak occurred in the summer. Thus, the authors compared the peak 242 that occurred in August and September of 2014 with the peak in same months of 2015 as Table 11. 243
Table 11. Comparison of Peak 244
Day Peak [kW] Evening Peak [kW] Max Peak [kW] ’15.08 285.12 294.24
294.24 ’15.09 255.84 213.12 ’14.08 271.08 259.56
271.08 ’14.09 255.96 237.24
245 Peak shaving ratio (PSR) is a ratio between the maximum peak in 2015 and the maximum peak 246
in 2014. 247 = 42.01kW × 0.9 ≅ 37.8kW (1) 248 PSR(%) = − × 100 − 100 (2) 249
PSR(%) = 294.24 − 37.8271.08 × 100 − 100 = 5.40% (3) 250
In (1), 42.01kW is a sum of the capacity of all equipment except cooling fans, printers, and the 251 ice storage AC system in Table 9. The value of added equipment capacity defined in (1) should be 252 subtracted from max peak in 2015. This value is an estimate of the capacity multiplied by the power 253 factor (0.9). In (1) and (2), the result of the PSR is 5.40%. This means that the early target of 5% 254 reduction in peak has been surpassed. 255
4.2. Consumption Reduction 256 The second effect of the SGS is the reduction of power consumption. The data used to calculate 257
peak reduction in Section 4.1 was also used in this section. 258 The consumption is separated into three time periods: off-peak load, mid load, and peak load, 259
as shown in Table 12. The added power consumption is subtracted from the total consumption in 260 2015. The consumption reduction ratio (CRR) is calculated in (5). In (4) and (5), the result is 261 approximately 11.26%. This indicates that the initial target is also achieved. 262
263
Preprints (www.preprints.org) | NOT PEER-REVIEWED | Posted: 10 May 2018 doi:10.20944/preprints201805.0161.v1
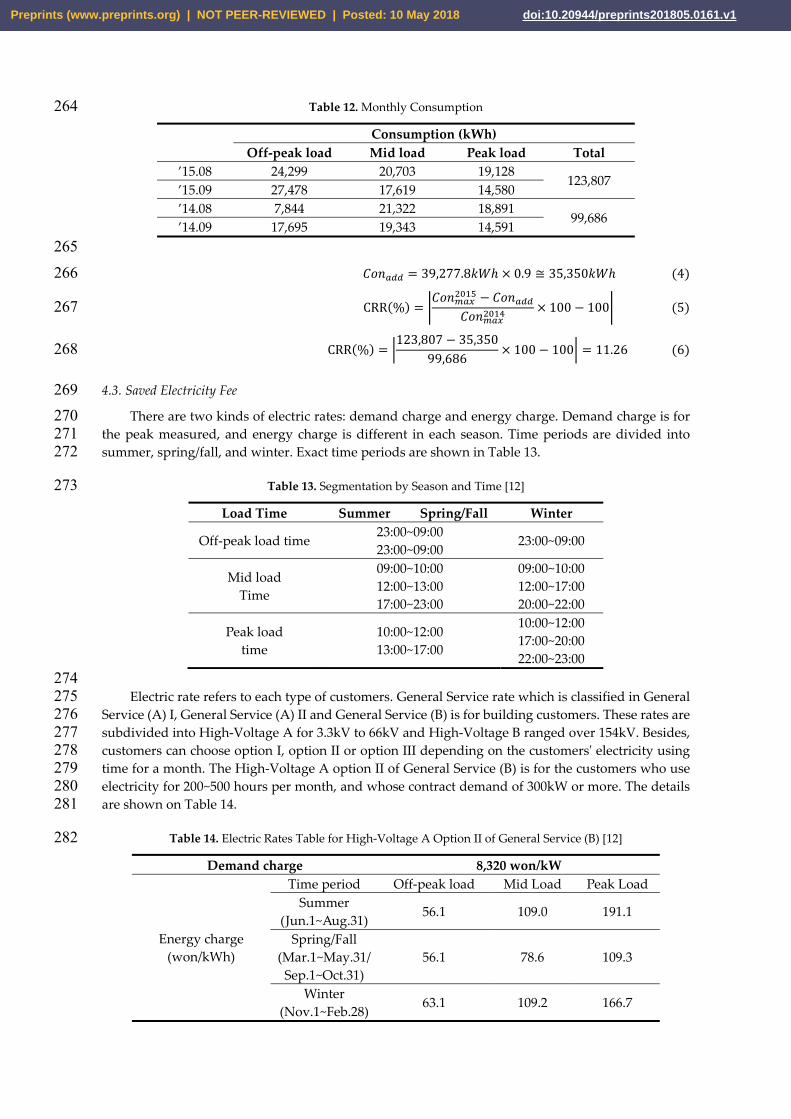
Table 12. Monthly Consumption 264
Consumption (kWh) Off-peak load Mid load Peak load Total
’15.08 24,299 20,703 19,128 123,807
’15.09 27,478 17,619 14,580 ’14.08 7,844 21,322 18,891
99,686 ’14.09 17,695 19,343 14,591
265 = 39,277.8 ℎ × 0.9 ≅ 35,350 ℎ (4) 266 CRR(%) = − × 100 − 100 (5) 267
CRR(%) = 123,807 − 35,35099,686 × 100 − 100 = 11.26 (6) 268
4.3. Saved Electricity Fee 269 There are two kinds of electric rates: demand charge and energy charge. Demand charge is for 270
the peak measured, and energy charge is different in each season. Time periods are divided into 271 summer, spring/fall, and winter. Exact time periods are shown in Table 13. 272
Table 13. Segmentation by Season and Time [12] 273
Load Time Summer Spring/Fall Winter
Off-peak load time 23:00~09:00 23:00~09:00
23:00~09:00
Mid load Time
09:00~10:00 12:00~13:00 17:00~23:00
09:00~10:00 12:00~17:00 20:00~22:00
Peak load time
10:00~12:00 13:00~17:00
10:00~12:00 17:00~20:00 22:00~23:00
274 Electric rate refers to each type of customers. General Service rate which is classified in General 275
Service (A) I, General Service (A) II and General Service (B) is for building customers. These rates are 276 subdivided into High-Voltage A for 3.3kV to 66kV and High-Voltage B ranged over 154kV. Besides, 277 customers can choose option I, option II or option III depending on the customers' electricity using 278 time for a month. The High-Voltage A option II of General Service (B) is for the customers who use 279 electricity for 200~500 hours per month, and whose contract demand of 300kW or more. The details 280 are shown on Table 14. 281
Table 14. Electric Rates Table for High-Voltage A Option II of General Service (B) [12] 282
Demand charge 8,320 won/kW
Energy charge (won/kWh)
Time period Off-peak load Mid Load Peak Load Summer
(Jun.1~Aug.31) 56.1 109.0 191.1
Spring/Fall (Mar.1~May.31/
Sep.1~Oct.31) 56.1 78.6 109.3
Winter (Nov.1~Feb.28)
63.1 109.2 166.7
Preprints (www.preprints.org) | NOT PEER-REVIEWED | Posted: 10 May 2018 doi:10.20944/preprints201805.0161.v1

Each of total power consumption and electricity fee in 2014 and 2015 is on Table 15. To calculate 283 the Saved Fee Ratio (SFR), the added fees were also considered. These fees are on Table 16 and Table 284 17. By (7), the sum of added fees is 4,127,892won, and the FRR is calculated as 10.15%. 285 = ℎ + ℎ (7) 286 SFR(%) = × 100 − 100 (8) 287 SFR(%) = , , , ,, , × 100 − 100 = 10.15% (9) 288
Although there was not an early target for fee reduction, the analysis of electricity fees is enough 289 to prove the effects of the Smart Grid Station. 290
Table 15. Total Electricity Fee in 2014 and 2015 291
Date Consumption (kWh) Fee (won) Total (won) ’15.08 64,130 8,659,000
15,924,000 ’15.09 59,677 7,265,000 ’14.08 48,057 6,424,000
13,128,000 ’14.09 51,629 6,704,000
Table 16. Demand Charge for Added Loads in 2015 292
Month Max Peak Demand Charge Charged Fee Aug 37.8kW 8,320 won/kW 314,496won Sept 37.8kW 8,320 won/kW 314,496won
Table 17. Energy Charge for Added Loads in 2015 293
2015 Consumption (kWh) Fee 1 (won)
Aug
Off-peak Load 7744 304,041 Mid load 5481.4 387,755 Peak load 6021.0 761,778
Total 19247.2 1,453,574
Sept
Off-peak Load 8056.7 406,783 Mid load 5695.8 558,758 Peak load 6278.2 1,079,785
Total 20030.7 2,045,326 1 0.9 of power factor is applied in the Fee, and decimal point is rounded up
5. Economic Analysis of Smart Grid Station 294 In Section 5, we studied the contribution with regard to the economic aspects, especially the 295
contributions of PV generation, EV, and energy time shifting by the ESS. 296
5.1. Saved Electricity Fee by PV generation 297 During August and September of 2015, PV generation was 2,961.5kWh in August and 298
2,326.1kWh in September. The total saved fee is the sum of saved demand charge (SDC) and saved 299 energy charge (SEC), contributed by PV system. 300 SDC = (kW) × ℎ (10) 301 SEC = (kWh) × ℎ (11) 302
It is difficult to know when the PV system generated power and how much the system 303 generated. For this reason, the authors assumed the PV supplied power to loads at peak-load time 304
Preprints (www.preprints.org) | NOT PEER-REVIEWED | Posted: 10 May 2018 doi:10.20944/preprints201805.0161.v1

and mid-load time in ratio of 8 to 2. Using the information above and (11), the SDC and the SEC in 305 August were found to be as follows: 306 SDC = 30kW × 8,320won/kW = 249,600won (12) 307 = 2,961.5kWh × (191.1won/kWh × 0.8 + 109.0won/kWh × 0.2) = 517,374won (13) 308
The SDC values from September are the same as those from August. Likewise, the SEC values 309 from September are as follows: 310 = 2,326.1kWh × (109.3won/kWh × 0.8 + 78.6won/kWh × 0.2) = 239,960won (14) 311
In conclusion, the total saved fee is 1,256,534 won. 312
5.2. Running Cost Reduction by EV 313 There was one electric vehicle in 2015, and the running data is on Table 18. In August and 314
September, the EV ran in 470km and 345km, respectively. We assumed the fuel efficiency of a 315 gasoline-powered car is 10km/L. Referring to the data, we compared the running cost (RC) of the EV 316 with that of a gasoline-powered vehicle. 317
Table 18. Running Data of EV in 2015 318
Month Mileage EV charge Amount (kWh)
Price of 1kWh (won/kWh)
Price of Gasoline 1 (won/L)
Aug 470km 105.8 109 1,560 Sept 345km 68.4 78.6 1,590
1 The price of gasoline is the average value of the month 319 = mileage(kW)km/L × (15) 320 = × (16) 321
By substituting figures, the results are as follows: 322 = 470kW10km/L × 1,560 / = 73,320 (17) 323 = 105.8kWh × 109 / ℎ ≅ 11,533 (18) 324 = 345kW10km/L × 1,590 / = 54,855 (19) 325 = 68.4kWh × 78.6 / ℎ ≅ 5,377 (20) 326 Using (17) and (18), 61,787 won were saved, which means about 84.3% of the running cost was 327
saved by the EV in August. These equations also show that 49,478 won, about 90.2% of the cost, were 328 saved in September. Although the actual amount saved is small, this shows that the EV is much more 329 effective than a gasoline-powered vehicle. 330
5.3. Saved Fee by ESS Scheduling 331 A customer charges the battery of the ESS at night, when the price of electricity is low, and 332
discharges the power at the peak load time or mid load time when the price is highs. However, the 333 power from PV system doesn’t charge the battery but supplies power to the building load directly in 334 the summer to maximize the efficiency. In August, 758.9kWh was charged to the battery, and same 335 amount was discharged. In September, 541.1kWh was charged and discharged. Also we adapted the 336 same assumption stated in Section 5.1. Equation (21) is a formula to calculate the fee reduction (FR). 337 Time of use (TOU) applied in this equation is an electricity fee policy that varies with seasons and 338 times, as shown in Table 14. 339 FR = × TOU − × (21) 340
Preprints (www.preprints.org) | NOT PEER-REVIEWED | Posted: 10 May 2018 doi:10.20944/preprints201805.0161.v1

By substituting figures, the results are as follows: 341 = 758.9 × (191.1 × 0.8 + 109.0 × 0.2) − (758.9 × 56.1) ≅ 89,991 won (22) 342 = 541.1 × (109.3 × 0.8 + 78.6 × 0.2) − (541.1 × 56.1) ≅ 26,465 won (23) 343 As the calculations show, 116,456 won was saved for two months. By load shifting, the cost of 344
electricity was greatly reduced. 345
6. Discussion 346 The authors verified the performance and economic feasibility of the Smart Grid Station to 347
propose a future strategy. The performance was evaluated with regard to three aspects: peak shaving, 348 reduction of power consumption, and electricity fee saving. Also, the economic efficiency was 349 feasible in terms of electricity fee and running cost of the EV. Measured values in 2015 are revised for 350 objective comparisons with values in 2014 before the SGS was built. 351
As described in Sections 4 and 5, the effectiveness of the SGS has been proven. However, smart 352 grid technology is led by KEPCO in Korea, and the expansion of the technology is otherwise stagnant. 353 This is because public institutions are leading the SG industry without supporting price policies for 354 devices, and the private sector dose not participate in the industries actively, despite the effectiveness 355 of the SGS. To support the expansion of SG, the convenience, safety and efficiency of SGS should be 356 improved for customers. Also through the upgrade of the EMS, the system can integrate and control 357 more various devices and technologies. To fulfill these requirements, the government needs to 358 establish supporting policies. 359
7. Conclusions 360 As climate has changed, many countries have tried to prevent negative environmental impact. 361
One of the efforts made toward this end is the smart grid. In Korea, KEPCO is evolving the SG 362 technologies and expanding them to most of its branch offices. In this paper, the authors studied the 363 first demonstration of SGS in the Guri branch office to prove the effectiveness. 364
The early main targets were a 5% reduction of peak, a 9.6% reduction of consumption, and 365 savings in electricity fees. To evaluate the performance objectively, we compared the factors in 2015 366 with the values in 2014, while considering the increased loads in 2015. These operational analyses 367 confirmed that peak was reduced by 5.40%, consumption by 11.26%, and fees by 10.15%. Also the 368 economic analysis shows that the SGS is an effective solution for a building. Considering its 369 effectiveness, we suggest the expansion of the SGS to more customers. By expanding it to the private 370 sector, smart grid will contribute to the building of a smart city, which is a city-sized of energy 371 solution. As a next step, the authors will study SG policies and the improvements. 372 Author Contributions: Jaehong Whang designed and wrote the paper. Woohyun Hwang supported and helped 373 to collect the data. Yeuntae Yoo and Gilsoo Jang conducted the review. Gilsoo Jang contributed to the 374 modification. All the authors have read and approved the final manuscript. 375 Acknowledgments: This work was supported by Korea Electric Power Corporation (R17XA05-4) and under the 376 framework of international cooperation program managed by National Research Foundation of Korea (No. 377 2017K1A4A3013579). 378 Conflicts of Interest: The authors declare no conflict of interest. 379
References 380 1. ADOPTION OF THE PARIS AGREEMENT, UNFCCC, Paris, France, 2015 381 2. Enhanced Actions on Climate Change, Department of Climate Change, national Development & Reform 382
Commission of China, Beijing, China, 2015. 383 3. SUBMISSION BY LATVIA AND THE EUROPEAN COMMISSION ON BEHALF OF THE EUROPEAN 384
UNION AND ITS MEMBER STATES, Latvian Presidency of the Council of the European Union, 2015. 385 4. Submission of Japan’s Intended Nationally Determined Contribution, Japan, 2015. 386 5. Submission by the Republic of Korea Intended Nationally Determined Contribution, Korea, 2015. 387
Preprints (www.preprints.org) | NOT PEER-REVIEWED | Posted: 10 May 2018 doi:10.20944/preprints201805.0161.v1

6. S. Borlase, “Smart Grid Technologies,” in Smart Grids Infrastructure, Technology, and Solutions; CRC Press: 388 Boca Raton, FL, USA, 2015; pp.79-125, 978-1-4398-2905-9 389
7. M. Ragheb, “Vertical Axis Wind Turbines,” University of Illinois at Urbana-Champaign, 2011. 390 8. J. Fadil, Soedibyo, and M. Ashari, “Performance Comparison of Vertical Axis and Horizontal Axis Wind 391
Turbines To Get Optimum Power Output,” 2017 15th International Conference on Quality in Research: 392 International Symposium on Electrical and Computer Engineering, 2017, pp. 429-433. 393
9. A. Mohd, E. Ortjohann, A. Schmelter, N. Hamsic, and D. Morton, “Challenges in Integrating Distributed 394 Energy Storage Systems into Future Smart Grid,” in Proc. IEEE ISIE, Cambridge, U.K., Jun. 30-Jul. 2, 2008, 395 pp.1627-1632. 396
10. E. Alegria, T. Brown, E. Minear, and R. H. Laseter, “CERTS Migcrogrid Demonstration With Large-Scale 397 Energy Storage and Renewable Generation,” IEEE Trans. Smart Grid, vol.5, no.2, pp. 937-943, Mar. 2014. 398
11. K. M. Tan, V. K. Ramachandaramurthy, and J. Y. Yong, “Integration of electric vehicles in smart grid: A 399 review on vehicle to grid technologies and optimization techniques,” Renewable and Sustainable Energy 400 Reviews, vol.53, pp.720-732, Jan. 2016. 401
12. KEPCO General Service Electricity rate table. Available online: 402 http://cyber.kepco.co.kr/ckepco/front/jsp/CY/E/E/CYEEHP00202.jsp (accessd on 09 May 2018). 403
Preprints (www.preprints.org) | NOT PEER-REVIEWED | Posted: 10 May 2018 doi:10.20944/preprints201805.0161.v1


![Kan waa guri - arts.unimelb.edu.au · Kan waa guri ! Sue Worcester Somali ! LEVEL 1 KAN WAA GURI SOMALI Title : Kan waa guri [This is a house] Author: Sue Worcester Translator: Ali](https://img.pdfslide.us/doc/110x75/5c5b91f809d3f240368bf74e/kan-waa-guri-arts-kan-waa-guri-sue-worcester-somali-level-1-kan-waa-guri.jpg)