Embed Size (px)
Citation preview

A Case Study of Kenya
Juiie A. Richardson
Overseas Development Institute


00003614
Overseas Development Institute
Structural Adjustment and Environmental Linkages
A Case Study of Kenya
Julie A. Richardson
Overseas Development Institute

A CIP Publication data record may be obtained from the British Library
ISBN 0 85003 233 4
© Overseas Development Institute 1996
Published by the Overseas Development Institute, Regent's College, Inner Circle, Regent's Park, London NW1 4NS
All rights reserved. No part of this may be reproduced by any means, nor transmitted, nor stored electronically, without the written permission of the publisher.
Printed by The Chameleon Press Ltd, London

Contents
Foreword vii Acknowledgements viii
1 Introduction 1
Structure of the Study 1 Overview of Structural Adjustment and Environment Linkages 2 Macroeconomic Performance and Structural Adjustment in Kenya: 1963-92 6
Concluding Comments 17
2 Public Sector Reforms and Environmental Linkages 19
Natural Resource Sectors: Trends in Public Expenditure and Net Government Outlay 21 Recurrent Expenditure 21 Development Expenditure 26 Net Government Outlay 27
Public Sector and Institutional Reforms 36 Trends in the Organisation of Government Institutions
for Natural Resource Management 38 Conclusions 40
3 Structural Adjustment and Environmental Linkages inthe Wildlife Sector 41
Economic and Environmental Significance of the Wildlife Sector 41Key Issues in Wildlife Management 43
Land Use Conflicts 43Illegal Poaching and Poor Management of the Wildlife Resource 45Public Expenditure and Investment in Infrastructure 46Lack of Community Support and Involvement in Wildlife
Management and Conservation 46
ill

Impact of Recent Economic and Institutional Reforms 47Management and Institutional Reforms 48 Financial Management Reforms: Balancing Revenuesand Expenditures 51
Community Participation Programmes 55 Indirect Impact of Structural Adjustment and OtherSectoral Reforms 56
Conclusions 58
4 Structural Adjustment and Environmental Linkages inthe Agricultural Sector 61
The Agricultural Sector 61Recent Economic Reforms in the Agricultural Sector 65
Fertiliser Policy 66Producer Incentives 66Public Expenditure Reforms 66
Methodological Approach 68Impact of Structural Adjustment on Land Use Patterns 69
Impact on the Spatial Extent of Production 69Conclusions 72
Impact of Structural Adjustment on Crop Selection 74Environmental Impacts of Crop Switching 77Concluding Comments 81
Impact of Structural Adjustment on Production Method 82Input Prices and Marketing Reforms 85 Farm Management Practices and Appropriate Technology 91Case Study of Machakos District 94
Concluding Comments 101
5 Concluding Themes 103
General 103Public Sector Expenditure and Institutions 105
Expenditures and Revenues . 105Institutions 106
Wildlife and Tourism 106Agriculture 108
Implementation of the Reform Programme in Agriculture 108
IV

Annex 1 Kenyan National Environmental Action Plan: Scopeand Coverage 113
Policy, Institutional and Legislative Framework 113 Other Sectoral and Specific Environmental Issues 113
Annex 2 Production and Marketing of Main Crops in Kenya 115
Maize 115Wheat . 116Beans 116Coffee 117Sugar 118Cotton 118Dairy Products 119Meat 119Horticulture 120
References 121
Tables
1 Kenya - development indicators, 1975-91 92 IMF and World Bank-led adjustment programmes
in Kenya, 1975-89 123 Sectoral expenditure as a percentage of total government
expenditure, 1980/81-90/91 204 Contribution of fisheries to GDP, 1972-91 345 Trend in tourist arrivals and receipts, 1980-91 426 Wildlife population in the Kenyan rangelands 437 Kenya - changes in production under various crops, 1980-91 628 Kenya - changes in land use, 1975-90 699 Kenya - habitat/ecosystem loss in the 1980s 7010 Kenya - changes in area under various crops 7511 Crops most affected by soil-related factors according
to smallholders' perceptions 7912 Trends in agricultural productivity for selected crops 8313 Fertiliser availability and usage, 1980-90 88

Figures
1 Multi-channel, multi-stage impact of macro andstructural adjustment policies on the environment 4
2 Central government expenditure, 1980-90 213 Real recurrent expenditure by selected sectors, 1981/2-91/2 224 Relationship between salaries and recurrent expenditure
in the forestry sector, 1980/81-91/2 245 Real development expenditure by selected ministries, 1982-91 266 Ministry of Tourism and Wildlife - real development
expenditure, 1982-91 287 Ministry of Water - real development expenditure, 1982-91 288 Ministry of Environment and Natural Resources -
real development expenditure, 1982-91 299 Net outlay to combined departments, 1972/3-90/91 3010 Net real public outlay to Forestry Department 3111 Real net outlay to Fisheries Department, 1972-91 3312 Net outlay by Department of Tourism and Wildlife, 1973-91 3513 Kenya Wildlife Service's projected recurrent
costs/revenues, 1991-6 5314 Agricultural terms of trade, 1982-92 8615 Agricultural input prices, 1982-92 8616 Agricultural quantum indices, 1982-92 87
Boxes
1 Summary of Kenya Wildlife Service's financial strategy 522 Land use conflicts between livestock and wildlife 713 Land use conflicts between wheat, pastoralism and wildlife 724 Land conflicts between agriculture and forestry 735 Perceived yield changes and causes 84
VI
Foreword
When structural adjustment assistance policies were first devised (in the late 1970s), little time was devoted to making prior assessments of their impact on the environment, nor to considering positive environmental measures which could be incorporated into the associated conditions.
By the time (1987) that the European Community decided to incorporate adjustment assistance into its EDF aid programmes, the state of the art had much improved. There were more robust techniques for valuing the environment and the literature on structural adjustment and economic reform had grown, often generating more heat than light, but there had been an overall gain in understanding and a refinement of instruments.
Europe - and the European Commission in particular - was none the less concerned about the coherence between the orthodox adjustment prescriptions which it was adopting, largely at the behest of bilateral donors and multilateral agencies, and the environmental questions which, because of public spending constraints in African countries in particular, were not being adequately addressed without donor support.
A new Paris-based research institute, DIAL (Developpement des Investigations sur Ajustement a Long Terme) was established for this and allied purposes. ODI was represented on DIAL'S programme committee from the start and in early 1993 DIAL was asked by the European Commission to investigate the links between adjustment and environment in four African countries representing contrasting geographical conditions: Kenya (savanna), Mali (Sahel), Equatorial Guinea (tropical wet forests) and Cote d'lvoire (forest/savanna).
The Kenya study was taken on by ODI following a long record of structural adjustment programme analysis there (by Tony Killick in particular), an innovative study into sustainable development in the Machakos Region (published as More People, Less Erosion by Tiffen, Mortimore and Gichuki), and some original work on adjustment-environment linkages for the United Nations Environment Programme (Hewitt and Cromwell, Cromwell and Winpenny). The methodology was strengthened and applied later to a number of country studies in collaboration with the World Wide Fund for Nature, now in print as ODI Working Papers. DIAL published a version of our Kenya report after it had been presented to the European Commission in December 1993 and the present book is an edited and updated version of that report, shorn of those recommendations which were specific to
vii

the EC's aid administration.The author, Julie Richardson, has two linkages with ODI. From 1986
to 1988 she was an ODI Fellow working for the Government of Botswana as an economist in the Ministry of Health, and for the duration of this Kenya study she was a Research Associate. Her main affiliation is with the School of African and Asian Studies of the University of Sussex.
ODI gratefully acknowledges the EC funding provided through DIAL which enabled this study to be conducted. We are glad to have worked with DIAL on other collaborative studies subsequently. The broader interest in Kenya's economy, its wildlife, its environment and its people in the often tortured but always highly political aid relationship under structural adjustment which Kenya exemplifies, together with the sharp analysis which the author brings to this case study are the elements which justify its publication in the ODI Research Study series.
Adrian P. Hewitt Deputy Director
Acknowledgements
Julie A. Richardson would like to thank all the people who contributed, particularly those interviewed during her stay in Kenya in July and August 1994. Special thanks are due to the EC Delegation (Kenya) for hosting her visit, Leonard Obidha who assisted in the data collection, Pious Owino who contributed to Chapter 1, and Elizabeth Cromwell and James Winpenny who helped with the methodology.
VLU
1Introduction
Structure of the Study
This study investigates the environmental implications of structural adjustment reforms in Kenya over the period 1980-93, focusing particularly on the impact of fiscal reforms on the country's key natural resource sectors, and is structured as follows. Chapter 1 considers the possible linkages between structural adjustment policies and environmental management, and then reviews macroeconomic performance and the structural adjustment programmes carried out in Kenya. Chapter 2 investigates the trends in public expenditure and net government outlay on selected natural resource sectors (tourism and wildlife, forestry and fishing) over the adjustment period. It shows that reductions in the level, and changes in the composition, of real public expenditure have adversely affected environmental management in these sectors. More detailed case studies of the impact of structural adjustment and environmental impact on the wildlife and agricultural sectors are provided in Chapters 3 and 4 respectively.
Chapter 3 demonstrates that reductions in the overall level and changes in the pattern of real expenditures over the adjustment period had a significant detrimental impact on wildlife conservation and management in Kenya throughout most of the 1980s. The alarming decline in wildlife populations, particularly of charismatic species such as the elephant and rhino, caused international and national outcry and urgent demands for sectoral reform. Pressure from the World Bank and the rest of the donor community was instrumental in prompting major management and institutional reforms, involving the creation of a new parastatal body to manage the sector and the establishment of the Protected Areas and Wildlife Services Project in 1989. To date, the combination of institutional and pricing reforms has achieved considerable success in revitalising and rehabilitating the wildlife sector in Kenya. Since 1989, the available evidence suggests that wildlife populations are expanding, poaching has been contained, and corruption on the part of officials has diminished.
Chapter 4 shows how structural adjustment policies have impacted on the agricultural environment via changes in land use patterns, crop and

2 Structural Adjustment and Environment Linkages in Kenya
livestock selection, and the choice of agricultural technology and farm management practices. In this case study, the structural adjustment-environment linkages were not easy to establish for the following reasons. Firstly, implementation of pricing and institutional reforms in the agricultural sector was slow and erratic. The reform process was characterised by stop-go and frequent policy reversal. In addition, the net effect of policy change was often unintended and perverse. For example, efforts to intensify agriculture via fertiliser use were undermined by exchange rate depreciations that effectively increased the cost of imported fertilisers beyond the reach of many farmers. Secondly, other factors often appeared more important in explaining changes in land use, crop selection and technology choice. Of particular significance were climate change and population pressure. Thirdly, uniform changes in economic policy did not prompt a uniform response amongst producers. The response, and hence the environmental implications, differed from farmer to farmer and district to district. To establish more precise linkages would require detailed study at the household district level.
Chapter 5 summarises the main lessons to be learned.
Overview of Structural Adjustment and Environment Linkages
In 1980, the World Bank's first structural adjustment loan became effective. Since that date a growing literature and public debate have emerged about the economic, social, political, and more recently the environmental, consequences of the package of policies that constitute a structural adjustment programme (SAP).
Broadly speaking, SAPs provide conditional finance to achieve short- term macroeconomic stability and long-term structural change. The key elements of SAP are price reforms to realign domestic and world prices, and supportive structural reforms designed to improve the responsiveness of the supply side of the economy. In the short term, a balance of payments stabilisation package may also be implemented to address any immediate crisis on the external account.
The short-term stabilisation programme is aimed at a sharp reduction and, if deemed necessary, a change in the composition of aggregate demand. The main economic instruments are fiscal (government expenditure, taxes and subsidies), monetary (money supply, credit and interest rates), and exchange rate policies. The medium-term structural

Introduction 3
and sectoral adjustment programme focuses on the relaxation of supply- side constraints. Policies are aimed at increasing both output from existing capacity and the rate of growth of capacity by prescribing a greater role for prices, markets and the private sector in the development process. The array of policy instruments to achieve these ends are varied and country-specific. The package may include trade liberalisation policies (dismantling import/export taxes and trade controls); domestic pricing policies (taxes, subsidies, and price controls); institutional reforms (land, financial, marketing, research/extension); and investment policies (public infrastructure, technology, training).
There are many criticisms of the IMF and World Bank restructuring programmes, not least, the potential sacrifice of political and economic autonomy, and the consequences of structural change on particular sectors of the economy. Some of the criticisms have helped to reformulate the overall policy package. For example, poverty alleviation has now become a stated purpose of adjustment (Reed, 1992).
However, concerns about the environmental implications of adjustment have yet to be incorporated into the design of policy-based lending. Much of the debate on debt, structural adjustment and environmental linkages focuses on the pressure to earn foreign exchange to stabilise the balance of payments, causing countries to 'mine' their natural resource base in an unsustainable way. Many studies support the statistical linkage between external indebtedness and unsustainable resource management. For example, the econometric study by Kahn and McDonald (1990) reports a strong positive relationship between debt and deforestation. However, the relationship between debt and environmental change is not a simple one, and there are dangers in interpreting any statistical relationship that may exist as a causal link. There is a growing body of evidence that suggests that debt and environmental degradation are in fact symptoms of more fundamental economic and institutional problems. The structural adjustment-environment debate has now become more complex, and the simple uni-directional causal linkages claimed in some studies have become increasingly discredited, at least for the purposes of drawing general lessons, policy conclusions and recommendations.
Figure 1 prepared by Panayotou1 shows the complexity of the relationship by tracing through the various routes (via efficiency, growth,
1. Distributed by Theodore Panayotou (Harvard Institute for International Development) at a seminar in London in 1992 to discuss the linkages between structural adjustment and environmental impact in Thailand.

4 Structural Adjustment and Environment Linkages in Kenya
Figure 1: Multi-channel, multi-stage impact of macro and structural adjustment policies on the environment
Macro and structural adjustment policies
—— Efficiency —Economic - conservation of scarce resources
Technical - less pollution per unit of output
Growth
Production - increased aggregate resource depletion and waste
Consumption - short run/long run
Environmental expenditure - increased pollution abatement
Structure"
Inputs - it depends 'labourenergy and chemicalsland and natural resources
Output - it dependsagriculture industry
Consumption - it depends• energy
natural resources plastics and packaging
• services
—— Poverty
Distribution"
encroachment migrants and squatters conservation investment
—— Inequality • ——— shortened time horizons——— reduced conservation expenditure
1————— increased migration
Public expenditures
— Environmentally destructive (e.g. pesticide subsidy)
— Social services (e.g. health and education)
— Environmental expenditures (e.g. sewage treatment)

Introduction 5
structure, distribution, public expenditure) whereby macroeconomic and structural adjustment policies might affect natural resource use and environmental quality. In fact, Figure 1 captures only part of the story as the environmental impacts themselves will also feed back into macroeconomic stability and economic and social performance. It also fails to capture the differential responses at the micro level reflecting differences in factor endowments, entitlements, and institutional and infrastructural constraints; nor does it distinguish between short-term impacts and the long-term dynamic response.
There are recent indications that the IMF is beginning to address concerns about the possible linkages between its policies and environmental degradation. In early 1991, its Executive Board informally considered the extent to which the Fund should address environmental issues, and concluded that 'staff should be mindful of the interplay between economic policies, economic activity, and environmental change . . . The IMF, however, would impose no environmental conditionality' (IMF, 1993).
Since that date, the IMF has hosted a seminar in May 1993 to discuss how macroeconomic and structural adjustment policies interact with environmental issues. Leading environmentalists from around the world met with IMF and World Bank staff. The main themes and lessons to be drawn from the discussions were as follows (IMF, 1993):
sound macroeconomic policies and economic stabilisation are essential to alleviate poverty and protect the environment
the linkages between macroeconomic policy and the environment, which run in both directions, are complex; one cannot generalise about them because they differ from case to case
analysing the linkages between macroeconomic policy and the environment requires a great deal of information that is not readily available
the IMF should help its members mirurnise the damaging environmental impact of macroeconomic policies if and when there is such an impact
poverty and the environment are linked in that the poor are more likely to resort to activities that can degrade the environment
subsidies that have negative distributional and environmental effects should be eliminated; environmental taxes/resource user charges can be a useful instrument in some adjustment programmes
the exchange rate is a 'blunt' instrument for dealing with market and institutional failures, which are often at the root of environmental problems
6 Structural Adjustment and Environment Linkages in Kenya
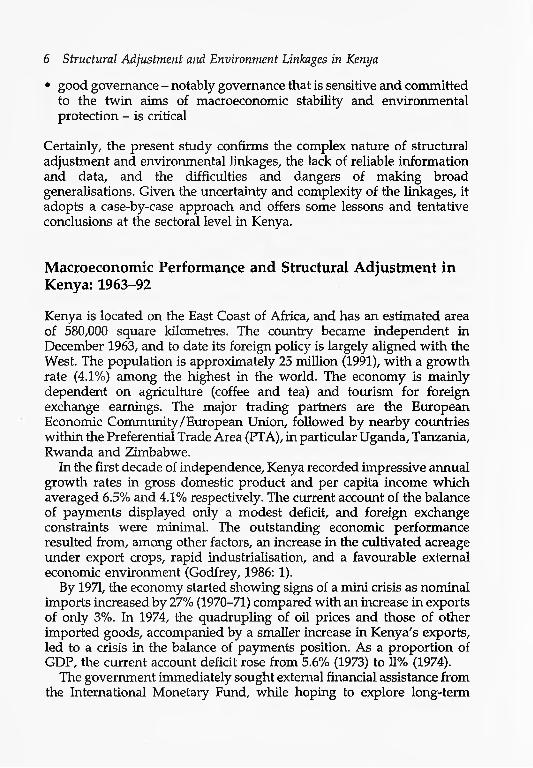
• good governance - notably governance that is sensitive and committed to the twin aims of macroeconomic stability and environmental protection - is critical
Certainly, the present study confirms the complex nature of structural adjustment and environmental linkages, the lack of reliable information and data, and the difficulties and dangers of making broad generalisations. Given the uncertainty and complexity of the linkages, it adopts a case-by-case approach and offers some lessons and tentative conclusions at the sectoral level in Kenya.
Macroeconomic Performance and Structural Adjustment in Kenya: 1963-92
Kenya is located on the East Coast of Africa, and has an estimated area of 580,000 square kilometres. The country became independent in December 1963, and to date its foreign policy is largely aligned with the West. The population is approximately 25 million (1991), with a growth rate (4.1%) among the highest in the world. The economy is mainly dependent on agriculture (coffee and tea) and tourism for foreign exchange earnings. The major trading partners are the European Economic Community/European Union, followed by nearby countries within the Preferential Trade Area (PTA), in particular Uganda, Tanzania, Rwanda and Zimbabwe.
In the first decade of independence, Kenya recorded impressive annual growth rates in gross domestic product and per capita income which averaged 6.5% and 4.1% respectively. The current account of the balance of payments displayed only a modest deficit, and foreign exchange constraints were minimal. The outstanding economic performance resulted from, among other factors, an increase in the cultivated acreage under export crops, rapid industrialisation, and a favourable external economic environment (Godfrey, 1986: 1).
By 1971, the economy started showing signs of a mini crisis as nominal imports increased by 27% (1970-71) compared with an increase in exports of only 3%. In 1974, the quadrupling of oil prices and those of other imported goods, accompanied by a smaller increase in Kenya's exports, led to a crisis in the balance of payments position. As a proportion of GDP, the current account deficit rose from 5.6% (1973) to 11% (1974).
The government immediately sought external financial assistance from the International Monetary Fund, while hoping to explore long-term

Introduction 7
corrective measures. The IMF loan was conditional on Kenya implementing a stabilisation programme2 which required, among other things, the imposition of ceilings on total domestic credit by restricting government borrowing from the banking system. Kenya received: (i) three drawings of SDR131.13m from the IMF in 1974-5, (ii) a programme loan of US$30m from the World Bank, and (iii) additional aid from bilateral donors such as West Germany and the USA.
For the longer-term perspective, the government launched Sessional Paper No. 4 of 1975 on Economic Prospects and Policies which outlined the official stabilisation policy. Considering the serious problems of a balance of payments deficit, slowing economic growth, and rising inflation, the document focused on the need for restructuring the economy by reducing dependence on imports and improving export performance. The 1975 budget announced various measures to achieve these objectives, including the introduction of an export compensation scheme, tightening import licensing and wage restraint. Furthermore, the Kenya shilling was devalued by 14.25% in October 1975.
Kenya experienced a temporary boom in 1976 and 1977, following increases in the world prices of its major export crops (coffee and tea). The balance of payments position recorded a remarkable turnaround, and similarly the foreign exchange reserves position improved. Nonetheless, Kenya increased import restrictions, and continued to tighten its credit policy as part of an anti-inflation programme started in 1973.
Unfortunately, unlike other coffee-exporting countries, Kenya did not manage its earnings from the mini-boom well, even though these gains represented fortuitous profits and not a return on past investment (Bevan et al., 1989). Furthermore, the foreign exchange controls did not force private agents to use the windfall in a socially desirable manner. The 1977 budget introduced an export tax, but it vdas too little and too late. Personal incomes increased, and the monetary base expanded faster than the rate of inflation. The proceeds from the boom were not even used to offset part of the external debt, which continued to be financed by more foreign borrowing. Moreover, the targets set out in the stabilisation programme were unobserved. For instance, (i) the credit ceiling condition in the IMF stabilisation package was not observed; (ii) the 1976 budget attempted to control domestic liquidity, but instead ended by being
2. The World Bank and IMF programmes complement each other. The IMF concentrates on short-term stabilisation and demand management policies such as exchange rate realignment, import liberalisation and changes in interest rates. On the other hand, the World Bank concentrates on long-term structural adjustment issues such as institutional reforms, land policy, and government investments.

8 Structural Adjustment and Environment Linkages in Kenya
expansionary; and (iii) no efforts were made towards import liberalisation.
The momentum of stabilisation that had just set in was lost and the economy was thrust into a period of excess demand. The volume of credit to the private sector continued to increase. Real interest rates remained negative throughout this period, and no action was taken on either lending or deposit rates. Money supply grew by a record 44% in 1977. The rate of inflation, which had fallen to 10.5% in 1976, rose to 16.9% by 1978.
Kenya experienced another set-back with the collapse of the East African Community (EAC) in 1977 which was followed by the closure of the common border with Tanzania. The demise of the EAC contracted Kenya's export market and adversely affected investment in the country. The government also increased its expenditure because of the need to re organise some of the institutions previously run by the EAC.3 Between 1977 and 1978, Kenya's terms of trade deteriorated by 22% as the world prices of its key export crops fell. The annual growth rates of GDP, including those of the manufacturing and agricultural sectors, decreased in 1978. Similarly, the current account balance and the overall balance of payments position deteriorated (Table 1). A second oil shock in 1979 made the economy even more vulnerable.
The government reacted to these economic crises in various ways. In financial year (FY) 1978/9, the authorities implemented a monetary policy that forced the banks to hold excess reserves and to pay a heavy inflationary tax on them. The additional revenue gained was used to offset part of the growing public deficit; in addition, the policy enabled the government to tax part of the gains from the boom (World Bank, 1987: 98). Inflation was also brought down from 16.9% in 1978 to 8% in 1979 (Table 1). Economic performance in FY 1978/9 appeared impressive, as evidenced by a favourable GDP growth rate and balance of payments position and an increase in gross domestic investment, plus low inflation. However, there was a breakdown in fiscal discipline, as indicated by increases in bank credit to the Treasury, and in the budget deficit as a percentage of GDP. As noted by Mosley (1991: 274), financial discipline in project implementation collapsed, leading to high inefficiency, waste and overspending within the government sector. There was a sudden rapid growth in the public and parastatal sectors, and by May 1979
3. Kenya's relations with the former EAC states improved in the early 1980s, with agreements reached on the distribution of EAC's assets and liabilities in 1983, and re opening of the Kenya-Tanzania border in December the same year (EIU, 1986/87: 4).

Tab
le 1
: K
enya
- d
evel
opm
ent
indi
cato
rs, 1
975-
91
1975
19
76
1977
19
78
1979
19
80
1981
198
2 19
83
1984
198
5 19
86 1
987
1988
198
9 19
90 1
991
GD
P (1
987
US$
m)a
10
,212
GD
P (a
nnua
l gr
owth
%)"
1.
3A
gric
. (r
eal
grow
th r
ate)
0.
1M
anuf
. (r
eal
grow
th r
ate)
-0
.01
Agr
icul
ture
(%
of
GD
P)a
36In
dust
ry (
% o
f G
DP)
" 19
Bal
ance
of
paym
ents
Cur
rent
acc
ount
(U
S$m
)bO
vera
ll ba
lanc
e (U
S$m
)bE
xpor
ts (
US$
m)a
Impo
rts
(US$
m)a
Ter
ms
of t
rade
(19
85=1
00)a
Rea
l ex
chan
ge r
ate
(")d
Fore
x re
serv
es (
1985
=100
)bM
oney
sup
ply"
Ext
erna
l de
bt (
US$
m)a
as %
of
expo
rts
Deb
t se
rvic
e ra
tio
Rea
l in
tere
st r
ates
(%
)aD
epos
it -1
2.1
Len
ding
-7
.2In
flat
ion
(%)
17.2
Gov
ernm
ent
defi
cit(
-)
-157
/sur
plus
as
% o
f G
DP"
4.
8G
over
nmen
t ex
pend
iture
" 54
6G
NP
per
capi
ta (
US$
)b
230
Pop
ulat
ion
(mill
ions
)11
13.4
1
9,15
110,
1171
1,57
512,
8591
3,65
8 11
,654
9,8
37 8
,189
7,6
92 7
,038
7,6
33 7
,974
7,8
44 7
,082
6,6
30 5
,615
2.2
9.4
6.8
7.5
5.4
4 10
.2
3.8
-0.1
-1
.318
.6
15.9
12
.6
7.1
5.7
36
36
35
34
3318
19
20
19
19
-224
-43
456
911
104.6
111 45
20
1,107
110
4.5
-126
84
762
972
123.6
105 72
25
1,282
112.2
5.9
26.2
269.3
1,161
1,286
147.4
109
134 36
1,712
107.4
4.8
-662
-220
956
1,70
6 115.5
116 90
42
2,240
145
8.1
-500
72
1,031
1,656
115.5
114
138 49
2,78
0 170
7.5
-887
72
1,313
2,59
0 10
8.7
117
124 52
3,449
167
21.8
-5.4
7 -7
.57
-11.
8-0
.5
-2.7
-6
.910
.5
12.7
16
.9-2
04
-160
-2
115.
9 3.
6 3.
957
9 66
8 98
924
0 27
0 31
013
.85
14.3
5 14
.88
4.1
1.9
1.5
1.7
4.3
7.1
5.9
6.2
4.6
4.3
1.7
6.2
4.4
1.6
-3.9
3.
7 4.
9 3.
8 4.
4 3.
9 3.
4 -1
.13.
6 2.
3 4.
5 4.
3 4.
5 5.
833
34
34
32
32
32
5.7 32
19
19
18
19
19
18
18
-560
-30
5 -4
78 -
126
-113
-38
.1 -
495
-306
-16
0 97
.9
61.6
-52
.1 1
37.7
-25
.11,
147
938
947
1,08
1 95
71,1
68
916
2,08
11,6
03 1
,379
1,5
93 1
,457
1,6
50 1
,738
99.5
96
.9 1
00.8
111
.2
100
120.
6 87
.810
8 10
9 10
0 10
3 10
0 85
78
58
52
93
100
100
103
5960
70
77
91
10
0 12
7 14
13,
3083
,451
3,7
15 3
,571
4,1
81 4
,670
5,7
3018
4 21
1.7
244
214.
7 26
0.2
245.
5 32
9.6
26
31.7
35
.6
33.6
39
.8
35.8
39
.8
6 5.
9 5.
2 3.
831
31
31
30
18
19
19
19
-460
-58
8 -4
77 -
231
-43.
4 12
2 -9
2.5
-111
1,
034
922
1,12
0 1,
070
1,98
7 2,
156
2,04
1 2,
034
86.7
83
.1
85.2
76
.4
72
70
59
54
66
68
49
2615
2 17
4 21
5 25
3 5,
757
5,78
3 7,
006
7,01
4 30
4.3
298.
9 31
3.7
318.
438
.7
36.4
34
.6
32.7
-2.9
-8
.12
-3.2
8 13
.8-4
03
-325
7.1
4.6
1,25
7 1,
409
370
420
15.3
3 16
.67
-2.9
5 -8
.2
1.8
2.7
0.6
5.7
3.21
-0.3
7 1.
4-2.
13
-5.1
0.6
-5.9
4.
3 5.
3 3.
3 8.
4 6.
9 3.
3 6.
7 3
-0.6
11.8
20
.4
11.5
9.
1 10
.7
5.6
7.1
10.7
10
.6
15.8
19
.6-4
42 -
500
-288
-29
7 -3
80 -
317
-506
-35
2 -5
44 -
476
-326
6.
6 7.
7 5
4.9
6.2
4.4
7 4.
1 6.
5 6.
7 5.
8 1,
420
1,50
1 1,
277
1,34
1 1,
326
1,54
6 1,
824
1,92
6 2,
095
1,87
743
0 40
0 35
0 33
0 31
0 33
0 34
0 37
0 37
0 37
0 34
0 17
.341
8.04
18.
77 1
9.54
20.
33 2
1.16
22.
94 2
3.88
24.
03 2
4.87
25.
91
Sour
ces:
"
Wor
ld B
ank
(199
3) W
orld
Deb
t Ta
bles
; b
IMF
(199
2) I
nter
natio
nal
Fina
ncia
l St
atis
tics
Year
book
; c
Gov
ernm
ent
of K
enya
, Ec
onom
ic S
urve
ys, v
ario
us i
ssue
s; d
Ow
ino
(199
5) b
ased
on
diff
eren
tials
of
cons
umer
pri
ce i
ndic
es w
ith
maj
or t
radi
ng p
artn
ers;
an
incr
ease
in
the
exch
ange
rat
e in
dex
deno
tes
an a
ppre
ciat
ion
and
vice
ver
sa.
| o 3
10 Structural Adjustment and Environment Linkages in Kenya
public sector employment had expanded by 10%. Due to unsatisfactory progress towards stabilisation, the IMF extended facility which had been granted earlier was suspended in August 1979.
Like other countries in sub-Saharan Africa, Kenya did not escape the effects of the second oil crisis, as depicted by macroeconomic indicators such as annual growth in GDP, government deficit, and changes in exports and imports and in the terms of trade. The government was prompt in borrowing from the IMF, the World Bank, and the high interest Eurodollar market. The principal requirement for the IMF and World Bank loans was the adoption of a stabilisation programme. Though the government had just slackened the implementation of a stabilisation programme with the IMF, other identical programmes were expeditiously agreed upon to secure the loans. These programmes were designed to: (i) limit the loss of reserves and contain inflation, (ii) restrict the growth of domestic credit and impose wage restraints, (iii) devalue the Kenya shilling, and (iv) start import liberalisation. Subject to the above conditions, loans of US$200m were secured from the Eurodollar market, and two stand-by arrangements with the IMF of SDR17.25m and SDR122.5m were reached in November 1978 and August 1979," respectively (Table 2).
After receiving the funds, Kenya made less progress towards stabilisation. For instance, (i) no action was taken on the exchange rate, (ii) the credit ceiling condition on bank credit to the government was not met, and (iii) the imbalance between government expenditure and revenue continued to increase (Table 1). In FY 1980/81, the fiscal deficit rose because of an increase in civil service salaries, and other forms of overspending by various ministries. Credit to the government increased by about 70%, much greater than the contractionary effect caused by the loss in foreign reserves (World Bank, 1987:108). Because of slow progress towards adjustment, Kenya was disqualified from further drawings of World Bank and IMF aid. Consequently, economic conditions worsened almost immediately. This necessitated a revision of the development strategy and the establishment of a short-run economic programme, set out in Sessional Paper No. 4 of 1980 on Economic Prospects and Policies. This promised action on the replacement of quantitative import restrictions by tariff equivalents, the standardisation and reduction in levels of industrial protection, and the adoption of a higher interest rate policy. Based on
4. The release of this tranche was delayed for a year because of a dispute with the IMF regarding doubling the rate of export subsidy in the 1980 budget (Mosley, 1991: 274).

Introduction 11
this paper, Kenya entered into two stand-by arrangements with the IMF amounting to SDR241m in 1980 and SDR151.5m in January 1982 and into the first structural adjustment loan (SAL) from the World Bank.
Immediately after embarking on the World Bank-led adjustment programme, Kenya suffered from political turmoil in 1982s which destabilised the economy. During the same year, inflation moved to a high 20.4%, the fiscal deficit rose to a peak 7.7% of GDP, the value of exports dropped, foreign exchange reserves fell to their lowest level since 1975, and interest rates remained negative despite the revisions undertaken in 1981 (Table 1). The first SAL aimed to achieve an efficient and outward-oriented development strategy rooted in the effective and prudent use of external and internal resources. Following the implementation of its first SAP, the Kenyan economy showed signs of recovery. For instance, the balance of payments on current account and gross domestic investment improved, as shown in Table 1. However, the country was hit by drought in 1980 which led to a decline in the volume of exports. This adversely affected the performance of the industrial sector because of shortage of foreign exchange. Moreover, the drought also necessitated huge food imports.
Once more, financial assistance was sought from the IMF, and the reinstatement of the previous stabilisation programme was enforced. The IMF used as a bargaining lever the second tranche of the October 1980 stand-by agreement6 to advocate a further devaluation of the currency. The Kenyan shilling, which was pegged to the SDK in the 1970s, was devalued by 5% (February 1981) and 15% (September 1981), but this was still thought to be insufficient by the IMF, and a further devaluation of 14% was implemented in December 1981 just in time for another IMF stand-by arrangement. Based on Sessional Paper No. 4 of 1982 on Development Prospects and Policies another structural adjustment loan (SAL II) of SDR123.8m was approved in June 1982 (Table 2). This loan had numerous and more specific conditions than those of SAL I, and was intended to support the on-going adjustment efforts.
5. There was an attempt by a section of the country's air force to overthrow President Moi's regime in 1982. Even though the coup failed, many economic activities were disrupted. For instance, many shops and firms were looted, work was at a standstill for several days, the tourism sector was adversely affected, and some investors attempted to move their capital to safe havens.
6. This loan was due to be released in April but was delayed because of slow progress towards adjustment, in particular monitoring external debt (Mosley, 1991: 304).

Tab
le 2
: IM
F a
nd W
orld
Ban
k-le
d ad
just
men
t pr
ogra
mm
es i
n K
enya
, 19
75-8
9
Dat
e/na
ture
of a
gree
men
t
July
197
5, S
DR
67.2
m,
IMF
exte
nded
fun
d fa
cili
ty
July
197
5, U
S$30
m,
Wor
ld B
ank
prog
ram
me
loan
Nov
embe
r 19
78,
SDR
17.2
5m
IMF
stan
dby
agre
emen
t
Aug
ust
1979
, SD
R12
2.5m
IM
F st
andb
y ag
reem
ent
Mar
ch 1
980,
US$
55m
Wor
ld B
ank
firs
t ad
just
men
t lo
an
Oct
ober
198
0, S
DR
241.
5m
IMF
stan
dby
arra
ngem
ent
Janu
ary
1982
, SD
R15
1.5m
IM
F st
andb
y ar
rang
emen
t
June
198
2, U
S$60
.9m
loa
n an
d SD
R62
.9m
cre
dit
Maj
or c
ondi
tions
* ce
iling
s on
gov
ernm
ent
borr
owin
g an
d do
mes
tic
cred
it
re
ason
able
lon
g-te
rm d
evel
opm
ent
lim
it l
oss
of r
eser
ves
cont
ain
bala
nce
of p
aym
ents
def
icit
redu
ce i
nfla
tion
to
12%
ceili
ngs
on g
over
nmen
t bo
rrow
ing
wag
e re
stra
int
impr
ove
tax
reve
nues
re
duce
gov
ernm
ent
spen
ding
ex
pand
cre
dit
to p
riva
te s
ecto
r co
ntro
l ex
tern
al d
ebt
wag
e re
stra
int
redu
ce g
over
nmen
t de
fici
t tr
ade
libe
rali
sati
on
expo
rt p
rom
otio
n re
form
int
eres
t ra
te p
olic
y
real
ign
exch
ange
rat
eim
port
lib
eral
isat
ion
lim
it p
ubli
c se
ctor
bor
row
ing
prom
ote
dom
esti
c sa
ving
s co
ntai
n ba
lanc
e of
pay
men
ts d
efic
it
prog
ress
ive
impo
rt l
iber
alis
atio
n
impo
rt l
iber
alis
atio
nre
form
of
para
stat
als
and
publ
ic c
ompa
nies
impr
ove
ince
ntiv
es f
or e
xpor
ts a
nd a
gric
ultu
ral
prod
ucti
onac
tive
int
eres
t ra
te p
olic
yfa
mil
y pl
anni
ng c
ampa
igns

Tabl
e 2:
IMF
and
Wor
ld B
ank-
led
adju
stm
ent p
rogr
amm
es i
n K
enya
, 197
5-89
con
tinue
d
Date/
natu
re o
f agr
eeme
nt
Mar
ch 1
983,
SD
R175
.95m
an
d IM
F st
andb
y ar
rang
emen
t
Febr
uary
198
5, S
DR8
5.2m
June
198
6W
orld
Ban
k ag
ricul
tura
l se
ctor
cre
dit
Febr
uary
198
8, U
S$85
m a
nd U
S$90
m
IMF
stru
ctur
al a
djus
tmen
t fac
ility
May
198
8, U
S$11
0mFi
rst i
ndus
trial
sec
tor
adju
stm
ent c
redi
t
Apr
il 19
89, S
DR2
40m
IMF
enha
nced
str
uctu
ral a
djus
tmen
t fac
ility
July
198
9Fi
nanc
ial s
ecto
r ad
just
men
t cre
dit
Maj
or c
ondi
tions
• re
alig
n ex
chan
ge r
ate
• im
prov
e in
cent
ives
for
agr
o-in
dust
ry s
ecto
rs•
refo
rm c
redi
t pol
icy
in f
avou
r of
priv
ate
sect
or•
ceili
ng o
n bu
dget
def
icit
(as
% o
f GD
P)•
ceili
ng o
n go
vern
men
t bor
row
ing
from
ban
king
sys
tem
• in
crea
se f
ertil
iser
ava
ilabi
lity
• in
crea
se f
ees
for
lives
tock
ser
vice
s•
rest
ruct
ure
thre
e pa
rast
atal
s (S
ON
Y, N
CPB
and
NIB
)•
redu
ce o
vers
eas
borr
owin
g•
redu
ce b
udge
t de
ficit
(as
% o
f GD
P)•
mai
ntai
n po
sitiv
e in
tere
st r
ates
• re
duce
num
ber
of ta
riff r
ates
• im
prov
e im
port
/exp
ort t
arif
fs/s
ubsi
dies
• im
plem
ent e
xpor
t pro
cess
ing
zone
s•
impr
ove
expo
rt in
cent
ives
• re
duce
bud
get
defic
it•
intr
oduc
e us
er c
harg
es•
pric
e de
-con
trol
• po
sitiv
e re
al i
nter
est r
ates
• re
duce
pub
lic s
ecto
r fis
cal d
efic
it•
esta
blis
h a
capi
tal m
arke
ts d
evel
opm
ent a
utho
rity
Sour
ces:
God
frey
(19
86),
Mos
ley
(199
1), W
orld
Ban
k (1
992a
: Vol
. II).
I
s o S'
3

14 Structural Adjustment and Environment Linkages in Kenya
The foreign exchange crisis of 1982, the rapid expansion of the public deficit, and the increasing costs of servicing the external debt were in part responsible for the stabilisation and adjustment efforts of 1983 and 1984. In May 1983 a devaluation of 2.6% was effected during the implementation of a fourth stand-by agreement with the IMF. Again, tight limits were set and maintained for credit expansion, leading to a decline in the growth of the volume of credit to less than 1% in nominal terms. The Central Bank liquidated part of its domestic debt, which resulted in a fall in its overall indebtedness (World Bank, 1987: 109).
In mid-1983, Kenya's second SAL was cancelled because of disagreement over import controls and grain marketing policy, and World Bank lending shifted in favour of individual sectoral loans. Just as the economy was recovering in 1984 drought set in, causing a huge drop in economic performance. The agricultural sector recorded negative growth, and the country was unable to increase its exports despite improvements in the terms of trade following India's withdrawal from the London tea market. The pressure on the Kenyan economy was reduced when the world price of tea improved in 1985, and the world began to move out of recession following a decline in the price of oil. During the same year, weather conditions improved; the Kenyan authorities embarked on a policy of strict budgetary discipline with improved economic management resulting in enhanced economic performance. In 1986, coffee prices rose and world oil prices fell. The economy recovered, attaining an annual growth rate of 4.3% in 1985 and 7.1% in 1986. The overall balance of payments position also improved during this period. In 1987, there was a slight drop in performance, blamed on inadequate rainfall, an increase in the world price of oil, and a fall in the world prices of major export crops. A rapid deterioration in the country's terms of trade occurred, the balance of payments on current account recorded a huge deficit of US$495m and the debt service ratio returned to its 1985 peak (Table 1). The budget deficit widened as a result of increases in government expenditure on: (i) the introduction of the 8-4-4 education programme;7 (ii) funding multiple university intakes; (iii) construction of grain silos, and the purchase of grain from the 1986 bumper harvest; (iv) hosting the All-Africa games; and (v) the general elections.
7. The change to a new education system meant additional expenditure in areas such as training and/or servicing teachers, developing a new curriculum and textbooks, buying new equipment for the schools. The new system was meant to be more practically oriented, and additional expenditures were incurred to build and equip laboratories.

Introduction 15
In 1988 there was a slight improvement in the economy: the GDP growth rate improved over the previous year, the terms of trade improved, and the debt service ratio fell. However, the rate of inflation accelerated from 7.1% in 1987 to 10.7% in 1988. The year 1989 presented a gloomy picture. Export performance weakened, due to sluggish economic growth in the industrialised countries. The price of coffee declined following the collapse of the quota system of the International Coffee Organisation. This situation led to a 10.2% deterioration in the country's terms of trade, resulting in a wider gap in the current account balance. In April 1989, the IMF approved an enhanced structural adjustment facility (ESAF) of SDR261m for Kenya. Nonetheless, the facility, which carried a concessional rate of interest of 0.5%, has not been fully drawn down (EIU, 1992/93:10). Generally, Kenya was increasingly favoured by foreign aid agencies in the late 1980s, as shown by the sharp rise in official development assistance from US$463m (1985) to US$l,630m (1990). This may perhaps explain why the overall balance of payments position did not worsen.
Kenya's major macroeconomic indicators deteriorated between 1990 and 1991. The GDP growth rate feU from 4.3% in 1990 to 1.7% in 1991, inflation rose, and the foreign exchange position and the debt service ratio also worsened, as shown in Table 1. The overall balance of payments position deteriorated and foreign exchange reserves declined, in part because of insufficient net official aid inflows8 (Julin and Levin, 1992:3). Correspondingly, gross domestic investment (% GDP) continued to decline, mainly because of foreign exchange shortages (ibid.: 4). Agriculture registered a negative growth rate, mostly because of excessive and earlier than usual rain experienced during the period. The low growth in the world economy and in world trade stuck a serious blow to Kenya's export performance. The increases in the price of crude oil just before and during the 'Gulf crisis' hit the country even harder; the oil import bill rose, and the tourism sector was seriously affected because of insecurity.9 Relations with Uganda worsened at the beginning
8. According to the World Development Report (1993), net disbursement of official development assistance to Kenya declined by 17% between 1990 and 1991. Moreover, the foreign exchange reserves position in 1992 stood at 9.4% of the 1985 level (IMF, IPS, 1993).
9. The performance of Kenya's tourism sector has been disappointing in the 1990s because of, among other factors, adverse publicity about wildlife conservation problems, and international press coverage of attacks on visitors in game parks (EIU, 1991/92).

16 Structural Adjustment and Environment Linkages in Kenya
of 1991, signifying adverse effects on trade between the two countries. In view of the rapid population growth of 4.1% and slow economic growth (1.8%), GNP per capita dropped from US$340 to US$292 in 1992 (IMF, IPS, 1993).
The early 1990s have also been characterised by political and economic conditionalities. Kenya suffered further withdrawals of foreign aid because of 'human rights violations', lapses in economic management, and widespread corruption (Bigsten, 1993: 1). Economic management which improved under the SAPs between 1985 and 1989 worsened thereafter, leading to the withdrawal of foreign aid and a tightening of donors' demands. The ESAF granted in May 1989 expired in August 1992, with SDR45m undisbursed, due, inter alia, to inadequate budget discipline, the slow pace of parastatal reform, and slow progress towards multi-party democracy (EIU, 1992/93: 10). Foreign donors also suspended about US$350m of promised aid to Kenya in November 1991, to press for political and economic changes in the hope that a more democratic system would improve accountability and root out corrupt practices (Financial Times, 24 March 1993). Under this kind of pressure the country held its first multi-party elections since 1963, in December 1992. President Moi's ruling Kenya National African Union party, won a majority (93) of the 180 seats, but the opposition is also fairly well represented in the parliament.
After the elections, foreign aid was still not forthcoming, and probably out of desperation Kenya reversed its economic reform programmes, with the President declaring the IMF and World Bank policies 'dictatorial' and 'suicidal'. Furthermore, the authorities asserted that the IMF/World Bank prescriptions would lead to economic recession, the instant collapse of a number of companies, mass redundancies, and high interest rates which would stifle agricultural activities, lead to shortages and make essential goods unaffordable to many Kenyans (Weekly Review, 26 March 1993). Then, in a drastic policy decision, the government re- introduced the economic reforms, exactly one month later. Agreement was reached with IMF and World Bank officials, resulting in a resumption of aid, with an initial advance of SDR40m (Weekly Review, 21 May 1993). Kenya's two drastic policy reversals within a month could imply that the government was not serious, but was perhaps issuing a threat to break off relations with the IMF. Thereafter, the World Bank appeared to be pleased with the country's adjustment efforts and there were signs of an end to the aid freeze (Financial Times, 1 October 1993).

Introduction 17
Concluding Comments
In virtually all of Kenya's economic crises since 1970, the country has clearly relied on foreign assistance from the IMF, the World Bank and bilateral donors. It was quick, and quite willing, to liberalise rather than control some parts of the economy when pushed to do so by the World Bank and the IMF. However, it did resist some adjustment measures, and reneged on IMF conditions on a number of occasions. As a result, there were periods of foreign exchange shortage. General balance of payments support will remain a necessity, and in the absence of appreciating terms of trade there appears to be no option other than to maintain IMF and World Bank assistance. Of late, however, it seems that agreeing economic policy with the IMF and World Bank is no longer enough in Kenya: the donors are insisting on political conditions being met as well.


2Public Sector Reforms and Environmental Linkages
Although the government has undertaken a number of reform measures to tackle fiscal and budgetary problems, it still faces a deep financial crisis on both domestic and external accounts. Despite efforts to tighten the fiscal stance, the budget deficit has been growing in both nominal and real terms since 1988. In 1991 the deficit (including grants) stood at 6.8% of GDP, which falls far short of the target of 2.5%. The World Bank gives the following explanation for this trend:
Despite implementation of revenue measures, the fiscal outturn in FY91 was very disappointing. Efforts to reduce expenditure were not successful because of unbudgeted spending by a few key ministries, increased interest on domestic debt, the assumption of additional parastatal debt service obligations, and the reversal of some of the additional expenditure cuts which were proposed in October 1990 to tighten aggregate demand. Some of the pressures on expenditure were associated with the doubling of the university intake, and the impact on the Government's domestic debt service caused by the liberalisation of the financial system (World Bank, 1992: 28).
Some progress was made in increasing revenues, but efforts to reduce public expenditure were regarded as 'unsuccessful'. Figure 2 shows the trend in central government expenditure during the 1980s, indicating a significant growth in real recurrent (consumption) expenditures, with capital expenditure remaining relatively stable. A more detailed analysis of central government expenditure trends is given in Table 3 which clearly shows that the trend was not uniform across sectors. The massive growth in the 'other services' category can largely be accounted for by the growth in servicing the public debt. The defence and social sectors have also expanded both in real terms and in their relative share of total government expenditure (minus 'other services'). 10 On the other hand, expenditure on 'economic services' has experienced negative real growth
10. The 'other services' category has been deleted from total government expenditure as this is composed chiefly of debt servicing.
19
20 Structural Adjustment and Environment Linkages in Kenya
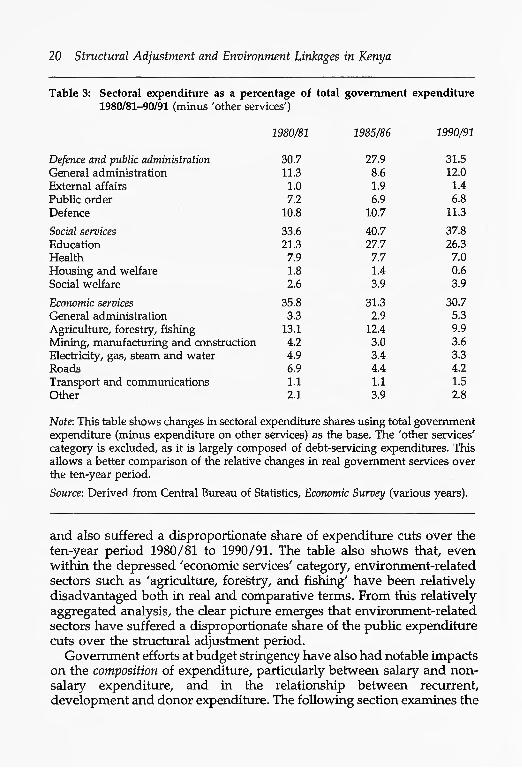
Table 3: Sectoral expenditure as a percentage of total government expenditure 1980/81-90/91 (minus 'other services')
1980/81 1985/86 1990/91
Defence and public administration 30.7 27.9 31.5General administration 11.3 8.6 12.0External affairs 1.0 1.9 1.4Public order 7.2 6.9 6.8Defence 10.8 10.7 11.3
Social services 33.6 40.7 37.8Education 21.3 27.7 26.3Health 7.9 7.7 7.0Housing and welfare 1.8 1.4 0.6Social welfare 2.6 3.9 3.9
Economic services 35.8 31.3 30.7General administration 3.3 2.9 5.3Agriculture, forestry, fishing 13.1 12.4 9.9Mining, manufacturing and construction 4.2 3.0 3.6Electricity, gas, steam and water 4.9 3.4 3.3Roads 6.9 4.4 4.2Transport and communications 1.1 1.1 1.5Other 2.1 3.9 2.8
Note: This table shows changes in sectoral expenditure shares using total government expenditure (minus expenditure on other services) as the base. The 'other services' category is excluded, as it is largely composed of debt-servicing expenditures. This allows a better comparison of the relative changes in real government services over the ten-year period.
Source: Derived from Central Bureau of Statistics, Economic Survey (various years).
and also suffered a disproportionate share of expenditure cuts over the ten-year period 1980/81 to 1990/91. The table also shows that, even within the depressed 'economic services' category, environment-related sectors such as 'agriculture, forestry, and fishing' have been relatively disadvantaged both in real and comparative terms. From this relatively aggregated analysis, the clear picture emerges that environment-related sectors have suffered a disproportionate share of the public expenditure cuts over the structural adjustment period.
Government efforts at budget stringency have also had notable impacts on the composition of expenditure, particularly between salary and non- salary expenditure, and in the relationship between recurrent, development and donor expenditure. The following section examines the

Public Sector Reforms and Environmental Linkages 21
Figure 2: Central government expenditure, 1980-90 (constant prices 1982=100) 2000
200 -
1980 1981 1982 1983 1984 1985 1986 1987 1988 1989 1990Year
• Total expenditure Recurrent expenditure Development
implications of changes in the pattern of public expenditure and revenues in a number of key natural resource sectors. Analysis of these trends reveals that blanket cut-backs in public expenditure are unlikely to achieve the desired efficiency gains, unless the institutional framework is also subject to reform and reorganisation. Finally, the need for reforms in government institutions responsible for natural resource management is investigated.
Natural Resource Sectors: Trends in Public Expenditure and Net Government Outlay
Recurrent Expenditure
Figure 3 shows the trend in real recurrent expenditures11 for the Ministries of Wildlife and Tourism,12 Water Development, and
11. Expenditures are gross and therefore include AIA (revenues).
12. Includes the Kenyan Wildlife Service and the Department of Fisheries.

22 Structural Adjustment and Environment Linkages in Kenya
Figure 3: Real recurrent expenditure by selected sectors, 1981/2-91/2 (constant prices 1980=100) 16
14
12 -
10 -
i 8
6 -
4 -
2 -
081/82 82/83 83/84 84/85 85/86 86/87 87/88 88/89 89/90 90/91 91/92
Year —•— Wildlife/tourism X Water —3— Environment & Nat. Resources
Source: Recurrent estimates (various years).
Environment and Natural Resources. 13 Although nominal expenditures have been rising, Figure 3 demonstrates that real recurrent expenditures show a slow decline for all three ministries over the structural adjustment period. However, these aggregate figures conceal significant changes in the composition of recurrent expenditure, particularly in the relationship between salary and non-salary expenditure. Throughout the period of adjustment, the civil service has continued to grow, so that by 1991 the approved establishment was almost 100% greater than it had been ten years previously. This growth was part of government policy to create jobs for the rapidly expanding population and to absorb the growing number of graduates from secondary and tertiary education.
This growth in the number of civil servants has increased the wage bill, but supporting operation and maintenance (O&M) expenditures have not kept pace with this. Whereas personnel emoluments were a significant and seemingly intractable component of recurrent expenditure, the burden of expenditure cuts has fallen primarily on non-wage recurrent expenditure. In addition, even though there has been steady
13. Includes Departments of Forestry, National Environmental Protection and Mineral Development.

Public Sector Reforms and Environmental Linkages 23
growth in the size of the civil service and the overall wage bill, this has been accompanied by stagnation or regression in the real salaries paid to civil servants. Consequently, even though the civil service has expanded, there is no evidence of a corresponding increase in access to, or improvement in the quality of, government services. In many cases, the opposite has occurred as personnel in post have become ineffective and demoralised, owing to cut-backs in supporting services and real wages. This has contributed to the growth in corruption and theft of government property in the 1980s.
Overall, the decline in real expenditures, the deterioration in the ratio of O&M expenditure to total recurrent expenditure, the deterioration in civil service salaries, and the increase in corruption and theft have all had a detrimental impact on the effectiveness of the public service, including environment-related sectors. The extent to which these changes can be partly or fully attributed to structural adjustment programmes is not clear, without knowledge of the alternative policies that the government would have pursued outside a SAP. For a government committed to a rapid reduction of inflation, there would certainly be some need to bring government spending under control. Nonetheless, it is fair to say that the Kenyan experience reflects the tendency for payroll costs to rise relative to other recurrent items in the government budget. This may be a common tendency during periods of budgetary stringency, but it appears more pronounced in the Kenyan case because of government resistance to large-scale public sector redundancies.
Forestry sectorIn the Forestry Department there has been a dramatic cut-back in non- salary expenditure, as shown in Figure 4. As a consequence, there is no longer the capacity to manage the forestry sector in an efficient and environmentally sound manner.
Many of the problems in Kenya's forests have been aggravated by the fact that the Forestry Department is a weak line agency, with limited political support. The Forestry Department has been suffering from static budgets in real terms, compounded by structural imbalances caused by 80-85% of the budget being spent on salaries and wages. Consequently, the department's development has been retrograde in the past five years to a point where its operations are severely hampered by run-down and insufficient infrastructure and vehicles, lack of materials, low morale among staff and particularly the labor force, and a continuous state of crisis management ... As a result of these developments, the Forestry Department is no longer adequately equipped to cope with the challenges

24 Structural Adjustment and Environment Linkages in Kenya
Figure 4: Relationship between salaries and recurrent expenditure in the forestry sector, 1980/81-91/2 (constant prices 1980=100)
400-
Salaries
Total expenditure
80/81 81/82 82/83 83/84 84/85 85/86 86/87 87/88 88/89 89/90 90/91 91/92Year
Source: Recurrent estimates (various years).
of meeting the development requirements of an environmentally sound and efficiently producing subsector. The Forestry Department's host ministry, the Ministry of Environment and Natural Resources, is equally weak and has not been able to ensure the strengthening of the Forestry Department (World Bank, 1990a: 9).
The World Barik has called for an improved forestry management system, including action on labour productivity. A recent study on the sustainable Monitorable Action Plan to Improve Labour Productivity of the Forestry Department (MAPLP, 1992) attempts to quantify staffing needs for the sector. To carry out the Forestry Department tasks (forestry management, conservation and forestry extension), the MAPLP Report estimates a total labour requirement of 6,881 (representing only 50% of the current labour force). As part of structural adjustment conditionality, cut-backs in the order of 5,000 forestry staff are required. The government has agreed to a freeze on recruitment, but not to changes in staff deployment, although early retirement packages are under

Public Sector Reforms and Environmental Linkages 25
consideration.It is clear that the existing structure and performance of the Forestry
Department are inadequate and are contributing to the poor management of both indigenous forests and industrial plantations. The sector is therefore currently targeted for institutional support under the World Bank/ODA Forestry IV Project. One of the main aims of this project is to strengthen the institutional capacity of the Forestry Department through physical investments, training, management support and technical assistance.
Wildlife sectorThroughout the 1980s, the wildlife sector suffered from financial and institutional problems similar to those in forestry. Budgetary cuts fell largely on operating expenses and reductions in real salaries and wages, reducing the effectiveness of staff in post and contributing to their demoralisation and the growth of corruption. The government recognises the damaging environmental consequences of this trend.
The shortage of operating funds contributed to poor management standards. Without funds, most WCMD staff became accustomed to inactivity and to the deterioration of facilities and equipment. The department was overstaffed but numbers could not in practice be reduced in order to release funds for non-personnel costs. Low salaries and failure to pay due allowances caused further demoralisation and contributed to the growth of corruption (KWS, 1990).
The problems are now being addressed with the reorganisation of the sector, including the creation of a new paraptatal organisation, the Kenyan Wildlife Service (KWS), in January 1990 to replace the Wildlife Conservation and Management Department (WCMD).
If all planned activities go ahead, the recurrent budget is expected to increase to almost Ksh700m a year by 1995/6, compared with the 1991/2 level of about Ksh285m. There will also be major changes in the composition of recurrent expenditure. The reforms involve cut-backs and retrenchment of the inherited WCMD workforce. New staff training programmes are designed to upgrade the remaining staff, and there has been some recruitment of new qualified personnel including consultants. The terms and conditions of service have been improved and serious attempts are being made to restore the balance between personnel and non-personnel expenditures. Although it is still early days in the reform process, there are signs that the reforms are contributing towards reducing land conflicts with local communities through revenue-sharing

26 Structural Adjustment and Environment Linkages in Kenya
schemes, increasing official revenues from wildlife through increased National Park entrance fees and improved collection rates, and reducing poaching through more active wildlife management. A more detailed analysis of the economic and environmental consequences of these reforms is given in Chapter 3.
Development Expenditure
Figure 5 shows the trend in real development expenditures for the Ministries of Tourism and Wildlife, Water Development, and Environment and Natural Resources. Over the adjustment period, development expenditures have kept pace with inflation for the Ministries of Tourism and Wildlife, and Environment and Natural Resources. In fact, donor support for both ministries has been on the upturn since the early 1990s. The Ministry of Water Development (MOWD) has recently suffered from real cut-backs in development expenditures. Between 1974/5 and 1989/90, the government contributed
Figure 5: Real development expenditure by selected ministries, 1982-91 (constant prices 1980=100)
1982 1983 1984 1985 1986 1987 1988 1989 1990 1991 1992Year
• Wildlife/tourism • X Water —3— Envlronmenl & Nal. Resources
Notes: Ministry of Environment and Natural Resources includes Departments of Forestry and Mineral Development. Development expenditures include external
Source: Development estimates (various years).

Public Sector Reforms and Environmental Linkages 27
K£400-500m towards its commitment to provide an adequate safe water supply for the entire population by 2000. However, in the early 1990s the Ministry suffered substantial cuts in real development expenditure owing to a redirection of development funds towards high priority projects with greater social and economic returns. At the same time, operational and maintenance costs have been passed on to the consumer in the form of higher water rates and tariffs.
These aggregate figures disguise important changes in the level of the government contribution to development projects. Figures 6-8 show the relationship between government and external funding for the three ministries.
The overall trend reveals a growing dependence on external sources to fund environment-related development projects over the period of adjustment. This implies that development priorities have been determined more by the availability of finance from donors, rather than by national priorities. There is also an increasing tendency for the development vote to be raided to support recurrent expenditures. Consequently, ministries have been reluctant to prioritise their development projects because of their reliance on the donor-financed portion of the development budget for the funding of their non-wage O&M expenditures. In many cases, government departments are unable to honour their financial commitment to donor-funded development projects, while projects and programmes which are 100% government financed have been most severely curtailed. For example, the Forestry Department reports severe reductions in the government-funded forestry extension and tree nursery programme and reduced contributions to donor-funded projects.
Net Government Outlay
This section is based on a 1993 report by the Long-Range Planning Division in the Ministry of Planning and National Development (Southey and Nderitu, 1993), which analyses the net government outlay14 or subsidy to the following environment-related sectors: fisheries, forestry, mining, wildlife and tourism. The section outlines the trend in government outlays to selected environmental sectors over the period of adjustment, and investigates the potential for raising revenue and improving resource
14. Net government outlay is the difference between gross expenditure (recurrent and development expenditures inclusive of aid and assistance grants) and revenues raised.

28 Structural Adjustment and Environment Linkages in Kenya
Figure 6: Ministry of Tourism and Wildlife - real development expenditure,1982-91 (constant prices 1980=100)
6 .
1982 1983 1984 1985 1986 1987 1988 1989 1990 1991 1992Year
Notes: Total development expenditure includes government and external contri butions. External funding includes grants, loans and donations in kind.
Source: Development estimates (various years).
Figure 7: Ministry of Water - real development expenditure, 1982-91 (constantprices 1980=100)
30
1982 1983 1984 1985 1986 1987 1988 1989 1990 1991 1992Year
—x— External funding
Notes: As Figure 6.
Total development expenditure

Public Sector Reforms and Environmental Linkages 29
Figure 8: Ministry of Environment and Natural Resources - real development expenditure, 1982-91 (1980=100)
14
1982 1983 1984 1990 1991 1992
—•- External funding
Notes: As Figure 6.
Total development expenditure
management through more extensive use of user charges. Southey and Nderitu (1993) emphasise that, as many environmental services are currently under-priced, there is considerable potential for replacing distortionary taxes elsewhere in the economy with user charges for natural resources. In this way, the natural resource sector can make a greater contribution to public revenues as well as improving natural resource management.
Figure 9 traces the combined net government outlay for fisheries, forestry, mining and tourism, and shows an overall increase in government outlay to these environmental sectors over the period 1972-91. However, over the period of structural adjustment in the 1980s, net real outlays show a steady decline, which picks up slightly in the early 1990s. The environmental implications for the different sectors are analysed separately below.
ForestryThe trend in net real government outlay to the Forestry Department in Figure 10 shows an initial decline in the early years of adjustment, due

30 Structural Adjustment and Environment Linkages in Kenya
Figure 9: Net outlay to combined departments, 1972/3-90/91 (in real 1982 K£)
35
30
25 I T- ——
Net Real Outlays
20
I15
10 -
/
72/73 74/75 76/77 78/79 80/81 82/83 84/85 86/87 88/89 90/91
Source: Southey and Nderitu (1993).
to reduced real expenditure and substantially increased revenues. After 1985/6, real expenditures show a long-term upward trend, and revenues have increasingly become eroded by inflation and collection problems.
The main revenue sources from the forestry sector are timber royalties (90%), fuel royalties (4%) and miscellaneous forest (6%) receipts, primarily from publicly owned exotic timber plantations. The royalties should be sufficient to cover the costs of re-establishing the timber. However, inflation has seriously eroded them and for many years the government has effectively been subsidising the production of commercial timber. Under structural adjustment, stumpage fees have now been raised, but there still remains a serious problem in the system of royalty collection. According to the World Bank (1990a: 21):
While stumpage fees have been raised to levels roughly in line with replacement costs, actual collection of royalties has decreased to a present low level of about or below 40 percent of the value of commercial timber removed.
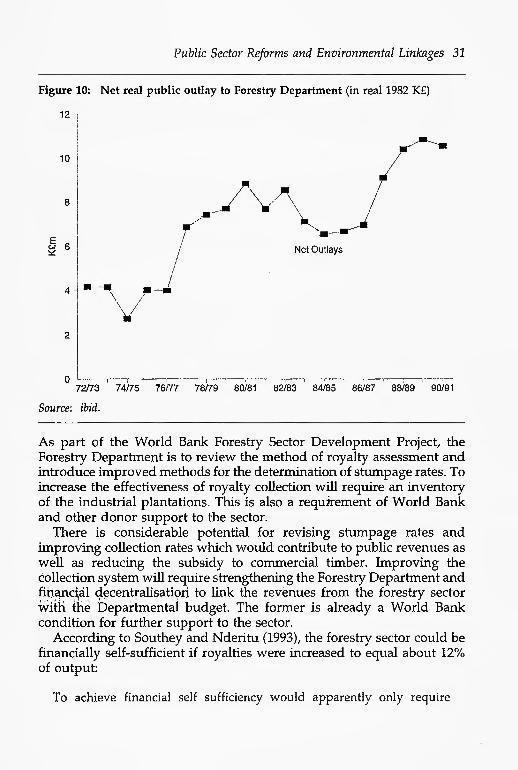
Public Sector Reforms and Environmental Linkages 31
Figure 10: Net real public outlay to Forestry Department (in real 1982 K£)
12 ;
10
|a
A .A
Net Outlays
\ ,
V
72/73 74/75 76/77 78/79 80/81 82/83 84/85 86/87 88/89 90/91
Source: ibid.
As part of the World Bank Forestry Sector Development Project, the Forestry Department is to review the method of royalty assessment and introduce improved methods for the determination of stumpage rates. To increase the effectiveness of royalty collection will require an inventory of the industrial plantations. This is also a requirement of World Bank and other donor support to the sector.
There is considerable potential for revising stumpage rates and improving collection rates which would contribute to public revenues as well as reducing the subsidy to commercial timber. Improving the collection system will require strengthening the Forestry Department and financial decentralisation to link the revenues from the forestry sector with the Departmental budget. The former is already a World Bank condition for further support to the sector.
According to Southey and Nderitu (1993), the forestry sector could be financially self-sufficient if royalties were increased to equal about 12% of output:
To achieve financial self sufficiency would apparently only require
32 Structural Adjustment and Environment Linkages in Kenya
royalty increases of equal to 12-13% of output, but the output of the traditional sector would be almost impossible to tax. Nevertheless, given the low collection rate and generally low stumpage fees, it should be achievable without causing any distortions in this sector, and indeed efficiency should improve.
FisheriesThe trend in real government outlay to the fisheries sector is shown in Figure 11. The upward trend is largely explained by the increase in real public expenditures. Government revenues from the sector are small, and consist of lake fisheries licence fees (47%), marine fishing licences (22%), registration of craft (11%) and peche-de-mer (20%). In 1991 an export levy of 0.5% was introduced, which should increase revenues by a small amount in the future.
Although the government outlay has been increasing in absolute terms, relative to the value of output it has been falling. Table 4 shows that in the late 1970s the government was implicitly subsidising the fishing industry to the tune of up to 40% of output value. By 1991 the subsidy had fallen to 17%, owing to increases in the real value of output from Lake Victoria rather than real expenditure cut-backs. Commercial output had been increasing throughout the 1970s and 1980s. However, the sudden burst in output in 1989 and 1990 is largely attributable to the significant increase in the price of fish, due to the opening up of the export market under the trade liberalisation reforms.
The important question is whether these increased fish yields are sustainable in the long term. This is doubtful and there are already growing fears that the industry is in the process of being rapidly overexploited, even though the stated policy of the Fishery Department is to secure maximum sustained yields.
Data for the period 1970-1975 showed that Kenyan waters, which landed 16,000-17,000 tons per year over this period, could have landed 90,000 on a sustainable basis. Using this criterion, catches in Victoria would have exceeded maximum sustainable levels in about 1985, and were more than twice as large as the maximum sustainable level in the record catch of 185,000 in 1990 (Southey and Nderitu, 1993: 23).
The problem is largely one of uncontrolled access to the lake resources which has led to unprecedented increases in the number of fishing vessels.
Between 1982 and 1990 official landings increased by 275 percent and the

Public Sector Reforms and Environmental Linkages 33
Figure 11: Real net outlay to Fisheries Department, 1972-91 (in real K£)3.5 |
u
2.5
0.5
?\A
Real Outlays
72/73 74/75 76/77 78/79 80/81 82/83 84/85 86/87 88/89 90/91
Sources: Estimates of Revenue of the Government of Kenya (various issues), Estimates of Recurrent and Development Expenditures (various issues).
value of catch by 408 percent in real terms (deflating catch by the GDP deflator). Canoes may have increased by 38%. There was clearly the opportunity in the last few years to capture very substantial rents as the value of catch per boat or per canoe has increased threefold (ibid.: 25).
Southey and Nderitu recommend a moratorium on new vessel licences in Lake Victoria and an increase in the export tax. Alternatively, differential licence fees could be introduced to distinguish between commercial and traditional fishermen, size of boat and/or fishing technology. The Department of Fisheries has introduced controls on mesh sizes and a closed season for seme nets and lamp attraction fishing.
Wildlife and tourismThe trend in real government outlay to the wildlife and tourism sector is shown in Figure 12, which illustrates the success of the government in cutting down real expenditures to the sector over the period of

Tab
le 4
: C
ontr
ibut
ion
of f
ishe
ries
to
GD
P, 1
972-
91
Nom
inal
val
ues
K£m
Year
1972
1973
1974
1975
1976
1977
1978
1979
1980
1981
1982
1983
1984
1985
1986
1987
1988
1989
1990
1991
Trad
ition
al
Mon
etar
y To
tal
0.15
0.16
0.18
0.20
0.29
0.29
0.43
0.46
0.55
0.82
1.03
1.11
1.25
1.46
1.80
1.85
2.11
2.85
3.01
3.28
1.26
1.35
1.45
1.65
2.36
2.33
3.52
3.70
4.37
6.56
8.33
9.02
10.3
412
.09
15.0
917
.50
20.0
927
.39
32.7
637
.48
1.41
1.51
1.63
1.85
2.65
2.62
3.95
4.16
4.92
7.38
9.36
10.1
311
.59
13.5
516
.89
19.3
522
.20
30.2
435
.77
40.7
6
Real
198
2 K
£m
Trad
ition
al
Mon
etar
y To
tal
Out
lay
as
% o
f GD
P
0.43
0.42
0.41
0.38
0.48
0.41
0.59
0.60
0.66
0.90
1.02
1.00
1.02
1.09
1.23
1.20
1.26
1.54
1.48
1.52
3.59
3.52
3.27
3.17
3.91
3.26
4.87
4.84
5.27
7.23
8.29
8.11
8.40
9.06
10.3
211
.37
11.9
814
.84
16.0
717
.32
4.02
3.93
3.67
3.55
4.39
3.66
5.46
5.45
5.93
8.14
9.31
9.11
9.42
10.1
511
.55
12.5
713
.24
16.3
817
.54
18.8
4
30.2
726
.68
23.8
821
.58
37.0
637
.03
39.5
634
.82
28.3
023
.15
19.1
223
.69
26.2
623
.53
20.0
517
.42
16.8
817
.23
16.8
7
Sour
ces:
G
over
nmen
t of
Ken
ya,
Eco
nom
ic S
urve
ys (
vari
ous
issu
es).

Public Sector Reforms and Environmental Linkages 35
Figure 12: Net outlay by Department of Tourism and Wildlife, 1973-91 (in real1982 K£)
25
20
15
10 i
~^Jet Outlays
x
073/74 75/76 77/78 79/80 81/82 83/84 85/86 87/88 89/90
Sources: Southey and Nderitu (1993).
adjustment. Real revenues15 also declined over the same period, owing to erosion by inflation and collection problems, including corrupt practices by wildlife officials. The earlier discussion on trends in recurrent and development expenditures highlighted the link between public expenditure cut-backs and wildlife mismanagement, including the poaching of key species such as rhino and elephant.
This trend has since been reversed with the recent reforms in the wildlife sector, including the creation of the Kenyan Wildlife Service (KWS) in 1990. One of the primary goals of the KWS is to establish a secure financial base. The following is an excerpt from the KWS Development Programme 1991-6:
Having already increased its revenue from Park fees, KWS is studying the potential for broadening and augmenting its revenue sources, so that it
15. Revenues include Park entry fees, rent from Park lodges, hire of machinery/ equipment, game licences, and royalties from ivory and confiscated trophies.

36 Structural Adjustment and Environment Linkages in Kenya
will be able to meet its recurrent costs in full and eliminate its requirement for central government funding. There is clearly scope for further real increases in entry charge levels, and good indications that other substantial commercial sources of income are waiting to be tapped, given an innovative and aggressive marketing programme (KWS, 1990).
The overall plan is to achieve financial self-sufficiency by the end of the 1990s. This will require substantial investments in the initial years (estimated at US$170m over 5 years) in infrastructure, facilities and equipment, training and technical assistance. The revitalisation and reorganisation of the wildlife sector have already attracted substantial donor support for many of these activities. The improved management and infrastructure will be able to attract and support growing numbers of tourists, and generate income for local communities from related activities.
Public Sector and Institutional Reforms
It is clear from the discussion in the previous sections of this chapter that efforts to reduce public expenditure have not been successful in correcting fiscal imbalances or in improving the efficiency of the public sector. On the contrary, this study has uncovered many examples of the growing ineffectiveness of public expenditure in selected natural resource sectors.
Over the past 20 years the central government has expanded from 19 to 28 ministries, and in the parastatal sector there are now about 255 commercially orientated public enterprises in which the government holds equity either directly or indirectly through majority-owned development finance institutions. The proliferation of the public sector has not only contributed to the massive growth of the recurrent budget, but has also led to a duplication of responsibilities, a breakdown in co ordination and communication, and conflicts between ministries. In the natural resource sector, this has led to fragmentation and overlap of environmental responsibilities and conflicts between national development policies that cannot be resolved within the existing institutional and legal framework. The following example illustrates the problems created by the overlap of government functions:
An agricultural investor in an arid area would be required to deal with six ministries: Agriculture; Reclamation and Development of Arid, Semi- Arid Areas and Wastelands; Livestock Development; Water Development;

Public Sector Reforms and Environmental Linkages 37
Cooperative Development; and Supplies and Marketing, in addition to the local administration and the district development committees. There may also be a conflict of advice, for instance a private farmer may be visited by different extension agents who might not take into consideration the conflict in land use patterns between, say, crops and livestock, as each agent will largely be interested in increasing the production of the crop or livestock he gives advice on (Friedrich Naumann Stiftung, 1992: 135).
The Kenyan adjustment programme emphasises the need for reorganising the public sector, with the following priorities:
streamlining the functions and organisational structure of government to avoid duplication and redundancies and to achieve better organisational synergy
reducing staff in line with the rationalised functions and organisational structure
reforming the pay structure and personnel procedures so as to achieve an appropriate mix of staff at all levels who are motivated and equipped to function effectively and efficiently (World Bank, 1992: 60)
A number of initiatives have been taken towards achieving these broad objectives. For example, the Budget Rationalisation Programme (BRP) was introduced in 1985 with the aim of increasing the productivity of government expenditure. Under the BRP a system of forward budgeting within overall ministerial ceilings was introduced. Unfortunately, there has been little progress in improving resource utilisation:
These improvements in the budgetary process have not achieved a reallocation of expenditure to non-wage O&M or a concentration of limited resources on high priority projects. On the contrary, the ratio of O&M expenditures to personnel expenditures continued to decline even after the BRP was introduced (ibid.: 38).
The Public Investment Programme (PIP) was another initiative designed to improve the productivity of government expenditure by restructuring and rationalising public investment. This means an improvement in investment programming, including prioritisation of projects. However, there is little evidence that this has been done according to economic or environmental criteria, or following a sectoral strategy.
Even if the BRP and PIP had been more successful in improving the efficiency of public expenditure, they still would not have addressed the

38 Structural Adjustment and Environment Linkages in Kenya
main problem, which relates to the organisational complexity and payroll of the civil service. Conditions aimed at streamlining the functions and organisational structure of government and reducing personnel costs are central to the adjustment programme in Kenya. There has been some progress in establishing ministerial staffing norms and salary ceilings, but the targets are regularly exceeded in most sectors.
The current organisational structure of government has important implications for environmental planning and the management of natural resources. The following sub-section examines recent trends in the organisation of institutions for natural resource management and highlights the need for reform.
Trends in the Organisation of Government Institutions for Natural Resource Management
The discussion thus far indicates that there has been very little change in the organisational structure of government over the adjustment period. 16 This means a continuation of the current system in which responsibility for environmental matters is fragmented among many ministries and institutions, resulting in frequent duplication of efforts and conflicting objectives.
Fragmentation of environmental responsibilitiesThere are many different ministries, departments, parastatals and committees that have some responsibility for different aspects of the environment. This sectoral approach to environmental issues means that each institution takes a stand that promotes its own individual interest, with no effective mechanism for inter-sectoral co-ordination. The existing Inter-Ministerial Co-ordinating Committee on the Environment is limited by its lack of authority to override ministerial decisions. This leads to costly duplication of activities and gaps in responsibility in other areas. For example, in the area of agroforestry, the Rural Afforestation Programme is run by the Forestry Department, but at the same time the Ministry of Energy has six agroforestry centres, and a number of other institutions are involved in tree nursery programmes. In contrast, there is a gap in responsibility for the management of wetlands and aquatic systems as highlighted by a report by Bragdon (1992: 16):
16. A notable exception is the reorganisation of the wildlife and tourism sector with the establishment of the Kenya Wildlife Service in 1990.
Public Sector Reforms and Environmental Linkages 39
The Ministry of Water Development is responsible for the management, development and maintenance of water resources. The Regional Development Authorities also have authority over hydrological resources. Without explicit responsibility resting with one institution or at least coordinated among institutions, the conservation of wetlands takes place only incidentally within lands protected for other purposes.
Reorganisation and streamlining of the government sector under structural adjustment must take the intersectoral nature of environmental issues into account. Bragdon recommends a move towards new institutional forms and programmes which are capable of cutting across administrative and sectoral boundaries.
Conflicting implications of national policyMany environmental conflicts arise in the implementation of national policy, which are difficult to resolve in the absence of a national environmental and land use policy and an effective co-ordinating body. The National Environment Secretariat has responsibility for co-ordinating the interests of the relevant ministries but it has no powers of implementation or enforcement. For example, the promotion of agriculture and wildlife tourism under the 1989-93 Development Plan created serious land conflicts between the two sectors. Similarly, national- level policy aimed at individualising land tenure creates conflict between agriculture, livestock, wildlife and water:
Unrestricted individualisation of land ownership . . . has the potential to lead to loss of wildlife habitat and dispersal areas and to disrupt livestock grazing systems. Furthermore, farmers who decide to fence their plot and grow crops on lower potential land frequently find themselves facing natural resource limitations. Water availability is often a major problem. Land degradation also results from the continuous use of land that does not have this capacity (Bragdon, 1992: 16).
Lack of national environmental policy and land use strategyCurrently there is no comprehensive environmental policy in Kenya. There are many ad hoc pieces of legislation that affect the environment, but they are scattered among different sectors and administered by different institutions.
The call for a comprehensive environmental policy is not new in Kenya. A Sessional Paper on the Environment outlining the government's environmental policy has been drafted. Annex 1 outlines the scope and coverage of the National Environment Action Plan (NEAP) which

40 Structural Adjustment and Environment Linkages in Kenya
includes the preparation of a national environmental policy, institutional reforms, and developing environmental information systems to support decision-making. The NEAP will feed into the national planning process and will require government action on policies, legislation and institutions; the modification of ongoing projects; and the development of an environmental investment programme of projects designed to implement new parts of the Plan.
Conclusions
The main conclusions and recommendations are outlined in Chapter 5. The key lessons to be learnt can be summarised as follows:
Recurrent budgets for environment-related ministries have suffered cut-backs in real terms under structural adjustment policies.
The burden of recurrent expenditure cuts has fallen on O&M expenditures and real wages. Consequently, employees have become ineffective and demoralised. Financial and personnel management standards have deteriorated which has adversely affected environmental management.
Government departments have become increasingly dependent on external sources to fund environment-related development projects over the adjustment period.
Government revenues from natural resource sectors have been eroded by inflation and poor collection rates. This has tended to reduce the priority attached to these sectors.
There is considerable potential for raising revenue and improving natural resource management through more extensive use of user charges.
Differential charges could be designed to achieve revenue-raising, conservation and distributional objectives.
There has been very little change in the organisational structure of government over the adjustment period. The existing framework has caused the fragmentation of environmental responsibilities across many different ministries, departments, parastatals and committees.
There is urgent need for institutional reform and the development of a national environmental policy and land use strategy to address inherent conflicts in national policy and to bring together various ad hoc policies and legislation affecting environmental management.
3Structural Adjustment and Environmental
Linkages in the Wildlife Sector
Economic and Environmental Significance of the Wildlife Sector
The wildlife sector has been selected for detailed case study because of its significance as an economic and environmental resource in Kenya. The tourism sector17 is now the country's leading foreign exchange earner, with receipts having increased from K£82.5m in 1980 to K£713m in 1991. It has also significantly improved its relative share of the export market, compared with agriculture and other services, recording an improvement from 18.4% in 1985 to 25.7% in 1988, while agricultural export earnings remained virtually static (from 40.4% to 40.1%) and 'other services' even declined (from 14.4% to 8.9%) over the period (Friedrich Naumann Stiftung, 1992: 198).
Table 5 shows the trend in tourist arrivals and earnings over the period 1980-91.
Throughout the period, tourist numbers have been steadily increasing, although the growth in real returns from tourism has not kept pace with this, largely because of the erosion of revenues through inflation and revenue leakages due to corruption on the part of wildlife officials throughout the 1980s. The growth in wildlife-based tourism ironically coincides with a decline in the populations of some of the charismatic animal species such as elephant and rhinoceros. For example, the elephant population fell from 165,000 in 1973 to less than 18,000 in 1988, and the black rhino decreased from about 20,000 in 1970 to 350 in 1986 (Nyeki, 1992). This disturbing trend has come about through organised poaching, a loss of critical habitats, conflicts with neighbouring communities, and a deterioration in Park and Reserve infrastructure and management capacity (World Bank, 1991).
Table 6 shows that many wildlife species in the Kenyan rangelands have suffered a significant population decline over the five-year period
17. Most of the economic returns from wildlife are derived from tourism, although there are now a number of initiatives under way to generate income from wildlife by other means, such as game ranching.
41

42 Structural Adjustment and Environment Linkages in Kenya
Table 5: Trend in tourist arrivals and receipts, 1980-91
Year
19721973197419751976197719781979198019811982198319841985198619871988198919901991
Arrivals
444,235397,721387,510407,000446,040346,460364,425385,850389,187365,940392,110381,192462,200540,600614,200661,300694,000734,700814,400804,600
Total visitor days
4.934.534.495.255.585.135.545.986.115.566.356.217.358.609.77
10.5811.109.99
11.7211.02
Earnings K£m
27.324.327.034.442.953.564.565.188.596.2
122.9130.9151.7196.7248.0292.1349.3432.1533.0594.0
Earnings 1982 K£m
77.863.360.866.071.174.889.285.2
106.6106.0122.9116.9123.3147.3169.6189.8208.3234.1261.4244.9
Source: Government of Kenya, Statistical Abstracts and Economic Surveys (various years).
1985-90. This caused a national and international outcry for the protection and conservation of wildlife in Kenya, and donor organisations started to demand major economic and institutional reforms in the wildlife sector. The government responded to the pressure by a public demonstration of its commitment to stop wildlife poaching, involving the burning of more than 2,500 elephant tusks in Nairobi National Park in July 1989 and the banning of all international trade in ivory within the CITES agreement. In 1990 the Protected Areas and Wildlife Services Project was established. This was an agreement between the Government of Kenya and the World Bank to initiate major institutional and economic reforms in the wildlife sector, including the replacement of the Wildlife Conservation and Management Department (WCMD) with a new parastatal called the Kenya Wildlife Services (KWS). Table 6 indicates encouraging signs that these initiatives have contributed to the reversal of the trend towards declining wildlife populations.

Structural Adjustment in the Wildlife Sector 43
Table 6: Wildlife population in the Kenyan rangelands ('000)
Species 1985 1987 1989 1990 1992
Elephant 19 17 17 17 19Buffalo 46 39 42 45 51Giraffe 55 45 52 56 59B. Zebra 142 142 174 194 197G. Zebra 74667Topi 82 103 107 110 108Kongomi 24 20 22 23 26Wildebeest 93 68 88 100 120Oryx 42 26 33 38 36Eland 27 17 26 31 33H. Hartebeest 20 19 23 3 3Waterbuck 11 8 767Kudu 7 7 11 13 14Gerenuk 25 25 24 23 24Impala 122 111 107 105 111G. Gazelle 184 127 163 184 188T. Gazelle 107 101 99 89Warthog 12 18 22 22Ostrich 26 33 38 37
Source: Government of Kenya, Economic Surveys (various years).
The main issues in wildlife management in Kenya are discussed below, and are then linked to recent economic and institutional reforms in the sector.
Key Issues in Wildlife Management
Land Use Conflicts
Kenya is a land-scarce economy, and as the population increases this inevitably means that wildlife must compete with other valuable land uses such as arable and livestock farming, industrial development and human settlement. In the past, wildlife has often lost the land battle with the surrounding communities. This is hardly surprising, given that the benefits of wildlife have accrued to a few tourist operators and poachers,
44 Structural Adjustment and Environment Linkages in Kenya
whereas the surrounding communities have borne a significant proportion of its costs in terms of damage to crops and livestock and threats to personal security. In the past, communities were able to apply for compensation for damage from wildlife, but this scheme was abolished at the end of the 1980s following widespread criticism that it was ineffective and corrupt. Cropping and fencing programmes were intended to resolve the conflict, and longer-term plans involve community participation and revenue-sharing schemes, and the development of a national land use policy.
At present, the principal mechanism for planning land use in Kenya is through the District Development Committees. However, in the absence of a national policy on land use, the District Committees are not able to resolve land use conflicts at the regional and national level. In particular, they cannot settle the conflict between wildlife and conservation and other interested ministerial sectors including agriculture, energy, fisheries, forestry, livestock, transport, water development and arid and semi-arid lands. Land use conflicts have a long history in Kenya, and the preparation of a national land use policy has been on the agenda for almost as long.
The greatest threat to wildlife habitats is in the National Reserves and the surrounding areas. These Reserves provide important wildlife dispersal areas and migration routes, but they do not afford the same level of protection as the National Parks. Some of the wildlife dispersal areas currently being threatened include the Masai Mara area and areas in Kajiado, Narok, and Samburu Districts.
For example, the development of the Kitengela areas may soon prevent the migration of the Nairobi National Park wildlife, unless a 'wildlife corridor' is protected. The spread of wheat cultivation into the Mara area has concentrated pastoralists and their herds of cattle into the group ranches adjacent to the National Reserve and diminished the wildlife dispersal area. But the most significant change under way is the trend towards the allocation of individual title in group ranch and trust lands (KWS, 1990: 19).
The continuation of land subdivision is seen by many as a serious threat to Kenya's wildlife and tourism. The Kenyan Wildlife Service is currently considering various land tenure options with the aim of reducing the conflict between wildlife and agriculture. Unfortunately, these plans will remain at the proposal stage until a national land use strategy is developed.

Structural Adjustment in the Wildlife Sector 45
Illegal Poaching and Poor Management of the Wildlife Resource
The growth of wildlife poaching in Kenya throughout the 1980s can be attributed to two main causes. Firstly, the strategy of wildlife management was based on the protection of wildlife through fencing and policing the National Park and Reserve areas. Local communities were actively excluded from the task of managing and sharing the benefits of wildlife. This policy contributed to the growth in poaching by surrounding communities. Secondly, the low priority that the government attached to the wildlife sector contributed to the demoralisation of staff and the growth in corruption within the WCMD. The involvement of government officers in poaching is now officially recognised as one of the primary threats to wildlife throughout the 1980s:
In the late 1970s corruption increased in the wildlife sector, because of the high values of ivory and rhino horn and the difficulty of accounting for Park gate revenues. Poaching for ivory became big business. A few senior wildlife officers took an active part in poaching and also the embezzlement of funds. Rangers were often required to carry out illegal activities for their superiors, in addition to misdemeanours of their own. Honest officers attempting to resist corruption risked victimisation. This contributed to the rapid growth of poaching, which became practically uncontrolled by the end of 1988. In the 15 years of its existence, the WCMD presided over the reduction of Kenya's elephant population by some 85%, and its rhino population by 97% (KWS, 1990: 3).
In 1987, armed personnel were posted to the Parks to challenge the poachers, but the strategy proved ineffective and poaching continued to escalate. In 1989, as noted above, the government demonstrated its commitment to addressing the poaching problem by staging a public burning of ivory tusks in Nairobi National Park. In the same year, the Convention on International Trade in Endangered Species (CITES) voted to upgrade the elephant from Appendix II to Appendix I, thus banning all international commercial trade in ivory. By 1990, the price of ivory paid to poachers in Kenya had fallen dramatically. Combined with the hew management reforms in the wildlife sector, this contributed to the reduction in elephant deaths from an all-time annual high of 5,000 between 1973 and 1989 to 17 in 1991.

46 Structural Adjustment and Environment Linkages in Kenya
Public Expenditure and Investment in Infrastructure
Chapter 2 showed that cut-backs in the real recurrent budget of the Ministry of Wildlife and Tourism had fallen largely on operating expenses and real salaries and wages. This reduced the effectiveness of staff in post and contributed to their demoralisation and the growth of corruption in the wildlife sector. Real development expenditure in the Ministry also showed a steady decline throughout most of the 1980s.
Efforts to reduce public expenditure, coupled with the mismanagement of funds, resulted in a serious decline in the infrastructure and facilities supporting the National Park and Reserve areas. For example, the maintenance of roads, vehicles, plant and equipment all but ceased until recently. Poor access and badly maintained internal roads have concentrated tourists in a relatively small area18 within a few easily accessible wildlife areas (Amboseli, Masai Mara, Nairobi National Park). The deterioration in infrastructure, combined with an expansion in tourism, has led to growing dissatisfaction amongst visitors to the Park and has degraded habitats and disrupted wildlife behavioural patterns. The main visitor complaints revolve around poor roads, reductions in numbers of key species, inadequate electricity and water supplies, environmental damage from lodges (especially pollution and unsightliness), fear about personal safety, and concern about poaching and government corruption. The 'wilderness experience' is also diminished by congestion and overcrowding and is disruptive to breeding cycles and hunting patterns. Off-road driving has also contributed to extensive damage to pasture lands in some Park and Reserve areas.
Under the Protected Areas and Wildlife Services Project steps are being taken to reverse the infrastructural deterioration and to restore tourist satisfaction and improve personal security. Revenue leakages have also been substantially reduced since the establishment of the KWS.
Lack of Community Support and Involvement in 'Wildlife Management and Conservation
Wildlife is indisputably a very valuable natural resource in Kenya. Efforts to realise this value in money terms have largely centred around tourism-
18. In most National Park and Reserve areas, 90% of the tourists use only 10% of the park area.

Structural Adjustment in the Wildlife Sector 47
related activities, which have mainly benefited the urban-based tourism industry and the Treasury in the form of National Park fees. However, as already noted many of the wildlife-related costs are borne by surrounding rural communities in terms of crop and livestock loss, threats to personal security, and in some cases, resettlement in marginal areas. This has resulted in an inequitable distribution of the costs and benefits of wildlife between urban and rural areas, and between the central government and local communities. It has also made rural communities antagonistic towards wildlife and inevitably has exacerbated land use conflicts and poaching, particularly in the Reserve areas.
Until the recent reforms, wildlife management in Kenya revolved around establishing National Parks and Reserves to protect wildlife and fauna and flora from human encroachment. The main purpose was 'to conserve, as far as possible, a representative sample of fauna and flora for educational purposes . . . and for aesthetic and recreational enjoyment by Kenyans and overseas visitors' (IUCN/UNEP, 1986: 249). Neighbouring communities were excluded both from the task of wildlife management and from the financial returns.
The shortcomings of this approach have now been recognised. The Kenyan Wildlife Service is currently in the process of introducing a new management strategy based on community participation in wildlife management. This involves community education and wildlife extension services, revenue-sharing schemes and new initiatives to appropriate value from wildlife from activities such as game farming and the expansion of tourism on private land. The government is also reviewing National Park pricing with a view to introducing differential fees to improve the use of the National Park and Reserve areas and to distinguish between national and foreign visitors.
Impact of Recent Economic and Institutional Reforms
It is important to note that the wildlife sector in Kenya has not been directly targeted for IMF and World Bank-supported structural adjustment reforms. However, structural adjustment policies have had important indirect implications for the country's wildlife, in particular through exchange rate movements and changes in public expenditure.
In the 1980s, the international community became more and more concerned about the deterioration of wildlife numbers and habitats, which was increasingly linked with the corruption and incapacity of the WCMD. Donor organisations started demanding major reforms in the

48 Structural Adjustment and Environment Linkages in Kenya
wildlife sector. The World Bank targeted the sector, recognising its importance in generating foreign exchange and the urgent need for institutional reform. The Bank pushed for major institutional reorganisation and outlined the wildlife management sector as one of the main areas for public sector reforms. This led to the establishment of the Protected Areas and Wildlife Service Project which attracted World Bank and donor funding in excess of US$140m, representing more than 80% of the anticipated costs of the KWS up to 1996. The funding is conditional on major reforms in wildlife management, National Park pricing, revenue raising and distribution, and education and training programmes. Strictly speaking, this support was not included in the SAL or SECAL programme but for the purposes of this study is regarded as 'SAL/SECAL-type' support, because of its conditional nature and emphasis on the generation of foreign exchange and the need for institutional and pricing reforms.
The following discussion traces the linkages between wildlife management and economic and institutional reforms affecting the sector since 1980. Over the period 1980-89, the main impacts of structural adjustment had been indirect, largely via exchange rate adjustments and cut-backs in public expenditure. The wildlife sector became increasingly unable to cope with expanding numbers of tourists, as the supporting infrastructure deteriorated and the staff became more and more ineffective, demoralised and corrupt. With the establishment of the Protected Areas and Wildlife Services Project in 1989 and the replacement of the WCMD with the KWS in January 1990, the picture changed dramatically. Efforts were focused on management reorganisation and strengthening, retraining and public education, National Park pricing reforms, income-generating and community participation schemes, and investments in supporting infrastructure. The key reforms are discussed in more detail under the following sub-headings: management and institutional reforms, financial management, and community participation programmes.
Management and Institutional Reforms
Throughout most of the 1980s, the management of wildlife in Kenya was the responsibility of the Wildlife Conservation and Management Department within the Ministry of Tourism and Wildlife. Over this period, it became increasingly apparent that the WCMD did not have the capacity or sufficient incentive to manage wildlife in Kenya effectively.

Structural Adjustment in the Wildlife Sector 49
The following points list some of the common criticisms levied at the WCMD:
lack of administrative, financial and legal autonomyinactivity due to shortages of operating funds and poor staff moraleinvolvement in corruption and organised poachingoverstaffing and imbalance between personnel and O&M expenditureslack of transparency and accountabilityinadequate management and planning capabilityantagonism of local communities and lack of community participationschemes
Many of these failings can be linked to the pattern of public expenditure cut-backs over the structural adjustment period. Unfortunately, efforts to achieve budget savings were not linked to an overall plan to improve the efficiency of the sector. Instead, they were made in areas of least resistance' that resulted in shortages of funds for O&M, reductions in investment and maintenance of infrastructure, and cut-backs in real wages. Demands for management reorganisation and institutional reforms led to the creation of a new institutional system with legal authority and autonomy to take over the management of the National Parks and Reserves. This included the replacement of WCMD with a new parastatal body called the Kenya Wildlife Service which came into operation in January 1990.
Two important elements of the KWS management strategy distinguish it from its predecessor. Firstly, wildlife management is now seen as an integral part of national life, not something that goes on in isolation and in conflict with local interests. Secondly, the KWS is to operate as a commercial entity. A new emphasis on tight financial management and flexible revenue-raising methods will set it apart from its bureaucratic antecedent. The KWS will also approach the international community to support in particular those activities which serve wider global objectives.
The KWS has considerable autonomy in day-to-day management, award of contracts, and hiring staff. This autonomy distinguishes it from the WCMD which was merely a department in the Ministry of Tourism and Wildlife. The KWS also enjoys a certain amount of financial autonomy and can raise funds and negotiate with donors independently. In addition, it can retain any revenues it generates and operates as a commercial enterprise. Before the reforms, revenues from National Parks and Reserves were returned to the Treasury and department budgets were determined centrally. Under this structure, the WCMD had no financial autonomy and little incentive to collect or return revenues to the

50 Structural Adjustment and Environment Linkages in Kenya
central government. The devolution of financial responsibility to the KWS has reduced corruption, and revenue collection has improved dramatically since the reforms.
During the 1980s the WCMD had paid little attention to the proper deployment, training or career development of its staff, or to medium or long-term planning in the wildlife sector as a whole. There had been little capacity to support wildlife development activities and the overall emphasis had been on the development of tourism with little concern for its environmental and conservation impacts. Since 1990, the KWS has had the main responsibility for managing the sector and organisational reforms have focused on the devolution of management responsibility to the regional level, strengthening management capability and restoring staff morale, and improving medium and long-term planning. Under the Protected Areas and Wildlife Project US$29m has been set aside for management strengthening and training.
Devolution of management responsibilityA new organisational structure is being developed within the KWS, based on a small well-qualified headquarters team and the devolution of responsibility to eight regional offices. The headquarters office will be responsible for the overall development of national policy and the regional co-ordination of wildlife and development activities.
Strengthening management capacityEfforts to strengthen management capability and restore staff morale have involved improvements in pay, working conditions, staff housing, career opportunities and staff training. The disbursement of funds under the sectoral agreement between the government and the World Bank is also dependent on the approval of personnel for key management positions within the KWS and an overall review of the staffing situation in the sector with the aim of proper deployment and removal of surplus staff.
Although these measures may have improved the efficiency of the sector, they also have much wider economic, social and maybe environmental consequences which need to be taken into account. For example, some of the staff removed from the KWS have been redeployed in other sectors. In these cases, the efficiency gains of the KWS must be counterbalanced by the added financial burden on the recipient sectors. In other cases, the streamlining will contribute to further urban unemployment in the short term and maybe urban-rural migration in the long term.

Structural Adjustment in the Wildlife Sector 51
Improving medium and long-term planningThe reforms in the planning process mean the participation of KWS staff and affected communities, and involve a three-tier planning strategy (system, management and annual plans) that looks 20-25 years into the future. Under the Protected Areas and Wildlife Services Project US$3m has been set aside to finance the establishment and operation of a Wildlife Policy and Planning Unit to implement the three-tiered planning strategy.
Financial Management Reforms: Balancing Revenues and Expenditures
The weak financial base of the WCMD is now regarded as one of the primary causes of the poor performance of the wildlife sector in the 1980s. As a government department, it was unable to retain the revenues collected from the National Parks and Reserves, nor was it able to raise its own funds from commercial or donor sources. During this period, the wildlife sector was wholly dependent on budget allocations via the Treasury and consequently became vulnerable to the low priority accorded to the sector by the central authorities. Earlier analysis in Chapter 2 showed that, in response to pressure to constrain government expenditures, real allocations to the sector declined in the 1980s. This trend, combined with government efforts to retain public sector staff (at the expense of O&M and investment funds), meant that the budgetary allocations to the WCMD soon became inadequate to carry out the tasks of the department. Consequently, poor management standards, inactivity, corruption and deterioration of facilities and equipment set in.
Under the financial reform process these weaknesses are now being addressed with the overall objective of making the KWS financially secure and independent of central government funding by 1996.
KWS is giving the highest priority to rectifying the financial weakness it inherited from WCMD, which itself was one of the main reasons for the decline in wildlife management in Kenya. A principal task for the next one to two years is to achieve the transition from the financial orientation, procedures and attitudes of an administrative department of government to those of a largely autonomous parastatal organisation based on sound commercial management (KWS, 1990: 144).
Box 1 summarises the key elements in the KWS strategy to achieve financial independence by 1996, involving efforts to restructure

52 Structural Adjustment and Environment Linkages in Kenya
Box 1: Summary of Kenya Wildlife Service's financial strategy
To increase revenues from tourism by revising the Park entrance fee system and exploiting new sources of revenue.
To establish new revenue sources from individuals, private foundations and businesses which are independent of the tourist industry.
To strengthen financial control and put in place management and budgetary systems which ensure cost-effectiveness and accountability in KWS operations.
To implement a financial system which specifies targets for individual Parks and provides Park wardens and their staff with incentives to improve and sustain management levels.
To restructure expenditure with a view to re-balancing staff costs.
Source: KWS (1990): 144-5.
expenditure and expand and diversify revenue sources. It is important to note that the reforms planned over the period 1991-6 involve steady increases in recurrent expenditures and significant increases in the capital investment programme (spread over the five-year period, but peaking in the early years). Nonetheless, it is also important to note that, over the period, the central government's financial commitment to the wildlife sector diminishes owing to a substantial increase in projected revenues from the sector. Figure 13 projects a surplus of Ksh4.3m of revenues over recurrent costs by 1996. The success of the strategy ultimately depends on the ability of the KWS to increase revenues by expanding and diversifying its revenue source and improving collection systems.
Projecting capital and recurrent costsEfforts to reduce government expenditure in the wildlife sector over the adjustment period have led to serious deterioration in the infrastructure of the Parks and Reserves. This has had detrimental consequences both for tourism and for the natural resource habitats of the wildlife areas.
Over the 1980s as tourism numbers increased, the supporting infrastructure, particularly access and internal roads, deteriorated. Failure to maintain and invest in the infrastructure of the Parks and Reserves has resulted in environmentally destructive tourism over much of the adjustment period and has threatened the long-term economic viability of the tourism sector. For example, as already noted above, poor infrastructure has impeded tourism and contributed to environmental degradation owing to overcrowding and congestion, surface degradation owing to off-road driving, unbalanced tourism development, reduced security and increased poaching in the less accessible areas.

Structural Adjustment in the Wildlife Sector 53
Figure 13: Kenya Wildlife Service's projected recurrent costs/revenues, 1991-6(1990 prices)
700
91/92
Source: KWS (1990).
92/93 93/94 Year
94/95 95/96
Fertiliser Purchased seeds
This trend can largely be attributed to efforts to reduce government expenditure in the wildlife sector over the adjustment period. The long- term economic and ecological consequences have now been recognised and funds have been made available under the Protected Areas and Wildlife Services Project to support the development of the Park and Reserve infrastructure.
The reform process recognises the need for substantial investments in both human and physical capital. Comprehensive training programmes are planned for both management and technical staff within the KWS. Investments in physical capital are needed to replace equipment and rehabilitate the infrastructure supporting the Parks and Reserves in order to accommodate future expansions in tourist numbers. The main bulk of the expenditure is planned in the following areas: Park and Reserve Management, Technical and Maintenance Services, and Community Wildlife Services.
Figure 13 shows that recurrent expenditures are expected to increase substantially over the five-year period. Under the new programme, salaries (per staff member), staff allowances, and O&M expenditures are

54 Structural Adjustment and Environment Linkages in Kenya
expected to rise as a result of efforts to improve staff performance and restore the balance between personnel and operating expenditures. Some of these increases will be offset by overall reductions in staff numbers.
Prospects for revenue generationThe new revenue generation strategy is based on expansion and diversification of revenue sources and improvements in the collection system. Some key steps have already been taken towards these objectives, including the establishment of an improved collection system designed to involve the centralised sale of Park entrance tickets, substantial increases in Park entrance fees, and the establishment of international Trusts to mobilise private resources for use in Kenya's conservation programmes.
During the 1980s, revenues from wildlife tourism via Park entry fees were seriously eroded owing to high rates of domestic inflation, depreciation of the Kenyan shilling against other currencies, and loss through corruption. This trend has benefited visitors to Kenya's Parks and Reserves and has allowed windfall profits to tour operators. But, at the same time, it has reduced wildlife revenues accruing to the government and must at least partially explain the low priority that the government attached to the sector over the adjustment period. The entrance fees to wildlife Park and Reserve areas have recently increased.
Further pricing reforms are in the pipeline with a four-fold purpose. Firstly, to increase revenues by substantially increasing Park entry fees and to introduce differential pricing to extract the full consumer surplus. There are also proposals to link Park fees to the US dollar. Secondly, to ensure that changes in the fee structure are equitable; for example, by introducing differential pricing to distinguish between resident and international visitors. Thirdly, to improve collection rates by more extensive use of individual season tickets and central ticket sales by the KWS in an effort to reduce losses at Park gates. Finally, to introduce differential pricing to improve the utilisation of the Park and Reserve areas and to minimise the environmental impact. Differential fees can be used to reduce environmental damage related to congestion and overcrowding in popular Parks, and could also be related to wildlife diversity and the populations of key species. There is some evidence from recent tourist surveys that Park visitors would be willing to pay higher entrance fees for a greater chance of seeing certain species and as a personal contribution towards sustainable wildlife management in Kenya. The KWS is also expanding its range of tourism activities to encourage pursuits with low environmental impact, such as guided walks and horse and camel safaris. Once again, differential pricing can

Structural Adjustment in the Wildlife Sector 55
be used to encourage such activities.
Community Participation Programmes
Wildlife protection within the Parks and Reserves will not be sufficient to ensure sustainable development of the wildlife sector in Kenya as a whole. Although approximately 8% of the total land area has been set aside as National Parks and Reserves, the wildlife within these protected areas regularly move out into the surrounding dispersal areas according to the season and migration patterns. It is this characteristic of the wildlife resource that has caused crop and property damage to surrounding communities. Compensation arrangements have proved inadequate and ineffective and were therefore abolished in January 1990. This has contributed to the antagonism of surrounding communities, which has been further exacerbated by their virtual exclusion from sharing in the monetary benefits of wildlife.
Throughout the 1980s land conflicts between wildlife and agriculture escalated and poaching for subsistence consumption was on the increase. The promotion of agriculture under the SAP may have contributed towards this trend, but population pressure, resettlement policy and the failure to develop a national land use plan were also key factors. The new wildlife sector reforms emphasise the importance of developing the wildlife resource not only for the economic benefit of the nation, but also for the benefit of the people living in wildlife areas. Consequently, the Community Wildlife Service has been set up as a separate department within the KWS with the aim of developing mechanisms to involve local communities in both the benefits and the management of wildlife outside the protected areas. The Protected Areas and Wildlife Services Project has set aside US$16.1m in support of the Community Wildlife Programme.
So far, the Community Wildlife Service has focused its activities on revenue-sharing schemes, granting usufructuary rights to landowners and promoting wildlife-based income generation. For example, the KWS aims to contribute 25% of the revenues earned from Wildlife Parks and Reserves to the adjacent communities. In 1992/3 the following revenues were distributed to the communities of Amboseli (Ksh3,752,000), Tsavo/Chyulu (Ksh2,010,00), Simba Hills (Ksh603,000), Aberdare (Ksh335,000), Mount Kenya (Ksh335,000), Marsabit (Ksh335,000), Nasolot/South Turkana (Ksh268,000), Kirmon (Ksh268,000), Nakuru (Ksh268,000), Mombasa Mp (Ksh335,000), Malindi/Watamu (Ksh268,000), Kisite/Mpunguti (Ksh268,000) and Diani Chale (Kshl34,000).

56 Structural Adjustment and Environment Linkages in Kenya
The KWS is also engaged in several pilot projects, allocating usufructuary rights to wildlife in the Athi-Kapiti plains, and cropping quotas have been assigned to several livestock ranches. In Machakos District, farmers have organised a wildlife Management Project together with the KWS, which involves issuing usufructuary rights to the community in the form of wildlife licences. Planned activities include a community cropping project and the commercial production of game meat and skins. In other areas, the KWS is promoting wildlife conservation through the expansion of tourism into new areas of private land. If properly managed, these initiatives offer considerable potential to increase the land given over to wildlife and to reduce land conflicts and poaching. However, there is a danger of over-exploitation of wildlife, particularly in open group ranch and Trust Lands. Consequently, the KWS is adopting a cautious step-by-step approach to these new activities, starting with a limited number of pilot projects subject to careful monitoring and evaluation. In areas where land use conflicts persist, the KWS is protecting the combined interests of local communities and wildlife through an extensive fencing scheme.19
Indirect Impact of Structural Adjustment and Other Sectoral Reforms
The above discussion highlights the impact of the recent reforms, largely under the Protected Areas and Wildlife Project. However, the wildlife sector does not exist in isolation from the rest of the economy, and consequently has been affected by structural adjustment reforms in other sectors, such as agriculture and industry. Adjustments to the exchange rate under the stabilisation programme have also impacted on the sector via tourism numbers and increased prices of factor inputs. A brief discussion of some of the main impacts of these policies is provided below.
Exchange rateAs an integral part of efforts to correct macroeconomic imbalances, the government followed a flexible exchange rate policy and has allowed significant nominal and real depreciations, particularly since 1989. The decline in the real exchange rate throughout most of the 1980s has had two important impacts on the wildlife sector. Firstly, it has promoted
19. The fencing scheme is largely funded by the European Union under the Protected Areas and Wildlife Services Project.

Structural Adjustment in the Wildlife Sector 57
tourism, as international visitors now find it cheaper to visit the country. Secondly, it has increased the price of imported factor inputs (equipment, machinery, vehicles, fuel) to the sector.
The environmental impacts of these changes have been mixed, but overall appear to be negative. On the one hand, increased tourism has increased wildlife revenues, but their real value to the government has been eroded owing to domestic inflation and corruption at the Park gates. Consequently, the government attached a low priority to the wildlife sector and failed to make the necessary investments in the supporting infrastructure to cope with expanding tourist numbers. This resulted in growing visitor dissatisfaction and deterioration in the natural capital of the Parks and Reserve areas. These effects were compounded by the escalation in the price of necessary inputs into wildlife management in Kenya, such as fuel and vehicles.
Agricultural promotion and land use policyOne of the major land use changes detrimental to wildlife and tourism is the extension of agriculture into wildlife dispersal areas. The promotion of agriculture under structural adjustment and the trend towards allocation of individual group ranch and Trust Lands will intensify land use conflicts in particular areas. For example, the spread of wheat cultivation into the Mara area has concentrated pastoralists and their herds of cattle into the group ranches adjacent to the National Reserve and diminished the wildlife dispersal area. Many land use conflicts will be alleviated under the KWS strategy which focuses on community management of wildlife. However, the viability of wildlife as a legitimate use of land is still threatened by the existing framework for allocation, adjudication and registration of land and the absence of an overall land use policy.
The move towards intensification of agriculture under the SAP may help to alleviate agriculture-wildlife conflicts, but this strategy also has indirect impacts on wildlife via increased chemical contamination of land and water bodies. Recent studies show ecological damage to aquatic and bird Life from chemical run-off into Lakes Naivasha and Nakuru (GoK/UNEP, 1992) and an increase in aquatic weed due to fertiliser use around Lake Victoria. Further water studies are being carried out in the Tsavo Region by the East African Wildlife Society to gauge the impact of chemical contamination on wildlife in this area.
Industrial promotionIndustrial promotion under structural adjustment can have an indirect impact on wildlife via issues related to land use and industrial emissions

58 Structural Adjustment and Environment Linkages in Kenya
and waste disposal. For example, the planned Nairobi export processing zone will seriously affect migration routes for wildlife in the Nairobi National Park. Industrial developments also need to take place within the framework of a national land use policy.
Conclusions
Throughout the 1980s Kenya benefited from growth in the tourism sector, partly because of the depreciation of the Kenyan shilling and the expansion of nature tourism worldwide. This growth contributed to supplies of foreign exchange and reaped short-term economic gains for tourist operators and the Treasury, but made little contribution to the long-term sustainable management of wildlife and conservation of the ecological base in the wildlife Parks and Reserves. In fact, the evidence is to the contrary, with increased tourist numbers being linked to habitat destruction and wildlife disturbance. Growing dissatisfaction with the 'Kenyan wilderness experience' and the antagonism of local communities also threatened the long-term economic viability of the sector.
This disturbing trend can be linked directly to the overall adjustment programme throughout this period. Pressure to reduce public expenditure caused real cut-backs in maintenance and investment budgets, with a consequent deterioration in the infrastructure supporting the wildlife areas. In addition, wildlife management standards worsened as recurrent budgets were squeezed, causing a widening imbalance between salary and non-salary expenditure and reductions in the real salaries of public sector employees. This contributed to the explosion in organised poaching and corruption by wildlife officials which further threatened wildlife populations, particularly of key species such as the elephant and rhino. This dismal story gives empirical support to the 'worst-case scenario' linking structural adjustment policies to environmental degradation.
Enthusiasm to earn foreign exchange through export promotion (in this case via international tourism) will exacerbate underlying institutional, infrastructural and management weaknesses in the sector and will tend to erode the natural resource base, unless the sector has the capacity to respond to this increased demand. In the case of wildlife and tourism in Kenya, this required government commitment and donor support for building up the institutional, infrastructural and management capability involving substantial investments in supporting infrastructure; institutional reorganisation and strengthening; and the development of

Structural Adjustment in the Wildlife Sector 59
mechanisms to include surrounding communities in the benefits of wildlife. These supply-side and distributional reforms need initial injections of recurrent and development funds, until the sector becomes financially independent. In the case of Kenya, conditional finance was provided by the international donor community in the form of the 'Protected Areas and Wildlife Services Project' agreed in 1989.
It is still early days in the reform process, but the emerging evidence suggests a substantial improvement in wildlife management both inside and outside the protected areas, a reduction in poaching and corruption, growth in wildlife populations, and improvements in the economic returns and the distribution of the benefits from wildlife. These are impressive achievements, but there are still some reservations and risks attached to the new strategy:
Land use conflicts have been reduced under the KWS strategy, but the sector is still constrained by national policy on land use and the trend towards further land sub-division. There is still an urgent need for an effective land use policy at the national and district level.
Deployment of staff under the reorganisation of the wildlife sector will have long-term social, economic and possibly environmental consequences which need to be addressed.
Community wildlife utilisation projects run the risk of overutilisation of the wildlife resource and its habitat. For example, promoting tourism outside the protected areas and allocating licences for consumptive wildlife may threaten wildlife populations, unless carefully managed. The KWS is adopting a cautious approach to community wildlife utilisation by introducing pilot projects which involve only a limited number of non-threatened species.


4Structural Adjustment and Environmental
Linkages in the Agricultural Sector
This chapter examines how recent structural adjustment policies in the agricultural sector have impacted on the environment via changes in the overall pattern of land use, in the types of crops cultivated and in the methods of agricultural production. There are also many other variables that may better explain changes in the agricultural sector over the structural adjustment period. Of particular importance in the Kenyan context are demographic, climatic and political factors. The discussion of the agricultural reforms and their environmental impact is therefore analysed in the light of these factors.
The Agricultural Sector
Agriculture is central to the Kenyan economy, employing over 70% of the total labour force, contributing about 30% to the gross domestic product and providing nearly all domestic food requirements and raw materials to the industrial sector. Future agricultural development as outlined in Sessional Paper No. 1 (1986) and the Sixth Development Plan 1989-93 has two main objectives: the growth of agricultural incomes and exports, and the achievement of domestic food security. The primary export crops are coffee, tea and horticultural crops, whereas production of maize, wheat, meat and milk largely serves domestic food requirements (Kirori and Gitu, 1991).
The recent production trend for different agricultural crops is shown in Table 7. The importance of the different crops depends very much on the criteria used to rank them, whether in terms of area cultivated, total value of production, or contribution to exports or food security goals, or on the perceptions of the farmer who is cultivating them. The distribution of national farm-gate value differs substantially from the distribution of land use and the priorities of the smallholder farmer. For example, coffee and tea represent about 22% and 12% of the value of production, yet use only 2.9% and 1.6% of the total value of land devoted to agriculture respectively. On the other hand, maize, beans and milk are high priorities for the smallholder in terms of food security and together
61

Tab
le 7
: K
enya
- c
hang
es i
n pr
oduc
tion
und
er
Crop
Mai
zeW
heat
('0
00 k
g)M
illet
Ric
e ('0
00 m
t)
Root
s/le
gum
esPo
tato
esB
eans
Hor
ticul
ture
Tom
atoe
sA
voca
dos
Ban
anas
Citr
usC
abba
ges
Cas
h cr
ops
Cof
fee -
coop
s.C
offe
e -
esta
teTe
a -
peas
ant
('000
kg)
Tea
- es
tate
('0
00 k
g)Su
gar
(mill
ion
mt)
Sim
sim
Cot
ton
('000
bal
e)P
yret
hrum
Tob
acco
Gro
undn
uts
Sunf
low
er
1980
19
81
1,77
3 2,
502
204,
427
234,
555
35
37 578
166
195
31
312
386
4 99
068
72
200
213
64
5335
34
33,9
80
35,8
0355
,913
55
,138
4 4
3 3
27
2416
19
3 4
20
139
7
1982
2,34
022
7,66
1 35 36 735
325 39 3
1,02
9 82 280 54 33
39,8
4656
,087 3 4 24 9 5 11 7
vari
ous
crop
s, 1
980-
91
1983
19
84
2,13
3 1,
422
244,
360
70,2
0032
32
36
34
597
414
333
308
46
694
161,
022
1,17
977
87
203
191
62
6849
29
50,9
64 5
2,70
868
,774
63,
464
3 4
3 3
16
393
37
815
3
4 5
1985
2,43
0
('000
ton
nes
unle
ss o
ther
wis
e
1986
2,89
820
6,55
0 22
1,85
032 35 28
822
5 69 121,
185 92 230 68 46
71,3
3975
,755 3 3 28 3 5 7 6
Sour
ces:
* G
itu (
1992
) an
d G
oK,
Econ
omic
Sur
veys
, b
Frie
dric
h N
aum
ann
31 32 809
341
122 15
1,40
212
430
0 70 3668
,125
75,1
92 4 3 19 6 6 5 9
1987
2,41
619
9,80
0 32 34 809
425
161 17
1,63
511
541
8 84 4476
,933
78,8
75 4 2 17 7 7 5 13
1988
2,76
124
0,30
0 29 34 671
326
173 17
1,61
618
637
3 78 3984
,693
79,3
38 4 3 20 6 8 9 8
1989
2,63
121
6,63
0 62 33 800
359
176 12 190
489 70 34 4 2 17 8 10 23 19
stat
ed)
1990
2,54
416
8,40
1 80 31 810
426
161 14 147
408 4 3 9 6 13 15
1991
2,20
5a18
8,53
2" 70a
36b
771a
424a a a a a a b b b b 4" r a 8a 6a 16
a13
a
Stif
tung
(19
92).
0,
K> tn 0 sT 2 I K
cn 3 § t-i» a
S a. tn s <3 3 3 3 i. t-1 3' B"
1 en S'
(? < &

Structural Adjustment in the Agricultural Sector 63
account for nearly 70% of the total land devoted to agriculture, but contribute only 33% of the farm-gate value. These figures reveal a number of important characteristics of the agricultural sector in Kenya. Firstly, the greatest proportion of agricultural land is devoted to low- value, subsistence activities, whereas high-value cash crops like coffee, tea, tobacco and most vegetables are produced on about one-tenth of this area. Secondly, the main land use trade-off is not between food and export crops, but within the food production sector between maize and milk (ibid.). Thirdly, future agricultural expansion to feed a growing population and to earn foreign exchange must come from increasing the intensity of production, rather than from land extensions.
As the above discussion indicates, smallholder agriculture is the dominant mode of production, in terms of both output and employment and land area cultivated. This trend is likely to continue in the future because of the resettlement policy20 to accommodate the expanding population. In total there are about 2.7 million smallholders, about 80% of them having plots of less than 2 hectares. Most smallholders practise mixed farming combining subsistence activities (primarily maize, milk and meat production) with varying amounts of cash crops, particularly in years of favourable weather. The estate sector is mainly involved in export crops such as coffee and tea, which contribute about 35% and 55% of total production respectively (World Bank, 1990b).
There has been considerable government involvement in the agricultural sector in both marketing and distribution. Marketing of the major food products is carried out by a series of statutory bodies such as the National Cereals and Produce Board (maize and wheat), Kenya Co operative Creameries (milk) and Kenya Meat Commission (meat). These bodies have statutory powers to control prices and the movement of these products throughout the country with the aim of securing an adequate national food supply. Their operations have been far from satisfactory in recent years and consequently they have been the focus of recent reforms under structural adjustment conditionality.
Difficulties have arisen in the operation of these agencies in the past few years and their operations are undergoing careful examination at present. In the case of NCPB limits to storage facilities available, cumbersome payment systems and frequent uncertainties over the stability of the
20. After independence the government undertook a vigorous resettlement programme through the purchase of large farms for the purpose of subdividing them to settle people. These farms were mainly purchased from the European settlers largely in the Central and Rift Valley Provinces (Mbwika, 1991),
64 Structural Adjustment and Environment Linkages in Kenya
realisation price of the product between the beginning of the season and harvest have been disincentives to production. For the two livestock agencies the major problem has been in delays in payments (Akong'a et al, 1987: 128).
The agricultural export sector has been dominated by a number of parastatal agencies, particularly in coffee, tea, pyrethrum and horticultural crops. Exports are marketed through these agencies, which pay an initial sum to the farmer on delivery followed later by a payment of the balance on the basis of the price realised on international markets. These bodies have also been criticised for payment delays and excessive deductions and consequently have been subject to recent reforms under structural adjustment conditionality.
Some of the most pressing economic and environmental issues in the agricultural sector are highlighted below.
First, the combined effects of the food security and land resettlement policies have contributed to land use conflicts with forestry, wildlife and pastoralism in some areas.
Secondly, the overall impact of population growth has been mixed. Population pressure has certainly accelerated the sub-division of land and resettlement into marginal lands of low agricultural potential. But, in some densely populated areas characterised by increasing land scarcity, recent reports indicate that increasing population pressure has prompted improved land management practices and switching to high-value crops (World Bank, 1990c; Tiffen, 1991).
Thirdly, the sector is plagued by periodic droughts, and more recently erratic rainfall patterns can at least partially explain crop switching and generally poor performance of the major permanent crops in the last few years.
Fourthly, state marketing has depressed the sector owing to payment delays and the excessive cost burdens of the parastatal and state marketing bodies. There is also some evidence that state marketing has encouraged the growth of maize under conditions of unsuitable soils and climate (Mosley et al, 1991: 284).
Fifthly, recent ethnic clashes in the main cereal-producing districts of Rift Valley and Western provinces have reduced hectarage and agricultural production in these areas.
Sixthly, world price movements such as the coffee booms in 1976-8 and 1986 and the tea slump in 1988 are exogenous factors that also have an impact on cropping patterns.

Structural Adjustment in the Agricultural Sector 65
Finally, the main environmental issues related to agriculture revolve around land use conflicts, soil fertility, and increased land and water contamination from the use of chemical pesticides and fertilisers.
Recent Economic Reforms in the Agricultural Sector
Chapter 1 noted that reform efforts in the early 1980s were largely focused on macroeconomic stabilisation. Some initial steps towards structural adjustment were also taken, but by 1986 much of the initial progress on this front had failed to be maintained, and in some cases had even been reversed. Renewed macroeconomic imbalances and sluggish growth prompted a move towards a sectoral-specific approach to structural adjustment. Agriculture was one of the main sectors targeted for reform.
Agricultural reforms focused on the dual goal of domestic food security and increased intensification and export promotion. The World Bank (1990b) identified the following four factors constraining agricultural potential:
stagnation in the use of key inputs, especially fertilisers inadequate production incentives falling agricultural investment, both public and private, and inefficiencies in the delivery of essential agricultural services
(extension, research, credit and marketing) because of weaknesses in government and parastatal institutions
Since 1986, the government has implemented the Agriculture Sector Adjustment Operations (ASAO I in 1986, and more recently ASAO II). Reform efforts under these programmes largely focused on fertiliser policy, producer incentives and the rationalisation of public expenditure. The main elements and achievements of ASAO I and II clearly show that the government entered into an extraordinarily large number of commitments relative to the implementation capacity within the sector (World Bank, 1992). The main elements of the programme are discussed below.

66 Structural Adjustment and Environment Linkages in Kenya
Fertiliser Policy
The aim of the programme was to intensify agricultural production by relaxing government controls and promoting the private sector to increase the supply of fertilisers. Although many of the suggested reforms were undertaken, the overall impact on fertiliser use and agricultural production has been very disappointing. Since 1989, fertiliser consumption has actually been falling. The government attributes this to the escalation in the domestic price of imported inputs such as chemical fertilisers, partly due to the large depreciations of the Kenyan shilling in recent years. This indicates an internal inconsistency between the overall stabilisation programme of the IMF and the sectoral reform programme of the World Bank and highlights the importance of policy sequencing. Detailed analysis of the environmental impacts of fertiliser policy via crop-mix patterns and farm management practices is provided below.
Producer Incentives
Both ASAO I and II emphasised a move towards international parity pricing, deregulation of agricultural marketing, and improved producer payment systems. Producer prices for domestically consumed commodities have consistently been increased, but for many commodities (particularly maize and milk) these increases have not kept pace with domestic inflation.
Some improvements in the timeliness of payments to producers have been recorded, particularly for maize, milk and pyrethrum. However, it has proved difficult to sustain these improvements, and for other commodities such as cotton, coffee and tea, there is very little evidence of any improvement at all. A more detailed analysis of the reform programme and its effect on the production, pricing and marketing of different crops is provided in Annex 2.
Public Expenditure Reforms
The level and pattern of public expenditure in agriculture tell the same story as in the other natural resource sectors discussed in Chapters 2 and 3. The expenditure problems that confronted the sector included: inadequate allocations to agriculture, and excessive allocations to inefficient and loss-making parastatals, a large number of projects with
Structural Adjustment in the Agricultural Sector 67
low returns and questionable justification, a worsening imbalance between salary and non-salary operating costs, low or negligible cost recovery in a number of services, and the provision of consumer subsidies for a number of commodities (World Bank, 1990b: 37). The public expenditure reform programme focused on increasing the level of spending in agriculture, improving budgetary processes, containing government departments' personnel costs, progressively phasing out food subsidies, increasing cost recovery for agricultural services, and a phased programme of parastatal reform.
The agricultural reform programme has not achieved the same degree of success in implementation as recent reforms in the wildlife sector. The process has been very slow, subject to frequent policy reversal (particularly in the maize sector), and in many cases has not been implemented at all. Initial efforts to increase allocations to the sector have since been eroded by inflation and absorbed by the additional costs of two new ministries created in 1987 (Supplies and Marketing, and Livestock Development). Public employment in the sector continues to grow and the imbalance between salary and non-salary expenditure is still widening.
The evaluation of ASAO I by the World Bank concluded that:
Good progress was made in: maintaining appropriate producer prices, and taking steps towards market deregulation (especially maize and beef); carrying out the financial and organizational restructuring of two parastatals, NCPB and SONY; and improving cost recovery for animal health services. Disappointing progress occurred in: removing supply constraints in fertilizer availability, and increasing use; improving efficiency of parastatals in the sector; and rationalising the pattern of public expenditures in agriculture. A weakening of Government commitment and capacity to implement reforms has been due to a fragmentation of responsibilities (from two to five sectoral ministries), and to some extent an apparent complacency on the part of the Government due to improved economic performance during the programme period (World Bank, 1990b: 39).
The sequencing of the reform process is crucial in determining sectoral and environmental impacts. In the Kenyan agricultural sector, the ex post sequencing was very different from that planned ex ante. While many pricing reforms have been implemented as planned, parastatal and marketing reforms have been much less successful. This poor sequencing of policies has not only reduced the effectiveness of price reforms but has often led to perverse and unintended consequences in terms of both the
68 Structural Adjustment and Environment Linkages in Kenya
production response and the environmental impact.
Methodological Approach
This study attempts to assess the extent to which structural adjustment has intensified or alleviated environmental problems related to land conflicts, soil fertility, and the chemical pollution of land and water bodies in Kenya. The structural adjustment-environmental linkages are analysed using the methodology developed by Cromwell and Winpenny (1993). The impacts of structural adjustment policies are linked to the environment via the impact on the spatial extent of production (land frontier), changes in the crop mix (switching effect), and changes in production method (production techniques and farm management practices).
Extending the land frontier for agricultural production creates obvious conflicts with other uses, such as wildlife habitats, pasture and forestry. The question is the extent to which the conversion of frontier land for agriculture has been associated with encroachment on wildlife habitats and biodiversity loss, livestock overgrazing in marginal areas, and deforestation. In the absence of an 'open access' land frontier, the response to a change in producer incentives may be to change the types of crops being cultivated, switching from relatively low-value to high- value crops. However, some crops will be more erosive than others and more suited to particular agro-ecological zones. This study investigates the extent to which crop switching has taken place under structural and sectoral adjustment in Kenya, and if this has had any discernible impact on soil fertility.
Crop selection may be influenced by output price, but the production method and farm management practices will be influenced by the cost and availability of inputs such as labour, tools and machinery, fertilisers (organic and chemical), extension services, irrigation water, etc. How has structural adjustment affected the cost and availability of these inputs and has this led to increased intensification of agriculture and reduced pressure on marginal lands? Have there been any undesirable environmental results from increasing intensification such as chemical run-offs and algae growth in surrounding water bodies?
The study now investigates the following: the impact of structural adjustment on land use patterns and its contribution to the emerging conflicts between agriculture, wildlife, pasture and forestry; the impact of recent reforms on crop selection and the environmental implications

Structural Adjustment in the Agricultural Sector 69
of trends in crop switching; and the impact of structural adjustment on production methods, technology and farm management practices, in particular, the environmental implications of changes in the prices and the use of key inputs such as fertiliser, credit and seeds.
Impact of Structural Adjustment on Land Use Patterns
Impact on the Spatial Extent of Production
Undoubtedly, one of the most pressing issues in Kenya today is the scarcity of productive land and the consequent escalation of conflicts over different land uses. Table 8, shows FAO estimates of broad changes in land use over the period 1975-90.
Table 8: Kenya - changes in land use, 1975-90 ('000 ha)
Total land area
Arable crops Permanent crops Permanent pasture Forest/woodland Other land
Source: FAO Yearbook (1991).
1975
56,969
1,768472
38,1002,640
13,989
1980
56,969
1,790480
38,1002,540
14,059
1985
56,969
1,880490
38,1002,440
14,059
1990
56,969
1,930500
38,1002,340
14,099
Given the importance of the agricultural sector in Kenya it is surprising that, according to the table, less than 5% of the total land area is devoted to agricultural crops. The area devoted to crops is largely in the high and medium potential areas, although low potential areas in the arid and semi-arid lands (ASAL) are increasingly being settled for permanent agriculture. According to Kirori and Gitu (1991: 4):
About one half of the land devoted to agriculture (crops and dairy) is used for dairy farming; 23 per cent is employed for the production of maize and beans; and the remaining 31 per cent supports all Kenya's export and industrial crops and the production of foodstuffs including wheat, sorghum, millet, potatoes and other horticultural commodities.

Tab
le 9
: K
enya
-
Hab
itat
Fore
sts
Gra
ssla
nds
Ari
d/se
mi-
arid
Des
erts
Lak
es
Wet
land
sw
amp
and
floo
dpla
in
Man
grov
es
Mar
ine
offs
hore
Cor
al r
eefs
Tota
l
Sour
ce;
GoK
/UN
EP
habi
tat/
ecos
yste
m l
oss
in t
he 1
980s
Tota
l ar
ea (
ha)
2,20
4,67
6
8,16
4,00
0
41,3
48,5
00 -
1,23
1,59
0
1,46
0,30
0
52,9
80
234,
600
50,0
00
54,5
12,0
46(1
992:
55)
.
%af
Ke
nya
3,78
0
14.0
12
70.9
67 -
2.11
4
2.50
6
0.09
1
0.40
3
0.08
6
93.5
56
% a
rea
lost
in 1
0 ye
ars
12 10 15 -
Not
kn
own 1 15 0
Not
kn
own
Biod
iver
sity
func
tion/
role
Con
sum
ptiv
e us
e va
lue
Pro
duct
ive
use
valu
eN
on-c
onsu
mpt
ive
use
valu
e W
ater
shed
fun
ctio
n
Wild
life
Liv
esto
ckA
gric
ultu
re
Wild
life
(tou
rism
/ gam
e)
Liv
esto
ck/a
gric
ultu
re
No
true
des
ert
in K
enya
Wild
life
Fish
erie
sC
lim
ate
mod
ific
atio
n
Wil
dlif
e/fi
sher
ies
Wat
er p
urif
icat
ion
Pole
s, m
asts
, ot
her
woo
d pr
oduc
ts,
fodd
er,
med
icin
es,
tann
ins,
mar
ine
nurs
ery,
aq
uati
c nu
rser
y
Fis
hery
Wild
life
Fish
ing
Shel
ls,
etc.
Econ
omic
val
ue o
f los
t fun
ctio
n
Los
t no
n-co
mm
erci
al u
se
Los
t ti
mbe
r re
venu
e L
ost t
ouri
sm r
even
ue
Incr
ease
d so
il er
osio
n/ir
regu
lar
wat
er s
uppl
y
Wild
life:
Ksh
lOO
/ha
Liv
esto
ck:
Ksh
91-1
26/h
a A
gric
ultu
re:
whe
at 2
to
nn
es/h
a
Sam
e as
abo
ve
Les
s th
an a
bove
Wild
life
cons
erva
tion
and
tou
rism
M
ore
than
90%
of
tota
l fi
sher
ies
Sam
e as
abo
veC
ost
of e
quiv
alen
t te
chno
logy
Not
qua
ntif
ied
in K
enya
O
ppor
tuni
ty c
ost o
f aq
uacu
ltur
e an
d sa
lt
Far
min
g (u
p to
Ksh
2m/h
a/yr
) D
eple
ted
fish
ery
yiel
ds
Pro
fit
of c
urre
nt f
ishe
ry
Tou
rism
rev
enue
Loc
al f
ishe
ries
Val
ue o
f aq
uari
um t
rade
a
3
a, hi
3 Q 3 3
IT"

Structural Adjustment in the Agricultural Sector 71
Box 2: Land use conflicts between livestock and wildlife
Decontrolling the prices of beef and mutton saw the price of these products move rapidly upwards. The high prices have not only encouraged ranchers and traditional cattle keepers to sell animals for slaughter but have also been incentives for them to increase production. While the ranchers have intensified, the traditional herders have used the rangelands extensively to support the increasing number of their livestock. This, of course, has occurred at the expense of wildlife habitats being altered or irreversibly destroyed.
Intensive and extensive production of livestock utilise an increasing proportion of the country's rangelands. Present developments include land enclosures, water development, tick control, and improved stock and marketing systems. Large livestock ranches owned by development corporations, co-operatives, groups or individuals are being developed and more are planned in the future. Such developments have serious effects on wild animal populations, particularly the plains game, and there is an increasingly serious risk that many wild species will be exterminated or at best be confined to National Parks.
The transformation of the rangelands has further increased the competition and conflicts for pasture, water and space between wildlife and livestock. And more often than not, wildlife has had to be displaced in favour of livestock because it does not offer direct benefits to landowners.
Source: Juma et al. (1993).
Table 8 also shows a remarkably stable pattern of land use over the adjustment period, the only significant changes being an increase in crop land by 8.4% and a reduction in forest and woodland by 11.4%. However, other data report recent land conversions of significant ecological importance. Table 9 shows the ecosystem loss in Kenya during the 1980s with notes on its biodiversity and economic importance.
The total increase in hectarage given over to agricultural crops in Table 821 cannot explain the substantial encroachment into forest, grassland and ASAL areas according to the UNEP estimates. These estimates identify agricultural encroachment as one of the main reasons for habitat loss, but other factors such as overstocking of livestock can account for the main losses in ASAL areas.
Boxes 2 to 4 illustrate some of the emerging land conflicts attributable to agricultural expansion. These examples are followed by a more detailed analysis in the following section of actual trends in agricultural
21. The actual figure is likely to be much less than this because of intercropping of some crops, e.g. maize and beans, coffee and horticulture.

72 Structural Adjustment and Environment Linkages in Kenya
Box 3: Land use conflicts between wheat, pastoralism and wildlife
In terms of the macroeconomic options, Kenya needs to re-examine its policies towards promoting crop production, particularly of wheat. Since the 1980s wheat production has been increasing at an average annual rate of 2.8%, while demand has been growing at 60%. In line with internal self-sufficiency objectives, expansion in wheat farming has always been encouraged. By 1986 wheat fanning had taken all the traditional wheatlands. Among the areas identified for further wheat growing was the Narok District, which resulted in a massive influx of people into traditional pasture and rangeland and set in motion one of the greatest ecological imbalances in the country. The environmental implications have been very adverse for the region. The Masai Mara Game Reserve has been seriously affected as the movement of wild animals is increasingly restricted, and as they are killed (legally) by farmers when they threaten to destroy crops or livestock. Thus there is already a trade-off between the objective of food self-sufficiency and that of tourism development. The government needs to examine the options at the micro level, so that the impacts of alternative policies on the external and budget accounts can be evaluated. Such analysis may demonstrate that the increased importance of wheat and the conservation of rangeland are desirable at the broader economic level. Doing this, however, requires the integration of macroeconomic and environmental planning to an extent that is still lacking in Kenya.
Source: GoK/UNEP (1992: 96-7).
land use by crop.
Conclusions
The medium-term agenda for the agricultural sector under structural adjustment rests on the promotion of agricultural output to meet domestic food requirements and to earn foreign exchange via exports. The goal is to achieve increased output via intensification of agriculture, particularly in the smallholder sector and in the high and medium potential areas. In this sense, agricultural policies will have potentially environmentally benign effects to the extent that encroachment into marginal areas is arrested and land use conflicts are reduced.
However, efforts to intensify production in the smallholder sector have not been successful so far. One of the reasons has been the escalating costs of the inputs needed (particularly imported inputs such as fertilisers, pesticides, farm tools and machinery) relative to the increase in the prices for agricultural output. The recent decline in the terms of
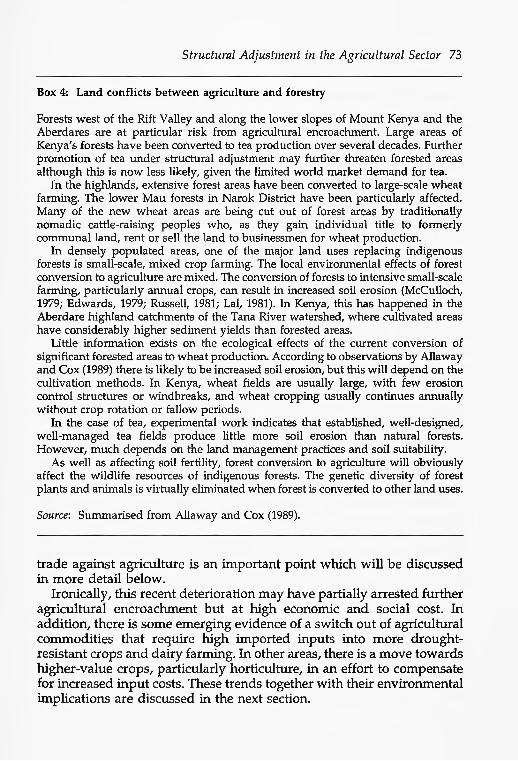
Structural Adjustment in the Agricultural Sector 73
Box 4: Land conflicts between agriculture and forestry
Forests west of the Rift Valley and along the lower slopes of Mount Kenya and the Aberdares are at particular risk from agricultural encroachment. Large areas of Kenya's forests have been converted to tea production over several decades. Further promotion of tea under structural adjustment may further threaten forested areas although this is now less likely, given the limited world market demand for tea.
In the highlands, extensive forest areas have been converted to large-scale wheat farming. The lower Mau forests in Narok District have been particularly affected. Many of the new wheat areas are being cut out of forest areas by traditionally nomadic cattle-raising peoples who, as they gain individual title to formerly communal land, rent or sell the land to businessmen for wheat production.
In densely populated areas, one of the major land uses replacing indigenous forests is small-scale, mixed crop farming. The local environmental effects of forest conversion to agriculture are mixed. The conversion of forests to intensive small-scale farming, particularly annual crops, can result in increased soil erosion (McCulloch, 1979; Edwards, 1979; Russell, 1981; Lal, 1981). In Kenya, this has happened in the Aberdare highland catchments of the Tana River watershed, where cultivated areas have considerably higher sediment yields than forested areas.
Little information exists on the ecological effects of the current conversion of significant forested areas to wheat production. According to observations by Allaway and Cox (1989) there is likely to be increased soil erosion, but this will depend on the cultivation methods. In Kenya, wheat fields are usually large, with few erosion control structures or windbreaks, and wheat cropping usually continues annually without crop rotation or fallow periods.
In the case of tea, experimental work indicates that established, well-designed, well-managed tea fields produce little more soil erosion than natural forests. However, much depends on the land management practices and soil suitability.
As well as affecting soil fertility, forest conversion to agriculture will obviously affect the wildlife resources of indigenous forests. The genetic diversity of forest plants and animals is virtually eliminated when forest is converted to other land uses.
Source: Summarised from Allaway and Cox (1989).
trade against agriculture is an important point which will be discussed in more detail below.
Ironically, this recent deterioration may have partially arrested further agricultural encroachment but at high economic and social cost. In addition, there is some emerging evidence of a switch out of agricultural commodities that require high imported inputs into more drought- resistant crops and dairy farming. In other areas, there is a move towards higher-value crops, particularly horticulture, in an effort to compensate for increased input costs. These trends together with their environmental implications are discussed in the next section.

74 Structural Adjustment and Environment Linkages in Kenya
Impact of Structural Adjustment on Crop Selection
As well as affecting the overall area given over to agricultural production, the recent economic reforms may also affect the choice of crop via changes in producer pricing and marketing incentives and input costs. This section investigates whether there has been any significant change in the types of crops cultivated in Kenya over the adjustment period and assesses the extent to which they can be attributable to changes in producer prices and marketing reforms. The next section identifies any changes in the availability and affordability of key inputs that may also have an impact on crop choice and land husbandry practices in general. Finally, in the event of discernible cropping shifts, can anything be said about the environmental implications of the resulting land use patterns and crop mixes;22 for example, maize and vegetables tend to be nitrogen-depleting crops whereas legumes are nutrient-fixing.
Table 8 and Table 10 indicate that much of the agricultural growth over the 1980s has come from the extension of land under cultivation, particularly of food crops. This trend is likely to continue unless economic and institutional reforms are more successful in intensifying agriculture. However, some notable changes in the types of crops cultivated are beginning to emerge. For example, there is some evidence of switching from low-value subsistence crops to high-value cash crops such as coffee, tea, horticulture and dairying, particularly in more densely populated areas such as Machakos (Tiffen, 1991; World Bank, 1992: 32). The evidence that exists is very patchy and incomplete and it is still too early to draw any broad conclusions on national trends in crop switching in response to the economic reforms. However, some interesting trends are emerging and warrant more detailed study at the district level. The following examples illustrate some specific regional trends in cropping patterns with a potential environmental impact that were observed in this short study.
22. The types of crops being promoted as a result of the economic reforms may be more or less erosive than the crops they are replacing. Certainly, crop selection will have an influence on soil fertility but what is of overall importance is the land and crop management practices under which they are cultivated. This important point is followed up in more depth in the next section.

Structural Adjustment in the Agricultural Sector 75
K
p1c3
13•sis? u^3u l
Ift
2
I•IH<u
1PR) V
geft
1X u
118^c«
!
O rn
S '
rH
O *O CO OO
t-H
O t~Hco cn
oo cnen |rH
O Lpj
rH
l-H
t-H
1t-H
00enrn
00 COenT-H
CO
oocnrH
oo en
**oocnt-H
fOCOenT"~l
00cnrn
t-HCO
O COcnrH
CM ID ON rH rH in
rH
ON ^ — I
Cx CO NO rH CO
O CO rHco LO inrH
S IX 0 CM
S NO rH CO
ca ON ooCON CO
O tx co in o inCM rH rH
rH
o in corH OO ^CM^ rHrH
o o inCM^ t-HrH
8 iHH [% ^I* CO
CM rHrHO CM CO O in rHCM^ rH
rH
O CO OCO ^t* CMrH. rHrH*"
O 00 ONO "# rH CM rHt— 1
NO CM OcO m oCM^ rHrH
CM rH
O MD tX CM -^ COrHrH
^ QJ -^ "S| -2 £ v
00 OrH
O OOrH
in CMMD ON
ON inco inCM
CO ON CM
CO CM CM
tX rHoo o in
VO ON CO VO
MD
tx txCO ONin
in o oo ^ m
oo voOO CM
LO
ON CM IX IX
O CO LO CM
"#
m r-x\O \D
CO CO\o ^o
soS
CM CO so •<* CO
CO SO
CM
E
Tubersflegltr Potatoes
Beans
CO O CO OCM CO
T-H COTHCO
o o 85?
Cx OS
O
T-H SO<?so in
T-H
a aC C
O CMt-H ',
OS t-HT-H
Cx OS
00 OS
Os 00
SO OOo
in tx^
•^ ino
•* COo
*=JI CO
o
to coo
-S 3 o 13 ° "2•H « g
in os co o oo coT-H 1
O SO OCM in
T-H OO CO IX Cx CO
^}l OO t— 1o 1 in^ T-H CMt— i
^P IX t-H
•* to aco C COS
nj tx njC rH C
ra os (TJ
O Cx CMOS T-H
O> tx CMOO t-H
CM SO -sji OO T-H
oo co inSO T-H
^f CM inSO T-I
CO T-H COSO T-H
CM CM COSO T-H
OS O COin T-H
00 OS CO
Bananas Citrus
Macadamia
R3 OOC in
re Os
T-H
1
ra Osc
<fl CM
CM Cx
10 10C C
m inCM
^ txCM
nj in C CM
!fl SOC «M
ssCM so
T— 1
CM CxT-H
•^1 IXT-H
SO OS
co inT-H
CM SO
Onions Cabbages
CO soin CM
o in
£n"*
£8
O COrH
•^ txLO
CC n3c c
in ONrH
CO IXin corH
K tx CO
rH
in tn in corH
^O -HHin corH
CM "#m co
o coin oorH
in CMCO 00
rH rH CO OO rH
CO ON rH tX rH
gfxt-H
8.!i8 ^ 8 u u H
CO IX O CO SO CsJT 1
CO Cx so
CO O ^hCM I
O T* so CO 1 T-H
CO -^ COT tCM O CO CM 1
cc cM tdc cO ^ ^rH OO rH
rH "3< COrH COrH
O CO rH
oo in oO 00 rH
CM \O ON 0 KrH
tx ix CMON rH
rH
CM IX ^DON ^
CM VO tXON \D
CO ON 00 CO N£)
•^t* tx CM CO t"x
O vO CM 00 OO
Sugarcane Simsim Cotton
CM CO CO t-H CO CO
1 1 T-H
Cx SO OT-I in •* 1
so Cx Cxin so 1
so^
1
CO CM CM
7
cc nl tx£n CH
33-
m oo ^
3JQ-
os os in
CM os in m
in so -^ in
SO •* SOin
so ••* inin
so CM t*
^S"11
ON rH CO •r}* CM
Sisal
Pyrethrum Tobacco
CO SO
1
X"?
0 07
77
"* 7
txO
0 txCM T-H
33
CO OST-H CM
CM SO<-" CM
asNO CO rH rH
CO CMrH rH
OO OrH rH
in oorH
00 COrH rH
rH rH
as
C/l
Groundnut Sunflower
c-TOSOST-H
IG
3&<am11I

76 Structural Adjustment and Environment Linkages in Kenya
Maize and milkIn the agricultural sector, the main land use trade-offs have not been between food and export crops, but within the food production sector itself (Gitu and Short, 1990). Throughout the 1980s milk production has been increasing, particularly in the high and medium potential areas in Central and Rift Valley Provinces. But in these areas there is also growing evidence of excessive stocking rates having adverse effects on both milk production and soil erosion. Under structural adjustment, the decontrol of milk prices in 1987 and the escalating costs of agricultural inputs, particularly imported fertilisers, are expected to prompt a further switch from maize to dairy cattle.
Maize and wheathi Rift Valley Province there is some evidence of switching from maize to wheat, although the overall trend is towards expansion of land given over to both crops. One explanation could be increased producer incentives including improved payment procedures,23 owing to the partial liberalisation of the wheat market, whereas the maize market is still highly controlled. However, given the localised nature of the pattern, the switch towards wheat may also be in response to recent erratic rainfall patterns in the region.24
HorticultureOne of the main growth areas in the agricultural sector is the horticultural sub-sector.
The horticulture subsector ranks third behind coffee and tea in agricultural exports. It accounts for approximately 21 per cent and 13 per cent of the total agricultural exports and total domestic exports, respectively. The subsector is also a major source of income for farm families and provides employment to an estimated 1.8 million people as compared to 1.6 million and 1.3 million engaged in coffee and tea production, respectively (World Bank, 1990b: 63).
Most of the recent production increases have come from intensification of land use, application of better husbandry practices and the
23. Improved payment procedures were a dominant form of optimism in the wheat sector noted by the KARI/ODA study (1992).
24. Recent failures in the long rains in the Rift Valley area may have prompted the switch towards wheat which requires a shorter rain period.

Structural Adjustment in the Agricultural Sector 77
introduction of high yielding varieties (Waruingi and Gitu, 1992). Hence, the changes in land given over to horticulture have been relatively small, although there is evidence of switching to this high-value sector particularly in areas around Nairobi including Machakos, Athi River, Naivasha, Nyeri, Meru, Embu, Karatina and Kiambu. Some horticultural crops are also grown further afield (mainly for the domestic market) in Taita Taveta, Eldoret, Kilifi and Kitale.
Although there is some limited evidence of changes in the types of crops being cultivated in Kenya over the adjustment period, the difficulty comes in attributing the cause to macro and sectoral policies affecting agricultural outputs and inputs, or to other key variables such as variations in climate and world price movements. In recent years, agricultural input prices have been rising faster than output prices and this has had an overall depressing effect on the sector. Some of the changes in crop-mix patterns can be attributed to smallholder attempts to switch from low-value to high-value commodities to compensate for increased input costs. For example, the move from maize to dairying and horticulture can be explained at least partially in these terms. Prices reflect both the pricing policy of the government on locally traded commodities and the effects of international economic conditions on internationally traded commodities. Since the introduction of the agricultural adjustment programme in 1986 the government has committed itself to the maintenance of attractive producer incentives, and some attempts have been made to speed up payments to farmers and to reduce the role of the public sector in marketing and distribution. Recent changes in the production and marketing arrangements covering maize, wheat, beans, coffee, tea, sugar, cotton, dairy products, meat and horticulture are given in Annex 2.
Environmental Impacts of Crop Switching
From the above discussion, we saw that the main crop-switching observations were:
a switch from food crops (maize and wheat) towards high-value dairy farming
a switch towards horticultural crops
It is difficult to say to what extent these changes are due to marketing and pricing reforms. But the above switching effects are consistent with

78 Structural Adjustment and Environment Linkages in Kenya
the direction promoted under the reform process. Efforts to liberalise the maize market (although limited) would work towards greater regional specialisation in maize. Particularly in areas where land is scarce, we would expect to see a gradual movement out of food crops towards more highly valued commodities such as dairy products and horticulture. The speed of this movement will ultimately depend on significant improvements in the pricing and marketing of maize. The move towards dairy farming has specifically been encouraged by recent reforms decontrolling the price of milk and improvements in milk marketing, whereas the export of horticultural commodities has benefited from recent exchange rate devaluations.
What is the likely impact of these trends on soil fertility?One of the major environmental problems facing Kenya is soil loss. The DANIDA Report on the Envkonmental Profile in Kenya refers to
. . . alarming rates of soil loss in both the high and medium potential areas as well as semi-arid areas as a result of intensified human activity. . . The loss in areas such as West Pokot, Kajiado, Nakuru, Taita, Kitui, and Embu exceeds 32 tonnes per hectares per year (DANIDA, 1989: 28).
Erosion of cropland is largely associated with annual crops, with perennials during the early years of establishment, and with sloping land which lacks effective conservation measures such as terracing (Mortimore, 1991).
Trends in soil erosion by crop and area are not available in Kenya. However, Table 11 shows the association between crops and soil-related factors according to the perceptions of smallholder farmers as reported in the study by KARI/ODA (1992). The study concludes that 'almost half the problems related to soil are associated with maize . . . This confirms maize's reputation as a "hungry" crop, requiring much manure and/or fertilizer' (KARI/ODA 1992: 110).
According to the agro-ecological classification of soil suitability (Jaetzold and Schmidt, 1982; FAO, 1992), the actual geographical distribution of the main staple crops, maize and beans, now extends well beyond their agro-ecological 'optima'. This trend can be explained by a whole host of factors including population pressure, the dietary preference for maize and beans, and maize pricing and marketing policies that restrict the free movement of maize around the country. The gradual liberalisation of the maize market under structural adjustment is likely to prompt a move towards greater maize specialisation. This

Structural Adjustment in the Agricultural Sector 79
Table 11: Crops most affected by soil-related factors according to smallholders' perceptions (responses %)
Crops
n =
Total Total Fertility Poor Poor Nutrient Poor Poor crops affected decline growth yields deficit soil germination
(soil)
11,430 182 50 46 46 20 s 11 s
s = small (<20) or very small sample (<10)
Source: KARI/ODA (1992).
9 s
MaizeBeansBananaPotatoesSugarcaneGroundnutsCashewSorghumCassavaSweet potatoCowpeasMilletPyrethrumRiceCoffeeWheatTobaccoNapier grassPigeon peasKalesCabbageCitrusOnionMangoCoconutOther fruitOther 2SunflowerAvocadoMiraa
29.315.82.78.50.61.00.23.12.92.53.62.91.10.33.50.70.40.12.03.42.71.00.70.40.30.20.10.10.10.1
48.412.1
4.93.83.32.72.72.22.22.21.61.61.61.61.11.11.11.10.50.50.50.50.50.50.50.50.50.50.50.5
6810
2242020020000000202002000000
4679402002242424202000000020200
2417
7990474704020000000000200000
60 s10 s
5 s0000000005 s5 s0005 s0005 s0000005 s0
64 s9 s0000009 s0000009 s
0000000000009 s
3333
00000000000000
00
1100
11000
11000
ss
s
s
s

80 Structural Adjustment and Environment Linkages in Kenya
study shows anecdotal evidence of such a trend, particularly in land- scarce areas. Greater regional specialisation in maize production may have environmentally benign effects, but will also increase the vulnerability of small farmers unless there is a significant improvement in maize marketing.
The movement towards dairy farming under structural adjustment is likely to have mixed environmental impacts, depending on the underlying production method. If a further move towards high-value dairy farming is to be promoted by pricing and marketing reforms, then it is crucial that the existing over-stocking pattern in some districts25 be addressed. One way to reduce further overgrazing pressures would be a move towards semi-zero and zero grazing systems. This would require raising fodder materials through napier grass and agroforestry. A more integrated farming approach in which food and cash crops are combined with dairy farming has the potential to improve soil fertility through the combined use of organic (dung) and chemical fertilisers and investments in agroforestry to provide livestock fodder as well as conserving soil moisture and providing other household needs such as fuelwood and fruits.
The switch to horticultural crops is also likely to have mixed environmental impacts depending on the underlying technology and farm management practices. Large-scale production of horticultural crops for the export market has been associated with more intensive use of chemical inputs (fertilisers and pesticides), irrigation, water26 and labour. Environmental problems of switching into horticulture relate to high accumulations of chemicals in soils and water bodies (there is growing evidence of water contamination from chemical run-offs in some horticultural intensive areas) and the growing density of pests and disease in horticultural areas.
Damage from runoff has been documented for Lakes Naivasha and Nakuru where, along with domestic sewerage and industrial effluent, it is causing serious ecological damage to the aquatic and bird life.
25. Overstocking is particularly serious in Nyandarua, S. Nyanza, Kericho, Nandi, Trans nzoia and Kakamega Districts (Gitu and Short, 1990: 10).
26. The horticultural sector is characterised by diversity in farm size and input use. There are some large-scale estates of over 100 acres with high investments in irrigation and heavy use of chemical inputs, hired labour and skilled management. There are also many small-scale farmers with little access to inputs and water, who produce rain-fed horticultural crops (Warning! and Gitu, 1992).

Structural Adjustment in the Agricultural Sector 81
Addressing this problem requires the implementation of the Polluter Pays Principle, so that farmers are made to pay for the measures that have to be taken to correct the damage caused. In the face of such changes they will have an incentive to modify their agricultural practices, to reduce the damage. Unfortunately, such measures cannot be adopted until the magnitude of the damage is assessed, and this preliminary step has still to be undertaken (GoK/UNEP, 1992: 95).
However, small-scale horticultural production largely for the domestic market tends to be rain-fed and less chemical intensive. In fact, the small- scale horticultural sector is often associated with environmental improvements, as in some areas it has prompted increased investments in soil and water conservation.
Concluding Comments
Structural adjustment reforms have had some impact on producer price incentives and may explain some of the land switching within the food sector. Expansion of the horticultural and traditional cash crop sector has been more influenced by international prices and will have been assisted by recent exchange rate depreciation and some improvements in marketing including reduced delays in payment.
However, much of the trend in crop switching and constraints on further expansion and intensification can be explained with reference to input availability and affordability, particularly in the smallholder sector. As the price of imported inputs has escalated faster than producer prices, this has had a generally depressing effect on agriculture and has triggered a switch out of crops that require large inputs of imported fertilisers to maintain soil fertility, towards more drought-resistant crops and into dairy farming. In other areas there has been a move towards high-value cash crops to cover increased input costs.
The change in the affordability and availability of key agricultural inputs has been one of the major impacts of structural adjustment on the sector and can at least partially explain emerging switching patterns. As we have seen, the choice of crop may have some influence on soil fertility, but what is of overall importance is the land and crop management practices under which these crops are cultivated. For example, potentially erosive properties can be overcome by appropriate crop management and conservation practices which will be more important in determining the sustainability of the supply response in the long term. In the following section, we explore these issues in more

82 Structural Adjustment and Environment Linkages in Kenya
depth by investigating the extent to which structural adjustment policies have affected the availability and affordability of the necessary inputs into successful crop and soil management practices.
Impact of Structural Adjustment on Production Method
The growth aimed at in the agricultural sector under structural adjustment is to be achieved via intensification in the production of crops and livestock in high and medium potential areas and some area expansion in ASAL areas under 'environmentally sustainable methods of production'. To achieve sustainable increases in yields from a given land area requires a change in the mix of inputs, the production technology and farm management practices. This section examines recent trends in agricultural productivity,27 assesses the success of the intensification strategy and examines the environmental implications of the emerging trends in terms of crop choice and farm management practices in general. Table 12 outlines the trend in agricultural productivity for different crops over the period 1980-92. It shows that efforts to intensify production have had limited success. Although production in the cereal sector has been increasing, this has been achieved by land extension rather than increased intensification. In recent years, production of some of the main cereals has been declining, which is at least partly because of a reduction in the use of chemical inputs.
The shortfall in maize production in recent years is mainly attributed to poor weather as indicated by the reduced precipitation, low usage of fertilizers and other chemicals, reduced hectarage and erratic disruption of agricultural activities by ethnic clashes in the main cereal producing districts of Rift Valley and Western Provinces (GoK, Economic Survey, 1993: 121).
Table 12 shows that the horticultural sector has achieved the most significant increases in productivity, whereas the more traditional cash crops like coffee, tea, sugar, cotton and tobacco show more erratic trends, with the greatest productivity gains being achieved in the tea sector.
It is interesting to compare these official data with the smallholders'
27. Agricultural productivity is derived from Ministry of Agriculture estimates. It is important to note that the data are not obtained by physical measurement but are an eyeball estimation by local agricultural extension staff. The data are not factual but estimates, and therefore should be used with caution (Gitu, 1992).

Tab
le 1
2:
Tre
nds
in a
gric
ultu
ral
prod
ucti
vity
for
sel
ecte
d
Crop
Cere
als
Mai
ze (
t/ha
)W
heat
(kg
/acr
e)So
rghu
m (
t/ha)
Mill
et (
t/ha
)Ri
ce (
t/ha)
Cas
sava
(t/
ha)
Roof
s/kgt
imes
Pota
to (
t/ha
)B
ean
(t/h
a)
Hor
ticul
ture
Tom
ato
(t/h
a)A
voca
do (
t/ha
)B
anan
a (t
/ha)
Cit
rus
(t/h
a)C
abba
ge (
t/ha
)
Cas
/i cr
ops
Cof
fee
- co
-op,
(t/
ha)
Cof
fee
- es
tate
sT
ea -
sm
allh
olde
r (1
00/k
g/ha
)Te
a -
esta
tes
(100
/kg/
ha)
Sug
ar (
t/ha
)Si
msi
m (
t/ha
)C
otto
n ('0
00 b
ales
/ha)
Sisa
l (t
/ha)
Pyr
ethr
um (
t/ha
)To
bacc
o (t
/ha)
Gro
undn
ut (
t/ha
)S
unfl
ower
(t/
ha)
Sour
ce:
Gitu
(19
92)
and
GoK
,
1980
1.60
0.10
0.76
0.67
10.3
36.
6718
.00
7.56
12.5
0
0.76
1.06
6.70
21.6
310
0.00
0.50
0.62
0.96
0.76
1.00
0.87
0.50
Econ
omic
1981
2.10
0.11
0.78
9.32
0.57
7.75
10.0
016
.78
7.20
14.2
0
0.54
1.02
6.79
21.0
873
.00
0.43
0.65
0.87
0.76
1.00
0.87
0.50
Surv
eys
1982
1.90
0.10 0.67
4.54
11.6
70.
79
9.75
10.0
016
.60
6.83
14.7
4
0.51
0.98
7.28
21.2
663
.00
0.44
0.63
1.09
0.75
1.25
0.61
0.54
(var
ious
1983 1.80
0.10
0.67
4.80
9.48
0.71
11.5
08.
0016
.22
7.00
11.2
4
0.54
1.37
9.27
25.8
964
.00
0.50
0.63
0.89
0.75
1.40
1.00
0.50
issu
es);
crop
s
1984
1.30
0.03
0.67
4.56
6.37
0.66
13.8
022
.86
18.4
27.
2512
.78
0.56
0.81
9.33
23.6
268
.00
0.43
0.63
0.91
0.75
1.33
0.17
0.50
1985
2.00
0.09
0.70
0.50
4.81
10.0
0
5.76
0.53
11.5
015
.00
17.4
37.
0813
.04
0.58 1.18
12.6
327
.73
66.0
00.
430.
630.
820.
501.
250.
390.
50
1986
19
87
2.40
2.
000.
09
0.08
0.80
0.
600.
58
0.73
4.32
4.
458.
60
8.50
10.2
4 9.
190.
72
0.81
13.5
6 20
.13
8.33
8.
9517
.10
18.3
77.
75
6.76
16.0
8 14
.92
0.58
0.
710.
94
1.55
12.0
5 13
.52
27.0
0 27
.65
68.0
0 72
.00
0.50
0.
400.
62
0.43
0.81
0.
760.
67
0.78
1.20
1.
400.
31
0.33
0.50
0.
59
b F
ried
rich
Nau
man
n St
iftu
ng
1988
2.20
0.10
0.73
4.68
7.89
0.59
24.7
18.
9517
.96
10.9
418
.11
0.67
1.05
14.6
827
.65
84.0
00.
750.
350.
860.
401.
330.
750.
31(1
992)
.
1989
2.20
0.09
0.73
4.46
9.20
0.60
19.5
610
.91
10.0
016
.32
0.59
0.90
92.0
00.
500.
540.
840.
501.
671.
280.
66
1990
2.00
0.07
0.74
4.17
9.42
0.64
6.10
11.6
7
8.65
92.0
00.
750.
440.
930.
641.
000.
720.
68
1991
»0.
08
b0.
80
b0.
72
a4.
69
b8.
50
b
8.86
'
0.85
a » a a " a b b b
88.0
0 b
0.50
a
0.45
a a
0.86
a
0.80
"
0.76
"

84 Structural Adjustment and Environment Linkages in Kenya
Box 5: Perceived yield changes and causes
Perceived yield trend Perceived causes for yield trends
Firmly positivePyrethrum Increased price due to an upsurge in demand for natural
pesticide; improved payment procedures Tea Improved payment procedures; use of inputs; soil
problemsTobacco Improved payment procedures; soil problems and diseases Wheat Improved payment procedures; other causes; use of inputs Sugar Improved payment procedures; other causes; favourable
price movements
Marginally positivePotato Positive impact of inputs is offset by negative impact of Banana diseases (especially potato, tomato, citrus) and pests Cassava (tomato, citrus) Citrus
Marginally negative Negative causal factors are rainfall (coconut, sorghum, millet); soil problems (roots, tubers); pests; unavailable inputs; payment problems (especially cotton); labour; poor prices; diseases
Source: KARI/ODA (1992: 43-4).
perceptions of yield changes over the last 10 years. Box 5 shows the perceived yield trends and the perceived causes for these trends for selected crops in the smallholder sector according to a recent farming systems survey (KARI/ODA, 1992).
Overall, poor rainfall, pests and diseases and input problems have dominated perceived causes of negative productivity trends, whereas positive trends have largely been attributed to improved payment procedures and favourable price movements. As we would expect, price changes have had the greatest impact on cash and export crops, whereas increased (real) producer prices of the main food crops such as maize are not cited as a causal factor in explaining yield trends. Maize is the main staple crop in Kenya, and is grown primarily for domestic consumption in the smallholder sector. However, structural adjustment policies have impacted on maize production but via changes in inputs rather than in producer price and marketing incentives. We therefore need to consider how the structural adjustment reforms have affected agricultural inputs

Structural Adjustment in the Agricultural Sector 85
and examine how this has impacted on crop choice, productivity and overall land husbandry.
Input Prices and Marketing Reforms
Box 5 gave some insights into the linkages between input use and yield trends. It showed rainfall as the variable perceived as being most responsible for changes in yield trends. Rainfall patterns have caused sufficient concern for smallholder farmers to alter some of their cropping patterns. Those having access to inputs (manure, chemical fertilisers, bought seeds, pesticides) are generally more optimistic about crop yields than those who find such inputs unaffordable, unavailable or unacceptable (KARI/ODA, 1992).
This optimism about increasing yields via increased input use is reflected in the Agricultural Sector Adjustment Operations I and II. One of the primary objectives of these reforms was to intensify agricultural production to meet growth, food and foreign exchange targets through the use of improved inputs. Specific objectives were set for fertiliser, improved seeds, livestock services, tractor hire services and agricultural credit.
Ironically, one of the major impacts of the structural adjustment reforms has been the escalating costs of agricultural inputs relative to output prices. Figure 14 shows the overall declining trend in the terms of trade for agriculture which has deteriorated most dramatically since 1990, largely due to depreciation of the Kenyan shilling. The escalating cost of many agricultural inputs has not only affected overall output levels in the sector, but may have affected crop choice and the mix of agricultural inputs. Figures 15 and 16 show the price and quantum indices for three of the key agricultural inputs (fertiliser, purchased seeds and fuel) over the adjustment period.
Real prices show a significant upward trend for all three inputs, but what is particularly noteworthy is the substantial but short-lived increase in fertiliser use immediately following the agricultural sector reforms in 1986. The most recent estimates of fertiliser use have now dropped off to below 1982 levels. On the basis of these figures, there is very little evidence of a long-term shift towards more intensive use of key agricultural inputs. In fact, the quantum index of key agricultural inputs in Figure 16 shows little responsiveness to the input price trends in Figure 15. The trends in the pricing and use of specific inputs are now discussed in more detail.

86 Structural Adjustment and Environment Linkages in Kenya
Figure 14: Agricultural terms of trade, 1982-92
240
1982 1983 1984 1985 1986 1987 1988 1989 1990 1991 1992Year
-*- Output price index -*- Input price index -s- Terms of trade
Figure 15: Agricultural input prices, 1982-92 (1982=100)
350
300
250x<D TJC
200 --
150
100
1982 1983 1984 1985 1986 1987 1988 1989 1990 1991 1992Year
Fertiliser Fuel/Power Purchased seeds

Structural Adjustment in the Agricultural Sector 87
Figure 16: Agricultural quantum indices (1982=100)
300
1982 1983 1984 1985 1986 1987 1988 1989 1990 1991 1992Year
Fertiliser Purchased seeds Fuel/Power
FertilisersFertiliser reforms under ASAO I constituted the core of the input policy. The main objectives were to promote the use of fertilisers, improve the co-ordination of fertiliser aid, and improve pricing policies and distribution incentives. The main measures taken and their impact on fertiliser use are summarised below:
An improved pricing formula for domestic marketing based oninternational prices was introduced in 1988. Fertiliser prices were fullydecontrolled in 1990.The number of private importers and distributors of fertilisersincreased (from about 15 in 1985 to 20 in 1989).Small fertiliser packages were introduced to enable more smallholdersto purchase fertiliser.The co-ordination of fertiliser aid was improved.District action plans for fertiliser promotion, soil testing, and trainingwere developed.

88 Structural Adjustment and Environment Linkages in Kenya
Table 13: Fertiliser availability and usage, 1980-90 ('000 tonnes and %)
Stocks Imports Available Stockscarried
forward
Estimated Annual usage %
change
1981198219831984198519861987198819891990
40.240.7
110.997.719.228.3
101.8105.392.4
120.7
129.7206.7129.6120.0184.4345.1230.1225.3213.1195.6
169.8247.4240.5219.7203.6373.4331.9330.3405.5316.3
40.7110.997.719.228.3
101.8104.892.4
120.797.3
129.1136.4142.8198.5175.3271.6227.1237.9284.8219.0
5.74.74.7
-11.754.9
-16.44.8
19.7-23.1
Note: Estimated usage during 1985/86 was greatly affected by the 1984 drought and the subsequent recovery.
Source: Ministry of Agriculture.
Table 13 shows the trend in fertiliser imports, availability and usage over the period 1980-90.
Initially, the response to the reforms was encouraging, with a significant increase in fertiliser usage of 20% in 1988/9. However, the success was short-lived and the more recent trend shows a sharp fall in both the availability and use of fertilisers. The reasons for this decline are not exactly clear. The government reports that poor crop performance in recent years is at least partly due to the reduction in the use of fertilisers and other chemicals as a result of high input prices (GoK, Economic Survey, 1993: 122). The World Bank (1992: 34) stresses that other non- price factors are responsible for the reduced fertiliser usage:
It is important to note that this fall is not the result of price decontrol; rather the perverse effect reflects underlying structural and institutional constraints in the fertiliser sector.
Certainly, the private sector has not moved into the fertiliser sector as fast as was expected and this has had undesirable consequences for the price and availability of imported fertilisers. This effect has been further compounded by exchange rate devaluations and foreign exchange shortages restricting fertiliser imports. To alleviate supply shortages,

Structural Adjustment in the Agricultural Sector 89
fertilisers have since been moved from schedule II to schedule I of the Import Licences Schedules under ASAO II. Donors have also responded by providing fertiliser aid in kind, but in the long term efforts are being made to reduce distortions caused by this 'in-kind' fertiliser aid. It is important to note that the impacts of the decline in fertiliser usage have not been spread evenly over the rural community, and have had some indirect environmental consequences in terms of cropping patterns and land management and chemical build-ups in land and water bodies. These are discussed below.
The FAO (1992) reports that the predominance of estate use of fertiliser (particularly for coffee, tea and sugar) has been facilitated by the recent liberalisation of fertiliser imports. This is because the large estate farmers have been better able to organise and finance fertiliser imports and have consequently benefited from a more efficient and reliable fertiliser procurement system, whereas the expansion of fertiliser use in the smallholder sector has been constrained by their more limited access to public and co-operative institutions promoting the use of fertilisers and credit. The emerging evidence suggests that smallholder maize farmers have been most seriously affected by the rising fertiliser costs which, in some areas, are beginning to trigger changes in cropping patterns such as a switch out of maize into more drought-resistant crops (requiring less chemical inputs), into dairy farming (and combined use of dung and chemical fertilisers), and into higher-value crops such as horticulture (with higher returns that can cover the higher input costs).
The environmental implications of these changes were discussed in the previous section. What is important to note is that, even though the fertiliser policy has had perverse effects, there has not been a uniform response across different groups in the rural sector (i.e. estate farmers, smallholder commercial and subsistence farmers) and consequently the environmental impacts have been mixed. Nonetheless, in some areas there are encouraging signs that greater intensity in land use is being achieved through improved crop management rather than through the use of expensive imported chemical inputs. This point is discussed further in the section on farm management practices.
Tractor hire and livestock servicesBoth of these have traditionally been provided by the public sector at subsidised rates. Under the agricultural reforms the objectives were to phase out subsidies on these services and move towards privatisation. The private sector is beginning to play a role in the provision of tractor hire services, but the World Bank (1992) implementation review indicates slow progress in this area:

90 Structural Adjustment and Environment Linkages in Kenya
The increase in budgetary allocation for THS calls into question GoK's commitment to phasing out the service and low fees reduce incentives for private sector activities.
The phasing out of subsidies on livestock services has increased the service charge for artificial insemination, clinical services and drugs, and dipping charges. In the long term, this is likely to slow down stock upgrading and intensification in the livestock sector. However, from the available evidence it is still too early to detect this linkage.
CreditIncreasing the availability and affordabiliry of credit to smallholders is a key component in the agricultural reform process. The strategy has stressed the need to intensify agriculture via greater use of inputs such as fertilisers, improved seeds and mechanised equipment. However, the ability of the smallholder to make investments in these areas has been constrained by the access to and affordability of institutional credit. Without credit, the small farmer has to balance the returns from seasonal crops with agricultural input needs as well as other household expenses. The increasing costs of agricultural inputs, household items and public services (such as health and education), at least partially due to the economic reform process, make such a balance increasingly difficult. Cash-flow problems are further exacerbated by the seasonal nature of income and expenditure, particularly the lump-sum payment of school fees which detracts from the farmers' ability to pay for chemical inputs, hired labour and bought seeds and to expand entrepreneurial activities (KARI/ODA, 1992: 121). A vicious circle often develops in which financial problems restrict access to marketed inputs, which in turn lead to lower yields and further financial constraints in the following period.
The challenge under the Agricultural Sector Adjustment Operation is to increase the availability of credit to smallholders, while at the same time emphasis is placed on widening the use of market signals in credit allocation.
Thus far, efforts have focused on requiring 17% of commercial bank lending to be allocated to agriculture, and attempts have been made (so far with little success) to restructure the Agricultural Finance Corporation (AFC) and to establish a new Agricultural Development Bank. The combined effect of these reforms has yet to feed through to the smallholder sector. For the smallholder, financial constraints are worsening as prices of inputs, household expenses and the cost of public services continue to escalate under the reform process. The long-term social, economic and environmental consequences are still uncertain, but

Structural Adjustment in the Agricultural Sector 91
the decline in the use of fertiliser inputs will reduce yields and soil quality unless compensating investments are made in improved farm husbandry to sustain long-term soil quality and crop yields.
SeedsThe main objective under the Agricultural Sector Adjustment Operation is to ensure the availability and quality of improved, high-yielding seed varieties. There is little evidence that this objective has been achieved and delays have been experienced in implementing the recommended price reforms. Farmers continue to complain about the quality of seeds and there is still some doubt about the appropriateness of some varieties of high-yielding seeds as indicated in a 1992 farm management survey:
Modern crop varieties (MVs) are seen as one way of protecting crops against diseases and (more recently) insect pests. The initial emphasis on developing high yielding varieties (HYVs) often neglected resistance to diseases/insects, storage needs, cooking qualities and palatability. The high percentage of farmers using bought seeds is tempered by the fact that nearly a quarter of smallholder farmers say they cannot afford to buy seed. The traditional practice of retaining seeds for planting in subsequent growing seasons has led to a mixed inheritance of past HYV and MV seed development in many local seed stocks, and the degeneration of hybrid vigour in second and subsequent generations may underlie some of the problems perceived by farmers (KARI/ODA, 1992: 116).
Farm Management Practices and Appropriate Technology
As noted, the implementation of structural adjustment policies in Kenya has failed to intensify agriculture through increased use of 'improved inputs', and in fact has constrained the use of some key inputs (fertiliser and credit), particularly in the smallholder sector. However, many observers express doubts about whether the promotion of 'improved inputs' represents the most appropriate technology to achieve long-term sustainable development. There is growing evidence that the prolonged use of chemical fertilisers leads to chemical build-up in soil and water bodies and is less likely to improve soil quality in the long term compared with the combined use of organic (e.g. dung) and chemical fertilisers. Similarly, the prolonged use of chemical pesticides and insecticides leads to pest resistance and the eventual need for different and stronger varieties to be developed and introduced. In terms of improved seed inputs, the emphasis has been on increasing yields, but

92 Structural Adjustment and Environment Linkages in Kenya
there is growing evidence that many of these varieties are vulnerable to greater incidence of pests and diseases, thus requiring more intensive pesticide application. Emphasis on capital intensive mechanised inputs such as tractors may not only have undesirable implications for rural employment but some reports suggest that tractor use can reduce long- term soil fertility. In a recent study of farming systems in Mukueni (Tiffen, 1992: 37), the third most quoted reason for not using tractors was that they destroyed soil fertility.
Reservations about the existing intensification strategy are clearly expressed in the KARI/ODA survey:
Most orthodox neo-classical economics describes economic growth in terms of production function equations, in which capital and labour are the main factors; but recent thinking includes technical knowledge as a third factor to help explain long-term economic growth patterns. This technical expertise cannot always be directly transferred: it needs to be appropriate. In biological terms, the unsuccessful transfer of new sorghum varieties from India to Africa in the 1970s was one major result of this rule being broken; and many farmers still have reservations about the complete appropriateness of some of Kenya's main maize and bean varieties. In cultural terms, western capital intensive, labour saving technologies are often inappropriate for developing country situations, such as Kenya's high density population zones, where technologies are required to be land saving, yet balance the need to maintain rural employment with the need to ease seasonal labour shortages and the heavy workloads of some groups, such as smallholders and women (KARI/ODA, 1992: 119).
The high cost of chemical fertiliser and pesticides under the recent reforms has increased the economic returns from more labour-intensive methods to enhance yields, arrest soil erosion and control pests and disease. The emerging evidence suggests that appropriate crop and soil management can enhance yields and value added, at the same time as increasing land use intensification and improving long-term soil fertility. In the long term, investment in improved land husbandry is the crucial ingredient to ensure a more sustainable supply response to economic signals (either from structural adjustment policies or world price movements) and can reduce the vulnerability to climatic variation including drought.
Crop managementThe sustainable management of croplands involves crop management,

Structural Adjustment in the Agricultural Sector 93
soil management, and investments in conservation structures. The choice of crops can have an impact on soil fertility, as has been discussed above. Crop choice, and particularly the implications of switching from food to cash crops, is one of the aspects frequently highlighted in the debate about linkages between structural adjustment and the environment. Although some crops are inherently more nutrient-depleting, what is of equal, if not greater, importance is the way in which crops are cultivated. For example, rotation of different crops can influence soil fertility and run-off, as can multiple cropping systems, in which crops are grown together, in sequence or relay. These systems can have many advantages over monocultures, including increased land use intensity, reduced risk by diversification, improved vegetative cover, and increased efficiency in water and nutrient use.
In many parts of Kenya, cereals and legumes, such as maize and beans and maize and cowpeas, are commonly intercropped. These combinations have the advantages of nitrogen fixation and the establishment of continuous vegetative cover, thus minimising the threat of erosion. However, in other circumstances sole or mono-cropping may be the more appropriate strategy. This point is emphasised by the KARI/ODA study:
Pure stands and intercropping mixtures have often been represented as typifying the extremes of an imported monoculture and an indigenous polyculture: and over the years there has been debate over their comparative merits in the African context. . . . both types of agriculture have advantages under different conditions. Sole cropping is particularly effective when the growing season is under three months. Crop mixtures fare better with longer growing seasons (KARI/ODA, 1992: 27).
Structural adjustment policies may have an impact on crop choice and encourage certain crops in more marginal and less suitable areas, such as the recent spread of tea and coffee outside suitable agro-ecological zones according to the FAO (1992). This will affect not only the sustainability of the supply response but the appropriateness of the cultivation method will also be of great importance. It encompasses decisions on multiple cropping as well as adoption (where appropriate) of the various soil management techniques discussed below.
Soil managementSoil management techniques include all soil modification techniques to enhance sustainable crop production. This includes designation of appropriate land use according to agro-ecological zones and more broadly

94 Structural Adjustment and Environment Linkages in Kenya
encompasses land tenure arrangements.28 It also includes crop residue management,29 contour farming and the use of buffer strips to slow down water run-off. The integration of crop and livestock farming under zero grazing has encouraged the use of grass strips in some areas for the joint purpose of controlling soil and water loss and producing fodder. Conservation tillage encompasses a large number of tillage techniques used to reduce soil and water loss and energy input and to increase timeliness of operation and the effectiveness of weed control (Marimi, 1977; Muchiri and Gichuki, 1982). Cut-off drains and terracing in areas of slope can be employed to control water run-off and minimise soil erosion. The run-off can be used in water harvesting schemes to provide supplemental water in rain-fed agricultural systems.
Many of these crop and soil management techniques have been adopted in Machakos District, with the greatest conservation investment being undertaken in areas given over to high-value crops such as horticulture. This district provides a good case study of an area that has benefited from increasing yields via intensified land use, and at the same time has improved soil fertility. The lessons learnt and the implications for structural adjustment policies are discussed below.
Case Study of Machakos District
A recent study of Machakos District (Tiffen et al, 1994) aims to relate long- term environmental change to population growth, production and technological change, and to identify the policies and institutions which are conducive to sustainable development.
One of the key characteristics of Machakos District is the rapid growth in population, leading to more than a fivefold increase since 1930. Nonetheless, the fears of environmental degradation and resource mining have not been realised; instead, soil erosion has been arrested and land productivity has increased with the adoption of more labour-intensive farming methods and investments in soil and water conservation.
28. Lack of title to land may be responsible for delay in undertaking conservation work. In Machakos District, improved land tenure arrangements are credited with having increased farmers' commitment to conservation and in some areas have improved access to development credit.
29. Crop residues can be left to decompose, or can be burnt, hoed or ploughed in or used as livestock fodder in the dry season.

Structural Adjustment in the Agricultural Sector 95
The degradation problem feared in the 1930s has been reversed. The long history of conservation interventions in the District has created a favourable environment for attaining sustainable agriculture. There has been a long- term political, social, economic and technical commitment to soil and water conservation. The results of this commitment include an impressive increase in both the percentage of farmland terraced in some form, and the total area of terraced land (Gichuki, 1991).
Population pressure and changes in land tenure have been two of the key factors that have prompted endogenous technological change and a move towards more labour-intensive and sustainable farming systems in Machakos District. Government policies, including structural adjustment reforms, have also had an impact. However, linking environmental change in Machakos (and, indeed, in Kenya as a whole) to recent agricultural reforms is not an easy task. This is because a uniform change in economic incentives at the macro level has not prompted a uniform supply and environmental response at the farm household level because of differences in factor endowments (access to land, labour supply, capital and fertiliser inputs) and farm management technologies. For example, shifting cultivation and bush-fallow systems in areas of low population density and land abundance will yield a different supply response to producer incentives from that which would occur in more densely populated areas where land is scarce, privately owned and under permanent agriculture.
The environmental impacts will also differ. Under shifting cultivation, increased production in response to producer incentives is achieved through land clearance, often using a slash-and-burn technique. This may create conflicts with other land uses of environmental significance (e.g. wildlife habitat, forestry) and lead to soil erosion over the long term. As population density increases, the shifting cultivation technology is likely to be replaced with a bush-fallow system. In this case, increased supply could be achieved by shortening the fallow period, but long-term soil fertility30 could suffer unless there was a corresponding increase in inputs (organic fertiliser, conservation investments). In very densely populated areas, where land is privately owned but scarce relative to other inputs, the farm technology will be more labour-intensive with zero grazing livestock systems and land given over to permanent agriculture. In this
30. Cromwell and Winpenny (1993) found anecdotal evidence linking structural adjustment reforms in Malawi to reductions in fallow in the smallholder sector. They concluded that given the existing intensity of cultivation, this was likely to have a negative effect on the overall sustainability of the farming system.

96 Structural Adjustment and Environment Linkages in Kenya
case, the response to increased agricultural prices may involve a change in the cropping system (crop choice, intercropping and sequential cropping) and more extensive use of chemical and mechanised inputs. Consequently, the environmental implications will be different again, but there are likely to be reports of water contamination from increased chemical use.
The above discussion shows the complexity of the relationship between economic policy, farm management practices and environmental impact. The nature of the impact will differ across regions and over time as new technologies are adopted and adapted in response to economic and demographic change. The historical development of farming practices in Machakos reflects changes in entitlements (access to land, labour supply, technical expertise, availability of organic and inorganic fertilisers) and the farmers' perceptions of the factor price relationships. In Machakos, the technologies adopted have been appropriate, given the relative factor endowments, and dynamic in so far as they have responded to changes in endowments and exchange entitlements. They have also been responsive to exogenous innovations when these have complemented the farmers' own needs and initiatives. In addition, the move towards land use intensification through improvements in crop and land management has arrested soil erosion and increased the carrying capacity of the land. It has also enabled the adoption of high- value crops such as coffee, fruit and horticulture and of grade livestock in land scarce areas.
In Machakos District the choice of crop, the method of cultivation and the extent of soil and water conservation investments have been part of a long process of endogenous adaptation to economic and demographic change. Recent structural adjustment efforts to promote further technological change via increased use of improved inputs (including chemical fertilisers and pesticides, improved seeds and mechanised equipment) have met with little success throughout the district,31 and in the smallholder sector in general. This is in part due to poor implementation of the strategy which has perversely resulted in reduced availability and affordability of some key inputs, particularly chemical fertilisers. But ultimately the adoption of a technology based on intensified chemical and mechanised inputs will depend on whether the prevailing conditions of population, land and labour supply, and market
31. Chemical fertilisers are applied to some commercial crops in the District, but their use is constrained by the longer-term nutrient requirements of arable soils which cannot be met by chemical fertilisers alone, and the competition for scarce capital (Mortimore and Wellard, 1991: 34).

Structural Adjustment in the Agricultural Sector 97
access justify it. The following section outlines the historical process of technological change in Machakos, highlighting the implications for crop and soil management and the more recent impacts of structural adjustment reforms on farming methods.
Structural adjustment and the implications for crop and land management in MachakosIn Machakos District, population pressure has increased the scarcity and price of land, which has prompted greater intensification of land use involving labour-intensive technologies and improved crop and soil management. The historical development of technological change in Machakos supports the Boserup hypothesis that population growth is a key stimulant to changes in farming systems that make them capable of supporting larger populations.32 Other factors have also been important, particularly the evolution of secure land tenure and the long-term support for soil and water conservation in the district. Some of the recent economic factors that have influenced crop choice and land husbandry practices are discussed below.
MaizeThe maize marketing arrangements and the policy of food security have had a significant impact on land use intensification and commercialisation. At the household level, the substitutability of food production and cash income is limited by the overriding priority to meet subsistence needs. In addition, the restrictions on maize marketing and regional movement of maize have encouraged an informal market involving illegal trafficking in maize, which considerably increases the costs and risks of marketing, reduces supply in more remote areas, and increases the price to the consumer. These factors explain why many potential maize consumers continue to grow maize themselves rather than relying on the market for their supplies. This has inhibited the regional specialisation in maize as many producers find it more economical to grow maize for their own consumption rather than paying the high retail prices which contain an element of monopoly profit. To some extent this explains the production of maize in areas of unsuitable climate and soil (Mosley et al, 1991).
Full liberalisation of the maize market under structural adjustment
32. Other writers such as Ehrlich and Ehrlich (1990) do not support the optimism of Boserup. They cite Kenya as an example of where rapid population growth is associated with increasing deforestation and soil erosion.

98 Structural Adjustment and Environment Linkages in Kenya
may reduce the land given over to maize in environmentally unsuitable areas. In land-scarce districts like Machakos, a movement out of maize into higher-value crops seems likely.
Depending on relative yields per unit of land, it will make more economic sense for farmers who are short of land for food crops to put more resources into the production of the more highly valued commodities and, if necessary, buy food, if fluctuations in food prices could be reduced by marketing improvements (Tiffen, 1991).
In Machakos District there is already evidence of this trend as farmers are switching into higher-value crops. Whether this movement is environmentally benign or not will depend on the characteristics of the crops replacing maize and the land husbandry methods under which they are cultivated. The Machakos study reports that most of the investments in improved crop management have been in high-value crops such as horticulture. Any potentially erosive properties of these crops have been overcome by appropriate crop management and conservation practices.
CottonFarmers in Machakos have been switching out of cotton since the mid- 1980s. The reasons given include unfavourable price movements, but marketing inefficiencies have also been important as well as a rise in input costs, particularly pesticide sprays and labour. Marketing reforms aimed at reducing payment delays have so far failed to have much effect, and farmers often cite this as a reason for the low priority attached to cotton production in recent years.
CoffeeCoffee production in Machakos and other areas in Kenya has suffered from unfavourable movements in the world price of coffee as well as marketing problems including delays in producer payment. Structural adjustment policies have failed to reverse this trend and in addition have contributed to rising input costs over the adjustment period. The combination of these factors has led to pressure on farmers to move out of coffee production. However, the uprooting of coffee bushes is illegal in Kenya, thus inhibiting the switch to higher-value crops. But some switching of inputs has occurred, as both labour effort and chemical inputs have been redirected to other crops. The environmental implications of this trend are mixed. On the one hand, coffee is a good crop for stabilising soils, but it is also a nutrient-hungry crop which is

Structural Adjustment in the Agricultural Sector 99
vulnerable to pests and diseases. This requires large chemical inputs, with implications for water contamination from run-offs. The reduction in use of chemicals (indirectly attributable to the structural adjustment reforms) is therefore more environmentally benign, but reduced labour inputs have meant a neglect of good husbandry practices in coffee cultivation.
Horticulture and fruitThe expansion of the horticultural and fruit sector is a key element in the export-orientated farming strategy under structural adjustment. In Machakos, there has been a rapid expansion in the horticultural sector. The environmental implications appear favourable as most of the investment in improved crop management has been related to horticultural production. The technology adopted has been appropriate, small-scale and labour-intensive, and many fruit and vegetables are well suited to the microenvironments found in the hill areas of Machakos and in the Northern areas. Machakos has also benefited from close access to the Nairobi market.
LivestockThe recent economic reforms have also had an impact on the livestock sector, but with mixed environmental implications. The recent deregulation of milk prices has enhanced the profitability of the livestock sector, particularly of grade and cross-breed cattle which produce higher quality milk. In the densely populated areas of Machakos this is likely to accelerate the underlying trend towards improved livestock and land management. In areas of lower density and/or communal grazing arrangements, an increased supply response may involve land use extensification and/or increased stocking on common lands, potentially at environmental cost in both cases.
The cost of rearing grade cattle has increased under the reform process. The aim is to phase out subsidies and improve livestock services and inputs. As a consequence, the fees for artificial insemination, dipping and clinical services have been increased. This will discourage the move towards intensive livestock farming as it will raise the costs of keeping grade cattle relative to unimproved animals.
FertilisationThe need to intensify agriculture because of population pressure, as well as the push for export expansion under structural adjustment, has accelerated the transformation of the fertilisation technology in Machakos. There are four main soil improvement options open to the

100 Structural Adjustment and Environment Linkages in Kenya
farmer: inorganic fertilisers, boma manure, alternative organic systems (compost, mulches, green manure), and crop management (crop choice, rotation, intercropping patterns). In Machakos, the extended use of farmyard manure has been the main response to the need to intensify land use under permanent agriculture. It has contributed to improvements in soil fertility and enhanced crop yields.
The use of chemical fertiliser has been limited because of liquidity shortages and capital scarcity, which have not been alleviated with the recent agricultural reforms. If anything, labour-intensive fertilisation methods such as manuring and composting are on the increase as smallholder scarcity of capital has worsened.33 The use of organic manure as part of an integrated farming strategy has proved to be a sustainable system in the long term, achieving both increased yields and improvements in soil fertility. It may not be as high-yielding as the alternative chemical-intensive strategy (at least in the short term), but it is more accessible and affordable to farmers. In addition, it is more environmentally benign.
Soil and water conservation practicesAs well as improved crop management and more integration of livestock and arable farming, there have also been considerable investments in soil and water conservation. These efforts have been carried out most vigorously in areas given over to high-value crops and where tenure rights are secure. The main conservation structures are terraces and cut off drains, and their widespread adoption has been facilitated by food- for-work, tools-for-work, Mwethya group efforts and an increased awareness of the need for soil and water conservation (Gichuki, 1991: 38). Sustainable increases in crop yields34 can be attributed to an increase in productivity per unit of land, and an expansion of cultivated land as a result of improved land and water management.
33. The declining terms of trade for agriculture, the increase in prices of consumer goods and public service fees have all contributed to capital scarcity in the smallholder sector over the structural adjustment period.
34. According to Lindgren (1988), terracing of land increases yields by 400 kg/ha and 77 kg/ha for maize and beans respectively.

Structural Adjustment in the Agricultural Sector 101
Concluding Comments
The experience of structural adjustment reforms in the agricultural sector in Kenya bears out the generalisation that institutional change is much harder to achieve by conditional finance than 'getting prices right' (Mosley et al., 1991). Consequently, the main environmental impacts of the agricultural reforms in Kenya have been via changes in relative input and output prices. Efforts to rationalise the pattern of public expenditures and to improve the efficiency of parastatals have been less successful. This experience provides an interesting contrast with recent reforms in the wildlife sector which has undergone major institutional and public financing reforms.
In addition, the reforms in the agricultural sector have been of a 'stop-go' nature and the sequencing and overall net effect of the policy package have sometimes led to perverse and unintended outcomes: for example, the overall depressing effect on the sector due to deterioration in the agricultural terms of trade, and the reduced availability and affordability of imported inputs. This makes analysis of the impacts of the reform process on the environment difficult. In addition, the agricultural sector in Kenya is far from homogeneous. There are many different agro-ecological and climatic zones, different farm sizes, production technologies, and tenure arrangements. Consequently, a uniform change in economic incentives at the macro level has not prompted a uniform supply and environmental response at the micro level.
Finally, the analysis is confounded by changes in other key variables, such as population growth and migration, tribal conflicts, climatic factors, and world price movements. However, this short study does suggest that some interesting trends are emerging in agricultural land use patterns and environmental impact in response to the agricultural reform programme. These trends warrant more detailed study at the farm household and district level.


5Concluding Themes
This chapter summarises the main lessons learnt from the three sectoral chapters in this study.
General
1. The sequencing of the reform process is crucial in determining sectoral and environmental impacts. In the agricultural sector in Kenya, the ex post sequencing was very different from that planned ex ante. While many pricing reforms have been implemented as planned, parastatal and marketing reforms have been much less successful. This sequencing of policies has not only reduced the effectiveness of the price reforms but has often led to perverse and unintended consequences both in terms of the production response and the environmental impact. Greater emphasis and effort needs to be directed at long-term investments in infrastructure and institutional reform.
2. Macroeconomic and sectoral policies will certainly have an impact on the way environmental resources are managed at the micro level. However, there is no evidence to suggest that this response will be uniform over different groups and over time. For example, in the agricultural sector the response will depend on a whole host of factors including land tenure arrangements, population density, infrastructure, marketing arrangements, farm technology and availability and affordability of inputs. It is not only impossible, but also undesirable, to make broad generalisations about the expected micro-level responses and the consequent environmental impacts. This does not undermine the impact of macroeconomic policies on the environment at the micro level. On the contrary, this study acknowledges the complexity of the problem and recommends that each country carry out its own detailed investigation into the likely responses of different groups to changes in macro-level incentives. This 'second-best' approach should prove more fruitful than applying uniform policy prescriptions derived from broad generalisations that often prove false or are surrounded by so many caveats as to be
103

104 Structural Adjustment and Environment Linkages in Kenya
meaningless.3. It is important to distinguish between the short- and long-run supply
and environmental response. In the short run, the response is more likely to be based on the intensification of existing practices. Over time, affected groups have time to adapt to the new incentive structure provided by macro-level pricing and institutional reforms. This may lead to changes in the methods of production and technology, or to permanent migration and resettlement. Consequently, at any moment in time the perceived environmental response will be different. Again, this makes generalisation not only difficult, but undesirable. In this light, the static cause-and-effect analysis of this study, and the majority of studies on structural adjustment and environment linkages, is inappropriate. There is an urgent need for longer-term studies that can capture the dynamic supply and environmental response to economic and institutional change.
4. Macroeconomic instruments (such as exchange rate and trade policies) were not principally designed to address environmental problems, although because they have such wide ramifications throughout the economy they inevitably do have an environmental impact. There is therefore a need to offset any adverse environmental effects from these macro measures with interventions targeted specifically at the environment and natural resource sectors.
5. The imposition of added 'environmental conditionality' seems inappropriate, given the diverse nature of the environmental response across different groups, different sectors and over time. The poor performance of the majority of developing countries in meeting the existing conditions suggests that added conditionality in the name of the environment would not only be ineffective, but would merely add to the existing complex and often contradictory package of conditions. Imposition of additional conditionality also raises important questions about national sovereignty which still remain controversial and unresolved. Finally, additional environmental conditionalities cannot be contemplated unless additional resources are provided to meet them, and to service the continuous evaluation and disbursement procedures required by the IMF and World Bank. The abandonment in November 1993 of the strictest forms of political conditionality related to aid at least removes one layer of imposition.
6. There is an urgent need to carry out environmental impact assessments prior to the implementation of all development projects and to carry out routine environmental monitoring of the rate of depletion of natural resources and the trend in environmental quality
Concluding Themes 105
due to economic development. This information should feed into project, sectoral and macroeconomic planning and would be the first step in the preparation of environmental satellite accounts.
Public Sector Expenditure and Institutions
Expenditures and Revenues
1. Blanket cut-backs in real public expenditure have not achieved the desired efficiency gains in the public sector in Kenya. In the environment-related sectors studied (tourism and wildlife, forestry, fishing), the exact opposite has occurred. Over the adjustment period, the decline in real expenditures, the deterioration in the ratio of O&M expenditure to total recurrent expenditure, the erosion of civil service salaries, and the increase in corruption and theft have had a detrimental impact on the effectiveness of the public services, including the environment-related sectors.
2. Although development expenditures have tended to keep pace with inflation, there has been a disturbing trend in the relationship between external funding and the government contribution to development projects. Over the adjustment period, there has been a pronounced growth in the dependence on external sources to fund environment-related development projects. Development priorities have been determined more by the availability of finance from donors, rather than in line with the economic, social and environmental viability of projects.
3. Government revenues from environment-related sectors have been eroded by inflation and subject to growing collection problems. In some sectors, there is potential for replacing distortionary taxes elsewhere in the economy by user charges for natural resources and for taking steps to ensure that domestic inflation and depreciation of the Kenyan shilling are systematically incorporated into natural resource user charges.
4. There is a need to move towards financial decentralisation in order to link revenues from environment-related sectors to departmental budgets. Decentralisation of financial responsibility is a first step in improving revenue collection, financial management and sectoral planning at the regional level.

106 Structural Adjustment and Environment Linkages in Kenya
Institutions
5. The experience in Kenya clearly shows that economic policies designed to reduce the fiscal budget and increase efficiency will be ineffective and may cause unintended outcomes in the absence of effective institutional reforms and reorganisation.
6. Over the past decade, the proliferation of public sector institutions has not only contributed to the massive growth of the recurrent budget, but has led to duplication of responsibilities, breakdown in co-ordination, and conflicts between institutions. In the natural resource sector, this has led to fragmentation and overlap of environmental responsibilities and conflicts between national development policies that cannot be resolved within the existing institutional framework. The National Environment Secretariat has responsibilities for co-ordinating the interests of affected ministries but it has no powers of implementation or enforcement.
7. Currently, there is no comprehensive environmental policy or legislation in Kenya. There are many ad hoc pieces of legislation that affect the environment but they are scattered in different sectors and administered by different institutions. There is an urgent need for institutional reform and development of a national environmental policy and land use strategy to address inherent conflicts in national policy and to bring together the various policies and legislation affecting environmental management.
Wildlife and Tourism
1. Wildlife tourism expanded throughout the 1980s, partly because of the depreciation of the Kenyan shilling and the expansion of tourism worldwide. Growth in tourist numbers contributed to foreign exchange and reaped short-term economic gains for tourist operators and the Treasury, but made little contribution to the long-term sustainable management of wildlife in Kenya.
2. The growth in tourism coincided with a serious decline in wildlife populations, owning to a number of factors: organised poaching, loss and degradation of critical wildlife habitats, growing conflicts with other land uses and neighbouring communities, and a deterioration in Park and Reserve infrastructure and management.
3. The wildlife sector was not directly targeted for IMF/World Bank- supported structural adjustment reforms. However, the reforms have

Concluding Themes 107
had important indirect implications for wildlife via exchange rate movements, changes in public expenditure, and competition with other sectors for scarce land.
4. Since 1989, the sector has received substantial direct support from the World Bank and other donors (including the European Union) under the Protected Areas and Wildlife Services Project. Financing under this project is conditional on major reforms in wildlife management, National Park pricing, revenue raising and distribution, education and training. It is therefore regarded as 'SAL/SECAL-type' support for the purposes of this study.
5. During the 1980s, pressure to reduce public expenditure caused real cut-backs in maintenance and investment budgets; consequently the infrastructure supporting wildlife areas deteriorated. In addition, wildlife management standards deteriorated as recurrent budgets were squeezed, causing a widening imbalance between salary and non-salary expenditure and reductions in the real salaries of public sector employees. This contributed to the explosion of organised poaching and corruption within the wildlife department.
6. Many of the problems were linked to the pattern of public expenditure cut-backs. Efforts to achieve budget savings were made in areas of 'least resistance' and in accordance with the government's employment strategy. This pattern did nothing to improve the efficiency of wildlife management. On the contrary, it made the wildlife department increasingly ineffective, de-skilled, and prone to corruption.
7. Enthusiasm to earn foreign exchange through export promotion (via international tourism) exacerbated the underlying institutional, infrastructural and management weaknesses and eroded the natural resource base on which the tourism sector is dependent. This is an example of the worst-case scenario linking structural adjustment to environmental deterioration.
8. Under the Protected Areas and Wildlife Services Project, there has been a substantial increase in real recurrent and development budgets to the sector. This recognises the need to invest in human and physical capital before the sector can be expected to generate revenue and foreign exchange in a sustainable way. The returns on these investments are expected to be realised over the next decade in the form of increased revenues and a diminishing financial commitment of the central government to the wildlife sector.
9. The new wildlife management strategy focuses on community participation and financial self-sufficiency. As a parastatal, the Kenya

108 Structural Adjustment and Environment Linkages in Kenya
Wildlife Service now has administrative, legal and financial autonomy. The devolution of responsibility has improved management and revenue collection and reduced corruption. In addition, the new wildlife sector reforms emphasise the importance of developing the wildlife resource not just for the economic benefit of the nation, but more importantly for the benefit of the people living in wildlife areas. Consequently, the Community Wildlife Service has been set up as a separate department within the KWS, with the aim of developing mechanisms to involve local communities in both the benefits and the management of wildlife outside the protected areas.
10. Many land use conflicts will be alleviated under the KWS strategy which focuses on community management of wildlife. However, the viability of wildlife as a legitimate land use is still threatened by the existing framework for the allocation, adjudication and registration of land in the absence of an overall land use policy.
11. It is still early days in the reform process, but the emerging evidence suggests a substantial improvement in wildlife management both inside and outside the protected areas, a reduction in poaching and corruption, growth in wildlife populations, and improvements in the economic returns and the distribution of the benefits of wildlife.
12. The experience of the wildlife sector shows that the sector has been indirectly affected by the structural adjustment reforms, largely via the exchange rate and public expenditure cut-backs. The exchange rate reforms have increased the demand for wildlife services, but at the same time the capacity of the sector to manage the wildlife resource effectively has been seriously eroded by the pattern of public expenditure cut-backs. The sector has now been targeted for institutional and management reforms, and substantial investments are being made in the physical and human capital of the sector. This will increase the capacity of the sector, and, it is to be hoped, enable a sustainable supply response to the growing demand for wildlife tourism now and in the future.
Agriculture
Implementation of the Reform Programme in Agriculture
1. The structural adjustment reforms were not firmly rooted in domestic policy. This resulted in frequent policy reversals and selected

Concluding Themes 109
implementation of the reform package. Of particular importance was the conflict between the national food security objectives and the push for increased productivity and regional specialisation under the agricultural export promotion strategy.
2. Pricing reforms proved easier to implement than marketing and institutional reforms. Unleashing the forces of the market prior to the necessary institutional reforms has led to unintended and perverse consequences in the agricultural sector. For example, liberalisation of fertiliser imports has not led to increased supply and reduced fertiliser prices, as expected.
3. Efforts to rationalise public expenditure and reform the parastatal sector have had only limited success. Initial efforts to increase allocations to the agricultural sector have been eroded by inflation and absorbed by the creation of two new ministries. Public employment in the sector continues to grow and the imbalance between salary and non-salary expenditure continues to widen. Public servants have become increasingly ineffective and demoralised as their supporting budgets have been cut in real terms.
4. The sequencing of policies under the reform programme reflects the short-term emphasis on balance of payments stabilisation and the relative neglect of reforms targeted at long-term institutional reform.
Land use conflicts5. The absence of a national land use and environmental policy has
contributed to continued conflicts between agriculture and other land uses of environmental and economic importance.
6. Failure to intensify agriculture under structural adjustment has meant that much of the agricultural growth over the last decade has come from land extension, particularly of food crops into wildlife, forested and marginal areas.
7. Reductions in land use conflicts will require greater success in intensifying agriculture, but ultimately efforts to reduce pressure on the limited land resource will require the development of alternative rural income-generating activities such as wildlife utilisation projects and food-processing industries.
Crop selection8. Improvements in agricultural price incentives have been undermined
by institutional, marketing and infrastructure constraints. For example, many potential maize consumers continue to grow maize themselves rather than relying on the market for their supplies. This is largely because of constraints on maize movements that have

110 Structural Adjustment and Environment Linkages in Kenya
inhibited regional specialisation in maize production.9. Some evidence is emerging of changes in the types of crops
cultivated over the adjustment period. It is difficult to attribute these changes solely to the economic reforms, but the switching effects which are consistent with the direction promoted under the reform process include the movement from maize towards high-value dairy farming and horticultural crops, particularly in land-scarce areas.
10. The environmental impact of these changes is mixed. Greater regional specialisation in maize production is likely to be environmentally benign, but will also increase the vulnerability of small farmers unless there is a significant improvement in maize marketing.
11. Movement towards dairy farming is likely to have mixed environmental impacts, depending on the underlying production method adopted. In some districts, the pricing and marketing reforms promoting dairy farming will exacerbate the existing over-stocking pattern. In other areas, increased output in high-value dairy farming has been achieved under semi-zero and zero grazing systems. In these areas, overgrazing pressure is reduced and land is being given over to agroforestry and fodder crops which prompt a more sustainable supply response.
12. The switch to horticultural crops was also found to have mixed environmental impacts, depending on the underlying technology and farm management practices. Large-scale production of horticultural crops for the export market has been associated with more intensive use of chemical inputs, irrigation water and labour. Environmental problems in large-scale horticultural areas relate to high chemical accumulation in soil and water bodies and a growing density of pests and diseases. The growth in the small-scale horticultural sector has been generally rain-fed and less chemical-intensive. In some areas, the move towards high-value horticulture has prompted increased investments in soil and water conservation.
13. Evidence in this study suggests that producer prices have had some influence on crop choice and soil fertility. But of greater environmental importance have been the land and crop management practices under which the crops were cultivated.
Production method and land management practices14. The primary objective of the Agricultural Sector Adjustment
Operations was to intensify agricultural productivity through increased use of improved inputs (particularly fertilisers and improved seeds). These policies had some impact on crop choice,

Concluding Themes 111
productivity and overall land husbandry, although not always in the direction originally expected.
15. Overall, the reform programme has failed to intensify agriculture, and in fact has constrained the use of some of the key inputs such as chemical fertilisers and credit, particularly in the smallholder sector. The deterioration in the agricultural terms of trade and the escalating costs of agricultural inputs under the reform programme have not only depressed overall output levels, but may also have affected crop choice and the mix of agricultural inputs.
16. The high cost of imported fertilisers and pesticides resulting from the recent reforms has increased the economic returns to more labour- intensive methods to enhance yields, arrest soil erosion and control pests and diseases. The increased market price of chemical inputs is also a better reflection of the environmental costs of chemical build ups in soil and water bodies.
17. The declining terms of trade for agriculture and the increase in prices of consumer goods and public service fees have also contributed to capital scarcity and reduced liquidity in the smallholder sector. Consequently, labour-intensive fertilisation methods such as manuring and composting are preferred to the use of chemical inputs.
18. In some areas, sustainable increases in crop yields have been achieved by improved land and water management rather than via the adoption of 'improved inputs'. For example, in Machakos District there has been considerable investment in soil and water conservation, particularly in areas given over to high-value crops where tenure rights are secure. The area has also benefited from considerable research, training and extension, and long-term donor assistance in soil and water conservation.
19. It is impossible to predict the supply and environmental response to changing economic incentives at the macro level, without detailed knowledge of the factor endowments (access to land and tenure arrangements, population density and labour supply, technical knowledge and donor support, capital and fertiliser inputs) and production technologies at the micro level. For example, bush-fallow cultivation in areas of low population density and land abundance will yield a different supply response to producer incentives from that which would occur in more densely populated areas where land is scarce, privately owned and under permanent agriculture.


Annex 1Kenyan National Environmental Action Plan:
Scope and Coverage
Policy, Institutional and Legislative Framework
Developing a national environmental policy for Kenya. Strengthening and improving institutional arrangements for inter-
ministerial and inter-agency co-ordination in environmental matters. Improving environmental legislation to reflect and give legal backing
to policy and institutional recommendations. Integrating population policies into the environmental framework and
vice versa.• Developing environmental information systems to support
environmental decision-making and promote better use and conservation of the environment.
Developing a national land use policy including the treatment of land tenure issues as may be needed.
Developing policy for environmental impact assessment and an institutional framework to be consistent with such policy.
Other Sectoral and Specific Environmental Issues
Agriculture and livestock - prevention of land degradation, maintenance of water supplies, use of agro-chemicals.
Forestry - prevention of deforestation, promotion of sustainable uses, protection of catchments, maintenance of habitat for wildlife.
Wildlife management - improvement in wildlife protection, incentives to landowners to protect wildlife, increase in protection of habitat, development of land use policies consistent with wildlife objectives.
Maintenance of biodiversity - conservation of habitat, sustainable use of genetic resources, conservation of species diversity in unprotected areas.
Tourism - better understanding of economics of tourism to provide stronger justification for protection and conservation measures.
Human settlements and urbanisation - promotion of rural development and employment as alternatives to urban migration.
113

114 Structural Adjustment and Environment Linkages in Kenya
Environmental consequences of industrial development - depletion of scarce natural resources, air and water pollution, transport, storage and disposal of hazardous wastes.
Water resources - conservation of wetlands, marine and coastal resources conservation, allocation of scarce water resources, development of policy on water usage and rights.
Energy - promotion of energy-efficient alternatives to fuelwood and strengthening research and application of renewable sources; mitigation of adverse environmental effects of hydro and thermal power generation facilities.
Environmental education and public awareness of environmental issues.
Development and application of environmental economics.

Annex 2Production and Marketing of Main Crops
in Kenya
Maize
Production and Imports
Since 1990, basic food production, especially of maize, has decreased by at least 7%. Seasonal rainfall has been both erratic and below long-term averages. In addition, the acreage and yield of maize have been adversely affected by serious shortfalls in agricultural inputs, especially fertiliser and seasonal credit. Poor extension services and high pre- and post-harvest losses contributed further to the decline in maize output. For the first time since 1984, Kenya required imports of up to 500,000 metric tonnes of maize in 1992 in order to meet its massive cereals shortfall.
Distribution, Marketing and Pricing
The rule which did not allow more than 88 bags of maize to be transported without a permit issued by the NCPB, posed the following major constraints on the effective distribution of the commodity:
Movement controls were intended to channel maize into the NCPB to enable it to stabilise consumer prices. However, the NCPB has not succeeded in maintaining minimum supplies to low-income consumers during recent times of scarcity.
In fact, movement controls increase maize consumer prices, due to unnecessary marketing costs, especially in deficit areas. In conclusion, movement controls do not benefit the consumer.
The NCPB sets the producer price for maize and will only buy maize if and when the market price falls below the official price. At the same time, it is subsidising the consumer price of domestically produced maize as the consumer price does not reflect the NCPB's actual marketing costs. This pricing strategy contributed to a Ksh3.85 billion loss from 1988/9 to 1991/2. Subsidised consumer prices discourage private traders from
115

216 Structural Adjustment and Environment Linkages in Kenya
participating in the market and are completely out of tune with the government's stated commitment to the Cereal Sector Reform Programme in favour of increased competition and liberalisation.
Wheat
Production and Imports
Since 1990, wheat production has decreased by at least 7%. This decline is attributed to delays in paying producers, increasing input costs, inadequate seasonal credit, poor agricultural extension support and erratic rainfall. To meet domestic production shortfalls, Kenya imports at least 250,000 tonnes annually. Without significant increases in per unit yield, this import requirement will continue to grow.
Distribution, Marketing and Pricing
The NCPB has sole authority for domestic wheat marketing, importing and exporting. In 1989-90, it transferred domestic wheat marketing functions to KGGCU. However, in early 1992 the NCPB again took direct responsibility for domestic wheat marketing, owing to KGGCU's financial problems and the resultant late payments to wheat farmers.
Official wheat prices reflect estimated production costs. However, adding the marketing costs of the NCPB and the KGGCU on to the producer price results in consumer prices well above international prices. During 1990-91 this encouraged a flood of relatively inexpensive imported wheat. Consequently, a variable tariff was introduced for key imported food commodities, including wheat. Government management of domestic and imported wheat distribution has reduced production incentives through late payments and increased distribution costs.
Beans
Production
Production of beans showed a downward fluctuating trend in the 1980s. The main reason for this decline appeared to be a combination of factors related to the vagaries of weather, research, extension and marketing

Annex 2 117
constraints (transport, storage, adequate funds for purchasing the crops by private traders).
Marketing and Pricing
The local bean market was deregulated in 1991. There are no longer controls in domestic pricing or movement of stock. The export trade is still government-controlled. The effect of partial liberalisation of the industry on production and prices cannot be adequately assessed given the short timespan and recent poor weather. However, judging from the trend in retail price levels, there is no indication that production has improved compared with previous years.
Coffee
Production, Export and Marketing
Until the second half of the 1980s, coffee was Kenya's most important cash crop and foreign exchange earner. Between 1963/4 and 1983/4 production tripled to about 129,000 tonnes per annum. This has now changed dramatically. Coffee production has declined to about 80,000 tonnes per annum and as a foreign exchange earner coffee has slipped to third place behind tourism and tea.
After the coffee is picked and processed into parchment by the coffee growers and co-operative societies, most of it is delivered to the country's main miller, the Kenya Planters Co-operative Union (KPCU) which mills, processes, grades and stores it. The Coffee Board of Kenya sells the coffee at its weekly auctions through a pool system. This provides a series of interim payments and one final payment, with the grower receiving an average price for the quality s/he produces.
The decline of the coffee industry is the result of domestic and international market problems:
poor and reduced earnings delays in payment to producers (up to 18 months) poor management of the Coffee Board of Kenya and the KPCU,
leading to excessive costs and a reduced share of the marketed price being paid to producers, particularly smallholders

118 Structural Adjustment and Environment Linkages in Kenya
Sugar
Production
After reaching a peak in 1989, sugar production has declined over the last few years and is projected to fall even further in the near future. The following factors have contributed to the decline in sugar production and cane productivity:
inadequate credit for smallholders poor producer price incentives financial and management problems of sugar companies lack of support services - research and extension
Pricing and Marketing
Prior to October 1989, the Ministry of Commerce was directly involved in policy-making, marketing and distribution of sugar. Since then, the responsibility for marketing and distributing including importation and/or exportation has been assigned to the Kenya National Trading Corporation (KNTC). On paper, the KNTC is responsible for all trade in sugar, but in practice the Ministry of Commerce controls sugar imports through the licensing mechanism. Private firms have been granted import licences for sugar and have been allowed to sell sugar directly to wholesalers/retailers without recourse to KNTC.
Producer prices of cane and sugar are government-controlled and are reviewed annually on the basis of costs plus a fair return.
Cotton
Production and Marketing
The cotton industry in Kenya has been the focus of a high degree of government regulation and intervention aimed at achieving national self- sufficiency. Up to 1984/5 this policy was successful and production levels were at a peak. Production has now declined to pre-1977 levels because of the inefficient, ineffective and extremely costly system of production, marketing and pricing which is dominated by the Cotton Board of Kenya (CBK).

Annex 2 119
Particular problems that beset the cotton industry include low producer prices, imports of new and second-hand clothes, excessive costs of CBK, inefficient financial, credit and distribution arrangements, lack of specialised extension services, increased price of seeds. Recently, there has been a switch to more profitable crops such as horticulture and sugarcane in eastern and western Kenya, respectively.
Dairy Products
Production and Marketing
Total milk production is estimated to have more or less doubled between 1980 and 1990. Historically, the pricing and marketing of milk in Kenya have been subject to government regulation and control. However, the decision by the government in May 1992 to stop controlling the price of dairy produce implies that the only government regulation and control now in place occurs in the marketing process. Most of the marketed milk output is handled by Kenya Co-operative Creameries Ltd (KCC). The lack of competition and the heavy dependence of small-scale producers on the KCC have led to serious problems which appear to be hindering increased dairy output. The marketing system has become increasingly inefficient and inadequate and cannot promote or support increased milk output.
Major constraints on dairy development include poor animal nutrition, due to limited grazing, fodder and livestock feeds; animal breeding and disease problems related to the delivery of veterinary and artificial insemination services; poor marketing infrastructure and payment delays (up to three months); and lack of capital and credit available for investments in dairy development.
Meat
Production and Marketing
Meat production occupies the largest percentage (35.9% in 1986) of the country's agricultural area, compared with maize at 18.1% and milk at 14.9%. Total annual meat production was estimated at 466,000 tonnes in 1990. With the resettlement and subdivision of large farms, the smallholder and pastoral systems in the ASAL areas now dominate the

120 Structural Adjustment and Environment Linkages in Kenya
industry, supplying more than 80% of the meat consumed in the country.Both the Kenyan Meat Commission (KMC) and the Uplands Bacon
Factory (UBF) have prevented or delayed the development of private commercial marketing channels in the past. To a large extent this remains the case today. This has resulted in inefficient and costly services, delayed payments to farmers and unsustainable budgetary costs to the government.
Constraints on the industry include livestock diseases; limited availability and affordability of important inputs including forage, livestock feeds, credit and AI services in intensive farming areas; poor supporting infrastructure including water, dips, markets and access roads; poor range management resulting in degraded rangelands, scarce forage and emaciated stock; and deficiency of livestock research and extension services.
Horticulture
Production and Marketing
The remarkable growth of horticulture in recent years can be attributed to dynamic public sector involvement. Over 90% of total production is currently consumed locally by selected income groups. The export sector, though small, has assumed major importance because of its capacity to earn foreign exchange and its great growth potential.
The bulk of horticultural production is generated by smallholders under rainfed conditions. The larger units are usually equipped with irrigation systems. A wide range of horticultural crops can be grown in various climatic zones and soil types. Yield levels differ according to varieties, crop husbandry practices and other factors such as irrigation.
The main constraints facing the sector are poor supporting infrastructure (roads, water supply), lack of credit for small-scale horticultural development, high input costs (fertilisers, chemicals and machinery), inadequate processing and marketing outlets which are unsuitable for perishable products. The export sector has its own problems because of stringent quality specifications, delivery timing, packaging and transport costs. In particular, air space, high air freight charges because of fuel costs, and lack of refrigeration facilities constrain development of the export sector.
Source: Selected extracts from Friedrich Naumann Stiftung (1992: 2-76).

References
Akong'a, J. T.E. Downing, N.T. Konijn, D.N. Mungai, H.R. Muturi and H.L.Potter (1987) The Effects of Climatic Variations on Agriculture in Central andEastern Kenya. Nairobi: IIASA and United Nations EnvironmentProgramme.
Allaway, J. and P.M.J. Cox (1989) 'Forests and Competing Land Uses',Environmental Management 13(2).
Bevan, D.L., P. Collier and J.W. Gunning (1989) 'Fiscal Response to aTemporary Trade Shock: The Aftermath of the Kenyan Coffee Boom',World Bank Economic Review 3(3).
Bigsten, A. (1993) 'Regulations Versus Price Reforms in Crisis Management:The Case of Kenya' in M. Blomstrom and M. Lundahl (eds) EconomicCrisis in Africa: Perspectives on Policy Responses. London: Routledge.
Bragdon, S.H. (1992) 'Kenya's Legal and Institutional Structure forEnvironmental Protection and Natural Resource Management: AnAnalysis and Agenda for the Future', report for the World Bank,Economic Development Institute, Robert McNamara Fellowship Program.Washington, DC: World Bank.
Cromwell, E. and J. Winpenny (1993) 'Does Economic Reform Harm theEnvironment? A Review of Adjustment in Malawi', Journal of InternationalDevelopment 5(6): 623-49.
DANIDA (1989) Environmental Profile: Kenya. Copenhagen: DanishInternational Development Agency and Ministry of Foreign Affairs.
EIU (various issues) 'Country Report: Kenya, Analysis of Economic andPolitical Trends'. London: Economist Intelligence Unit.
Edwards, K.A. (1979) 'Catchment Sediment Yields at Kimakia', East AfricanAgriculture and Forestry Journal (special issue).
Ehrlich, P. and A. Ehrlich (1990) The Population Explosion. London:Hutchinson.
FAO (1991) Yearbook. Rome: Food and Agriculture Organisation of theUnited Nations.
FAO (1992) Agro-ecological Land Resources Assessment for AgriculturalDevelopment Planning. A Case Study of Kenya: Resources, Database and LandProductivity. Rome: Food and Agriculture Organisation of the UnitedNations, Land and Water Development Division and IIASA.
Friedrich Naumann Stiftung (1992) Blueprint for a New Kenya: Post ElectionAction Programme. Nairobi: Friedrich Naumann Stiftung.
Gichuki, F.N. (1991) Environmental Change and Dryland Management inMachakos District, Kenya 1930-90: Conservation Profile, ODI Working Paper
121

122 Structural Adjustment and Environment Linkages in Kenya
56. London: Overseas Development Institute. Gitu, K.W. (1992) Agriculture Data Compendium. Nairobi: Ministry of
Planning and National Development. Gitu, K.W. and C. Short (1990) Problems and Opportunities for Improving Land
Use Efficiency in the High and Medium Potential Areas: focus on DairyProduction, TP 90-06. Nairobi: Ministry of Planning and NationalDevelopment.
Godfrey, M. (1986) Kenya to 1990: Prospects for Growth, Special Report No.1052. London: Economist Intelligence Unit.
GoK/UNEP (1992) 'The Costs Benefits and Unmet Needs of BiodiversityConservation in Kenya', study prepared by the National Biodiversity Unit(National Museum of Kenya) and Metroeconomic Ltd, UK. Nairobi:Government of Kenya and United Nations Environment Programme.
IMF (1993) IMF Survey. Washington, DC: International Monetary Fund,June.
IMF (1993) International Financial Statistics (IPS) Yearbook 1992-93.Washington, DC: International Monetary Fund.
IUCN/UNEP (1986) Review of the Protected Area System in the AfrotropicalRealm. Gland, Switzerland: International Union for the Conservation ofNature and Natural Resources and United Nations EnvironmentProgramme.
Jaetzold, R. and H. Schmidt (1983) Farm Management Handbook of Kenya:National Conditions and Farm Management Information. Nairobi: Ministry ofAgriculture.
Julin, E. and J. Levin (1992) 'Kenya: Macroeconomic Performance 1990 andSome Issues Related to Structural Adjustment Programmes', Report No.30/92. University of Gothenburg, Department of Economics.
Juma, C., H. Krugman and A. Ayako (1993) The Unsteady State: StructuralAdjustment and Sustainable Development in Kenya. Nairobi: African Centrefor Technology Studies.
Kahn J.R. and J.A. McDonald (1990) Third World Debt and TropicalDeforestation. Binghamton, NY: Department of Economics.
KARI/ODA (1992) Farming Systems Survey Report, KARI and ODA CropProtection Project. London: Overseas Development Administration,Natural Resources Division.
Kenya, Government of (various issues) Development Plans. Nairobi:Government Printer.
Kenya, Government of (various issues) Economic Surveys. Nairobi:Government Printer.
Kenya, Government of (various) Sessional Papers No. 4, 1974, 1975, 1980,1980 and 1982 on Economic Prospects and Policies. Nairobi: GovernmentPrinter.
Kenya, Government of (various issues) Statistical Abstracts. Nairobi:

References 123
Government Printer. Kirori, G.N. and K.W. Gitu (1991) Supply Response in Kenyan Agriculture: A
Disaggregated Approach, TP 91-01. Nairobi: Ministry of Planning andNational Development, Long Range Planning Division.
KWS (Kenya Wildlife Service) (1990) A Policy Framework and DevelopmentProgramme 1991-1996. Nairobi: Government of Kenya.
Lal, R. (1981) 'Deforestation of Tropical Rainforests and HydrologicalProblems' in R. Lal and E.W. Russell (eds) Tropical Agricultural Hydrology.Chichester and New York: John Wiley and Sons.
Lindgren, B.M. (1988) 'Machakos Report 1988: Economic Evaluation of a SoilConservation Project in Machakos District, Kenya'. Nairobi: Ministry ofAgriculture.
MAPLP (1992) 'Kenya Forestry Master Plan: Sustainable Monitorable ActionPlan to Improve Labour Productivity of the Forest Department'. Nairobi:Government of Kenya, Forestry Department.
Marimi, A.P.M. (1977) The Effects of Certain Tillage Methods and CroppingSystems for Conserving Rainfall in a Semi-arid Area of Kenya' in S.B.Westley (ed.) Soil and Water Conservation in Kenya, report of a workshopheld at the University of Nairobi, 21-23 September, IDS Occasional PaperNo. 27. Brighton and Nairobi: Institute for Development Studies at theUniversity of Sussex and University of Nairobi, Faculty of Agriculture.
Mbwika, J.M. (1991) Land Tenure Status and Farm Investments in Kenya, TP91-09. Nairobi: Ministry of Planning, Long Range Planning Division andNational Development.
McCulloch, J.S.G. (1979) 'Introduction', East African Agriculture and ForestryJournal (special issue).
Mortimore, M. (ed.) (1991) Environmental Change and Dryland Management inMachakos District, Kenya, 1939-90: Environmental Profile, ODI WorkingPaper 53. London: Overseas Development Institute.
Mortimore, M. and K. Wellard (1991) Environmental Change and DrylandManagement in Machakos District, Kenya, 1930-90: Profile of TechnologicalChange', ODI Working Paper 57. London: Overseas DevelopmentInstitute.
Mosley, P. (1991) 'Kenya' in Mosley et al. Mosley, P., J. Harrigan and J. Toye (1991) Aid and Power: The World Bank and
Policy-based Lending, Vol. 2, Case Studies. London: Routledge. Muchiri, G. and F.N. Gichuki (1982) 'Conservation Tillage in Semi-arid
Areas', paper presented at National Soil and Water ConservationWorkshop held at the Faculty of Agriculture, University of Nairobi.
Nyeki, D.M. (1992) Wildlife Conservation and Tourism in Kenya. Nairobi:Jacaranda.
Owino, P.S.W. (1995) "The Impact of Structural Adjustment on theProduction and Availability of Pharmaceutical Products in Kenya', Dphil

124 Structural Adjustment and Environment Linkages in Kenya
thesis. Brighton: Institute of Development Studies at the University ofSussex.
Reed, D. (ed.) (1992) Structural Adjustment and the Environment. London:Earthscan in association with the World Wide Fund for Nature.
Russell, E.W. (1981) 'Role of Watershed Management for Arable Land Usein the Tropics' in R. Lal and E.W. Russell (eds) Tropical AgriculturalHydrology. New York: John Wiley and Sons.
Southey C. and B. Nderitu (1993) Contribution of the Natural Resource Sectorsto Government Revenues and Expenditures, Technical Paper 93-07. Nairobi:Ministry of Planning and National Development, Long Range PlanningDivision.
Tiffen M. (1991) Environmental Change and Dryland Management in MachakosDistrict, Kenya: Population Profile, 1930-90, ODI Working Paper 54.London: Overseas Development Institute.
Tiffen, M. (ed.) (1992) Environmental Change and Dryland Management inMachakos District, Kenya: Farming and Income Systems, ODI Working Paper59. London: Overseas Development Institute.
Tiffen M., M. Mortimore and F. Gichuki (1994) More People, Less Erosion:Environmental Recovery in Kenya. Chichester: John Wiley and Sons.
Waruingi, E.M. and K.W. Gitu (1992) Kenya's Horticultural Subsector: OldWine in New Bottles, Working Paper. Nairobi: Ministry of Planning andNational Development.
World Bank (various issues) World Debt Tables. Washington, DC: WorldBank.
World Bank (various issues) World Development Report. Washington, DC:World Bank.
World Bank (1987) Kenya: Industrial Sector Policies for Investment and Growth,Report No. 6711-KE, Vols I and II. Washington, DC: World Bank.
World Bank (1990a) Kenya: Forestry Development Project: Staff AppraisalReport. Washington, DC: World Bank, East Africa Department.
World Bank (1990b) Agricultural Growth Prospects and Strategy Options, Vol.2, Annexes. Washington, DC: World Bank, 8 March.
World Bank (1990c) Kenya: Stabilisation and Adjustment: Toward AcceleratedGrowth, Report No. 9047-KE. Washington, DC: World Bank, East AfricaDepartment.
World Bank (1991) Staff Appraisal Report: Kenya Protected Areas and WildlifeServices Project. Washington, DC: World Bank, Agriculture OperationsDivision, Eastern Africa Department.
World Bank (1992) 'Kenya: Re-Investing in Stabilisation and Growththrough Public Sector Adjustment', Report No. 9998-KE, Vols I and II.Washington, DC: World Bank, 10 January.


ODI Research Studies
Structural Adjustment and Environmental Linkages: A Case Study of KenyaJulie A. Richardson I
In this book the author investigates the environmental implications of structural adjustment reforms in Kenya, with detailed case studies of wildlife and agriculture. She concludes that: S Changes in public expenditures have failed to achieve
desired efficiency gains and reduced the effectiveness of key environmental agencies, with a growing dependence on external resources for environmental projects.
Programme implementation has resulted in conflicts with national objectives, resulting in frequent policy reversals and undermining the management of environmentalresources.An over-emphasis on earning foreign exchange has led to perverse environmental consequences. Responses to macroeconomic measures, and their environmental impacts have differed across resource users and between districts.
£12.95.;" ISBN 085003 2334
di Overseas Development Institute