Embed Size (px)
Citation preview

Evaluating the Performance of Greenhouse Design through Digital SimulationA Case Study of a USDA Research Laboratory at the North Dakota State University

Evaluating the Performance of Greenhouse Design through Digital SimulationA Case Study of a USDA Research Laboratory at the North Dakota State University
An Architectural Research Project Submitted to the Department of Architecture and Landscape Architecture of the North Dakota State University
ACKNOWLEDGMENT:
This project would not have been possible without the gracious support and assistance of Center Director Mike Grusak, Supervisory Engineer Ben Lagasse
and the staff at the Bioscience Research Lab, NDSU. Thank you all!
The following research project was composed throughout the Fall 2017 academic semester.
Document Completed:December 15th 2017
Written By: Alexandra M. Mills

CONTENTSabstractintroduction background study tools
phase 1 introduction findings evaluation
phase 2 introduction findings evaluation
phase 3 introduction design 1 design 2 design 3
conclusionappendix references image sources
0608
08
10
1212
14
18
2020
22
24
2828
30
32
34
3638
38
39

THERMAL PERFORMANCE ASSESSMENT | 76 | PROJECT ABSTRACT
THESIS ABSTRACT
INTERIOR OF THE BRL GREENHOUSE | FIGURE 1
The goal of this architectural research study is to simulate the thermal performance of a
multi-story greenhouse design. To do this, the study must first verify the authenticity of
digital simulation, then apply the solver technology to additional designs. It does this in three
phases:
The first is a quantifiable, measurable field investigation which will lead to conclusions about
the varying temperatures surrounding a greenhouse facility. The study data describes a
distinct difference in temperature between the interior and exterior, demonstrating a clear
control of the internal environment across all weather conditions. The second phase of the
study simulates the greenhouse’s performance in Autodesk CFD using comparable conditions
as found in the first phase. The resulting simulation data has minimal deviation from reality:
92% of the results were within 10°F of the actual recorded data. In the third and final phase
of the study, CFD is used to evaluate the thermal performance of three new designs. This
provides an incredible amount of insight into the impact of design factors such as massing,
HVAC placement and solar orientation. This study attempts to prove that digital simulation
can accurately predict the thermal performance of a design. Based on the success of the
three phases, it can be concluded that CFD has the ability to reflect reality in a consistent
and accurate manner.
ABSTRACT

THERMAL PERFORMANCE ASSESSMENT | 98 | INTRODUCTION
INTRODUCTION
The way people are living is changing. People are increasingly relocating from rural areas to attractive and exciting urban communities. In 2015, The United Nations reported that 54% of the world’s population currently resides in urban areas. That percentage is expected to grow to 66% by 2050 (2014). Consequently, city design for immense population growth can lead to a disconnection from the natural environment because this influx of people leads to a decreased amount of available space in cities (Capaldi 2014). The decrease in green and open areas is a result of the limitation surrounding our current mindset regarding agriculture in the city. By implementing strategies to facilitate agriculture in the urban environment, we can provide a consistent supply of fresh produce while also providing healthy spaces for people to gather and socialize.
This architectural research project is conducted in pursuit of simulating conditions to reflect the reality of a multi-story urban greenhouse design. Its intention is to learn about the construction and behavior of single story greenhouses in order to apply the theories and techniques to a design with multiple stories.
The quantifiable impact of various energy saving techniques is a valid and critical aspect of design, and the study’s investigation and conclusion could lend insight into the subject. Additionally, the study will provide comparative results from the real and simulated environments, further contributing to the validity of computer software in general.
LONDON SKY GARDEN | FIGURE 2

THERMAL PERFORMANCE ASSESSMENT | 1110 | STUDY TOOLS
STUDY TOOLS
Autodesk Design Applications for Digital ModelingAutodesk Revit is a building information modeling (BIM) software application for designers and engineers. It enables users to accurately model and collaborate on designs in both full-scale and actual construction methods. Because of its incredible scope, Revit is increasingly integral in the design field for the accurate digital development of designs in both 2D and 3D. Designers are able to manipulate all aspects of a building’s design and integrate its systems in one comprehensive digital format. Autodesk Revit 2018 will be used in this study to model the existing conditions of a single story greenhouse design. The model will reflect the actual construction of the greenhouse as accurately as can be recovered.
Autodesk Computational Fluid Dynamics (CFD)CFD is a thermal simulation tool that is able to conduct energy analysis based on variables like material, massing and environment. Its sophisticated solver technology runs iterative calculations based on the set values until a stable analysis is completed. By inputting values comparable to the external/internal conditions found in the field investigation, CFD will be able to analyze how the building theoretically will respond to its environment. Autodesk CFD provides many opportunities for architectural design. Its ability to analyze the early stages of development and study the downstream
effects of changes are its most valuable architectural applications. With CFD, designs can be analyzed both internally and externally. CFD can also simulate external factors such as solar and wind loading, natural ventilation and wind flow patterns. Internally, it can evaluate HVAC air flow and thermal comfort of occupants. These results aid in the optimization of design decisions and improve the efficiency of systems and placements. CFD simulations are faster and more affordable than physical testing and its use can help avoid errors by predicting results.
Onset HOBO Data LoggersA HOBO Data Logger is an electronic device that measures and record various parameters at set intervals over a period of time. A HOBO Data Logger is small and mobile, which makes it ideal for recording data. Prior to installation on site, the HOBO Data Logger must be configured to record the appropriate parameters at the desired logging intervals.
Extech FLIR i7 InfraRed Camera AC130A FLIR Camera is a device that uses infrared radiation to form an image reflecting the overall temperature of a subject. It is typically used to detect heat and energy loss, moisture intrusion and structural issues. (1) FLIR InfraRed Camera was used in this investigation to photograph the interior and exterior environment of the greenhouse.
Onset HOBO Data LoggersA HOBO Data Logger is an electronic device that measures and record various parameters, such as temperature or humidity, at set intervals over a period of time. A HOBO Data Logger is small and mobile, which makes it ideal for recording data. Prior to installation on site, the HOBO Data Logger must be configured to record the appropriate parameters at the desired logging intervals.
Extech FLIR i7 InfraRed Camera AC130A FLIR Camera is a device that uses infrared radiation to form an image reflecting the overall temperature of a subject. It is typically used to detect heat and energy loss, moisture intrusion and structural issues. (1) FLIR InfraRed Camera was used in this investigation to photograph the interior and exterior environment of the greenhouse.
HOBO DATA
(6) HOBO Data Loggers were installed at varying elevations and locations at the site (Figure 1). Four HOBO Data Loggers are installed around the interior of the greenhouse, and the remaining two were placed around the immediate exterior of the greenhouse.
FLIR i7 InfraRed Camera
During the installation of the HOBO Data Loggers, the building’s temperatures were thermo-graphically captured and recorded as part of the investigation. These temperatures are used for reference to identify conditions in the simulations.
LOGGER
FLIR CAMERA | FIGURE 4
HOBO LOGGER | FIGURE 3

THERMAL PERFORMANCE ASSESSMENT | 1312 | PHASE 1
PHASE 1 FIELD INVESTIGATION
EXTERIOR OF THE BRL GREENHOUSE | FIGURE 5
The study contains three phases. The first begins with a case study examining the effectiveness of an existing single story greenhouse design. By inventorying a built design in a quantifiable, measurable investigation, the actual effectiveness of its performance can be evaluated and conclusions can be drawn based on its results. The second phase of the study is to simulate the building performance in CFD based on comparable conditions. The results of the inventory and simulation are compared to determine the accuracy of the CFD software. Once the software is validated or discredited, the findings will inform design decisions for an urban multi-story greenhouse. In the final phase, CFD will simulate the building performance of multistory greenhouse designs. This report contributes to a larger research project regarding the feasibility of agriculture in the urban environment.
In the first phase of the study, the existing conditions of a single story greenhouse in Fargo, North Dakota were
examined. The investigated greenhouse is located within a federal research facility maintained by the Red River Valley Agricultural Research Service in conjunction with the United States Department of Agriculture (USDA). The facility, the Biosciences Research Laboratory (BRL), maintains six greenhouses with nine controlled spaces for experiments. This phase investigates the BRL’s greenhouse ranges #3 and #4, which are combined within a single greenhouse design.
Over the course of seven days, several environmental factors of the single story greenhouse were measured and recorded: temperature, humidity, light intensity and air velocity. The investigation occurred 09/19/2017 - 09/26/2017 with measurements recorded every fifteen minutes. This particular greenhouse (ranges #3 and #4) was selected because of its ability to test the impact of several energy saving techniques including form, material and spatial layout.
THE STUDY
THERMAL PERFORMANCE ASSESSMENT | 1514 | PHASE 1
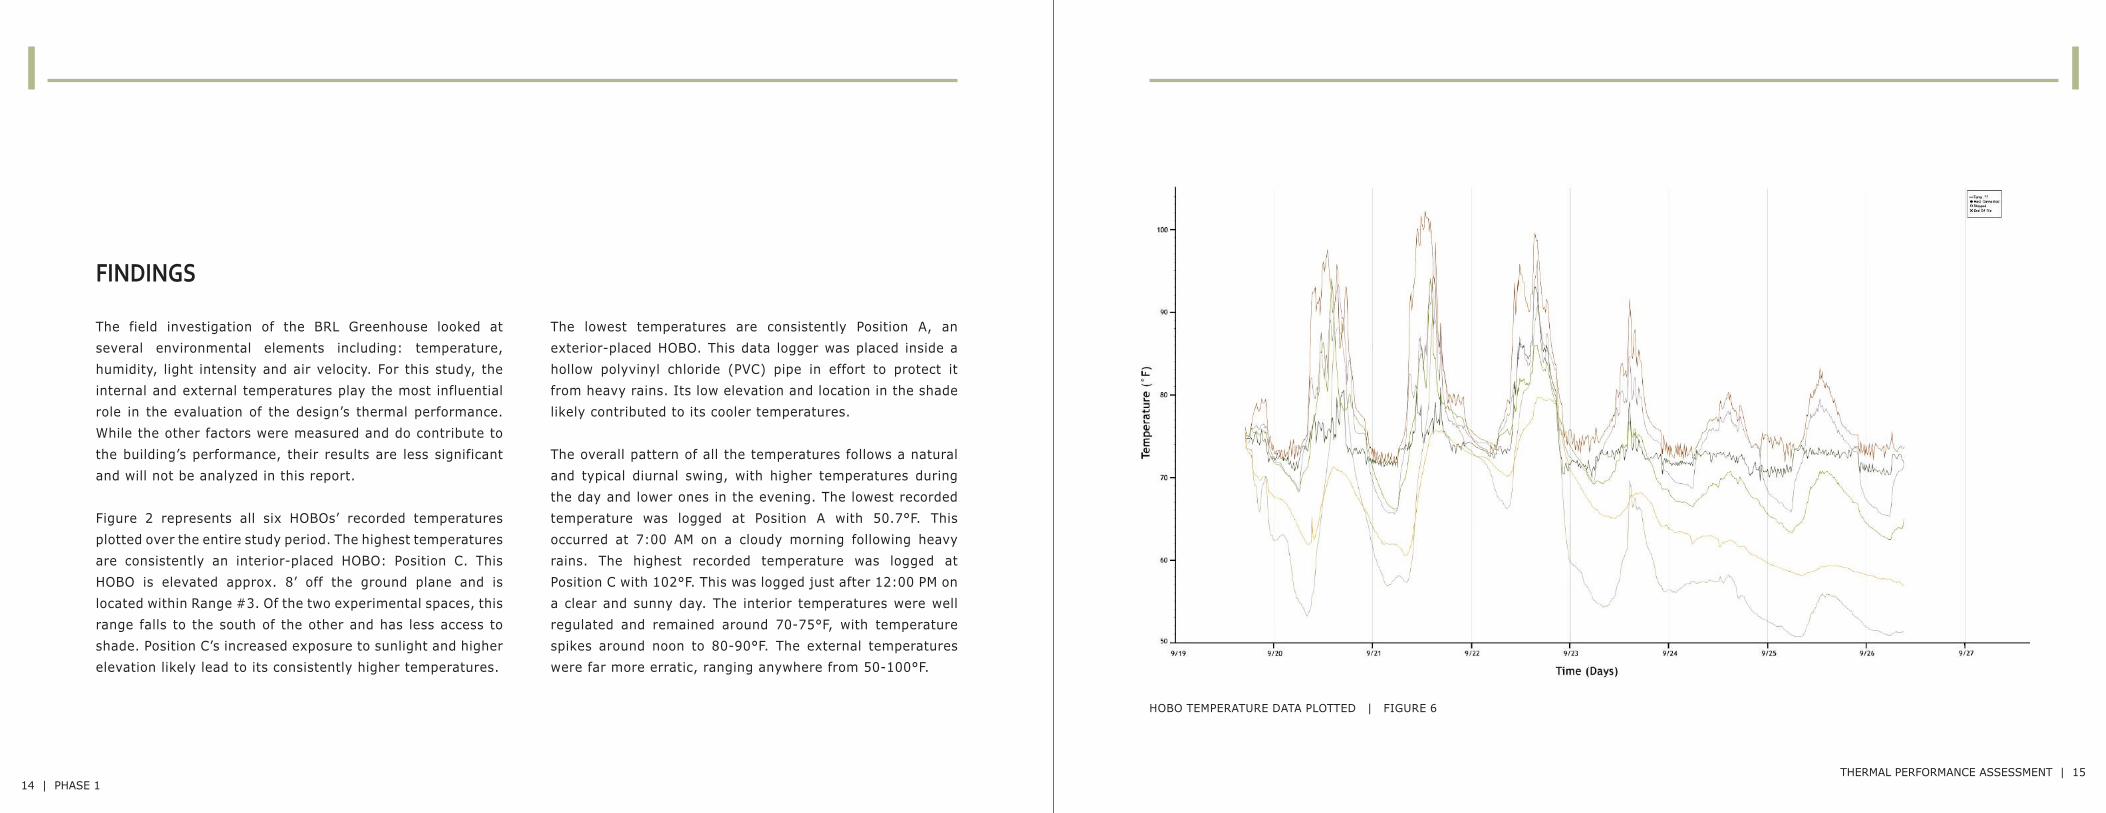
The field investigation of the BRL Greenhouse looked at several environmental elements including: temperature, humidity, light intensity and air velocity. For this study, the internal and external temperatures play the most influential role in the evaluation of the design’s thermal performance. While the other factors were measured and do contribute to the building’s performance, their results are less significant and will not be analyzed in this report.
Figure 2 represents all six HOBOs’ recorded temperatures plotted over the entire study period. The highest temperatures are consistently an interior-placed HOBO: Position C. This HOBO is elevated approx. 8’ off the ground plane and is located within Range #3. Of the two experimental spaces, this range falls to the south of the other and has less access to shade. Position C’s increased exposure to sunlight and higher elevation likely lead to its consistently higher temperatures.
The lowest temperatures are consistently Position A, an exterior-placed HOBO. This data logger was placed inside a hollow polyvinyl chloride (PVC) pipe in effort to protect it from heavy rains. Its low elevation and location in the shade likely contributed to its cooler temperatures.
The overall pattern of all the temperatures follows a natural and typical diurnal swing, with higher temperatures during the day and lower ones in the evening. The lowest recorded temperature was logged at Position A with 50.7°F. This occurred at 7:00 AM on a cloudy morning following heavy rains. The highest recorded temperature was logged at Position C with 102°F. This was logged just after 12:00 PM on a clear and sunny day. The interior temperatures were well regulated and remained around 70-75°F, with temperature spikes around noon to 80-90°F. The external temperatures were far more erratic, ranging anywhere from 50-100°F.
HOBO TEMPERATURE DATA PLOTTED | FIGURE 6
FINDINGS

THERMAL PERFORMANCE ASSESSMENT | 1716 | PHASE 1
Figure 4 represents the two exterior HOBO Positions: A and G. While the two have similar recordings in some instances, they also have very different logs for the same time. Despite this, they appear to follow the same overall pattern of warmer temperatures during the day, and cooler ones in the evening.
Position A has cooler temperatures than Position G, but interestingly, also has higher temperatures. Its increased range is likely due to Position G’s placement on a pile of brick pavers. These extra pavers were stacked against the greenhouse for storage. These particular pavers were tacked against the greenhouse for storage. These particular pavers were stacked 5’W x 10’L x 2.5’H. They are also made of clay. Masonry acts as a heat sink and retains and loses heat slower than other materials. This means Position G was exposed to a source that aided
Figure 3 plots the four interior HOBO Positions. Of the internal readings, Position C had the highest temperatures, Position H had the lowest, and Position B was the most constant or had the least variation. Position C is the highest in both internal and external temperatures because of its high elevation within the climate-controlled greenhouse. Its location in the southern range also contributes to its readings due to increased access to sunlight. The southern range’s exposure to sunlight would also warm the space more than the Northern range.
Position H recorded the coolest temperatures of the interior readings. It was located 2’ above the ground plane along an exterior wall near the exhaust vents. It’s possible the cool air leaving the greenhouse passed over Position H and kept its temperatures consistently lower than the others. Position H is also the only interior
HOBO placed on an exterior wall. It likely was subjected to cold air infiltration from the exterior.
Of all the interior HOBO’s, Position B had the least varying temperatures. It was placed in the middle of the southern range, on a flat table about 2’ from the ground. Its readings found temperatures in the center of the room
were more moderate and consistent than the other positions. It is likely that its position in the center of the space had more air circulation that created an even distribution of temperatures. Air is more likely to be an average of all the environmental conditions near the middle of the space in the X,Y, and Z dimensions.
in moderating its temperatures. If the pavers were slow to heat and slow to cool, it would make sense that objects nearby would experience less varied temperatures. Also contributing to Position G’s stable temperatures is its placement within a small protected area just north of the BRL Greenhouse. Its location was exposed to less wind and rain than Position A. Because
Position G was placed within an alcove, on top of a heat sink, its temperature fluctuated far less than Position A’s, which had neither wind nor elemental protection.
HOBO EXTERIOR DATA PLOTTED | FIGURE 8HOBO INTERIOR DATA PLOTTED | FIGURE 7

THERMAL PERFORMANCE ASSESSMENT | 1918 | PHASE 1
In order to maximize accuracy, the BRL’s engineering archives were searched to find the original building plans and technical drawings. Several drawings from the original 1960’s construction sets were successfully recovered and transposed into working files: Figure 5. This information was used to develop a Revit model of the physical construction of the greenhouse. Using this information, Revit was able to successfully replicate the actual construction of the greenhouse. Revit’s 2D and 3D modeling framework allows for maximum flexibility which aids especially in recreating an older built design.
During the field investigation, the building was measured and compared against the construction drawings for consistency. Most of the current elements matched the drawings. The current construction utilizes lightweight steel angles and channels to frame the overall greenhouse, which appears to be of the same design as the original. The building’s framework is skinned entirely with twin-wall polycarbonate sheets and maintains the original brick and concrete exterior wall. The model incorporates these elements as precisely as their original implementation specified. The greenhouse has had some modifications since its original construction, and those updates were also modeled in an attempt to match the greenhouse’s current state. Some modifications could not be traced to original drawings, and instead, a comparable
component was incorporated in its absence. The model reflects similarly sized structural trusses and overhead framework for light fixtures. It does not attempt to model the interior HVAC or plumbing systems, as that information could not be recovered or measured. Instead, it incorporates ventilation that was measured in the field investigation: the intake and exhaust systems. Both of which are integral in the second phase of the study.
This phase of the study attempts to prove that digital modeling can accurately represent how something has been built. And by doing so, also prove that digital modeling can also be used to represent how something might be built. If it can accurately model a built design, it can be used to model an unbuilt design. Based on the success of the BRL Greenhouse’s Revit model, it can be concluded that Revit’s ability to reflect reality is very accurate (Figure 6 and Figure 7). The scope of its software allows for full integration of elements and their customization. The software is able to specify an incredible amount of detail, down to a custom R-values, product specification and even unconventional construction. Autodesk Revit is a valid and accurate modeling tool based on its ability to precisely replicate a built design.
EXISTING TECHNICAL DRAWINGS | FIGURE 9
EVALUATION

THERMAL PERFORMANCE ASSESSMENT | 2120 | PHASE 2
PHASE 2 BRL SIMULATION
The Revit model is imported into Autodesk CFD in Phase 1 of the study. The various field conditions collected during Phase 1 are inputted into the software and the simulation is ran. The results of the simulations are compared to the actual findings to determine the validity of CFD and its capability to reflect reality. By digitally imitating the conditions collected during the field investigation, the study can visually evaluate the thermal performance of the greenhouse design.
Figure 12 (next page) compiles readings from each HOBO Data Logger at 9:00 AM and 5:00 PM in order to evaluate each day’s bottom and peak temperatures. By determining which day has the widest range of temperatures, the study will have the most opportunities to test the varying conditions. Of the days recorded, September 22nd provides the most diverse conditions to simulate because it has the widest range of low to high temperatures.
In order to evaluate the thermal performance of the BRL Greenhouse, several conditions from throughout September 22nd were selected for simulation: 6:00 AM, 9:00 AM, 12:00 PM, 3:00 PM, 6:00 PM and 9:00 PM. These six trials, or, six specific instances provide a comprehensive representation of the entirely of the day. This selection provides the widest range of input values, which in turn, allows for thorough
investigation of environmental factors like sunlight, sun angle, and seasonal impact.
Figure 13 (next page) lists the input values used in the simulation:
1. Weather information from Weather Underground (WU), an official forecaster and reporter. This value is used for the reference temperature of the external volume.
2. HOBO Data Loggers’ recorded temperature at each position, during each instance/time of day. These are the target values the simulation strives to replicate.
3. The inlet and outlet air velocities recorded during the field investigation. Their values were set as the corresponding flow rates for the condenser and exhaust systems in the simulation.
Each of the 6 trials, or instances of time, were ran through CFD’s solver technology 100 times. This was done to develop an accurate calculation of the thermal performance and to verify a consistent result across the iterations. Six monitor points representing the six HOBO Data Logger positions were also set within the CFD model to track both the internal and external temperatures at those points.
BRL EXTERIOR REALITY (LEFT) SIMULATION (RIGHT) | FIGURE 10
BRL INTERIOR REALITY (LEFT) SIMULATION (RIGHT) | FIGURE 11

THERMAL PERFORMANCE ASSESSMENT | 2322 | PHASE 2
The simulation results of the BRL Greenhouse trials were successful. The Revit model was imported seamlessly into CFD and the calculation values obtained from the field-investigation were well suited for the solver technology. The visualization tools within the software aided in creating and displaying the results.
Figure 14 is a set of section planes through the entire model at each trial, or time of day, throughout September 22nd. The section displays the interior and exterior air temperatures by color where blue is cold and red is hot. The color scale ranges from 60°F to 100°F to cover the entirety of the day.
The 6:00 AM trial is the coldest of the trials. With the sun just rising, the external air hasn’t been warmed. The internal temperatures, however, are warmed to room temperature to provide for the plants. By 12:00 PM, the sun is high in the sky and warms the roof of the greenhouse to 100°F. Internal air is warmer under the roof than elsewhere in the interiors. By the afternoon, the air has been exposed to solar radiation, and has warmed considerably to 80°F. At 3:00 PM, the model reaches peak heating. The air temperatures rise to approx. 90°F, and the west side of the greenhouse experiences direct solar exposure. By 9:00 PM, the sun’s impact has lessened
and the external air drops to 70°F and the internal heaters must warm the interior again.
DAILY TEMPERATURE READINGS | FIGURE 12
STUDY CONDITIONS; FROM HOBO LOGGERS | FIGURE 13
6:00 AM 9:00 AM 12:00 PM
3:00 PM 6:00 PM 9:00 PM
SIMULATION VISUALIZATION | FIGURE 14
FINDINGS

THERMAL PERFORMANCE ASSESSMENT | 2524 | PHASE 2
At 12:00 PM, the simulation calculated the least accurate results of all the trials. Only three of the six monitors points were within 5°F. of the target temperatures. The other three simulation results differed from the target temperature by 10-14°F. Interesting, all three of the inaccurate monitor points were interior positions, in both the northern and southern greenhouse ranges. Additionally, the same three inaccurate temperatures measured cooler than their targets. Perhaps the greenhouse research team added additional environmental factors for their experiments that intentionally or inadvertently raised the temperatures in the interior. Factors like additional lighting, more people, even open doors and windows on a hot day could warm the space in a way CFD could not predict.
At 3:00 PM, the results were mostly accurate. Four of the six monitor points were very close to their target - within 4°F of the actual field-measured temperature. The two inaccurate temperatures came from Monitor Points C and G, which are interior and exterior positions respectively. The simulated temperature for Monitor Point C came in cooler than its target, just as it had in the trial at 12:00 PM. This point is elevated higher in the greenhouse than the other interior points. The stratification of heat could play a role
in explaining why the field-measured temperature of C was warmer than its simulated counterpart. Monitor Point G is also off from its target temperature. While only 7°F warmer, it sits in an alcove just north of the greenhouse. Perhaps the space created in the alcove became a micro-climate which retained heat better than the other exterior monitor points.
At 6:00 PM, the simulation results matched their target temperatures in five of the six monitor points within 4°F. The only point to miss the target was Monitor Point G by 8°F. Similar to the trial at 3:00 PM, G was warmer than its target and is likely caused by the same micro-climate principle. Despite its anomaly, this trial had the second best average difference in temperatures. It was the second most accurate trial overall.
At 9:00 PM, the simulation results were very accurate. All six of the monitor points were within 5°F of the actual measurement. This trial had the third best average difference in temperatures. It was the third most accurate trial overall. It is intriguing that the three most accurate trials occurred after regular business hours. Perhaps the building users play an unpredictable role in evaluating building performance.
At 6:00 AM, the simulation results were very accurate. All of the values were within 5°F of the actual field-measured temperature. Of all the trials, this instance had the best average difference in temperatures. It was the most accurate trial overall.
At 9:00 AM, the simulation results were also very accurate. Five of the six monitor points were within 4°F of the target
temperature. However, there was one strong anomaly in this trial. The simulation temperature at Monitor Point A was 15.6°F over the target temperature, the highest difference throughout all the trials. It is unclear why the simulation’s external temperature came in considerably higher than reality. Perhaps the simulation’s morning sun hit the east of the greenhouse and created an extraordinary concentration of solar heat on Monitor Point A.
SIMULATION RESULTS | FIGURE 15
FINDINGS

THERMAL PERFORMANCE ASSESSMENT | 2726 | PHASE 2
Figure 15 (previous page) and 17 show all of the simulation results taken at the six corresponding monitor points adjacent to their field-measured counterpart. The simulation temperature is subtracted from the target temperature to find the difference. This difference is the measure of how close and how often the simulation was able to produce temperatures that were consistent with what reality measured.
Figure 16 evaluates the temperature difference between the simulation results and the field-measured temperatures in three pie charts. The left-most chart looks at whether the simulation results were warmer (negative difference) or cooler (positive difference) than its reality counterpart:
Example: 6:00 AM at Monitor Point CReality (73.26°F) - Simulation (70.11°F) = + 3.14 °F
56% of the monitor points through all six trials had a positive difference, which means the simulation temperatures came in cooler than its target a little ore than half the time. This leads to a likelihood that similar greenhouse designs’ simulated temperatures are going to be cooler than how a building will realistically perform. This is an important takeaway from the Phase 2 results. The field-measured temperatures are higher than the simulations’ 56% of the time, and this is likely due to additional environmental factors. When applying the CFD software to other designs, it is important to recognize the
simulation results may be a little cooler than how the building will ultimately perform.
The middle chart looks at the temperature differences between simulation and reality in several tiers of accuracy: 0-5°F, 5-10°F, 10-15°F, and +15°F. 75% of the differences between reality and simulation fell within the 0-5°F difference. This means, three quarters of the simulated results were within 5°F of the actual field-measured temperature. This also means, the CFD software predicted the results within 10% accuracy, 75% of the time.
17% of the temperature differences fell within the 5-10°F range. When combined with the results from 0-5°F, a total of 92% of the simulation results fell within 10°F of reality. This precision demonstrates CFD’s ability to reflect reality and create a comparable evaluation of a design’s performance.
Finally, the right-most chart looks specifically at the temperatures differences between simulation and reality and charts the collective percentage of each degree. 8% of simulation results were within 1°F of the actual result, 19% was within 1-2°F, etc. The largest percentage of results fell within 3-4°F with 22%. This means the CFD technology is more likely to calculate within 3-4°F of the actual temperature than any other degree difference.
SIMULATION DIFFERENT VISUALIZED | FIGURE 16
SIMULATION VS. REALITY RESULTS | FIGURE 17

THERMAL PERFORMANCE ASSESSMENT | 2928 | PHASE 3
PHASE 3 MULTI-STORY SIMULATION
The third and final phase of the study evaluates the thermal performance of three multi-story greenhouse designs using the same digital simulation software as the second phase. Because the software’s accuracy was verified in Phase 2 of the study, it is a valid assessor of each designs’ thermal performance. CFD is a reliable source of prediction for how these designs would perform in reality.
Each design was created using the same work flow as the second phase: the designs were modeled in Revit, imported into and values applied in CFD, and ran through the solver technology. The simulation results will provide insight to factors of multi-story greenhouse design such as: massing, HVAC placement, and solar orientation.
Three designs (Figure 18) were evaluated using CFD’s solver technology. These multi-story greenhouse designs incorporated a variety of findings from both the Phase 2 simulations and additional external research. From Phase 2, the most critical takeaway came from its HVAC placement. The single story BRL Greenhouse utilized a simple layout where the inlet aligned directly opposite of the outlet. This arrangement allowed for air to pass over the space directly and consistently, creating a fresh supply of air for the plants. This constant pressure created by the opposite alignment lead to an even and unstratified flow of air.
When designing the multi-story designs for simulation, mimicking the BRL’s stable air distribution was a strong consideration, as well as its solar orientation for maximizing sunlight. Because of the additional height, the multi-story designs’ massing took liberties in exploring how these factors would contribute to their respective thermal performance.
The first design utilizes a traditional greenhouse form with five levels and a center atrium for ventilation. This design was oriented to the north in order to allow the long axis to receive plenty of unobstructed sunlight. This massing known for its excellent shedding of snow, optimal lighting and ventilation opportunities, due to its sloped roof, clear glazing and ability to add venting to straight surfaces.
The second design uses a passive solar greenhouse form. This kind of greenhouse is not standalone, and is typically attached to an elevation of a building. Because of its solar orientation, the design receives plenty of sunlight and sheds snow loads efficiently. This particular design has an incorporated flat roof and would need to make adjustments. Due to its slanted wall, in order to add floor space, the design must add head space, which can be expensive to heat. This design is oriented to the north, which allows for sunlight all day with nice ambient light from the north. The four floors are connected by an atrium - this is again to circulate air and battle stratification. The air inlets are oriented differently in this design than the other two - it runs along the short axis instead of the long one. This is done to explore the impact of orientation.
The third design explores a gutter connect greenhouse design. This style is beneficial for large operations like a commercial greenhouse. In this design, four greenhouses are aligned and their sidewalls removed. The slope of their roofs connect in a “gutter” which can be difficult to manage with snow and rain loads. This however, can present opportunities for water collection. This design is much wider than the previous two and thus has fewer floors, only 3. It incorporates the same atrium for distributing air.
MULTISTORY GREENHOUSE DESIGNS | FIGURE 18

THERMAL PERFORMANCE ASSESSMENT | 3130 | PHASE 3
Each of the three multi-story greenhouse designs were ran through CFD’s solver technology 100 times. Just as Phase 2, this was done in order produce an accurate calculation of the thermal performance and to verify a consistent result across the iterations.
August 2016 tied July 2016 for the hottest month the world has seen in the last 136 years (Thompson 2017). Each design was simulated during this month as well as during peak heating time: 3:00 PM on August 15th. This instance was selected for simulation in order to predict how the design performs under intense but realistic heat.
Because many greenhouses struggle with optimizing design for hot summer conditions, the simulations attempt to provide insight into the effects of design factors to mitigate the effects of summer heat loads.
Traditional Form (Figure 19)
This traditional greenhouse design appears to perform adequately. While the design is cooled throughout the center,
about 65°F, there are alarmingly hot temperatures found on the west side in areas far from the outlet/exhaust system. Temperatures in this area stagnate around 100°F, which is not optimal for growing plants. Therefore, additional outlets are needed to properly circulate the air in these areas.
This design utilizes a central atrium in order to distribute air throughout the floors. The cold air appears to leave the inlet source at each floor and collect towards the atrium before being pushed out of the outlet. In Figure 19.4, the section cut is taken at a point where the atrium does not intersect. These areas maintain a very cool temperature. Perhaps the atrium design does not promote air circulation and instead collects the cool air. In Figure 19.3, which is through the atrium, the cold air collects towards the center of the greenhouse and warms before falling and exiting the greenhouse. This is an unexpected behavior of cool air.
Because the design’s long axis aligns north to south, the west side of the greenhouse warms considerably in the late afternoon. The west side’s temperatures span between 90-100°F whereas the east side measures almost ten degrees lower, between 80-90°F. This difference between the two would create an uneven distribution of air and thus, the design would benefit from shading devices or decreased glazing on the west side in order to balance the temperatures.
DESIGN 1
This design performed the second best out of the three designs evaluated. Areas of the interior overheated due to lack of air outlets and its orientation allowed for extreme solar heat gain in the afternoon.
DESIGN 1’S THERMAL PERFORMANCE | FIGURE 19
DESIGN 1
19.3 19.4
19.219.1

THERMAL PERFORMANCE ASSESSMENT | 3332 | PHASE 3
Passive Solar Form (Figure 20)
This passive solar greenhouse design performed quite successfully. The interior temperatures are cool throughout, and despite its warmer temperatures on the west side, it doesn’t seem to overheat. Near the roof on the north side, in Figure 20.3, temperatures reach around 100°F. Though this is warm, the heat doesn’t enter very far into the design. Most of the internal temperatures range around 70-85°F, which is a desirable temperature for growing plants.
The placement of the inlet valves are different from the other two designs - it aligns to the short axis instead of the long. The cold air behaves as expected: it exits the inlet and settles towards the floor before being pushed towards the exhaust systems. Because it settles to the ground so quickly, the air doesn’t seem to circulate throughout the floors as it did in Design 1. Perhaps the volume flow rate wasn’t high
enough to push air towards the atrium, or the “stepping” of the floors discouraged vertical air movement. There is also a concentration of cool air on the first floor of the design towards the center. Additional fans would be beneficial to provide circulation of this cool air.
This design sits against an “existing building.” By placing the greenhouse design on the north elevation, its south side is protected against the afternoon solar heat gains. This design is aligned east to west, and is considerably warmer on the west side with temperatures around 100°F. Despite this increased temperature, the solar heat doesn’t seem to penetrate into the design and affect the overall interior temperature. This solar orientation performs much cooler than Design 1, so its additional shading on the south and solar orientation appear to be successful.
DESIGN 2
This design performed the best out of the three designs evaluated. The air was ventilated well and temperatures were regulated throughout. The top level did get warmer than the other floors, therefore additional shading may be necessary.
DESIGN 2’S THERMAL PERFORMANCE | FIGURE 20
DESIGN 2
20.3 20.4 20.5
20.220.1
THERMAL PERFORMANCE ASSESSMENT | 3534 | PHASE 3
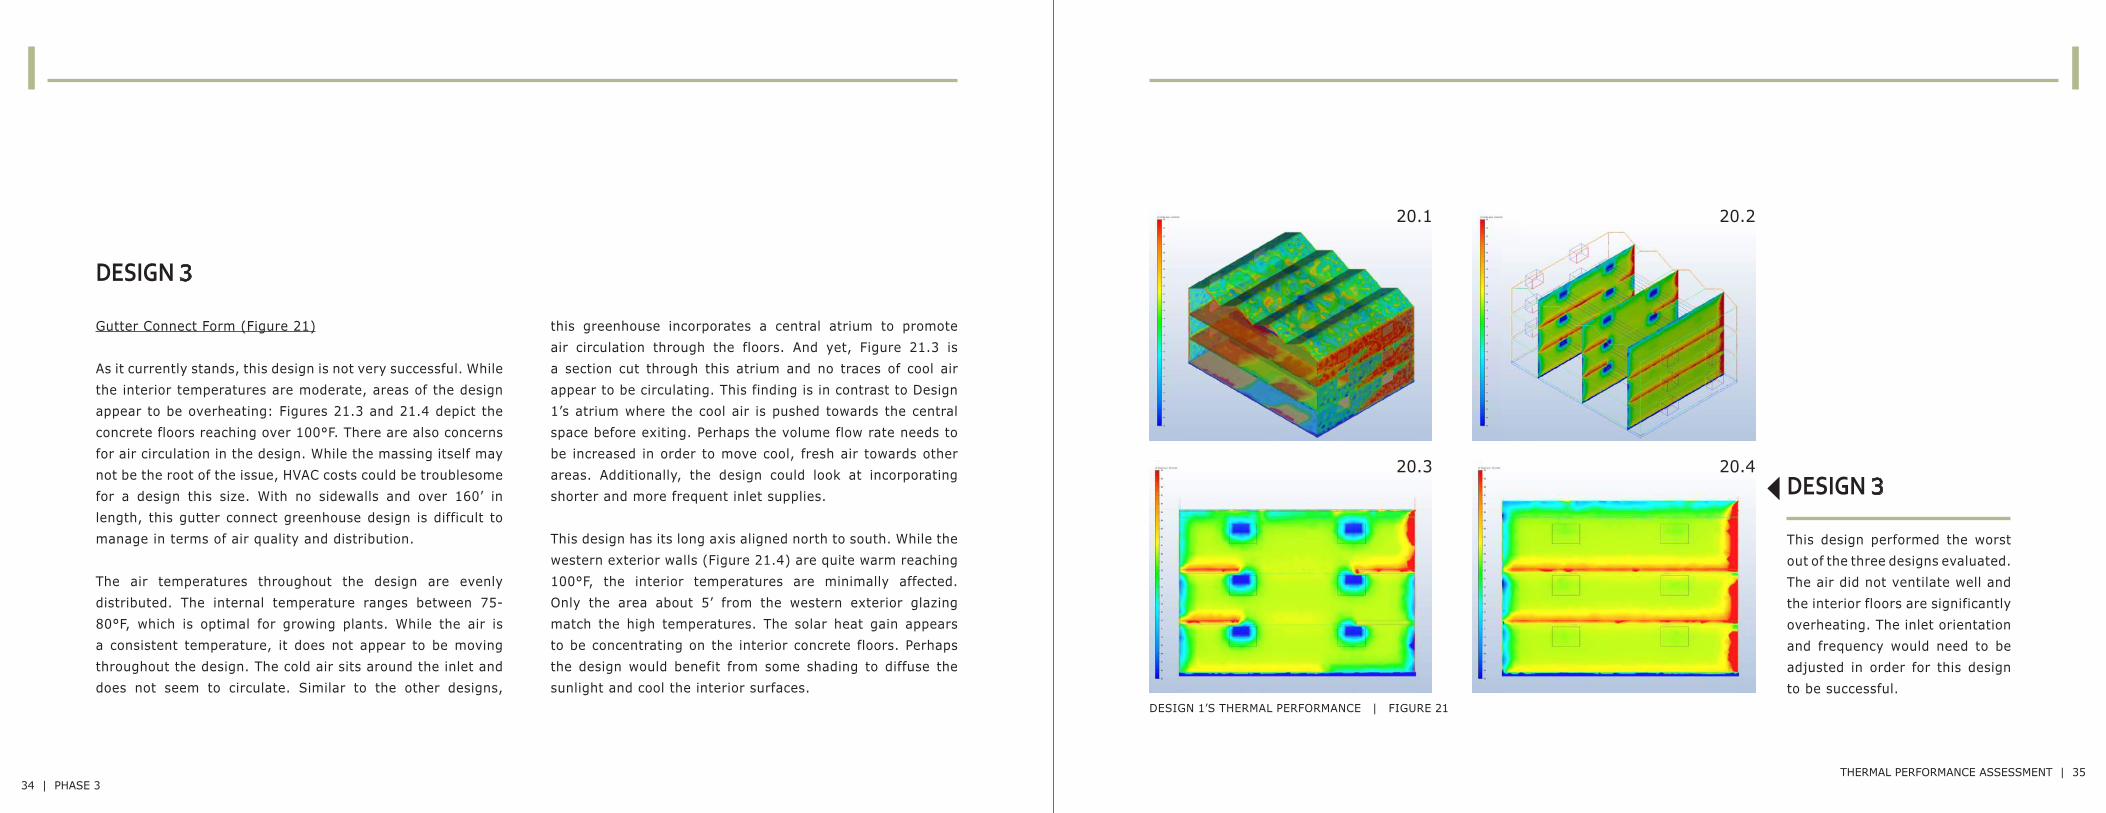
Gutter Connect Form (Figure 21)
As it currently stands, this design is not very successful. While the interior temperatures are moderate, areas of the design appear to be overheating: Figures 21.3 and 21.4 depict the concrete floors reaching over 100°F. There are also concerns for air circulation in the design. While the massing itself may not be the root of the issue, HVAC costs could be troublesome for a design this size. With no sidewalls and over 160’ in length, this gutter connect greenhouse design is difficult to manage in terms of air quality and distribution.
The air temperatures throughout the design are evenly distributed. The internal temperature ranges between 75-80°F, which is optimal for growing plants. While the air is a consistent temperature, it does not appear to be moving throughout the design. The cold air sits around the inlet and does not seem to circulate. Similar to the other designs,
this greenhouse incorporates a central atrium to promote air circulation through the floors. And yet, Figure 21.3 is a section cut through this atrium and no traces of cool air appear to be circulating. This finding is in contrast to Design 1’s atrium where the cool air is pushed towards the central space before exiting. Perhaps the volume flow rate needs to be increased in order to move cool, fresh air towards other areas. Additionally, the design could look at incorporating shorter and more frequent inlet supplies.
This design has its long axis aligned north to south. While the western exterior walls (Figure 21.4) are quite warm reaching 100°F, the interior temperatures are minimally affected. Only the area about 5’ from the western exterior glazing match the high temperatures. The solar heat gain appears to be concentrating on the interior concrete floors. Perhaps the design would benefit from some shading to diffuse the sunlight and cool the interior surfaces.
DESIGN 1’S THERMAL PERFORMANCE | FIGURE 21
DESIGN 3
This design performed the worst out of the three designs evaluated. The air did not ventilate well and the interior floors are significantly overheating. The inlet orientation and frequency would need to be adjusted in order for this design to be successful.
DESIGN 3
20.1 20.2
20.3 20.4

THERMAL PERFORMANCE ASSESSMENT | 3736 | CONCLUSION
CONCLUSION
The goal of this architectural research project was to simulate the thermal performance of a multi-story greenhouse design. To do this, the study first had to verify the authenticity of digital simulation, then apply its solver technology to additional designs in order to evaluate the thermal performance of design factors.
The quantifiable, measurable field investigation in the first phase led to conclusions about the varying temperatures surrounding a greenhouse facility. The data described a distinct difference in temperature between the interior and exterior, demonstrating a clear control of the internal environment on both hot sunny and cold rainy days. The HOBO Data Loggers recorded the stratification of temperatures within the interior as well: lending insight into the differences in temperature in both elevation and relationship to southern exposure. This phase of the study was beneficial in developing understanding about design factors and influences.
The second phase of the study simulated the building performance in Autodesk CFD based on comparable conditions
found in the first phase. These results were very accurate and depicted the findings in a clear and visually compelling manner. The simulation data had minimal deviation: 92% of the results were within 10°F of the actual recorded data. This level of precision verified the accuracy of the software and validated the solver technology.
In the third and final phase of the study, CFD evaluated the thermal performance of three new designs. This provided an incredible amount of insight into the impact of design factors such as massing, HVAC placement and solar orientation. Of the three designs, the passive solar greenhouse design was the most successful - outperforming the others in air circulation, heat distribution and passive strategies.
This study attempts to prove that digital simulation can accurately predict the thermal performance of a design. Based on the success of the three phases, it can be concluded that CFD’s ability to reflect reality is very reliable. This study concludes that Autodesk CFD is a powerful and accurate tool for evaluating greenhouse design through digital simulation.
The second design, the passive solar greenhouse, performs better than the other two based on its CFD simulation. While its sloped massing leads to a decreased amount of workable floor space, its current thermal evaluation outperforms the others in air circulation and solar heat gain. Its site orientation and massing protect against overexposure to sun and its staggered floors allow for air circulation without limiting floor-by-floor air control.
The design would benefit from additional CFD simulation trials. Many design factors like wall-to-window ratios, materials, and volume flow rates would impact the thermal performance of the design beyond what has already been evaluated. Additional investigation into these elements and more simulation trials would provide the necessary insight to comprehensively evaluate Design 2’s thermal performance throughout the year.
RESULTS OF SIMULATION TRIALS
CONCLUSION
BRL EXTERIOR | FIGURE 22
THERMAL PERFORMANCE ASSESSMENT | 3938 | APPENDIX: REFERENCES
APPENDIX: REFERENCE LIST
Capaldi, C. A., Dopko, R. L., & Zelenski, J. M. (2014). The relationship between nature connectedness and happiness: a meta-analysis. Frontiers in Psychology, 5, 976. Retrieved from http://doi.org/10.3389/fpsyg.2014.00976
Nations, United (2014, July 10). World’s population increasingly urban with more than half living in urban areas. Retrieved from http://www.un.org/en/development/desa/news/population/world-urbanization-prospects-2014.html
Thompson, Andrea (2016, Sept 12). “August Ties July as Hottest Month Ever on Record.” Climate Central. Retrieved from www.climatecentral.org/news/august-ties-july-as-hottest-month-on-record-20691
CoverFigure 1Figure 2Figure 3Figure 4Figure 5Figure 6Figure 7Figure 8Figure 9Figure 10Figure 11Figure 12Figure 13Figure 14Figure 15Figure 16Figure 17Figure 18Figure 19Figure 20Figure 21Figure 22
69
1111121516171921212222232427272831333536
personal photograph, taken Sept 18, 2017personal photograph, taken Sept 18, 2017www.londonnewgirl.com/londons-best-views-sky-garden/www.onsetcomp.com/files/styles/image_widget_large/public/U10-003.jpg?itok-LdDUoYCbcdn.shopify.com/s/files/1/0150/2930/products/FLIR-E5-Rent-Hire-Thermal-Imaging-Camera.jpg?personal photograph, taken Sept 18, 2017custom graphic, hoboware softwarecustom graphic, hoboware softwarecustom graphic, hoboware softwarecustom graphic, transposed from BRL Engineering Archives’ Drawing Setspersonal photograph, taken Sept 18, 2017 + custom graphic, Revit 2018personal photograph, taken Sept 18, 2017 + custom graphic, Revit 2018custom graphic, excel tablecustom graphic, excel tablecustom graphic, CFD softwarecustom graphic, excel tablecustom graphic, excel chartcustom graphic, excel chartcustom graphic, REVIT 2018custom graphic, CFD softwarecustom graphic, CFD softwarecustom graphic, CFD softwarepersonal photograph, taken Sept 18, 2017
figure page source